Embed Size (px)
Citation preview
Chin Meng Khoo,1,2 Melvin Khee-Shing Leow,2,3,4 Suresh Anand Sadananthan,4,5 Radiance Lim,4,6 Kavita Venkataraman,5,7
Eric Yin Hao Khoo,1 S. Sendhil Velan,4,8,9 Yu Ting Ong,4 Ravi Kambadur,4,10 Craig McFarlane,4 Peter D. Gluckman,4
Yung Seng Lee,4,11 Yap Seng Chong,5 and E. Shyong Tai1,2,7
Body Fat Partitioning Does NotExplain the Interethnic Variationin Insulin Sensitivity AmongAsian Ethnicity: The SingaporeAdults Metabolism Study
We previously showed that ethnicity modifies theassociation between adiposity and insulinresistance. We sought to determine whetherdifferential body fat partitioning or abnormalities inmuscle insulin signaling associated with higherlevels of adiposity might underlie this observation.We measured the insulin sensitivity index (ISI),percentage of body fat (%body fat), visceral (VAT)and subcutaneous (SAT) adipose tissue, liver fat, andintramyocellular lipids (IMCL) in 101 Chinese, 82Malays, and 81 South Asians, as well asphosphorylated (p)-Akt levels in cultured myoblastsfrom Chinese and South Asians. Lean Chinese andMalays had higher ISI than South Asians. Althoughthe ISI was lower in all ethnic groups when %bodyfat was higher, this association was stronger inChinese and Malays, such that no ethnic differenceswere observed in overweight individuals. These
ethnic differences were observed even when %bodyfat was replaced with fat in other depots. Myoblastsobtained from lean South Asians had lower p-Aktlevels than those from lean Chinese. Higheradiposity was associated with lower p-Akt levels inChinese but not in South Asians, and no ethnicdifferences were observed in overweight individuals.With higher %body fat, Chinese exhibited smallerincreases in deep SAT and IMCL compared withMalays and South Asians, which did not explain theethnic differences observed. Our study suggeststhat body fat partitioning does not explain interethnicdifferences in insulin sensitivity among Asian ethnicgroups. Although higher adiposity had greater effecton skeletal muscle insulin sensitivity amongChinese, obesity-independent pathways may bemore relevant in South Asians.Diabetes 2014;63:1093–1102 | DOI: 10.2337/db13-1483
1Department of Medicine, Yong Loo Lin School of Medicine, National Universityof Singapore, Singapore2Duke-National University of Singapore Graduate Medical School, Singapore3Department of Endocrinology, Tan Tock Seng Hospital, Singapore4Singapore Institute for Clinical Sciences, A★STAR, Brenner Centre for MolecularMedicine, Singapore5Department of Obstetrics & Gynaecology, National University of Singapore,Singapore6Max Planck Institute for Heart and Lung Research, Germany7Department of Epidemiology and Public Health, Yong Loo Lin School ofMedicine, National University of Singapore, Singapore8Singapore Bioimaging Consortium, A★STAR, Singapore9Clinical Imaging Research Centre, A★STAR-National University of Singapore,Singapore
10School of Biological Sciences, Nanyang Technological University,Singapore11Department of Pediatrics, Yong Loo Lin School of Medicine, NationalUniversity of Singapore, Singapore
Corresponding author: E. Shyong Tai, [email protected].
Received 29 September 2013 and accepted 10 December 2013.
This article contains Supplementary Data online at http://diabetes.diabetesjournals.org/lookup/suppl/doi:10.2337/db13-1483/-/DC1.
C.M.K. and M.K.-S.L. are co-first authors.
© 2014 by the American Diabetes Association. See http://creativecommons.org/licenses/by-nc-nd/3.0/ for details.
Diabetes Volume 63, March 2014 1093
PATHOPHYSIO
LOGY
South Asians are more insulin-resistant than Caucasiansdespite similar or even lower BMI (1–3). We have shownthat within Asia, South Asians exhibit the greatest in-sulin resistance, Chinese the least, and Malays are in-termediate (4,5). Interestingly, this interethnic differencein insulin resistance was only prominent among leanindividuals (2). The association of higher BMI withgreater insulin resistance was stronger in Chinese than inother Asian ethnic groups, such that ethnic differences ininsulin resistance were no longer evident in overweightor obese individuals (4).
The mechanisms underlying these observations areunclear. One possibility is that individuals from differentethnic groups have a differing propensity to accumulatefat in compartments that are metabolically detrimental,such as within the abdomen, or in the liver or skeletalmuscles. Existing evidence suggests that ethnicity doesmodulate the relationship between total adiposity and theamount of fat in specific depots and lends credence to thishypothesis (1,6,7). However, many of these studies usedBMI as a surrogate marker of adiposity and did not ac-curately measure adiposity. Furthermore, relatively im-precise measures of insulin sensitivity were used.
In this study, we sought to determine whether thepropensity to accumulate fat in specific depots with in-creasing adiposity mediates the interaction betweenethnicity, adiposity, and insulin sensitivity. We alsomeasured liver fat content and intramyocellular lipids(IMCL), both being important determinants of whole-body insulin resistance (8,9). Primary cultures of muscleobtained from humans have been shown to retain met-abolic characteristics of the donors from which they weretaken (10). Thus, we further sought to determinewhether abnormalities in skeletal muscle insulin signal-ing might underlie the interethnic differences in insulinsensitivity.
RESEARCH DESIGN AND METHODS
Subjects
We recruited 264 healthy adult men, comprising 101Chinese (38.3%), 82 Malays (30.7%), and 81 SouthAsians (31.1%). The subjects had no prior history ofglucose intolerance, hypertension, or dyslipidemia, andall had normal values for fasting blood glucose (,7.0mmol/L). We excluded those with significant changes indiet or weight loss of .5 kg, a history of heart disease,epilepsy, insulin allergy, current smoking, a history ofingesting any drug known to alter insulin sensitivity (e.g.,corticosteroids), or any hospitalization or surgery duringthe 6 months before enrollment in our study. Ethicsapproval was obtained from the National HealthcareGroup Domain Specific Review Board (Singapore). Allsubjects provided informed consent.
Clinical Measurements
Demographic data, medical and drug history, and data onlifestyle factors were collected using interviewer-
administered questionnaires. Height was measured usinga wall-mounted stadiometer, and weight was measuredusing a digital scale (SECA, model 803; Vogel & Halke,Hamburg, Germany). BMI was computed using the sub-ject’s weight (kg) divided by the square of his height (m).Waist circumference was measured at the midpoint be-tween the lower costal margin and iliac crest duringmidrespiration. Blood was sampled for glucose, renalfunction, liver function, lipids, and thyroid-stimulatinghormone after a 10-h overnight fast. Body compositionwas measured using a Hologic Discovery Wi dual-energyX-ray absorptiometry (DEXA) scanner (Hologic, Bedford,MA). Subjects were positioned according to the standardprotocol, and all subjects fit within the area of mea-surement. Manual analyses were performed for regionalsoft tissue demarcation by three trained DEXA technol-ogists certified by the International Society of ClinicalDensitometry.
Insulin sensitivity was assessed after a 10-h overnightfast using the hyperinsulinemic euglycemic clamp technique(11). Insulin was infused at a fixed rate of 40 mU/m2
body surface area/min for the duration of the clamp(120 min). Blood glucose level was measured every 5 minusing the glucose oxidase method (Yellow Spring GlucoseAnalyzer; YSI Life Sciences, Yellow Spring, OH). The in-fusion rate of the dextrose 20% solution was adjusted tomaintain a constant blood glucose level at ;90 mg/dL(5 mmol/L) throughout the clamp. The insulin sensitivityindex (ISI) was calculated using the mean glucose in-fusion rate and steady-state insulin concentrations(mean 116.8 6 35.9 mU/L) during the final 30 min ofthe clamp.
Biochemical analyses were conducted at the NationalUniversity Hospital Referral Laboratory, which isaccredited by the College of American Pathologists. Se-rum insulin was measured using a chemiluminescenceassay (ADVIA Centaur Analyzer, Siemens HealthcareDiagnostics). Serum total cholesterol, HDL-cholesterol,LDL-cholesterol, and triglyceride values were measuredusing the automated ADVIA 2400 analyzer (Bayer Diag-nostics, Tarrytown, NY).
Magnetic Resonance Spectroscopy of Liver andSkeletal Muscle
Fat content in the liver and skeletal muscle was de-termined using 1H magnetic resonance (MR) spectros-copy using a 3 Tesla MR scanner (Tim Trio, Siemens).The liver spectra were obtained from a 2- 3 2- 3 2-cm3
voxel from two locations (right and left lobes) usinga point-resolved spectroscopy sequence (echo time[TE] = 30 ms, repetition time [TR] = 2,000 ms) anda Siemens body matrix coil. The acquired spectra werefitted using the linear combination of model spectra(LCModel) (12). The liver fat was determined from theconcentration of methyl and methylene groups of lipidsand the unsuppressed water signal (13). The fat con-centration obtained was corrected for T2 losses and was
1094 Body Fat Partitioning and Insulin Sensitivity Diabetes Volume 63, March 2014
also verified by region-of-interest analysis with Dixonimaging. For skeletal muscle MR spectroscopy, the rightleg was positioned in a leg holder, and the foot wasaligned to eliminate residual dipolar interactions(14,15). The muscle spectrum was obtained from a 2- 32- 3 2-cm3 voxel within the soleus muscle using a pointresolved spectroscopy sequence (TE = 30 ms, TR = 2,000ms) and a Siemens Tx/Rx 15-Channel Knee Coil. Theamount of IMCL was calculated and expressed as theIMCL-to-creatinine ratio.
MR Imaging of the Abdomen
Abdominal fat images were acquired using two 2-pointDixon sequences (TR = 5.28 ms, TE1 = 2.45 ms, TE2 =3.68 ms, flip angle = 9°, slice thickness = 3 mm) duringbreath-holds of 18–20 s. The fat volume in each ab-dominal fat compartment was obtained from 80 axialslices covering the L1 to L5 lumbar vertebrae. A fullyautomatic graph theoretic segmentation algorithmextracted and estimated the subcutaneous (SAT) andvisceral (VAT) adipose tissue volumes (16,17). Thesegmentation algorithm was a two-step process. First,the fat tissues were separated from the nonfat tissuesby thresholding. The extracted fat tissues were thenclassified into SAT and VAT using a graph cut techniquethat has been validated on the skull-stripping problem(18). A modified version of the distance regularizedlevel set evolution method was used to separate thedeep SAT (DSAT) and superficial SAT (SSAT) depots(19). The segmented image volumes of each of the fatdepots were quantified by adding all of the voxels of allof the slices and multiplying by the image resolution.This method provides valid estimates of fat volumecompared with manual segmentation, with a Dice sim-ilarity index ranging from 0.7 to 0.89, where 0 indicatesno overlap between the two methods and 1 indicatesperfect overlap (unpublished data, manuscript underreview).
Primary Human Myoblast Culture
Percutaneous muscle biopsy specimens were obtainedfrom the belly of the vastus lateralis under local anes-thesia. One specimen was put immediately into PBS formyoblast cultures. The other samples were snap frozen inliquid nitrogen and stored at 280°C. For myoblast cul-tures, muscle tissue was minced and digested with 0.2%collagenase type 1A (C5894; Sigma-Aldrich, St. Louis,MO) for 20 min at 37°C. The cultures were then centri-fuged, resuspended in PBS, and passed througha 100-mm filter to remove undigested tissue. The cellswere resuspended in Dulbecco’s modified Eagle’s medium,supplemented with 20% FBS (Invitrogen, Carlsbad, CA),10% horse serum (Invitrogen), 1% penicillin-streptomycin(Invitrogen), and 1% chick embryo extract (C3999; USBiological Life Sciences, Salem, MA) and enriched formyoblasts by preplating on uncoated plates for 3 h. Thesupernatant containing the myoblasts was transferred
onto 10% matrigel-coated plates (Becton, Dickinson andCo., Franklin Lakes, NJ). All cultures were maintained at37°C and 5% CO2.
Phosphorylated Akt Immunoblot Analysis
Primary myoblasts were plated at a density of 15,000cells/cm2 and incubated with serum-free minimumessential medium-a for 15 min. Then, 2 mL freshserum-free minimum essential medium-a was added,and the cells were starved for 16 h, followed by stim-ulation with or without increasing concentrations(0.01 , 0.1, and 1 mmol/L) of insulin for 15 min at 37°Cand 5% CO2. The myoblasts were then washed with PBSand lysed with radioimmunoprecipitation assay buffer(Sigma-Aldrich; Cat#R0278) and complete proteaseinhibitor cocktail (Roche). Cell lysates were passedthrough a 26-gauge needle 10 times and centrifuged topellet cell debris. Total protein (10 mg) was separatedby 4–12% SDS-PAGE (Invitrogen) electrophoresis andtransferred to nitrocellulose membrane by electro-blotting. The membranes were then blocked in 5% milkin Tris-buffered saline with Tween overnight at 4°C,followed by incubation with specific primary antibodiesfor 3 h at room temperature. The primary antibodiesused for immunoblotting were rabbit anti–phosphor-ylated (p)-Akt antibody (sc-7985-R; Santa Cruz Bio-technology) and mouse a-tubulin antibody (T-9026;Sigma-Aldrich). The membranes were then washedwith Tris-buffered saline with Tween and further in-cubated with anti-rabbit IgG horseradish peroxidase(HRP) conjugate (Bio-Rad) or anti-mouse IgG HRPconjugate (Bio-Rad) secondary antibodies for 1 h atroom temperature. The HRP activity was detectedusing Western Lightning Chemiluminescence ReagentPlus (NEL104; PerkinElmer Life Sciences, Wellesley,MA) and exposure to autoradiography film. Blots werequantified by densitometric analysis using the GS-800densitometer (Bio-Rad). All p-Akt immunoblots werenormalized against a-tubulin levels (SupplementaryFig. 1).
Statistical Analysis
All analyses were performed using SPSS 17.0 software(SPSS, Inc., Chicago, IL). All values are given as means 6SD unless stated otherwise. P , 0.05 was considered tobe statistically significant. ANOVA was used for com-parisons of continuous variables, with Bonferroni cor-rections applied for group comparisons.
ANCOVA was used to assess the relationship betweenthe ISI and BMI (Fig. 1A) and between ISI and percentageof body fat (%body fat) (Fig. 1B). The relationship be-tween ISI with the two measures of adiposity was similar,such that among lean individuals, South Asians were lessinsulin-sensitive than Chinese or Malays. Although theISI was lower in all ethnic groups when adiposity washigher, this association was stronger in Chinese andMalays, such that in overweight individuals, no ethnic
diabetes.diabetesjournals.org Khoo and Associates 1095
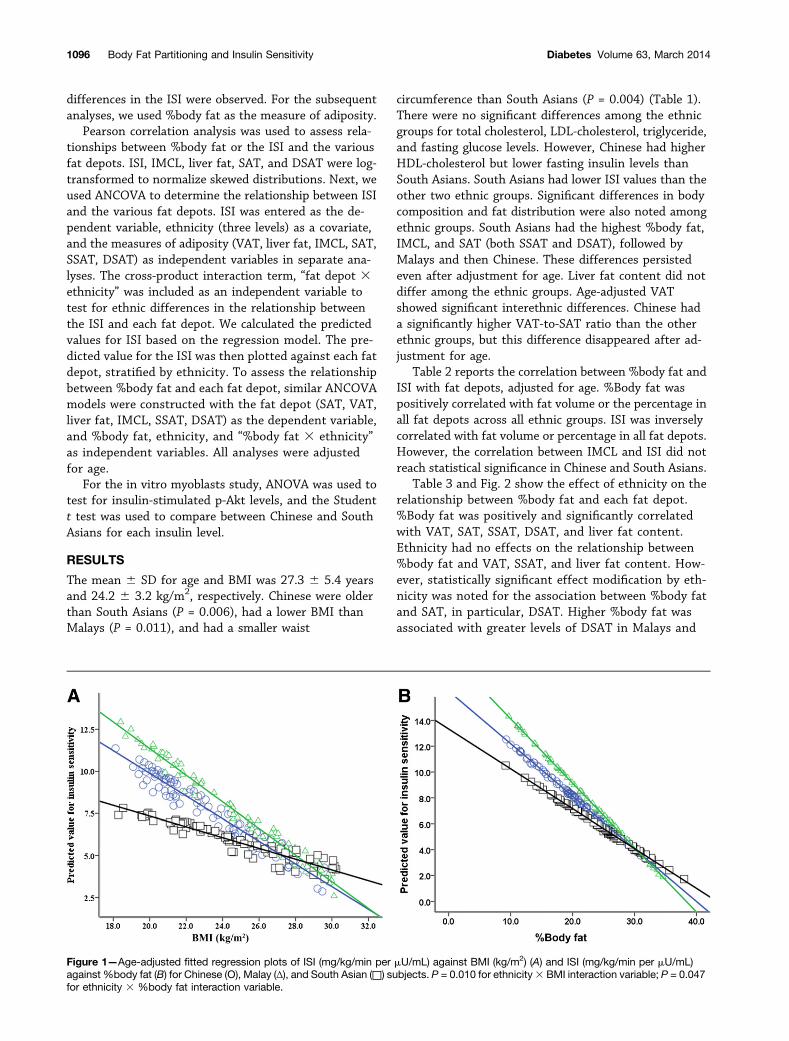
differences in the ISI were observed. For the subsequentanalyses, we used %body fat as the measure of adiposity.
Pearson correlation analysis was used to assess rela-tionships between %body fat or the ISI and the variousfat depots. ISI, IMCL, liver fat, SAT, and DSAT were log-transformed to normalize skewed distributions. Next, weused ANCOVA to determine the relationship between ISIand the various fat depots. ISI was entered as the de-pendent variable, ethnicity (three levels) as a covariate,and the measures of adiposity (VAT, liver fat, IMCL, SAT,SSAT, DSAT) as independent variables in separate ana-lyses. The cross-product interaction term, “fat depot 3ethnicity” was included as an independent variable totest for ethnic differences in the relationship betweenthe ISI and each fat depot. We calculated the predictedvalues for ISI based on the regression model. The pre-dicted value for the ISI was then plotted against each fatdepot, stratified by ethnicity. To assess the relationshipbetween %body fat and each fat depot, similar ANCOVAmodels were constructed with the fat depot (SAT, VAT,liver fat, IMCL, SSAT, DSAT) as the dependent variable,and %body fat, ethnicity, and “%body fat 3 ethnicity”as independent variables. All analyses were adjustedfor age.
For the in vitro myoblasts study, ANOVA was used totest for insulin-stimulated p-Akt levels, and the Studentt test was used to compare between Chinese and SouthAsians for each insulin level.
RESULTS
The mean 6 SD for age and BMI was 27.3 6 5.4 yearsand 24.2 6 3.2 kg/m2, respectively. Chinese were olderthan South Asians (P = 0.006), had a lower BMI thanMalays (P = 0.011), and had a smaller waist
circumference than South Asians (P = 0.004) (Table 1).There were no significant differences among the ethnicgroups for total cholesterol, LDL-cholesterol, triglyceride,and fasting glucose levels. However, Chinese had higherHDL-cholesterol but lower fasting insulin levels thanSouth Asians. South Asians had lower ISI values than theother two ethnic groups. Significant differences in bodycomposition and fat distribution were also noted amongethnic groups. South Asians had the highest %body fat,IMCL, and SAT (both SSAT and DSAT), followed byMalays and then Chinese. These differences persistedeven after adjustment for age. Liver fat content did notdiffer among the ethnic groups. Age-adjusted VATshowed significant interethnic differences. Chinese hada significantly higher VAT-to-SAT ratio than the otherethnic groups, but this difference disappeared after ad-justment for age.
Table 2 reports the correlation between %body fat andISI with fat depots, adjusted for age. %Body fat waspositively correlated with fat volume or the percentage inall fat depots across all ethnic groups. ISI was inverselycorrelated with fat volume or percentage in all fat depots.However, the correlation between IMCL and ISI did notreach statistical significance in Chinese and South Asians.
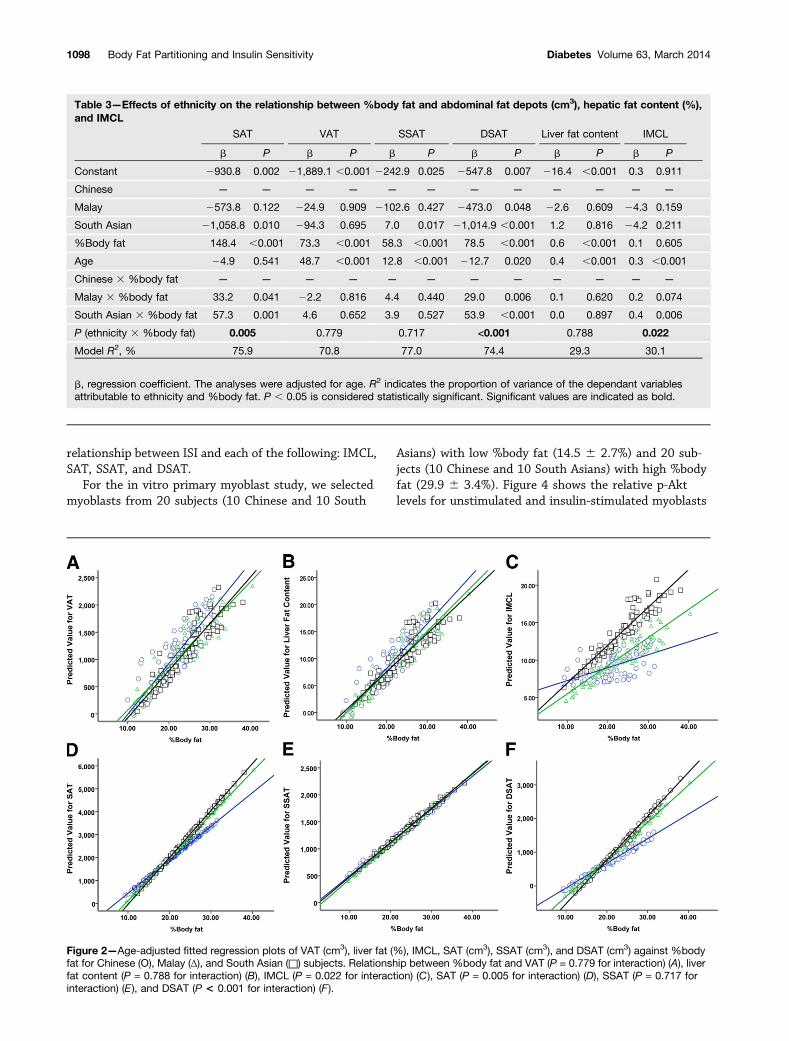
Table 3 and Fig. 2 show the effect of ethnicity on therelationship between %body fat and each fat depot.%Body fat was positively and significantly correlatedwith VAT, SAT, SSAT, DSAT, and liver fat content.Ethnicity had no effects on the relationship between%body fat and VAT, SSAT, and liver fat content. How-ever, statistically significant effect modification by eth-nicity was noted for the association between %body fatand SAT, in particular, DSAT. Higher %body fat wasassociated with greater levels of DSAT in Malays and
Figure 1—Age-adjusted fitted regression plots of ISI (mg/kg/min per mU/mL) against BMI (kg/m2) (A) and ISI (mg/kg/min per mU/mL)against %body fat (B) for Chinese (Ο), Malay (Δ), and South Asian (□) subjects. P = 0.010 for ethnicity3 BMI interaction variable; P = 0.047for ethnicity 3 %body fat interaction variable.
1096 Body Fat Partitioning and Insulin Sensitivity Diabetes Volume 63, March 2014
South Asians than in Chinese. A statistically significantethnic interaction was also noted between %body fatand IMCL, especially between Chinese and South Asians(P = 0.006).
Figure 3 shows the relationships between ISI andvarious fat depots and the influence of ethnicity on theserelationships. ISI was significantly lower, with greaterlevels of fat volume or percentage in all depots (P , 0.001
for all). In general, the patterns of association mirroredthat for %body fat and ISI (i.e., South Asians were lessinsulin-sensitive when fat volume or percentage waslow). This association was stronger in Chinese andMalays, such that at higher levels of fat volume or per-centage, no ethnic differences in ISI were observed. Thiswas observed in all fat depots, and the interaction term(fat depot3 ethnicity) was statistically significant for the
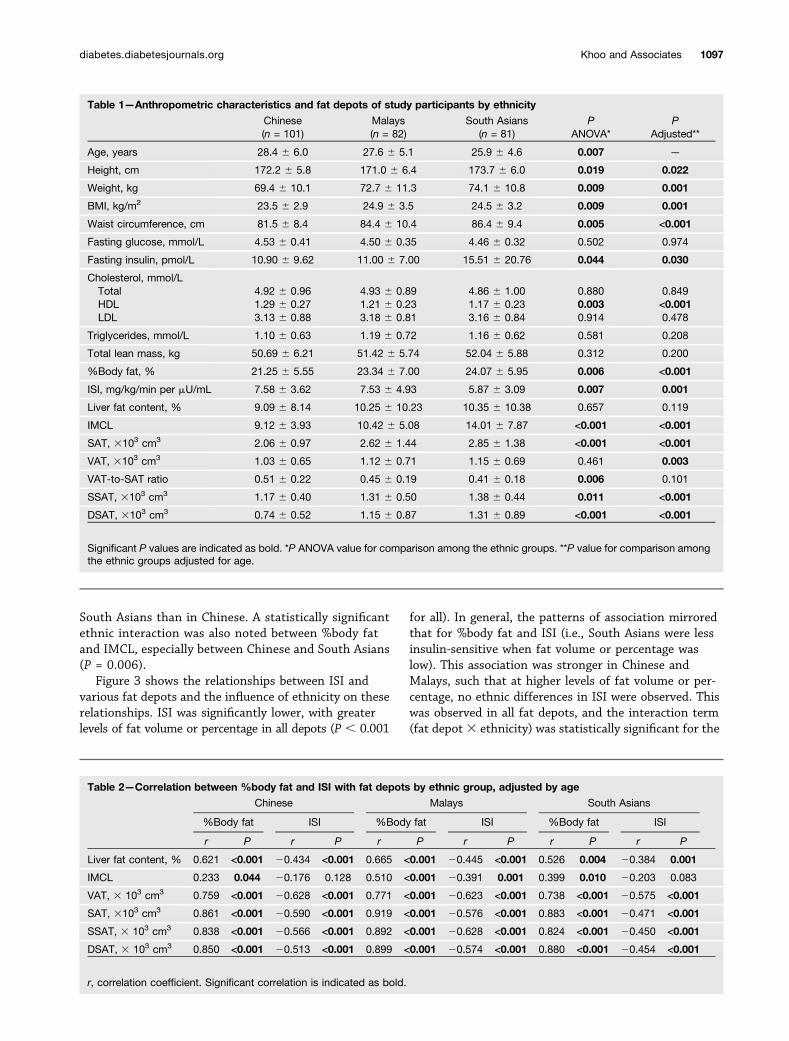
Table 1—Anthropometric characteristics and fat depots of study participants by ethnicity
Chinese Malays South Asians P P(n = 101) (n = 82) (n = 81) ANOVA* Adjusted**
Age, years 28.4 6 6.0 27.6 6 5.1 25.9 6 4.6 0.007 —
Height, cm 172.2 6 5.8 171.0 6 6.4 173.7 6 6.0 0.019 0.022
Weight, kg 69.4 6 10.1 72.7 6 11.3 74.1 6 10.8 0.009 0.001
BMI, kg/m2 23.5 6 2.9 24.9 6 3.5 24.5 6 3.2 0.009 0.001
Waist circumference, cm 81.5 6 8.4 84.4 6 10.4 86.4 6 9.4 0.005 <0.001
Fasting glucose, mmol/L 4.53 6 0.41 4.50 6 0.35 4.46 6 0.32 0.502 0.974
Fasting insulin, pmol/L 10.90 6 9.62 11.00 6 7.00 15.51 6 20.76 0.044 0.030
Cholesterol, mmol/LTotal 4.92 6 0.96 4.93 6 0.89 4.86 6 1.00 0.880 0.849HDL 1.29 6 0.27 1.21 6 0.23 1.17 6 0.23 0.003 <0.001LDL 3.13 6 0.88 3.18 6 0.81 3.16 6 0.84 0.914 0.478
Triglycerides, mmol/L 1.10 6 0.63 1.19 6 0.72 1.16 6 0.62 0.581 0.208
Total lean mass, kg 50.69 6 6.21 51.42 6 5.74 52.04 6 5.88 0.312 0.200
%Body fat, % 21.25 6 5.55 23.34 6 7.00 24.07 6 5.95 0.006 <0.001
ISI, mg/kg/min per mU/mL 7.58 6 3.62 7.53 6 4.93 5.87 6 3.09 0.007 0.001
Liver fat content, % 9.09 6 8.14 10.25 6 10.23 10.35 6 10.38 0.657 0.119
IMCL 9.12 6 3.93 10.42 6 5.08 14.01 6 7.87 <0.001 <0.001
SAT, 3103 cm3 2.06 6 0.97 2.62 6 1.44 2.85 6 1.38 <0.001 <0.001
VAT, 3103 cm3 1.03 6 0.65 1.12 6 0.71 1.15 6 0.69 0.461 0.003
VAT-to-SAT ratio 0.51 6 0.22 0.45 6 0.19 0.41 6 0.18 0.006 0.101
SSAT, 3103 cm3 1.17 6 0.40 1.31 6 0.50 1.38 6 0.44 0.011 <0.001
DSAT, 3103 cm3 0.74 6 0.52 1.15 6 0.87 1.31 6 0.89 <0.001 <0.001
Significant P values are indicated as bold. *P ANOVA value for comparison among the ethnic groups. **P value for comparison amongthe ethnic groups adjusted for age.
Table 2—Correlation between %body fat and ISI with fat depots by ethnic group, adjusted by age
Chinese Malays South Asians
%Body fat ISI %Body fat ISI %Body fat ISI
r P r P r P r P r P r P
Liver fat content, % 0.621 <0.001 20.434 <0.001 0.665 <0.001 20.445 <0.001 0.526 0.004 20.384 0.001
IMCL 0.233 0.044 20.176 0.128 0.510 <0.001 20.391 0.001 0.399 0.010 20.203 0.083
VAT, 3 103 cm3 0.759 <0.001 20.628 <0.001 0.771 <0.001 20.623 <0.001 0.738 <0.001 20.575 <0.001
SAT, 3103 cm3 0.861 <0.001 20.590 <0.001 0.919 <0.001 20.576 <0.001 0.883 <0.001 20.471 <0.001
SSAT, 3 103 cm3 0.838 <0.001 20.566 <0.001 0.892 <0.001 20.628 <0.001 0.824 <0.001 20.450 <0.001
DSAT, 3 103 cm3 0.850 <0.001 20.513 <0.001 0.899 <0.001 20.574 <0.001 0.880 <0.001 20.454 <0.001
r, correlation coefficient. Significant correlation is indicated as bold.
diabetes.diabetesjournals.org Khoo and Associates 1097
relationship between ISI and each of the following: IMCL,SAT, SSAT, and DSAT.
For the in vitro primary myoblast study, we selectedmyoblasts from 20 subjects (10 Chinese and 10 South
Asians) with low %body fat (14.5 6 2.7%) and 20 sub-jects (10 Chinese and 10 South Asians) with high %bodyfat (29.9 6 3.4%). Figure 4 shows the relative p-Aktlevels for unstimulated and insulin-stimulated myoblasts
Table 3—Effects of ethnicity on the relationship between %body fat and abdominal fat depots (cm3), hepatic fat content (%),and IMCL
SAT VAT SSAT DSAT Liver fat content IMCL
b P b P b P b P b P b P
Constant 2930.8 0.002 21,889.1 ,0.001 2242.9 0.025 2547.8 0.007 216.4 ,0.001 0.3 0.911
Chinese — — — — — — — — — — — —
Malay 2573.8 0.122 224.9 0.909 2102.6 0.427 2473.0 0.048 22.6 0.609 24.3 0.159
South Asian 21,058.8 0.010 294.3 0.695 7.0 0.017 21,014.9 ,0.001 1.2 0.816 24.2 0.211
%Body fat 148.4 ,0.001 73.3 ,0.001 58.3 ,0.001 78.5 ,0.001 0.6 ,0.001 0.1 0.605
Age 24.9 0.541 48.7 ,0.001 12.8 ,0.001 212.7 0.020 0.4 ,0.001 0.3 ,0.001
Chinese 3 %body fat — — — — — — — — — — — —
Malay 3 %body fat 33.2 0.041 22.2 0.816 4.4 0.440 29.0 0.006 0.1 0.620 0.2 0.074
South Asian 3 %body fat 57.3 0.001 4.6 0.652 3.9 0.527 53.9 ,0.001 0.0 0.897 0.4 0.006
P (ethnicity 3 %body fat) 0.005 0.779 0.717 <0.001 0.788 0.022
Model R2, % 75.9 70.8 77.0 74.4 29.3 30.1
b, regression coefficient. The analyses were adjusted for age. R2 indicates the proportion of variance of the dependant variablesattributable to ethnicity and %body fat. P , 0.05 is considered statistically significant. Significant values are indicated as bold.
Figure 2—Age-adjusted fitted regression plots of VAT (cm3), liver fat (%), IMCL, SAT (cm3), SSAT (cm3), and DSAT (cm3) against %bodyfat for Chinese (Ο), Malay (Δ), and South Asian (□) subjects. Relationship between %body fat and VAT (P = 0.779 for interaction) (A), liverfat content (P = 0.788 for interaction) (B), IMCL (P = 0.022 for interaction) (C), SAT (P = 0.005 for interaction) (D), SSAT (P = 0.717 forinteraction) (E), and DSAT (P < 0.001 for interaction) (F).
1098 Body Fat Partitioning and Insulin Sensitivity Diabetes Volume 63, March 2014
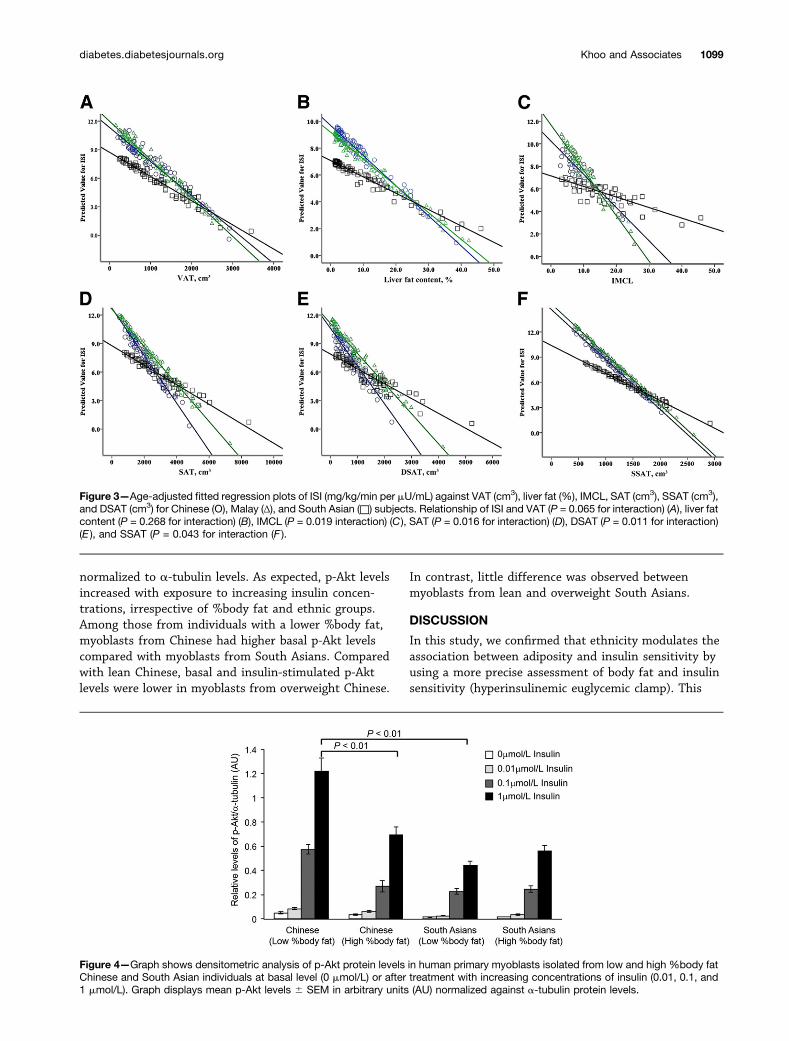
normalized to a-tubulin levels. As expected, p-Akt levelsincreased with exposure to increasing insulin concen-trations, irrespective of %body fat and ethnic groups.Among those from individuals with a lower %body fat,myoblasts from Chinese had higher basal p-Akt levelscompared with myoblasts from South Asians. Comparedwith lean Chinese, basal and insulin-stimulated p-Aktlevels were lower in myoblasts from overweight Chinese.
In contrast, little difference was observed betweenmyoblasts from lean and overweight South Asians.
DISCUSSION
In this study, we confirmed that ethnicity modulates theassociation between adiposity and insulin sensitivity byusing a more precise assessment of body fat and insulinsensitivity (hyperinsulinemic euglycemic clamp). This
Figure 3—Age-adjusted fitted regression plots of ISI (mg/kg/min per mU/mL) against VAT (cm3), liver fat (%), IMCL, SAT (cm3), SSAT (cm3),and DSAT (cm3) for Chinese (Ο), Malay (Δ), and South Asian (□) subjects. Relationship of ISI and VAT (P = 0.065 for interaction) (A), liver fatcontent (P = 0.268 for interaction) (B), IMCL (P = 0.019 interaction) (C), SAT (P = 0.016 for interaction) (D), DSAT (P = 0.011 for interaction)(E ), and SSAT (P = 0.043 for interaction (F ).
Figure 4—Graph shows densitometric analysis of p-Akt protein levels in human primary myoblasts isolated from low and high %body fatChinese and South Asian individuals at basal level (0 mmol/L) or after treatment with increasing concentrations of insulin (0.01, 0.1, and1 mmol/L). Graph displays mean p-Akt levels 6 SEM in arbitrary units (AU) normalized against a-tubulin protein levels.
diabetes.diabetesjournals.org Khoo and Associates 1099
agrees with our previous findings, which used the ho-meostasis model assessment of insulin resistance asa measure of insulin resistance and BMI as the measureof adiposity (4). We showed that with higher %body fat,all three ethnic groups accumulate fat in the liver and inVAT and SSAT compartments to a similar extent. How-ever, Chinese with higher levels of %body fat seemed toaccumulate DSAT and IMCL to a lesser extent comparedwith other ethnic groups. Fat in both of these compart-ments has been thought to be detrimental, and therefore,this reduced accumulation of fat in these depots does notexplain the stronger association between high adiposityand low ISI observed in Chinese than in other ethnicgroups. Although insulin sensitivity was generally lowerwith greater fat volume or percentage in each adiposetissue depot, the effect was greater among Chinese andMalays than in South Asians. As such, our data do notsupport the hypothesis that a difference in fat accumu-lation in various fat depots is responsible for these ethnicdifferences. Studies performed in primary myoblastssuggest that these differences relate to differences in theexpression of p-Akt in the muscle of these ethnic groups.This is the first study to explore these relationships inrelation to insulin sensitivity and also the first study tocompare Chinese, Malays, and South Asians. These eth-nic groups (or related ethnic groups) represent almosttwo-thirds of the world’s populations living in areaswhere the prevalence of type 2 diabetes is projected toescalate tremendously.
Several studies have demonstrated ethnic differencesin the distribution of fat (6,7). Lear et al. (6) showed thatthe higher levels of VAT with greater adiposity were moreprominent in Chinese, followed by Europeans and thenSouth Asians, resulting in higher VAT in South Asians atlow levels of adiposity and lower VAT in South Asians athigher levels of adiposity. However, the authors did notmeasure insulin sensitivity, and whether the differencesin VAT accumulation translate into differences in insulinsensitivity is unclear. Nazare et al. (7) had recentlyshowed that the relationship between BMI and fat dis-tribution differed between ethnic groups. In particular,East Asians (from Japan, China, and Korea) had a ten-dency to accumulate more VAT with greater levels ofadiposity (both BMI and SAT) compared with Hispanics,African Caribbean blacks, and Southeast Asians. Atmoderate levels of adiposity, East Asians showed loweramounts of VAT; however, with higher BMI, East Asianshad greater levels of VAT. In relation to SAT, East Asiansaccumulated less SSAT and DSAT relative to VAT withhigher BMI, which explains their higher levels of VATdespite generally lower overall adiposity in this ethnicgroup. This study had several limitations. First,Southeast Asians originated mainly from Malaysia andThailand and comprise a mixture of Chinese, Malay, andSouth Asian ethnicities. Second, the study did not in-clude South Asians, an ethnic group that is thought tosuffer most from the effects of insulin resistance and
visceral adiposity. Finally, few of the ethnic differences inthe relationship between fat volume and cardiometabolicrisk factors reached statistical significance. This may re-late to the fact that insulin resistance was assessed usinga variety of cardiometabolic variables that do not pre-cisely represent insulin stimulated glucose uptake.
Of specific relevance to our present study, the Multi-cultural Community Health Assessment Trial showedthat Chinese exhibited more VAT per kilogram of totalbody fat than Europeans, whereas South Asians exhibitedless VAT per kilogram of total body fat (6); however,there was no direct comparison between Chinese andSouth Asians. Our study agrees with these studies (6,7)and confirms that East Asians tend to accumulate VATwith higher levels of adiposity. In addition, our studyprovides a direct comparison between Chinese and SouthAsians in relation to fat partitioning with adiposity and isthe first to include liver fat content and IMCL. Weshowed that differential fat partitioning with higherlevels of adiposity between Chinese and South Asians isobserved, particularly for DSAT and IMCL.
Excessive accumulation of DSAT is associated withadverse lipid profiles and with insulin resistance (20).The DSAT depot has higher saturated lipids contentcompared with SSAT (21). The expression profiles of11b-hydroxysteroid dehydrogenase-1, leptin, and resis-tin in DSAT are closer to VAT (22). Taken together, DSATrepresents a distinct abdominal fat depot that may havepathogenic potential in the development of obesity-associated disorders. However, our data do not suggestthat the differences in DSAT are likely to explain theethnic differences in insulin sensitivity. This greaterpropensity to deposit DSAT with higher %body fat wasobserved in Malays and South Asians, whereas Chineseshowed the least tendency to accumulate DSAT. How-ever, the negative relationship of higher %body fat andlower insulin sensitivity was greater in Chinese than inthe other ethnic groups.
In relation to IMCL, South Asians tend to accumulatemore IMCL with higher levels of adiposity than Malays orChinese. However, this did not explain the ethnic dif-ferences in insulin sensitivity observed. Indeed, theassociations between IMCL and insulin sensitivity wereweak in all three ethnic groups. The reason for the weakcorrelation between IMCL and insulin sensitivity is un-clear and may be context-dependent. That higher levelsof IMCL are associated with enhanced insulin sensitivityin endurance-trained athletes is well known (23). Al-though our participants were not endurance-trainedathletes, they were young. A study in mice showed thatyoung mice exhibited high IMCL but were insulin-sensitive, in contrast to old mice, which had high IMCLbut were insulin-resistant (24). Thus, one possibility isthat age modulates the association between IMCL andinsulin sensitivity and that in young subjects (such asours), the association between IMCL and insulin sensi-tivity is less strong.
1100 Body Fat Partitioning and Insulin Sensitivity Diabetes Volume 63, March 2014
We have also shown that these in vivo findings arerecapitulated in vitro. Akt is a downstream effector ofphosphatidyl inositol 3-kinase in the insulin-signalingpathway and plays a key role in regulating GLUT4 traf-ficking for intracellular glucose uptake. Consistent withthe in vivo ISI, we observed that the basal and insulin-stimulated p-Akt levels were lower in myoblasts fromlean South Asians compared with those from leanChinese. Higher %body fat was associated with lower p-Aktin myoblasts from Chinese subjects but not in those fromSouth Asians. In lean South Asians, basal and insulin-stimulated p-Akt levels were similar to Chinese with high%body fat. The mechanisms underlying this observationare not clear at this time. However, we suggest thata primary defect in the muscles that is unaffected byincreasing adiposity may underlie the insulin resistanceobserved in South Asians. The hypothesis that non–obesity-mediated pathways may be important in thepathogenesis of insulin resistance is consistent with thefindings of Abbasi et al. (25), who reported that obesityexplains only 22% of the variance in insulin sensitivity.
In contrast to our study, Chandalia et al. (1) foundthat for any given BMI level, greater insulin resistance inSouth Asians was accompanied by greater truncal adi-posity compared with Caucasians. These authors alsoshowed that South Asians had higher levels of adiposityin the truncal subcutaneous compartment than in thevisceral compartment. Nonetheless, these differences infat mass in different compartments failed to explain theethnic differences in insulin resistance. In fact, theauthors showed that insulin resistance in young SouthAsian men can be observed even without an increase inthe intraperitoneal fat mass and is related to large sub-cutaneous adipose adipocytes size.
The molecular basis underpinning the greater effect ofadiposity on insulin resistance in Chinese remains un-solved. One prevailing hypothesis is that limited fat ex-pandability in these susceptible individuals gives rise todysfunctional adipose function, greater inflammation,and altered adipokines production. This hypothesis isfurther suggested by Chandalia et al. (1), who showedthat South Asians had high levels of nonesterified fattyacid and low levels of adiponectin compared with Cau-casians (1). Ethnic differences in the relationship be-tween fat volume or percentage and adipokines,myokines, or inflammatory markers that mediate thebiological cross talk between adipose tissue and skeletalmuscle deserve further study.
There are limitations in our study. This study includedonly men. For future studies, it will be important toextend the findings in this study to women, taking intoaccount the variation in insulin resistance that occurs indifferent phases of the menstrual cycle. In addition, ourcohort consisted of young, healthy men who have lowrisk of diabetes or cardiometabolic diseases in theshort-term. However, we do believe that the propensityfor diabetes in these individuals is high (in Singapore,
more than 30% of the population aged older than 50years has diabetes), and studying them when they areyoung and healthy allows us to avoid any confoundingthat occurs due to reverse causation that may occur afterchronic diseases develop. Furthermore, our findings aresimilar to our previous findings (which included a mucholder population), and as such, we do not feel that this isa major limitation of this study. We also did not sys-tematically measure hepatic insulin sensitivity. The in-sulin sensitivity measured using the euglycemic clampreflects primarily skeletal muscle insulin sensitivity. Fu-ture studies on differences in insulin sensitivity amongthe ethnic groups will need to take into consideration theuse of radiolabeled glucose tracers to quantify hepaticinsulin resistance.
In summary, irrespective of ethnic groups, higher%body fat is associated with higher fat volume or per-centage in various depots or organs. Higher %body fat isalso associated with lower insulin sensitivity. Ethnicitymodulates the relationship between adiposity and insulinsensitivity, although this phenomenon appears complexand cannot be purely explained by differences in body fatpartitioning alone. Our study suggests that in SouthAsians, non–obesity-related insulin resistance may pre-dominate in skeletal muscles. In contrast, Chinese andMalays appear to be more affected by higher levels ofadiposity. Further studies of adipose tissue and skeletalmuscle from these ethnic groups will be required todissect the pathways to insulin resistance. These findingsmay have relevance to other populations because obesityis known to explain only a small proportion of the var-iance in insulin sensitivity.
Funding. This study was funded by the National Medical Research CouncilTranslational and Clinical Research Flagship Programme Grant (NMRC/TCR/004).
Duality of Interest. No potential conflicts of interest relevant to thisarticle were reported.
Author Contributions. C.M.K. and M.K.-S.L. were responsible for thestudy execution and for manuscript preparation. C.M.K. and K.V. were re-sponsible for data management and data analyses. C.M.K., M.K.-S.L., K.V., andE.Y.H.K. performed study experiments. S.A.S. and S.S.V. were responsible forthe MR imaging and MR spectroscopy. R.L. and Y.T.O. performed the myo-blasts experiment. R.K. and C.M. were responsible for the design and inter-pretation of the myoblasts study. P.D.G., Y.S.L., and Y.S.C. provided criticalreview of the manuscript. E.S.T. wrote the grant proposal, designed theexperiments, and reviewed and edited the final manuscript. C.M.K. and E.S.T.are the guarantors of this work and, as such, had full access to all the data inthe study and take responsibility for the integrity of the data and the accuracyof the data analysis.
References1. Chandalia M, Lin P, Seenivasan T, et al. Insulin resistance and body fat
distribution in South Asian men compared to Caucasian men. PLoS ONE2007;2:e812
2. Liew CF, Seah ES, Yeo KP, Lee KO, Wise SD. Lean, nondiabetic AsianIndians have decreased insulin sensitivity and insulin clearance, and raised
diabetes.diabetesjournals.org Khoo and Associates 1101
leptin compared to Caucasians and Chinese subjects. Int J Obes RelatMetab Disord 2003;27:784–789
3. Chandalia M, Abate N, Garg A, Stray-Gundersen J, Grundy SM. Relation-ship between generalized and upper body obesity to insulin resistance inAsian Indian men. J Clin Endocrinol Metab 1999;84:2329–2335
4. Khoo CM, Sairazi S, Taslim S, et al. Ethnicity modifies the relationships ofinsulin resistance, inflammation, and adiponectin with obesity in a multi-ethnic Asian population. Diabetes Care 2011;34:1120–1126
5. Tai ES, Lim SC, Chew SK, Tan BY, Tan CE. Homeostasis model assess-ment in a population with mixed ethnicity: the 1992 Singapore NationalHealth Survey. Diabetes Res Clin Pract 2000;49:159–168
6. Lear SA, Humphries KH, Kohli S, Chockalingam A, Frohlich JJ, BirminghamCL. Visceral adipose tissue accumulation differs according to ethnicbackground: results of the Multicultural Community Health AssessmentTrial (M-CHAT). Am J Clin Nutr 2007;86:353–359
7. Nazare JA, Smith JD, Borel AL, et al. Ethnic influences on the relationsbetween abdominal subcutaneous and visceral adiposity, liver fat,and cardiometabolic risk profile: the International Study of Predictionof Intra-Abdominal Adiposity and Its Relationship With Cardiometa-bolic Risk/Intra-Abdominal Adiposity. Am J Clin Nutr 2012;96:714–726
8. Kumashiro N, Erion DM, Zhang D, et al. Cellular mechanism of insulinresistance in nonalcoholic fatty liver disease. Proc Natl Acad Sci U S A2011;108:16381–16385
9. Corcoran MP, Lamon-Fava S, Fielding RA. Skeletal muscle lipid depositionand insulin resistance: effect of dietary fatty acids and exercise. Am J ClinNutr 2007;85:662–677
10. Ukropcova B, McNeil M, Sereda O, et al. Dynamic changes in fat oxidationin human primary myocytes mirror metabolic characteristics of the donor.J Clin Invest 2005;115:1934–1941
11. Bergman RN, Finegood DT, Ader M. Assessment of insulin sensitivity invivo. Endocr Rev 1985;6:45–86
12. Provencher SW. Estimation of metabolite concentrations from localized invivo proton NMR spectra. Magn Reson Med 1993;30:672–679
13. Cowin GJ, Jonsson JR, Bauer JD, et al. Magnetic resonance imaging andspectroscopy for monitoring liver steatosis. J Magn Reson Imaging 2008;28:937–945
14. Velan SS, Narasimhan K, Spencer RG, Raylman RR, Rajendran VM, AlwaySE. Ankle orientation alters bulk susceptibility and residual dipolar cou-plings during plantar flexion and dorsiflexion of skeletal muscle. Posterpresentation (Poster 2597) at the 18th Annual Meeting of the InternationalSociety of Magnetic Resonance in Medicine, 1-7 May 2010, Stockholm,Sweden
15. Pola A, Sadananthan SA, Yaligar J, et al. Skeletal muscle lipid metabolismstudied by advanced magnetic resonance spectroscopy. Prog Nucl MagnReson Spectrosc 2012;65:66–76
16. Sadananthan S, Zagorodnov V. Retrospective Techniques for Segmentationof Structural and Functional MR Brain Images. Singapore, NanyangTechnological University, 2010
17. Parimal S, Zagorodnov V. Segmentation of Magnetic Resonance Images ofBrain and Abdomen. Singapore, Nanyang Technological University, 2010.
18. Sadananthan SA, Zheng W, Chee MWL, Zagorodnov V. Skull strippingusing graph cuts. Neuroimage 2010;49:225–239
19. Li C, Xu C, Gui C, Fox MD. Distance regularized level set evolution and itsapplication to image segmentation. IEEE Trans Image Process 2010;19:3243–3254
20. Kelley DE, Thaete FL, Troost F, Huwe T, Goodpaster BH. Subdivisions ofsubcutaneous abdominal adipose tissue and insulin resistance. Am JPhysiol Endocrinol Metab 2000;278:E941–E948
21. Lundbom J, Hakkarainen A, Lundbom N, Taskinen MR. Deep subcutane-ous adipose tissue is more saturated than superficial subcutaneous adi-pose tissue. Int J Obes (Lond) 2013;37:620–622
22. Walker GE, Verti B, Marzullo P, et al. Deep subcutaneous adipose tissue:a distinct abdominal adipose depot. Obesity (Silver Spring) 2007;15:1933–1943
23. Dubé JJ, Amati F, Stefanovic-Racic M, Toledo FG, Sauers SE, GoodpasterBH. Exercise-induced alterations in intramyocellular lipids and insulin re-sistance: the athlete’s paradox revisited. Am J Physiol Endocrinol Metab2008;294:E882–E888
24. Neumann-Haefelin C, Kuhlmann J, Belz U, et al. Determinants of intra-myocellular lipid concentrations in rat hindleg muscle. Magn Reson Med2003;50:242–248
25. Abbasi F, Brown BW Jr, Lamendola C, McLaughlin T, Reaven GM. Re-lationship between obesity, insulin resistance, and coronary heart diseaserisk. J Am Coll Cardiol 2002;40:937–943
1102 Body Fat Partitioning and Insulin Sensitivity Diabetes Volume 63, March 2014


![Closed-Loop Decoder Adaptation Algorithms for Kalman ... · neural activity while a subject performs movements [2 4,8,9], or imagines moving [7,12 14], and then training a decoder](https://img.pdfslide.net/doc/110x75/5ff33de0f8b31f615c42ebb7/closed-loop-decoder-adaptation-algorithms-for-kalman-neural-activity-while-a.jpg)