Embed Size (px)
Citation preview
Body Surface and Intracardiac Mapping of
SAI QRST Integral Checkpoint Presentation
600.446: Computer Integrated Surgery II, Spring 2012 Group 11: Sindhoora Murthy and Markus Kowalsky Mentors: Dr. Larisa Tereshchenko, Dr. Fady Dawoud

Overview
� Introduction
� Motivation
� Quick Background
� Milestones
� Deliverables
� Technical Approach and Results
� Problems and Remaining Work
� References
Why?
� Physicians use electric potential maps of the heart to treat and diagnose arrhythmias
� Current method to map surface of heart is invasive and takes a long time
� Is there a better way to predict arrhythmias?
� We know that SAI QRST is a better clinical marker for a patient’s risk of ventricular arrhythmias but don’t understand what it means and how sensitive it is to lead placement
Background- Arrhythmias
� Approximately 350,000 people die of sudden cardiac death every year in the United States 1
� Half of all deaths caused by heart disease are sudden death 1
� Known that ventricular arrhythmias are linked to sudden death � Ventricular Tachycardia: rapid coordinated contraction of the
ventricles � Ventricular Fibrillation: rapid uncoordinated contraction of the
ventricles � Often Ventricular Tachycardia leads to Ventricular Fibrillation
which can quickly lead to sudden cardiac death
1. Lloyd-Jones D, Adams R, Carnethon M, et al. Heart disease and stroke statistics—2009 update: a report from the American Heart Association Statistics Committee and Stroke Statistics Subcommittee. Circulation 2009;119:480
Background-ECGs and QRST
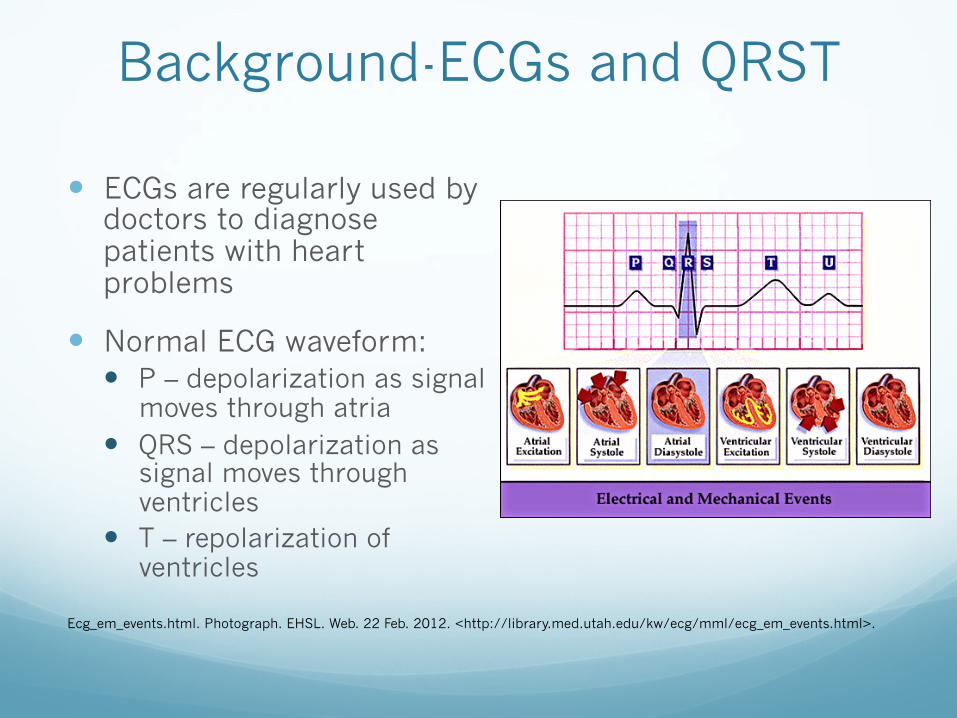
� ECGs are regularly used by doctors to diagnose patients with heart problems
� Normal ECG waveform: � P – depolarization as signal
moves through atria � QRS – depolarization as
signal moves through ventricles
� T – repolarization of ventricles
Ecg_em_events.html. Photograph. EHSL. Web. 22 Feb. 2012. <http://library.med.utah.edu/kw/ecg/mml/ecg_em_events.html>.
Background – SAI QRST
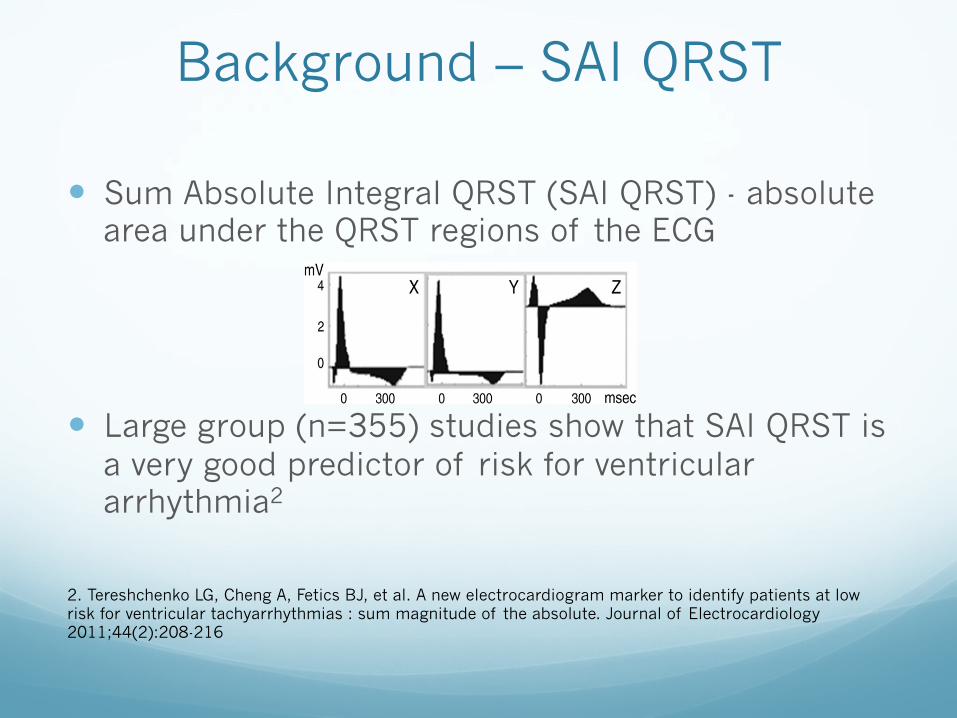
� Sum Absolute Integral QRST (SAI QRST) - absolute area under the QRST regions of the ECG
� Large group (n=355) studies show that SAI QRST is a very good predictor of risk for ventricular arrhythmia2
In this work, we proposed a novel ECG metric: summagnitude of the absolute QRST integral (SAI QRST). Wehypothesized that the SAI QRST predicts VA in primaryprevention ICD patients with structural heart disease.
Methods
The study protocol was approved by the Johns HopkinsUniversity institutional review board, and all patients gavewritten informed consent before entering the study.
Study population
Prospective Observational Study of the ICD in SuddenCardiac Death Prevention (PROSE-ICD) (NCT00733590) isa prospective, observational, multicenter cohort study ofprimary prevention ICD patients with either ischemic ornonischemic cardiomyopathy. Patients were eligible for thestudy if the left ventricular (LV) EF was less than or equal to35%, myocardial infarction was at least 4 weeks old, ornonischemic LV dysfunction was present for at least 9months. Patients were excluded if the ICD was indicated forsecondary prevention of SCD, if patient had a permanentpacemaker or a class I indication for pacing, if the patienthad New York Heart Association (NYHA) class IV, or if thepatient was pregnant. Electrophysiologic testing to assessinducibility of ventricular tachycardia (VT) was performedin 373 patients (73%) at the time of ICD implantation. Leftventricular diastolic diameter (LVDD) was assessed by 2-dimensional echocardiography in 225 patients (44.3%).Single-chamber ICD was implanted in 263 patients (52%),dual-chamber ICD in 92 patients (18%), and cardiacresynchronization therapy defibrillator (CRT-D) in 153patients (30%). The PROSE-ICD study is an ongoing activeproject that continues to enroll new patients. This reportpresents data analysis of study participants with at least 6months of follow-up, recruited at the Johns HopkinsHospital site.
Surface ECG recording
Digital orthogonal ECG was recorded before ICDimplantation during 5 minutes at rest, using the modifiedFrank18 orthogonal XYZ leads by PC ECG machine (NoravMedical Ltd, Thornhill, Ontario, Canada), with a 1000-Hzsampling frequency, high-pass filter 0.05 Hz, low-pass filter350 Hz, and notch filter 60 Hz.
QRST integral measurement
All ECGs were analyzed by customized software in arobust automated fashion. Noise and ventricular prematureand ventricular-paced beats were excluded from analysis, butECG recordings during atrial fibrillation were analyzed.Images of areas under the QRST curve were reviewed toensure appropriate ECG wave detection. Absolute QRSTintegral was measured as the arithmetic sum of areas underthe QRST curve (absolute area under the QRST curve abovebaseline was added to the area below baseline; Fig. 1),averaged during a 5-minute epoch. The sum magnitude of 3
orthogonal leads absolute QRST integral (SAI QRST)was calculated.
End points
Appropriate ICD therapies (either shock or antitachycar-dia pacing) for VA served as the primary end point foranalysis. Programming of the ICD was based on theattending electrophysiologist's clinical evaluation. The ICDdevice was interrogated during follow-up visits every 6months. All ICD interrogation data were reviewed by anindependent end points adjudication committee blinded tothe results of SAI QRST analysis. Implantable cardioverter-defibrillator therapies for monomorphic VT (MMVT),polymorphic VT (PVT), or ventricular fibrillation (VF)were classified as appropriate.Monomorphic VTwas definedas a sustained VT with stable cycle length (CL) andelectrogram morphology. Polymorphic VT was defined asa sustained VT with unstable CL and electrogram morphol-ogy and average CL of at least 200 milliseconds. Ventricularfibrillation was defined as sustained ventricular tachyar-rhythmia with unstable CL and electrogram morphology andaverage CL less than 200 milliseconds. Sustained appropri-ately treated VT/VF events were categorized as MMVTgroup and PVT/VF group.
Statistical analysis
The first 128 consecutive participants of the PROSE-ICDstudy were included in the derivation cohort. The validationcohort included the remaining 380 PROSE-ICD studyparticipants who were followed prospectively for at least6 months.
Derivation data set analysisCutoff points of SAI QRST were determined in the
preliminary analysis of 128 study patients, 15 of whom hadsustained VT/VF events during 13 ± 10 months of follow-up.In this derivation set, the lowest SAI QRST quartile was lessthan or equal to 69 mV ⁎ ms; and the highest quartile wasgreater than 145 mV ⁎ ms. Preliminary survival analysis ofthe derivation set showed that the lowest quartile of the SAIQRST predicted VT/VF (log-rank test, P b .0001) with100% sensitivity, 78% specificity, 37% positive predictivevalue, and 100% negative predictive value.
Validation data set analysisValidation cohort participants were categorized according
to their baseline SAI QRST value, with SAI QRST lessthan or equal to 69 mV ⁎ms labeled low, SAI QRST of 70 to
Fig. 1. Example of SAI QRST measurement. The sum of the areas underQRST curve on 3 orthogonal ECG leads is calculated.
209L.G. Tereshchenko et al. / Journal of Electrocardiology 44 (2011) 208–216
2. Tereshchenko LG, Cheng A, Fetics BJ, et al. A new electrocardiogram marker to identify patients at low risk for ventricular tachyarrhythmias : sum magnitude of the absolute. Journal of Electrocardiology 2011;44(2):208-216
Re-cap of Progress
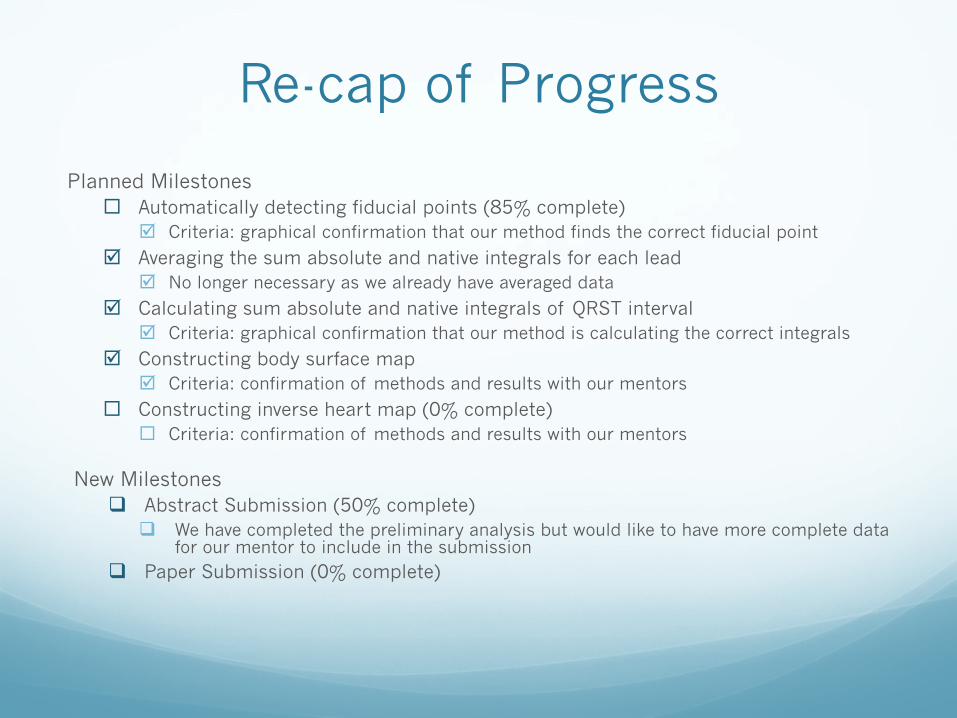
Planned Milestones ¨ Automatically detecting fiducial points (85% complete)
þ Criteria: graphical confirmation that our method finds the correct fiducial point
þ Averaging the sum absolute and native integrals for each lead þ No longer necessary as we already have averaged data
þ Calculating sum absolute and native integrals of QRST interval þ Criteria: graphical confirmation that our method is calculating the correct integrals
þ Constructing body surface map þ Criteria: confirmation of methods and results with our mentors
¨ Constructing inverse heart map (0% complete) ¨ Criteria: confirmation of methods and results with our mentors
New Milestones q Abstract Submission (50% complete)
q We have completed the preliminary analysis but would like to have more complete data for our mentor to include in the submission
q Paper Submission (0% complete)
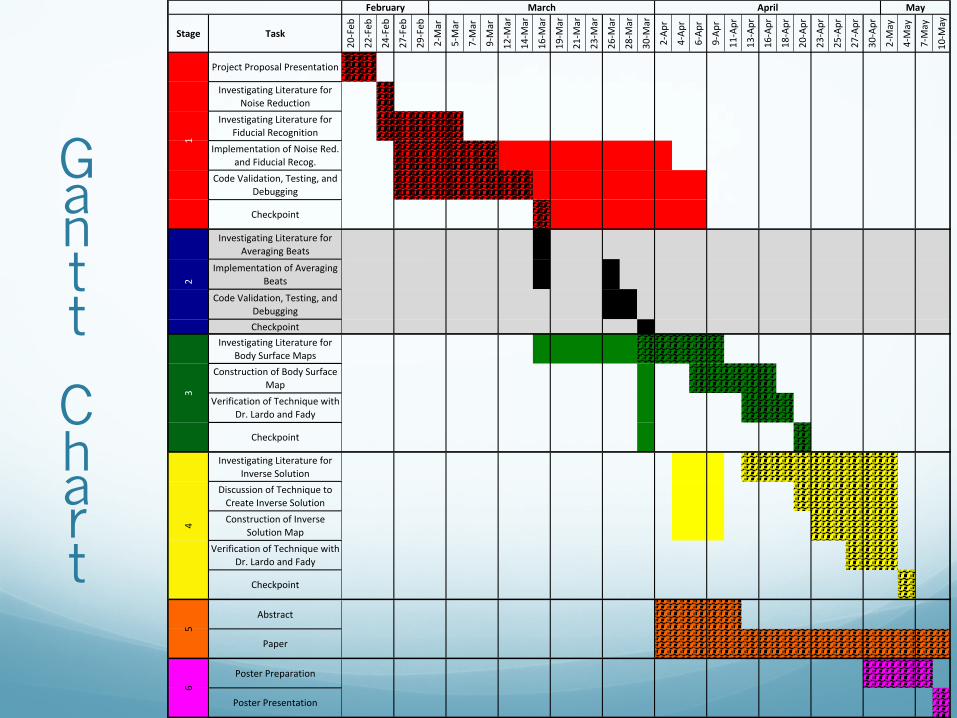
Gantt
Chart
Stage Task
20#Feb
22#Feb
24#Feb
27#Feb
29#Feb
2#Mar
5#Mar
7#Mar
9#Mar
12#M
ar
14#M
ar
16#M
ar
19#M
ar
21#M
ar
23#M
ar
26#M
ar
28#M
ar
30#M
ar
2#Ap
r
4#Ap
r
6#Ap
r
9#Ap
r
11#Apr
13#Apr
16#Apr
18#Apr
20#Apr
23#Apr
25#Apr
27#Apr
30#Apr
2#May
4#May
7#May
10#M
ay
Investigating<Literature<for<Averaging<Beats
Implementation<of<Averaging<Beats
Code<Validation,<Testing,<and<DebuggingCheckpoint
6
Poster<Presentation
12
3
Poster<Preparation
Abstract
Paper
5
Discussion<of<Technique<to<Create<Inverse<Solution<Construction<of<Inverse<
Solution<MapVerification<of<Technique<with<
Dr.<Lardo<and<Fady
Checkpoint
4
Checkpoint
Investigating<Literature<for<Inverse<Solution
April MayFebruary March
Project<Proposal<Presentation
Investigating<Literature<for<Body<Surface<Maps
Construction<of<Body<Surface<Map
Verification<of<Technique<with<Dr.<Lardo<and<Fady
Implementation<of<Noise<Red.<and<Fiducial<Recog.
Code<Validation,<Testing,<and<Debugging
Checkpoint<
Investigating<Literature<for<Noise<Reduction
Investigating<Literature<for<Fiducial<Recognition
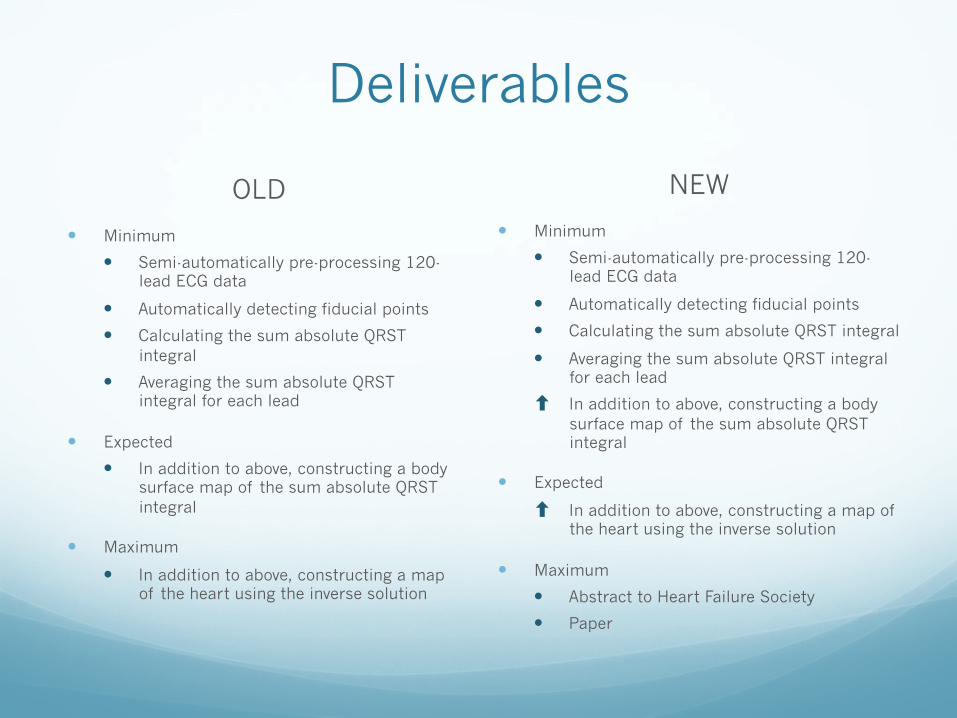
Deliverables
OLD
� Minimum
� Semi-automatically pre-processing 120-lead ECG data
� Automatically detecting fiducial points
� Calculating the sum absolute QRST integral
� Averaging the sum absolute QRST integral for each lead
� Expected
� In addition to above, constructing a body surface map of the sum absolute QRST integral
� Maximum
� In addition to above, constructing a map of the heart using the inverse solution
NEW
� Minimum
� Semi-automatically pre-processing 120-lead ECG data
� Automatically detecting fiducial points
� Calculating the sum absolute QRST integral
� Averaging the sum absolute QRST integral for each lead
⬆ In addition to above, constructing a body surface map of the sum absolute QRST integral
� Expected
⬆ In addition to above, constructing a map of the heart using the inverse solution
� Maximum
� Abstract to Heart Failure Society
� Paper
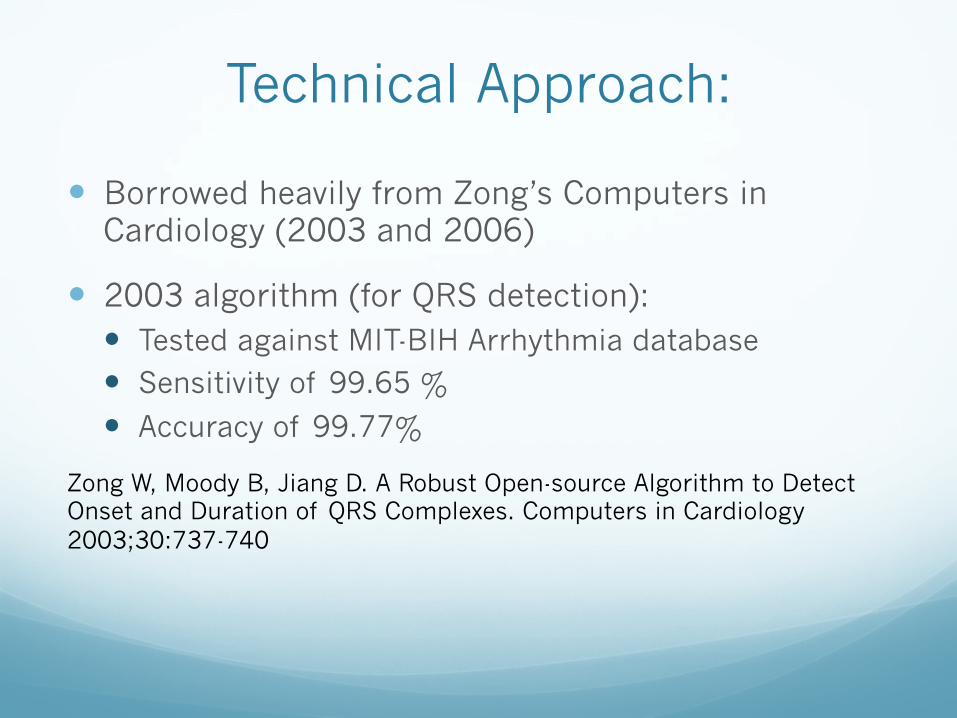
Technical Approach:
� Borrowed heavily from Zong’s Computers in Cardiology (2003 and 2006)
� 2003 algorithm (for QRS detection): � Tested against MIT-BIH Arrhythmia database � Sensitivity of 99.65 %
� Accuracy of 99.77%
Zong W, Moody B, Jiang D. A Robust Open-source Algorithm to Detect Onset and Duration of QRS Complexes. Computers in Cardiology 2003;30:737-740
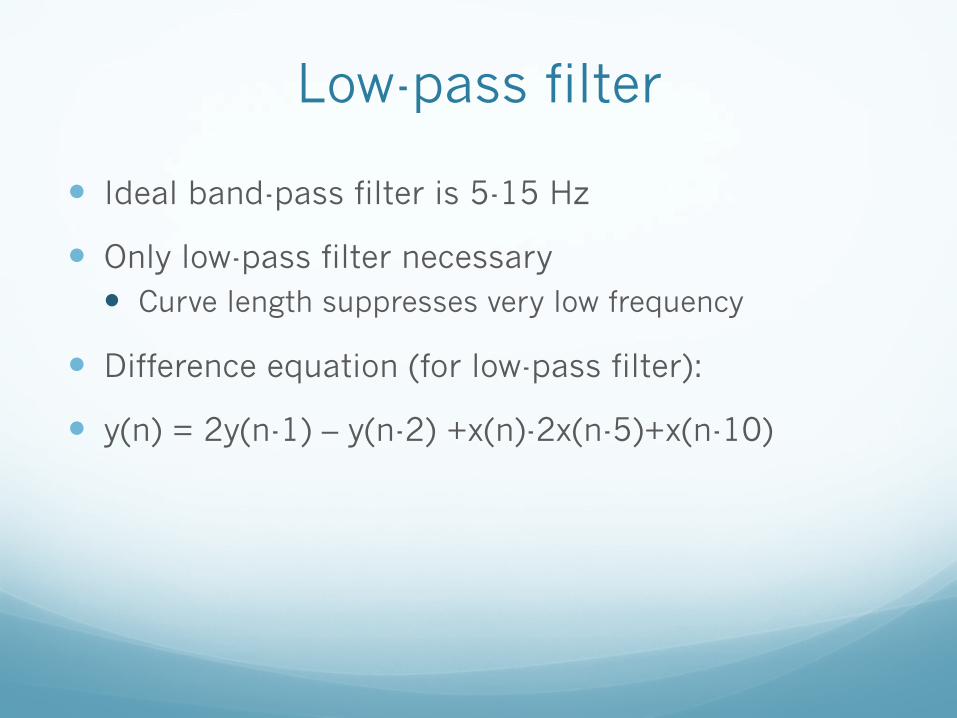
Low-pass filter
� Ideal band-pass filter is 5-15 Hz
� Only low-pass filter necessary � Curve length suppresses very low frequency
� Difference equation (for low-pass filter):
� y(n) = 2y(n-1) – y(n-2) +x(n)-2x(n-5)+x(n-10)
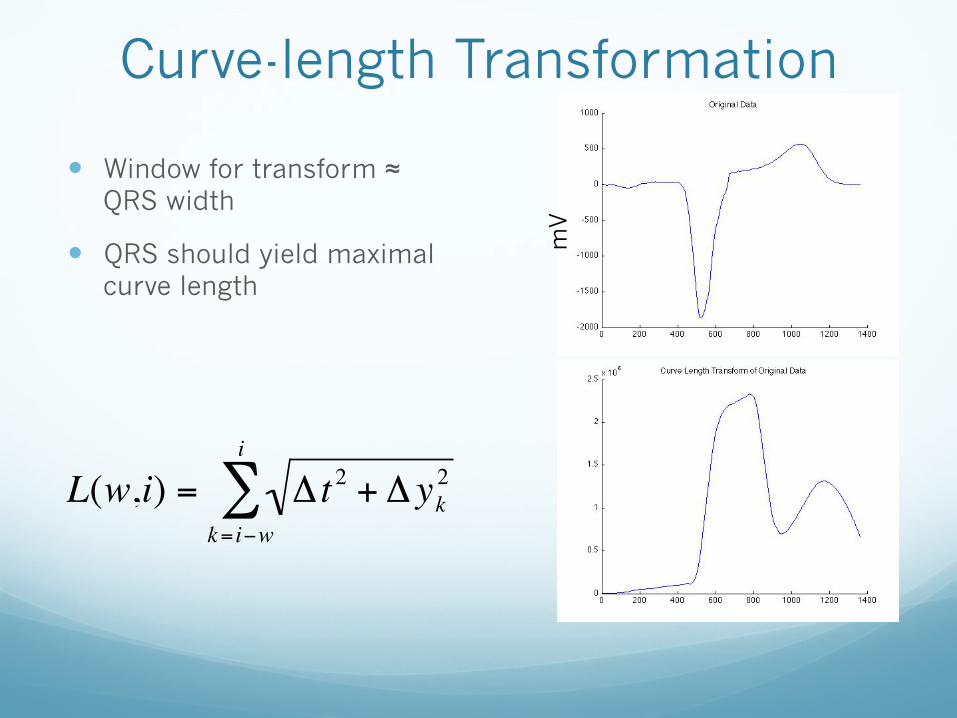
Curve-length Transformation
� Window for transform ≈ QRS width
� QRS should yield maximal curve length
€
L(w,i) = Δ t 2 + Δ yk2
k= i−w
i
∑m
V
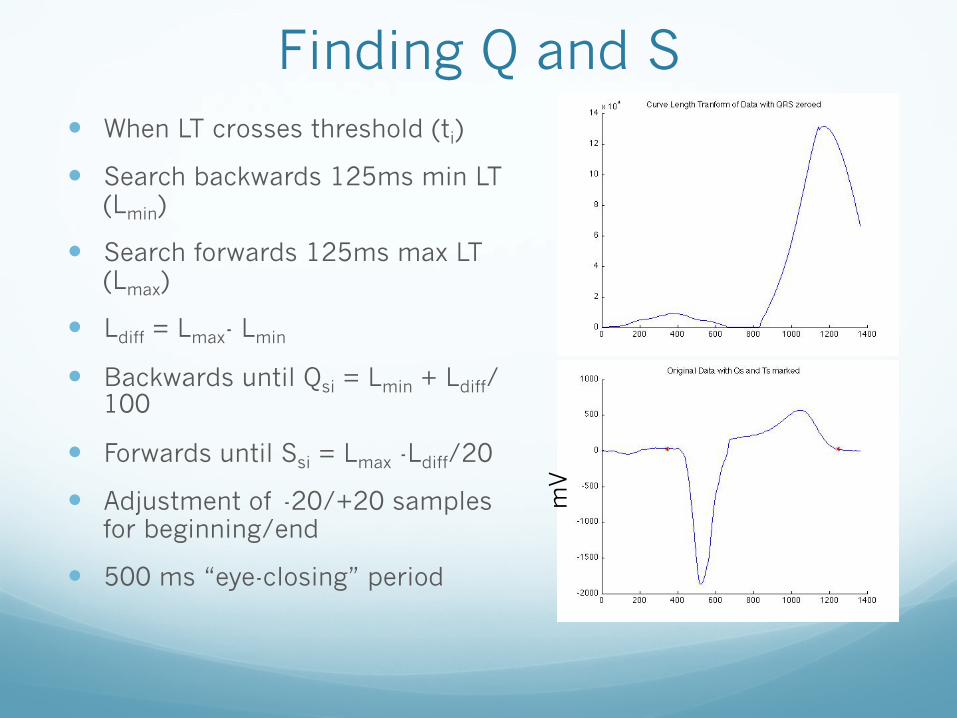
Finding Q and S � When LT crosses threshold (ti)
� Search backwards 125ms min LT (Lmin)
� Search forwards 125ms max LT (Lmax)
� Ldiff = Lmax- Lmin
� Backwards until Qsi = Lmin + Ldiff/100
� Forwards until Ssi = Lmax -Ldiff/20
� Adjustment of -20/+20 samples for beginning/end
� 500 ms “eye-closing” period m
V
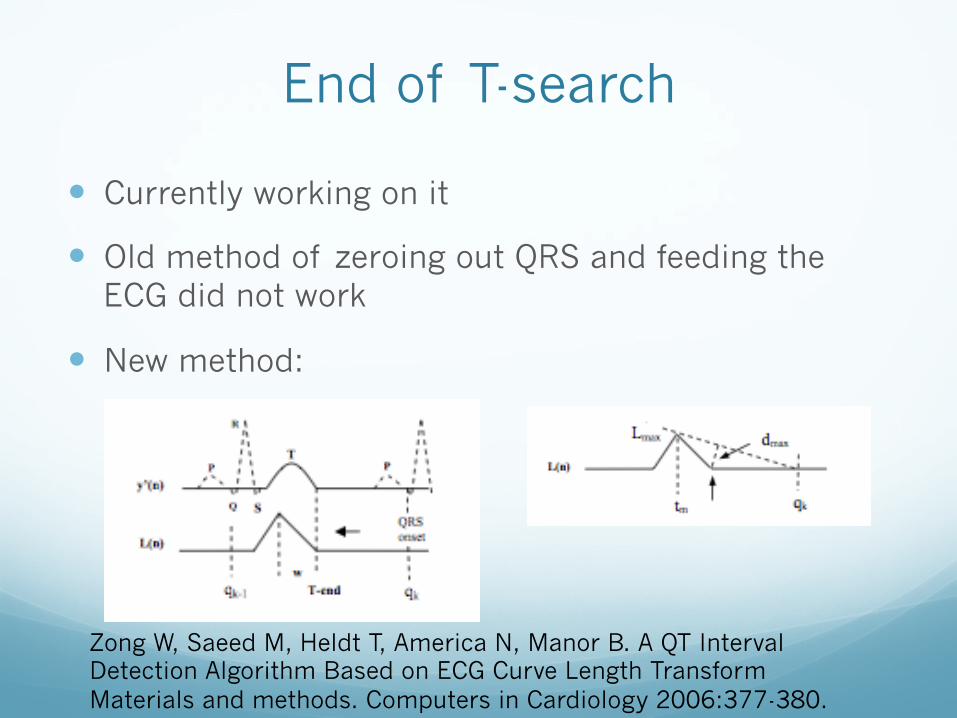
End of T-search
� Currently working on it
� Old method of zeroing out QRS and feeding the ECG did not work
� New method:
Zong W, Saeed M, Heldt T, America N, Manor B. A QT Interval Detection Algorithm Based on ECG Curve Length Transform Materials and methods. Computers in Cardiology 2006:377-380.
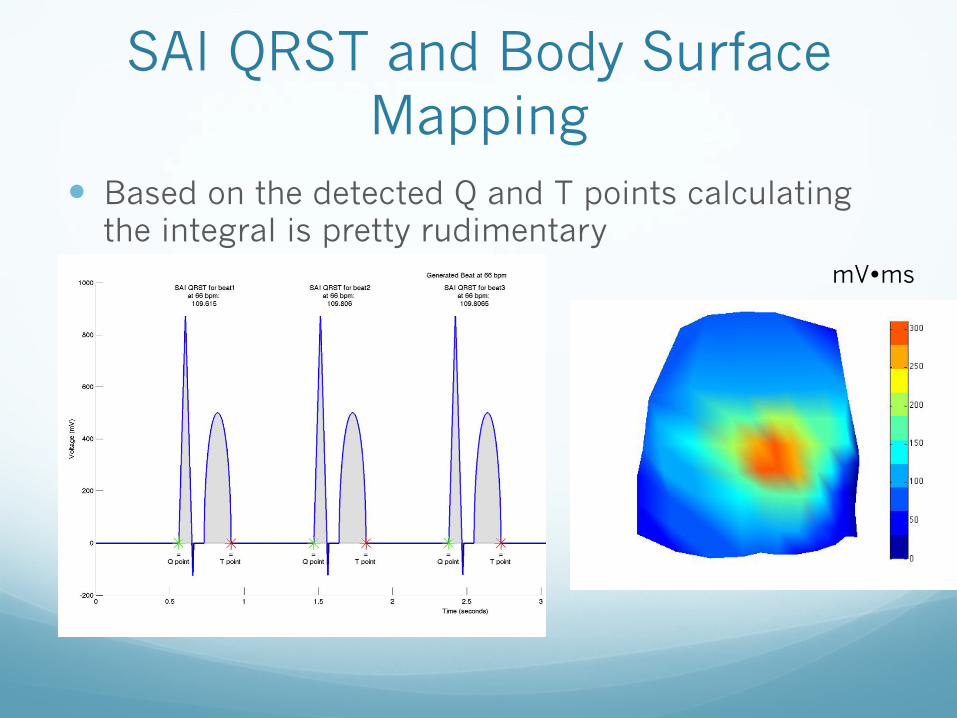
SAI QRST and Body Surface Mapping
� Based on the detected Q and T points calculating the integral is pretty rudimentary
mV�ms
Remaining Work
� Debugging the T-wave detection
� Validation of results
� Intracardiac Mapping
Dependencies
� IRB Approval � Mentors need IRB approval to release data � Status: Resolved
� Data Source � See above � Status: Resolved
� Weekly support meetings with Dr. Tereshchenko � Assistance with first two stages of project � Status: Resolved
� Packages to help solve the inverse problem and create body surface and heart maps � Turned out to just be a bunch of plotting features in MATLAB � Status: Resolved
� Meetings with Dr. Lardo or Fady for help with constructing body surface and heart maps � Fady will be primary contact and provide assistance with constructing these
maps � Status: Resolved
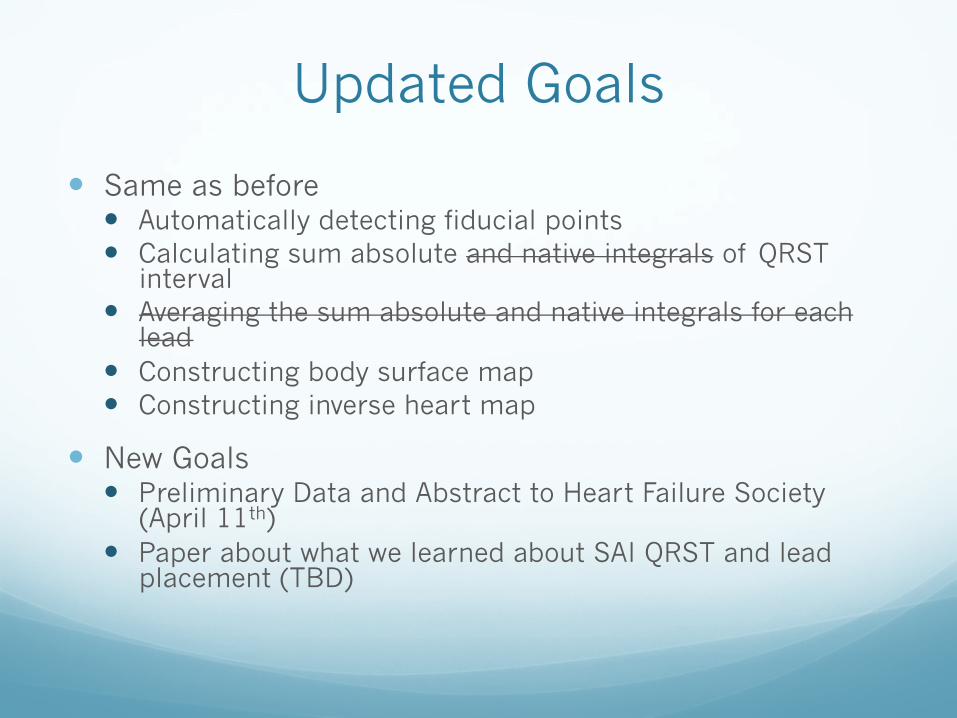
Updated Goals
� Same as before � Automatically detecting fiducial points � Calculating sum absolute and native integrals of QRST
interval � Averaging the sum absolute and native integrals for each
lead � Constructing body surface map � Constructing inverse heart map
� New Goals � Preliminary Data and Abstract to Heart Failure Society
(April 11th) � Paper about what we learned about SAI QRST and lead
placement (TBD)

Management Plan
� Everything remains the same as planned � Mentors:
� Weekly Meetings with Dr. Tereshchenko: Fridays 3-4:30pm
� Dr. Lardo – as needed (most likely not)
� Fady Dawoud – as needed
� Markus and Sindhoora: working together on all aspects of the project
References Remains the same as before
� 1. Ghosh S, Silva JN a, Canham RM, et al. Electrophysiologic substrate and intraventricular left ventricular dyssynchrony in nonischemic heart failure patients undergoing cardiac resynchronization therapy. Heart rhythm : the official journal of the Heart Rhythm Society 2011;8(5):692-9.
� 2. Ambroggi LD, Corlan AD. Body Surface Potential Mapping. In: Comprehensive Electrocardiology., 2011:1376-1413.
� 3. Rudy Y. Cardiac repolarization : Insights from mathematical modeling and electrocardiographic imaging ( ECGI ). HRTHM 2009;6(11):S49-S55.
� 4. Wang Y, Cuculich PS, Zhang J, Desouza KA, Smith TW, Rudy Y. Noninvasive Electroanatomic Mapping of Human Ventricular Arrhythmias with Electrocardiographic Imaging ( ECGI ). 2011;84.
� 5. Tereshchenko LG, Cheng A, Fetics BJ, et al. A new electrocardiogram marker to identify patients at low risk for ventricular tachyarrhythmias : sum magnitude of the absolute. Journal of Electrocardiology 2011;44(2):208-216.
� 6. Tereshchenko LG, Cheng A, Fetics BJ, et al. Ventricular arrhythmia is predicted by sum absolute QRST integral but not by QRS width. Journal of Electrocardiology 2010;43(6):548-552.
� 7. Sornmo L, Laguna P. ELECTROCARDIOGRAM (ECG) SIGNAL PROCESSING. Wiley Encyclopedia of Biomedical Engineering 2006:1-16.
� 8. Zong W, Saeed M, Heldt T, America N, Manor B. A QT Interval Detection Algorithm Based on ECG Curve Length Transform Materials and methods. Computers in Cardiology 2006:377-380.
� 9. Zong W, Moody B, Jiang D. A Robust Open-source Algorithm to Detect Onset and Duration of QRS Complexes. Computers in Cardiology 2003;30:737-740.

Questions?


![Inter-Surface Mapping - Hugues Hoppehhoppe.com/intersurf.pdf · Inter-surface mapping. Lee et al [1999] create an inter-surface map between two surfaces1𝑀, 𝑀2 by first constructing](https://img.pdfslide.net/doc/110x75/603a59a1704f6c3b614d0288/inter-surface-mapping-hugues-inter-surface-mapping-lee-et-al-1999-create-an.jpg)