Embed Size (px)
Citation preview

Data from theNATIONAL HEALTH SURVEY
Series 11Number 126
BodyWeight, Stature,
and Sitting Height:
White and Negro
Youths 12-17 Years
United States
Height, weight, and sitting height measurements cm whiteand Negro youths 12-17 years of age in the United States,1966-70, are compared.
DHEW Publication No. (HRA) 74-1608
U.S. DEPARTMENT OF HEALTH, EDUCATION, AND WELFARE
Public Health Service
Health Resources AdministrationNational Center for Health Statistics
Rockville, Md. August 1973
Series 11 reports present findings from the National Health ExaminationSurvey, which obtains data through direct examination, tests, and meas-urements of samples of the U.S. population. Reports 1 through 38 relateto the adult program, Cycle I of the Health Examination Survey. Thepresent report is one of a number of reports of findings from the c’hil-dren and youth programs, Cycles H and 111of the Health ExaminationSurvey. These reports are being published in Series 11 but are num-bered consecutively beginning with 101. It is hoped this will guideusers to the data in which they are interested.
Vital and Health Statistics-Series 1 l-No. 126
For sale by the Snporintendent of Documents, U.S. Government Printing Office, W’mhmgton, D.’C. 20402- I?rico 65 cents

NATIONAL CENTER FOR HEALTH STATISTICS
EDWARD B. PERRIN, Ph. D., Acting Director
PHILIP S. LAWRENCE, SC.D., Associate Director
GAIL F. FISHER, Acting Assistant Director for Health Statistics Development
WALT R. SIMMONS, M. A., Assistant Director for Research and Scientific Development
JOHN J. HANLON, M.D., Medics/ Advisor
JAMES E. KELLY, D.D.S., Dental Advisor
EDWARD E. MINTY, Executive Officer
ALICE HAYWOOD, Information Officer
DIVISION OF HEALTH EXAMINATION STATISTICS
ARTHUR J. McDOWELL, Director
GARRIE J. LOSEE, Deputy Director
PETER V. V. HAMILL, M.D., Medical Advisor, Children and Youth Programs
HENRY W. MILLER, ChieJ Operations and @ality Contro\ Branch
JEAN ROBERTS, Chief Medical Statistics Branch
SIDNEY ABRAHAM, chie~ Nutritional Statistics Branch
COOPERATION OF THE BUREAU OF THE CENSUS
In accordance with specifications established by the National Health Sur-
vey, the Bureau of the Census, under a contractual agreement, participated
in the design and selection of the sample, and carried out the first stage ofthe field interviewing and certain parts of the statistical processing.
Vital and Health Statistics-Series 11 -No. 126
DHEW Publication No. (HRA) 74-1608
Library of Congress Catalog Card Number 72-600212
CONTENTS
Page
Introduction ------- -------------- ------- ------- ------- ------- ------- --
h4ethod --------- --------------------------- ---------------------------
Height ------- -------------- ------- ------- ------- ------- ------- -----
Weight ------------------------------------------------------------Sitting Height ------------------------------------------------------Age---------------------------------------------------------------Race --------------------------------------------------------------
Results --------------------------------------------------------------Weight ------------------------------------------------------------SittingHeight/Stature Ratio ------------------------------------------
Discussion -----------------------------------------------------------
References ------- ------- ------- ------- ------- ------- ------- ------- ---
List of Detailed Tables --------- --------------------------- ------------
Appendix. Statistical Notes ------- ------- -.----- ------- ------- ------- -“
The Survey Design ------- -------------- ---.--- -------------- --------
Some Notes on Response Rates ----.-” -------------------- --------- -,_-
Parameter and Variance Estimation -------- ------- ------- ------- -----
Standards of Reliabili~ and Precision --------------------------------Hypothesis Testing -------------------------------------------------Imputation ---------------------------------------------------------Quality Control -----------------------------------------------------
1
233344
478
10
14
15
2929303132323334
...Ill

SYMBOLS
Data not available ------------------------ ---
Category not applicable ------------------- . . .
Quantity zero ---------------------------- -
Quantity more than O but less than O.05---- 0.0
Figure doesnot meet standards ofreliabilityor precision ------------------ *
iv
BODY WEIGHT,WHITE AND
STATURE, AND SITTING HEIGHT:NEGRO YOUTHS 12-17 YEARS
Peter V, V. Hamill, M.D., M.P.H., Francis E. Johnston, Ph.D.and Stanley Lemeshow, M.S.P.H.a
INTRODUCTION
This report comparing the weights, stand-ing heights, and sitting heights of white and Ne-gro youths 12-17 years of age in the UnitedStates is the second one in a series of reportspresenting amdyses and discussion of data onbody measurements performed in Cycle III ofthe Health Examination Survey. The first re-portl also concerned height and weight,. but itfocused on the interpretation of data during theadolescent growth spurt and” on clinical stand-ards, This series of Cycle III reports will parallelthe series on body measurement data from CycleII on children 6-11 years of age which coversheights, weights, skinfolds, and more than 20other body dimensions related to variables suchas age, sex, race, geographic region, socioeco-nomic level of family, IQ, self-concept, schoolachievement, and skeletal age. These reports ofCycle III body measurements, by supplementingthe reports from Cycles I and H, complete thepublication of data reporting body measure-ments for the population 6-79 years of age inthe United States in the decade of the 1960’s.
Cycle I of the Health Examination Survey(HES), conducted from 1959 to 1962, obtainedinformation on the prevalence of certain chronic
ahledical Advisor, Children and Youth Programs,Divisionof Health Examinatiofi Statistics; Professor ofAnthropology, University of Pennsylvania, Philadelphia;and formerly Analytical Statistician, Division of HealthExamination Statistics, respectively.
diseases and on the distribution of a number ofanthropometric and sensory characteristics inthe civilian, noninstitutionalized population ofthe continental United States aged 18-79 years.The general plan and operation of the surveyand of Cycle I are described in two previous re-portsz33and most of the results are published inother Vital and Health Statistics Series 11 reports.
Cycle II of the Health Examination Survey,conducted from July 1963 to December 1965,involved selection and. examination of a proba-bility sample of noninstitutionalized children inthe United States aged 6-11 years. This programsucceeded in examining 96 percent of the 7,417children selected for the sample. The examina-tion had. two focdses: on factors related tohealthy growth and development as determinedby. a physician, a nurse, a dentist, and a psychol-ogist and on a variety of somatic and physiologicmeasurements performed by special$ trainedtechnicians. The detailed plan and operation ofCycle II and the response results are describedin Vital and Health Statistics, Series 1-Number5.4
HES Cycle III, conducted from March1966 to March 1970, was essentially an agewiseextension of Cycle II. As described in detail in“Plan and Operation of a Health ExaminationSurvey of U.S. Youths 12-17 Years of Age,”5 itwas more similar to Cycle 11than it was to CycleI not only in form, content, and style but alsowith its major emphasis on factors of “normal’.’growth and development rather than chronic dis-eases. In fact, the identical sampling units wereused in Cycle 111which had been used in Cycle
1
II approximately 3 years earlier,band as a resultover 30 percent of the youths examined in CycleIII had also been examined as children in CycleII 3 years earlier. By examining more than 2,000of the children at two different ages, it was in-tended to provide a quasi-longitudinal aspect to.these two sequential cross-sectional surveys.However, this more complex quasi-longitudinalanalysis will be reserved for future reports onbody composition and body proportion; in thisreport the data will be handled in the more fa-miliar cross-sectional mode.
The first report from Cycle III, Series 11,Number 124,1 presented data on measurementsof height and weight by age and sex and focusedon two facets: (1) the adolescent growth spurtand (2) a discussion of clinical application of thedata and presentation of clinical standards. Thisreport carries the analysis of height and weightdata a step further not only by introducing raceas the major classifying variable but also b y tak-ing a more detailed look at stature through anal-ysis of the reciprocal relationship of its majorcomponents, sitting height and leg length. Theadolescent growth spurts of. Negro and whiteyouths will be compared by examining peaks ofthe pseudo velocity curves. The reader is re-ferred to the first report, Number 124+ for theextensive discussion of problems inherent inexamining cross-sectional data taken during thegrowth spurt. Of course, the same inferentiallimitations pertain to this report.
Parallel to the pattern of the series of re-ports on body measurements on children, thesubsequent reports on youths 12-17 years of agewill become. increasingly analytic. Analysis bysocioeconomic level of family, by geographicdifferences in the United States, by “biologicage,’” by other body dimensions, and by phys-
bIn Cycle II two separate caravans were used simul-taneously for the first 25 locations: the two were thenconsolidated into one caravan for the remaining 15 loca-tions. In Cycle III only one caravan was used for all 40locations, which created a, different itinerary or sequenceof locations around the United States even though theidentical sites and even primary sampling units were usedagain. The average time interval between locations wasabout 3 years.
C“Biologic age” will be estimated primarily by skeletal
agc ad by maturation level of primary and secondary sexcharacteristics as assessed by the examining physician.
iologic and behavioral vaiables will be subjectsof subsequent reports. In this report the data arepresented by percentile distributions and bymeans and standard errors; the ages are groupedboth by l-year and by 6-month age intervals inan attempt to balance increasing “statisticalnoise” resulting from smaller samples on the onehand with the finer precision in pinpointing, intime, deflections of curves on the other hand.
METHOD
At each of 40 preselected locations (see ap-p endix for sample design) throughout theUnited States, the youths were brought to thecentrally located mobile examination center foran examination which lasted about 31\zhours.Six youths were examined in the morning andsix in the afternoon. Except during vacations,they were transported to and from schooland/or home.
When they entered the examination center,each youth’s oral temperature was taken and acursory screening for acute illness was made; ifillness was detected, the youth was sent homeand reexamined later. The examinees changedinto gymnasium-t ype shorts; cotton sweat socks;a terry cloth robe; and, for the girls, a lightsleeveless topper. All six then proceeded to dif-ferent stages of the examination, each one fol-lowing a different route. The 3%-hour examina-tion was divided into six 35-minute time pe-riods, each consisting of one or more detailedexaminations at a designated station. At the endof each period the youths rotated to another sta-
tion so that at the end of 3% hours each youthhad had essentially the same examinations bythe same examiners but in a different sequence.Four of these examination time periods were al-located to examinations by a pediatrician, a den-tist, and a psychologist,’ and the other two were
‘In the first report, Series 11, Number 124, when sexwas the only additional classification, the ages weredivided into 3-month age intervals, but the small size ofthe Negro sample precludes this when race is the princi-pal classification.
‘The entire examination by the psychologists con-sisted of two consecutive time periods (70 minutes).Two psychologists performed identical examinationssimultaneously at separate stations.
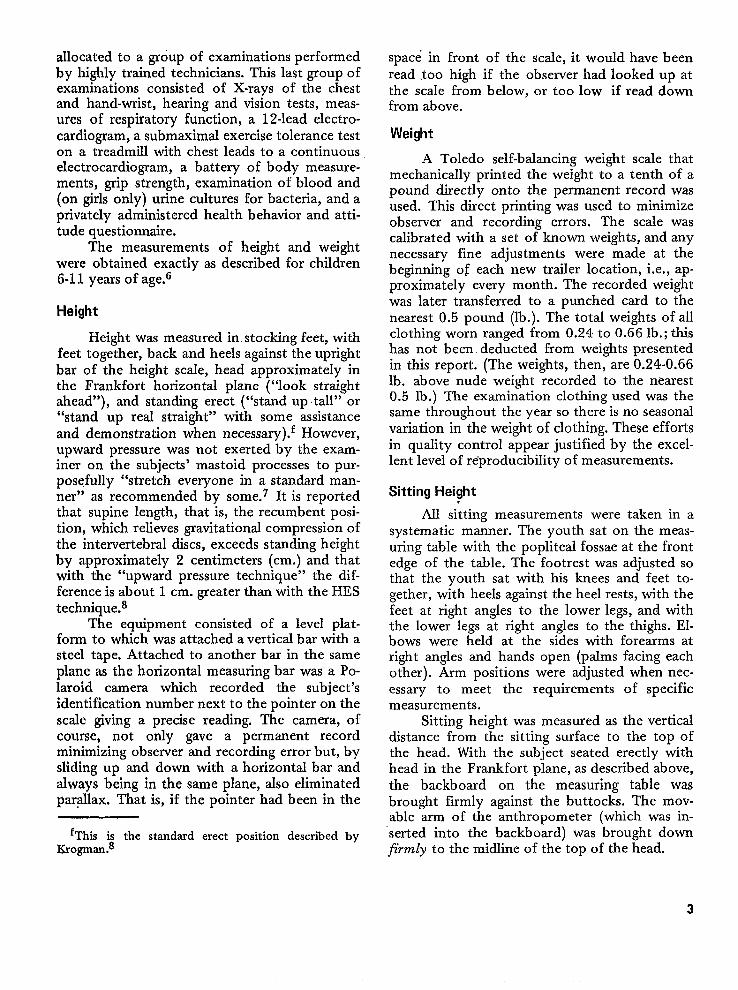
allocated to a group of examinations performedby highly trained technicians. This last group ofexaminations consisted of X-rays of the chestand hand-wrist, hearing and vision tests, meas-ures of respiratory function, a 12-lead electro-cardiogram, a submaximal exercise tolerance teston a treadmill with chest leads to a continuouselectrocardiogram, a battery of body measure-ments, grip strength, examination of blood and(on girls only) urine cultures for bacteria, and aprivately administered health behavior and atti-tude questionnaire.
The measurements of height and weightwere obtained exactly as described for children6-11 years of age.6
Height
Height was measured in stocking feet, withfeet together, back and heels against the uprightbar of the height scale, head approximately inthe Frankfort horizontal plane (“look straightahead”), and standing erect (“stand up tall” or“stand up real straight” with some assistanceand demonstration when necessary).f However,upward pressure was not exerted by the exam-iner on the subjects’ mastoid processes to pur-posefully “stretch everyone in a standard man-ner” as recommended by some.’ It is reportedthat supine length, that is, the recumbent posi-tion, which relieves gravitational compression ofthe intervertebral discs, exceeds standing heightby approximately 2 centimeters (cm.) and thatwith the “upward pressure technique” the dif-ference is about 1 cm. greater than with the HEStechniques
The equipment consisted of a level plat-form to which was attached a vertical bar with asteel tape. Attached to another bar in the sameplane as the horizontal measuring bar was a Po-laroid camera which recorded the subject’sidentification number next to the pointer on thescale giving a precise reading. The camera, ofcourse, not only gave a permanent recordminimizing observer and recording error but, bysliding up and down with a horizontal bar andalways being in the same plane, also eliminatedpar.dlax. That is, if the pointer had been in the
‘This is the standard erect position described byKrogman.8
space in front of the scale, it would have beenread too high if the observer had looked up atthe scale from below, or too low if read downfrom above.
Weight
A Toledo self-balancing weight scale thatmechanically printed the weight to a tenth of apound directly onto the permanent record wasused. This direct printing was used to minimizeobserver and recording errors. The scale wascalibrated with a set of known weights, and anynecessary fine adjustments were made at thebeginning of each new trailer location, i.e., ap-proximately every month. The recorded weightwas later transferred to a punched card to thenearest 0.5 pound (lb.). The total weights of allclothing worn ranged from 0.24 to 0.66 lb.; thishas not been deducted from weights presentedin this report. (The weights, then, are 0.24-0.66lb. above nude weight recorded to the nearest0.5 lb.) The examination clothing used was thesame throughout the year so there is no seasonalvariation in the weight of clothing. These effortsin quality control appear justified by the excel-lent level of reproducibility of measurements.
Sitting Height.
All sitting measurements were taken in asystematic manner. The youth sat on the meas-uring table with the popliteal fossae at the frontedge of the table. The footrest was adjusted sothat the youth sat with his knees and feet to-gether, with heels against the heel rests, with thefeet at right angles to the lower legs, and withthe lower legs at right angles to the thighs. El-bows were held at the sides with forearms atright angles and. hands open (palms facing eachother). Arm positions were adjusted when nec-essary to meet the requirements of specificmeasurements.
Sitting height was measured as the verticaldistance from the sitting surface to the top ofthe head. With the subject seated erectly withhead in the Frankfort plane, as described above,the backboard on the measuring tabIe wasbrought firmly against the buttocks. The mov-able arm of the anthropometer (which was in-“serted into the backboard) was brought downj%mly to the midline of the top of the head.

Age
As in all the HES reports, age is basicallydefined as age a$tained at last birthday (obtainedfrom a copy of the birth certificate in 92 per-cent of the Cycle III examiners). In all tablesutilizing 1-year age groupings, the designated agerepresents the beginning of the interval and notthe mean age of the group (i.e., “15 years”means 15.0 to 15.99 years). However, when thepopulation is divided into half-year age group-ings, the designated age is the approximate meanof the age group (e.g., the group designated 15%years in table 2 includes all those youths 15%?years *3 months or 15.25-15.74 years with ex-act means of 15.49 years for boys and 15.51years for girls).
Race
Race was recorded as “white,” “Negro,”and “other races.”g In Cycle III, the whiteyouths constituted 84.74 percent of the total,the Negro youths 14.76 percent, and youths ofother races only 0.50 percent. In Cycle H whiteyouths constituted 85.69 percent of the exam-ined subjects and Negro youths 13.86 percent.(The differential_ response rate by age, sex, andrace is analyzed and discussed on page 28 of theappendix, The increased proportion of Negro sub-
je’cts in Cycle- III was due to their bitter re-sponse rate—the overall Negro response rate was96.6 percent and the overall white response ratewas 89.1 percent.) Aq in Cycle II, because so few
gThe ~ame cla55ification scheme as used in the 1960census was employed here. As described in the pre-viously mentioned report on the operation of HES Cycle111,5 this information was obtained at the initial house-hold interview by the Bureau of the Census field worker.Its accuracy was checked at the subsequent home visitby the highly experienced representative from HES andagain at the examination in the trailer. A final recordcheck by birth certificate turned up only seven inconsist-encies, and these were mostly pertaining to the category,“other races.” Hence, the possible extent of misclassifi-cation of the variable, race, as described, is so minimalthat it could have no effect on the data analyzed in thisreport. However, when comparing the present HES find-ings to those of other variously defined racial groupingsin the world, the degrees of genetic admixture, as firstdiscussed by Herskowitzg in 1928 and later by Glass andLi,l 0 by Roberts, 11~12 and by Reed,l 3 should be takeninto consideration.
“youths of “other races” were part of the sample,data from them have not been analyzed as a sep-arate category. Their data, of course, are in-cluded whenever data are analyzed independ-ently of a classification by race (as in theprevious report, Series 11, Number 1241 –inwhich the data were classified by age and sexonly).
Report Number 124 initiated the inclusionof data from a previous HES cycle. In all the re-ports of HES data to that time, the data fromeach cycle had been handled as a discrete agegroup. However, the overlapping sampling designand similar methodology of Cycles II and IIIpermit the height and weight data of children6-11 years of age to be incorporated in many ofthe figures and some of the tables in this presentseries of reports to give a much better perspec-tive of the adolescent growth spurt by describingthe 12-year span, 6-17 years, rather than restrict-ing to ages 12-17.
RESULTS
Table 1 presents mean height in centi-meters, standard deviation, standard error of themean, and seven selected percentiles, separately,for whites and Negroes, by age at last birthday(whole-year age groups), in the United States,1966-70. Table 2 presents the same informationgrouped by half-year age intervals for white boysand girls, while table 3 uses the identical formatfor Negro boys and girls.
When the data from these tables are pre-sented in graphs, the correlative data from CycleII, on children 6-11 years of age, have beenadded to give a better perspective.
Figure 1, comparing the boys’ relativemean heights from the data in tables 2! and 3, israther difficult to interpret. The curve of thewhite boys’ mean heights is quite smooth; butthe curve of the Negro boys, whose sample sizeis only about 15 percent as large, fluctuatesaround the more stable curve so erratically thatan inference comparing the heights is impossible.Figure 2, however, is clearer. It graphs data fromtables 4 and 5 and compares the mean heights ofthe half-year age groups of Negro and whiteboys which have been sm”oothed by a 3+eriodmoving average, the same technique dkcussedand employed extensively in Series 11, Number

180
170
[
.....
f
.White . . . . .
.. . .. Negro
.... .
/
...
/
/“
. .
...”.
. . .
. . . . .
,...
/
Ho~6.0 7.0 8.0 9.0 10.0 11.0 12.0 13.0 14,0 15.0 16.0 17.018.0
AGE IN YEARS
Figure 1. Distance curve of mean height attained by males 6-18
years of age, by half-year age group and race.
—
llo~6,0 7.0 8.0 9.0 10.0 11.0 12.0 13.0 14.0 15.0 16.0 17.0 18.0
AGE IN YEARS
180 r170
1
llo~l6.0 7.0 8.0 9.0 10.0 11.0 12.0 13.0 14.0 15.0 16.0 17.0 18.0
AGE IN YEARS
Figure 3. Distance curve of mean height attained by females 6-18
years of age, by helf-year age group and race.
1s0
170[
120
t
110 I I I I I I I I I I I I t6.0 7.0 8.0 9.0 10.0 11.012.0 13.0 14.0 15.0 16.0 17.0 18.0
AGE IN YEARS
Figure 2, Distance curve of mean height attained by males 6-18
years of age, by half-year age group (smoothed by a 3-period
moving averaga) end race,
Figure.4. Distance curve of mean height attained by females 6-18
years of age, by half-year age group (smoothed by a 3-period
moving average) and race.
5

6-
5
4
g
;
z!=3$u~
g
s 2
br0E8z$1
z
0
-1
-.2.
6.0 7.0 8.0 9.0 10.0 11,0 12.0 13.0 14.0 15.0 16.0 17.0 18.0
AGE IN YEARS
Fiaure 5. Pseudo velocity curve of differences in mean heights between wccessive grouPs of males 6-18 years of age, by half-year agegroup and race.
124. A comparison of figures 1 and 2 illustratesthe advantage of smoothing the means whenusing small samples (i.e., the sample sizes of thehalf-year age groupings of Negro boys rangedfrom 19 to 53). The graphs in figure 2 indicatethat the Negro boys were taller at ages 7-9 years,the white boys were slightly taller from 9 toapproximately 12 years. These two groups ofboys had virtually, identical mean heights from12-14 years, and from 14-17 years the meanheights of the white boys were slightly–butconsistently—greater than those of their Negrocounterparts.
Figure 3, which graphs the girls’ data fromtables 2 and 3, is as difficult to interpret as thecorresponding graphs for the boys (figure 1).Figure 4, which graphs the smoothed means ofthe half-year age groupings of girls (tables 4 and5), shows rather clearly that the mean heights ofNegro girls are consistently greater than those of
white girls from 7 years until 14 years of age.From ages 14 until 17 the mean heights of thewhite girk become slightly, but consistently,greater.
‘rhe differences in boys’ mean heightsbetween the successive haIf-year age groups aregraphed to create pseudo velocity curves (as de-scribed in the first report, Number 1241 ).lt canbe seen that figure 5 has so much noise (sucherratic swings from point to point in the muchsmaller sample size of Negroes) that it is utterIyunreadable. Therefore, the means weresmoothed by the moving average technique, andthe differences between successive age means ob-tained in this way are plotted in figure 6. Of thefour parameters of the adolescent growth spurtdiscussed in report Number 124, the only onewhich has enough stability to be useful in thisreport is the age at peak velocity. It is apparentthat the peaks of both the white and the Negro
—
6

4
3
2
1
0 J I I I I I I I I I I I6.0 7,0 8.0 9.0 10.0 11,0 12.0 13.0 14.0 15.0 16.0 17.0 18.0
AGE IN YEARS
Figure 6. Pseudo velocity curve of differences in mean heights between successivegroups of males 6-18 years of age, by half-yeai age
group (smoothed by a 3-period moving averege) and race.
boys’ pseudo velocity curves are identical, bothby chronological placement and in magnitude.And, of course, the two peaks in figure 6 arelocated at the same age, 13% years, as it was forall boys–regardless of race–in report Number124.
When the Negro girls and white girls arecompared similarly (figures 7 and 8), it is readilyseen that the peak height velocity for Negro girlsis of greater relative magnitude and occurs one-half year earlier (i.e., at 11?4 years of age forNegro girls and at 11% yearsh for white girls).
Weight
The weights of white and Negro youths arecompared in the same way that heights are.There are two inherent differences between theheight data and the weight data, however. Thedistribution of height data is essentially gaussian
‘In report Number 124, the peak height velocity forall races of U.S. girle combined was 11% yearn.
(i.e., a normal distribution), while weight dataare skewed to the right (i.e., high weight valuesstray further from the median than do lowvalues), and both individuals and populationsvary more in weight than in height. Tables 6-10present the weight data in a manner similar tothat in which heights are presented (i.e., table 6arranges weight data in kilograms by l-year ageintervals, while tables 7 and 8 subdivide the agegroupings by half-year interwds). Only meanweights smoothed by a 3-period moving averageare presented in graphs (data from tabIes 9 andlo).
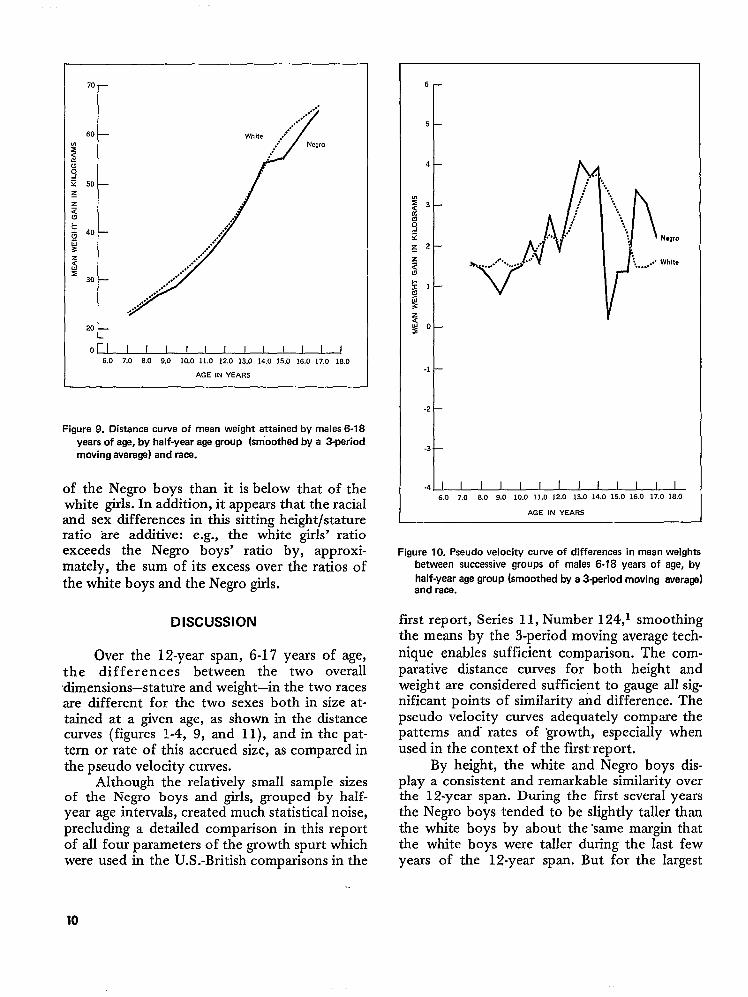
Figure 9, comparing white and Negro boysby weight, shows that the mean weights ofNegro boys are less than those of white boys atall ages except at 13, 13%, and 14 years and thedifferences are much greater from 14-17 yearsthan at any earlier ages; however, it is greatest atage 15 and apparently is not so great at 16 and17 years.
The comparative peak weight velocities forboys from the pseudo weight velocity curves in
7

7-
6 -
5 -
4 —
3 —
2 —
1 —
0 —
-1 —
-2 I I I I I I I I I I I I I6.0 7.0 8.0 9.0 10.0 11.0 12.0 13.0 14.0 15.0 16.0 17.0 lB,O
AGE IN YEARS
Figure 7. Pseudo velocity curve of differences in mean heights betwean successive groups of females 6-18 years of age, by half-yearage group and rata.
figure 10 do not peak as sharply or as clearly asdid those for height. However, despite erraticmovement at the peaks of the curves, a commonpeak is barely discernible at 13% years. (This isthe same age at which boys of all races com-bined had the peak weight velocity for thesmoothed half-year age group in report Number124.)
As seen in figure 11, the mean weights ofNegro girls are greater than those of white girlsfrom ages 11-15 years. After age 15, however,there are no consistent differences between themean weights of the two groups of girls. Incomparing the mean ages at peak weight velocityin figure 12, the Negro girls hit a peak at 11?4years, fuIly 1 year ahead of the white girls’ peak
at 12M years. The relative magnitude of the peakweight velocity is also greater for Negro girls (asit is for heights).
Sitting Height/Stature Ratio
Stature (total standing height) ,is composedof two major segments: sitting height and leglength. Table 11 presents sitting height whiletable 12 presents the percentage of stature ac-counted for by the sitting height segment ar-ranged by the mean percentages of each 1-yearage grouping separately for males (white vs.Negro) and females (white vs. Negro) togetherwith the standard deviations, the standard errorsof the means, and seven percentile distributions.
8

I I I I I I I I6.0 7.0 8.0 9.0 10.0 11.0 12.0 13.0 14.0 15.0 16.0 17.0 18.0
AGE IN YEARS
Figure 8. Pseudo velocity curve of differences in mean haights betwaan successivegroups of females 6-18 years of age, by half-yearage group (smoothad by a 3-period moving average) and race.
Figure 13 graphs these mean sitting height/stature percentages, by each year of age 12?-17
years, for all four sex-race groups of youths.All four lines slope upward with age which
indicates that sitting height constitutes an in-creasingly large proportion of stature with eachyear of adolescence. Also, the four lines are al-most parallel indicating that the differencesbetween the four groups remain approximatelycmsistent, or, in other words, the proportionateincrease of sitting height is similar for all fourgroups.
In addition to the age gradient there is astrikingly consistent sex difference. The girls ofeach race have a greater proportionate sittingheight than do the respective boys–and byabout the same magnitude.
However, the racial differences are evenmore striking than the sex differences: i.e., thesitting height/stature ratio of the white girls hasa greater margin of difference over that of theNegro girls than it “has over that of the white
boys; and, as a corollzuy, the white boys’ sittingheight ratio has a much greater margin over that
9
70r
I
I
‘“t
o~6.o 7.0 8.0 9.0 10,0 11.0 12.0 13.0 14.0 15.0 16,0 17.0 18.0
AGE IN YEARS
Fiqure 9. Distance cuwe of mean weight attained by malas 6-18
‘years of age, by half-year aga group- (sm”oothed by a 3+eriod
moving average) and race.
of the Negro boys than it is below that of thewhite girls. In addition, it appears that the racialand sex differences in this sitting height/statureratio are additive: e.g., the white girls’ ratioexceeds the Negro boys’ ratio by, approxi-mately, the sum of its excess overthe white boys and the Negro girls.
DISCUSSION
the ratios of
Over the 12-year span, 6-17 years of age,the differences between the two overalldimensions-statu~e and weight–in the two racesare different for the two sexes both in size at-tained at a given age, as shown in the distancecurves (figures 1-4, 9, and 11), and in the pat-tern or rate of this accrued size, as compared inthe pseudo velocity curves.
Although the relatively small sample sizesof the Negro boys and girls, grouped by half-year age intervals, created much statistical noise,precluding a detailed comparison in this reportof all four parameters of the growth spurt whichwere used in the U.S.-British comparisons in the
J I I I I I I I
Nagro
While
J I I I I6.0 7.0 8.0 9.0 10.0 11.0 12.0 13.0 14.0 15.0 16.0 17.0 lfJ.O
AGE IN YEARS
Figure 10, Pseudo velocity curve of differences in mean weights
between successive groups of males 6-18 years of a~e. by-..half-year aga group (smoothed by a 3-period moving average)and race.
first report, Series 11, Number 124,1 smoothingthe means by the 3-period moving average tech-nique enables sufficient comparison. The com-parative distance curves for both height andweight are considered sufficient to gauge all sig-nificant points of similarity tid difference. Thepseudo velocity curves adequately compare thepatterns and rates of growth, especially whenused in the context of the first report.
By height, the white and Negro boys dis-play a consistent and remarkable similarity overthe 12-year span. During the first several yearsthe Negro boys tended to be slightly taller thanthe white boys by about the “same margin thatthe white boys were taller during the last fewyears of the 12-year span. But for the largest
10

20to~
6.0 7.0 8.0 9.0 10.0 11.0 12.0 13.0 14.0 15,0 16.0 17.0 18.0
AGE IN YEARS
Figure 11. Distance curve of mean weight attained by females
6.18 yearsof aga, by halfwar age grow (Smoothed by a3-period moving average) and race.
part of the age span, there were no consistentdifferences in attained mean heights between thetwo groups. Furthermore, the height spurts wereidentical when comparing timing and relativemagnitude of the two peak velocities.
In contrast to the marked similarity in theheight curves, the difference in weight was quitestriking—in consistency and in magnitude. At notime during the 12-year span were the meanweights of Negro boys greater than the meanweights of their white peers (except erratically,by ,the noise of small samples). At 13 and 14years of age they were essentially the same, butduring the rest of the age span the mean weightsof the white boys were from 1 to 6 kilogramsgreater than the corresponding means for theNegro boys.
This discrepancy between the height andthe weight growth patterns of white and N“egroboys is more understandable when the markeddisparity between the mean sitting height/stature ratios of the two groups is taken intoaccount. This finding means that, in general,white boys have longer trunks while Negro boystend to have longer legs. And of course, the
6
5
[
.4~6.0 7.0 a.o 9.0 10,0 11.0 12.0 13.0 14.0 15.0 16.0 17.0 la.o
AGE IN YEARS
Fiaure 12. Pseudo velocity curve of differences in mean weightsbetween successive groups of females 6-18 years of age, by
half-year age group (smoothed by a 3-pariod moving averaga)and race.
trunk, being thicker, weighs more per unitlength than do the legs. In other words althoughwhite boys and N“egro boys have one similaroverall dimension, stature, they are assembledsomewhat differently. They have arrived at simi-lar statures by reciprocally balancing the dis-parate lengths of the two major componentparts; and this difference in the proportion ofparts gives rise to some of the difference in theother overall dimension, weight:
This finding is entirely con&tent with themajor conclusion of the more detailed exami-nation of many additional body segments,widths, and girths of children 6-11 years. inCycle II, which will be reported in a forth-coming NCHS publication.1 4 In these younger
11

53rWh)te
. . . . . . . . . . . . . . . . . . . f,m~,~#
. . .. . . . . . . . . ..-. . . . . . . .
. . . . . .. . . . . .
. . . . ---- White
e:
,fi., /“
,./ ‘\._ /.--”
49L
o~
12,0 13.0 14.0 15.0 16,0 17.0 18.0
AGE IN YEARS
Figure 13. Mean sitting heightktanding height ratio for youths12-17 years of age by sex and race.
children there was a marked and consistent ra-cial difference: white children of both sexes con-sistently had larger mean lengths and girths ofthe trunk while Negro children consistently hadgreater mean lengths of the limbs. (Furthermore,there was an apparent proximal-distal gradientto these limb differences).
In addition, the detailed racial comparisonsof subcutaneous fat distributions, as estimatedby skinfold measurements, which have alreadybeen reported on children aged 6-11 years in
Vital and Health Statistics Series 11, Number1201s –and which will be in another Series 11reportl G on youths 12-17 years, demonstrate agreater subcutaneous fat thickness in white chil-dren over the trunk and the limbs than in theirNegro counterparts-the difference being some-what greater over the limbs.
That most of these differences are pri-marily of genetic rather than environmental ori-gin would seem incontestable at this time. Theforthcoming report analyzing the more detailedmeasurements of segmental lengths, girths, andwidths on youths 12-17 years of age which par-allels the report previously citedl q on children6-11 years of age will help clarify these findings.
The girls’ pattern of differences is quiteunlike that of the boys. Whereas the white andNegro boys differed by the relatively more ad-
vent i t i ous dimension of weight, the mostmarked difference between N-egro and whitegirls was in the more fundamental growthcharacteristic, stature. Moreover, the girls’ dif-ference was much more consistent and seems todescribe a definite pattern.
In the younger part of the tot~ age span 6to 18 years the HES data demonstrate that themean height of N-egro girls is greater%han that ofwhite girIs. This difference is consistently main-tained until after age 13% years when thepseudo growth spurts for- both groups of girlshave been completed and th? velocity of ap-parent height increment has slowed far belowthe preadolescent velocity (figures 4 and 8). TheNegro girls’ height velocity, which peaked bothhigher and a half year earlier than the whitegirls’, starting at about 12?4 years diminishes cor-resp ondingly earlier. The white girls, on the aver-age, continue to grow in stature for a half yearlonger than the Negro girls, which not only erad-icates the deficit of the earlier years but alsoenables the white girls to end up with approxi-mately 0.5 cm. larger smoothed mean heights(table 4).
The pattern of differences in weight seemsto more or less mirror this, but the relative mag-nitude of the difference in weight is less. Thebiggest difference between the two pseudogrowth curves is from 11?4 to 13?4 years which,probably, only reflects the earlier growth spurtin the IYegro girls.
The girls’ pattern of racial difference bystature/sitting height ratios was almost identicalto that of the boys’.
An additional dimension, important to anunderstanding of these differences in bodygrowth patterns which have just been discussed,is comparative biological timing. The first stageof adding this dimension to this series of reportswill be accomplished by the forthcoming reportson “skeletal age” assessment by age, sex, race,and sociodemographic variables covering theages 6-11 and 12-17 years. Additionally for theadolescent years, 12-17, there will be furtheranalyses by other “biological timers, ” such asage at menarche and youth’s stage of pubertaldevelopment which was assessed by the ex-amining physician using Tanner’sl T–classification of primary and secondary sexcharacteristics.
12
After weighing and considering all the dif-ferences in growth patterns by race and sexwhich have been discussed here, it is expectedthat almost no difference will be found, either inskeletal age or by other maturational indices, be-tween white and Negro boys from 6 years of ageto 18 (including the timing of the adolescentgrowth spurt which has already been seen inSeries 11, Number 124).
Between white and Negro girls, on theother hand, definite differences in biologic tim-ing are expected, solely on the basis of thesedata find their interrelationships. It is expectedthat from age 6 to about 13 years, mean skeletalage of Negro girls will be consistently earlier, or
more mature, by approximately 3 to 6 monthsthan that of white girls of comparable chrono-Iogic age.
These expected differences in biologicalmaturity would adequately explain the greaterdifferences in height and weight between whiteand Negro girls than between white and Negroboys which have been discussed. At that timewhen predictions are no longer necessary (i.e.,there will be not only certainty of the dif-ferences in timing, but also quantification ofthese differences for use in further analyses), amo>e complex analysis of differences in bodycomposition will extend these presentdescriptive findings.
000
13

References
1National Center for Health Statistics: Height andweight of youths, 12-17 years of age, United States. Vitaland Health Statistics. Series 1l-No. 124. DHEW Pub, No.(HSM) 73-1606. Health Services and Mental Health Ad-ministration. Washington. U.S. Government Printing Of-fice, Jan. 1973.
2National Center for Health Statistics”: Plan andinitial program of the Health Examination Survey. t%aland Health Statistics. PHS Pub. No. 1000-Series l-No. 4.Public Health Service. Washington. US. GovernmentPrinting Office, July 1965.
3National Center for Health Statistics: Cycle I ofthe Health Examination Survey, sample and response,United States, 1960-1962. Vital and Health Statistics.PHS Pub. No. 1000-Series 1l-No. 1, Public Health Serv-ice. Washington. U.S. Government Printing Office, Apr.1964.
4National Center for Health Statistics: Plan, opera-tion, and response results of a program of children’sexaminations. Vital and Health Statistics. PHS Pub. No.1000-Series l-No. 5. Public Health Service. Washington.U.S. Government Printing Office, Oct. 1967.
5National Center for Health Statistics: Plan andoperation of a health examination survey of U.S. youths12-17 years of age. Vital and Health Statistics. PHS Pub.No. 1000-Series l-No. 8. Public Health Service. Washing-ton. U.S. Government Printing Office, Sept. 1969.
6National Center for Health Statistics: Height andweight of children, United States. Vital and HealthStatistics. PHS Pub. No. 1000-Series 1l-No. 104. PublicHealth Service. Washington. U.S. Government PrintingOffice, Sept. 1970.
7Tanner, J. M.: Personal communication.
8fiogrnan, W. M.: A handbook of the measure-ment and interpretation of height and weight in thegrowing child. Monogr. Sot. Res. Child Dev. 13(3),1950.
‘Herskowitz, M. J.: The American Negro, a Studyin Racial Crossing. New York. Alfred A. Knopf, 1928.
10Glass, B., and Li, C. C:: The dynamics of racialintermixture-an analysis based on the American Negro.Am. J. Huzn. Genet. 5:1-20, 1953.
11 Roberts, D. F.: The dynamics of racial inter-mixture in the American Negro-some anthropologicalconsiderations. Am. J. Hum. Genet. 7:361-367, 1955.
12 Roberts, D. F., and Hioms, R. W.: The dynamicsof racial intermixture. Am. ]. Hum. Genet. 14:261-277,1962.
13 Reed, T. E.: Caucasian genes in AmericanNegroes. Science 165:762-768, 1969.
14National Center for Health Statistics: Comparisonof body dimensions by race; children 6-11 years, UnitedStates. Vital and Health Statistics. Series 11. HealthResources Administration, DHEW, Rockville, Md. To bepublished.
15Nation~ Center for Heath Statistics: Skinfold
thickness of children 6-11 years, United States. Vital andHealth Statistics. Series 1 l-No. 120, DHEW Pub. No.(HSM) 73-1602. Health Services and Mental HealthAdministration. Washington. US. Government PrintingOffice, Oct. 1972.
1~Nationfl Center for Health Statistics: Skinfoldthickness of youths 12-17 years, United States. Vital and ,Health Statistics. Series 11. Health Resources Adminis-tration, DHEW, Rockville, Md. To be published.
17Tanner, J. M.: Growth at Adolescence. 2d ed.Oxford. Blackwell Scientific Publications, 1962.
18Nation~ center for Health Statistics: Replication,
an approach to the analysis of data from complexsurveys. Vital and Health Statistics. PHS Pub. No.1000-Series 2-No. 14. Public Health Service. Washington.U.S. Government Printing Office, Apr. 1966.
19National Center for Health Statistics: A Regres-sion Scheme as a Solution to the Problem of Imputation,by S. Lemeshow and T. Drizd, Technical InformationNotes, No. 49. Division of Health Examination Statis-tics, Rockville, Md. Jan. 31, 1973. Mimeographed.
14

LIST OF DETAILED TABLES
Table 1.
2.
3.
4.
5.
6.
7.
8.
9.
10.
11.
12.
;l;gh;e~ centimeters for youths aged 12-17 years by single year of age by racesample size, estimated population size, mean, standard deviation,
standard:error of the mean, and selected percentiles, United States, 1966-70----
Height in centimeters for whites aged 12-18 yeara by half-year age group and sex:sample size, estimated population size, mean, standard deviation, standard errorof the mean, and selected percentiles, United States, 1966-70-------------------
Height in centimeters for Negroes aged 12-18 years by half-year age group atidsex: sample size, estimated population size, mean, standard deviation, standarderror of the mean, and selected percentiles, United States, 1966-70-------------
Height in centimeters for whites aged 6-18 years by half-year age group and sex:differences between successive groups, 3-period moving averages of mean heights,and differences between successive moving averages, United States, 1966-70------
Height in centimeters for Negroes aged 6-18 years by half-year age group and sex:differences between successive groups, 3-period moving averages of mean heights,and differences between successive moving averages, United States, 1966-70------
we~gh;e~ kilograms for youths aged 12-17 years by single year of age byrace: sample size, estimated population size, mean, standard deviation,
standard error of the mean, and selected percentiles, United States, 1966-70----
Weight in kilograms for whites aged 12-18 years by half-year age group and sex:sample size, estimated population size, mean, standard-deviation, standard errorof the mean, and selected percentiles, United States, 1966-70-------------------
Weight in kilograms for Negroes aged .12-18 years by half-year age group and sex:sample size, estimated population size, mean, standard deviation, standard errorof the mean, and selected percentiles, United States, 1966-70-------------------
Weight in kilograms for whites aged 6-18 years by half-year age group and sex:differences between successive groups, 3-period moving averages of mean weights,and differences between successive moving averages, United States, 1966-70------
Weight in kilograms for Negroes aged 6-18 years by half-year age group and sex:differences between successive groups, 3-period moving averages of mean weighta,and differences between successive moving averages, United States, 1966-70------
Sitting heightof youths aged 12-17 years by sex, race, and age at last birthday:sample size, estimated population size, mean, standard deviation, standard errorof the mean, and selected percentiles, United States, 1966-70-------------------
Sitting heightlstanding height ratio of youths aged 12-17 years by sex, race, andage at last birthday: sample size, estimated population size, mean, standard de-viation, standard error of the mean, and selected percentiles, United States,1966-70-------------------------------------------------------------------------
Page
i6
17
18
19
20
21
22
23
24
25
26
27
15
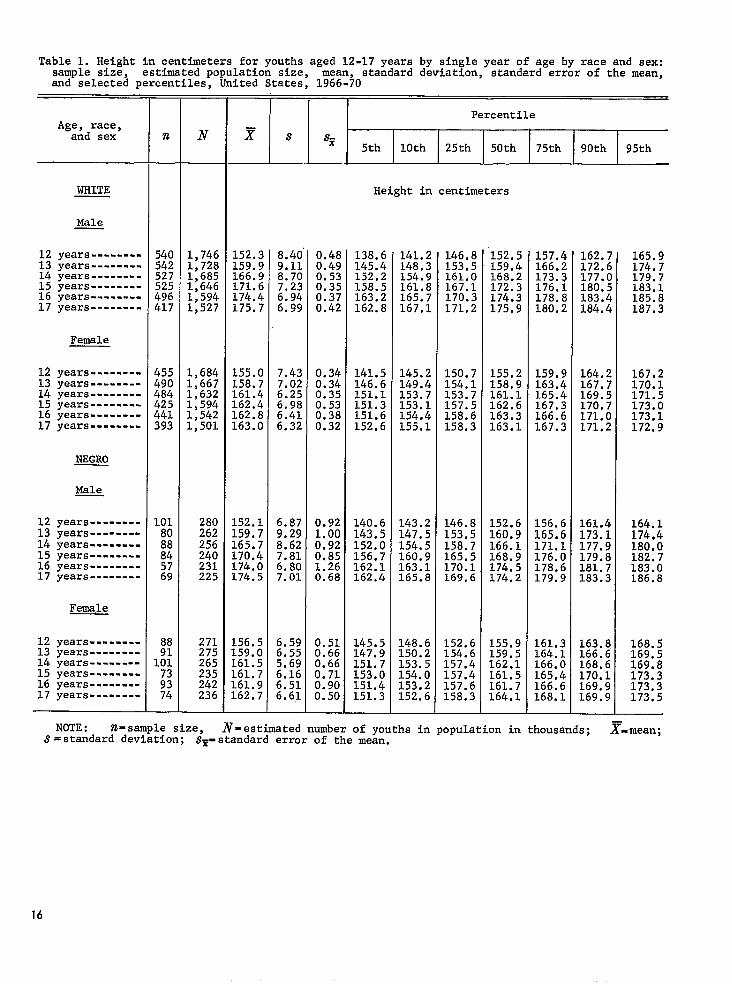
Table 1. Height in centimetersfor youths aged 12-17 years by singleyear of age by race and sex:sample size, estimatedpopulationsize, mean, standarddeviation,standarderror of the mean,and selected percentiles, United States, 1966.70
i;
;21617
121314151617
121314151617
1213
j
17
WHITE
Male
years--------years--------years--------years--------years--------years--------
Female
years--------years--------years--------years--------year5--------years--------
NEGRO
Male
years--------years--------years--------years--------years--------years--------
Female
years--------years--------years--------years--------years-.-.-=.-years--------
—
540542527525496417
455490484425441393
1018088845769
;?101
;:74
N
1,7461,7281,6851,6461,5941,527
1,6841,6671,6321,594L,5421,501
280262256240231225
271275265235242236
--!-L.Percentile
z s Sz5th 10th 25th 50th 75th 90th 95th
Height in centimeters
152.3159.9166.9171.6174.4L75.7
155.0158.7L61.4L62.4L62.8L63.O
L52.1159.7L65.7L70.4L74.OL74.5
L56.5L59.O161.516107161.9L62.7
8.409.118.707.236.946.99
7.437.026.256.986.416.32
6.879.298.627.816.807.01
6.596.555.696.166.516.61
0.480.490.530.350.370.42
0.340.340.350.530.380.32
0.921.000.920.851.260.68
0.510.660.660.710.900.50
138.6145.4152.2158.5163.2162.8
141.5146.6151.1151.3151.6152.6
140.6143.5152.0156.7162.1162.4
145.5147.9151.7153.0151.4151.3
141.2148.3154.9161.8165.7167.1
145.2149.4153.7153.1154.4155.1
143.2147.5154.5160.9163.1165.8
148.6150.2153.5154.0L53.2152.6
146.8153.5161.0167,1170.3171.2
150.7154.1153.7157.5158.6158.3
146.8153.5158.7165.5170.1169.6
152.6154.6157.4157.4157.6158.3
152.5;;:.$
172:3174.3175.9
155.2158.9161.1162.6163.3163.1
152.6160.9166.1168.9174.5174.2
155.9159.5162,1161.5161.7164.1
157.4166.2173.3176.1178.8180.2
159.9163.4165.4167.3166.6167.3
156.6165.6171.1176.0178.6179.9
161.3164.1166.0165.4166.6168.1
162.7172.6177.0180.5183.4184.4
164.2167.7169.5170.7171.0171.2
161.4173.1177.9179.8181.7183.3
163.8166.6168.6170.1169.9169.9
165.9174.7179.7183.1185.8187.3
167.2170.1171.5173.0173.1172.9
164.1174,4180.0182.7183.0186.8
168.5169.5169.8173.3173.3173.5
NOTE: n=sample size, N-estimated number of youths in populationin thousands; z-mean;S=standard deviation; $E=standard error of the mean.
16

Table 2, Height in centimetersfor whites aged 12-18 years by half-year age group and sex: samplesize, estimatedpopulationsize, mean, standarddeviation,lected percentiles,United States, 1966-70
standarderror of the mean, and se-
Age and sex
Male
years--------1/2 years----years--------1./2years----years--------1/2 years----years--------1/2 years----years--------1/2 years----years--------1/2 years----years--------
Female
years--------1/2 years----years--------1/2 years----years--------1/2 years----years--------1/2 years----years--------1/2 yeart3----years--------1/2 years----years--------
—
101291279288239271276275255226232209105
2;:265;;;
234221215238188235183100
N
331923912903792846872851841720792754387
272947935793;;$
778834854649878675389
Percentile
z s +
5th 10th 25th 50th 75th 90th 95th
150.6151.7155.4160,0163.7166.7169.7171.6173,5174.6175.5175,8175.4
153.0155.2156.8159.0160.2161.4162.0162.9::;.;
163:1162.8162.9
8,877.928.538.998,678.877.807.046.656.597.086.947.21
6.517.737.126.916.406.35;,:;
::;:
6:435.886.90
1,030.720.480.730.740.700.530.400.400.380.550.650.81
0.880.520.410.490.490.430.430.680.530.380.500.470.68
Height in
138.1139.2142.0145,5148.6151.5156,1159.2162,1164.2163.3163.3162.4
140.8141.2144.5;:;.;
150:4152.3151.6150.8151.7151.6152.8152.6
138.7141.5145.5148.6;:;.:
159:3162,8169,8166.4166.4162.4166.1
145.3143.8147.0149.8151.8153.5154.5153.3153.5154.4155.0155.4154.5
entimeters
144.6146.4149.8153.5157.6159.8164.1167,3169.7170.9170.6170.9170.7
149.5150.7152.1154.4156.5157.3157.4157.8157.7158.5158.8158.4157.5
150.2152.3155.5159,4163,5168.3170.3171.9173.8174,7176.1175.9175.4
152.8155.7156.9158.7160.7161.2161.6162.8162.5163.3163.7162.9162.2
156.4156.6160.7165.8170.2173.3175.3175,6177.7178.7180.0179.8180.4
156.2160.5161.5163.6164.5165.3166.8168.2166.8166.6166.8166.8167.7
161.7161.6166.5172.8174.3177.2179.2180.6181.1183.2184.2184.8185.3
159.4164.5166.4168.2167,8170,1169.6171.8170.1170.9171.5170.7171.6
165.5164.1170.1175.4177.4179.4181.8183,5184.2185.2186.6188.0186.6
167.2166.7167.9170.2170.1171.3171.8173.8172.5172.8173.5171.9175.5
NOTE: n=ssmple size; ~=estimated number of youths in populationin thousands; X=mean;S= standarddeviation; Sy=standarderror of the mean.
17

Table 3. Height in centimeters for Negroes aged 12-18 years by half-year age group and sex samplesize, estimated population size, mean, standard deviation,lected percentiles, United States, 1966-70
standard error of the mean, and se-
Age and sex
Male
years----------1/2 years------years----------1/2 years------years----------1/2 years------years----------1/2 years------years----------1/2 years------years----------1/2 years------years----------
Female
years ----------1/2 years------years----------1/2 years------years----------1/2 years------years----------1/2 years------years----------1/2 years------years----------1/2 years------years----------
1;:160129106153111132139
1:;10082
lx13517810113212410513512310812649
Percentile
x s +
5th 10th 25th 50th 75th 90th 95th
,
Height in centimeters
150.7150.4156.2160.5162.5166.3168.0169.6171.8175.6173.8174.5175.9
156.8155.2158.6159.8159.3161.5161.7161.3162.3161.6163.5162.0163.2
6.20 2.376.85 0.829.14 1.268.25 1.408,56 1.978.17 1.388.85 1.396.81 0.987.64 1.774.59 0.696.82 1.238.17 1.675.72 1.21
6.56 1.206.30 1.106.69 0.516.23 0.926.55 1.275.75 0.856.39 0.945.95 0.695.39 0.76:.;$ :.;:
7:42 0:765.31 2.00
141.3138.8138,5150.0150.4154.6155.2159.5;;;.;
163:2161.7168.2
145.6145.4149.2150.2148.1151.8150.6153.3153.4151.4154.1150.4152.7
142.8140.9144.2150.6151.4157.2156.4160.6162.1170.3165.3162.7170.2
149.0147.8150.1151.2148.7154.0153.4154.3155.4152.6155.0151.4153.7
146.2144.8150.5154.3153.7158.9163.0165.8;;;.;
169:2169.1173.0
153.1152.1153.8156.3154.5157.3157.5156.8158.7157.2159.2155.9158.7
150.3151.0156.5158.4163.8167.1168.1168.5174.2175.3173.6173.4175.9
150.0155.1158.8160.5159.6161.5162.3161.1163.1162.0163.1162.6163.8
153.9155.4163.4167.1167.5171.0173.4174.3178.3178.8177.6180.6180.2
159.8159.8163.2164.4165.1165.7165.4166.3166.1166.5168.2168.1167.6
159.8158.7167.4174.1174.8177.2179.4178.7180.2181.4182.6186.2181.4
167.7162.6168.4166.2168.3168.6170.2168.817001169.6174.0172.1169.1
161.8163.1170.6174,6178.4183.1190.0181.8181.6182.8183.6188.8185.6
170.0163.9169.7169.6169.1171.2173.4172.2170.6172.3174.617400169.2
NOTE : n=sample size; IV=estimated number of youths in population in thousands; ~=mean;S= standard deviation; sz=standard error of the mean.
18
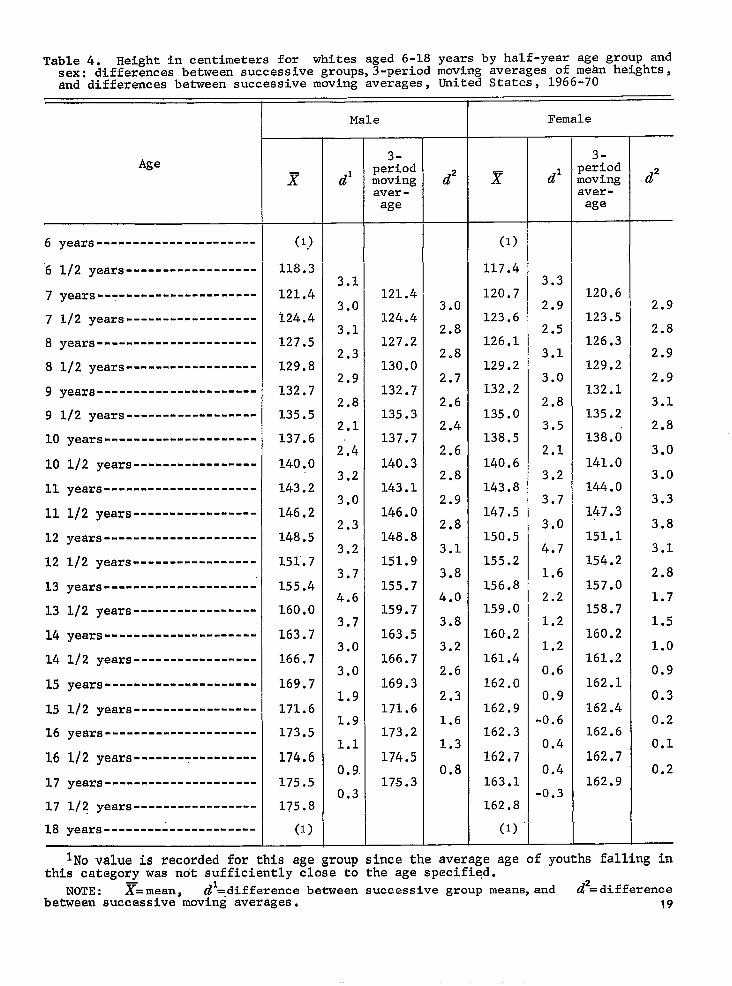
Table 4. Height in centimeters for whites aged 6-18sex: differences between successive groups,3-periodand differencesbetween successive moving averages,
years by half-year age group andmoving averages of mean heights,United States, 1966-70
Age
6 years----------------------
‘6 1/2 years------------------
7 years----------------------
7 1/2 years------------------
8 years----------------------
8 1/2 years------------------
9 years----------------------
9 1/2 years------------------
10
10
11
11
12
12
13
13
14
14
15
15
16
16
17
17
years---------------------
1/2 years-----------------
yea~s..-.--.....---..---..
1/2 yeara-----------------
years---------------------
1/2 years-----------------
years---------------------
1/2 years-----------------
years-.----n --------------
1/2 years-----------------
years .....................
1/2 years-----------------
years---------------------
1/2 years-----------------
years---------------------
1/2 years-----------------
18 years---------------------
Male
x-
(1)
118.3
121.4
124.4
127.5
129.8
132.7
135.5
137.6
140.0
143.2
146.2
148.5
15s.7
155.4
160.0
163.7
166.7
169.7
171.6
173.5
174.6
175.5
175.8
(1)
d’
3.1
3.0
3.1
2.3
2.9
2.8
2.1
2.4
3.2
3.0
2.3
3.2
3.7
4.6
3.7
3.0
3.0
1.9
1.9
1.1
0.9,
0.3
3-periodmovingaver-age
121.4
124.4
127.2
130.0
132.7
135.3
137.7
140.3
143.1
146.0
148.8
151.9
155.7
159.7
163.5
166.7
169.3
171.6
173.2
174.5
175.3
d’
3.0
2.8
2.8
2.7
2.6
2.4
2.6
2.8
2.9
2.8
3.1
3.8
4.0
3.8
3.2
2.6
2.3
1.6
1.3
0.8
(1)
117.4
120.7
123.6
126.1
129.2
132.2
135.0
138.5
140.6
143.8
147.5
150.5
155.2
156.8
159.0
160.2
161.4
162.0
162.9
162.3
162.7
163.1
162.8
(1)“
Female
dl
3.3
2.9
2.5
3.1
3.0
2.8
3.5
2,1
3.2
3.7
3.0
4.7
1.6
2.2
1.2
1.2
0.6
O*9
-0.6
0.4
0.4
-0.3
3-periodnovingaver-age
120.6
123.5
126.3
129.2
132.1
135.2
138.0
141.0
144.0
147.3
151.1
154.2
157.0
158.7
160.2
161.2
162.1
162.4
162.6
162.7
162.9
d2
2.9
2.8
2.9
2.9
3.1
2.8
3.0
3.0
3.3
3.8
3.1
2.8
1.7
1.5
1.0
0.9
0.3
0.2
0.1
0.2
lNo value is recorded for this age group since the average age of youths falling inthis category was not sufficiently close to the age specified.
NOTE: Z= mean, dl=,differencebetween successive group means,and ~2=differencebetween successive moving averages. 19

Table 5. Height .incentimeters for Negroes aged 6-18 years by half-year age group andsex: differences between successive groups,3-periodmoving averages of mean heights,and differences between successivemoving averages, United States, 1966-70
Age
6
6
7
7
8
8
9
9
years.-.--.................
1/2 years-----------------
years----------------------
1/2 years--.-..------.-.=-.
years------.-.----....=----
1/2 years------------------
years----------------------
1/2 years------------------
10 years---------------------
10 1/2 years-----------------
11 years---------------------
11 1/2 years-----------------
12 years---------------------
12 1/2 years-----------------
13 years---------------------
13 1/2 years-----------------
14 years-.-----..-.=-.-.....-
14 1/2 years-----------------
15 years----.-----=----------
15 1/2 years.................
16 years---------------------
16 1/2 years-----------------
17 years---------------------
17 1/2 years-----------------
~8 years---------------------
(1)
118.4
122.9
124.9
130.0
131.0
132.3
134.2
136.5
140.7
141.8
145.5
150.5
150.4
156.2
160.5
162.5
166.3
168.0
169.6
171.8
175.6
173.8
174.5
(1)
Male
4.5
2.0
5.1
1.0
1.3
1.9
2.3
4.2
1.1
3.7
5.0
-0.1
5.8
4.3
2.0
3.8
1.7
1.6
2.2
3.8
-1.8
0.7
3-periodmovingaver-age
122.1
125.9
128.6
131.1
132.5
134.3
137.1
139.7
142.7
145.9
148.8
152.4
155.7
159.7
163.1
165.6
168.0
169.8
172.3
173.7
174.6
d’
3.8
2.7
2.5
1.4
1.8
2.8
2.6
3.0
3.2
2.9
3.6
3.3
4.0
3.4
2.5
2.4
1.8
2.5
1.4
0.9
,(1)
119.1
121.8
124.7
127.4
128.6
135.2
137.6
139.1
140.6
146.1
149.1
154.4
155.2
158.6
159.8
159.3
161.5
161.7
161.3
162.3’
161.6
163.5
162.0
-(1)
Female
dl
2.7
2.9
2.7
1.2
6.6
2.4
1.5
1.5
5.5
3.0
5.3
0.8
3.4
1.2
-0.5
2.2
0.2
-0.4
1.0
-0.7
1.9
-1.5
3-periodmovingaver-age
121.9
124.6
126.9
130.4
133.8
137.3
139.1
141.9
145.3
149.9
152.9
156.1
157.9
152.9
160.2
160.8
161.5
161.8
161.7
162.5
162.4
d’
2.7
2.3
3.5
3.4
3.5
1.8
2.8
3.4
4.6
3.0
3.2
1.8
1.3
1.0
0.6
0.7
0.3
-0.1
0.8
-0.1
lNo value is recorded for this age group since the average age of youths falling inthis category was not sufficiently close to the age specified.
X=mean,--
NOTE: dl=difference between successive group means,and d2=differencebetween successivemoving averages.
20

Table 6. Weight in kilograms for youths aged 12-17 years by single year of age by race and sax:sample size, estimatedpopulationsize, mean, standarddeviation,standard error of the mean,and selectedpercentiles,United States, 1966-70
&ae4 ;:xe,
WHITE
Male
12 years-----13 years-----14 years-----15 years-----16 years-----17 years-----
Female
12 years-----13 years-----14 years-----15 years-----16 years-----17 years-----
NEGRO
Male
12 years-----13 years-----14 years-----15 years-----16 years-----17 years-----
Female
12 years-----13 years-----14 years-----15 years-----16 years-----17 years-----
n
540542527525496417
455490k84425$41393
10180
:;5769
88
1::739374
N
1,7461,7281,6851,6461,5941,527
1,6841,6671,6321,5941,5421,501
280262256240231225
271275265235242236
Percentile
x s ST5th 10th 25th 50th 75th 90th 95th
43.0949.9156.9962.2665.0165.22
46.1850.5054*O556.7358.0157.40
42.0150.5654.7257.0463.7166.65
i9.1650.2555.0255.6058.4658,85
9.27311.60012,37311,32111.48411.524
9.7349.888
10.32211.38711.24810.279
8.89912.85212.20810.30911.43711.352
11.06512,58210.30410.42213.10012,141
0.3850.5490.6350.4440.5720.389
0.4600.5210.4800.5280.6720.622
1.2731.4411.5771,2371.6341.564
1.3253.9473.9431.2992.4762.017
Weight in
30.4635.2939.2746.67;;.;:
.
32.5636.7140.6542.2644.8844.76
31.8032.8438.8642.5748.0552.95
34.0136.4439.6041.9444.0443.51
32,4336.8841.9949.2952.2455.32
34.8238.9943.1844.7446.7747.01
33.3435.6940.7046.1648.7757.03
35.7037.7943.8444.3045.3944.92
cilograms
36.4641.1549.0154.8357.9260.67
39.1743.4747.3649.1351.0050.72
36.8042.4545.6149.8356.6859.98
41.8242.3647.7948.2950.0248.98
41.9848.2755.6361.1963.4066.45
45.1349.0352.3055.0355.7955.64
39.8148.6452.8656.2762.9163.70
46.0047.3453.3653.8455.0758.49
48.1656.3763.5467.6370.4174.12
51.5956.6559.0761.0862.2061.68
45.6359.2761.8862.5768.6071.31
57.2655.4060.8059.5562.2165.47
56.54;5.;:
76:6479.0381.98
58.5562.9066.3271.3570.5769.29
52.4567.4670.0071.2175.8679.81
63.9766.0268.3771.1577.5571.87
60.3670.5778.7984.4484.9391.49
62.83;5.:;
79:6878.9675.93
55.8075.1273.6773.4485.0789.56
68.6281.2072.4375.96w;;
NOTE: n=sample size; N=estimated nmber Of youths in populationin thousands; ~=mean;s = standarddeviation; SY=standard error of the mean.
21
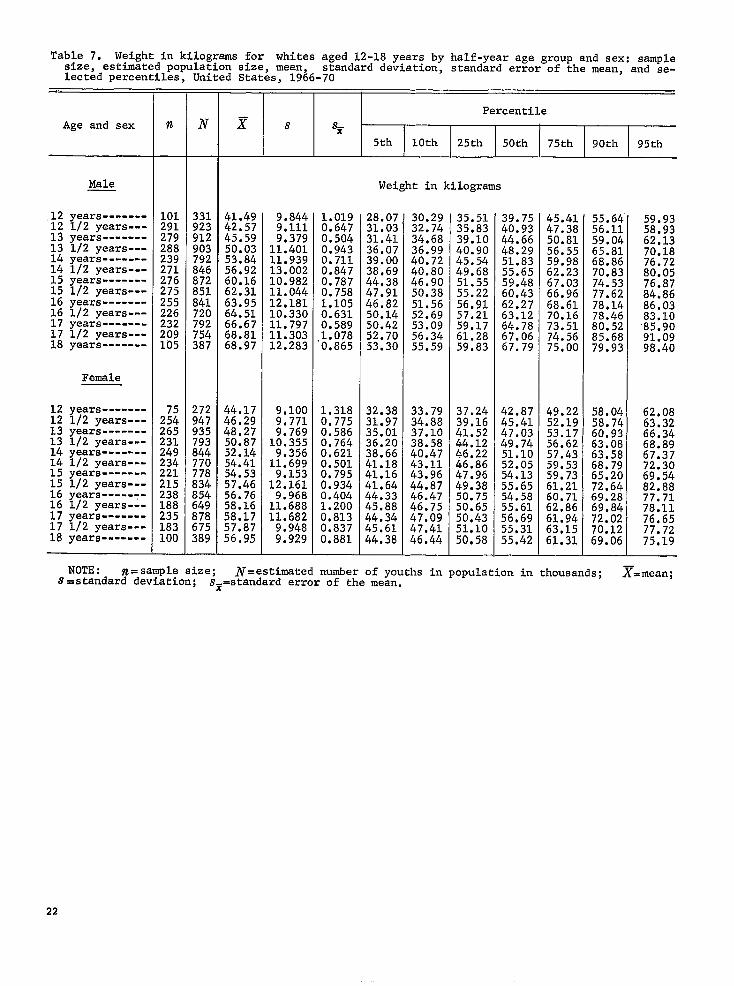
Table 7. Weight in kilograms for whites aged 12-18 years by half-yearage group and sex: samplesize, estimated population size, mean, standard deviation, standard error of the mean, and se-lected percentiles, United States, 1966-70
Age and sex
12121313141415151616
:;18
1212131314141515161617
:;
Male
years-------1/2 years---years-------1/2 years---years-------1/2 years---years-------1/2 years---years-------1/2 years---years-------1/2 years---years-------
Female
years-------1/2 years---years-------1/2 years---years-------1/2 years---years-------1/2 years---years-------1/2 years---years-------1/2 years---years-------
‘n
101291279288239271276275255226232209105
2;:265231249234221215238188235183100
N
331923912903792846872851841720792754387
272947935793844770778834854649878675389
Percentile
x s SE
5th 10th 25th 50th 75th 90th 95th
Weight in kilograms
41.4942.5745.5950.0353.8456.9260.1662,3163.9564.5166.6768.8168.97
44.1746.2948.2750.8752.1454.4154*5357.4656.7658.1658.1757.8756.95
9.8449.1119.37911.40111.93913.00210.98211.04412.18110.33011.79711.30312,283
9.1009.7719.76910.3559.35611.6999.15312.1619.96811.68811.6829.9489.929
1.0190.6470.5040.9430.7110.8470.7870.7581.1050.6310.5891.0780,865
1.3180,7750.5860.7640.6210.5010.7950.9340.4041.2000.8130.8370,881
28.0731.0331.4136.0739.0038.6944.3847.9146.8250.1450.4252.7053.30
32.3831.9735.0136.2038.66$1.18%1.1641.64$4.33~5.8844,34!5.6144● 38
30.2932.7434.6836.9940.7240.8046.9050.3851.5652.6953.0956.3455.59
33.7934.8837.1038.5840.4743.1143.96:;.:;
46:7547.0947.4146.44
35.5135.8339.1040.9045.5449.6851.5555.2256.9157.2159.1761.2859.83
37.2439.1641.5244.1246.2246.8647.9649.3850.7550.6550,435101050,58
39.7540.9344.6648.2951.8355.6559.4860.4362.2763.1264.7867.0667.79
42.8745*4147.03$9.7451.1052.0554.1355.6554.5855.6156.6955.3155.42
45.4147.3850.8156.5559.9862.2367.0366.9668.6170.1673.5174.5675.00
49.2252,1953.1756.6257.4359.5359,7361.2160.7162.8661,9463,1561.31
55.6456.1159.0465.8168.8670.8374.5377.6278.1478.4680.5285.6879.93
58.0458.7460.9363.0863.5868.7965.2072.6469.2869.8472.0270.1269.06
59.9358.9362.1370.1876.7280.0576.8784.8686.0383.10“;;.::
98:40
62,0863.3266.3468.8967,3772.3069.5482,8877.7178.1176,6577.7275.19
NOTE: n=sample size; j’f=estimatednumber of youths in populationin thousands; X=mean;S=standard deviation; Sz=standarderror of the mean.
22
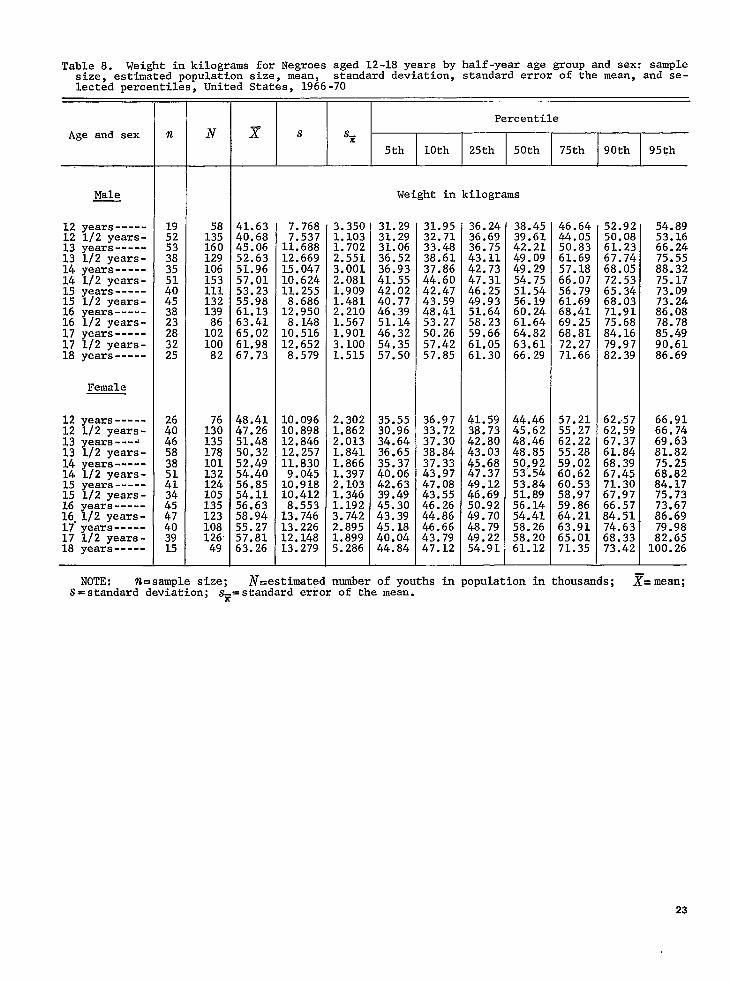
Table 8. Weight in kilogramsfor Negroes aged 12-18 years by half-yearage group and sex: samplesize, estimated population size, mean, standard deviation, standard error of the mean, and se-lected percentiles,United States, 1966-70
Age and sex
Male
12 years-----12 1/2 years-13 years-----13 1/2 years-14 years-----14 1/2 years-15 years-----15 1/2 years-16 years-----16 1/2 years-17 years-----17 1/2 years-18 years-----
Female
12 years-----12 1/2 years-13 years---~13 112 years-14 years-----14 112 years-15 years-----15 1/2 years-16 years-----~;.;~;rears-
-----17 1/2 years-18 years-----
N
lx160129106153111132139
1::10082
1X13517810113212410513512310812649
Percentile
z s s%
5th 10th 25th 50th 75th 90th 95th
41.6340.6845.0652.6351.9657.0153.2355.9861.1363.4165.0261.9867.73
48.4147.2651.4850.3252.4954.4056.8554.1156.6358.9455.2757.8163.26
7.7687.53711.68812.66915.04710.62411.2558.68612.9508.14810.51612.6528.579
10.09610.89812.84612.25711.8309.04510.91810.4128.55313.74613.22612.148L3.279
3.3501.1031.7022.5513.0012.0811.9091.4812.2101.5671.9013.1001.515
2.3021.8622.0131.8411.8661.3972.1031.3461.1923.7422.8951.8995.286
Weight in
31.2931.2931.0636.5236.9341.5542.0240.7746.3951.1446.3254.3557.50
35.5530.9634.6436.6535.3740.06;;.:;
45:3043.3945.1840.0444.84
31.9532.7133.4838.6137.8644.6042.4743.5948.4153.2750.2657.4257.85
36.9733.7237.3038.8437.3343.9747.0843.5546.2644.8646.6643.7947.12
:ilogr<
36.2436.6936.7543.1142.7347.3146.2549.9351.6458.2359.6661.0561.30
41.5938.7342.8043.0345.6847.3749.1246.6950.9249.7048.7949.2254.91
Is
38.4539.6142.2149.0949.2954.7551.5456.1960.2461.6464.8263.6166.29
44.4645.6248.4648.8550.9253.5453.8451.8956.1454.4158.2658.2061.12
46.6444.0550.8361.6957.1866.0756.7961.6968.4169.2568.8172.2771.66
57.2155.2762.2255.2859.0260.6260.5358.9759.8664.2163.9165.0171.35
52.9250.0861.2367.7468.0572.5365.3468.0371.9175.6884.1679.9782.39
62.5762.5967.3761.8468.3967.4571.3067.9766.57!34.5174.6368.3373.42
54.8953.1666.2475.5588.3275.1773.0973.2486.0878.7885.4990.6186.69
66.9166.7469.6381.8275.2568.8284.1775.7373.6786.6979.9882.65100.26
NOTE: 7Z=samDlesize: N=estimated number of vouths in ~ouulationin thousands: ~=mean:S=standard deviktion; s~=standard error of the me;n.
. .
23

Table 9. Weight in kilograme for whites aged 6-18 years by half-year age group and sex: differ-ences between successive groups, 3-period moving averages of mean weights, and differences be-tween successive moving averages, United States, 1966.70
Age
6
6
7
7
8
8
9
9
years-----------------------------
1/2 years-------------------------
years-----------------------------
1/2 years-------------------------
years.“---------------------------
1/2 years-------------------------
years-----.-----------=-----------
1/2 years-------------------------
10
10
11
11
12
12
13
13
14
14
15
15
16
16
17
17
18
years----------------------------
1/2 years------------------------
years----------------------------
1/2 years------------------------
years----------------------------
1/2 years ------------------------
years--.”--------------------.-.--
1/2 years------------------------
years.........-------------------
1/2 years------------------------
years.----....-----.-=-----------
1/2 years------------------------
years----------------------------
1/2 years------------------------
years----------------------------
1/2 years------------------------
years..---------.-----.=---------
(1)
21.83
23.40
24.71
26.41
27.97
29.20
31.44
32.42
33.90
36.27
38.49
40.83
42.57
45.59
50.03
53.84
56.92
60.16
62.31
63.95
64.51
66.67
68.81
(1)
Male
d’
1.57
1.31
1.70
1.56
1.23
2.24
0.98
1.48
2.37
2.22
2.34
1.74
3.02
4.44
3.81
3.08
3.24
2.15
1.64
0.56
2.16
2.14
3-periodmovingaver-age
23.31
24.84
26.36
27.86
29.54
31.02
32.59
34.20
36.22
38.53
40.63
43.00
46.06
49.82
53.60
56.97
59.80
62.14
63.59
65.04
66.66
dz
1.53
1.52
1.50
1.68
1.48
1.57
1.61
2.02
2.31
2.10
2.37
3.07
3.76
3.78
3.38
2.82
2.34
1.45
1.45
1.62
(1)
21.48
22.91
24.58
25.42
27.57
29.22
31.55
33.62
35.08
37.45
39.80
42.05
46.29
48.27
50.87
52.14
54.41
54.53
57.46
56.76
58.16
58.17
57.87
(1)
Female
dl
1.43
1.67
0.84
2.15
1.65
2.33
2.07
1.46
2.37
2.35
2.25
4.24
1.98
2.60
1.27
2.27
0.12
2.93
-0.70
1.40
0.01
-0.30
3-periodmovingaver-age
22.99
24.30
25.86
27.40
29.45
31.46
33.42
35.38
37.44
39.77
42.71
45.54
48.48
50.43
52.47
53.69
55.47
56.25
57.46
57.70
58.07
d2
1.31
1.56
1.54
2.05
2.01
1.96
1.96
2.06
2.33
2.94
2.83
2.94
1.95
2.04
1.22
1.78
0.78
1.21
0.24
0.37
lNo value is recorded for this age group since the average age of youths falling in this cate-gory was not sufficiently close to the age specified.
NOTE : X=mean, dl=difference between successive group means, and d2=difference betweensuccessive moving averages.
24
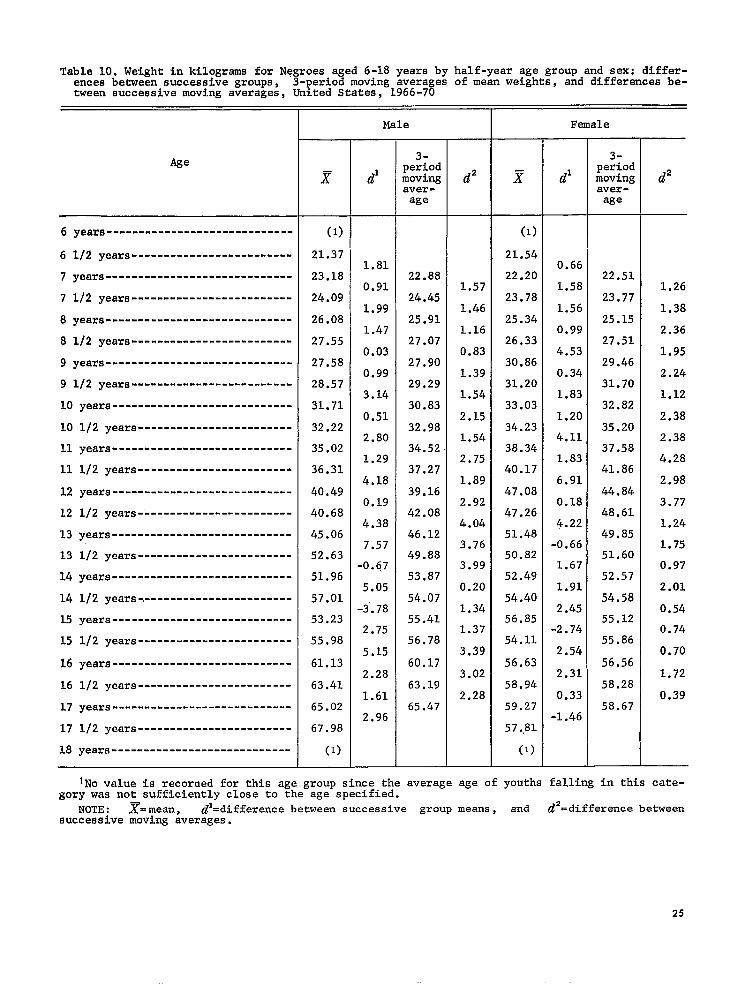
Table 10. Weight in kilograms for Negroes aged 6-18 years by half-yearage group and sex: differ-ences between successivegroups, 3-periodmoving averages of mean weights, and differencesbe-tween successivemoving averages,United States, 1966-70
Age
6
6
7
7
8
8
9
9
10
10
11
11
12
12
13
13
14
14
15
15
16
16
17
17
18—
years---------------------------.-
L/2 years-------------------------
fears--”--------------------------
L/2 years-------------------------
bears-----------------------------
LJ2 years-------------------------
Tears-----------------------------
1./2years-------------------------
years----------------------------
1/2 years------------------------
1/2 years------------------------
years----------------------------
l/2 years------------------------
years----------------------------
l/2 years------------------------
years-----------------------------
1/2 years------------------------
1/2 years------------------------
years-“----”..-------------------
1/2 years------------------------
years----------------------------
1/2 years------------------------
years----------------------------
(1)
21.37
23.18
24.09
26.08
27.55
27.58
28.57
31.71
32.22
35.02
36.31
40.49
40.68
45.06
52.63
51.96
57.01
53.23
55.98
61.13
63.41
65.02
67.98
(1)
Male
dl
1.81
0.91
1.99
1.47
0.03
0.99
3.14
0.51
2.80
1.29
4.18
0.19
4.38
7.57
-0.67
5.05
-3”.78
2.75
5.15
2.28
1.61
2.96
3-peri.odmovingaver-age
22.88
24.45
25.91
27.07
27.90
29.29
30.83
32.98
34.52
37.27
39.16
42.08
46.12
49.88
53.87
54.07
55.41
56.78
60.17
63.19
65.47
dz
1.57
1.46
1.16
0.83
1.39
1.54
2.15
1.54
2.75
1.89
2.92
4.04
3.76
3.99
0.20
1.34
1.37
3.39
3.02
2.28
Female
x
(1)
21.54
22.20
23.78
25.34
26.33
30.86
31.20
33.03
34.23
38.34
40.17
47.08
47.26
51.48
50.82
52.49
54.40
56.85
54.11
56.63
58.94
59.27
57.,81
(1)
dl
0.66
1.58
1.56
0.99
4.53
0.34
1.83
1.20
4.11
1.83
6.91
0.18
4.22
-0.66
1.67
1.91
2.45
-2.74
2.54
2.31
0.33
-1.46
3-periodmovingaver-age
22.51
23.77
25.15
27.51
29.46
31.70
32.82
35.20
37.58
41.86
44.84
48.61
49.85
51.60
52.57
54.58
55.12
55.86
56.56
58.28
58.67
dz
1.26
1.38
2.36
1.95
2.24
1.12
2.38
2.38
4.28
2.98
3.77
1.24
1.75
0.97
2.01
0.54
0.74
0.70
1.72
0.39
lNo value is recoroed for this age group since the average age of youths fallingin this cate-gory was not sufficientlyclose to the age specified.
NOTE: X= mean, d*=differencebetween successive group means, and d2=differencebetweensuccessivemoving averages.
25
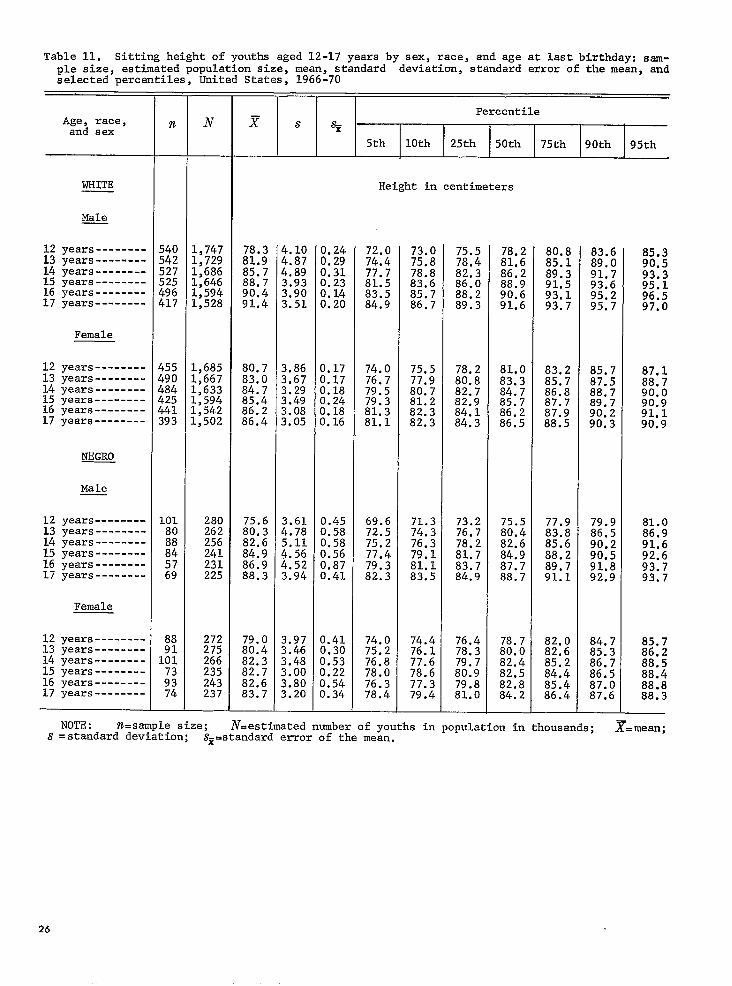
Table 11. Sitting height of youths aged 12-17 years by sex, race, and age at last birthday:sam-ple size, estimatedpopulationsize, mean, standardselectedpercentiles,United States, 1966-70
deviation,standard error of the mean, and
Age, race,and sex
WHITE
Male
years --------years--------years--------years--------years--------years--------
Female
years --------years--------years--------years--------years--------years--------
NEGRO
Male
years --------years--------years--------years--------years--------years--------
Female
years--------years--------years--------years--------years--------years--------
540542527525496$17
$55!9o!84$25$41393
10180
::5769
X101
;:74
N
1,7471,7291,6861,6461,594L,528
1,6851,667L,633L,594L,542L,502
280262256241231225
272275266235243237
PercentileF s ~
5th 10th 25th 50th 75th 90th 95th
Height in centimeters
78.381.985.788.790.491.4
80.783.084.785.486.286.4
75.680.382.684.986.988.3
79.080.482.382.782.683.7
4.104.874.893.933.903.51
3.863.673.293.493.083.05
3.614.785.114.564.523.94
3.973.463.483.003.803.20
0.240.290.310.230.140.20
0.170.170.180.240.180.16
0.450.580.580.560.870.41
0.410.300.530.220.540.34
72.074.477.781.583.584.9
74.076.779.579.381.381.1
69.672.575.277.479.382.3
74.075.276.878.076.378.4
73.075.878.883.685.786.7
75.577.980.781.282.382.3
71.374.376.379.181.183.5
74.476.177.678.677.379.4
75.578.482.386.088.289.3
78.280.882.782.984.184.3
73.276.778.281.783.784.9
76.478.379.780.979.881.0
78.281.686.288.990.691.6
81.083.384.785.786.286.5
75.580.482.684.987.788.7
78.780.082.482.582.884.2
80.885.189.391.593.193.7
83.285.786.887.787.988.5
77.983.885.688.289.791.1
82.082.685.284.485.486.4
83.689.091.793.695.295.7
85.787.588.789.790.290.3
79.986.590.290.591.892.9
84.785.386.786.587.087.6
85.390.593.395.196.597.0
87.188.790.090.991.190.9
81.086.991.692.693.793.7
85.786.288.588,488.888.3
NOTE : ?t=samplesize; iV.estimatednumber of youths in populationin thousands;S =standard deviaticm;
X= mean;SE=standarderror of the mean.
26
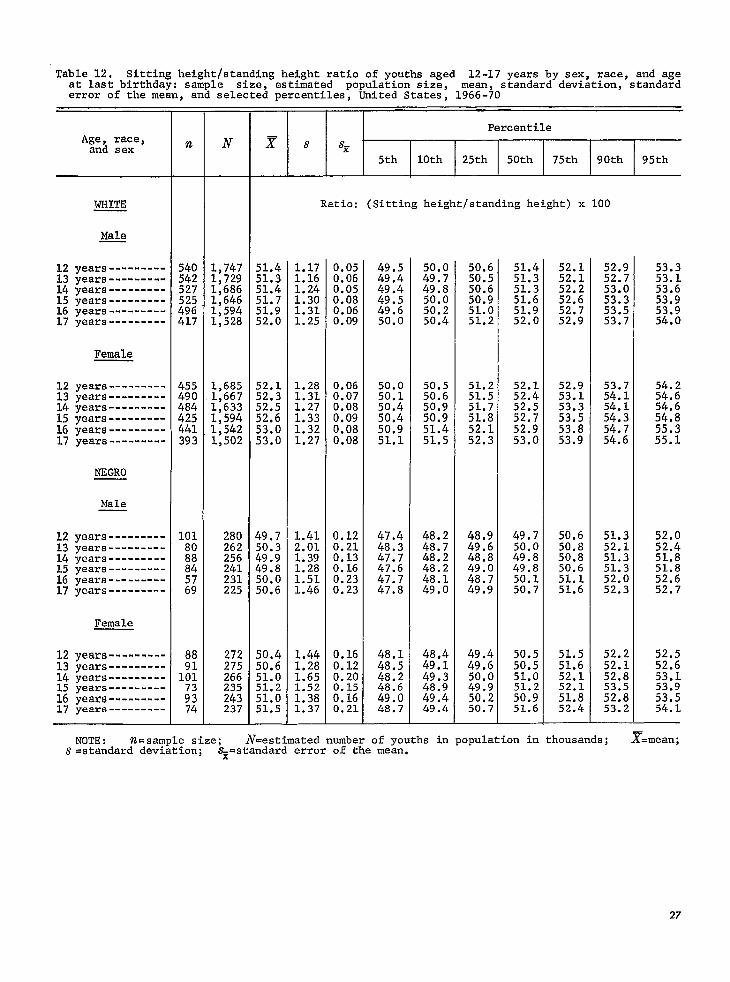
Table 12. Sitting height/standing height ratio of youths agedat last birthday: sample size, estimated population size,
12-17 years by sex, race, and agemean, standard deviation, standard
error of the mean, and selected percentiles, United States, 1966-70
WHITE
Male
121314151.61.7
121314
:217
121314151617
121314151617
years ---------years ---------years ---------years ---------years ---------years ---------
Female
years ---------years ---------years ---------years ---------years ---------years ---------
NEGRO
Male
years ---------years ---------years ---------years ---------years---------years ---------
Female
years ---------years---------years---------years---------years---------years ---------
n
540542527525496417
455490484425441393
1018088845769
H101
;;74
N
1,7471,7291,6861,6461,5941,528
1,6851,6671,6331,5941,5421,502
280262256241231225
272275266235243237
Ratio:
51.451.351.451.751.952.0
52.152.352.552.653.053.0
49.750.349.949.850.050.6
50.450.651.051.251.051.5
1.171.161.241.301.311.25
1.281.311.271.331.321..27
1.412.011.391.281.511.46
1.441.281.651.521.381.37
0.050.060.050.080.060.09
0.060.070.080.090.080.08
0.120.210.130.160.230.23
0.21
Percentile
5th 10th 25th 50th 75th 90th 95th
(Sittingheight/standingheight) x 100
49.549.449.449.549.650.0
50.050.150.450.450.951.1
47.448.347.747.647.747.8
48.148.548.248.649.048.7
50.049.749.850.050.250.4
50.550.650.950.951.451.5
48.248.748.248.248.149.0
48.449.149.348.949.449.4
50.650.550.650.951.051.2
51.251.551.751.852.152.3
48.949.648.849.048.749.9
49.449.650.049.950.250.7
51.451.351.351.651.952.0
52.152.452.552.752.953.0
49.750.049.849.850.150.7
50.550.551.051.250.951.6
52.152.152.252.6.52.752.9
52.953.153.353.553.853.9
50.650.850.850.651.151.6
51.551.652.152.151.852.4
52.952.753.053.353.553.7
53.754.154.154.354.754.6
51.352.151.351.352.052.3
52.252.152.853.552.853.2
53.353.153.653.953.954.0
54.254.654.654.855.355.1
52.052.451.851.852.652.7
52.552.653.153.953.554.1
NOTE : %=sample size; iV=estimated number of youths in population in thousands; Z.mean;S=standard deviation; ~=standard error of the mean.
27

APPENDIX
STATISTICAL NOTES
The Survey Design
The sampling plan of the third cycle of theHealth Examination Survey followed a multi-stage, stratified probability sample of clusters ofhouseholds in land-based segments in which asample of the U.S. population (including Alaskaand Hawaii) aged 12 through 17 years was se-lected. Excluded were those youths confined toinstitutions or residing upon any of the reser-vation lands set aside for use by AmericanIndians.
The sample design of Cycle III is similar tothat of Cycle II in that it utilizes the same 40sample areas and the same segments. The de-cision to incorporate this feature into Cycle IIIwas not made prior to the selection of thesecond cycle sample although it is consistentwith the early concept of a single program for6-17 year olds. The final decision to utilize thisidentical sampling frame was made during theoperation of the second cycle program.
The successive elements for this sample de-sign are primary sampling unit, census enumer-ation district, segment (a cluster of households),household, all eligible youths, and finally, sam-ple youth. Every eligible youth within th~ de-fined population ,has a known and approx-
imately equal chance for selection into thesample.
The steps of drawing the sample werecarried out jointly with the Bureau of theCensus; the starting points were the 1960 decen-nial census lists of addresses and the nearly1,900 primary sampling units (PSU’S) into which
the entire United States was divided. Each PSUis a standard metropolitan statistical area(SMSA), a county, or a group of two or threecontiguous counties. These PSU’S were grouped
into 40 strata so that each stratum had an aver-
age size of about 4.5 million persons. Thisgrouping was done in a manner which maxi-mized the degree of homogeneity within stratawith regard to the population size of the PSU’Sdegree of urbanization, geographic proximity,and degree of industrialization. The 40 stratawere then classified into four broad geographicregions of 10 strata each and then within eachregion, cross-classified by four population den-sity classes and by the rates of populationchange from 1950 to 1960. Using a modifiedGoodman-Kish contrded-selection technique,one PS~ was drawn from each of the 40 strata.
The sampling within PSU’S was carried outin several steps. The first was the selection ofcensus enumeration districts (ED’s). These ED’sare small well-defined areas of about 250housing units into which the entire Nation wasdivided for the 1960 population census. EachED was assigned a ‘ “measure of size” equal tothe rounded whole number resulting from a‘“division by nine” of the number of childrenaged 5-9 in the ED at the time of the 1960census. A sample of 20 ED’s in the sample PSUwas selected according to a systematic samplingtechnique with each ED having a probability ofselection proportional to the population of chil-dren 5-9 years at the time of the 1960 censusdate. From each ED a radom selection of onemeasure of size (segment) was taken.
Minor changes required in the Cycle IIIdesign were that it be supplemented for newconstruction to a greater extent than had beennecessary in Cycle II and that reserve segmentsbe added. Although it was the plan for Cycle IIIto use the Cycle II segments, it was recognizedthat within several PSU’S, additional reservesegments would be needed to avoid the risk ofhaving an insufficient number of examinees.This was prompted by the fact that four of the
29

PSU’S in Cycle II had yields of less than 165eligible children and several others were marginalin their yield. In addition, there was a 3-yearinterval between Cycle 11and Cycle III, so it wasquite possible for some segments to have beencompletely demolished to make room for high-way construction or ‘urban redevelopment.
The time available for examinations at aparticular location or stand, as they have beendesignated, is necessarily set far in advance ofany preliminary field work at the stand. There-fore, the number of examinations that can beperfo~ed at a particular location is dependentupon the number of examining days available.At the majority of locations the number of daysavailable, excluding Saturdays, is 17. At the rateof 12 examinations each day, this provides for204 examination slots. Examinations are con-ducted on Saturdays if, for some reason, it isnecessary. Because of rescheduling for cancella-tions or no-shows, the maximum number ofyouths that is considered for inclusion in thesample is 200. When the number of eligibleyouths exceeds this number, subsampling is per-formed to reduce the number to manageablelimits. This is accomplished through the use of amaster list which is a listing of all eligible youthsin order by segment, serial number (householdorder within segment), and column number(order in the household by age). After thesubsarnpling rate has been determined, every nthname on the list is deleted, starting with the ythname, y being a randomly selected numberbetween 1 and n. Youths who are deleted fromthe Cycle III sample but who were examined inCycle II as well as any twin who may have beendeleted are, if time permits, scheduled for anexamination for inclusion only in the longi-tudinal study portion or twin study portion ofthe survey. Their data are not included in thereport as part of the regular sample.
Since the strata are roughly equal in popu-lation size and a nearly equal number of sampleyouths were examined in each of the samplePSU’S, the sample design is essentially self-weighting with respect to the target population;that is, each child 12 through 17 years old hadabout the same probability of being drawn intothe sample.
The adjustment upward for nonresponse isintended to minimize the impact of nonresponse
on final estimates by imputing to non-respondents the characteristics of “similar”respondents. Here “similar” respondents werejudged to be examined youths in a sample PSUhaving the same age (in years) and sex as thosenot ex~ined in that sample PSU.
The poststratified ratio adjustment used inthe third cycle achieved most of the gains inprecision which would have been attained if thesample had been drawn from a population strat-ified by age, color, and sex and made the finalsample estimates” of population agree exactlywith independent controls prepared by the U.S.Bureau of the Census for the noninstitutionalpopulation of the United States as of March 9,1968 (approximate midsurvey point), by color ‘and sex for each single year of age 12 through17. The weight of every responding sample childin each of the 24 age, race, and sex” classes isadjusted upward or downward so that theweighted total within the class equals the inde-pendent population control.
A more detailed description of the sam-pling plan and estimation procedures is includedin Vital and Health Statistics, Series 2, Number43, “Sample Design and Estimation Proceduresfor a National Health Examination Survey of.Children,” and in Series 1, Numbers 1, 5, and 8,which describe the plan and operation of thefirst three cycles of the Health Examination Sur-vey (HES).
Some Notes on Response Rates
As mentioned previously, the sample de-signs of the second and third cycles of the HESwere similar. Differences did occur; however, inresponse rates of various subgroups of thesesamples and these differences deserve some con-sideration here.
Most importantly, the number of youthsselected for examination increased from 7,417in Cycle 11 to 7,514 in Cycle 111.The responserateYthat is, the number of youths selected whowere actually examined, decreased from 96 per-cent in Cycle II to 90 percent in Cycle III. Ofthe examined youths of Cycle H, 13.86 percentwere Negro compared with 14.76 percent of@ose examined in Cycle III. Th~s differencedoes not reflect a difference in the percentage ofNegro youths selected for examination, but in-
30

stead, a smaller decrease in response rate forNegro youths between the two cycles than wasthe case for the white youths. In actuality, 13.8percent of the sample selected for examinationwas Negro in Cycle III corresponding to 13.5percent for Cycle II. However, whereas theresponse rate for white youths dropped from95.6 percent in Cycle II to 89.1 percent in CycleIII, the response rate for Negro youths droppeda far lesser degree from 98.4 percent to 96.6percent. Thus, better relative response from theNegro portion of the sample yielded a greaterpercentage of ‘these youths actually examinedduring Cycle III than was the case during theprevious sample.
Examination of sample sizes in this reportclearly shows that at every age group there werefewer girls actually examined than there wereboys of the same age. This again is not attrib-uted to differences in numbers of youths se-lected in the sampling design, but rather to thefollowing differential response rates betweenmales and females:
Age Male Female
12 . . . . . . . . . . 93.5 91.313 . . . . . . . . . . 93.2 91.914, . . . . . . . . . 91.7 90.715 . . . . . . . . . . 91.6 87.916 . . . . . . . . . . 89.8 87.717 . . . . . . . . . . 87.6 81.8
Total ..,..... 91.4 88.7
Note that at each age group the response rate forboys exceeded that of girls.
A similar analysis of response rates can bedone by age, race, and sex as follows:
AgeWhite Negro White NegroMale Male Female Female
1’2 . . . 92.6 99.0 90.1 98.9
13 .,.. 92.5 98.8 91.1 96.8
14 . . . . 91.0 97.8 89.6 96.2
15 . . . . 90.7 97.7 86.4 98.6
16. . . . 68.2 95.0 86.6 93.0
17 . . . . 86.5 95.8 80.2 91.4
Total . . 90.5 97.6 87.4 95.8
The above clearly indicates that for all agesunder consideration in Cycle III of the HES, the
NOTE: The list of references follows the text.
response rate for’ Negro youths exceeded that ofwhite youths of the same sex and age.
Reasons for differences in response ratesare many but may range from the incentive toget examined in order to miss a day of school, tofear of the examination itself, to inhibitionswith respect to being examined. Note that thevery worst response rate was recorded for theoldest girls, i.e., 17-year-old females.
Parameter and Variance Estimation
Because each of the 6,768 sample childrenhas an assigned statistical weight, all estimates ofpopulation parameters presented in HES publi-cations are computed taking this weight intoconsideration. Thus, the estimate of a populationmean P is computed as follows: ~ = ZWiXi/ZWi;where Xi 1s the observation or measurement onthe i ‘h person and ~ is the weight assigned tothat person.
The Health Examination Survey has anextremely complex sampling plan and obviouslythe estimation procedure is, by the very natureof the sample, complex as well. A method isrequired for estimating the reliability of findingswhich “reflects both the losses from clusteringsample cases at two stages and the gains fromstratification, ratio estimation, and poststratifica-tion.”ls
The method for estimating variances in theHealth Examination Survey is the half-samplereplication technique. The method was developedat the U.S. Bureau of the Census prior to 1957and has at times been given limited use in theestimation of the reliability of results from theCurrent Population Survey. This half-sample rep-lication technique is particularly well suited tothe Health Examination Survey because thesample, although complex in design, is relativelysmall (6768 cases) and is based on only 40strata. This feature permitted the developmentof a variance estimation computer programwhich produces tables containing desired esti-mates of aggregates, means, or distributions,together with a table identical in format butwith the estimated variances instead of the esti-mated statistics. The computations required bythe method are simple and the internal storagerequirements are well within the limitation of
31
the IBM 360-.50 computer system utilized at theNational Center for Health Statistics.
Variance estimates computed for this re-port were based on 20 balanced half-samplereplications. A half-sample was formed bychoosing one sample PSU from each of 20 pairsof sample PSU’S. The composition of the 20half-samples was determined by an orthogonalplan. To compute the variance of any statistic,this statistic is computed for each of the 20half-sarnplesLUsing the mean as an example, thisis denoted Xi. Then, the w~ighted mean of theentire, undivided sample (X) is computed. The
variance of the mean is the mean square deviationof each of the 20 hall-sample means about the
overall mean. Symbolically, Var(~) =i$q (~~2?f)2/20
and the standard error of the mean is simply thesquare root of this. In a similar manner, thestandard error of any statistic may be computed.
A detailed description of this replicationprocess is contained in Vital and Health Statis-tics, Series 2, Number 14, “Replication: AnApproach to the Analysis of Data from ComplexSurveys,” April 1966, by Philip J. McCarthy,Ph.D.
Standards of Reliability and Precision
All means, variances, and percentages ap-pearing in this report met defined standardsbefore they were considered acceptably preciseand reliable.
‘l’he rule for reporting means consisted oftwo basic criteria. The first criterion was that asample size of at least five was required. If thisfirst criterion was met, then the second criterionwas that the coefficient of variation (i.e., thestandard ~rror of the mean divided by themean sZ/X) be less than 25 percent. Thus, ifeither the sample size was too small or the varia-tion with respect to the mean was too large, theestimate was considered neither precise nor reli-able enough to meet the standar& establishedfor publications.
In this report, these criteria were met in allinstances since the breakdowns used were gener-ally large in size and thus eliminated the prob-lems faced in other reports where subgroups
are divided and redivided yielding extremelysmall cell frequencies.
Hypothesis Testing
Classically, to test the difference betweentwo means (or, put differently, to test whethertwo samples could have been drawn from thesame population), one could set up a teststatistic which would utilize the means andstandard errors of the means as computed fromthe samples. The statistic
would then be compared to a table of normaldeviates to determine the probability of obtain-ing values of the test statistic as extreme or moreextreme than that computed, if in fact the twopopulation means were equal.
Because of the many breakdowns of theHES sample, innumerable tests of this naturecould be performed and, with each new test, theprobability of rejecting a hypothesis incorrectlymay be .05; but if 10 such tests are performed,the probability of making at least one mistakesomewhere in those 10 tests is closer to 0.50.This last “overall error rate” will get increasinglylarge as the number of such tests increases.Therefore, while the data necessary to do z testsare provided in the tables of this report, no suchtests were performed by the authors.
It was decided, instead, to place the great-est emphasis on a relationship remaining con-stant over both sexes and all ages under con-sideration. In other words, to say that “all wholeyear age cohorts of males have greater staturesthan corresponding age cohorts of females fromages 13 to adulthood” has far greater meaningand interpretability than to say “the mean stat-ure for 13-year-old males is significantly greater(at the .05 level) than the mean stature for13-year-old females, and the mean stature for14-year-old males is . . . . etc., as determined bya normal deviate.” In these analyses, consistency
32
rather than statements about successions of indi-vidual probability levels is the factor consideredmost imp ortant in demonstrating a relationship.
Imputation
The necessity of arriving at a workableimputation scheme for Cycle III of the HES wasdictated by the fact that each individual carries aseparate and unique statistical weight, i.e., thenumber of individuals in the United States popu-lation he is said to represent. The decision todrop from the sample such an individual due tomissing or erroneous values on some number ofvariables would not be satisfactory unless thestatistical weight was somehow redistributed.The extent of bias introduced in this mannerwould depend upon the scheme chosen for theredistribution of the individual’s statisticalweight and would carry along with it the majordisadvantage of having unweighed sample sizesdiffer from variable to variable (thus makingcorrelation procedures more complicated) while,of course, the weighted sample sizes wouldremain constant.
A regression method of imputation whichwas selected for the analysis of HES bodymeasurements was desirable and possible forseveral reasons. First, the number of problemcases was small enough so as not to be unwieldy.Second, the various body measurements col-lected on an individual are highly correlated and,as such, one would like the imputed value to beharmonious with the other valid measures forthat individual. To simply impute a group meanor a randomly selected value to an atypicalindividual in place of either a nonexistent or anexisting but obviously incorrect measurementwhile ignoring the other valid information onthat same individual would be undesirable.
Third, the bias introduced by a regressionscheme would clearly be less than would arise ifindividuals with missing or questionable bits ofinf(nmwtion were excluded from the sample andtheir statistical weights redistributed. Fourth,this system has the advantage of holding boththe weighted and unweighed sample sizes con-stant from variable to variable thus facilitatingany correlations or cross-tabulations desired.Thus, an elaborate regression scheme was utilized
to impute body measurements of the third cycleof the HES.
The procedure was as follows: From thetotal 6,768 subjects on whom some body mea-surements were performed, “26 subjects forwhom there was one or more missing valueswere temporarily dropped and four files werecreated from the remaining 6,742 subjects. Thefiles were white males, Negro males, white fe-males, and Negro females. It was from thesesubjects that the prediction equations werefinally developed.
In a typical case, a subject (for example, a
12-year-old Negro male) might have a bodyweight recorded which is so low to raise thequestion of whether there was an error some-where in the data preparation process. However,despite this extremely low value, his recordwould be otherwise complete. Since all the othervariables are recorded for this individual, anestimate for body weight is derived based on allthe other information available and it is possibleto conclude that the recorded measurement ispossible considering the youth’s other dimen-sions or that the recorded ‘value is an obviousclerical error and should be changed. Thus, thefile with the Negro males who all have completerecords is tapped and a stepwise regression iscalculated, with body weight the dependent var-iable. All the remaining variables are eli#ble forinclusion into the equation with the followingrestrictions:
(1) Age must be the first variable added intothe equation, irrespective of the correlationbetween age and the dependent variable.
(2) So long as adding a new variable con-tributed at least .005 (Y2 percent) to thecoefficient of multiple determination (R2 ),it was included. If the contribution was lessthan that, the equation was frozen with allthe variables which did add at least thatmuch to R2. (No equation included morethan eight independent variables.)
The resulting equation may be of the form
where Y is the predicted sitting height,
% PI, (32, 63, etc., are the coefficients gen-
33

erated by the regression, and Xl , X2, X3, etc.,are the independent variables. By inserting therecorded values for this subject of X,l , X2, X3up to X~ (k being the number of va.nables con-tributing significantly to l?2, k<8) into theequation, a prediction is arrived at for bodyweight. A value imputed in this manner issuperior to other possible methods since all therelevant information is utilized and allows anextremely large or small person to be assigned asimilarly large or small imputed value.
In actuality there were only six youths ofCycle III of the HES whose values for height orweight on the original data tape were eithermissing or highly questionable.
To determine whether a height, weight, orsitting height was “questionable,” extremes ofthe distributions of each variable were examinedcase by case. (Although useful, this procedureallows some highly deviant values to go unde-tected, for example, hidden in the distributionof body weights may be an individual of ex-tremely small stature who had a mispunchedweight far too great for his stature but neverthe-less within normal bounds for the entire distri-bution of all weights from the entire HESsample.) But the magnitude of the problem ofbad or missing height and weight data in the
NOTE: The list of references follows the text.
HES is very small and oversights such as this willnot have an appreciable collective effect.
By using the above-described techniques ofediting for questionable values and imputing themissing ones, the height values on only twosubjects were changed for this report: one youthhad no standing height recorded because grossdistortion from birth defects made such mea-surement impossible and unreasonable, and theother youth was unable to stand upright becauseof leg braces.
A complete description of the problems,the alternatives, and the selected procedure foruse in imputation of all the other HES bodymeasurements can be found in a separate docu-ment. 19 In addition, a complete log was kept ofall changes made on the original Cycle III dataand these may be made available upon request.
Quality Control
A detaiIed discussion of quality controlmeasures has been included in appendix III ofSeries 11, Number 124. In addition, the analysisof replicate measures of stature and weight waspresented. The analysis of replicate measures ofsitting height was included in an extensive anal-ysis of all the body measurements used in CyclesII and III in appendix III of the recently publishedVital and Health Statistics Series 11 report,
Number 123.
* U.S. GOVERNMENT PiWNTING OFFICE :1973 543-876/7
cio c?-
34

VITAL AND HEALTH STATISTICS PUBLICATION SERIES
flrigindy l%blic Health Service publication No. 1000
r
SWies 1.
Series 2.
Series 3.
Series 4.
Series 10.
Sm”es 11.
Sqies 12.
Series 13.
Sin-es 14.
Sm”es 20.
Series 21.
Sm”es 22.
programs and collection procedures. - Reports which describe the general programs of the NationalCenter for Health Statistics and its offices and divisions, data collection methods used, definitions,and other material necessary for understanding the data.
Data evaluatwn and methods research. —Studies of new statistical methodology including: experi-mental tests of new survey methods, studies of vital statistics collection methods, new analyticaltechniques, objective evaluations of reliability of collected data, contributions to statistical theory.
Analytical studies. —Reports presenting analytical or interpretive studies basedon vital and health /“statistics, carrying the analysis further than the expository types of reports in the other series.
Doctunents and committee reports. - Final reports of major committees concerned with vital andhealth statistics, and documents such as recommended model vital registration laws and revisedbirth aqd death certificates.
Data from the Health Interview Survev.— Statistics on illness, accidental injuries, disability, useof hospital, medical, dental, and other services, and other health-related topics, based on datacollected in a continuing national household interview survey.
Data from the Health Examination Survey. —Data from direct examination, testing, and measure-ment of national samples of the civilian,” noninstitutional population provide the basis for two typesof repbrts: (1) estimates of the medically defined prevalence of specific diseases in the UnitedStates and the distributions of the population with respect to physical, physiological, and psycho-logical characteristics; and (2) analysis of relationships among the various measurements withoutreference to an explicit finite universe of persons.
Data from the Institutional Po@dation Surveys. —Statistics relating to the health characteristics ofpersons in institutions, and their medical, nursing, and personal care received, based on nationalsamples of establishments providing these services and samples of the residents or patients.
Data Jrom the Hospital Discharge Survey. —Statistics relating to discharged patients in short-stayhospitalq based on a sample of patient records in a national sample of hospitals.
Dat4t on health resources: manpower and facilities. —Statistics on the numbers, geographic distri-bution, and characteristics of health resources including physicians, dentists, nurses, other healthoccupations, hospitals, nursing homes, and outpatient facilities.
Datu on mortality.— Various statistics on mortality other than as included in regular annual ormonthly reports —special analyses by cause of death, age, and other demographic variables, alsogeographic and time series analyses.
Data on natality, mawiage, and divorce. —Various statistics on natality, marriage, and divorceother than as included in regular annual or monthly reports-pecial analyses by demographicvariables, also geographic and time series analyses, studies of fertility.
Data jmtn the Natwnal Natility and Mortality Sumeys. — Statistics on characteristics of birthsand deaths not available from the vital records, based on sample surveys stemmfng t?om theserecords, including such topics as mortality by socioeconomic class, hospital experience in thelast year of life, medical care during pregnancy, health insurance coverage, etc.
For a list of titles of reports published in these series, write to: Office of InformationNat ional Center for Health StatisticsPublic Health Service, HR.4Rockville, Md. 20852