Embed Size (px)
Citation preview
BOFIT Policy Brief 2020 No. 10
Vesa Korhonen
Chasing real developments in Russia’s government budget
Bank of Finland, BOFIT Institute for Economies in Transition
BOFIT Policy Brief Editor-in-Chief Mikko Mäkinen
BOFIT Policy Brief 10/2020 26.8.2020 Vesa Korhonen Chasing real developments in Russia’s government budget ISSN 2342-205X (online)
Bank of Finland BOFIT – Institute for Economies in Transition PO Box 160 FIN-00101 Helsinki Phone: +358 9 183 2268 Email: [email protected] Website: www.bofit.fi/en
The opinions expressed in this paper are those of the authors and do not necessarily reflect the views of the Bank of Finland.
Vesa Korhonen
Chasing real developments in Russia’s government budget
Bank of Finland / Institute for Economies in Transition 2 BOFIT Policy Brief 10/2020 www.bofit.fi/en
Contents Abstract ................................................................................................................................................ 3
1. Real volumes of government budget expenditures provide insight into government conduct ........ 4
2. Price components used in forming deflators for Russia’s government budget expenditures and revenues ............................................................................................................................................... 5
3. Composition of budget deflators depends on the approach to the government’s role ..................... 7
4. Real volumes of Russia’s government budget expenditures and revenues stalled for years ........... 9
5. Years of decline in real volumes of budget expenditures that facilitate the government’s supplier role ..................................................................................................................................................... 11
6. Different tracks in real volumes of government budget spending on functional branches ............ 13
7. Summary of results ........................................................................................................................ 16
Data sources ....................................................................................................................................... 17
Vesa Korhonen Chasing real developments in Russia’s government budget
Bank of Finland / Institute for Economies in Transition 3 BOFIT Policy Brief 10/2020 www.bofit.fi/en
Vesa Korhonen1
Chasing real developments in Russia’s government budget
Abstract
This paper traces the development of real volumes of expenditures and revenues of Russia’s consolidated government budget (combined federal, regional and local budgets, as well as state social funds, but excluding inter-budget transfers). Novel budget deflators are built from relevant prices and structures of the government budget’s expenditures to assess: (1) how the government has performed the basic twin role of (A) supplying services and goods, including spending on individual functional branches of the government budget sector, and (B) providing social support; and (2) how government budget spending has impacted demand in the economy.
Regarding the supply of services and goods, the real volume of government budget spending for acquiring the inputs remained well below its 2009 peak during most of the 2010s. This decline reflects, in particular, the major increases in nominal wages in the government budget sector. Real spending on the supplying government sector branches have moved along partly different paths. In the task of providing social support, the spending allotment increased in real terms until the middle of 2010s, then levelled off. Looking at the impact of government spending on demand in the economy, the real spending volume rose almost continuously before plateauing in 2013. The volume declined considerably in 2015, staying at the lower level until 2019.
Keywords: Russia, government, budget, deflators
1 I am grateful to Iikka Korhonen and Mikko Mäkinen, as well as participants at the Bank of Finland (BOFIT) seminar, for their helpful comments.
Vesa Korhonen
Chasing real developments in Russia’s government budget
Bank of Finland / Institute for Economies in Transition 4 BOFIT Policy Brief 10/2020 www.bofit.fi/en
1. Real volumes of government budget expenditures provide insight into government conduct
Assessing economic development of a country over time requires data on real volumes of various indicators when their nominal values have been eroded by inflation. Real volume data for the entire economy and the main sectors, i.e. the corporate sector and households, are usually available from national statistical agencies. Standard examples include GDP, production, consumption, fixed investment, exports, imports and household real incomes.
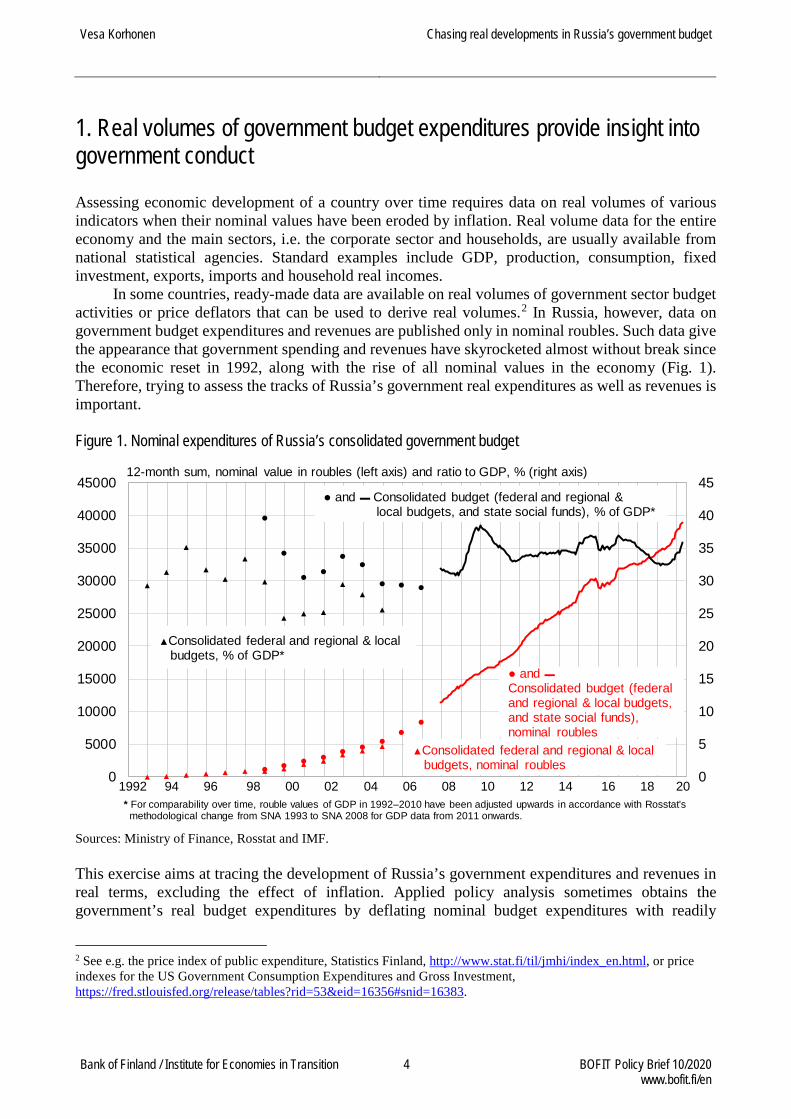
In some countries, ready-made data are available on real volumes of government sector budget activities or price deflators that can be used to derive real volumes.2 In Russia, however, data on government budget expenditures and revenues are published only in nominal roubles. Such data give the appearance that government spending and revenues have skyrocketed almost without break since the economic reset in 1992, along with the rise of all nominal values in the economy (Fig. 1). Therefore, trying to assess the tracks of Russia’s government real expenditures as well as revenues is important. Figure 1. Nominal expenditures of Russia’s consolidated government budget
Sources: Ministry of Finance, Rosstat and IMF. This exercise aims at tracing the development of Russia’s government expenditures and revenues in real terms, excluding the effect of inflation. Applied policy analysis sometimes obtains the government’s real budget expenditures by deflating nominal budget expenditures with readily
2 See e.g. the price index of public expenditure, Statistics Finland, http://www.stat.fi/til/jmhi/index_en.html, or price indexes for the US Government Consumption Expenditures and Gross Investment, https://fred.stlouisfed.org/release/tables?rid=53&eid=16356#snid=16383.
0
5
10
15
20
25
30
35
40
45
0
5000
10000
15000
20000
25000
30000
35000
40000
4500012-month sum, nominal value in roubles (left axis) and ratio to GDP, % (right axis)
▲Consolidated federal and regional & localbudgets, % of GDP*
● and ▬ Consolidated budget (federal and regional &local budgets, and state social funds), % of GDP*
▲Consolidated federal and regional & localbudgets, nominal roubles
● and ▬Consolidated budget (federaland regional & local budgets,and state social funds), nominal roubles
1992 94 96 98 00 02 04 06 08 10 12 14 16 18 20* For comparability over time, rouble values of GDP in 1992–2010 have been adjusted upwards in accordance with Rosstat's
methodological change from SNA 1993 to SNA 2008 for GDP data from 2011 onwards.

Vesa Korhonen
Chasing real developments in Russia’s government budget
Bank of Finland / Institute for Economies in Transition 5 BOFIT Policy Brief 10/2020 www.bofit.fi/en
available price indicators such as CPI or GDP deflator. However, as any of those price indicators captures only some of the price increases that government budget spending faces, we construct novel government budget deflators from various price indicators. Budget deflators are necessary also because virtually all other relevant price indicators have moved upwards much faster than the conveniently used CPI. The GDP deflator is conceptually unsuited to this task as it comprises export prices with considerable weight (which is particularly relevant in Russia’s case due to movements of oil export prices).
Budget deflators are constructed for addressing two aspects of government spending. The first aspect, which is also laid down in international guidelines,3 is the government’s basic twin role of (A) supplying services and goods and (B) providing social support. Task A casts the government in the role of an input-buyer facilitating the supply. It naturally makes the real volume of government budget expenditures and revenues dependent on the prices at which the government procures inputs. In this respect, the government faces the same setup as the corporate sector (households face a different price front, i.e. consumer prices). The relevance of different prices for the government obviously depends on the proportions of government spending on inputs (goods, services and work by its employees).
Government budget sector wages, like wages in any supplier sector, thus constitute prices (and in this exchange context are not an instrument of e.g. social support). Their increases affect the real volume of the government’s wage expenditures. Apart from this basic division between prices and real volumes, the further issue of whether wage increases enhance the real volume of supply by improving productivity is a topic beyond the scope of this exercise to distil real volume developments of government budget expenditures from nominal budget data with the help of price data.
Provision of social support, task B of the government’s twin role, largely involves distributing funds to people on a non-reciprocal basis. Therefore, the price front faced by government expenditures on social support consists of the consumer prices that recipients of social support confront in their spending.
The impact of budget expenditures on demand in the economy constitutes the other aspect of government spending. Here, we build the budget deflator by simply changing the price front faced by government budget wage expenditures to consumer prices because in this approach wage earners of the government budget sector also act as buyers. Government spending on goods and services in this context remains confronted with the same prices as under the first aspect. Second-round effects on demand in the economy are not included here. 2. Price components used in forming deflators for Russia’s government budget expenditures and revenues
The availability of data defines the degree of sophistication in constructing government budget deflators (BDs), both regarding BD price components and the weights attached to the price components. The choice of price components is also affected by the available weights. Here, data on government budget expenditures according to the economic classification, i.e. wages, use of goods and services, subsidies, fixed investments and social benefits (see Table 1) are the only option for weights.4 Two price indicators specific to the Russian government budget sector are publicly
3 Government Finance Statistics Manual 2014, Washington, DC, International Monetary Fund, 2014, https://www.imf.org/external/Pubs/FT/GFS/Manual/2014/gfsfinal.pdf or System of National Accounts 2008, New York, 2009, European Commission, International Monetary Fund, Organisation for Economic Co-operation and Development, United Nations, World Bank, https://unstats.un.org/unsd/nationalaccount/docs/SNA2008.pdf. 4 The sources for data are listed at the end of this paper.
Vesa Korhonen
Chasing real developments in Russia’s government budget
Bank of Finland / Institute for Economies in Transition 6 BOFIT Policy Brief 10/2020 www.bofit.fi/en
available, i.e. prices of public consumption (PPC) for the entire government budget sector and the average wage (W) of the government budget sector. Both are applied to build alternative BDs, based on the fact that over half of public consumption consists of government budget sector wage expenditures.
W or PPC is used together with price indicators not specific to the government sector, i.e. producer prices of industrial goods supplied to domestic users (PIGD), prices of imports of goods and services (IP), prices of gross fixed capital formation (PGFCF) and consumer prices (CPI). General price components that relate both to the corporate and government sectors (PIGD) or all sectors of the economy (PGFC) are naturally proxies for the prices faced by government spending on goods and services. PIGD and IP represent supply, while PPC and PGFCF represent demand. They have overlaps (PPC includes PIGD and IP, and PGFCF overlaps with PIGD and IP) that were dealt with when attaching weights to these price components of BDs. A separate non-investment PIGD was unavailable. PGFCF was used instead of fixed investment prices because the PGFCF in the 2008 version of the System of National Accounts introduced in Russia half a decade ago includes investment in military equipment (even if Russian SNA 2008 data is only available from 2011 onwards). Such equipment is not covered by Russian fixed investment data. No attempt was made here to include prices of domestic services or agricultural producer prices in the BDs.
Households face different CPIs due to different consumption baskets. A separate CPI had to be built for households receiving social support as Rosstat only publishes CPI figures for the lowest income decile (CPI 1) where the income level per household member is much lower than e.g. the average pension in 2011−2018. As the five lowest deciles in 2011−2018 have had income levels per household member in the area around the average pension level, our CPI for households receiving social support is the average of the purpose-built CPIs of the five lowest income deciles (CPI 1−5). Notably, this CPI 1−5 rises only slightly faster over time than the general CPI. The difference is also miniscule between the increases of CPIs from 1 to 5 even if there are differences between the structures of consumer baskets. The rise of CPI 1−5 appears understated in comparing CPI 1 to Rosstat’s CPI 1 because we use broad three-part structures of the consumption baskets (food, non-food goods, and services) and assume that prices of the three sub-baskets in each CPI basket from 1 to 5 increased at the same pace as in the general CPI.5
One practical issue is different time frequencies of price indicators in the statistics as CPI and PIGD are monthly, PPC, PGFCF and IP are quarterly, and W is annual. For building 12-month BDs, movements between quarterly and annual data points were assumed to have occurred at a constant pace. The latest data on PPC, PGFCF and IP were available for 1Q20. For the subsequent months of 2020, changes of these prices from a year earlier were assumed to have remained the same as in 1Q20. As the latest data on W is from 2019, an estimate for 2020 was made using monthly data available up to June 2020 on the wages of corporate and government sectors in three large government budget sector branches or their combinations (administration + defence + social security, education, and healthcare + social services).
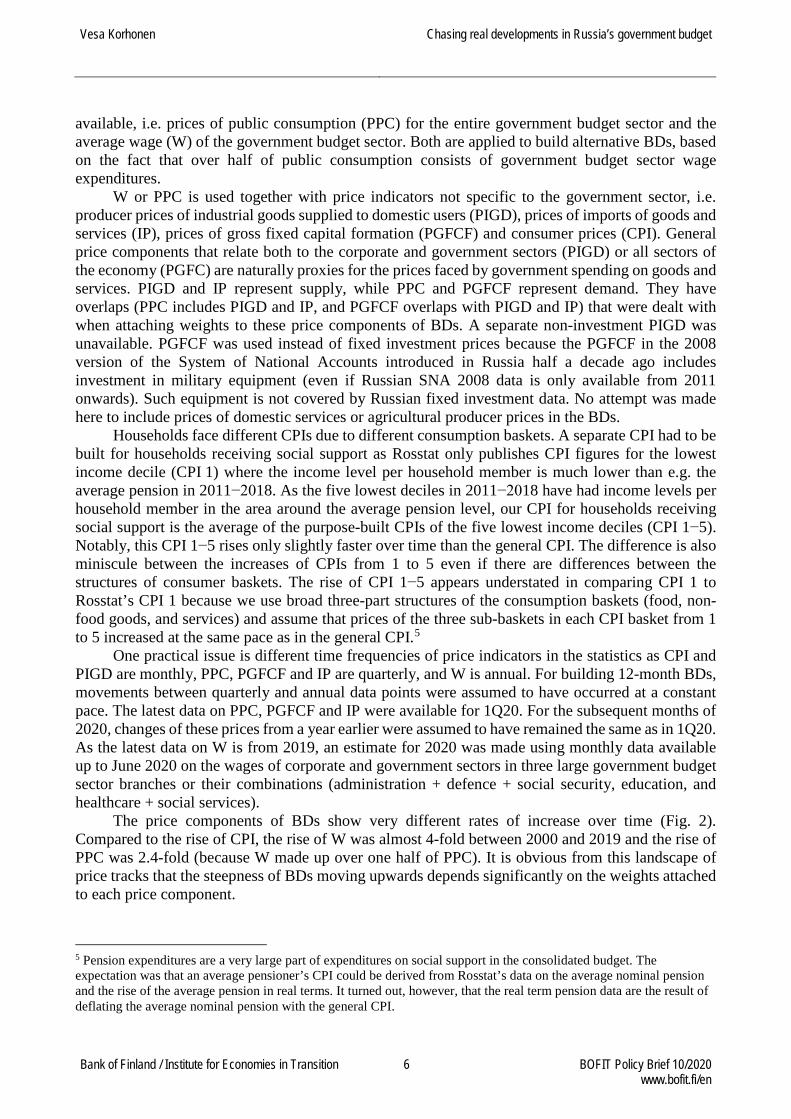
The price components of BDs show very different rates of increase over time (Fig. 2). Compared to the rise of CPI, the rise of W was almost 4-fold between 2000 and 2019 and the rise of PPC was 2.4-fold (because W made up over one half of PPC). It is obvious from this landscape of price tracks that the steepness of BDs moving upwards depends significantly on the weights attached to each price component.
5 Pension expenditures are a very large part of expenditures on social support in the consolidated budget. The expectation was that an average pensioner’s CPI could be derived from Rosstat’s data on the average nominal pension and the rise of the average pension in real terms. It turned out, however, that the real term pension data are the result of deflating the average nominal pension with the general CPI.
Vesa Korhonen
Chasing real developments in Russia’s government budget
Bank of Finland / Institute for Economies in Transition 7 BOFIT Policy Brief 10/2020 www.bofit.fi/en
Figure 2. Price components for government budget deflators
Sources: Rosstat and BOFIT. 3. Composition of budget deflators depends on the approach to the government’s role
Two main types of BDs were built for deflating total government budget expenditures and revenues according to the approaches described above, i.e. to have a view of the government’s basic twin role (BD 1 in Table 1) and the impact of government budget expenditures on demand in the economy (BD 2). Weights attached to the price components are from the expenditure structure (according to the economic classification) of the consolidated budget, i.e. federal, regional and local budgets, plus state social funds. The price components have fixed weights of 2011, and each price component is thus set at 100 for 2011. For presentation purposes for Figures 2 and 3 that show the price components and the resulting BDs, the 100 mark is shifted to the year 2000. Compositions of BD 1 and BD 2 have only one difference already noted, i.e. whether the weight of wage expenditures is attached to W (in BD 1) or CPI (in BD 2), although Figure 2 above makes it obvious that the difference is crucial for the steepness of upward tracks of the two BDs.
The rest of the palette of price components and their weights are the same in BD 1 and BD 2. That bunch of inputs acquired by the government, i.e. goods and services, is separated in the budget expenditure data into current use of goods and services and fixed investments. BD 1 also has another variant based on PPC. In this variant, the weights of wage expenditures and the use of goods and services are attached to PPC as they account for almost all public consumption.
Concerning further the government’s use of goods and services, PIGD and IP are combined. The share of imports in PIGD-IP had to be assumed and is put at 10 %, thus giving a very small weight to IP in the BDs. Subsidies to corporations are treated as part of the government’s task of supplying services and goods (the other option would be to exclude subsidies if they were seen as
0
200
400
600
800
1000
1200
1400
0
200
400
600
800
1000
1200
1400
00 02 04 06 08 10 12 14 16 18 20
Average nominal wage ↑ 2267of the government budget sector (2019)
Import prices,goods & services
Consumer prices
Consumer prices,5 lowest income deciles
(dotted line)
Prices of gross fixed capital formation
Producer pricesof industrial goods
supplied todomestic users
12-month or 4-quarter average, 2000=100Prices of publicconsumption

Vesa Korhonen
Chasing real developments in Russia’s government budget
Bank of Finland / Institute for Economies in Transition 8 BOFIT Policy Brief 10/2020 www.bofit.fi/en
part of the government’s task to distribute funds). In building both BD 1 and BD 2, the price component weighted with expenditures on social benefits is CPI 1−5.
Two separate BDs under BD 1 were formed regarding each of the two tasks under the government’s basic twin role. The BD relating to the government’s task of supplying services and goods (BD 1.A in Table 1) was also formed as W-based and PPC-based variants. The BD for the other task in the twin role, i.e. providing social support (BD 1.B in Table 1), is structured similarly to BD 1.A. It contains the small weight of wages in this government budget spending branch. Table 1. Inclusion and weights of price components in government budget deflators
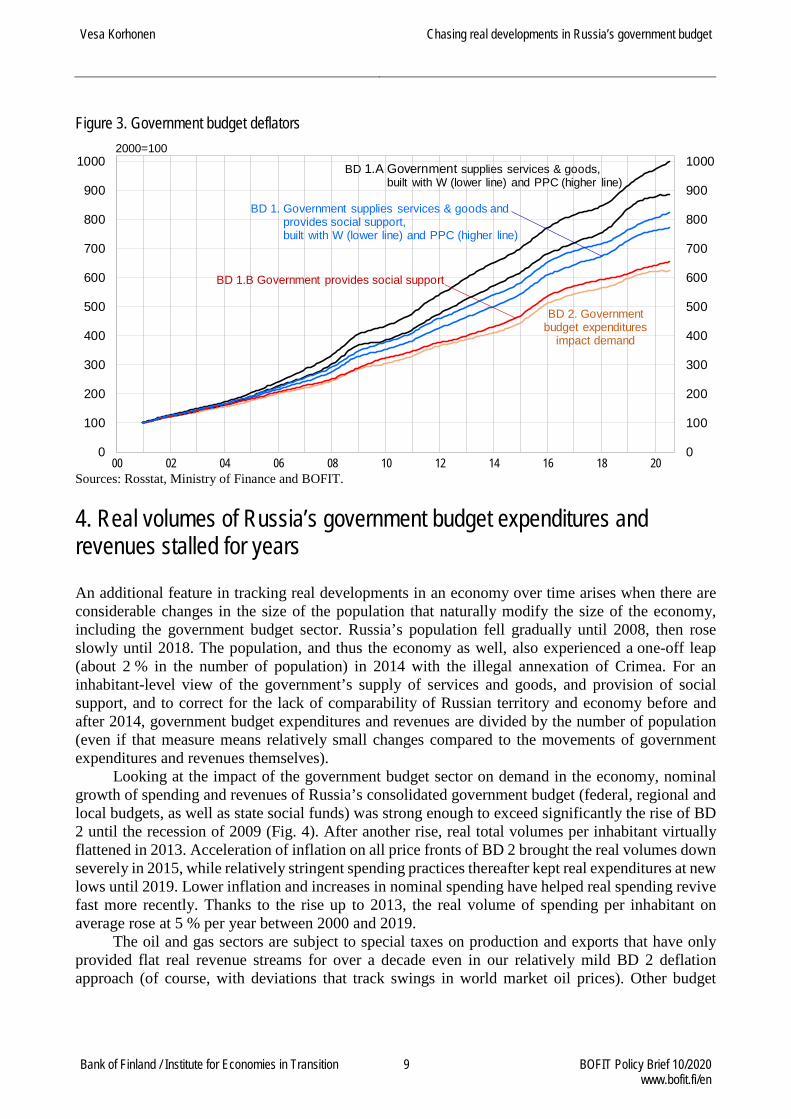
Sources: Ministry of Finance and BOFIT. As prejudged by the price components, the BDs obtained in Figure 3 show considerable differences in their rise over time. BD 2 that refers to the impact of government budget expenditures on demand in the economy has risen least as expenditures on wages have faced the relatively moderate increase of CPI. The government’s task to provide social support has confronted a slightly stronger wind, which is mainly caused by W in BD 1.B. The government’s spending increases for the various budget branches that supply services and goods overall have faced soaring costs and prices (BD 1.A), especially the rise of W or PPC due to W (the average annual increases of the BD 1.A variants amount to 12−13 % during 2001−2019).
Price component Average Prices of public Consumer prices Producer prices of Prices ofnominal consumption Total 5 lowest industrial goods gross fixedwage of the household supplied to capitalgovernment income domestic users formationbudget sector deciles and imports (90−10)
Weight category from Wages Wages Use of Wages Social Use of Subsidies Fixedthe economic classification of goods & benefits goods & investmentconsolidated gov. budget expenditures services services expenditures
weight in 2011, % weight in 2011, % weight in 2011, % weight in 2011, %Budget deflator relating to the government's role
1. Gov. supplies services & goods wage-based 20.4 35.2 17.1 10.9 16.3 and provides social support PPC-based 20.4 17.1 as above as above as above
1.A Gov. supplies services & goods wage-based 31.6 26.4 16.8 25.2PPC-based as above 26.4 as above as above
1.B Gov. provides social support, 7.2* 92.8* weights from the functional classification of consolidated gov. budget expenditures
2. Gov. expenditures impact demand in the economy 20.4 35.2 17.1 10.9 16.3
Vesa Korhonen
Chasing real developments in Russia’s government budget
Bank of Finland / Institute for Economies in Transition 9 BOFIT Policy Brief 10/2020 www.bofit.fi/en
Figure 3. Government budget deflators
Sources: Rosstat, Ministry of Finance and BOFIT. 4. Real volumes of Russia’s government budget expenditures and revenues stalled for years
An additional feature in tracking real developments in an economy over time arises when there are considerable changes in the size of the population that naturally modify the size of the economy, including the government budget sector. Russia’s population fell gradually until 2008, then rose slowly until 2018. The population, and thus the economy as well, also experienced a one-off leap (about 2 % in the number of population) in 2014 with the illegal annexation of Crimea. For an inhabitant-level view of the government’s supply of services and goods, and provision of social support, and to correct for the lack of comparability of Russian territory and economy before and after 2014, government budget expenditures and revenues are divided by the number of population (even if that measure means relatively small changes compared to the movements of government expenditures and revenues themselves).
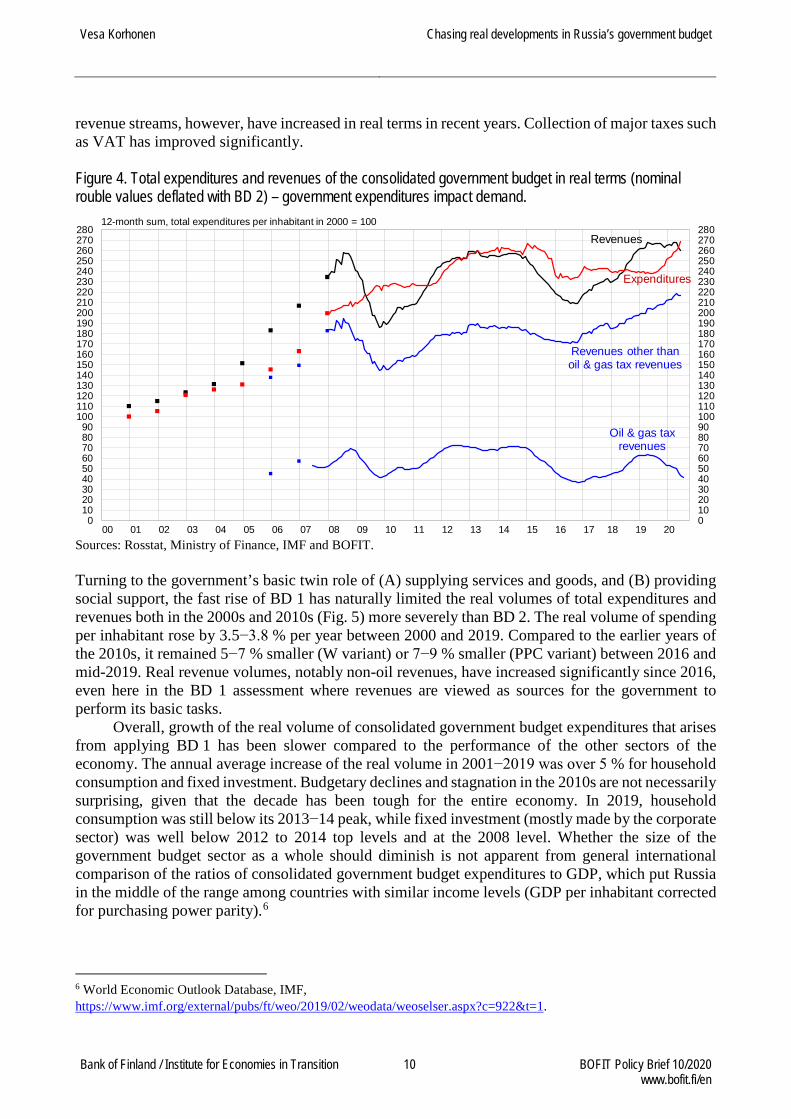
Looking at the impact of the government budget sector on demand in the economy, nominal growth of spending and revenues of Russia’s consolidated government budget (federal, regional and local budgets, as well as state social funds) was strong enough to exceed significantly the rise of BD 2 until the recession of 2009 (Fig. 4). After another rise, real total volumes per inhabitant virtually flattened in 2013. Acceleration of inflation on all price fronts of BD 2 brought the real volumes down severely in 2015, while relatively stringent spending practices thereafter kept real expenditures at new lows until 2019. Lower inflation and increases in nominal spending have helped real spending revive fast more recently. Thanks to the rise up to 2013, the real volume of spending per inhabitant on average rose at 5 % per year between 2000 and 2019.
The oil and gas sectors are subject to special taxes on production and exports that have only provided flat real revenue streams for over a decade even in our relatively mild BD 2 deflation approach (of course, with deviations that track swings in world market oil prices). Other budget
0
100
200
300
400
500
600
700
800
900
1000
0
100
200
300
400
500
600
700
800
900
1000
00 02 04 06 08 10 12 14 16 18 20
2000=100
BD 1. Government supplies services & goods andprovides social support,built with W (lower line) and PPC (higher line)
BD 2. Governmentbudget expenditures
impact demand
BD 1.A Government supplies services & goods,built with W (lower line) and PPC (higher line)
BD 1.B Government provides social support
Vesa Korhonen
Chasing real developments in Russia’s government budget
Bank of Finland / Institute for Economies in Transition 10 BOFIT Policy Brief 10/2020 www.bofit.fi/en
revenue streams, however, have increased in real terms in recent years. Collection of major taxes such as VAT has improved significantly. Figure 4. Total expenditures and revenues of the consolidated government budget in real terms (nominal rouble values deflated with BD 2) – government expenditures impact demand.
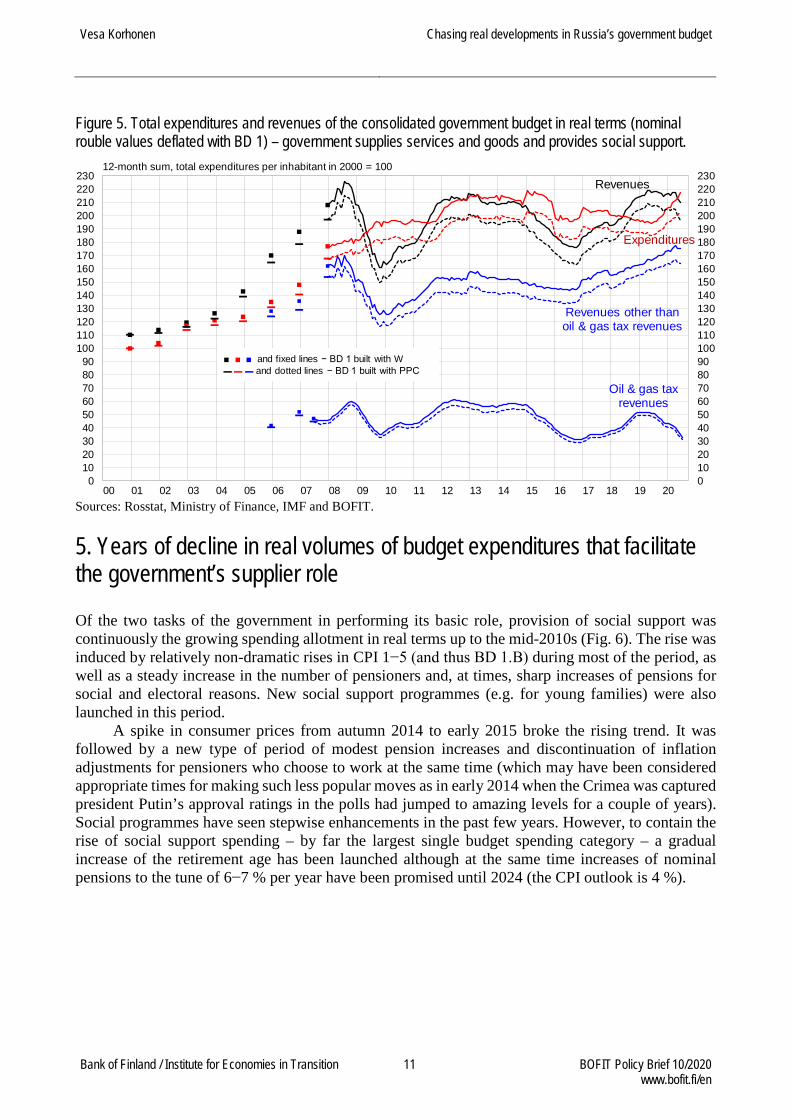
Sources: Rosstat, Ministry of Finance, IMF and BOFIT. Turning to the government’s basic twin role of (A) supplying services and goods, and (B) providing social support, the fast rise of BD 1 has naturally limited the real volumes of total expenditures and revenues both in the 2000s and 2010s (Fig. 5) more severely than BD 2. The real volume of spending per inhabitant rose by 3.5−3.8 % per year between 2000 and 2019. Compared to the earlier years of the 2010s, it remained 5−7 % smaller (W variant) or 7−9 % smaller (PPC variant) between 2016 and mid-2019. Real revenue volumes, notably non-oil revenues, have increased significantly since 2016, even here in the BD 1 assessment where revenues are viewed as sources for the government to perform its basic tasks.
Overall, growth of the real volume of consolidated government budget expenditures that arises from applying BD 1 has been slower compared to the performance of the other sectors of the economy. The annual average increase of the real volume in 2001−2019 was over 5 % for household consumption and fixed investment. Budgetary declines and stagnation in the 2010s are not necessarily surprising, given that the decade has been tough for the entire economy. In 2019, household consumption was still below its 2013−14 peak, while fixed investment (mostly made by the corporate sector) was well below 2012 to 2014 top levels and at the 2008 level. Whether the size of the government budget sector as a whole should diminish is not apparent from general international comparison of the ratios of consolidated government budget expenditures to GDP, which put Russia in the middle of the range among countries with similar income levels (GDP per inhabitant corrected for purchasing power parity).6
6 World Economic Outlook Database, IMF, https://www.imf.org/external/pubs/ft/weo/2019/02/weodata/weoselser.aspx?c=922&t=1.
0102030405060708090100110120130140150160170180190200210220230240250260270280
0102030405060708090
100110120130140150160170180190200210220230240250260270280
00 01 02 03 04 05 06 07 08 09 10 11 12 13 14 15 16 17 18 19 20
12-month sum, total expenditures per inhabitant in 2000 = 100
Revenues other thanoil & gas tax revenues
Oil & gas taxrevenues
Expenditures
Revenues
Vesa Korhonen
Chasing real developments in Russia’s government budget
Bank of Finland / Institute for Economies in Transition 11 BOFIT Policy Brief 10/2020 www.bofit.fi/en
Figure 5. Total expenditures and revenues of the consolidated government budget in real terms (nominal rouble values deflated with BD 1) – government supplies services and goods and provides social support.
Sources: Rosstat, Ministry of Finance, IMF and BOFIT. 5. Years of decline in real volumes of budget expenditures that facilitate the government’s supplier role
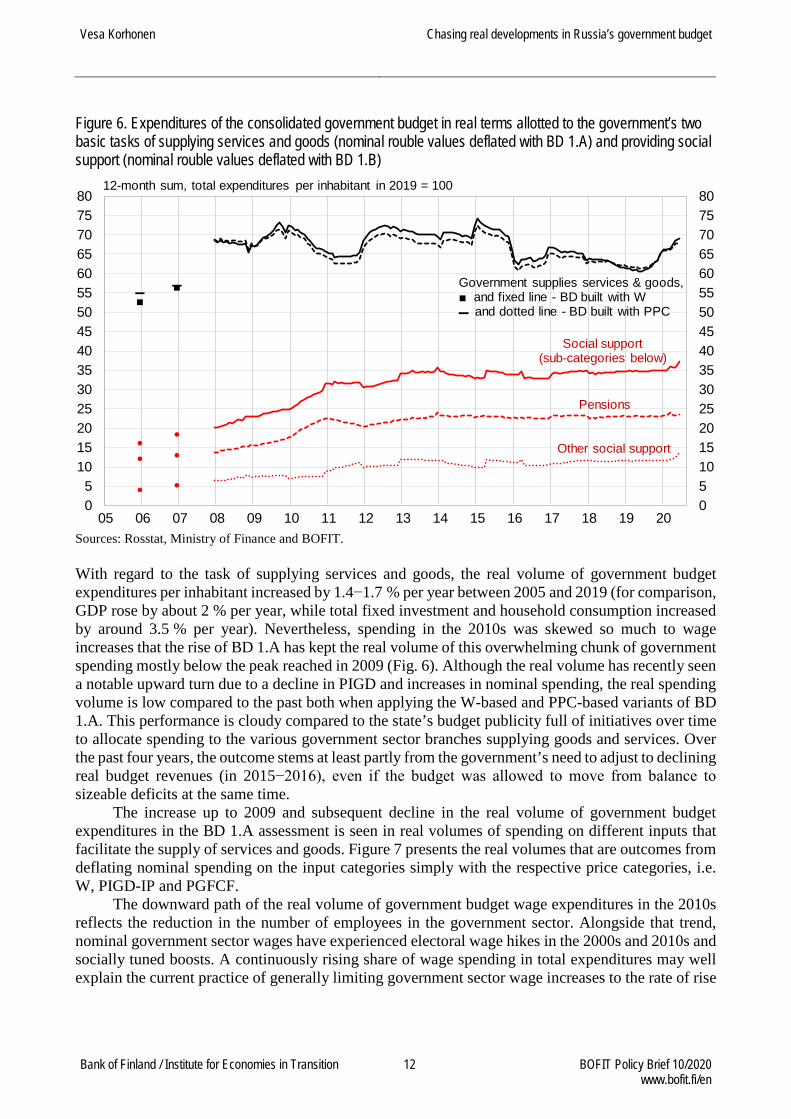
Of the two tasks of the government in performing its basic role, provision of social support was continuously the growing spending allotment in real terms up to the mid-2010s (Fig. 6). The rise was induced by relatively non-dramatic rises in CPI 1−5 (and thus BD 1.B) during most of the period, as well as a steady increase in the number of pensioners and, at times, sharp increases of pensions for social and electoral reasons. New social support programmes (e.g. for young families) were also launched in this period.
A spike in consumer prices from autumn 2014 to early 2015 broke the rising trend. It was followed by a new type of period of modest pension increases and discontinuation of inflation adjustments for pensioners who choose to work at the same time (which may have been considered appropriate times for making such less popular moves as in early 2014 when the Crimea was captured president Putin’s approval ratings in the polls had jumped to amazing levels for a couple of years). Social programmes have seen stepwise enhancements in the past few years. However, to contain the rise of social support spending – by far the largest single budget spending category – a gradual increase of the retirement age has been launched although at the same time increases of nominal pensions to the tune of 6−7 % per year have been promised until 2024 (the CPI outlook is 4 %).
0102030405060708090100110120130140150160170180190200210220230
0102030405060708090
100110120130140150160170180190200210220230
00 01 02 03 04 05 06 07 08 09 10 11 12 13 14 15 16 17 18 19 20
12-month sum, total expenditures per inhabitant in 2000 = 100
Revenues other thanoil & gas tax revenues
Oil & gas taxrevenues
Expenditures
Revenues
■ ■ ■ and fixed lines − BD 1 built with W▬ ▬ ▬ and dotted lines − BD 1 built with PPC
Vesa Korhonen
Chasing real developments in Russia’s government budget
Bank of Finland / Institute for Economies in Transition 12 BOFIT Policy Brief 10/2020 www.bofit.fi/en
Figure 6. Expenditures of the consolidated government budget in real terms allotted to the government’s two basic tasks of supplying services and goods (nominal rouble values deflated with BD 1.A) and providing social support (nominal rouble values deflated with BD 1.B)
Sources: Rosstat, Ministry of Finance and BOFIT. With regard to the task of supplying services and goods, the real volume of government budget expenditures per inhabitant increased by 1.4−1.7 % per year between 2005 and 2019 (for comparison, GDP rose by about 2 % per year, while total fixed investment and household consumption increased by around 3.5 % per year). Nevertheless, spending in the 2010s was skewed so much to wage increases that the rise of BD 1.A has kept the real volume of this overwhelming chunk of government spending mostly below the peak reached in 2009 (Fig. 6). Although the real volume has recently seen a notable upward turn due to a decline in PIGD and increases in nominal spending, the real spending volume is low compared to the past both when applying the W-based and PPC-based variants of BD 1.A. This performance is cloudy compared to the state’s budget publicity full of initiatives over time to allocate spending to the various government sector branches supplying goods and services. Over the past four years, the outcome stems at least partly from the government’s need to adjust to declining real budget revenues (in 2015−2016), even if the budget was allowed to move from balance to sizeable deficits at the same time.
The increase up to 2009 and subsequent decline in the real volume of government budget expenditures in the BD 1.A assessment is seen in real volumes of spending on different inputs that facilitate the supply of services and goods. Figure 7 presents the real volumes that are outcomes from deflating nominal spending on the input categories simply with the respective price categories, i.e. W, PIGD-IP and PGFCF.
The downward path of the real volume of government budget wage expenditures in the 2010s reflects the reduction in the number of employees in the government sector. Alongside that trend, nominal government sector wages have experienced electoral wage hikes in the 2000s and 2010s and socially tuned boosts. A continuously rising share of wage spending in total expenditures may well explain the current practice of generally limiting government sector wage increases to the rate of rise
05101520253035404550556065707580
05
101520253035404550556065707580
05 06 07 08 09 10 11 12 13 14 15 16 17 18 19 20
12-month sum, total expenditures per inhabitant in 2019 = 100
Social support(sub-categories below)
Pensions
Other social support
Government supplies services & goods,■ and fixed line - BD built with W▬ and dotted line - BD built with PPC
Vesa Korhonen
Chasing real developments in Russia’s government budget
Bank of Finland / Institute for Economies in Transition 13 BOFIT Policy Brief 10/2020 www.bofit.fi/en
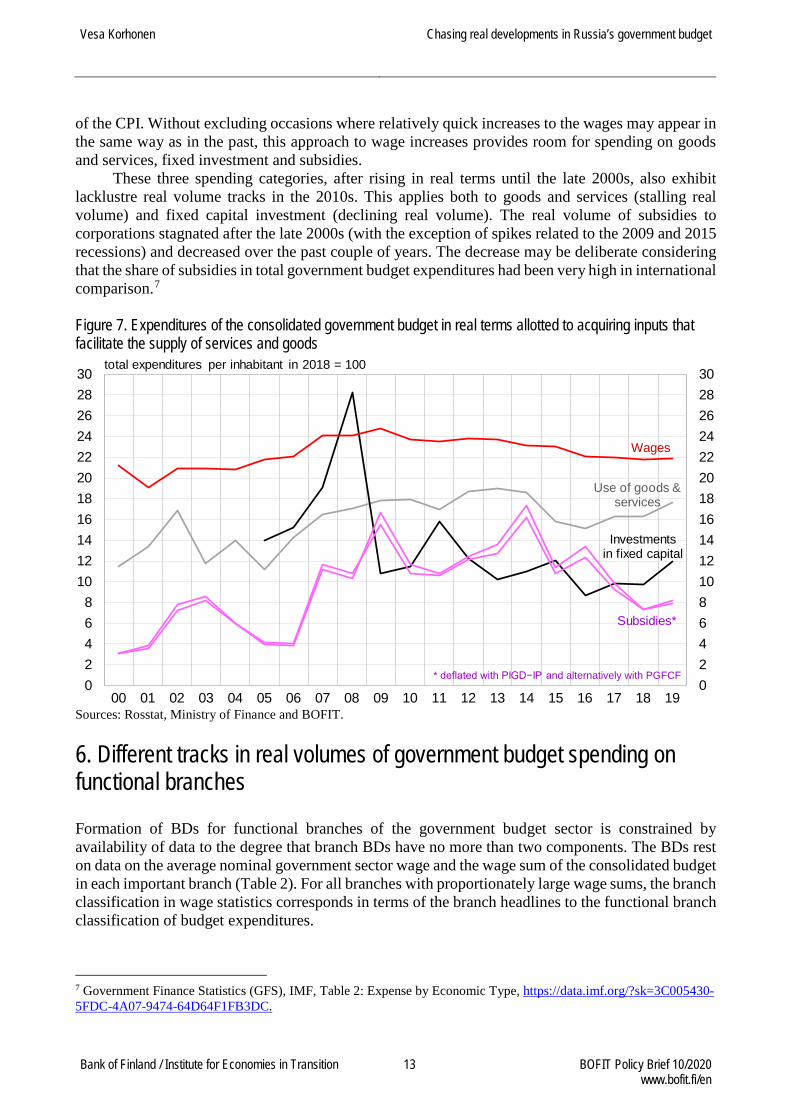
of the CPI. Without excluding occasions where relatively quick increases to the wages may appear in the same way as in the past, this approach to wage increases provides room for spending on goods and services, fixed investment and subsidies.
These three spending categories, after rising in real terms until the late 2000s, also exhibit lacklustre real volume tracks in the 2010s. This applies both to goods and services (stalling real volume) and fixed capital investment (declining real volume). The real volume of subsidies to corporations stagnated after the late 2000s (with the exception of spikes related to the 2009 and 2015 recessions) and decreased over the past couple of years. The decrease may be deliberate considering that the share of subsidies in total government budget expenditures had been very high in international comparison.7
Figure 7. Expenditures of the consolidated government budget in real terms allotted to acquiring inputs that facilitate the supply of services and goods
Sources: Rosstat, Ministry of Finance and BOFIT. 6. Different tracks in real volumes of government budget spending on functional branches
Formation of BDs for functional branches of the government budget sector is constrained by availability of data to the degree that branch BDs have no more than two components. The BDs rest on data on the average nominal government sector wage and the wage sum of the consolidated budget in each important branch (Table 2). For all branches with proportionately large wage sums, the branch classification in wage statistics corresponds in terms of the branch headlines to the functional branch classification of budget expenditures.
7 Government Finance Statistics (GFS), IMF, Table 2: Expense by Economic Type, https://data.imf.org/?sk=3C005430-5FDC-4A07-9474-64D64F1FB3DC.
024681012141618202224262830
02468
1012141618202224262830
00 01 02 03 04 05 06 07 08 09 10 11 12 13 14 15 16 17 18 19
total expenditures per inhabitant in 2018 = 100
Investmentsin fixed capital
Use of goods & services
Subsidies*
* deflated with PIGD−IP and alternatively with PGFCF
Wages
Vesa Korhonen
Chasing real developments in Russia’s government budget
Bank of Finland / Institute for Economies in Transition 14 BOFIT Policy Brief 10/2020 www.bofit.fi/en
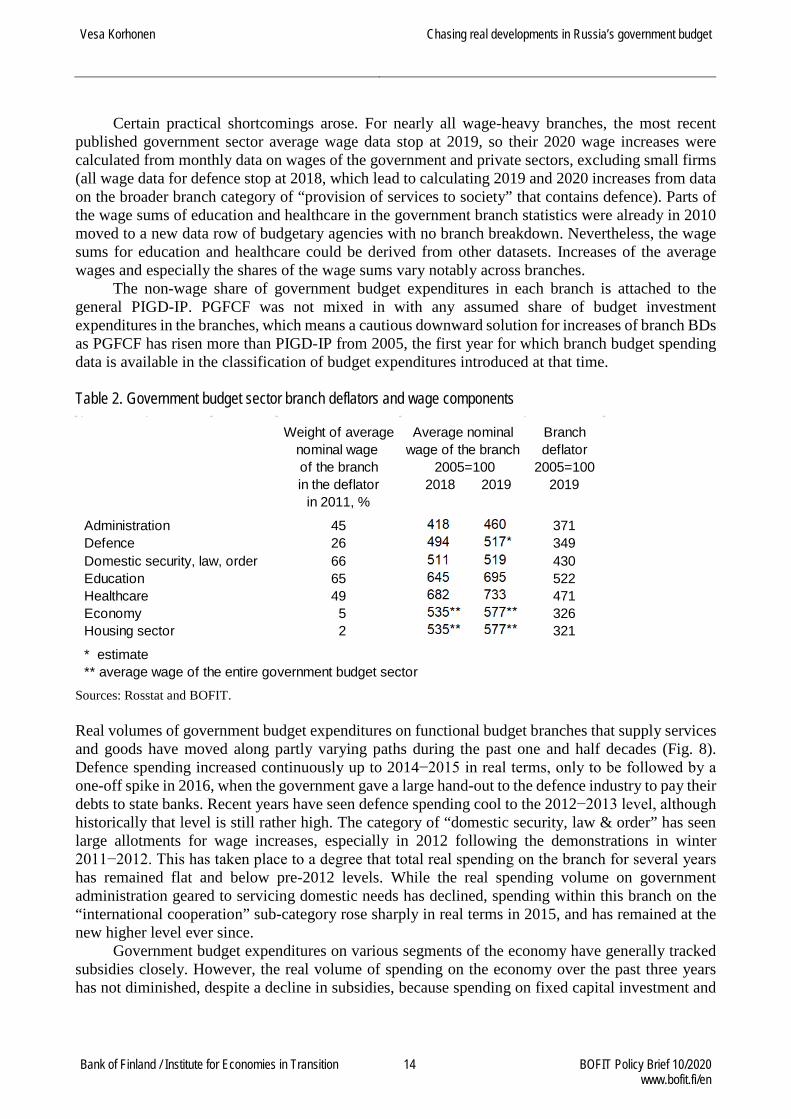
Certain practical shortcomings arose. For nearly all wage-heavy branches, the most recent published government sector average wage data stop at 2019, so their 2020 wage increases were calculated from monthly data on wages of the government and private sectors, excluding small firms (all wage data for defence stop at 2018, which lead to calculating 2019 and 2020 increases from data on the broader branch category of “provision of services to society” that contains defence). Parts of the wage sums of education and healthcare in the government branch statistics were already in 2010 moved to a new data row of budgetary agencies with no branch breakdown. Nevertheless, the wage sums for education and healthcare could be derived from other datasets. Increases of the average wages and especially the shares of the wage sums vary notably across branches.
The non-wage share of government budget expenditures in each branch is attached to the general PIGD-IP. PGFCF was not mixed in with any assumed share of budget investment expenditures in the branches, which means a cautious downward solution for increases of branch BDs as PGFCF has risen more than PIGD-IP from 2005, the first year for which branch budget spending data is available in the classification of budget expenditures introduced at that time. Table 2. Government budget sector branch deflators and wage components
Sources: Rosstat and BOFIT. Real volumes of government budget expenditures on functional budget branches that supply services and goods have moved along partly varying paths during the past one and half decades (Fig. 8). Defence spending increased continuously up to 2014−2015 in real terms, only to be followed by a one-off spike in 2016, when the government gave a large hand-out to the defence industry to pay their debts to state banks. Recent years have seen defence spending cool to the 2012−2013 level, although historically that level is still rather high. The category of “domestic security, law & order” has seen large allotments for wage increases, especially in 2012 following the demonstrations in winter 2011−2012. This has taken place to a degree that total real spending on the branch for several years has remained flat and below pre-2012 levels. While the real spending volume on government administration geared to servicing domestic needs has declined, spending within this branch on the “international cooperation” sub-category rose sharply in real terms in 2015, and has remained at the new higher level ever since.
Government budget expenditures on various segments of the economy have generally tracked subsidies closely. However, the real volume of spending on the economy over the past three years has not diminished, despite a decline in subsidies, because spending on fixed capital investment and
Weight of average Average nominal Branchnominal wage wage of the branch deflatorof the branch 2005=100 2005=100in the deflator 2018 2019 2019
in 2011, %
Administration 45 460 371Defence 26 517* 349Domestic security, law, order 66 519 430Education 65 695 522Healthcare 49 733 471Economy a 5 577** 326Housing sector a 2 577** 321
* estimate** average wage of the entire government budget sector

Vesa Korhonen
Chasing real developments in Russia’s government budget
Bank of Finland / Institute for Economies in Transition 15 BOFIT Policy Brief 10/2020 www.bofit.fi/en
the use of goods and services has risen. The housing sector, where a considerable part of government budget spending goes to necessary infrastructure and the urban environment, has generally seen falling real spending volumes after the late 2000s. An upturn materialised in recent years when e.g. the City of Moscow started a programme to replace crumbling apartment buildings erected six decades ago.
Healthcare and education have been major decliners in terms of real volumes of budget spending since 2012 as growth of the spending has focused heavily on increases to wages which are major parts of budget spending in the two branches. Last year’s upturns are promising as they may entail more inputs into facilities that help improve healthcare and education.
While it goes beyond the purpose of this exercise to assess whether decreasing real volumes of government budget expenditures on individual budget branches are bad or natural developments, a few glimpses beyond the analysis of spending data can be appropriate. Numerous countries are engaged in policymaking processes that aim at increasing the role of the private sector in supplying services in certain segments of the economy, e.g. the housing sector, healthcare and education, while in some countries the prospects for tackling shortfalls in healthcare, education and care for the environment look meagre without reasonable amounts of government funding. Government administrations may be too large or too small – and at the same time have underdeveloped capabilities. Defence and domestic security structures may have become overdimensioned empires.
To the extent that reference is provided by structures of government budget expenditures in the eleven newest EU member countries,8 as well as global comparisons of the burden of defence spending on the government budget and the economy,9 government spending in Russia should focus less on the economy, defence and domestic security, and more on healthcare and the environment. Figure 8. Expenditures of the consolidated government budget in real terms allotted to the main government branches supplying services and goods
Sources: Rosstat, Ministry of Finance and BOFIT.
8 Government revenue, expenditure and main aggregates, Eurostat, https://appsso.eurostat.ec.europa.eu/nui/show.do?dataset=gov_10a_main&lang=en. 9 SIPRI Military Expenditure Database, https://www.sipri.org/databases/milex.
0
2
4
6
8
10
12
14
16
18
0
2
4
6
8
10
12
14
16
18
05 06 07 08 09 10 11 12 13 14 15 16 17 18 19 20
Defence
Domestic security, law, order
Economy
Housing sector
HealthcareEducation
Administration excl. expenditures on international cooperation
Economy incl.bank capital pack
12-month sum, total expenditures per inhabitant in 2019 = 100
Defence incl. lump sumto defence industry forrepaying bank debts
Vesa Korhonen
Chasing real developments in Russia’s government budget
Bank of Finland / Institute for Economies in Transition 16 BOFIT Policy Brief 10/2020 www.bofit.fi/en
7. Summary of results
Application of the budget deflators built in this exercise to deflate Russia’s consolidated nominal budget expenditures show that the real volume of total government spending rose between 2000 and 2012−2014. Spending declined thereafter, remaining at considerably lower levels until 2019. This rise and fall are valid both when assessing (1) the government’s basic twin role in supplying services and goods and providing social support, and (2) the impact of spending on demand in the economy. However, the rise of the real volume of spending in (1) is lower, around 100 % in 2001−2019 (slightly over 3.5 % per year) than the rise of 150 % (5 % per year) in (2). This is because wage expenditures of the budget have faced major increases of nominal wages in the budget sector under the (1) approach, but a much more reasonably rising CPI under the (2) approach.
The separate outcome for the real volume of government spending to facilitate supply of services and goods is even weaker than in the entire (1) above. The real volume reached its peak as early as 2009 and then remained below that peak for most of the 2010s. In addition, the lows of the latest years compared to the levels of 2012−2014 are much deeper. In the 2006−2019 period (for which comparable data are available), the real volume only rose at around 1.5 % per year.
Real volumes of government expenditures on the functional branches have partly developed in different ways. In the 2010s, defence spending grew while budget funding for branches of the economy mostly hovered around the 2010−2011 level. Expenditures on education and healthcare decreased after 2012. Unlike spending on supplying services and goods, the real volume of social support expenditures only peaked near the mid-2010s and has remained relatively steady at that level ever since.
Compared to the readily available (and more commonly used) CPI to transform Russia’s nominal government budget expenditures and revenues into their real volumes, the two alternative budget deflators built in the (1) approach give considerably bleaker results. Starting from 2000, the real volume of spending to fulfil the twin role of (1) is around 15−20 % smaller in 2009−2010 and 20−25 % smaller from 2012 onwards than the real volume obtained with CPI. The level of the GDP deflator over time is fairly close to these two budget deflators. However, the GDP deflator contains a large share of export prices. Due especially to swings in export prices, the GDP deflator has shown changes in several years that are quite different from changes of the budget deflators to a degree that it appears strongly misleading to use the GDP deflator mechanically as a government budget deflator when making assessments of short-term developments of real volumes of budget expenditures.
Vesa Korhonen
Chasing real developments in Russia’s government budget
Bank of Finland / Institute for Economies in Transition 17 BOFIT Policy Brief 10/2020 www.bofit.fi/en
Data sources
Revenues and expenditures of the consolidated budget / general government
Краткая информация об исполнении консолидированного бюджета Российской Федерации и государственных внебюджетных фондов, накоплено с начала года, Министерство финансов Российской Федерации, https://www.minfin.ru/ru/statistics/conbud/.
Консолидированный бюджет Российской Федерации и бюджетов государственных внебюджетных фондов, Федеральное казначейство (Казначейство России), http://www.roskazna.ru/ispolnenie-byudzhetov/konsolidirovannyj-byudzhet/.
Government Finance Statistics (GFS), IMF, Table 2. Expense by economic type, https://data.imf.org/regular.aspx?key=60991457 and Table 3. Transactions in assets and liabilities, https://data.imf.org/regular.aspx?key=61042576.
Статистика государственных финансов РФ, Федеральное казначейство (Казначейство России) http://www.roskazna.ru/ispolnenie-byudzhetov/statistika-gosudarstvennykh-finansov-rf/.
For total revenues and expenditures of the consolidated government budget (general government) in 1998–2004, World Economic Outlook Database, IMF, https://www.imf.org/external/pubs/ft/weo/2019/02/weodata/weoselser.aspx?c=922&t=1.
For consolidated federal and regional budget expenditures, СОЦИАЛЬНО-ЭКОНОМИЧЕСКИЕ ПОКАЗАТЕЛИ РОССИЙСКОЙ ФЕДЕРАЦИИ В 1991-2018 гг., Федеральная служба государственной статистики (Росстат), https://gks.ru/bgd/regl/b19_13pr/Main.htm. Price components of government budget deflators
Consumer prices and prices of industrial goods supplied to domestic users Информация, публикуемая в соответствии с ССРД МВФ − Россия. Специальный Стандарт Распространения Данных, https://gks.ru/bgd/free/b00_24/IssWWW.exe/Stg/d000/I000650R.HTM and https://gks.ru/bgd/free/b00_24/IssWWW.exe/Stg/d000/I000750R.HTM.
Prices of public consumption, prices of gross fixed capital formation, and import prices (goods and services) Национальные счета − Использованный ВВП. Квартальные данные. Индекс-дефлятор без исключения сезонного фактора, в % к соответствующему кварталу предыдущего года, https://gks.ru/free_doc/new_site/vvp/kv/tab32.htm.
Nominal wages of the government budget sector and government budget sector branches Единая межведомственная информационно – статистическая система (ЕМИСС), https://fedstat.ru/, Среднемесячная номинальная начисленная заработная плата на одного работника по полному кругу организаций.
Vesa Korhonen
Chasing real developments in Russia’s government budget
Bank of Finland / Institute for Economies in Transition 18 BOFIT Policy Brief 10/2020 www.bofit.fi/en
For nominal average wage of the government budget sector in 2020, Среднемесячная номинальная начисленная заработная плата работников организаций по видам экономической деятельности в Российской Федерации за 2000-2019 гг., https://www.gks.ru/labor_market_employment_salaries For nominal average wages of government budget sector branches in 2020 (for the defence branch, in 2019 and 2020), Единая межведомственная информационно – статистическая система (ЕМИСС), https://fedstat.ru/, Среднемесячная номинальная начисленная заработная плата работников организаций (без субъектов малого предпринимательства) с 2017 г. Weights of the price components of government budget deflators
Expenditures of the general government, economic classification Government Finance Statistics (GFS), IMF, Table 2: Expense by Economic Type, https://data.imf.org/regular.aspx?key=60991457 and Table 3: Transactions in assets and liabilities, https://data.imf.org/regular.aspx?key=61042576.
Wage sums of government budget sector branches Национальные счета России, РАСХОДЫ НА КОНЕЧНОЕ ПОТРЕБЛЕНИЕ СЕКТОРА ГОСУДАРСТВЕННОГО УПРАВЛЕНИЯ ПО ФУНКЦИЯМ, https://gks.ru/bgd/regl/b19_15/Main.htm.
For wage sums of government budget sector branches of education and healthcare Национальные счета России, ОПЛАТА ТРУДА НАЕМНЫХ РАБОТНИКОВ ПО ОТРАСЛЯМ И СЕКТОРАМ, https://gks.ru/bgd/regl/b19_15/Main.htm. Единая межведомственная информационно – статистическая система (ЕМИСС), https://fedstat.ru/, Фонд начисленной заработной платы работников по полному кругу организаций за отчетный период; Базовые таблицы «затраты-выпуск» Российской Федерации за 2011 год, https://www.gks.ru/accounts.
BOFIT Policy Brief https://www.bofit.fi/fi/julkaisut/policy-brief/
2016 No 1 Riku Niemi: The Eurasian Union – much potential, little results No 2 Andrei Yakovlev: What is Russia trying to defend? No 3 Andrei Yakovlev, Lev Freinkman and Anton Zolotov: Domestic and external factors in the development of Russia’s economic
think tanks sector No 4 Mikko Mäkinen: Nowcasting of Russian GDP growth
No 5 Iikka Korhonen, Tuomas Forsberg, Vesa Korhonen ja Heli Simola: BOFIT Venäjä-tietoisku 2016 No 6 Heli Simola: Economic relations between Russia and China – Increasing inter-dependency? No 7 Ivan Lyubimov: Are educational reforms necessarily growth-enhancing? Weak institutions as the cause of policy failure No 8 Laura Solanko: Opening up or closing the door for foreign trade – Russia and China compared No 9 Heli Simola ja Vesa Korhonen: Arktisen alueen taloudellinen merkitys Venäjälle No 10 Masaaki Kuboniwa: Estimating GDP and foreign rents of the oil and gas sector in the USSR then and Russia now No 11 Masaaki Kuboniwa: Considerations on new Rosstat data on the contribution of Russia’s military goods sector to GDP growth in
recent years
2017 No 1 Jouko Rautava: Kiinassa talouspolitiikka ei pysy maan muutosten vauhdissa No 2 Heli Simola: China’s growing role in global production boosted by strong competitiveness – evidence from international input-output tables No 3 Heli Simola ja Laura Solanko: Katsaus Venäjän öljy- ja kaasusektoriin No 4 Heli Simola: Chinese production chains rely increasingly on domestic services No 5 Heli Simola and Laura Solanko: Overview of Russia’s oil and gas sector No 6 K.C. Fung, Nathalie Aminian, Iikka Korhonen and Keith Wong: The Chinese yuan: Influence of interest groups examined No 7 Päivi Määttä: Meeting the challenges of impact measurement No 8 Caroline Stern, Mikko Mäkinen and Zongxin Qian: FinTechs in China – with a special focus on peer to peer lending No 9 Iikka Korhonen and Riikka Nuutilainen: Breaking monetary policy rules in Russia No 10 Andrei Yakovlev, Lev Freinkman, Sergey Makarov and Victor Pogodaev: In response to external shocks: How advanced
Russian regions react to changes in federal policies – Experience of Tatarstan
2018 No 1 Ivan Lyubimov and Maria Lysyuk: Schooling ain’t learning in Russia either: High level of student employment as an indicator for slow human capital accumulation
No 2 Jouko Rautava: Intian nopea kasvu ei vähennä reformien tarvetta No 3 Eeva Kerola: Hongkongin talous on vahvasti kytkeytynyt Manner-Kiinaan No 4 Iikka Korhonen, Heli Simola and Laura Solanko: Sanctions, counter-sanctions and Russia − Effects on economy, trade and finance No 5 Andrei Yakovlev, Lev Freinkman and Nina Ershova: Channels of dialogue between international businesses and national governments: The implications for domestic reforms and international relations in the case of Russia No 6 Helmut Wagner: Structural change, rebalancing, and the danger of a middle-income trap in China No 7 Wing Thye Woo: A U.S. perspective on China’s external economic disputes in the past 40 years and in the coming 40 years No 8 Nigel Gould-Davies: Economic effects and political impacts: Assessing Western sanctions on Russia No 9 Jouko Rautava: Kiina ja Venäjä – eripariset talouskumppanukset No 10 Sergey Vlasov and Mariam Mamedli: Russia’s pension system in the context of world experience and expected trends No 11 Riikka Nuutilainen: Juanin kansainvälistyminen ei etene suoraviivaisesti
2019 No 1 Mariya Hake and Alice Radzyner: Western Balkans: Growing economic ties with Turkey, Russia and China No 2 Iikka Korhonen: Sanctions and counter-sanctions – What are their economic effects in Russia and elsewhere? No 3 Carsten Sprenger and Srdjan Todorović: Corporate Governance of the Largest Russian Banks No 4 Heli Simola: Effects of external shocks on Russian economy
2020 No 1 Laura Solanko: From reforms to stagnation – 20 years of economic policies in Putin’s Russia No 2 Riikka Nuutilainen and Jouko Rautava: Russia and the slowdown of the Chinese economy No 3 Le Xia: Lessons from China’s past banking bailouts No 4 Heli Simola: CO2 emissions embodied in EU-China trade and carbon border tax No 5 Jouko Rautava: Protektionismi ja uudistusvastaisuus estävät Intian nousun keskeiseksi globaaliksi taloustoimijaksi No 6 Heli Simola and Laura Solanko: Domestic and global economic effects of corona containment measures - Russia in international
comparison No 7 Heli Simola: Venäjän talous koronan kourissa No 8 Christian Alexander Belabed and Thomas Theobald: Why the Chinese recovery will slow – some lessons from sectoral data No 9 Risto Herrala: Capital controls in an integrated world: A review of recent developments, policies and the academic debate No 10 Vesa Korhonen: Chasing developments in Russia’s government budget
http://www.bofit.fi • email: [email protected]
ISSN 2342-205X