Embed Size (px)
Citation preview

BOILER COFIRING OF CHLORINATED HYDROCARBONS
RAVI SRIVASTAVA, MARK WALTON AND LARRY HAMEL
Acurex Corporation
Energy and Environmental Division Research Triangle Park, North Carolina
ABSTRACT
Steady state and transient operating conditions were examined to determine the destruction and removal
efficiencies (DRE) for the principal organic hazardous constituents (POHC) when cofiring liquid hazardous
waste in a firetube package boiler. Results indicate that aromatic chIoro-hydrocarbons are the most difficult to destroy. A DRE less than 99.99% was experienced for transient operating conditions in load, stoichiometry, and waste feed rate. Steady operation above 10% excess air ensures DRE's greater than 99.99%. Major products of incomplete combustion (PIC's) seen were methylene chloride and chloroform.
INTRODUCTION
Management of hazardous waste, which is generated
in the U.S. at an annual rate of 265 million metric tons (0.58 million lb)[ 1-3], is a growing environmental concern. Stringent control over transportation and storage of these wastes, under the Resource Conser
vation and Recovery Act (RCRA) and subsequent land disposal restrictions under the Hazardous and Solid Waste Act (HSWA) of 1984, provide incentives
for ultimate waste destruction techniques such as in
cineration.
Thermal destruction of hazardous waste is an attractive alternative to landfilling and is likely to grow
367
JOHN H. WASSER Environmental Protection Agency
Air and Energy Engineering Laboratory Research Triangle Park, North Carolina
in the future [2, 4-7]. Thermal destruction can be achieved by direct incineration or by cofiring hazardous waste in industrial boilers, furnaces, and kilns. Direct incineration of hazardous wastes is regulated by Part 264 of the RCRA, however, boiler cofiring, with subsequent energy recovery in some cases, is currently exempt from RCRA provisions. This exemption was based on the absence of a sufficient database on the practice, and because the byproduct of energy recovery is an attractive option. The incineration rules are designed to limit atmospheric emissions, and specifically mandate that principal organic hazardous constituents (POHCs) in waste must exhibit a destruction and removal efficiency (DRE) of � 99.99%. The DRE is defined as:
where Mfeed = mass flow rate of a POHC in the waste
Ms�ck = stack mass emission of a POHC
POHCs are the compounds listed in Appendix VIII of the May 1980 RCRA amendments and have significant concentrations in the waste.
Cocombustion or cofiring of hazardous wastes with
conventional fuels in industrial boilers is widely practiced in the U.S. as many wastes have significant heating values. The options of energy recovery,

conventional fuel saving, and on-site waste disposal are attractive. Many studies on the practice have examined the dependence of DRE on the boiler operation parameters and waste characteristics [8, 10]. Widely
practiced waste cofiring has increased the availability
of a database. With the growing concern over possible environmental impact, EPA is developing regulations to cover this practice; these regulations have been proposed in May 1987 (40 CRF Part 260 et al.). There still remains a need to characterize DRE during co
firing under nonstandard and transient conditions. Such conditions could be the result of facility startup, soot blowing, load change, hardware malfunction, overcharging, etc., and could lead to failure modes of
operation where DRE is less than 99.99%. Some studies have been conducted under these conditions, yet the database needs to be expanded [11].
This paper is a result of a study sponsored by EPA's Combustion Research Branch in the Air and Energy Engineering Research Laboratory (AEERL) to examine the effects of boiler cofiring of hazardous waste on emissions, including those under nonstandard and/ or treatment boiler conditions.
EXPERIMENTAL FACILITY AND METHODS
The primary component of the test facility (see Fig. 1) was a North American Atlas brand, 0.8 MW (2.7 million Btu/hr), three-pass firetube package boiler capable of firing either fuel oil mixtures and/or natural gas. The boiler support systems were designed for independent control of combustion air, fuel( s), and air atomization. The boiler load was passed to a shell and tube heat exchanger, which subsequently transferred the load to an evaporative cooling tower loop.
Another major component of the test facility was the surrogate waste feed system. The waste mixture was contained in a steel drum, which was located on an electronic weigh scale for measurement of average waste consumption rates. From the drum the waste
mixture was pumped into the boiler through a volume flowmeter and a manual flowmetering valve.
Stack concentrations of O2, CO2, CO, and NO were measured by a Continuous Emissions Monitoring System (CEMS).
A variation of the Volatile Organic Sampling Train
(VOST) procedure, called mini-VOST [12], was used to characterize the stack emissions of chlorinated hydrocarbons. Ten liter samples, in duplicate, were taken
for the various data points. Tenax tubes, used to absorb chlorinated hydrocarbons, were analyzed within 24 hr of sampling.
368
APPROACH
The primary boiler fuel used was natural gas. Initially, boiler gaseous emissions were characterized un
der baseline (no POHC) cofiring steady state conditions. For POHC cofiring, the surrogate hazardous waste mixture used was 95% distillate fuel oil and
2% by weight each of carbon tetrachloride (CCI4), monochlorobenzene (MCB), and perchloroethylene (PCE). Carbon tetrachloride, MCB, and PCE, listed in Appendix VIII of the May 1980 RCRA amend
ments, were chosen to be the POHCs used in this study. The composition and the amount of waste mixture cofired with natural gas were based on the range of
heating values of the individual species and on the composition of hazardous waste mixtures encountered in previous field studies of boiler cofiring [13].
Under steady state cofiring conditions, the nominal
boiler operating parameters of stoichiometric ratio and firing rate were chosen to be 1.10 and 0.64 MW (2.2
million Btu/hr), respectively. The percentage of boiler heat input contributed by the waste mixture determined the fuel heating value. The nominal value for this parameter was chosen to be 25%, corresponding to a fuel higher heating value (HHV) of 51.8 MJ/kg (22.3 kBtu/lb). Subsequently, parametric tests were carried out to study the effect of boiler stoichiometric ratio, firing rate, fuel heating value, and degree of waste mixture atomization on the DRE under steady state nonstandard boiler operation. Further tests were carried out to characterize the effects of transient boiler operating conditions on the DRE. The transient boiler conditions of load, stoichiometric ratio, and waste flow rate were chosen for testing, as these transient con
ditions do occur in commercial practice. Products of incomplete combustion (PICs) could be
just as, or even more, harmful as POHCs, hence PICs were also screened during the analysis of the miniVOST samples.
RESULTS
DRE Versus Stoichiometric Ratio
The impact of stoichiometric ratio on DRE is depicted in Fig. 2. Operation at relatively low stoichio
metric ratios could lower DREs due to oxygen deficiency. On the other end, operation at relatively high stoichiometric ratios at constant load could lower the temperature of the boiler and decrease the com
bustion gas residence time, resulting in the decrease of the destruction of POHC's and lower DREs. Based on these counter-balancing effects, a maximum in the

c...>
0- \0
No
.2 f
ue
l fi
llin
g l
ine
F
low
me
ter
Pre
ss
ure
re
gu
lato
r
Mix
er W
eig
h
sc
ale
Co
mb
us
tio
n
Air
Air
Na
tura
l G
as
Fil
ter
Ve
nt
sy
ste
m
Dig
ita
l w
eig
hm
ete
r
Liq
uid
fe
ed
>
> -
- . �
)
""'
Pre
ss
ure
reli
ef
ch
ec
k
Flo
wm
ete
rin
g v
alv
e
-Sa
mp
le v
alv
e
valv
e
I I
Dri
p p
an
Re
cir
cu
lati
on
lin
e
So
len
oid
va
lve
VO
S
Wa
ter
Sta
ck
j�
�-r:
:
N ..
..... -
Iol ""'"
r
....,
\A.
""-"'
......
.... -"'"
� _
"'"
"\ �
'.,.
.-,..
vr'"",
-. ""
" ....... .:
. ..., -
_v::..-v�
"";. �
-""
" ".. '"
..... �
�
,.. ..
.... J""t"
�'-
_N
�""_
""� �
/V.,-
, .. """""
" """"'�
_":.-. __ �"\".
......
.. -..
... '-"'
'''''''" ''
'''' _, .. _
.....
lsS;,
'S S
s, S \
S S S
, t, f\
s s
's s
, \
S g \ ,
r, ,
, t
G �
s S
Ex
ha
us
t li
ne
(ex
its
bu
ild
ing
)
He
ate
d
sa
mp
le
lin
e
Te
flo
n
sa
mp
le
lin
e
By
-pa
ss
an
d
Imp
ing
er
tra
in
Re
frig
era
tor
ga
s d
rye
r
"---- O
bs
erv
ati
on
po
rt/
cle
an
ou
t h
atc
h
FIG
. 1
E
XP
ER
IME
NT
AL
FA
CIL
ITY
02
an
aly
zer
CO
an
aly
zer
C0
2 a
na
lyze
r
Ro
om
air
De
sic
ca
nt
(Ca
So
4)
NO
x
L-.,-_..I' a
na
lyze
r
De
sic
ca
nt
(Ca
So
4)
Sa
mp
le
pu
mp
Ro
om
air
De
sic
ca
nt
(Ca
So
4)

99.99999 I I I ,
6 Firing Rate�70%, HHV=51.B MJ/kg (22.3 kBtu/lb) o Firing Rate=BO%, HHV=51.B MJ/kg (22.3 kBtu/lb)
0 Firing Rate�BO%, HHV=4B.B MJ/kg (21.0 kBtu/lb)
99.9999 - -
g6 Or:.
c � � '" .e 99.999 f- -
w 0: 0 II I 0 Q.
99.99 'fJ -
99.9 I I , ,
1.0 1.1 1.2 1.3 1.4 1.5
Stoichiometric Ratio (SA)
FIG. 2 POHC DRE VERSUS STOICHIOMETRIC
RATIO (SR)
DRE versus stoichiometric ratio (SR) curve would be expected. This trend is exhibited by the 80% firing rate and the 51.8 MJ /kg (22.3 kBtu/lb) higher heating value curve.
DRE Versus Firing Rate
An increase in the firing rate corresponds to a decrease in residence time of the combustion gases in the
boiler. This could, potentially, lead to a decrease in the DRE for POHC's. The results for this effect are plotted in Fig. 3. The effect is visible for all tested
combinations of stoichiometric ratio and higher heating values (HHV), except 1.1 and 51.8 MJ /kg (22.3 kBtu/hr), respectively. With 10% excess air and a
higher heating value of 51.8 MJ/kg (22.3 kBtu/hr),
perhaps the POHC destruction reaction kinetics are fast enough to mask the residence time effects.
370
c � � � .e, w 0: 0 II I 0 Q.
99.99999 I I
6 SR�1.1, HHV�51.8 MJlkg (22.3 kBlu/lb) CJ SR�1.1, HHV�4B.8 MJlkg (21.0 kBlullb)
0 SR�1.0, HHV�51.B MJlkg (22.3 kBlullb)
0 SA�1.0, HHV�4B.8 MJ/kg (21.0 kBlullb)
99.9999 - -CJ 6 6 60
0
CJ
99.999 r -
99.99 - 00 -
00
99.9 '---__ ..I..-_____ ...l-L-_ _ ___ -L-, _-,----...J
70 BO 90
Firing Rate (percent)
FIG. 3 POHC DRE VERSUS FIRING RATE
DRE Versus Fuel Heating Value (HHV)
The effect of decreasing the fuel heating value (by increasing the amount of low heating value waste con
tent in the fuel) at constant stoichiometric ratio and firing rate would be a decrease in the DRE via a decrease in the temperature of combustion gases. These trends are seen in Fig. 4. The DRE decrease, with a decrease in fuel heating value, is more dramatic for the case with a stoichiometric ratio of 1.0 perhaps due to additional effects of oxygen paucity.
DRE Versus Degree of Waste Mixture Atomization
The degree of atomization affects the combustion efficiency by decreasing/increasing the surface area of the fuel available for combustion. Poor atomization would lead to a decrease in surface area available for
combustion and would be expected to lower the POHC DREs. Two different atomization states were established for the waste mixture by creating two different atomizing air flows to the atomizing nozzle. One of
these states was "good" atomization and the other "poor," both of which were established visually. The

99.99999 I I I I
o SA: 1.0, Firing Aate:60%
"i1 SA: 1.1, Firing Aate:60%
99.9999 -
"i1
"i1
0 c " � " .e w II: 0 () :I: 0 0..
99.999 I-
99.99 I- 00
99.9 I I I I 48 49 50 51 52
Higher Heating Value (MJ/kg or xO.43 kBtu/lb)
FIG.4 POHC ORE VERSUS FUEL HEATING VALUE
-
-
-
atomization states were varied at nominal furnace conditions, and the results in Fig. 5 show the lowering of
DRE with deterioration in atomization quality of the waste mixture.
Transient Ramping of Firing Rate
Maintaining the stoichiometric ratio at 1.1 and the
waste flow rate constant under relatively good atomization conditions, the firing rate was ramped up from a baseline of 70% to about 90% and then ramped back down to 70%. The processes of ramping up and down were each completed at a constant rate in 15 min and during each ramping condition, mini-VOST samples were taken continuously over the entire period of the ramp. The test results are plotted in Fig. 6. On ramping
up, the residence time of the combustion gases decreases and the total POHC DRE drops slightly; on ramping down the reverse happens and DRE increases slightly. The effect, if any, between the two baseline
371
c � � � .e, w II: 0 () :I: 0 "-
99.99999
Firing Rete = 80% SA: 1.1 Waste Heat Input = 25%
99.9999 r- �
99.999 f-
99.99 f-
99.9
GOOD BAD
Atomization
FIG. 5 POHC ORE-GOO� ATOMIZATION VERSUS
POOR ATOMIZATION
-
-
-
DREs at the beginning of ramping up and the end of
ramping down is interesting and needs to be substantiated with more data.
The test results using a more rapid rate, 10 min rather than 15 min, are also plotted in Fig. 6. The difference in the two baselines (beginning and end of
transient conditions) seems to be greater, suggesting that perhaps the effects of lower residence times during
ramp up continued into the ramp down condition, with a greater degree during a relatively rapid transient phase. Thus, the time slope of the ramp up / ramp down condition seems to be related to DRE, but this needs to be substantiated by further study.
Transient Fluctuations in Stoichiometric Ratio
At nominal conditions of firing rate and waste heating value, the boiler stoichiometric ratio was varied
between 1.1 and 1.0 in a periodic manner. This was
done for two different wastes, corresponding to fuel mixture HHVs of 51.8 MJ/kg (22.3 kBtu/lb) and
48.8 MJ /kg (21.0 kBtu/lb). The test results are plot-

99.9999
99.999
99.99
99.9 Baseline FR:70% Waste
Ramp up/down ..
15x2=30 minutes
Aller Ramping Uplrom
Heal=51.2% Baseline
After Ramping Down 10 Baseline
Rapid Ramp up/down
.. 1Qx2=20 minutes
Baseline Aller FR"700J. Ramping Waste Uplrom Heat=S1.2% Baseline
Alter Ramp!ng Down to Baseline
FIG. 6 POHC ORE VERSUS RAM PING OF FIRING
RATE
ted in Fig. 7. Also plotted in Fig. 7, for comparison purposes, are the relevant baseline results. The decrease
in DRE during transient conditions could be attributed to the sensitivity of DRE to stoichiometric ratio. Also, the stoichiometric ratio may have gone down even below 1.0 during transient conditions, thus giving a DRE even lower than that at steady state and a stoichiometric ratio of 1.0. No trend seemed apparent on changing the waste heating value from 51.8 MJ/kg (22.3 kBtu/lb) to 48.8 MJ Ikg (21.0 kBtu/lb). It is worth noting that transient fluctuations in stoichiometric ratio could easily lower DRE values to below 99.99%, as indicated in Fig. 7.
Transient Fluctuations in Waste Flow Rate
Starting with nominal steady state operation of the boiler, the waste flow rate was varied in a periodic manner such that the waste heat input was between 30% and 25%. The test results are shown in Fig. 8.
Also plotted in Fig. E, for comparison, are the relevant baseline results. The variation in waste flow rate may have caused a combination of poor atomization (due
372
99.9999
0 99.999 � e � .e, w a: 0 () I 0 a.
99.99
99.9 Baseline Transient Baseline Baseline Transient Baseline
FR::800/0 SR FR=80% FR=80% SR FR::80%
SR=-1.1 SA=1.0 SA=1.1 SA=1.0
Waste Waste Waste Waste
Heal=2S% Heal=25% Heal=50% Heat=SO%
FIG.7 ORE VERSUS TRANSIENT FLUCTUATIONS IN
STOICHIOMETRIC RATIO
to pulsating flow to the nozzle) and oxygen deficiency per mole of POHC to decrease the DRE. It is worth noting that the POHC DRE went down below 99.99%
for the tests performed.
Individual POHC DRE Comparisons
To explore the effect of molecular structure of POHC on DRE, DREs for the individual POHC are cross-plotted in Figs. 9-11. These plots suggest that the PCE was destroyed more easily than CCI4, while
CCl4 was destroyed more easily than MCB. Thus MCB
seemed to be the hardest to destroy among the POHCs tested.
Performance Indicators (DRE versus NO, CO)
Carbon monoxide (CO) and nitric oxide (NO) are emitted from all combustion systems in varying amounts. As CO is an indicator of the degree of completion of combustion, and NO is an indicator of temperature I stoichiometric ratio conditions in the
furnace, these measures have been considered as pos
sible indicators of boiler performance. Several studies have been conducted on this aspect [14, 15], and it

99.9999
'f 99.999
1l � w a: o (J I o Q.
99.99
99.9 L.. _ _ -LL-_ _ __ _ ---L-L _ _ __ _ ----IL...L __ ---.J Baseline FR·8Q% SR=1.! Waste Heat=25%
TransIent Waste Flowrale 25%�Wasle Heat 90%
Baseline FR·80% SA:::1.1 Waste Heat=50%
FIG.8 ORE VERSUS TRANSIENT FLUCTUATIONS IN
WASTE FLOW RATE
99 9999
99 999
� ! w a: 0 U (J
99 99
99 9
cP CCI. ORE = 100.03569 + 0.01557 In(MCB ORE-99.9) (Correlation Coefficient. 0.480032) 0 0
o
99 9 99 99 99.999
MeB ORE (percen!)
FIG. 9 CCI4 ORE VERSUS MCB ORE
99.9999
373
99.9999 r-------,---------,------�
]; � w a: 0 '" (J ::.
� � ! w a: 0 U 0
99.999
99.99
MCB DRE = 108.23955 + 3.57592 In (PCE DRE-99.9) (Correlation Coefficient::: 0.82776)
o o o
o
99.9 � ______ � ______ _L ______ � 99.9 99.99 99.999 99.9999
99.9999
99.999
99.99
99.9
peE ORE (percent)
FIG. 10 MCB ORE VERSUS PCE ORE
CCI,4 ORE::: 101.632 + 070817 In(PCE DRE·99.9) (Correlalion Coefficient::: 0.480032)
o o
o o
o 0
o
99.9 99.99 99.999
peE ORE (percent)
FIG. 11 CC4 ORE VERSUS PCE ORE
99.9999

99.99999 r------.--------r-----r�--_._--___,
c: " u Q; � w a: 0 II 1: 0 0..
99.9999
0
99.999
o
O� 0 0
cB 0
0
DRE = 99.87595 + 0.0276565 In (NO) (Correlation Coefficient = 0.7401856)
0
99.9 L..-__ -'-__ ----''--__ -'-__ --'-__ ----' 60 70 80 90
NO (dry, @ 3% O2), ppm
FIG. 12 POHC ORE VERSUS NO
100 110
has been concluded that the relationships between ORE and these parameters are, in all likelihood, facility specific.
In this study, correlations between ORE and COl
NO emissions were attempted. The results are plotted in Figs. 12 and 13. Best-fit correlations were developed for the data in these figures. These correlations are also plotted in Figs. 12 and 13. Both the plots and the best-fit curves indicate that ORE increases with in
creasing NO emissions, perhaps due to increasing temperature, and ORE decreases with increasing CO emissions due to worsening combustion conditions.
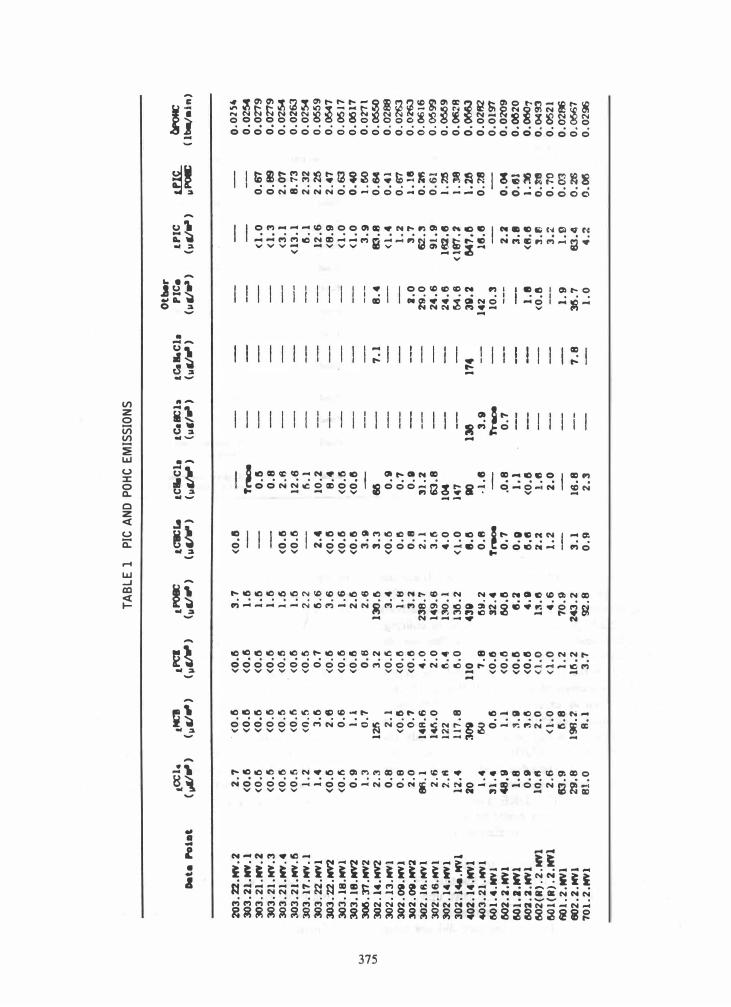
PIC Emissions
Table 1 summarizes the chlorinated PIC and PORC emissions for the various data points analyzed by mini
VOST during this study. It can be seen that the PIC concentration increases with an increase in PORC concentrations. For the range of parameters tested the
374
� �9��--r--r--�--._--r--r_-,
99.9999
o
9999
o
o
ORE:- 100.0003017 - 0.000002 (CO) (Correlation Coefficlent:- 0.8178469)
99 9 L-_...L __ .l-_--'-__ .l-_--'-__ '--_--' 1000 2000 3000 4000
CO (dry,@3%02)' ppm
5000 6000
FIG. 13 POHC ORE VERSUS CO
7000
PIC/PORC ratio varied between 0.03 and 8.87, giving mean and median values of 1.14 and 0.67, respectively, thus indicating that PIC concentrations were of the same order of magnitude as the PORC concentrations,
As chlorinated PICs could be just as hazardous as PORCs and their emissions are of the same order of
magnitude, they should be paid as much attention as PORCs from an environmental pollution standpoint.
CONCLUSIONS AND RECOMMENDATIONS
Table 2 summarizes all the experimental conditions at which the PORC ORE was found to be below 99.99%.
Analysis of the results of the various tests performed in this study yielded the following conclusions and
recommendations: (a) As load and waste heat input were increased,
and stoichiometric ratio was decreased, the PORC ORE was observed to decrease within the range of parameters tested.
(b) Stoichiometric ratio, or oxygen available per mole of PORC, was the most sensitive parameter affecting the PORC ORE under steady state, good atomization conditions. At a stoichiometric ratio below 1.1,
the PORC ORE can be expected to be below 99.99%, The effect is especially noticeable with MCB.
TA
BL
E 1
P
IC A
ND
PO
HC
EM
ISS
ION
S
Othe
r tCC
I•
tlCl
tf'CI
tl"Oll:
teEr.
tC
HaCb
tC
all:h
tC.
a.Cb
P
IC.
tPIC
1lK.
. �
Je
t. Po
lDt
(\III"
) ("
" ..
) ("
U--)
(""
.. )
("CIW'
) ("
U--)
(11'/
")
(II"
")
(II"
")
(II"
")
"I'0Il:
(It./
_in)
203
. 22
.MY.2
2
.7
·<
0.
5
<0
.5
3
.7
<
0.
5
0·O
H4
303
.2
!.
MY.
!
<0
.5
<
0.
8
<0
.5
1
.5
T
.--
0.
02
54
303
. 2
1.
MY.
2
<0
.6
<
0.
0
<0
.5
1
.6
0.
5
<1
.0
0
.67
0
.0
279
303
. 2
1.
MY • 3
<
0.
6 <
0.
6
<0
.6
1
.6
0
.8
<
1.
3
0.
89
0.
027
9
303
. 2
1.
NY.
4
<0
.0
<
0.
5
<0
.6
1.
6 <
O.
IS
2.
6
<3
.1
2
.0
7
0.
0Z54
3OJ
.2
1.NY
.6
<0
.5
<
0.
6
<0
.6
1
.5
<
0.
0
12
.6
<
13
.1
8
.7
3
0.
02
63
303
.1
7.
NY.
l
1.
2
<0
.5
(
0.
5
2.
2
6.
1
5.
1
2.
32
0
.0
254
303
. 22
.NY
l
1.
4
3.
6
0.
7
6.
6
2.4
1
0.
2
12
.6
2
.26
0.05
59
303.
22.
NY2
<0
.6
2
.6
(
0.
5
3.
6
<0
.0
B
.4
(
B.
9
2.
47
0
.054
7
3OJ
.l
B.
NYl
<
0.
6
0.
6
(0
.6
1
.6
<
0.
5
(0
.0
-
<1
.0
0
.63
0.
05J7
30
3.
1B
.NY2
0
.9
1
.1
(
0.
6
2.
6
<0
.&
<
0.
&
(1
.0
0
.40
0
.00
17
VJ
3OIS
.J1
.NY
2
1.
3
0.
7
0.
6
2.6
3.
9
3.
9
1.60
0
.027
1 -l
Ul
30
2.
14
.NY2
2
.3
1
26
3.
2
130
.6
3
.3
M
7
.1
8
.4
83
.8
0
.64
0
.05
50
302
.I
3.
NYl
0
.8
2
.1
<
0.
6
3.
4
<0
.6
0
.9
<
1.4
0
.4
1 0
.0
288
302
.OS
.NY
l
0.
8
<O.IS
<0.6
1
.8
0.
6 0
.7
1.
2 0
.67
0.
0263
302
.OS
.NY
:l
2.
0
0.
7
<0
.6
3.
2 0
.8
0
.8
2
.0
3.
7
1.18
0
.0
263
J02.
1S.NY
l 86
.1
1
48
.6
4
.0
2
36
.7
2
.1
31
.2
29.
0
62.3
0
.26
0.
061
6
302
. 16
.NYI
2.6
14t1
.0
2
.0
14
9.6
3.
6
63.
8
24
.6
9
1.
9
0.
61
0
.05
99
302
.1
".
NYI
2.
B 12
2 1'0.
4 1
30.
1
4.
0
104
2
4.
6
162
.8
1
.26
0.
0669
302.
1 .... NV
l 12
••
11
7.
8
6.0
13
6.
2
<l
.0
14
7 M
.6
<
187
.�
1.38
0
.06
28
40
2.
1 •
. NV
I
20
308
1
10
43
9 8
.8
110
138
11
4 38
.2
&47.
8 1.
2&
O.OMJ
40
3.
21
.NV
l
1.
4
IW
7.
B
09
.2
0.
8
·1.
8
3.
9
14
2
18
.8
0
.2
8
0.
02R2
60
1.
4.
NVI
31
.4
0.
5
<0
.&
3
2.
4
T..-
Tnoa
10
.3
0
.0
197
602
.2
.NVI
48
.9
1.
1
(0
.6
60
.8
0
.7
.0.
8
0.
7
2.
2
0.04
0
.0
209
fIOl
.2
.NY
l
l.
8
:t.9
<0
.8
8
.2
0
.8
1
.1
3.
8 O.
f.ll
0.00
20
602
.2
.MY
I
0.
9
3.6
<0
.6
4
.8
6
.8
<
0.
&
1.
8
<8
.8
l.
lG
0.060
7
602
(R
).
2.
NYI
10
.6
2.
0 <1
.0
1�
.8
2.
2 1
.8
<
0.
6
3.e
O.H
0
.049
3
fIOl
(R
).
2.
NYl
2
.6
(
1.0
<
1.
0
4.
6
1.2
2.0
3
.2
0
.7
0
0.
052
1
R01
.2
.NY
I
63.9
6
.8
1
.2
7
0.
9
1.
9
1.9
0.
03
0
.0
286
602
.2
.NY
I
29.
8
198
.2
1
6.
2
243
.2
3
.1
1
6.
8
7.
8
M.
7
63.4
0.
26
0.
0667
70
l.
2.
NYI
8
1.
0
8.1
3.
7
92.
8
0.
9
2.
3
1.
0
4.
2
0.00
0
.0
296
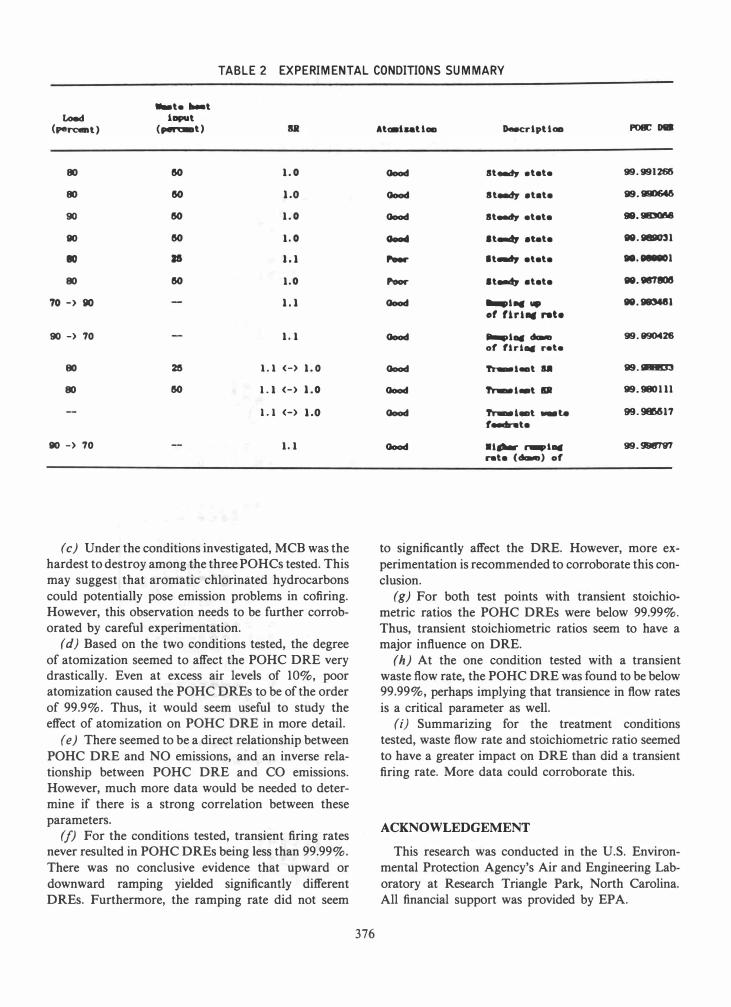
TABLE 2 EXPERIMENTAL CONDITIONS SUMMARY
... t ..... t toed !DlNt
(pen:.tt) (..-rc-t)
80 50 1.0
80 50 1.0
90 50 1.0
80 50 1.0
10 • 1.1
80 50 1.0
10 -) go 1.1
90 -) 70 1.1
80 28 1.1 <-) 1.0
80 50 1.1 (-) 1 . 0
1.1 (-) 1.0
80 -) 70 1.1
(c) Under the conditions investigated, MCB was the hardest to destroy among the three POHCs tested. This may suggest that aromatic chlorinated hydrocarbons
could potentially pose emission problems in cofiring. However, this observation needs to be further corroborated by careful experimentation.
(d) Based on the two conditions tested, the degree
of atomization seemed to affect the POHC ORE very drastically. Even at excess air levels of 10%, poor atomization caused the POHC OREs to be of the order
of 99.9%. Thus, it would seem useful to study the effect of atomization on POHC ORE in more detail.
(e) There seemed to be a direct relationship between
POHC ORE and NO emissions, and an inverse relationship between POHC ORE and CO emissions. However, much more data would be needed to determine if there is a strong correlation between these parameters.
(/) For the conditions tested, transient firing rates never resulted in POHC OREs being less than 99.99%.
There was no conclusive evidence that upward or
downward ramping yielded significantly different OREs. Furthermore, the ramping rate did not seem
376
At_I..UOD o..cr1pUoa �.,.
Good st...,. .t.t. 99.991266
Good at...,. .t.t. 99.990646
Good at...,. .t.t. 98.9IDOIWI
Oood .t...., .tat. •. 1188031
r- It..., .t.t. • . ....,1
r-- .t...., at.t. •• 18'7801J
Good .... 1 .. -. •. �l of I1r1., ,.t.
Good .... 1 .. cbe 99.990426 0' 'lri .. ,.t.
Good Tr-.l_t sa 99. SI88II33
Good tr..1..t .. 99.980111
Good tr..l.t _ta 99.98M17 , ...... t.
Good .1 .... .... 1 .. 99. 998'79'7 At. (cbe) 0'
to significantly affect the ORE. However, more ex
perimentation is recommended to corroborate this con
clusion.
(g) For both test points with transient stoichiometric ratios the POHC OREs were below 99.99%. Thus, transient stoichiometric ratios seem to have a major influence on ORE.
(h) At the one condition tested with a transient waste flow rate, the POHC ORE was found to be below 99.99%, perhaps implying that transience in flow rates
is a critical parameter as well.
(0 Summarizing for the treatment conditions tested, waste flow rate and stoichiometric ratio seemed
to have a greater impact on ORE than did a transient
firing rate. More data could corroborate this.
ACKNOWLEDGEMENT
This research was conducted in the U.S. Environmental Protection Agency's Air and Engineering Lab
oratory at Research Triangle Park, North Carolina. All financial support was provided by EPA.

REFERENCES
[ I] U.S. EPA. "National Survey of Hazardous Waste Generator and Treatment Storage and Disposal Facilities Regulated Under RCRA in 1981." Washington, D.C.: U.S. Government Printing Office, 055000-00239-8, 1984.
[2] U.S. Congress, Congressional Budget Office. "Hazardous Waste Management: Recent Changes and Policy Alternatives." Washington, D.C.: U.S. Government Printing Office, 1985.
[3] U.S. Congress, Office of Technology Assessment. "Technologies and Management Strategies for Hazardous Waste Control," Washington, D.C.: U.S. Government Printing Office, OTA-196, March 1983.
[4] Oppelt, E.T. "Hazardous Waste Destruction." Environ. Sci. Techno/. 20 (1986):312.
[5] Environmental Resources Management, Inc. "New Jersey Hazardous Waste Facilities Plan," Trenton, New Jersey: New Jersey' Waste Facilities Siting Commission, March 1985, 170.
[6] ICF, Inc. "Survey of Selected Firms in the Commercial Hazardous Waste Management Industry: 1984 Update." U.S. EPA, September 1985.
[7] Office of Appropriate Technology. "Alternatives to the Land Disposal of Hazardous Wastes, An Assessment for California." Sacramento, California: Toxic Waste Assessment Group, Governor's Office of Appropriate Technology, 1981.
377
[8] Castaldini, C., et al. "A Technical Overview of the Concept of Disposing of Hazardous Wastes in Industrial Boilers." Acurex Corporation Technical Report, October 1981.
[9] "Assessment of Hazard Potential From Combustion of Wastes in Industrial Boilers." EPA-600/7-81-108, July 1987.
[10] "Proceedings of the Hazardous 'waste Combustion Workshop. " Cincinnati, Ohio, April 22-23, 1971. Battelle Draft Report, November 1981.
[11] Lips, H. and Castaldini, C. "Engineering Assessment Report: Hazardous Waste Cofiring in Industrial Boilers Under Nonsteady State Operating Conditions." U.S. EPA, August 1986.
[12] Spannagel, U., et al. "Mini-VOST Field Analytical Protocol." Acurex Corporation Final Report, FR-85-159/EED, July 1985.
[13] DeRosier, R., et aI. "Emissions Testing of Industrial Boilers Cofiring Hazardous Wastes-Site L." Acurex Corporation Final Report, EPA Contract No. 68-02-3176, December 1984.
[14] U.S. EPA. "Performance Evaluation of Full-Scale Hazardous Waste Incineration." 5 volumes, NTIS, PB 85-129500, November 1984.
[15] Dellinger, B., and Hall, D. "The viability of Using Surrogate Compounds for Monitoring the Effectiveness of Incineration Systems," JAPCA 36 (1986): 179.