Embed Size (px)
Citation preview
1
Food Security Monitoring November 2009 - January 2010
BOLIVIA
Updated January 2009
For more information, contact: Mrs. Vitória Ginja, WFP Bolivia Country Director, [email protected] Mr. Oscar Antezana, WFP Bolivia Programme Assistant, [email protected]
The Spanish Government is providing financial support for the strengthening of Food Security Monitoring Systems in Bolivia. The support also supports the preparation of this report.
World Food
Programme
2
1.0 SUMMARY AND HIGHLIGHTS
At the end of 2009 El Chaco regions of the departments of Santa Cruz, Tarija
and Chuquisaca experienced the peak of a large period of drought which
started in 2008.
After the drought period in the country, the rainy season started influenced by
El Niño phenomenon causing floods, mainly in the lowlands. According to
official reports, rains have continued to fall over the Chapare region
(Cochabamba), where river flows have considerably increased, destroying
some 5,000 hectares of crops. Minor livestock was also reported to have died.
The Civil Defense estimates some 4,500 flood affected families in that region.
In the department of Santa Cruz heavy rains are affecting soya and rice
producers’ agricultural calendar by provoking delays in the sowing season.
The rainy season corresponds mainly to the phase of the crops’ growing
period, so that their development would be comprised in case the floods
worsen.
Forecasts by the Central Bank of Bolivia (BCB) estimate around 4% inflation
for the period 2010-2011. At the same time the BCB foresees 2010 economic
growth in between 4.5 and 5. 5% and the external remittances to be stable
during the year. BCB reports a reduction of 6,8% in remittances received in
2009 compared to 2008.
Recommendations for action: close monitoring of the rainy season, and
initial assessments in flood-affected areas in coordination with Government
and UN agencies.

3
2. ENVIRONMENTAL, ECONOMIC AND GOVERNANCE ISSUES
2.1 Environment
The region of El Chaco (located in the southeastern part of Bolivia covering important areas of
the Departments of Santa Cruz, Tarija and Chuquisaca), had been declared in a drought
emergency in November 2008 and conditions that significantly worsened during 2009. Water
supply, crops and pasture conditions for livestock were severely affected. Although the region has
experienced good rains during December 2009, which have somewhat alleviated the situation,
there are still drought effects to be addressed.
Based on an EFSA conducted by WFP and other UN agencies in June/July 2009, food aid to a
total of 5.566 families was distributed by the WFP and the Civil Defense in the Chaco regions of
Tarija, Santa Cruz and Chuquisaca. However, evaluations carried out in November 2009 by
Government and UN showed the need of increase the assistance to 11,000 families.
Between June and November 2009, the National Service of Meteorology and Hydrology
(SENAMHI) reported a reduction in the rain levels compared to averages of previous years. The
rainy season started in December affected by El Niño phenomenon causing floods in the
departments of Cochabamba, Santa Cruz, Beni and La Paz. According to official reports, rains
have continued to fall over the Chapare region (Cochabamba), where river flows have
considerably increased, destroying harvests of rice, yucca, bananas and citric fruits in rural
communities, where some 5,000 hectares of crops may have been lost. Minor livestock was also
reported to have died. The Civil Defense estimates some 4,500 flood affected families in that
region.
In rural La Paz, valleys have also registered damages produced by river overflows. Civil Defense
will support the affected families with food aid. Data collection on the number of affected
families was in progress at the time of report writing. The Vice minister of Civil Defense
requested WFP food aid to support some 2,000 familias in Chapare region.
Seasonal Perspectives for Crop and Livestock Production:
After low rainfall in the first months of the rainy
season through end November 2009, many reports
emphasized delays in the sowing season and in the
preparation of the land due to the lack of rain in
highlands (La Paz, Potosí y Oruro) and Valley
(Cochabamba y Chuquisaca) regions.
In the department of Santa Cruz heavy rains are
affecting soya and rice producers’ agricultural
calendar by provoking delays in the closure of the
sowing season, normally due in December. The
Association of Oilseed and Wheat Producers as
well as the National Federation of Rice
Cooperatives stated that due to heavy rains in the
north and drought in the east of Santa Cruz
Department, they are experiencing a 20% fall in the
sowing.
The rainy season extends from December till February/March. As shown in the crop calendar, apart
from some areas with wheat and barley, all crops are normally sown during September-November.
Hence, both low and excessive rainfall, the latter causing flooding in low-lying areas, will affect

4
sowing, while continuing excessive rainfall tends to affect crops of the low-lying areas, which are
oilseed, wheat and rice.
Risk Analysis:
In the recent years, the recurrence of El Niño/La Niña events has significantly increased. On the
other hand, VAM figures show that 70 per cent of households in food-insecure municipalities of
Bolivia have very low capacity to respond to disasters and emergencies. This combination of a high
frequency of climatic events and the vulnerability of its population makes of Bolivia a country with
a high risk of natural disasters.
Between 2006 an 2008, three consecutive years of major natural disasters devastated the livelihoods
of thousands of families in a large part of the Bolivian territory. Floods, mudslides, landslides, and
droughts have caused loss of lives, injury and displacements, as well as damage to housing,
infrastructure and agriculture. Rain deficits we reported in El Chaco region since the second half of
2008 resulting in the government’s emergency declaratory in November 2008. In 2009, El Chaco
and the highlands were affected by low rainfall during the first months of the rainy season
(December/08 to march/09) till end November 2009. During the last semester of 2009, according to
SENAMHI, El Niño phenomenon aggravated the rain deficit and wide areas of the country were
affected by drought especially in the Chaco.
At the beginning of 2010, the country is experiencing again heavy rains influenced by El Niño that
indicate the high risk of the recurrence of massive floods in the first quarter of the year. The zones
that are more prone to this kind of phenomenon are low lands (Santa Cruz, Beni, Pando and the
eastern area of Cochabamba). According to past EFSAs in these zones, an estimated of 30.000
families will be in food insecurity situation due to floods. The most vulnerable victims are likely to
be subsistence farmers and indigenous people, who are already poor, and were affected by previous
disasters.
2.2 Economic Conditions
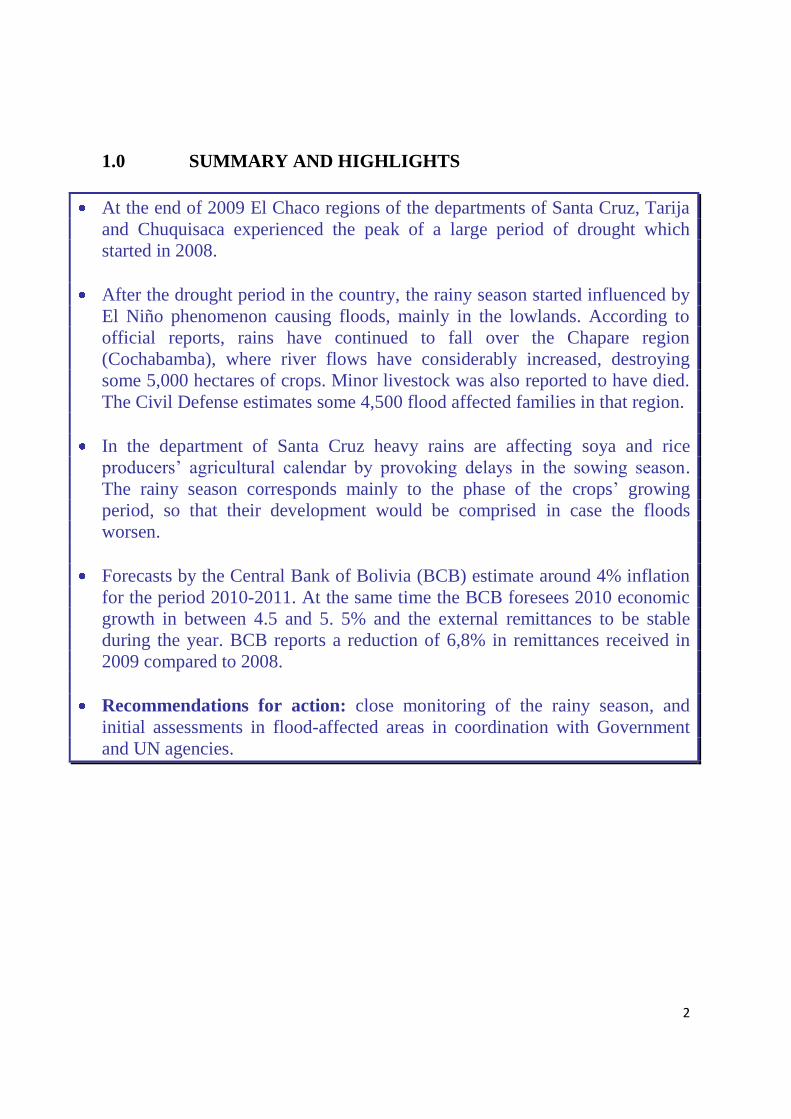
During the global crisis of food prices, the Food Consumer Price index for Bolivia has increased in
37 points between January 2007 and September 2008, and remained high up to the present. During
the last months of 2008 and till end 2009 prices on most commodities have fallen slightly.
5
Source: VAM Bolivia, based on figures from the National Institute of Statistics
Regarding the effects of the financial crisis, compared with previous year, remittances are down by
7.5% but the level has stabilized and remained quite high during July-October 2009.
Forecasts by the Central Bank of Bolivia (BCB) estimate around 4% inflation for the period 2010-
2011. At the same time the BCB foresees 2010 economic growth in between 4,5 and 5,5% and the
external remittances income to be stable along the year. BCB reports a reduction of 6,8%
(equivalent to 68,5 million dollars) in remittances received in 2009 compared to 2008.
Risk Analysis:
Due to effects of the Niño phenomenon on the agricultural harvests, it is expected a reduction of
food availability in markets because of the loss of production and damages to roads, resulting in a
food price increase during the first part of 2010.
2.3 Governance
Government Actions:
Since 2008, the Evo Morales‘s Government undertook a comprehensive set of actions to respond to
the global crisis in food price increase; the aim of these actions was to increase the supply in local
markets as well as stimulate local production.
At the end of 2007 the Government established the Empresa de Apoyo a la Producción de
Alimentos (EMAPA), an enterprise to support food production, with the aim of supplying internal
markets under the principle of fair price. It works with subventions not only for production, but also
for the sale of food to consumers. EMAPA sells mainly oil, rice, wheat flour and sugar, but also
provided soy (as chicken food) to producers.

6
In March 2008, export of vegetable oil, rice, and sugar was restricted in order to prioritize supply to
the internal market. Afterwards, restrictions to exportation were made more flexible, although the
prioritization of the internal market was maintained. In December 2009, a supreme decree
authorized the exportation of 30,000 tonnes of rice.
Risk Analysis:
Evo Morales won the presidential elections on Sunday December 6th with at least 61% of the vote.
His party, the Movement toward Socialism (MAS) also won two-thirds of the seats in Bolivia's
congress. As Bolivia’s first leader to win consecutive re-election since 1964, Morales said he will
use his five-year term to expand state control over the country’s natural resources and distribute
revenue from state-controlled businesses to the poor. No governability risks are foreseen for his
government in the short term.
3. FOOD AVAILABILITY
Supply/Demand:
Bolivia continues to face significant deficits in national cereal production: it imports 60 percent of
the wheat consumed, which is a basic commodity in the food basket. In 2003, the Food and
Agriculture Organization of the United Nations (FAO) graduated Bolivia from the low-income,
food-deficit country category, mainly because agro-industry in the eastern lowlands exports
significant volumes of soybeans as animal feed. To reduce dependency on imports, the Government
is supporting small farmers, encouraging them to grow local foods.
Production Trends
(index 2005 =100)
60%
70%
80%
90%
100%
110%
120%
130%
140%
150%
160%
2005(p) 2006(p) 2007(p) 2008(p)
Rice Maize(1) Barley Quinua
Wheat (1) Sugar Cane Soy (1) Potatoes
Source: VAM Bolivia, based on figures from the National Institute of Statistics
Production of wheat and sugar has increased in response to high import and export prices,
respectively. Also, these crops, which are primarily grown in the eastern lowlands, have not been
affected by flooding.

7
BOLIVIA: ANNUAL AGRICULTURAL PRODUCTION (metric tones)
DESCRIPCION 2005(p) 2006(p) 2007(p) 2008(p)
Rice 526.836 446.462 369.141 435.960
Maize 816.736 894.436 770.365 1.000.385
Barley 73.996 75.226 72.589 46.936
Quinoa 25.201 26.873 26.601 28.809
Wheat 119.227 143.677 165.165 161.553
Sugar Cane 5.112.222 6.201.125 6.419.313 7.458.808
Soya Beans 1.693.087 1.618.966 1.595.947 1.225.885
Potatoes 761.891 754.807 735.254 935.862
Source: National Institute of Statistics
(p): Preliminary data
4. FOOD ACCESS
Access is the main cause of food insecurity in Bolivia. The income of 38 percent of the total
population (59 percent of the rural population) is not sufficient to meet basic food needs. According
to VAM, extreme poverty reaches 72 percent of households in the most food insecure
municipalities.
The 2009 WFP Food Security and Nutrition Survey, aimed at investigating the changes suffered by
most vulnerable municipalities as a consequence of the last global crisis, established that 6 out of 10
households were covering less then the 90% of the recommended energy level intake. Regarding
micronutrients, Vitamin A and Calcium for example, the report found the situation to be very
critical, where more than 80% of the population living in high vulnerable municipalities were
consuming less than 70% of the recommended rations.
Recent crises had a strong impact on households’ strategies, showing important signs of adaptation
but also tension or stress. In most vulnerable municipalities, the proportion of households that
recognizes agricultural and livestock activities as their main source of income is reducing, as these
activities are highly exposed to climate risks.
At the same time, wage labour decreased, generally associated to a more stable source of income,
while self employment (a less stable source of income) increased its importance in rural zones.
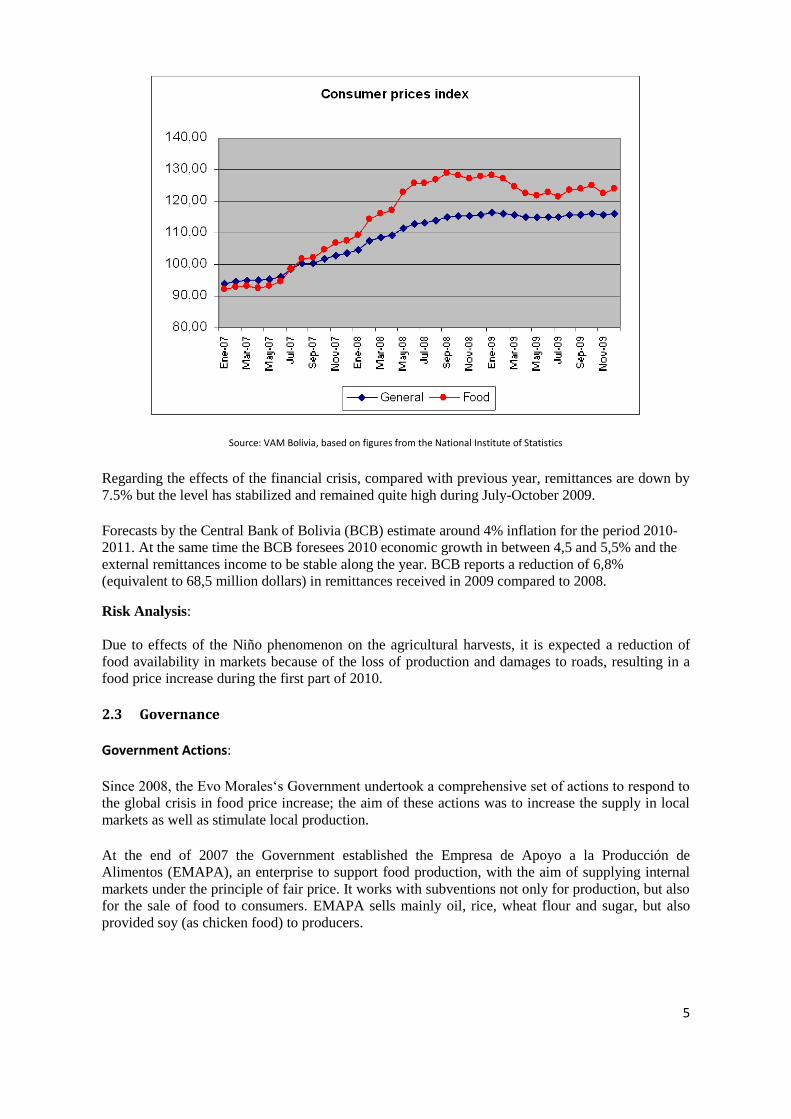
In vulnerable rural municipalities, households declared that 77% of food consumed was purchased
rather than produced, an increase from 65% in the 2005 survey. This confirms a trend of less
reliance on own production in food consumption, which probably dates back to the 1980s
The most sensitive indicator for appreciating the effects of price increases is the structure of
expenditure, because it reveals important changes in comparison with 2005; in fact the proportion of
expenses for food increased from 56 to 65% in the last 4 years, which discloses the fact that
households had to reduce the part of expenses destined to health and other expenses.
8
Source: WFP VAM Bolivia
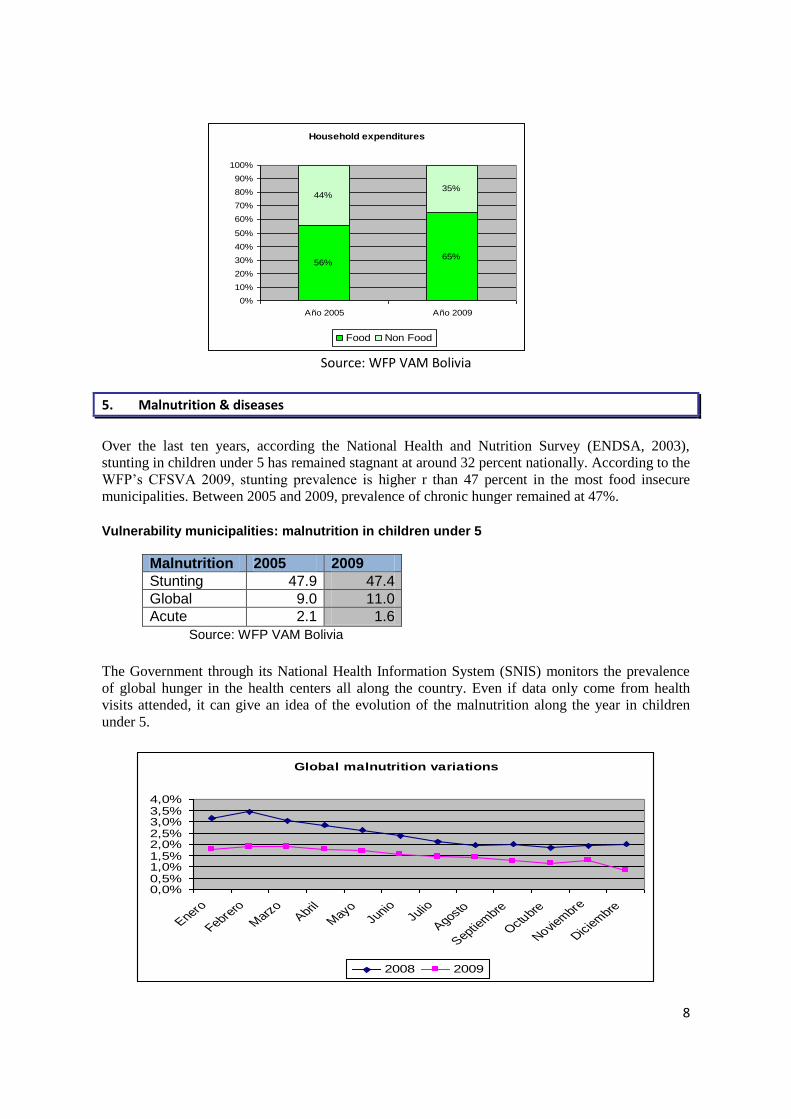
5. Malnutrition & diseases
Over the last ten years, according the National Health and Nutrition Survey (ENDSA, 2003),
stunting in children under 5 has remained stagnant at around 32 percent nationally. According to the
WFP’s CFSVA 2009, stunting prevalence is higher r than 47 percent in the most food insecure
municipalities. Between 2005 and 2009, prevalence of chronic hunger remained at 47%.
Vulnerability municipalities: malnutrition in children under 5
Malnutrition 2005 2009
Stunting 47.9 47.4
Global 9.0 11.0
Acute 2.1 1.6
Source: WFP VAM Bolivia
The Government through its National Health Information System (SNIS) monitors the prevalence
of global hunger in the health centers all along the country. Even if data only come from health
visits attended, it can give an idea of the evolution of the malnutrition along the year in children
under 5.
Global malnutrition variations
0,0%0,5%1,0%1,5%2,0%2,5%3,0%3,5%4,0%
Enero
Febrero
Marz
oAbril
Mayo
JunioJulio
Agosto
Septiem
bre
Octu
bre
Noviem
bre
Diciem
bre
2008 2009
Household expenditures
56%65%
44%35%
0%
10%
20%
30%
40%
50%
60%
70%
80%
90%
100%
Año 2005 Año 2009
Food Non Food

9
Source: SNIS
It is notable that in the last 2 years the behavior of malnutrition is in some way linked to the rainy
season. In 2008, Bolivia suffered massive floods in big part of the country, which also makes the
information about malnutrition higher than the 2009, especially in the first 2 months of the year.
In the same way, in the first 4 months of the year, other factors that influence malnutrition, such as
diarrhea and respiratory diseases, starts to increase.
Source: SNIS
2009: Casos de diarrea reportados en menores de 5 años
40000
42000
44000
46000
48000
50000
52000
54000
56000
58000
Ene
ro
Febre
ro
Mar
zoAbr
il
May
o
Junio
Julio
Ago
sto
Sep
tiem
bre
Octubr
e
Novi
embr
e
2009:Casos de enfermedades respiratorias reportados en
menores de 5 años
020000400006000080000
100000120000140000160000180000200000
Enero
Febre
ro
Mar
zoAbr
il
May
o
Junio
Julio
Agosto
Septie
mbr
e
Octub
re
Nov
iem
bre

10
ANNEXES
Annex 1 – Elevation & Rain forecast January 2010
Source: FAO
Source: SENAMHI
11
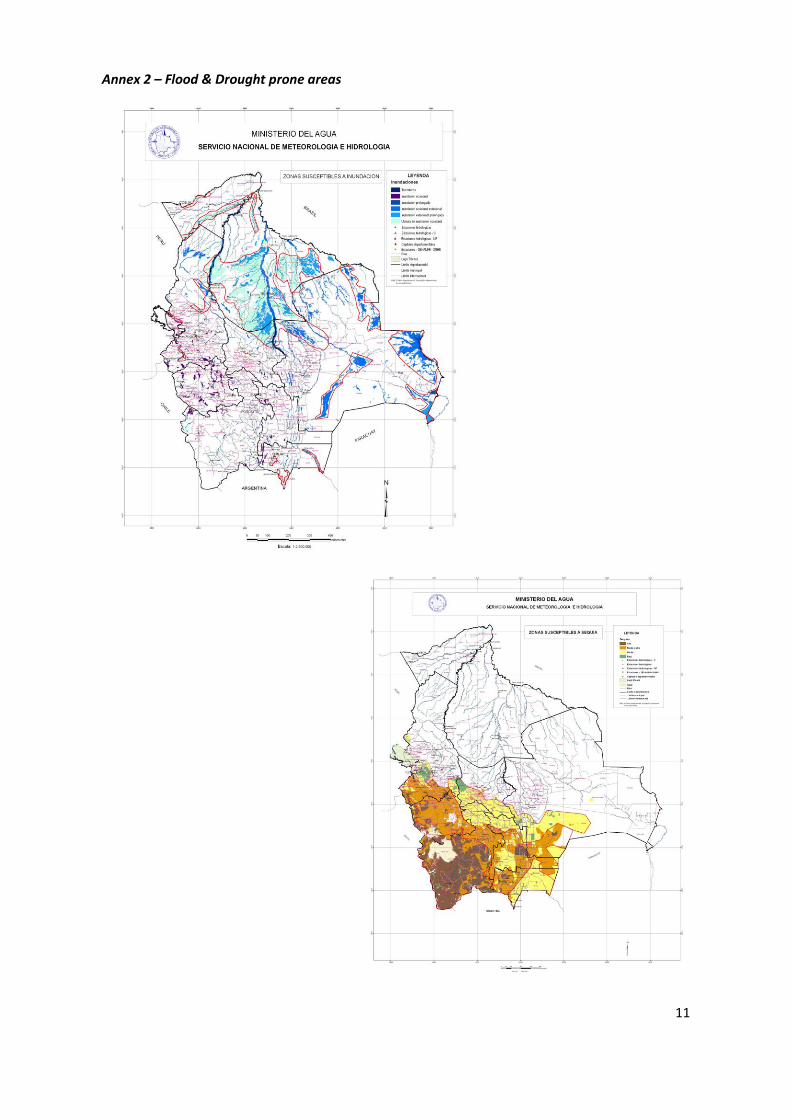
Annex 2 – Flood & Drought prone areas

12
Annex 3 – December 2009: Rainfall statistics
Source: SENAMHI