Embed Size (px)
Citation preview
1
REPUBLIC OF GHANA
------------- MINISTRY OF LOCAL GOVRNMENT,
RURAL DEVELOPMENT AND ENVIRONMENT
------------
BONGO DISTRICT ASSEMBLY
BONGO DISTRICT WATER
AND SANITATION PLAN
August 2008
GROUPE D’ETUDE DE RECHERCHE ET D’APPUI AU DÉVELOPPEMENT
2
Sicap Sacré Cœur III Villa N° 9231 - BP : 16473 Dakar/Fann, Sénégal
Tel: 221-33 869-37-93 / Fax: 221-33 827-94-99 / Email: [email protected] /[email protected] / Web:
www.geradsn.org
Content
I- INTRODUCTION ........................................................................................................................................ 6
1-1 Preamble ....................................................................................................................................... 6
1-2 Implementation strategy ................................................................................................................ 7
1-3 Approach ....................................................................................................................................... 8
1-4 Methodology .................................................................................................................................. 8
A- GENERAL DESCRIPTION OF THE DISTRICT ...................................................................................... 11
A-1-1 District size and location .......................................................................................................... 11
A-1-2 Climate and Vegetation ............................................................................................................ 13
A-1-3 Geology and soils .................................................................................................................... 13
A-2 POPULATION AND HUMAN RESOURCES ........................................................................................ 13
A-2-1 Population size and breakdown ............................................................................................... 13
A-2-2 Breakdown of the population by Area Council ......................................................................... 14
A-2-2 Education levels ....................................................................................................................... 17
A-2-3 Ethnic groups ........................................................................................................................... 18
A-2-4 Urban and rural ........................................................................................................................ 19
A-2-5 Households’ activities and expenditure .................................................................................... 19
A-3 POVERTY ASSESSMENT.................................................................................................................... 20
A-3-1 Access to basic social services ................................................................................................ 21
A-4 STAKEHOLDERS ................................................................................................................................. 24
A-4-1 District Assembly ..................................................................................................................... 24
A-4-2 Technical services ................................................................................................................... 24
A-5 WATER, HYGIENE AND SANITATION ISSUE .................................................................................... 25
A-5-1 Safe water sector ..................................................................................................................... 25
A-5-1-1 Access and use of water .................................................................................................. 26
A-5-1-2 Coverage of the water needs............................................................................................ 29
A-5-2 Access to sanitation infrastructures.......................................................................................... 31
A-5-2-1 Identification and types of sanitation facilities ................................................................... 31
A-5-2-2 Linkages between water, hygiene and health ................................................................... 34
A-6 SUMMARY OF THE ASSESSMENT .......................................................................................... 36
B-STRATEGIC ORIENTATIONS TO IMPROVE ACCESS TO WATER AND SANITATION ...................... 37
B-1 STRATEGIC ORIENTATIONS .............................................................................................................. 37
B-2 IDENTIFICATION OF ACTIONS ........................................................................................................... 38
B-2-1 Improved access to water ........................................................................................................ 38
B-2-2 Improved access to sanitation infrastructures .............................................................................. 38
B-2-3 Promotion of good governance ................................................................................................ 39
CONCLUSION ............................................................................................................................................. 40
3
Maps
Map 1 : Location of Bongo District ..................................................................................................... 12
Map 2 : Breakdown of the District population ..................................................................................... 16
Map 3 : Location of the basic social facilities in the District ................................................................ 22
Map 4 : Location of water facilities ..................................................................................................... 27
Map 5: Safe water coverage .............................................................................................................. 30
Map 6: Location of sanitation facilities ............................................................................................... 33
Map 7: Sanitation coverage rate ........................................................................................................ 35
Tables
Table 1 : Breakdown of the population by age and sex ..................................................................... 14
Table 2: Breakdown of Area Councils by communities ...................................................................... 14
Table 3: Categories of the district population ..................................................................................... 15
Table 4: Education of children aged 6 to 15 ....................................................................................... 17
Table 5: Types of basic social facilities .............................................................................................. 21
Table 6: Distribution by Area Council ................................................................................................. 21
Table 7: Access level of the vulnerable people .................................................................................. 23
Table 8: Safe water supply in dry season .......................................................................................... 26
Table 9: Water point functionality level .............................................................................................. 28
Table 10: Conditions for access to water ........................................................................................... 29
Table 11: Coverage rate by Area Council .......................................................................................... 31
Table 12 : Summary of issues and solutions ..................................................................................... 39
Figures
Figure 1 : Ethnic groups as per the sample ....................................................................................... 18
4
Figure 2 : Main occupations of the household heads ......................................................................... 20
5
ACRONYMS AND ABBREVIATIONS
AEPHA Access to Safe Water, Hygiene and Sanitation
CBO Community Based Organisation
CWSA Community Water and Sanitation Agency
DWSO District Water and Sanitation
DWSP District Water and Sanitation Plan
DWST District Water and Sanitation Teams
EPA Environnemental Protection Agency
GWCL Ghana Water Company Limited
HDW Hand Dug Wells
LG Local Government
LGA Local Government Act
LI Legislative Instrument
MoWRWH Ministère des Ressources Hydrauliques et du Logement
OMD Development Millenium Goals
PNDC Provisionnal National Defense Council
PS Piped Systems
PURC Public Utilities Regulatory
RH Rain Harvesting
VIP Ventilated Pit Latrines
WAG WaterAid Ghana
WATSAN Water and Sanitation Committees
WRC Water Resources Commission

6
I- INTRODUCTION
1-1 Preamble
Since independence in 1957, Ghana is one of the West African countries in sub Sahara whose
development sits on a participatory approach using decentralisation as the governance model.
For a long time, the political system inherited from England has influenced the various
governments of the country with the main characteristic being the involvement of all in the
management of Ghana. This is shown through a political, legal, economic and administrative
framework allowing all stakeholders to express their views and also to define the boundaries
of the central government’s authority as compared to the local governments.
Pursuant to the Anglo-Saxon culture, all powers are not owned by the State which has then to
transfer some of its competencies to its local territory units. The Government is made up of all
these small units which vest the State some of federal competencies. This is why the
«devolution of power » is so dear to Anglo-Saxons. This is completely different from the
majority of approaches used in the region where the Constitution allows the law makers to
establish the local governments’ competencies. Key principles of Ghana’s decentralisation are
based on empowerment, subsidiarity, accountability (to the people/voters) and transfer of
some skills and responsibilities (human and material) from the central Government to the
Local Governments.
In theory, though the decentralisation process started since 1985, its effective implementation
occurred after the new Constitution in 1992 which granted the following prerogatives to the
Local Governments, in compliance with the Local Government Act of 1993:
Develop and implement strategies, plans and programmes aimed at an effective
mobilisation of resources needed for the development of the District;
Determine and levy contributions -fiscal, tax and other dues.
As strategic planning documents, the local development plans of Districts raise development
issues and outline the main intervention thrust/ areas in the relevant sectors (education, health,
road infrastructure, water, hygiene and sanitation, etc.). Local development plans are
implemented using resources from the local and central government but also from technical
and financial support of development partners.
Some Districts have developed their water, hygiene and sanitation plans which are not only
strategic documents outlining the political vision of this sector but also decision making tools
in the relevant sectors. The DWSP which as a coordination tool is subsequent to a
participatory diagnosis involving all stakeholders of the District and materialises the agreed
vision of these players who validated the findings of the diagnosis as well as the strategic
orientations set, based on solutions proposed and to be implemented by the District. The
7
DWSP contributes to achieving the MDGs and the objectives of the Poverty Reduction
Strategic Framework, a national strategic benchmark of development.
WaterAid Ghana has been implementing a number of projects for the benefit of vulnerable
people in some districts with the support of some partners. WaterAid’s intervention is in line
with the Local Millennium Development Goal Initiative for achieving MDGS on safe water,
hygiene and sanitation in West Africa.
WaterAid Ghana’s decision for this initiative is because the Country Programme believes that
citizens’ engagement in the safe water, hygiene and sanitation sector is essential to leveraging
effective and transparent water, hygiene and sanitation services. Indeed:
Services will be more sustainable as they involve local communities;
Unacceptable practices such as delays or poor service performance will be minimised
and controlled
Local communities will closely and regularly work with Districts and other service
providers to hold them accountable on a regular basis;
Clear responsibilities will be given to community members and the District Assembly;
Citizens/communities will contribute to the implementation of water, hygiene and
sanitation plans and strategies.
Most Local Governments throughout the country have their water and sanitation development
plans embedded in their Local Development Plans. For some objective reasons however, they
do not raise the water and sanitation issue in a specific manner (for instance, through poverty
profile, financial and geographic access to infrastructures, etc.).
It is WAG’s belief that the DWSP’s format would be fully integrated in the intervention
framework so as to serve as an advocacy tool for raising resources. Therefore, for more
efficient actions, while keeping in line with the national policies and citizen’s engagements,
WAG is supporting the Local Governments to better plan their water and sanitation work by
adapting the DWSP to its intervention strategy.
1-2 Implementation strategy
The District is WAG’s intervention unit. It is a decentralised local structure headed by the
District Assembly which is the closest entity to communities with the mandate of providing
enabling conditions for sustainable development. WaterAid Ghana’s main objective is
therefore to improve the access to safe water and sanitation infrastructure and promote general
hygiene conditions. To achieve this, a participatory approach was required using participatory
tools. The DWSP was developed while having in mind the following:

8
Consistent with the sector and national policies: suggested activities can help in
strengthening decentralisation, implementing DWSP and subsequently fighting poverty
through meeting the priority needs of local communities.
Synergy of suggested actions: this easily links to poverty alleviation work.
The participatory assessment clearly highlighted that the underlying reason of poverty is the
lack of access to basic social services. The poorest and other vulnerable groups remain the
most affected as they have inadequate/no access to financial resources allowing them to
adequately access basic social infrastructure and equipment.
Convergence for more tangible and sustainable results in fighting poverty: this effort
in fighting poverty is seen as a pre- requisite for achieving the DWSP objectives.
1-3 Approach
The development of DWSP in the District requires both a strategy and an approach focusing
on two main principles: local governance and citizens’ action through the coordination of data
collection process by the decentralised bodies including DWST, implementing partners, etc. It
is about empowering local communities which understand the need for enabling the
emergence of a partnership capital among the user groups.
Accountability principle through learning in order to empower local communities: capacity
building of all stakeholders –field staff is a token for improving control and participation to
making decisions in particular those related to the management of local affairs. Equity
through applying of a participatory process allows to create the awareness of communities on
the existing issues who systematically assess and discuss them to find possible solutions.
1-4 Methodology
The main components in developing the DWSP and which are set in our technical proposal
clearly highlights that the method used is a participatory approach which involves
communities in assessing the situation and defining the issues:
1. Harmonisation meeting
This meeting was aimed at harmonising views on the methodology and agree on
organisational and logistical issues. The following items were discussed:
The implementation plan for rolling out the next stages in developing the DWSP;
The implementation mechanisms of these stages: number and contents of missions;
The various expected outcomes and the formats for feeding back these.
9
At the end of the meeting, a flow chart was developed and which highlights the key stages for
the next steps of the study and they include: statistics, map database and the data collection
methods in the relevant areas.
2. Data collection
a. Desk review and data treatment
The process started with the development and review of data available on the study area. A
variety of documents were consulted including:
Specific information on water, hygiene and sanitation collected with WaterAid,
DWST and some implementing partners;
Reports and statistics at WAG level;
Additional data from the Internet.
b. Sampling and suggested data collection tools
WAG provided the study team with statistics (communities and their size) on the ten Districts
where it works. The gap in these data was that communities were not attached to their
different area Councils. However, a sampling unit was suggested to the CP as part of the
conduct of the household surveys. So based on the size of the District, the number of district
households was determined (18,0491 ) and then the survey sample (1805) which is 1/10
th.
But in using the Sphinx software, the initial sample of 1805 households was reduced to 304.
In addition, trying to align with the objectives of the study, the following survey tools were
developed:
Interview guide on citizens’ participation: the objective was to assess citizens’
involvement level, local governance and democracy.
Interview guide for CBO assessment to know about the social organisation of
communities.
Focus Group with the key resource people in communities to collect background
information on the social structure and major development dynamics.
Household questionnaires for quantitative data related to living standard and also
access to basic social services and facilities.
In addition to the above tools, WAG has suggested a guide to be used for the
institutional diagnosis of Districts: this will help understand or capture the profile of
the Local Government’s resource persons.
1 The number of households in the District was obtained basing on the figure given by WAG on the average size
of a household - 5.876 people.

10
c. Training of trainers
This was held from January 30-31, 2008 and looks rather like an exchange/discussion meeting
between relevant participants and the study team. Given their good knowledge of the study
areas, participants suggested to reword some questions as well as some data collection
methods to consider the socio- cultural context.
3. Data treatment
a. Data entry
The practical training on using Sphinx to treat the data allowed the operators to input data
related to households, communities and CBOs. The compiled data were captured in an entry
form and facilitated the building of a digital data base used for drawing maps.
b. Map analysis
Maps were drawn using Arc View which has a compatibility link. Various thematic maps
were produced (on population, facilities, coverage rates, etc) to be used as decision making
tools during the planning processes.
c. Analysing the raw data
Qualitative and quantitative data collected in communities were fed into a data base and
aggregated at the levels of Area Councils and Districts. Analysed data enabled us to draw the
first conclusions which contributed in writing this report.
11
A- GENERAL DESCRIPTION OF THE DISTRICT
A-1 PHYSICAL DESCRIPTION
The key benchmarks which are essential for assessing the initial situation and identifying
development issues include the natural, human and economic status of a given area.
To assess the water and sanitation coverage rates, we always consider the population data
compared to the standards. It is known that needs/demands vary from urban to the rural areas.
As part of the DWSP development, the study started with the review of natural and population
related data (both qualitative and quantitative) to identify some benchmarks to be used for an
overall analysis.
A-1-1 District size and location
Bongo district is part of the Upper East region which is in Northern East of Ghana. Bongo
shares the following boundaries: Burkina Faso in the North, Togo in the East, in the West by
Sissala East in the Upper West region and West Mamprusi in Northern region. Bongo is a flat
area with a few hills in the East and South and land area of about 8 842 sq km which is 2.7%
of the country’s land area.
Bongo District is in the Central East of Ghana’s Upper East region, particularly at the border
Burkina Faso. Its surface area of 488 sq km represents 5.6% of the total area of the region. It
is surrounded by:
Bawku West in the East,
Kassena-Nankana district in the West,
Bolgatanga Municipal and Talensi-Nabdam in the South
Burkina Faso in the North.

Map 1 : Location of Bongo District

13
A-1-2 Climate and Vegetation
Like many areas in the Upper East region, Bongo District has a tropical climate. The northern
East position of the district makes Bongo enjoy both a dry and raining season. The latter
which generally runs from May through October and records the maximum rainfall between
August to September (annual rainfall of 800 to 1,100 mm). The other season which is longer
spans from November to February and is earmarked by winds which are either hot and dry or
cold and dry with dust.
The temperature in the day is hot and goes down as low as 14 degrees Celcius at night as
opposed to over 35 degrees at day time.
The plant cover which is made up of short deciduous leaves which are scattered and drought
resistant includes the following species: dawadawa, baobab, acacia and shea trees which all
contribute to communities’ incomes. There is a forest reserve and the Red Volta which offers
an excellent environment for the development of certain wild animals such as baboons,
monkeys, rats, mice, hares, buffaloes, antelopes’ and guinea fowls.
A-1-3 Geology and soils
The geological formations of this District belong to the Birimian Tarkwaian and Voltarian
rocks of Ghana and are characterised by granite and soils with high content of phosphate and
potassium. These soils have a good water retention capacity, which accounts for their fertility
level. But the extensive farming practices in use together with the bad land management have
not only resulted in soil degradation, erosion and impoverishment but also led to the
formation of lithosols.
The District is drained by the Red Volta and its tributaries including Ayedama and Kulumasa.
There is also an important dam in Vea and other nine small ones scattered in other locations.
A-2 POPULATION AND HUMAN RESOURCES
A-2-1 Population size and breakdown
The population and housing census in 2000 estimated the population of the District at 77,885
people. Considering the annual population growth of 2.8% at that time, the estimated number
of people in Bongo for 2006 was 91, 949.
Bongo is mainly a rural district as depicted by the household sizes. Indeed, the findings of the
survey show that the majority of the sample households (52.3%) have 5 to 10 people; 36.4%
have more than 10 people and 11.3% households have less than 5 people. The average in this
district is higher than the national one which is 4 people per household. This situation is due
to the survival of some practices such as arranged or early marriages but also by the limited
14
use of modern contraception methods. The population growth in Bongo District is related to
its high natural growth (compared to other parts of the regions) mainly since migration from
neighbouring districts is very scarce.
Using the 2006 figures, the population density is about 200 people per sq km and this is very
high when compared to the whole Upper East region which records 104 people per sq.
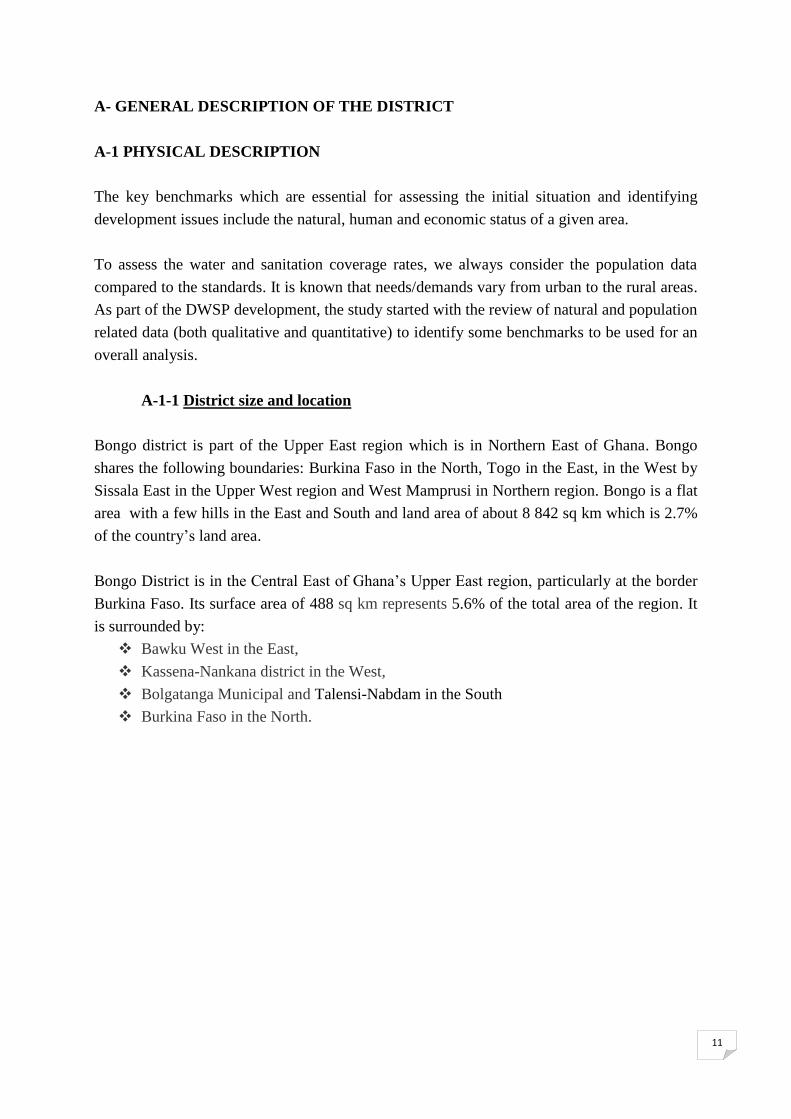
In terms of age groups, 44.8% of the population is between 0 to 14 and only 7% are beyond
65. The proportion of the adults is about 40% of the total population of the District. The
women are slightly more than the men.
Table 1 : Breakdown of the population by age and sex
Age groups Men Women Total
0-14 22.5% 22.3% 44.8%
15- 49 15.9% 22.2% 38.1%
50 64 4.4% 5.7% 10.1%
Plus de 65 3.8% 3.2% 7%
Total 46.6% 53.4% 100%
Source: 2000 Population Census
A-2-2 Breakdown of the population by Area Council
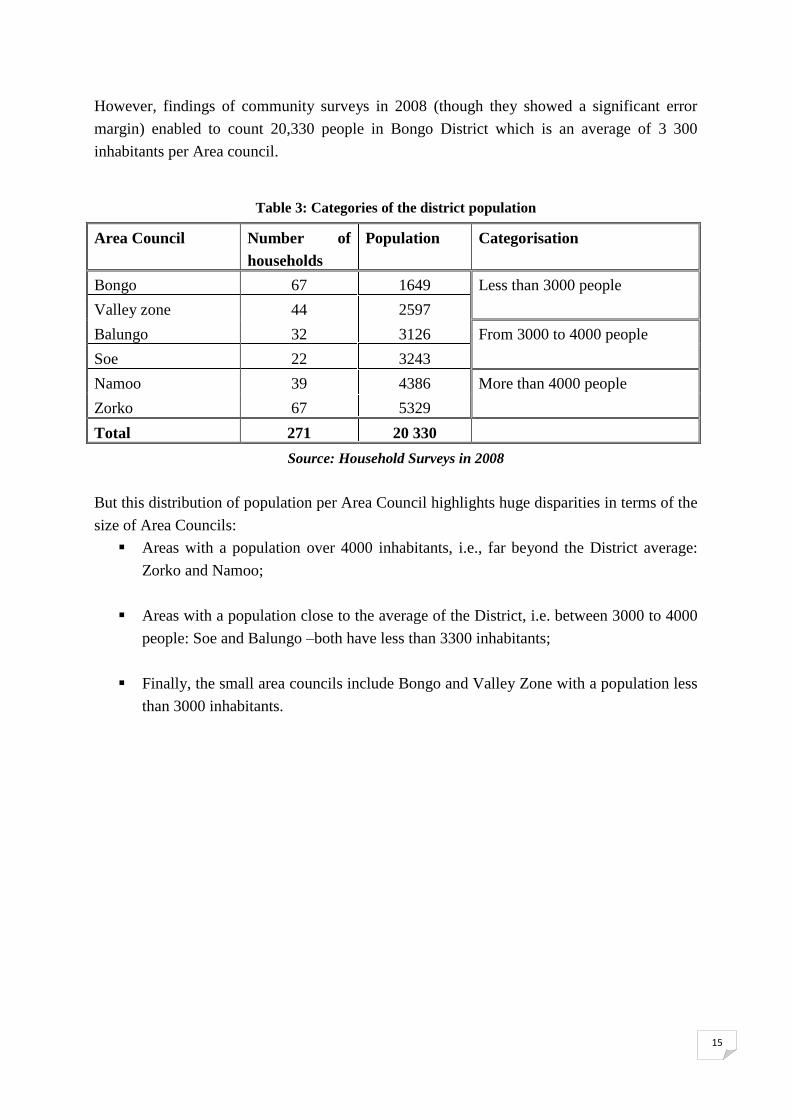
The analysis based on surveys carried out in 40 communities in Bongo District. Findings
revealed that six Area Councils had a population of 91,949 inhabitants. Looking at the table
below, we can assume that Bongo, Namoo and Zorko areas, with nine communities each have
the majority of the district population. The findings of the 2000 population and housing
census also confirm this situation, adding that except Bongo (capital city of the District), the
population of all other areas is small. Estimates show that in 2006, the suburb and peri urban
areas of Bongo will have 17,008 people, which represents 18% of the district’s population.
Table 2: Breakdown of Area Councils by communities
Area Councils Communities
Balungo 03
Bongo 09
Namoo 09
Soe 03
Valley zone 07
Zorko 09
Total 40
Sources: Household Survey in 2008
15
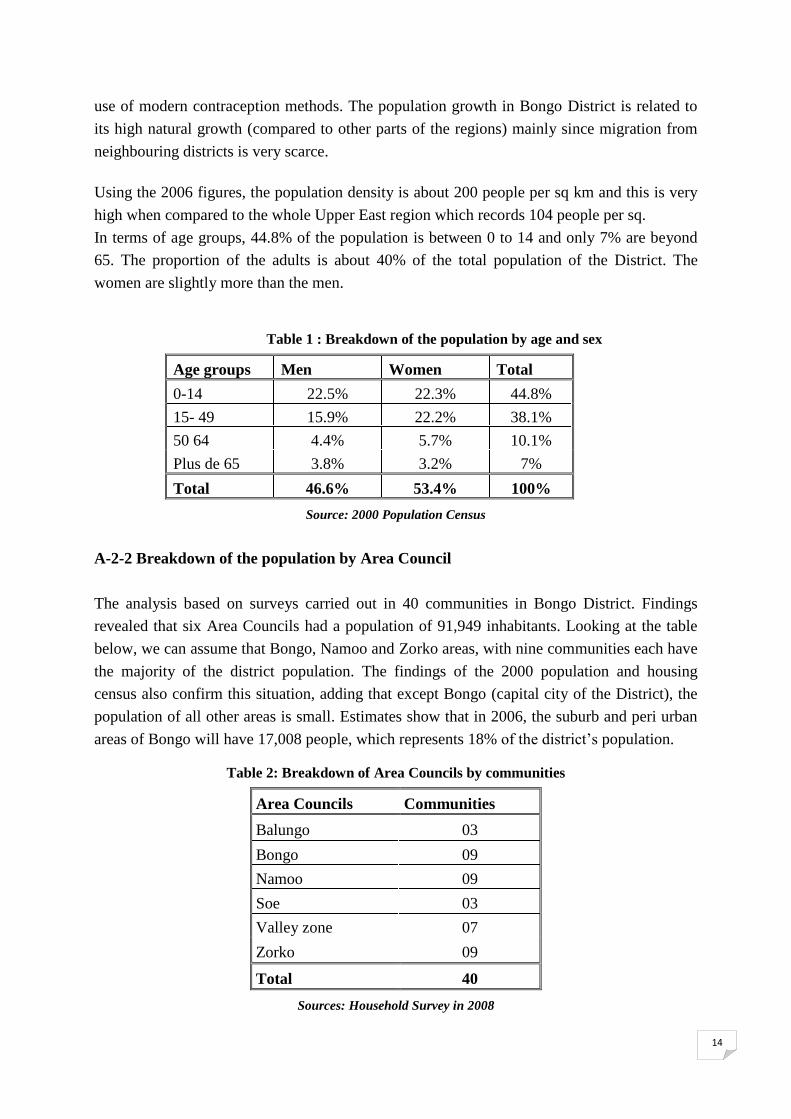
However, findings of community surveys in 2008 (though they showed a significant error
margin) enabled to count 20,330 people in Bongo District which is an average of 3 300
inhabitants per Area council.
Table 3: Categories of the district population
Area Council Number of
households
Population Categorisation
Bongo 67 1649 Less than 3000 people
Valley zone 44 2597
Balungo 32 3126 From 3000 to 4000 people
Soe 22 3243
Namoo 39 4386 More than 4000 people
Zorko 67 5329
Total 271 20 330
Source: Household Surveys in 2008
But this distribution of population per Area Council highlights huge disparities in terms of the
size of Area Councils:
Areas with a population over 4000 inhabitants, i.e., far beyond the District average:
Zorko and Namoo;
Areas with a population close to the average of the District, i.e. between 3000 to 4000
people: Soe and Balungo –both have less than 3300 inhabitants;
Finally, the small area councils include Bongo and Valley Zone with a population less
than 3000 inhabitants.
Map 2 : Breakdown of the District population
17
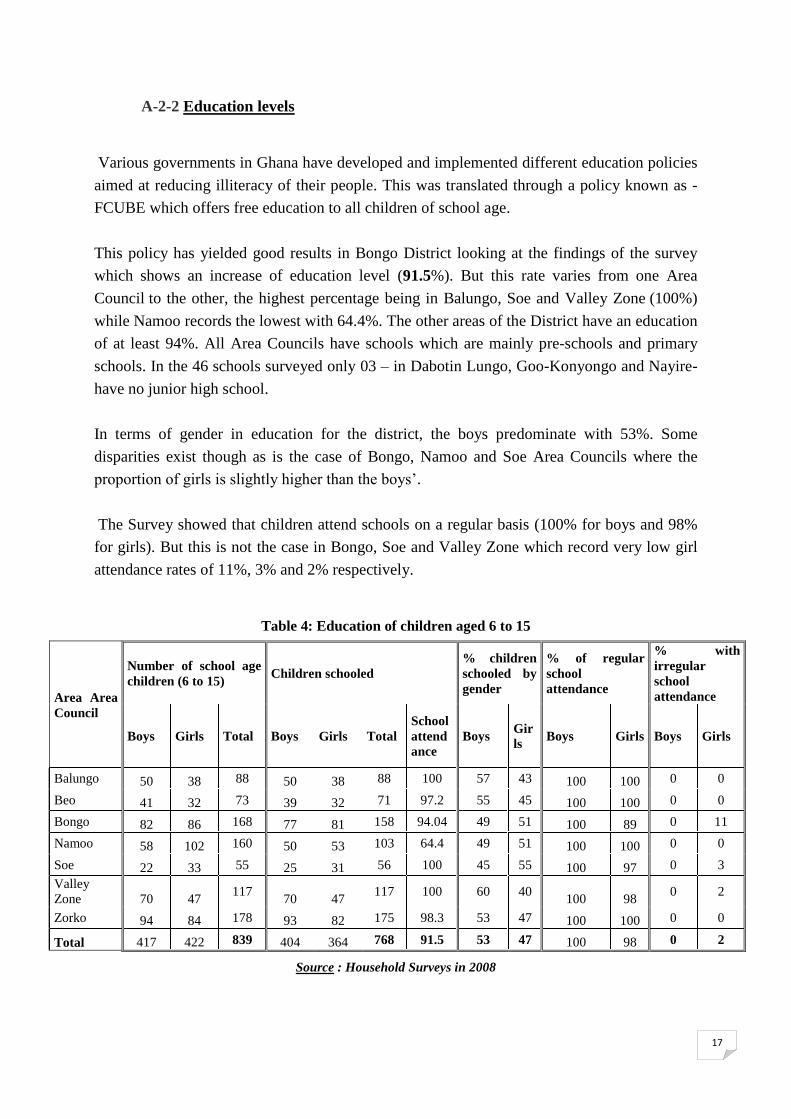
A-2-2 Education levels
Various governments in Ghana have developed and implemented different education policies
aimed at reducing illiteracy of their people. This was translated through a policy known as -
FCUBE which offers free education to all children of school age.
This policy has yielded good results in Bongo District looking at the findings of the survey
which shows an increase of education level (91.5%). But this rate varies from one Area
Council to the other, the highest percentage being in Balungo, Soe and Valley Zone (100%)
while Namoo records the lowest with 64.4%. The other areas of the District have an education
of at least 94%. All Area Councils have schools which are mainly pre-schools and primary
schools. In the 46 schools surveyed only 03 – in Dabotin Lungo, Goo-Konyongo and Nayire-
have no junior high school.
In terms of gender in education for the district, the boys predominate with 53%. Some
disparities exist though as is the case of Bongo, Namoo and Soe Area Councils where the
proportion of girls is slightly higher than the boys’.
The Survey showed that children attend schools on a regular basis (100% for boys and 98%
for girls). But this is not the case in Bongo, Soe and Valley Zone which record very low girl
attendance rates of 11%, 3% and 2% respectively.
Table 4: Education of children aged 6 to 15
Area Area
Council
Number of school age
children (6 to 15) Children schooled
% children
schooled by
gender
% of regular
school
attendance
% with
irregular
school
attendance
Boys Girls Total Boys Girls Total
School
attend
ance
Boys Gir
ls Boys Girls Boys Girls
Balungo 50 38 88 50 38 88 100 57 43 100 100 0 0
Beo 41 32 73 39 32 71 97.2 55 45 100 100 0 0
Bongo 82 86 168 77 81 158 94.04 49 51 100 89 0 11
Namoo 58 102 160 50 53 103 64.4 49 51 100 100 0 0
Soe 22 33 55 25 31 56 100 45 55 100 97 0 3
Valley
Zone 70 47 117
70 47 117 100 60 40
100 98 0 2
Zorko 94 84 178 93 82 175 98.3 53 47 100 100 0 0
Total 417 422 839 404 364 768 91.5 53 47 100 98 0 2
Source : Household Surveys in 2008
18
Looking at statistics, Bongo District appears to have the highest education rate although the
proportion of students (university level) remains low and represents 4.7% of the total learners.
But this is still higher compared to the percentage of students attending the technical and
professional schools which represents only 4.1%. The majority of pupils in the district are
mainly found in the primary schools and second cycle with 58% and 26% respectively.
Review of education level in all cycles in this district reveals a predominance of boys (54%-
over the girls except in pre schools where girls are more numerous (54%); this trend is
confirmed as we move to the higher education level i.e. university.
There is therefore the need to improve girls’ educational level, considering the significant
linkages between education, health and hygiene. The education must be coupled with
knowledge of good practices on health and family planning. It is a known fact that education
is an essential component of any development plan.
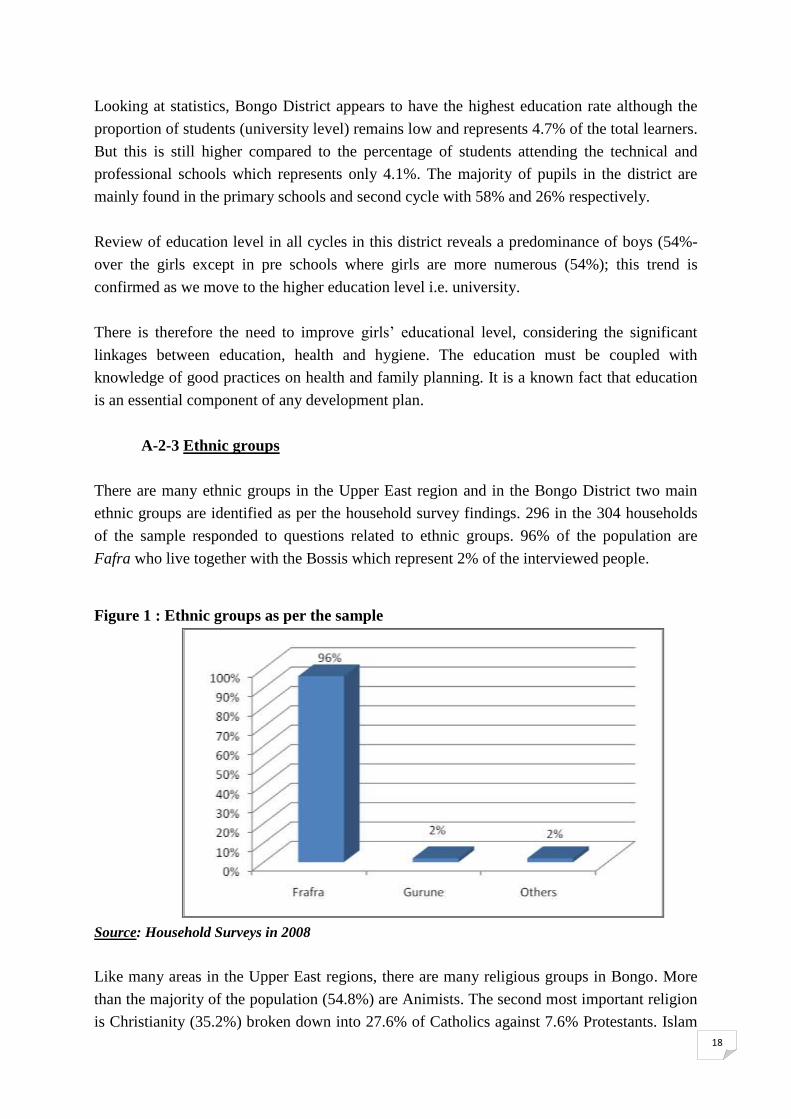
A-2-3 Ethnic groups
There are many ethnic groups in the Upper East region and in the Bongo District two main
ethnic groups are identified as per the household survey findings. 296 in the 304 households
of the sample responded to questions related to ethnic groups. 96% of the population are
Fafra who live together with the Bossis which represent 2% of the interviewed people.
Figure 1 : Ethnic groups as per the sample
Source: Household Surveys in 2008
Like many areas in the Upper East regions, there are many religious groups in Bongo. More
than the majority of the population (54.8%) are Animists. The second most important religion
is Christianity (35.2%) broken down into 27.6% of Catholics against 7.6% Protestants. Islam
19
is still embryonic in this district with 7.9% of the population. 2.1% of the population say that
they have other religious practices.
A-2-4 Urban and rural
The upper East region is the less urbanised area of the country with only 15.7% of its
population living in urban centres in year 2000. This situation affects the whole Bongo
District which is mainly made up of small rural and scattered human settlements.
Some urban cities exist though: Bongo area is the biggest and as the capital town of the
District, it has many important advantages and concentrates all activities and services.
Estimates based on the 2000 census say that the population of Bongo suburbs will be 17008
people in 2006, that is about 18% of the whole District.
Other small urban cities with some socio economic infrastructures include Namoo, Soe,
Zorko- Kanga and Beo.
Rural areas are mainly earmarked by many hamlets with huts built using local materials and
thatched/ zinc roofs. These huts are generally round shape, flat roofs, poorly ventilated with
small windows.
A-2-5 Households’ activities and expenditure
The following primary sector activities prevail: agriculture, hunting and forestry; other related
activities include processing and selling products from agriculture and gathering. Findings of
the survey reveals that over 90% households are involved in agriculture which has a lot of
potential: availability of land and an enabling climate. Soils are also very rich in phosphate,
which contributes to harvesting increased yields. Active practice of agriculture can be
accounted for by the existence of a dam (in Vea) for irrigation purposes and which is 850 ha
for the use of 2000 small farmers.
The major crops grown include onions, tomatoes, beans, vegetables, rice in the husk
(generally grown in irrigated areas). Other crops grown during the raining season are: millet,
sorghum, maize, groundnuts, Chinese beans, etc.
Livestock breeding is always combined with agriculture and almost all households practice
grass-feeding technique on sheep, goats, poultry, etc. The use of cows for ploughing is
common place in this district and this accounts for the significant raising of these animals in
this area: 1200 cows were counted in the population and housing of 2000.
Other activities carried out include selling of products from agriculture and gathering. A total
of six shops and three markets were identified by the survey.
20
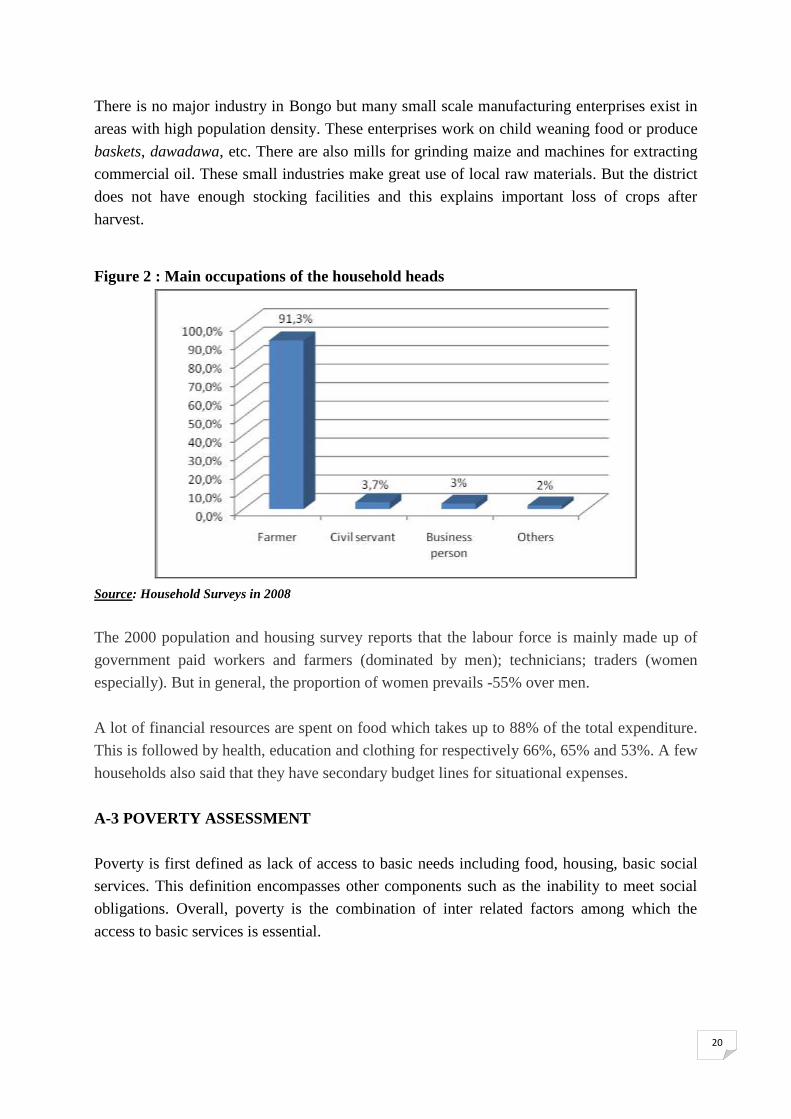
There is no major industry in Bongo but many small scale manufacturing enterprises exist in
areas with high population density. These enterprises work on child weaning food or produce
baskets, dawadawa, etc. There are also mills for grinding maize and machines for extracting
commercial oil. These small industries make great use of local raw materials. But the district
does not have enough stocking facilities and this explains important loss of crops after
harvest.
Figure 2 : Main occupations of the household heads
Source: Household Surveys in 2008
The 2000 population and housing survey reports that the labour force is mainly made up of
government paid workers and farmers (dominated by men); technicians; traders (women
especially). But in general, the proportion of women prevails -55% over men.
A lot of financial resources are spent on food which takes up to 88% of the total expenditure.
This is followed by health, education and clothing for respectively 66%, 65% and 53%. A few
households also said that they have secondary budget lines for situational expenses.
A-3 POVERTY ASSESSMENT
Poverty is first defined as lack of access to basic needs including food, housing, basic social
services. This definition encompasses other components such as the inability to meet social
obligations. Overall, poverty is the combination of inter related factors among which the
access to basic services is essential.
21
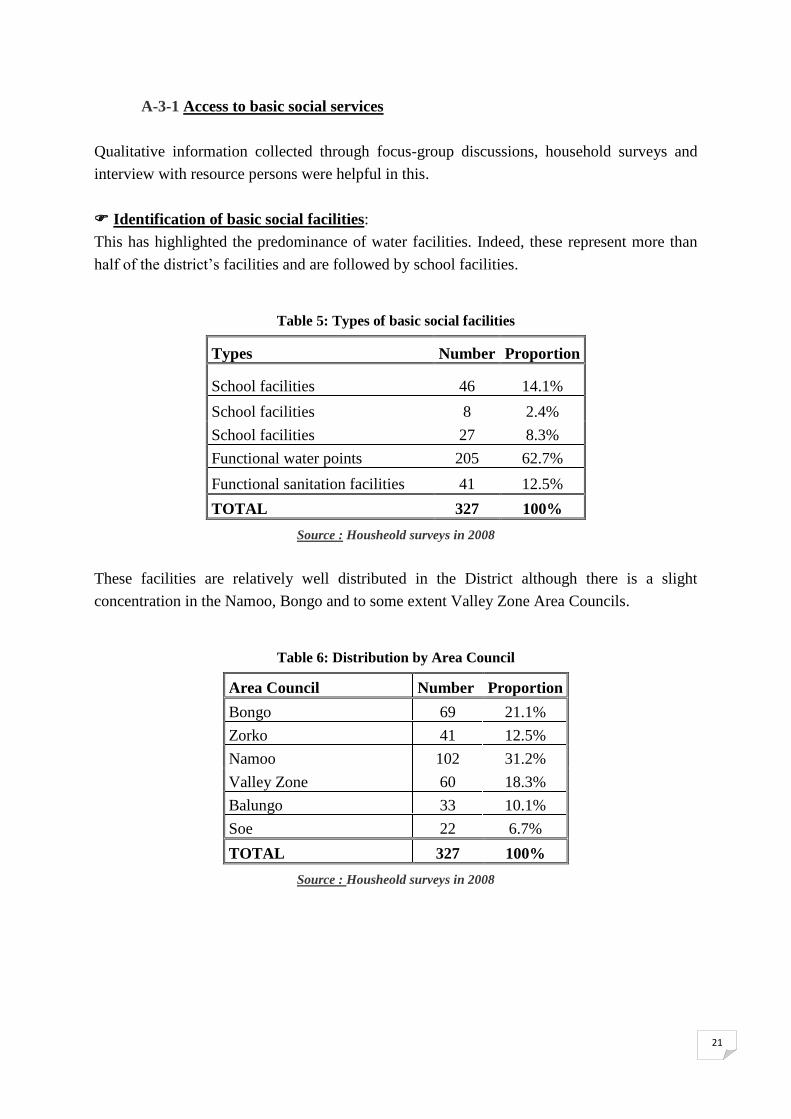
A-3-1 Access to basic social services
Qualitative information collected through focus-group discussions, household surveys and
interview with resource persons were helpful in this.
Identification of basic social facilities:
This has highlighted the predominance of water facilities. Indeed, these represent more than
half of the district’s facilities and are followed by school facilities.
Table 5: Types of basic social facilities
Types Number Proportion
School facilities 46 14.1%
School facilities 8 2.4%
School facilities 27 8.3%
Functional water points 205 62.7%
Functional sanitation facilities 41 12.5%
TOTAL 327 100%
Source : Housheold surveys in 2008
These facilities are relatively well distributed in the District although there is a slight
concentration in the Namoo, Bongo and to some extent Valley Zone Area Councils.
Table 6: Distribution by Area Council
Area Council Number Proportion
Bongo 69 21.1%
Zorko 41 12.5%
Namoo 102 31.2%
Valley Zone 60 18.3%
Balungo 33 10.1%
Soe 22 6.7%
TOTAL 327 100%
Source : Housheold surveys in 2008
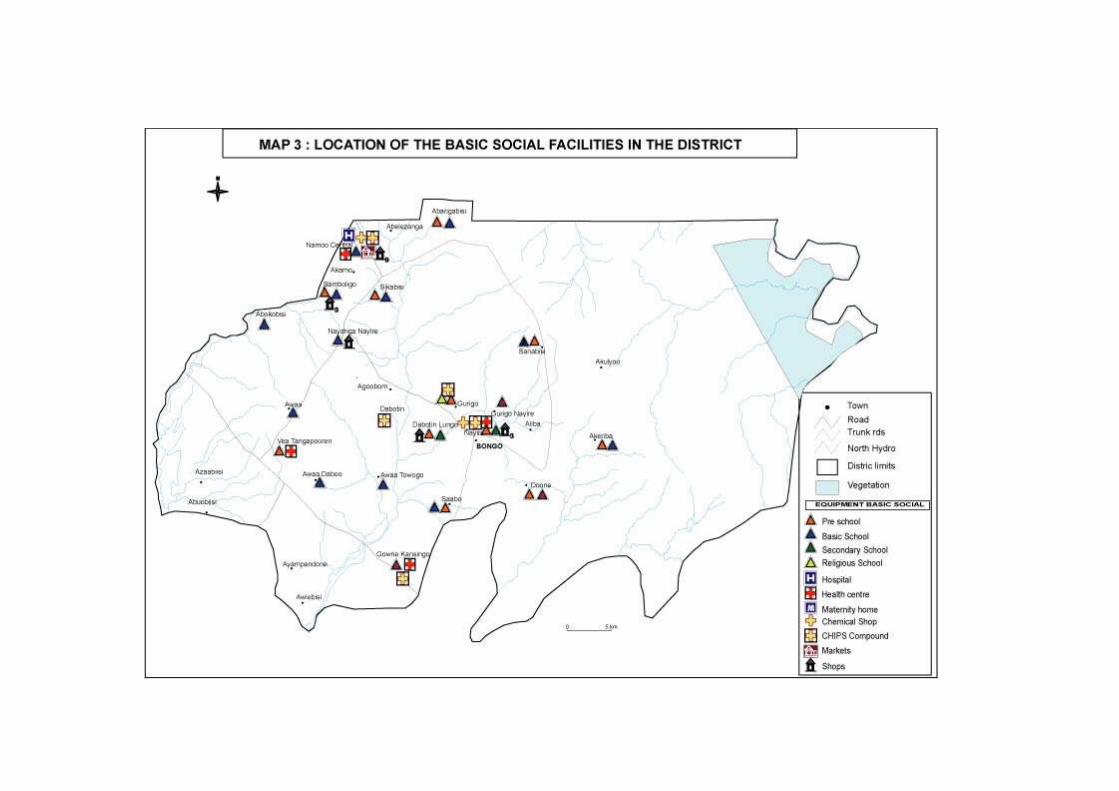
Map 3 : Location of the basic social facilities in the District

23
Identification of basic social facilities:
Due to its geographic position, the District is currently facing issues related to climate change.
Knowing that the majority of the labour force is involved in agriculture during the raining
season with almost nothing to do in the dry season, this district records a high rate of
unemployment; the population and housing census reveals an unemployment level of 26%
which is twice the national average of 10.4%. In the region, the Bongo District has the highest
unemployment rate after Bawku West which records 27%.
The involvement of a great number of children (aged 7 to 14) in economic activities is a
significant indicator of poverty level in this area. Indeed, in order to diversify their income
sources, most household heads resort to and use their children in economic activities instead
of sending them to school. This very common place situation involves 33% of school age
children who according to the 2000 census, are found in agriculture – 60.3%, 29% in
industries and 10% in trading. This is a real challenge to the District Assembly mainly as the
children aged 0 to 14 represent an important proportion of the total population.
Other bad practices derived from the poor living conditions include rural-urban migration.
Indeed, some young girls leave the district for big cities like Kumasi, Accra, and Burkina
Faso to look for non-existent jobs which leads them into social vices culminating into
unwanted pregnancies and diseases such as HIV/AIDS.
There are vulnerable people in Bongo mainly the disabled ones. The number is 112, which
represents 4% of the sample population (58 men and 54 women). The District Assembly in
conjunction with some partners have developed programmes and initiatives aimed at a social
rehabilitation of this group: these include enrolment of children at school, credit schemes to
promote income generating activities, education and surgical intervention on cataract in
particular.
Table 7: Access level of the vulnerable people
Vulnerable people’s
access to services
Water Adequate sanitation
Number Proportion Number Proportion
Number of responses 196 64.7% 179 59.1%
Yes 53 17.5% 41 13.5%
No 54 17.8% 83 27.4%
TOTAL 303 100% 303 100%
Source : Housheold surveys in 2008
Initiatives taken are relevant to these vulnerable groups as they face constraints in accessing
water and sanitation. HIV AIDS groups also suffer from some discrimination according to 29
household heads. To address this situation, those involved in the sample group suggest not

24
only the construction of adequate facilities for better access to basic infrastructure, but also
and most importantly, to bring moral support to the HIV/AIDS group.
A-4 STAKEHOLDERS
An analysis of stakeholders in the district to determine the existing level of partnerships in
the District as well as their capacities to effectively follow up the implementation of
development programmes and plans.
A-4-1 District Assembly
Institutionally, the District has a District Assembly of 54 members in 2000. The DA is the
legislative body and two thirds of its members are elected by direct vote; the other 1/3 is
appointed by the central government. For the purpose of efficiency and effectiveness and in
line with its mission, the DA has an Executive Committee headed by the District Chief
Executive. He/she is appointed by the president and approved by 2/3 of members of the DA
present with a voting status.
There is a central administration headed by the District Coordinating Director who is
supported by a Deputy, a secretariat and a storekeeper.
A-4-2 Technical services
With the support of public services in place in Bongo, the DA is responsible for managing all
the District’s affairs using its legislative, legal and executive powers. Relevant services
include:
Finance department: headed by a finance officer who is assisted by qualified staff,
this unit is in charge of collecting the public revenue and other financial transactions
of the Assembly.
District Planning Coordinating Unit: The staff in this unit is in charge of
developing the DA’s plans and programmes, coordinating and harmonising the
development activities of the decentralised departments and other development
partners. The unit also gathers data on profitable activities which can help in preparing
the tax and methods for taking resolutions related to the DA budget. The monitoring
and evaluation of the development plans and programmes is also part of their mandate.
Department of Works: this is headed by a senior works supervisor and its role is to
provide technical advice to the DA on its public works and civil engineering.
25
Health and environment unit: The environment and public health inspector is the
head of this unit which is responsible for ensuring and promoting good and safe living
environment in all places with human settlements.
Local Government’s Inspection: This Area is headed by a Local Government
inspector with the mandate of reviewing payment vouchers and advising on these. It
also analyses the books and cash receipts of the staff in charge of collecting revenue.
A-5 WATER, HYGIENE AND SANITATION ISSUE
In Ghana, the MoWRWH, Ministry of Water Resources, Works and Housing is responsible
for developing the various sector policies, coordinating and leading the water, hygiene and
sanitation related activities. The MoWRWH is supported by the Water Resources
Commission (WRC); the Environmental Protection Agency (EPA); the Public Utility
Regulatory (PURC) and the District Assembly as well. So the ministry, together with the
above mentioned agencies are in charge of coordinating the implementation of water sector
plans to provide water for rural and urban settlements.
Water supply in the urban areas is handled by both the Ghana Water Company Limited-
GWCL and a private agency (Aqua Vitens Rand), that is, a semi public management system.
On the other hand, Community Water and Sanitation Agency (CWSA) is in charge of the
management of water and sanitation in rural areas and small towns. CWSA support the
District Assembly in identifying its District Water and Sanitation needs in the district and also
build the capacity of District Water and Sanitation Team (DWST). The District Assembly
determines the final users, decides on the sitting of the water points and approves water
tariffs. In so doing, management of water becomes a decentralised process as technical and
financial aspects are dealt with through effective involvement of beneficiary communities.
Also note that the community always contributes 5% to the facility cost.
Support of the development partners for the sector is generally either technical or building the
capacities of people in charge of managing the water and sanitation sector at the local level.
A-5-1 Safe water sector
Water is essential to not only any development work but also for improving the environment
and overall living and hygiene conditions of people. This awareness has led the District
Assembly to request support from the Water supply Agency so as to provide water to all its
areas. Also, the World Bank has funded the second phase of Community Water Supply
Project aimed at increasing the access of people to safe water.
26
In addition to the modern water points, people in the District have hand dug wells mainly in
the rural areas. Many of such wells have been drilled in the district with the support of
partners like Rural Aid, LACROSREP II, etc. With the access to modern water points being
low, wells continue to be used and this contributes to reducing the resort to surface water.
A-5-1-1 Access and use of water
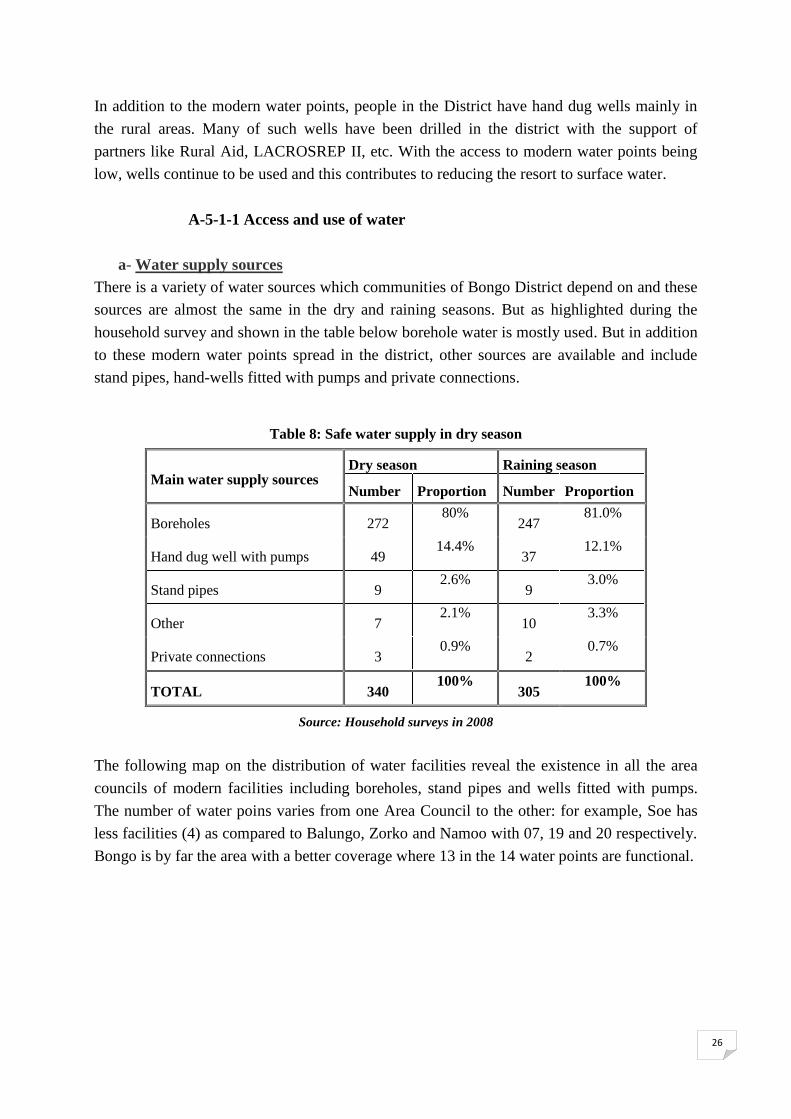
a- Water supply sources
There is a variety of water sources which communities of Bongo District depend on and these
sources are almost the same in the dry and raining seasons. But as highlighted during the
household survey and shown in the table below borehole water is mostly used. But in addition
to these modern water points spread in the district, other sources are available and include
stand pipes, hand-wells fitted with pumps and private connections.
Table 8: Safe water supply in dry season
Main water supply sources Dry season Raining season
Number Proportion Number Proportion
Boreholes 272 80%
247 81.0%
Hand dug well with pumps 49 14.4%
37 12.1%
Stand pipes 9 2.6%
9 3.0%
Other 7 2.1%
10 3.3%
Private connections 3 0.9%
2 0.7%
TOTAL 340 100%
305 100%
Source: Household surveys in 2008
The following map on the distribution of water facilities reveal the existence in all the area
councils of modern facilities including boreholes, stand pipes and wells fitted with pumps.
The number of water poins varies from one Area Council to the other: for example, Soe has
less facilities (4) as compared to Balungo, Zorko and Namoo with 07, 19 and 20 respectively.
Bongo is by far the area with a better coverage where 13 in the 14 water points are functional.

Map 4 : Location of water facilities

28
There is need to highlight that a great proportion of people in Bongo District still rely on
unsafe water sources for various reasons. Although the main one is the long distances from
safe water points, other reasons are of cultural and financial. Such households meet their
water demands by resorting to traditional wells or surface water sources including dams,
rivers and rain water.
b- Functionality of the water points
The assessment carried out in Bongo numbered 205 water points of which 80 are modern
sources split as follows: 42 boreholes and 33 wells fitted with pumps. But the survey indicates
that almost one third of these safe water points are not functional.
Table 9: Water point functionality level
Area Council Functional Non functional Functionality %
Balungo 4 3 42.9%
Bongo 13 1 7.1%
Namoo 12 8 40%
Valley Zone 10 6 37%
Soe 3 1 25%
Zorko 13 6 32%
Total 55 25 31%
Source: Household surveys in 2008
The functionality level of the water facilities in the Area Councils vary considerably and
ranges from 7% - in Bongo to 42.9% in Balungo. Bongo Area Council has the greatest
number of boreholes which are all functional. The other issue of non functionality of some
water points, is the presence of high flouride in some of the water points.
c- Accessibility to safe water sources
This was assessed using criteria such as distance between houses and water points, time spent
to access water, quantity per day and per capita and the financial affordability.
Distance: this corresponds to the distance people have to travel to get access water.
The survey showed that in all seasons, 64% households go less than 500m and 36%
travel 500m to 2 km to access water. On the basis of the national standard of 500 m, it
can be said that overall, the distance criteria is not met if we consider the proportion of
people living beyond 500m from the water: almost half of them travel more than 1Km.
The survey findings highlight that an average of 48% of households are not happy
with the location of the water points; the reason given by 80% of these households is
the remoteness of the water source mainly in the dry season.
Time: this varies based on many criteria such as distance, type of water point, the
crowd at the water point. From the assessment carried out in Bongo District, 91% and

29
87.2% households in dry and rainy season respectively need more than 15minutes to
access water.
Quantity: to assess this, we have used the 2005 data provided as part of LMDGI
process. Quantity was to be measured using WHO standard which is 35l/day/capita.
Application of this criterion shows that in the District 11% have access to safe water and
in the right quantity. Bongo Area Council with about 7% records the lowest safe water
access as per this standard as opposed to Valley Zone, Soe and Beo, where the rates are
higher.
Conditions for access to water: paying for water is yet to be a common practice among
the majority of people in Bongo district. Indeed whatever the period of the year, more
than 2/3 households are said to freely have access to water. Some households contribute
with money paid either as an annual lump sum (more than 60% households); flat amount
per month (31.5%); payment by container (about 5%) and the monthly billing (0.4%) for
people with private/individual connections.
Table 10: Conditions for access to water
Conditions for access
Dry season Raining season
Number Proportion Number Proportion
Annual lump sum contribution 182 62.3% 169 62.8%
Monthly lump sum contribution 92 31.5% 86 32%
Paying by the container 18 6.2% 13 4.8%
Private/individual connections - - 1 0.4%
TOTAL 292 100% 269 100%
Source: Household Surveys in 2008
Whatever payment mode is used, 79.9% households reported that the cost of water is
affordable: for 54.8% households, the unit cost is said to be less than 1 Ghc and the remaining
6.8% say it is 5 Ghc. But about 20% households wish this cost is reduced, half expect the
price to be less than 1 Ghc and 31.7% advocate for a cost ranging from 1 to 3 Ghc.
A-5-1-2 Coverage of the water needs
The above indicators give an overview of the water coverage levels in Bongo District which
stills record a low percentage in the area of safe water. The ration of people per water point
(obtained using the size of population and the existing and functional water sources) is 1416
people2. This indicator is a good illustration of the low water supply rate. Indeed, children and
women in particular spend most of their time fetching water and to save time, some people
prefer resorting to unsafe sources.
2 Il s’agit de la population totale donnée par le recensement de 2000 divisée par les 55 points d’eau modernes
fonctionnels données par le diagnostic.
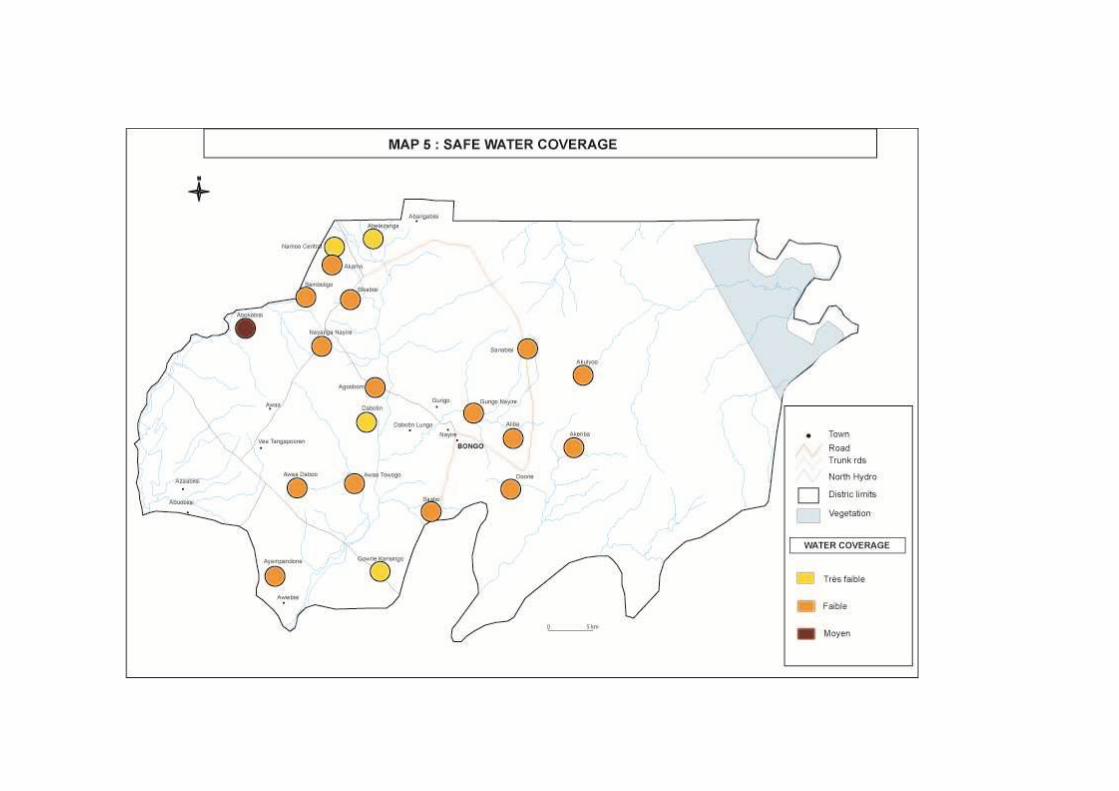
Map 5: Safe water coverage

31
The various Area Councils can be classified as follows, on the basis of some indicators such
as distribution, and the functionality of the water points:
Areas with extreme water constraints are places where the facilities are insufficient
and the functionality is an issue: Valley Zone and Balungo (functionality issue
mainly;
Areas with high water constraints include: Namoo, Zorko and Soe;
Bongo Area which is capital town of the District experiences low water constraints
and is the only area with mechanised boreholes.
Table 11: Coverage rate by Area Council
Water coverage
Households
interviewed
Nber of
litres
Number of
litres/household
Number
litres/capita
Valley Zone 45 1145 25 3
Balungo 30 770 26 3
Zorko 60 1860 31 4
Namoo 45 1560 35 5
Bongo 61 2200 36 5
Soe 30 1260 42 6
Beo 30 1540 51 7
TOTAL
301 10335 34 5
Source : househoold surveys in 2008
Safe water coverage rate was obtained based on the number of containers used3 per day and
by community and compared to the number of households surveyed in the community. This
allowed us to assess the quantity of water collected by household. Based on the average
number of people per household (5 to 10 people as per the sample), it was possible to know
the average consumption per capita in the sample group.
A-5-2 Access to sanitation infrastructures
A-5-2-1 Identification and types of sanitation facilities
The assessment of the types of sanitation facilities show that they are found in compounds and
public places
Household latrines: about 4% of the sample said they have latrines at home. Latrine
coverage rate4 in the district remains very low (9). But this rate strongly varies
3 Containers’ capacities: basin: 25 liters, drum: 25 liters, bucket: 15 liters and pot: 10 liters.
4 This is determined by the ration between the population and average number of people per household (12 in
rural area); then divide the number of latrines in good order by this ratio and multiply by 100.
32
depending on the area councils and ranges from 4% to 20% in Zorko and Namoo
respectively. Apart from Soe and Bongo with 17% and 12% respectively, all the other
area councils record less than 10%. Note that most of these sanitation facilities are
traditional ones and do not therefore meet the hygiene standards. However, very few
households own VIP latrines which were built through a project support. Such support
is either material, technical or financial as evidenced respectively by 66.7%, 30.8%
and 2.6% of households who received such support. The financial support can be
either full/total (38.5%) or through subsidy (61.5%).
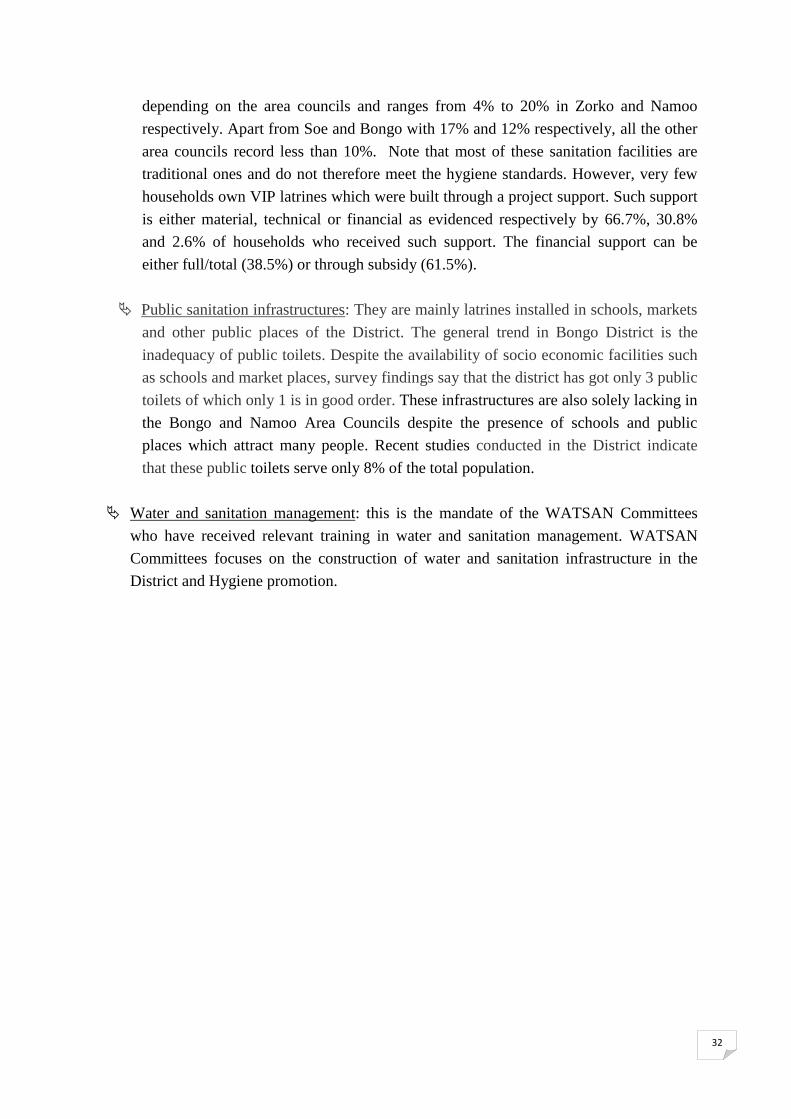
Public sanitation infrastructures: They are mainly latrines installed in schools, markets
and other public places of the District. The general trend in Bongo District is the
inadequacy of public toilets. Despite the availability of socio economic facilities such
as schools and market places, survey findings say that the district has got only 3 public
toilets of which only 1 is in good order. These infrastructures are also solely lacking in
the Bongo and Namoo Area Councils despite the presence of schools and public
places which attract many people. Recent studies conducted in the District indicate
that these public toilets serve only 8% of the total population.
Water and sanitation management: this is the mandate of the WATSAN Committees
who have received relevant training in water and sanitation management. WATSAN
Committees focuses on the construction of water and sanitation infrastructure in the
District and Hygiene promotion.
Map 6: Location of sanitation facilities
34
A-5-2-2 Linkages between water, hygiene and health
Water is essential in assessing the hygiene and health conditions. Water quality is known
through the way it is kept (conservation) and used in the households. Water quality analysis
can help determine the link between water, hygiene and health.
General hygiene conditions:
Overall, Bongo District communities have a positive perception of their water quality both
during dry and raining season. Only less than 15% households have a negative judgment of
the water quality and this confirms the findings of the survey carried out by Ghana Health
Service in 1995 and which reported that almost 33% pupils in the District have dental
fluorosis and a total of 62% children in central Bongo. This disease is also found with the
adults. This is actually due to the high content of fluoride in the underground water. To
address this issue, the District Assembly and CWSA have approached an engineering school
‘KNUST’ to do research on fluoride.
Practices of communities during transportation and conservation of water are key factors
which can help determine their health situation. The survey findings show that more than half
of people interviewed cover the containers used to carry water with lids as opposed to 44%
who don’t. But almost all households cover the containers used to store their drinking water.
99% households responded that they clean the containers they used for keeping their drinking
water; as for the ‘how often’ this cleaning takes place, it varies depending on households.
Overall, Bongo communities are unaware of the risks related to drinking unsafe water. Not
covering water during transportation has a direct impact on its conservation as it can be
contaminated.
The diagnosis has highlighted many practices which can have an impact on the communities’
health. Low coverage in latrines together with the poor maintenance of these facilities
contribute to environmental degradation. In addition to that, almost all children, and even
adults defecate in the open. This contributes to the degradation of the environment and the
development of bacteria breeding diseases including diarrhoea, bilharzias, typhoid, scabies
and to some extent malaria and guinea worm.
Another hygiene issue is the absence of a public grave yard. As a result, community members
bury their people in their compounds, which is dangerous as nearest water points can be
polluted.
It is therefore necessary to raise communities’ awareness and draw their attention to the
relevance of complying with hygiene rules. Then, more modern sanitation facilities can help
to improve the living environment of people in the District.
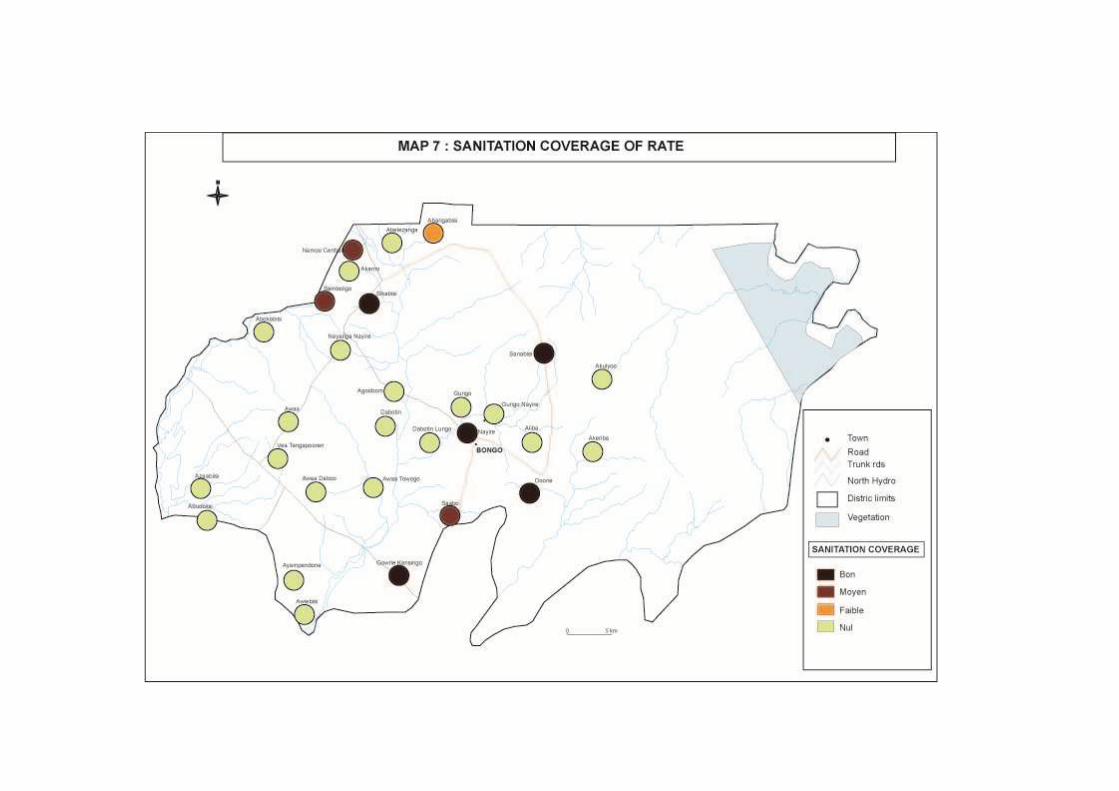
Map 7: Sanitation coverage rate
36
Waste management
Solid waste disposal: this is a key issue for the Bongo District Assembly which has put
in place a mechanism to address the indiscriminate dumping of solid waste. Permanent
and part time staffs have been recruited to address this: they look after the 6 refuse
containers sited in public places such as markets of Bongo, Beo, Soe, Zorko and
Gowrie. The waste which is stored in these containers are removed by a tractor which
generally disposes it off on farms upon request from farmers to fertilise their soils.
Another key challenge to the environment is the wide spread of polyethylene bags.
Liquid waste management: because of its rural position, Bongo District has no
adequate liquid waste management system. Also, drains in the urban areas mainly are
inadequate. The regular floods experienced by the District can be evidenced by this
and contribute to worsening soil erosion. The main issue in the compounds is the lack
of soak aways for the disposal of waste water. But local authorities, especially the
health and environmental unit is encouraging households to build these soak aways.
The District still faces a public health issue which requires the construction sanitation
facilities and the need to sensitise the people on the adoption of good hygienic practices.
A-6 SUMMARY OF THE ASSESSMENT
Data from the recent studies and the findings has revealed the overall water and sanitation
situation of the Bongo district.
The 2000 population census reported that Bongo is mainly rural with 77 885 inhabitants; with
a population growth of 2.8% the number of people expected in 2006 was 91 946. Bongo
District’s difference as compared to the other areas of the Upper East region is its high
population density (200 inhabitants per sq2) which is due to the fecundity rate. Women are
slightly more numerous than men. Education rate is very high (91.5%) with the boys groups
being more important (53%).
The district economy is dominated mainly agricultural with livestock breeding, hunting and
gathering which account for 91% of the income. The tertiary sector is not much developed
and is mainly dominated by trading. Other important activities carried out in the district
include civil servants and other professional workers. But the District people face poverty
which accounts for the fact that children are used in economic activities to diversify and
increase the family income sources.
Institutionally, the Ghanaian law vets the local governments with the necessary skills needed
for their development. So as the core political body, the District Assembly takes care of all
development activities of Bongo with the support of some technical decentralised structures
and development partners, mainly those involved in water and sanitation.

37
The assessments indicate that there are major constraints in accessing water. Indeed, the safe
water coverage rate is low and the majority of people cannot meet the WHO standard of 35
litres.
For the access to sanitation the low coverage rate (average of 9% in the District) and the lack
of public sanitation infrastructure pose a health and hygiene risk. This leads to the spread of
diseases such as diarrhoea, bilharzias, typhoid, scabies and to some extent malaria and guinea
worm.
B-STRATEGIC ORIENTATIONS TO IMPROVE ACCESS TO WATER AND
SANITATION
The DWSP is a proposed plan for Bongo District to improve the access to water and
sanitation. It is also a benchmark for any interventions in the water and sanitation sectors in
the District. Taking into account the constraints identified by local communities, solutions
have been suggested to address the gaps.
These priorities identified by the communities to address the constraints and promote
enhanced access to safe water and sanitation fall under three key strategic orientations:
Promote access to safe water sources;
Improved access to public and individual sanitation infrastructures;
Capacity building
The above listed elements are inter related and if implemented, they will help achieve the
objectives set by the District Assembly for rapid and sustainable development.
B-1 STRATEGIC ORIENTATIONS
The assessment on the water, hygiene and sanitation sectors has revealed the presence of
many bottlenecks hindering the development of Bongo District. To step up the access to safe
water and sanitation infrastructures and promote sustainable development, local stakeholders
have identified the major actions worth undertaking.
Development priority areas in Bongo
The participatory assessment carried out has enabled the Bongo District communities to
highlight their most difficult challenges and then prioritise actions to be undertaken to address
these and improve access to safe water and sanitation infrastructures as well as promote
hygiene. On the water and sanitation sector, the following needs were identified:
Improved access to water,
Improved access to sanitation infrastructures,
Promotion of local governance.
The above listed needs are closely linked and must fit into an integrated and global strategy.
38
Development priority constraints
Bongo District faces a number of constraints including:
WATER
Insufficient modern water sources
Remoteness of modern water sources.
HYGIENE/SANITATON
Low latrine coverage rate (9%)
Insufficient household latrines
Insufficient institutional latrines.
Lack of adequate solid/liquid waste disposal systems.
Presence of bad hygiene practices and behaviour.
B-2 IDENTIFICATION OF ACTIONS
B-2-1 Improved access to water
Basis for action
Despite the substantial rainfall received, water supply is a big issue for people in Bongo
District. The reasons preventing people to have their needs met mainly during the dry season
include, but are not limited to: the inadequacy or old age of the facilities, the lack of safe
wells, the presence of fluorine in most boreholes of the District, etc.
Actions required:
Construction of boreholes throughout the District communities,
Construction of small Town Water Systems in cities with large populations like
Namoo and Nayorogo,
System to remove fluorine from boreholes in Namoo, Bongo, Nayorogo, Gowrie, Vea,
Nyariga, Zorko, Sikabisi, Sambolgo and Balungo
B-2-2 Improved access to sanitation infrastructures
Basis for action
Overall, latrinisation is very low as one considers the limited number of household latrines.
Are also noted the use of latrines which do not meet the standards and the inadequate
management of liquid and solid waste. Need is there then to not only increase the sanitation
infrastructures but also to sensitise communities on complying with good hygiene practices.
Actions required
The main activities include the promotion of household latrines in all communities of the
District. This will be complemented by a range of capacity building sessions for local players
in a bid to improve both individual and collective hygiene.
39
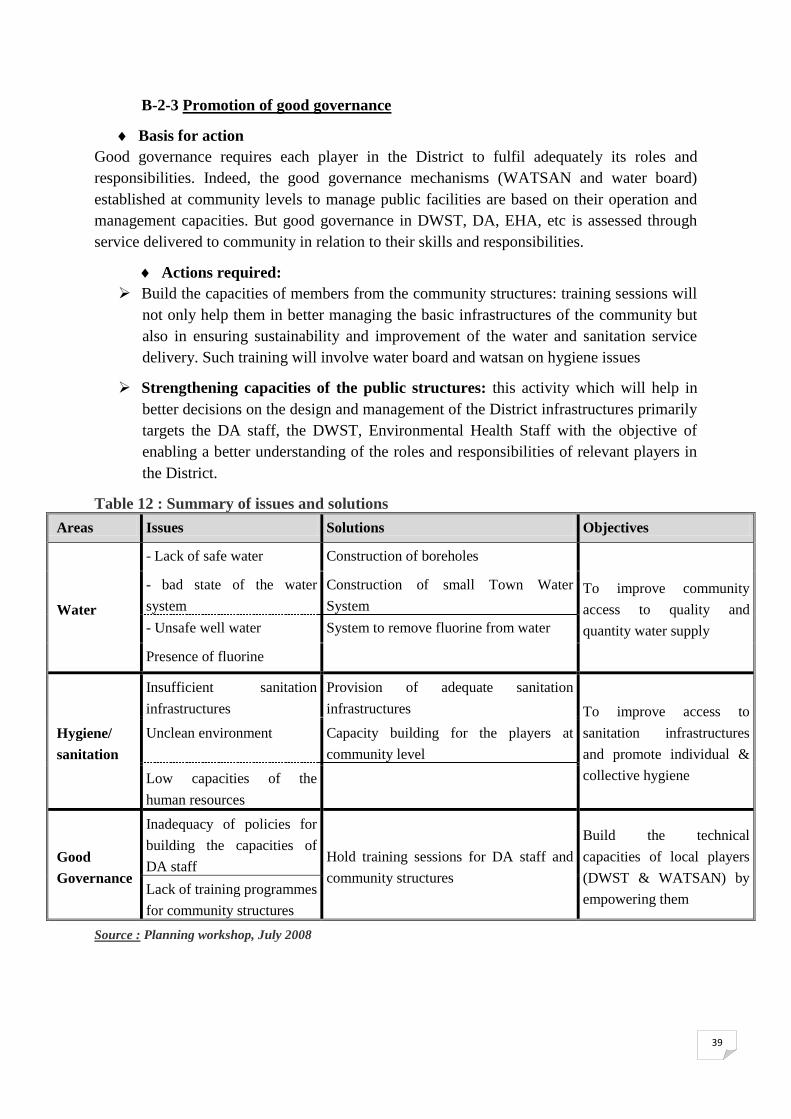
B-2-3 Promotion of good governance
Basis for action
Good governance requires each player in the District to fulfil adequately its roles and
responsibilities. Indeed, the good governance mechanisms (WATSAN and water board)
established at community levels to manage public facilities are based on their operation and
management capacities. But good governance in DWST, DA, EHA, etc is assessed through
service delivered to community in relation to their skills and responsibilities.
Actions required:
Build the capacities of members from the community structures: training sessions will
not only help them in better managing the basic infrastructures of the community but
also in ensuring sustainability and improvement of the water and sanitation service
delivery. Such training will involve water board and watsan on hygiene issues
Strengthening capacities of the public structures: this activity which will help in
better decisions on the design and management of the District infrastructures primarily
targets the DA staff, the DWST, Environmental Health Staff with the objective of
enabling a better understanding of the roles and responsibilities of relevant players in
the District.
Table 12 : Summary of issues and solutions
Areas Issues Solutions Objectives
Water
- Lack of safe water Construction of boreholes
To improve community
access to quality and
quantity water supply
- bad state of the water
system
Construction of small Town Water
System
- Unsafe well water System to remove fluorine from water
Presence of fluorine
Hygiene/
sanitation
Insufficient sanitation
infrastructures
Provision of adequate sanitation
infrastructures To improve access to
sanitation infrastructures
and promote individual &
collective hygiene
Unclean environment Capacity building for the players at
community level
Low capacities of the
human resources
Good
Governance
Inadequacy of policies for
building the capacities of
DA staff Hold training sessions for DA staff and
community structures
Build the technical
capacities of local players
(DWST & WATSAN) by
empowering them Lack of training programmes
for community structures
Source : Planning workshop, July 2008

40
CONCLUSION
Bongo owns its DWSP with an implementation Plan which includes all actions required and
assesses the local finances to be invested for the local development with the involvement of
all stakeholders.
The methodology used in developing the SDP was a comprehensive institutional diagnosis of
all stakeholders with a focus on their roles, responsibilities, interests, etc in each programme.
Finally, a practical approach has been immediately used to market the plan; this approach has
based on the local communities’ needs as well as the capacities of the strategic partners in the
District.
Each strategic partner will work in line with its role in the project and following an
implementation plan. To this effect, the District needs to own a monitoring and evaluation
system to be used as both a guide and management tool for the following purposes:
- Ensure community participation in all stages of the implementation;
- Jointly identify strengths and weaknesses of actions;
- Keep the relevant stakeholders (supported people, technicians, project/programme
staff, donors) updated on the implementation level;
- Follow the progress of the project implementation using criteria and data base initially
agreed upon by stakeholders (project owners, contractors, monitoring officer, etc)
- If necessary, make adjustments using the lessons learnt.


![Bongo R&D – Fintech [Финтех]](https://img.pdfslide.net/doc/110x75/58703ac61a28ab4e2c8b48ed/bongo-rd-fintech-.jpg)