Embed Size (px)
Citation preview
April 13, 2020
Elliot Mainzer, Administrator
Bonneville Power Administration
P.O. Box 3621
Portland, OR 97232
Brigadier Gen. D. Peter Helmlinger
Commander Northwestern Division
US Army Corps of Engineers
1201 NE Lloyd Blvd. #400
Portland. OR 97232
Ms. Lorri Gray, Regional Director
Mr. David Mabe, Deputy Regional Director
US Department of the Interior, Bureau of Reclamation
Columbia-Pacific Northwest-Interior, Region 9
1150 North Curtis Road, Suite 100
Boise, ID 83706
Comments of the Joint Commenters on the Columbia River System Operations Draft
Environmental Impact Statement
NW Energy Coalition has prepared these comments on the Columbia River System Operations
(CRSO) Draft Environmental Impact Statement (DEIS), which are supported by Idaho Conservation
League, Natural Resources Defense Council, Sierra Club, American Rivers and Save Our wild Salmon
Coalition, hereafter the “Joint Commenters.”
Joint Commenters Comments on CRSO DEIS April 13, 2020 - Page 2
NW Energy Coalition (NWEC) is an alliance of over 100 environmental, civic, and human service
organizations, progressive utilities, and businesses in Oregon, Washington, Idaho, Montana and British
Columbia. We promote development of renewable energy and energy conservation, consumer
protection, low-income energy assistance, and fish and wildlife restoration on the Columbia and Snake
rivers. Since 1981, NWEC has engaged in energy planning and policy in the Pacific Northwest,
including directly engaging in the operations of the Columbia River System.
Idaho Conservation League (ICL) is Idaho’s largest and oldest statewide conservation group. Since our
inception in 1973, we have engaged in energy planning and resource development to protect the clear
air, clean water, and vibrant fish and wildlife that make our state and region special. On behalf of our
more than 25,000 supporters, we submit these comments on the necessary elements of a complete and
rigorous evaluation of alternatives to the current Columbia River System Operations.
Natural Resources Defense Council's (NRDC) staff of approximately 700 scientists, lawyers, and
policy experts work to safeguard the earth, its people, its plants and animals, and the natural systems
on which all life depends. NRDC’s energy work is focused on accelerating the shift from fossil fuels to
a clean energy future transition, removing barriers to cost-effective energy efficiency, and helping
impacted communities fight fossil-fuel extraction. NRDC has a long history of working on energy
issues and planning in the Pacific Northwest. On behalf of our 3 million members and activists, we
submit these comments to draw attention, improve agency decision-making, and inform the impacted
public regarding the energy analysis of the CRSO DEIS.
Sierra Club is the nation’s oldest and largest grassroots environmental organization. Founded in 1892,
Sierra Club now has over three million members and supporters, including more than 250,000 in the
Pacific Northwest. Sierra Club’s mission is to explore, enjoy, and protect the wild places of the earth;
to practice and promote the responsible use of the earth’s ecosystems and resources; to educate and
enlist humanity to protect and restore the quality of the natural and human environment; and to use all
lawful means to carry out these objectives.
American Rivers, founded in 1973, is the leading conservation organization working to protect our
nation’s rivers and streams. American Rivers' mission is to protect wild rivers, restore damaged rivers
and conserve clean water for people and nature. nature. Our strength lies in our 355,000 members,

Joint Commenters Comments on CRSO DEIS April 13, 2020 - Page 3
supporters and volunteers from all 50 states, thousands of whom live, work and recreate in the
Columbia Basin.
Save Our wild Salmon Coalition (SOS) formed in 1992. SOS brings together conservationists, sport
and commercial fishing interests, clean energy and orca advocates, scientists and others working to
protect and restore abundant, self-sustaining populations of Columbia and Snake river salmon and
steelhead and the many benefits they bring to Northwest communities and ecosystems.
Joint Commenters Comments on CRSO DEIS April 13, 2020 - Page 4
_________________________________________________________________________________
Key Findings
The DEIS confirms that dam breaching and clean energy power replacement can maintain
electric system reliability while providing the best chance for fish restoration.
• The DEIS acknowledges that a replacement portfolio of new, clean energy resources
can meet electricity needs without compromising system reliability.
• The DEIS found that dam breaching is the only option that, with additional
improvements, could increase fish return rates to a level that may support recovery and
preservation of at least some salmon and steelhead populations.
The DEIS fails to meet energy industry resource planning standards, resulting in numerous
inaccuracies and an exaggerated cost for clean energy power replacement.
• The errors stem from a failure to adequately consider a full range of possible
replacement resources, a failure to optimize the selected replacement resources to
achieve the most efficient outcome, and outdated and incomplete cost assumptions for
replacement resources.
• These shortcomings were exacerbated by the use of inconsistent time frames for
different elements of the analysis, the use of a static year rather than a multi-year
analysis of the replacement portfolio, and by the arbitrary assumption of a 2022
implementation date.
• The result is an exaggerated estimate of clean energy replacement costs leading to a similarly
exaggerated estimate of impacts to consumer electricity bills
Because the DEIS fails to provide the accurate information needed to make informed decisions, a
new, more rigorous study is required.
• A study that meets the standards of the region’s utilities and the Northwest Power and
Conservation Council for integrated resource planning (IRP) would examine energy and
capacity needs over a span of 20 years, fully explore demand requirements and resource
options, and test and optimize combinations of possible replacement resources. The
result would be:
• Significantly lower costs to acquire wind, solar, storage, and demand-side
resources.
• Less need for new generating and transmission resources because demand
response and energy efficiency would make larger contributions than the DEIS
assumes.
• A more efficient and cost-effective system that could improve region-wide
reliability and greatly reduce the impact on customer rates.
_________________________________________________________________________________

Joint Commenters Comments on CRSO DEIS April 13, 2020 - Page 5
1. Introduction
In these comments, the Joint Commenters respond to elements contained in the CRSO DEIS
concerning the feasibility and cost of replacing the electricity and grid services currently provided by
hydropower generation at the four lower Snake River dams with a portfolio of new clean energy
resources.
The Joint Commenters have reviewed the Preferred Alternative (PA) and the four Multiple Objective
Alternatives, particularly Multiple Objective Alternative 3 (MO3) proposing breach of the four Lower
Snake River (LSR) dams and retirement of their associated hydrogeneration facilities, along with
additional spill operations in the Lower Columbia River.
The Joint Commenters note that the DEIS confirms the feasibility of clean energy resources taking the
place of LSR hydrogeneration in reliably delivering electricity to customers. We also note that the
dam breach alternative (MO3) is projected to have more potential for improving life cycle return rates
and abundance of ESA listed Snake River salmon and steelhead stocks, in comparison to the Preferred
Alternative and the other Multiple Objective Alternatives.
While MO3 clearly provides the best outcome for ESA listed species, the agencies rejected this
alternative due to alleged concerns about costs to electricity customers in the region. However, as our
comments below demonstrate, the DEIS energy analysis is substantially deficient and has a multitude
of shortcomings and omissions.
As a result, the proposed power replacement portfolios for the Preferred Alternative and the Multiple
Objective Alternatives – especially MO3 – fall far short of providing optimized, least cost and least
risk energy alternatives and significantly exaggerate the cost of clean energy replacement. By relying
on deficient analysis to support the Preferred Alternative, the agencies failed to comply with NEPA
law and regulations.
1.1 Effects of DEIS Alternatives for ESA Listed Species
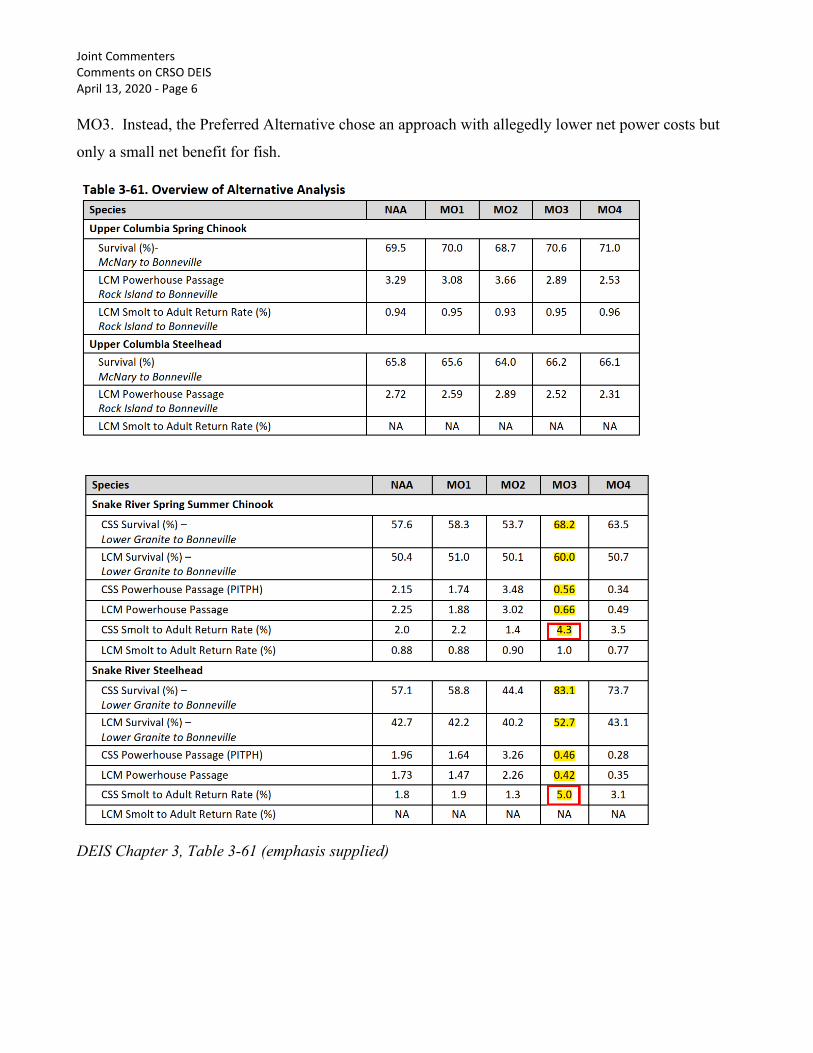
The DEIS analysis clearly shows that MO3 results in the most improvement for Lower Snake salmon
and steelhead compared to the No Active Alternative and the other Multiple Objective Alternatives
(see Table 3-61 below). However, the Preferred Alternative did not incorporate the main elements of
Joint Commenters Comments on CRSO DEIS April 13, 2020 - Page 6
MO3. Instead, the Preferred Alternative chose an approach with allegedly lower net power costs but
only a small net benefit for fish.
DEIS Chapter 3, Table 3-61 (emphasis supplied)
Joint Commenters Comments on CRSO DEIS April 13, 2020 - Page 7
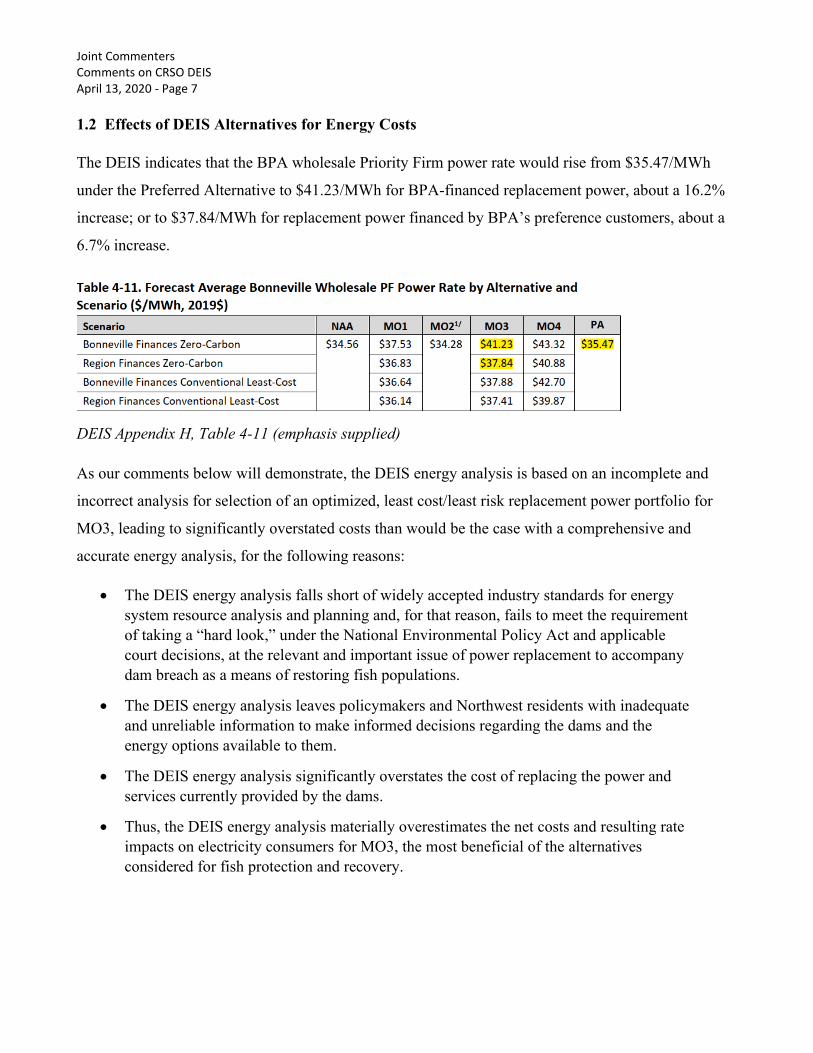
1.2 Effects of DEIS Alternatives for Energy Costs
The DEIS indicates that the BPA wholesale Priority Firm power rate would rise from $35.47/MWh
under the Preferred Alternative to $41.23/MWh for BPA-financed replacement power, about a 16.2%
increase; or to $37.84/MWh for replacement power financed by BPA’s preference customers, about a
6.7% increase.
DEIS Appendix H, Table 4-11 (emphasis supplied)
As our comments below will demonstrate, the DEIS energy analysis is based on an incomplete and
incorrect analysis for selection of an optimized, least cost/least risk replacement power portfolio for
MO3, leading to significantly overstated costs than would be the case with a comprehensive and
accurate energy analysis, for the following reasons:
• The DEIS energy analysis falls short of widely accepted industry standards for energy
system resource analysis and planning and, for that reason, fails to meet the requirement
of taking a “hard look,” under the National Environmental Policy Act and applicable
court decisions, at the relevant and important issue of power replacement to accompany
dam breach as a means of restoring fish populations.
• The DEIS energy analysis leaves policymakers and Northwest residents with inadequate
and unreliable information to make informed decisions regarding the dams and the
energy options available to them.
• The DEIS energy analysis significantly overstates the cost of replacing the power and
services currently provided by the dams.
• Thus, the DEIS energy analysis materially overestimates the net costs and resulting rate
impacts on electricity consumers for MO3, the most beneficial of the alternatives
considered for fish protection and recovery.
Joint Commenters Comments on CRSO DEIS April 13, 2020 - Page 8
The detailed discussion below explains why the Joint Commenters have arrived at these conclusions
and why we believe there remains a need for a rigorous and thorough study examining the cost and
efficacy of affordable clean energy alternatives before the agencies complete the Final EIS process and
issue their Records of Decision.
1.3 Context of the Joint Commenters’ Comments
The CRSO DEIS energy analysis is briefly summarized in the Executive Summary, described
extensively in Chapter 3, especially Section 3.7, Power Generation and Transmission, with supporting
detail particularly in Appendix H (Power and Transmission), Appendix I (Hydroregulation), Appendix
J (Hydropower) and Appendix Q (Cost Analysis).
By “energy analysis” here and below, the Joint Commenters refer to the assessment and discussion in
the DEIS relating to hydrogeneration and transmission operations providing energy service from the
Columbia River System to the preference customer utilities of the Bonneville Power Administration, as
well as to the Northwest region and beyond, considering the No Action Alternative, the Preferred
Alternative and the four Multiple Objective Alternatives.
In this comment, the Joint Commenters focus on the Preferred Alternative (PA) and Multiple Objective
Alternative 3 (MO3), often referred to as the “dam breaching” alternative. The key element of MO3 is
the breach of the four Lower Snake River dams (Little Goose, Lower Monumental, Lower Granite and
Ice Harbor) and retirement of their respective hydropower generation and related facilities. MO3 also
includes additional spill operations at the four Lower Columbia CRS hydro projects and other related
measures.
Under MO3, dam breach would return the Lower Snake River to a free-flowing condition connecting
the lower Columbia River to substantial salmon and steelhead habitat throughout southeast
Washington, northeast Oregon and central Idaho. The DEIS demonstrates that MO3 has, by a
substantial margin, the highest likelihood of assisting wild salmon and steelhead stocks currently listed
as threatened or endangered under the Endangered Species Act (ESA) to achieve the life cycle viability
and abundance levels needed for their protection and potential recovery
To achieve benefits for Snake River basin fish and related environmental benefits, the dam breach
under MO3 would also require the retirement of the hydropower facilities in the Lower Snake River
Joint Commenters Comments on CRSO DEIS April 13, 2020 - Page 9
dams and, consequently, replacement of the energy services they currently provide. These measures
may be needed to support continuing achievement of the Bonneville Power Administration’s statutory
and contractual obligations, including its preference customer requirements, and for other purposes,
although we have no information upon which to determine exactly what energy services need to be
replaced to meet BPA’s statutory and contractual obligations based on the DEIS analysis.
Lower Snake River dam breach, hydropower retirement and replacement power strategies have been
the focus of numerous previous studies, including the Lower Snake River Juvenile Salmon Migration
Feasibility Report/Environmental Impact Statement1 (2002 LSR EIS). The Joint Commenters
reviewed this study and others conducted over subsequent years.
1.4 NWEC/ICL Scoping Comments
The Joint Commenters review of the CRSO DEIS uses the scoping comments submitted on February
7, 2017 by the NW Energy Coalition and the Idaho Conservation League (“NWEC/ICL Scoping
Comments”) as a basis to assess the Preferred Alternative and MO3 energy analysis. That submission
is submitted along with these comments for reference.
In the Scoping Comments, NWEC and ICL proposed that the CRSO EIS energy analysis be conducted
in accordance with widely accepted practices for utility integrated resource planning (IRP), using a
scenario assessment approach, a combination of advanced computer modeling tools and expert
judgment to provide a fully optimized energy portfolio selected with respect to a least cost/least risk
perspective. This combination of elements, based on longstanding principles and practices of IRP
analysis, is needed to effectively assess programmatic alternatives for achieving the energy oriented
outcomes defined for the CRSO EIS.
The NWEC/ICL Scoping Comments provided the following summary of recommendations:
• Ongoing support by an independent technical review panel consisting of the Agencies
and a broad range of stakeholders, as well as ongoing public input to assure the full
range of information and experience can be provided to the assessment.
1 https://www.nww.usace.army.mil/Library/2002-LSR-Study/
Joint Commenters Comments on CRSO DEIS April 13, 2020 - Page 10
• Evaluation of the current operations of the LSR dams within the context of the
Columbia River System, the Northwest regional power system, and the Western
Interconnection.
• Assessment and comparison of continued operation of the LSR dams and potential
alternative resource portfolios that could better meet CRS responsibilities while
minimizing or eliminating environmental impacts and meeting all federal statutory and
regulatory requirements. Alternatives to be considered should include:
(1) continued operation of the LSR dams (no action alternative);
(2) reduced operation of the LSR dams to provide additional spill for fish passage,
including a resource portfolio of replacement energy resources;
(3) full replacement of the LSR dams with a range of potential resource alternatives.
• Consideration of the full range of electric services provided by the LSR dams and
alternative portfolios – energy, capacity, flexibility and reliability – from the
perspective of electric system requirements, not merely the potential output of an
electric resource, as well as their environmental costs and benefits.
• Utilization of transparent, consistent and commonly accepted methods, inputs, metrics
and analysis.
• Consideration of future system conditions through a scenario assessment framework, to
assess potential changes in energy demand, resource availability and cost, economic
trends, energy policy, climate change and other key factors.
• Consideration of ongoing changes and improvements to the Columbia River System,
Northwest power system and Western Interconnection.
• Balancing the costs of all alternative actions against the risks inherent in any forward
looking assessment, including environmental costs and benefits.
NWEC/ICL Scoping Comments at 2-3
First, the NWEC/ICL Scoping Comments proposed that the energy assessment be conducted with
assistance from a technical review team, similar to the Hydropower Impact Team that assisted with the
2002 LSR EIS.2 That team included 16 subject matter experts from the US Army Corps of Engineers,
2 Lower Snake River Juvenile Fish Mitigation Feasibility Study: Technical Report on Hydropower Costs and Benefits,
Drawdown Regional Economic Workgroup: Hydropower Impact Team, March 1999,
https://www.nww.usace.army.mil/portals/28/docs/environmental/drew/powerdoc.pdf
Joint Commenters Comments on CRSO DEIS April 13, 2020 - Page 11
the Bonneville Power Administration, other federal agencies, the Northwest Power and Conservation
Council, utilities, industry representative and the NW Energy Coalition.
Such a technical review had proven its worth for the 2002 LSR EIS and could assist in defining the
methods and reviewing the results of the DEIS energy assessment to consider alternative federal
actions to comply with NEPA and ESA requirements in a complex and fast-changing CRS and
regional electric power system context. And as further explained below, utility integrated resource
planning (IRP) generally includes a stakeholder technical review process to provide guidance, concepts
and data for the planning process.
Second, a key element of comprehensive energy analysis is the consideration of a wide range of
alternative resource options and future scenarios of supply, demand and system conditions. As stated
in the NWEC/ICL Scoping Comments:
Considering a range of alternatives to the proposed action “is the heart of the
environmental impact statement” and the action agencies must “rigorously explore and
objectively evaluate all reasonable alternatives.” 40 C.F.R § 1502.14. This evaluation
must be based on “accurate scientific analysis, expert agency comments, and public
scrutiny.” 40 C.F.R. § 1500.1(b). Moreover, “Agencies shall insure the professional
integrity, including scientific integrity, of the discussions and analyses in environmental
impact statements.” 40 C.F.R. § 1502.24.
NWEC/ICL Scoping Comments at 5
As the NWEC/ICL Scoping Comments observed, substantial changes have occurred within the
Columbia River System and the electric power system of the Pacific Northwest and Western
Interconnection in the two decades since the bulk of the energy analysis for the 2002 EIS was
conducted in 1997-99.
As discussed below, the DEIS fails to fully consider the effects these changes and others with direct
bearing on the CRS, and hence fails to provide the public and decision-makers with relevant and
important information to make an informed choice among the alternatives presented in the DEIS. This
is a significant failure.
Joint Commenters Comments on CRSO DEIS April 13, 2020 - Page 12
1.5 Lower Snake River Dams Power Replacement Study
Considering the above factors, the NW Energy Coalition commissioned a feasibility study to assess
whether Lower Snake River hydropower could be replaced with a clean energy portfolio. The study
modeling and assessment were conducted independently by Energy Strategies, a respected technical
consulting firm with three decades of experience in transmission and power planning across the
Western Interconnection.
The Energy Strategies 2018 study3 was developed under an innovative framework employing multiple
models familiar to and used by power and transmission planners in the Northwest. The study also used
the most current available data from authoritative sources such as the Northwest Power and
Conservation Council and ColumbiaGrid. The multi-model framework enabled a feasibility analysis
of the potential and cost for clean energy resources to replace the energy services of LSR
hydrogeneration while preserving Northwest power system resource adequacy and operational
reliability. The study concluded that a clean energy replacement for Lower Snake River hydropower
would result in an affordable, adequate and reliable Northwest power system.
It is important to note that the Energy Strategies 2018 study was intended to be a feasibility
assessment, not a comprehensive review. In commissioning the study, NWEC anticipated that the
CRSO EIS, already underway, could provide the comprehensive review needed to comply with the
legal requirement of the National Environmental Policy Act to provide a “hard look” at the options
available to mitigate the environmental effects of Columbia River System operations, especially on
threatened and endangered species in the Lower Snake River basin. Thus, the Energy Strategies 2018
study was intended to provide an input to the DEIS, and to help inform the public and decision-makers
in the Northwest.
However, the Joint Commenters below show how the energy analysis conducted for the CRSO review,
as reported in the Draft Environmental Impact Statement, falls short of “hard look” required by NEPA.
3 Energy Strategies, Lower Snake River Dams Power Replacement Study: Assessing the technical feasibility and costs of
clean energy replacement portfolios, April 2018, available at: https://nwenergy.org/featured/lsrdstudy/
Joint Commenters Comments on CRSO DEIS April 13, 2020 - Page 13
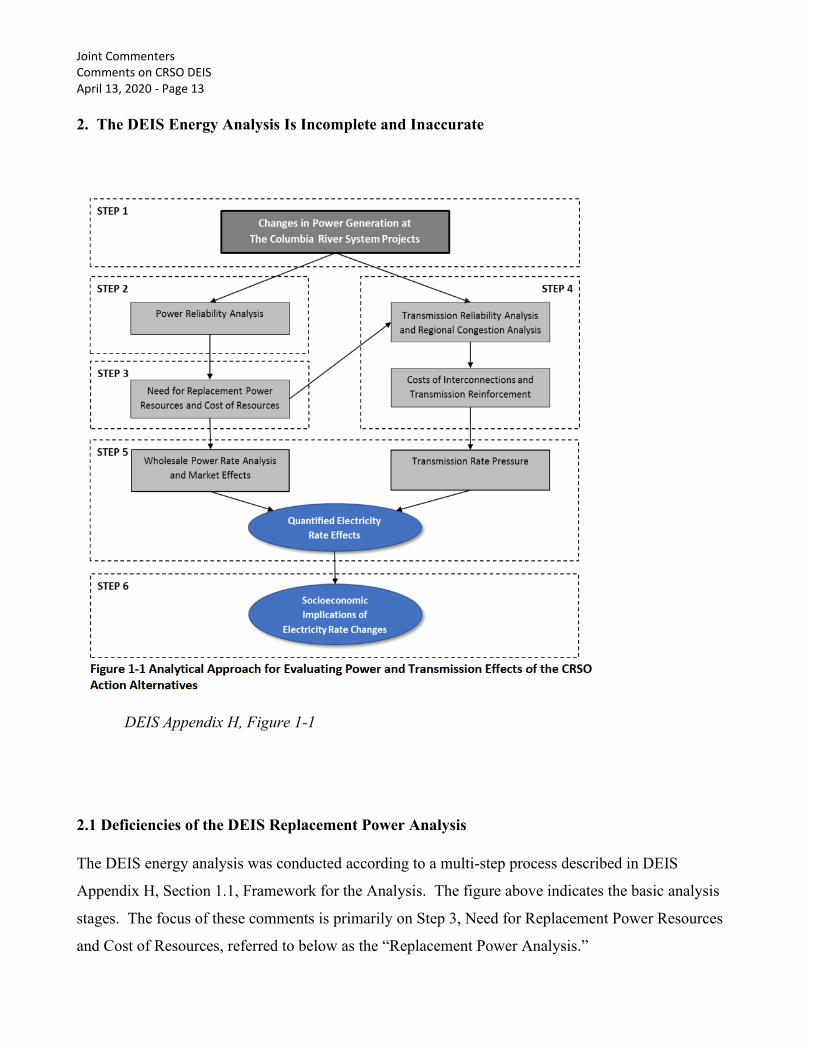
2. The DEIS Energy Analysis Is Incomplete and Inaccurate
DEIS Appendix H, Figure 1-1
2.1 Deficiencies of the DEIS Replacement Power Analysis
The DEIS energy analysis was conducted according to a multi-step process described in DEIS
Appendix H, Section 1.1, Framework for the Analysis. The figure above indicates the basic analysis
stages. The focus of these comments is primarily on Step 3, Need for Replacement Power Resources
and Cost of Resources, referred to below as the “Replacement Power Analysis.”
Joint Commenters Comments on CRSO DEIS April 13, 2020 - Page 14
Because the outcome of Step 3 directly shapes the results achieved in the first stage of Step 5,
Wholesale Power Rate Analysis and Market Effects, and Step 6, Socioeconomic Implications of
Electricity Rate Changes, the inaccurate and insufficient analysis in the Replacement Power Analysis
renders the conclusion of the DEIS energy analysis on wholesale power rates and consumer bill
impacts equally inaccurate and insufficient.
The Replacement Power Analysis is the pivotal component of the DEIS energy analysis. This stage of
the framework is essential for: (1) fully and accurately estimating the energy system value of the CRS
and particularly the hydrogeneration of the four Lower Snake River project; and (2) fully and
accurately assessing options for need, cost and performance of replacement power under the Preferred
Alternative and four Multiple Objective Alternatives.
As recommended in the NWEC/ICL Scoping Comments and further explained below, an integrated
resource planning (IRP) process is the established and longstanding method for this type of
comprehensive assessment, as conducted by the Northwest Power and Conservation Council and the
region’s electric utilities. The Oregon Public Utility Commission summarized its guidelines for IRP
analysis as follows:
Consistent with our guidelines, a utility's IRP must include the following key
components:
• Identification of capacity and energy needs to bridge the gap between expected
loads and resources
• Identification and estimated costs of all supply-side and demand-side resource
options
• Construction of a representative set of resource portfolios
• Evaluation of the performance of the candidate portfolios over the range of
identified risks and uncertainties
• Selection of a portfolio that represents the best combination of cost and risk for the
utility and its customers.
Oregon Public Utility Commission, Order No. 17-386, October 9, 2017
Below, we review the generally accepted process and the foundational elements for IRP analysis. We
compare that approach with the specific steps, data inputs, modeling constraints and other factors
Joint Commenters Comments on CRSO DEIS April 13, 2020 - Page 15
employed in the DEIS Replacement Power Analysis, and describe how the DEIS fails to achieve the
provide a complete, accurate and rational DEIS energy analysis.
2.2 The CRSO DEIS Does Not Follow Established Methods for Integrated Resource Planning
The electric power system provides essential services and is comprised of critical infrastructure and
systems supporting the entire economy, including life, health and safety. Because the system is
capital-intensive and must continuously and simultaneously optimize reliability, economic and
environmental objectives, integrated resource planning is designed to explore a wide range of possible
conditions for electric power demand, resource supply, availability and cost, and coordination of
generation, transmission, distribution and demand side components over time.
IRP assessments must consider long time horizons, typically 20 years or more, because of the capital
intensity and long operating lifetime of energy resources. Thus, integrated resource planning helps
reduce the risks of overinvestment, threats to system reliability, and excessive environmental impacts.
IRP assessment must also consider various forms of system constraints and risks. As a result, IRP
assessment includes a rigorous review of alternatives in order to achieve a “least cost/least risk”
outcome.
As a consequence, IRP analysis must review existing system resources and consider the need for new
resources as the consequence of potential resource retirements, future changes in power demand, and
the effects of technology innovation on the cost and availability of new resources. The IRP analysis
must then consider a wide range of resource portfolios, including options for new resources, using
scenario assessment. Finally, the IRP must assess the range of potential portfolios through the “least
cost/least risk” lens and select the new portfolio that can best meet system needs.
As the comments below demonstrate, the DEIS energy analysis fails to achieve any of these
requirements. As a consequence, the results greatly overstate the costs and understate the benefits
especially of MO3.
Joint Commenters Comments on CRSO DEIS April 13, 2020 - Page 16
Foundational IRP Element #1: Long-Term Assessment
Summary: The DEIS Replacement Power Analysis focuses on a single study year – 2022 –
rather than a 20-year planning horizon, in accordance with established best practice.
The DEIS does not explain why the single reference year was chosen for the Replacement
Power Analysis and does not explain the choice of 2022 as the reference year.
As a result, the DEIS analysis does not test for a comprehensive range of loads, resources,
interconnection and system conditions over time, in accordance with IRP assessment.
Utility IRP methods generally include a long-term planning horizon; 20 years is often used as
providing the best balance between the uncertainties of future system conditions and the long lead
times, capital intensity and extended lifetime of new resources, which typically ranges from 5 to 50
years. In the Northwest, the Northwest Power and Conservation Council, Portland General Electric,
PacifiCorp, Chelan PUD, Avista Utilities, Idaho Power, Puget Sound Energy, Seattle City Light and
many others use 20 years as the time horizon for their IRPs, even when they expect specific resource
retirements.
In contrast, the DEIS Replacement Power Analysis uses a single planning year, 2022. By choosing a
single reference year, the DEIS energy assessment provides a “snapshot” view that is arbitrary,
incomplete and not at all indicative of the dynamic conditions expected for CRS operations over the
coming years and decades. This precludes the long-term system assessment required to consider
changing conditions for the CRS over many years and decades.
In addition, as discussed at length below, the use of a 2022 reference year is particularly inappropriate
for MO3. As a consequence, the replacement power portfolio for MO3 is not adequately assessed and
is very likely to have much higher apparent cost than would be the case with a more appropriate
starting date and long-term assessment in line with standard IRP practice.
Foundational IRP Element #2: Scenario Assessment
Summary: Unlike standard utility IRP assessment, the DEIS conducts an extremely limited
review of scenarios. The DEIS does not explain why this very limited set of scenarios was
chosen instead of the multi-factor and more wide-ranging scenario assessment needed for a
comprehensive, accurate and sufficient Replacement Power Analysis.
Joint Commenters Comments on CRSO DEIS April 13, 2020 - Page 17
Using an appropriate long-term time horizon for an IRP assessment enables planner to assess existing
and new resources under a wide range of future system conditions, considering changes in electricity
demand, climate change, technology innovation, energy markets and other dynamic factors. To
facilitate the IRP process, these varying elements are aggregated together as scenarios. The purpose of
scenario assessment, broadly speaking, is to test the “feasibility space” of different resource portfolios
in meeting future demand requirements under widely varying conditions.
For example, the Northwest Power and Conservation Council’s 7th Northwest Power Plan4 includes
more than 20 scenarios, each assessed against 800 futures generated from combinations of regional
load and resource projections under conditions. The scenario assessment considers historical
temperature, rainfall and Columbia basin hydrosystem conditions, and includes forward projections for
fuel (especially natural gas), power market prices, current and future resource costs, and many other
factors.
In stark contrast to established best practices, the DEIS energy analysis provides a very limited
assessment. The Replacement Portfolio Analysis in Step 3 of the framework, in which the replacement
resource mix for each DEIS alternative is selected, effectively has only a single scenario. The
subsequent wholesale and retail “rate pressure” analysis in Steps 5 and 6 of the process have a very
limited set of sensitivities.
As a result, the DEIS energy analysis, particularly for the crucial portfolio selection in Step 3, does not
set forth a rational range of scenarios commensurate with standard IRP practice, and the DEIS does not
explain why it failed to do so. Under NEPA, “Agencies shall insure the professional integrity,
including scientific integrity, of the discussions and analyses in environmental impact statements.”5 By
failing to adhere to established industry practices, this DEIS is not the requisite “hard look” under
NEPA.
4 Northwest Power and Conservation Council, Seventh Northwest Conservation and Electric Power Plan, February 2016,
https://www.nwcouncil.org/reports/seventh-power-plan 5 40 CFR § 1502.24.

Joint Commenters Comments on CRSO DEIS April 13, 2020 - Page 18
Foundational IRP Element #3: Resource Portfolio Optimization
Summary: The DEIS does not conduct the iterative, progressive approach to resource
portfolio optimization that is key to recommending a robust new resource plan to meet the
least cost/least risk criterion.
Instead, the DEIS considers a single, static metric for resource adequacy in a single year,
2022, and does not proceed to any of the other steps considered essential for rational
resource optimization in standard utility IRP practice.
Resource portfolio optimization in a crucial step in the IRP process, and thus a major part of any
legitimate energy system plan. Without optimization, it is nearly certain that the resulting resource
portfolio will have significantly greater cost, weaker performance and lower system value than it
should. While the effort to optimize resource portfolios must be methodical and thorough, a wide
range of methods and models can be used to accomplish this key outcome.
The resource portfolio development process must be rigorous, comprehensive and as objective as
possible, and must be guided by a careful mix of modeling and expert judgment. As mentioned above,
the process for IRP resource portfolio optimization typically starts with development of a wide range
of system scenarios and resource portfolios, which are then iterated in stages. At each stage, the range
of candidate portfolios is narrowed and re-optimized, leading toward selection of a preferred resource
portfolio in the final stage that best meets all relevant criteria and constraints.
An optimized resource portfolio must include a review of both existing and potential new resources,
including all their relevant capabilities and costs. The review must assess all current and potential new
resources on a comparable basis, using multiple criteria covering capital and operating cost,
environmental cost and benefit, and system resource adequacy and operational reliability.
Because energy resources have varying costs, capabilities and effects, they interact differently with the
overall power system. The potential contribution of each resource to total system value must be
examined in concert with all others. The ultimate measure is not the performance of a given resource
on its own, but rather how individual resources interact with the electric system to provide reliable,
affordable energy to customers.
IRP resource portfolio optimization includes many performance metrics and constraints. In overview,
these include operational reliability, resource adequacy, and energy, capacity and flexibility value.
Joint Commenters Comments on CRSO DEIS April 13, 2020 - Page 19
The resource portfolio development process must be rigorous, comprehensive and as objective as
possible, and must be guided by a careful mix of modeling and expert judgment. The outcome must be
a preferred resource portfolio that meets least cost/least risk criteria.
As mentioned above, the process for IRP resource portfolio optimization typically starts with
development of a wide range of system scenarios and resource portfolios, which are then iterated in
stages. At each stage, the range of candidate portfolios is narrowed and re-optimized, leading toward
selection of a preferred resource portfolio in the final stage that best meets all relevant criteria and
constraints.
In contrast to these established methods, models, data and review processes, the DEIS Replacement
Power Analysis, conducts only the most cursory approach to developing replacement power portfolios
for the alternatives under consideration. As described more fully below, the DEIS does not explain
why the analysis did not incorporate other data and factors that were readily available to the energy
analysis to develop robust resource portfolios that could be selected through scenario assessment,
portfolio optimization and least cost/least risk screening. The DEIS does not conduct a review of a
range of potential resource portfolios, then narrow them down by testing them across a wide range of
scenarios over time.
The DEIS does not explain why the alternatives are assessed with respect to a single study year, 2022,
rather than the long-term horizon that is standard practice. The DEIS energy analysis therefore has
resulted in a materially incomplete, misleading and arbitrary assessment of replacement options for all
alternatives presented, and most especially MO3.
Development of DEIS Replacement Power Portfolios
The DEIS describes the Replacement Power Analysis portfolio selection process as follows:
To determine the optimal mix of resources under each portfolio, this analysis assesses
the cost-effectiveness of specific power resources by dividing the total costs by the
LOLP benefit. The most cost-effective resources were then added into the GENESYS
model until the resulting LOLP reached the No Action Alternative LOLP (6.6 percent).
DEIS, Appendix H at line 606
Joint Commenters Comments on CRSO DEIS April 13, 2020 - Page 20
A check against resource adequacy is a key part of any IRP process. But assessing the adequacy of an
alternative is fundamentally different than developing that alternative in the first place. The use of a
resource adequacy model to develop resource portfolios is not a rational way to match the demanding
test of meeting all system requirements over multiple years and decades in a least cost/least risk
fashion.
We start by reviewing the loss of load probability (LOLP) metric. The LOLP is a measure of system
resource adequacy in a future year. It is a metric that is widely used in the electric utility industry to
assess whether sufficient system resources will exist in each operating hour across a year to meet
anticipate system demand.
The Northwest Power and Conservation Council developed the GENESYS model two decades ago to
assess the resource adequacy of the Northwest regional power system using the LOLP metric as a
primary measure. GENESYS is regarded as being the most capable model for that purpose in the
Northwest, in particular because of its highly sophisticated emulation of CRS hydrogeneration under a
full range of hydrological flow, hydrogeneration and power system conditions.
The Council resource adequacy assessment is updated annually and looks forward five years. The
assessment has proven to be highly robust and provides valuable guidance for regional decision makers
and the public. However, that assessment only includes existing resources and committed new
resources, including the Council’s regional energy efficiency target. The annual resource adequacy
assessment does not generate and test candidate power portfolios to fill any resource adequacy gap –
that effort is considered in the Council’s Northwest Regional Power Plan every five years.
The agencies here have ready access to the appropriate tools to develop optimized resource portfolios.
To develop the preferred resource mix for the Northwest Regional Power Plan, the Council uses its
capital expansion model, the Regional Portfolio Model (RPM). Capital expansion models are the core
of IRP assessment, because they simulate power system conditions over the planning time horizon for
the scenarios, data, constraints and resource portfolios of a full IRP assessment. Their outputs can be
used to iterate, optimize and select the least cost/least risk preferred portfolio. Some capital expansion
models are vendor-supplied, while others, like the Council’s RPM, are internally developed.
Regardless of source, the established industry practice is to use capacity expansion tools to develop
Joint Commenters Comments on CRSO DEIS April 13, 2020 - Page 21
alternative portfolios, and then use resource adequacy tools to assess these alternatives. The DEIS
skipped this step to develop a robust set of alternatives and thus fails to comply with NEPA.
The DEIS Replacement Power Analysis consisted of three steps.
First, GENESYS was used to derive loss of load probability (LOLP) values for the existing Northwest
power system as modeled in 2022 under the median water scenario. This resulted in a 6.6% annual
LOLP metric. This is a static annual value for the single year of 2022 and does not incorporate future
changes of loads, resources, climate change and future hydro variability, changes in western power
markets and many other factors that must be considered in IRP analysis.
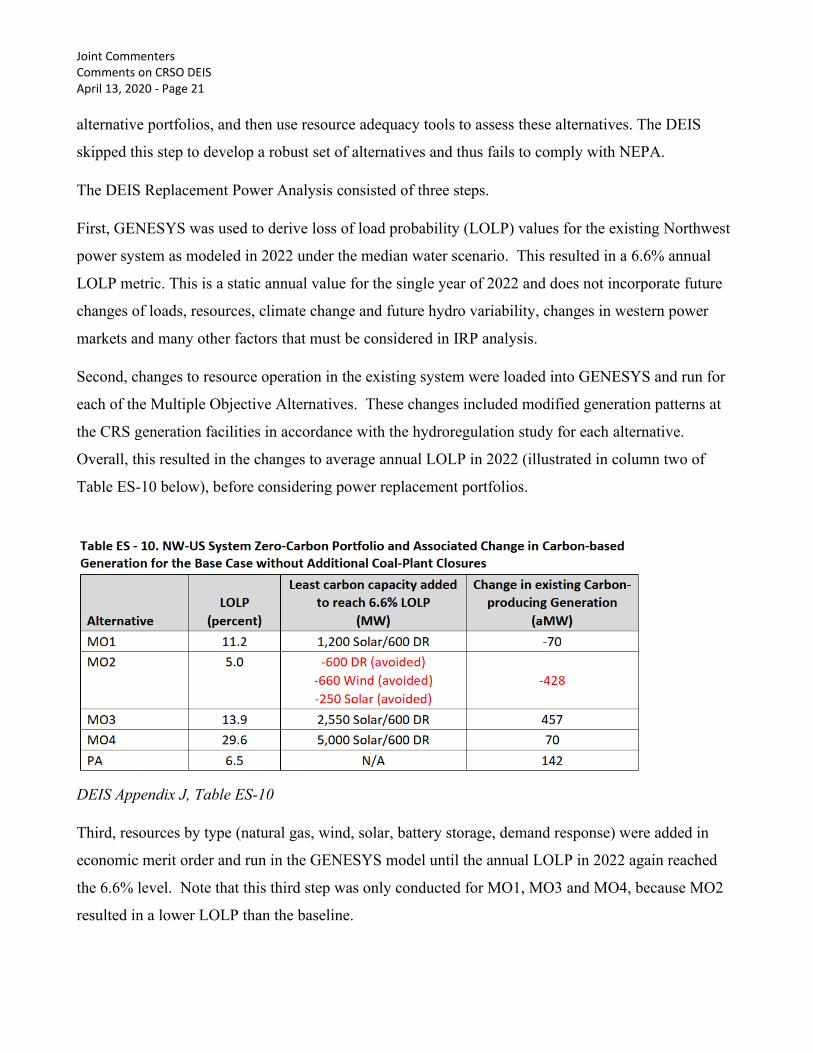
Second, changes to resource operation in the existing system were loaded into GENESYS and run for
each of the Multiple Objective Alternatives. These changes included modified generation patterns at
the CRS generation facilities in accordance with the hydroregulation study for each alternative.
Overall, this resulted in the changes to average annual LOLP in 2022 (illustrated in column two of
Table ES-10 below), before considering power replacement portfolios.
DEIS Appendix J, Table ES-10
Third, resources by type (natural gas, wind, solar, battery storage, demand response) were added in
economic merit order and run in the GENESYS model until the annual LOLP in 2022 again reached
the 6.6% level. Note that this third step was only conducted for MO1, MO3 and MO4, because MO2
resulted in a lower LOLP than the baseline.
Joint Commenters Comments on CRSO DEIS April 13, 2020 - Page 22
This third step constitutes the full and entire process of developing the power replacement portfolios in
the DEIS. No additional iteration or optimization whatsoever was conducted. This process is not the
robust development and analysis of alternatives required by NEPA. The agencies do not explain how
the cost-effectiveness for each resource type was determined and how the resources were assembled in
economic order sequence to create each replacement power portfolio. Such details would normally be
explained at length during a standard IRP process.
The process described fails to select the best replacement portfolios considering their interaction with
the entire system, as would an adequate IRP assessment
As a result, it is nearly certain that the net costs of the replacement power portfolios resulting from the
DEIS Replacement Power Analysis significantly exceed what a fully optimized review would
accomplish. The DEIS fails to explain either why its limited approach is rational and reliable, nor why
it did not take the steps of a standard IRP analysis to weigh and optimize the many factors over the
long duration time horizon needed to select the lowest cost and least risk replacement portfolio,
especially for MO3.
Foundational IRP Element #4: Least Cost/Least Risk Assessment
Summary: The DEIS does not explain why the Replacement Power Analysis does not define
least cost/least risk criteria nor construct the power replacement portfolios to include all
factors necessary to achieve those criteria. In particular, the DEIS energy assessment does
not explicitly address system risk as well as system cost.
Therefore, the DEIS does not conduct a rational or robust least cost/least risk assessment
across a full planning horizon of 20 years or more.
Utility IRP analysis in the Pacific Northwest generally engages in some form of least cost/least risk
assessment. That is, rather than merely solving for a single objective function over time, such as
minimizing cumulative system cost, IRP modeling must also account for multiple elements of risk.
Among these are operational reliability, longer term resource adequacy, and financial risk. The
Oregon Public Utility Commission order on the Portland General Electric 2016 Integrated Resource
Plan describes the industry standard for least cost-least risk planning:
The IRP is a road map for providing reliable and least cost and least risk electric service
to the utility's customers, consistent with state and federal energy policies, while

Joint Commenters Comments on CRSO DEIS April 13, 2020 - Page 23
addressing, and planning for, uncertainties. The primary outcome of the process is the
selection of a portfolio of resources with the best combination of expected costs and
associated risks and uncertainties for the utility and its customers.”
Oregon PUC Order 17-386 at 3
Above we describe the industry best practice for developing alternative resource portfolios. In sum:
Tradeoff analysis and expert judgment must be combined with computer modeling to achieve a fully
optimized system portfolio that appropriately balances cost and risk.
To accomplish this result, a co-optimization approach is employed to find the best balance between
minimizing production cost over time (least cost) while also minimizing variation in both direct and
externality risks, usually through a proxy cost factor (least risk).
There are many recognized methods for achieving a least cost/least risk planning result and defining a
new resource portfolio, but the DEIS employed none of them.
For example, the Northwest Power and Conservation Council uses its Regional Portfolio Model (RPM)
to construct the preferred least cost/least risk resource mix for its 20-year resource portfolio and
associated 5-year action plan, all of which are updated approximately every five years in the Northwest
Regional Power Plan.
The RPM operates in quarterly steps over a 20-year time horizon. For each of more than 20 scenarios
in the 7th Northwest Power Plan, the RPM model generated about 800 futures representing ranges of
load, resource and market price conditions across the 80 time steps, incorporating additional elements
for risk assessment such as stochastic shocks to market prices. The RPM model selects the optimal
mix of existing and new resources across all time steps for each scenario and aggregates the results to a
cost metric and a risk metric.
The complete set of scenario cost and risk metrics across the 800 futures is then plotted to show an
“efficient frontier” where cost and risk are minimized. Finally, the Council reviews those scenarios
falling closest to the efficient frontier and applies further analysis, extensive stakeholder input and
expert judgment to select the future resource portfolio included in the 20-year regional plan and the
associated 5-year action plan.
Joint Commenters Comments on CRSO DEIS April 13, 2020 - Page 24
In contrast, to select the new resources for the Preferred Alternatives and the four Multiple Objective
Alternatives, the DEIS Replacement Power Analysis only assesses baseline conditions for the single
study year of 2022, rather than a multi-decade study period with a comprehensive scenario assessment.
The replacement power portfolios for each alternative consist of only two – the “least cost
conventional” portfolio and the “zero-carbon” portfolio. Those portfolios were selected to return
MO1, MO3 and MO4 to the 6.6% LOLP baseline of the No Action Alternative but not to meet any
other important performance criteria and constraints.
The set of two portfolio options for each DEIS alternative is far more limited than the wide range of
portfolios typically considered in IRP analysis. Rather than assessing the full range of energy,
flexibility and other criteria to steer toward a least cost/least risk portfolio, the criterion for selection of
the DEIS replacement portfolios is a single factor – resource adequacy as denoted by the LOLP metric.
This is not a rational, accurate or sufficient step to create an optimized, least cost/least risk power
replacement portfolio.
In conclusion, as a result of the omissions and deficiencies in the DEIS Replacement Power Analysis
for MO3, the results are incomplete and inadequate. Consequently, the rate pressure analysis in Step 5
and the socioeconomic impact analysis in Step 6 of the framework analysis, which are based entirely
on the Power Replacement Analysis, are likewise incomplete and inaccurate.
3. The Replacement Power Analysis Is Limited to A Single Study Year
As described in the previous section, Step 3 of the CRSO DEIS energy assessment framework, the
Replacement Power Analysis, includes a comparative analysis of the CRS system performance of the
proposed six alternatives based on a single year system assessment for the year 2022.
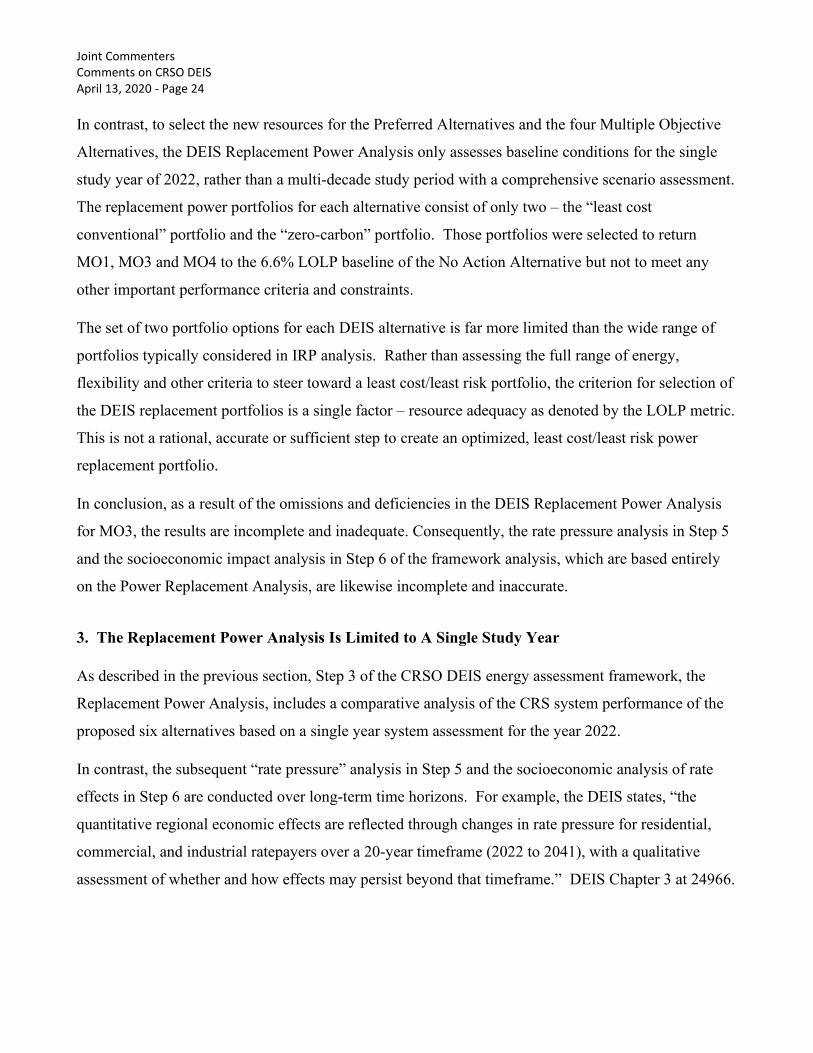
In contrast, the subsequent “rate pressure” analysis in Step 5 and the socioeconomic analysis of rate
effects in Step 6 are conducted over long-term time horizons. For example, the DEIS states, “the
quantitative regional economic effects are reflected through changes in rate pressure for residential,
commercial, and industrial ratepayers over a 20-year timeframe (2022 to 2041), with a qualitative
assessment of whether and how effects may persist beyond that timeframe.” DEIS Chapter 3 at 24966.

Joint Commenters Comments on CRSO DEIS April 13, 2020 - Page 25
3.1 The Choice of the Year 2022 is Infeasible and Inappropriate for Assessment of MO3
Even under the most rapid process conceivable, LSR dam breach and hydrogeneration retirement
cannot possibly be completed in 2022. The DEIS defends the use of the 2022 date as follows:
The construction costs for the structural measures were assumed to be implemented
over the first two years of the project (2021 and 2022), consistent with guidance
provided by the co-lead agencies. Although some of these measures, especially the dam
breaching measures, may take a number of years to implement or may not start for a
number of years (pending further studies), it was necessary to provide a consistent time-
frame for implementation in the evaluation to compare across the alternatives.
DEIS Appendix Q at Q-3-2
While we agree that using a consistent time-fram is important, the DEIS focus on 2022 is arbitrary
because, as the agencies admit, dam breach under MO3 is not be possible by 2022. Many financial,
engineering, contractual, legal and other steps are needed to accomplish dam breach, hydropower
retirement and related activities, as well as acquisition of the replacement power portfolio. Completion
of these activities under MO3 would take several years to put in place.
The choice of the starting year for the Replacement Power Analysis is consequential. Compared to a
later year that is closer to the first feasible time that MO3 can be implemented, many factors in the
regional power system and CRS will have changed. Of particular importance to the anticipated cost
for MO3, the ongoing decline of clean energy resource costs will proceed further because of
technology innovation and policy such as the Clean Energy Transformation Act in Washington,6
decreasing the actual cost of the replacement portfolio for MO3. Furthermore, the data and models
available for the DEIS energy analysis can easily accommodate a shift in the reference year for MO3.
The DEIS does not provide any rationale for the use of a single reference year for the Replacement
Power Analysis and other purposes, includes information to contradict that this is a reasonable date,
and still proceeds with the analysis of a flawed single reference year that biases the results of the
analysis. In conclusion, the DEIS’s explanation that use of a single reference year, 2022, is needed for
consistency across Alternatives is inadequate given the nature of resource planning.
6 See Washington State Department of Commerce, Clean Energy Transformation Act (CETA),
https://www.commerce.wa.gov/growing-the-economy/energy/ceta/
Joint Commenters Comments on CRSO DEIS April 13, 2020 - Page 26
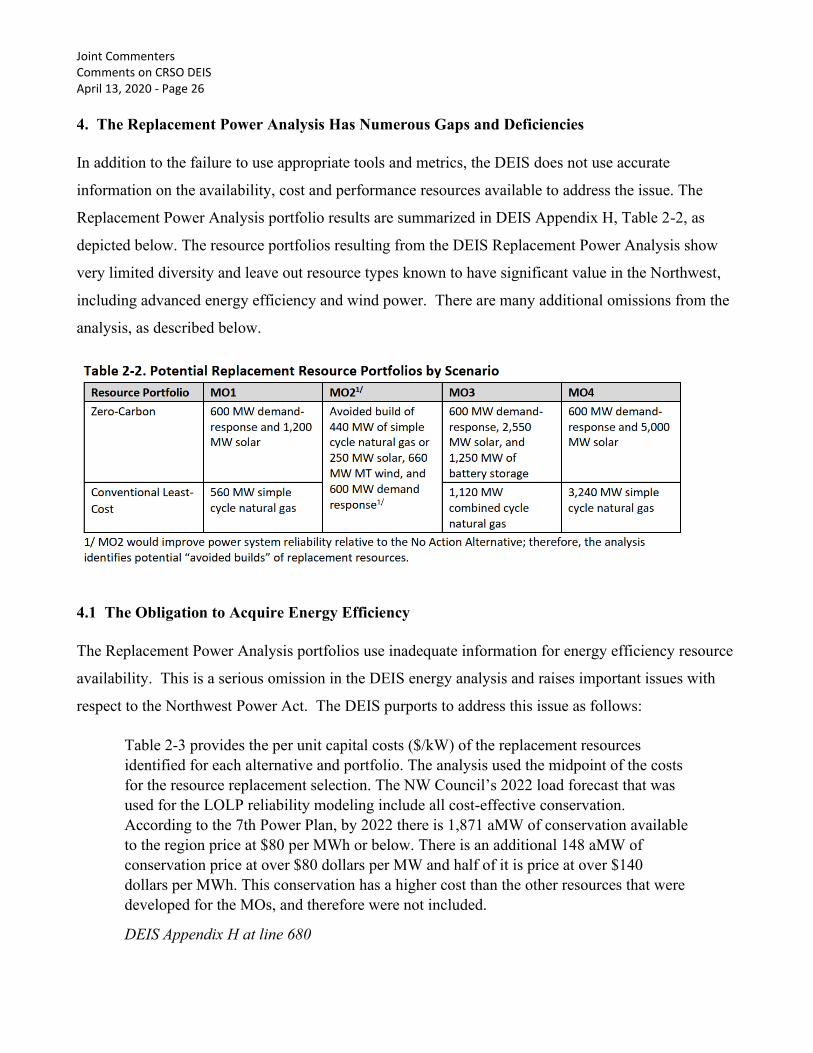
4. The Replacement Power Analysis Has Numerous Gaps and Deficiencies
In addition to the failure to use appropriate tools and metrics, the DEIS does not use accurate
information on the availability, cost and performance resources available to address the issue. The
Replacement Power Analysis portfolio results are summarized in DEIS Appendix H, Table 2-2, as
depicted below. The resource portfolios resulting from the DEIS Replacement Power Analysis show
very limited diversity and leave out resource types known to have significant value in the Northwest,
including advanced energy efficiency and wind power. There are many additional omissions from the
analysis, as described below.
4.1 The Obligation to Acquire Energy Efficiency
The Replacement Power Analysis portfolios use inadequate information for energy efficiency resource
availability. This is a serious omission in the DEIS energy analysis and raises important issues with
respect to the Northwest Power Act. The DEIS purports to address this issue as follows:
Table 2-3 provides the per unit capital costs ($/kW) of the replacement resources
identified for each alternative and portfolio. The analysis used the midpoint of the costs
for the resource replacement selection. The NW Council’s 2022 load forecast that was
used for the LOLP reliability modeling include all cost-effective conservation.
According to the 7th Power Plan, by 2022 there is 1,871 aMW of conservation available
to the region price at $80 per MWh or below. There is an additional 148 aMW of
conservation price at over $80 dollars per MW and half of it is price at over $140
dollars per MWh. This conservation has a higher cost than the other resources that were
developed for the MOs, and therefore were not included.
DEIS Appendix H at line 680
Joint Commenters Comments on CRSO DEIS April 13, 2020 - Page 27
However, analysis for the 7th Power Plan was primarily conducted in 2015 based on data available up
to that time. It has been five years since the 7th Plan energy efficiency analysis was conducted, and a
further two years until the DEIS Replacement Power Analysis single study year of 2022. Furthermore,
as extensively discussed above, resource acquisition to cover reductions in hydrogeneration under
MO3 would occur in some later year, during which time additional cost-effective energy efficiency
resources are likely to become available.
For the last several decades, energy efficiency has benefitted from rapidly emerging technology
innovation in residential, commercial and industrial energy use. These improvements in opportunities
for energy efficiency are not easily captured over long time horizons. Therefore, conservation
assessments from five years ago are outdated and of limited and uncertain usefulness for the DEIS
Replacement Power Analysis. Furthermore, the Council’s analysis provides estimates not just for a
single year, but for the changing costs and availability of energy efficiency over time.
However, the DEIS did not employ such data and methods, nor does the DEIS explain why such steps
were not taken to incorporate the most accurate available information. This calls into question the
validity of the price and availability of the energy efficiency resource used in this analysis.
In addition, the amount of cost-effective conservation chosen is a function of all the other aspects of
any given scenario and portfolio. According to the DEIS Replacement Power Analysis, under
alternatives MO1, MO3 and MO4, CRS hydrogeneration would decline, and therefore regional power
supply would fall relative to demand. As that occurs, costs will rise and the cost-effectiveness limit for
replacement resources will go up. The Council’s RPM model takes all of this into account, adjusting
for market price effects as it assesses, iterates and optimizes the selection of resources into its resource
portfolio.
But instead of incorporating all the dimensions of the Council’s energy efficiency analysis, the DEIS
chooses a crude average cost. This likely falls short of full assessment of additional cost-effective
energy efficiency that could be included in the DEIS replacement portfolios, thus decreasing their cost.
The DEIS does not explain the reasons for not using the full Council analysis.
Joint Commenters Comments on CRSO DEIS April 13, 2020 - Page 28
4.2 Overestimated New Resource Costs
The DEIS Replacement Power Analysis relies on supply resource cost data from the Council’s 7th
Northwest Regional Power Plan and its 2018 Midterm Assessment. DEIS Chapter 3 at line 673.
These resource costs are outdated and more recent cost data sources were available for the DEIS
analysis, but were not used.
For example, the National Renewable Energy Laboratory launched its Annual Technology Baseline
(ATB),7 which provides a sophisticated, freely available, fully documented framework for assessing
future resource costs that includes estimation of technical innovation, policy drivers and market
acceptance. The ATB has rapidly become an authoritative source for electric generation and battery
storage resource cost estimates.
Along with using stale information on costs and performance, the DEIS further overstates the cost of
MO3 by electing to start in 2022, a date the agencies themselves say is not a reasonable starting point.
Application of such outdated resource pricing further overstates the overall cost of MO3. If a more
feasible starting point is chosen, the continually declining costs of clean energy replacement resources
will materially decrease the cost of MO3.
Solar photovoltaic (PV) resources illustrate these concerns. While PV systems have been
commercially available since the 1970s, over the last decade PV has rapidly ascended to become a
leading source of renewable energy, along with wind power. This has been driven by rapid
technological innovation and development of global supply changes, and as a result costs have rapidly
decline.
Technical innovation continues to emerge with PV systems. In the last two years, bifacial PV modules
have rapidly become a significant fraction of the market, and are poised to become the dominant
format within the next few years. Because bifacial modules collect both direct insolation and reflect
surface energy, it is estimated they will add about 10% to output at little or no incremental cost.8
7 Annual Technology Baseline, National Renewable Energy Laboratory, atb.nrel.gov. 8 National Renewable Energy Laboratory, “Bifacial Solar Advances with the Times—and the Sun,” February 2020,
https://www.nrel.gov/news/features/2020/bifacial-solar-advances-with-the-times-and-the-sun.html
Joint Commenters Comments on CRSO DEIS April 13, 2020 - Page 29
Secondly, while PV considered by itself is a variable energy resource, considerable effort is being
made to improve its performance, decrease output variability and match system demand more
precisely. These most recent and important development is the rapid emergence of integrated hybrid
PV-battery storage power plants. Advances on the hybrid front have been so rapid that there was
almost no cost and performance data available in 2018, but now it is estimated that hybrid PV-storage
projects are nearly half of the interconnection queue in California. The potential was already apparent
in mid-2019, when the California Independent System Operator noted that approximately 41% of the
total capacity currently seeking interconnection to their system was hybrid resources, mostly consisting
of PV-battery configurations.9
At the same time, PV-battery hybrid resource costs have declined at unprecedented rates. Two recent
articles considered the costs of a new PV-hybrid project being constructed under contract with the Los
Angeles Department of Water and Power (LADWP). The project will consist of 400 MW of PV and
300 MW/1200 MWh of battery resources. Analysts suggest the value of the project will be under
$40/MWh for energy and $127/kW-year for capacity, below the cost of a new gas peaker power
plant.10
While the costs for such hybrid projects in the Northwest will be higher due to the somewhat less
favorable solar resource in this region, their value will be considerable given the potential for co-
optimization with the storage and flexibility capabilities of the CRS, while providing adding to overall
system energy, capacity and resource adequacy, especially during the late summer when demand is
high and the spring freshet has depleted and hydrogeneration potential is very limited.
DEIS Replacement Portfolio Analysis failed to incorporate these widely known and established
industry trends and instead relied on stale information that consistently overstates the costs of the
alternatives.
9 CAISO, “Hybrid Resources Initiative: Issue Paper Stakeholder Meeting,” July 22, 2019,
http://www.caiso.com/InitiativeDocuments/Presentation-HybridResources-IssuePaper.pdf 10 Energy Storage News, "Battery storage at US$20/MWh? Breaking down low-cost solar-plus-storage PPAs in the USA,"
March 20, 2020, https://www.energy-storage.news/blogs/battery-storage-at-us20-mwh-breaking-down-low-cost-solar-plus-
storage-ppas; and EnergyGPS, "Grateful for Reliability, April 3, 2020,
https://www.energygps.com/Newsletter/b/Newsletter-Grateful-for-Reliability-1620014
Joint Commenters Comments on CRSO DEIS April 13, 2020 - Page 30
The DEIS analysis adopts a PV capital cost of $1,350 to $1,500/kW (2019$). DEIS Appendix H,
Table 2-3. Those costs are applied to the single study year of 2022. By that time, costs are likely to
decline by a significant amount, reflecting deeply embedded declining cost trends over many years, yet
the DEIS made no attempt to account for that. Assessments seeking to assess future technical,
performance and cost trajectories for resources undergoing profound innovation such as PV have
several analytical tools at their disposal. Here we discuss and apply two that are particularly relevant
to future resource cost projections – at least one of which should have been employed in the DEIS
energy analysis.
The first is a technique is known as experience curve analysis (often called learning curve analysis,
though that term is more limited in applicability). This relies on the robust and well documented
process through which technologies undergoing technical innovation decline in cost by a fixed factor,
known as the learning rate, for a given amount of aggregate market expansion. Research by the Santa
Fe Institute demonstrated the robust performance of experience curve assessment in considering future
resource cost trajectories across 62 industries.11
In 2013, NWEC submitted a paper to the Western Electricity Coordinating Council (WECC),
describing the technique and use of experience curve analysis specifically with regard to PV
technology and markets.12 In general, as the global installed capacity of PV doubles in size, cost
comes down by about 20% for modules and 15% for balance of system costs. That observation has
remained robust since a 1978 analysis by the Solar Energy Research Institute (now NREL) to the
present time.
To illustrate the importance of the deficiency in the DEIS energy analysis of future resource costs, we
use these two methods described above to assess the future costs of PV resources in relation to the
costs in the DEIS. As mentioned, the DEIS adopts the Council’s 2018 estimate of $1,350 to
$1,500/kW-ac (2019$) for grid-scale PV in 2022. To simplify the explanation, we assume a midpoint
11 Nagy B, Farmer JD, Bui QM, Trancik JE (2013) Statistical Basis for Predicting Technological Progress. PLoS ONE 8(2):
e52669. https://doi.org/10.1371/journal.pone.0052669 12 NW Energy Coalition, “Experience Curves and Solar PV,” September 3, 2012, available at:
https://app.nwcouncil.org/media/6867808/2012-09-03-nwec-experience-curves-and-solar-pv.pdf
Joint Commenters Comments on CRSO DEIS April 13, 2020 - Page 31
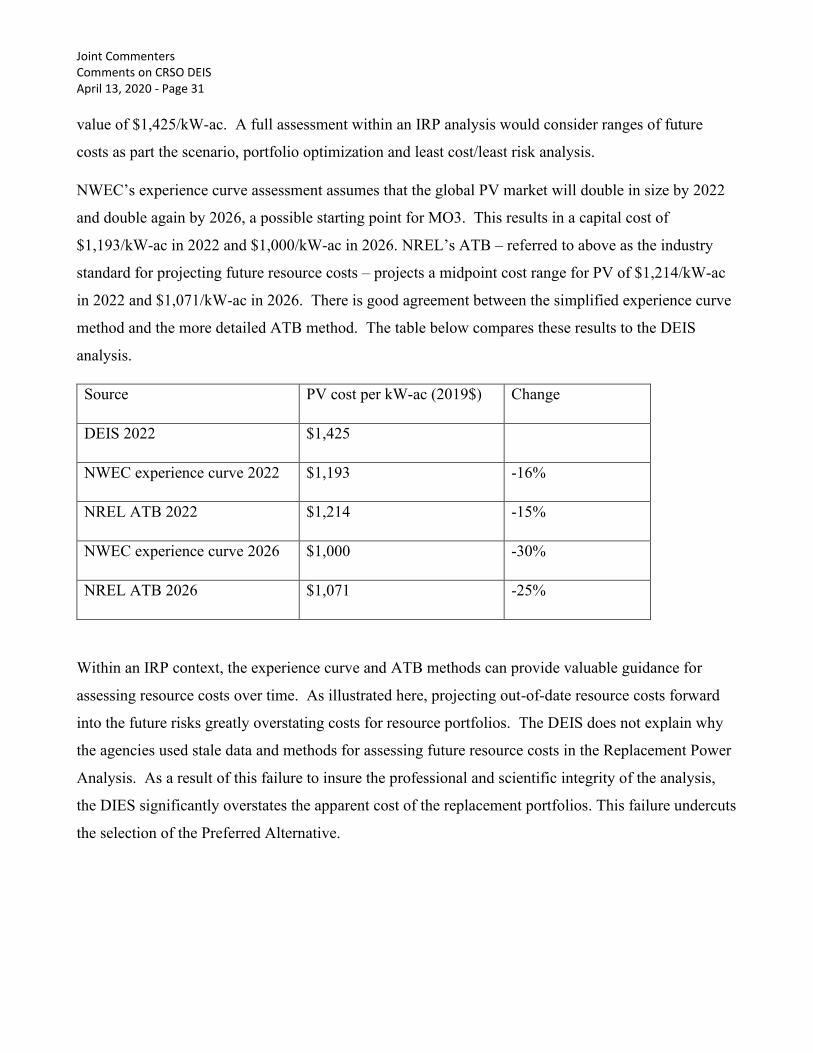
value of $1,425/kW-ac. A full assessment within an IRP analysis would consider ranges of future
costs as part the scenario, portfolio optimization and least cost/least risk analysis.
NWEC’s experience curve assessment assumes that the global PV market will double in size by 2022
and double again by 2026, a possible starting point for MO3. This results in a capital cost of
$1,193/kW-ac in 2022 and $1,000/kW-ac in 2026. NREL’s ATB – referred to above as the industry
standard for projecting future resource costs – projects a midpoint cost range for PV of $1,214/kW-ac
in 2022 and $1,071/kW-ac in 2026. There is good agreement between the simplified experience curve
method and the more detailed ATB method. The table below compares these results to the DEIS
analysis.
Source PV cost per kW-ac (2019$) Change
DEIS 2022 $1,425
NWEC experience curve 2022 $1,193 -16%
NREL ATB 2022 $1,214 -15%
NWEC experience curve 2026 $1,000 -30%
NREL ATB 2026 $1,071 -25%
Within an IRP context, the experience curve and ATB methods can provide valuable guidance for
assessing resource costs over time. As illustrated here, projecting out-of-date resource costs forward
into the future risks greatly overstating costs for resource portfolios. The DEIS does not explain why
the agencies used stale data and methods for assessing future resource costs in the Replacement Power
Analysis. As a result of this failure to insure the professional and scientific integrity of the analysis,
the DIES significantly overstates the apparent cost of the replacement portfolios. This failure undercuts
the selection of the Preferred Alternative.
Joint Commenters Comments on CRSO DEIS April 13, 2020 - Page 32
4.3 Hybrid Solar-Battery Storage
As noted in DEIS Appendix H, Table 2-2, the “zero carbon” replacement power portfolio for MO3
includes 2,550 MW of solar with 1,250 MW of battery storage.
First, the analysis fails to provide any explanation of why 1,250 MW is the right amount of
incremental storage, and notes that this was done “last” in the analysis as an add-on. Further, it does
not consider the perspective that the LSR dam attributes “lost” are the same ones that the rest of the
CRS system might have in excess if significant amounts of solar and wind are developed on the
system.
Second, the DEIS does not consider additional storage resources when determining how much solar
and demand response are necessary to return the system to the LOLP baseline. This means the analysis
of MO3 is likely overbuilt from a capacity perspective. To properly build the portfolio, the DEIS
should have calculated the flexibility need created, added storage to provide that, then counted this
storage in the LOLP analysis to determine what additional solar/wind capacity is required to return the
system to the benchmark LOLP. As a result of this one error, the MO3 portfolio likely should have
had either less solar, less storage, or less of both, resulting in a material reduction in portfolio cost.
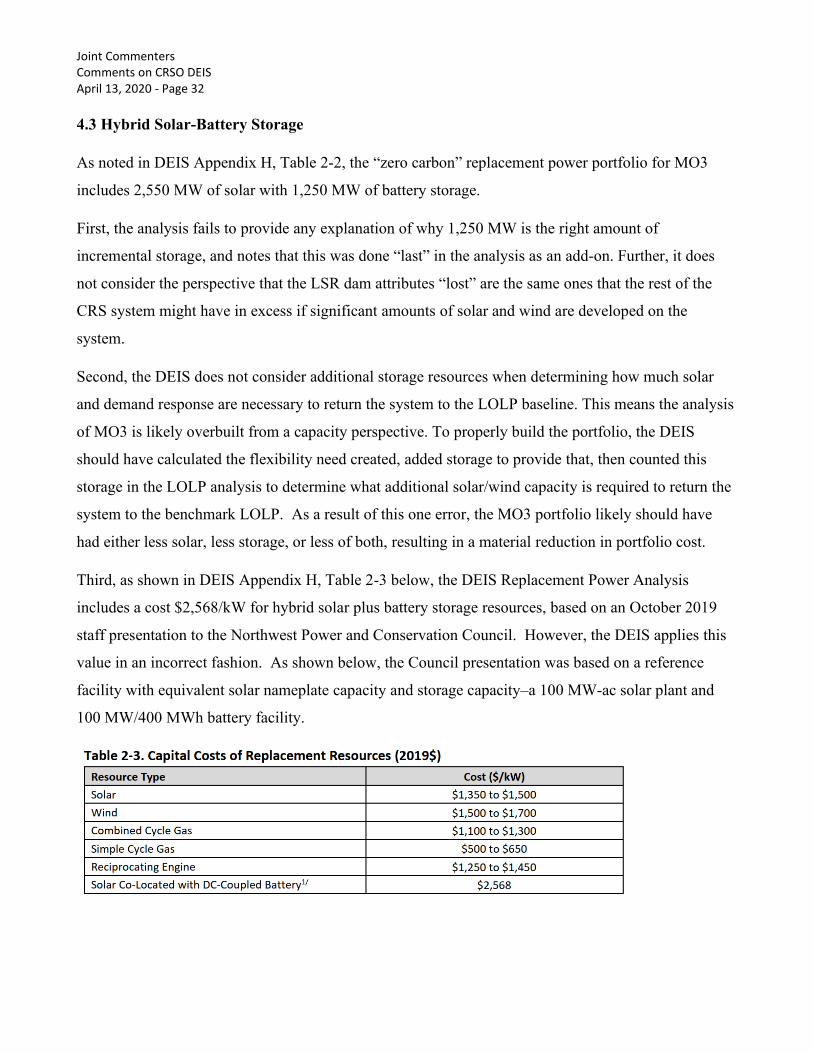
Third, as shown in DEIS Appendix H, Table 2-3 below, the DEIS Replacement Power Analysis
includes a cost $2,568/kW for hybrid solar plus battery storage resources, based on an October 2019
staff presentation to the Northwest Power and Conservation Council. However, the DEIS applies this
value in an incorrect fashion. As shown below, the Council presentation was based on a reference
facility with equivalent solar nameplate capacity and storage capacity–a 100 MW-ac solar plant and
100 MW/400 MWh battery facility.
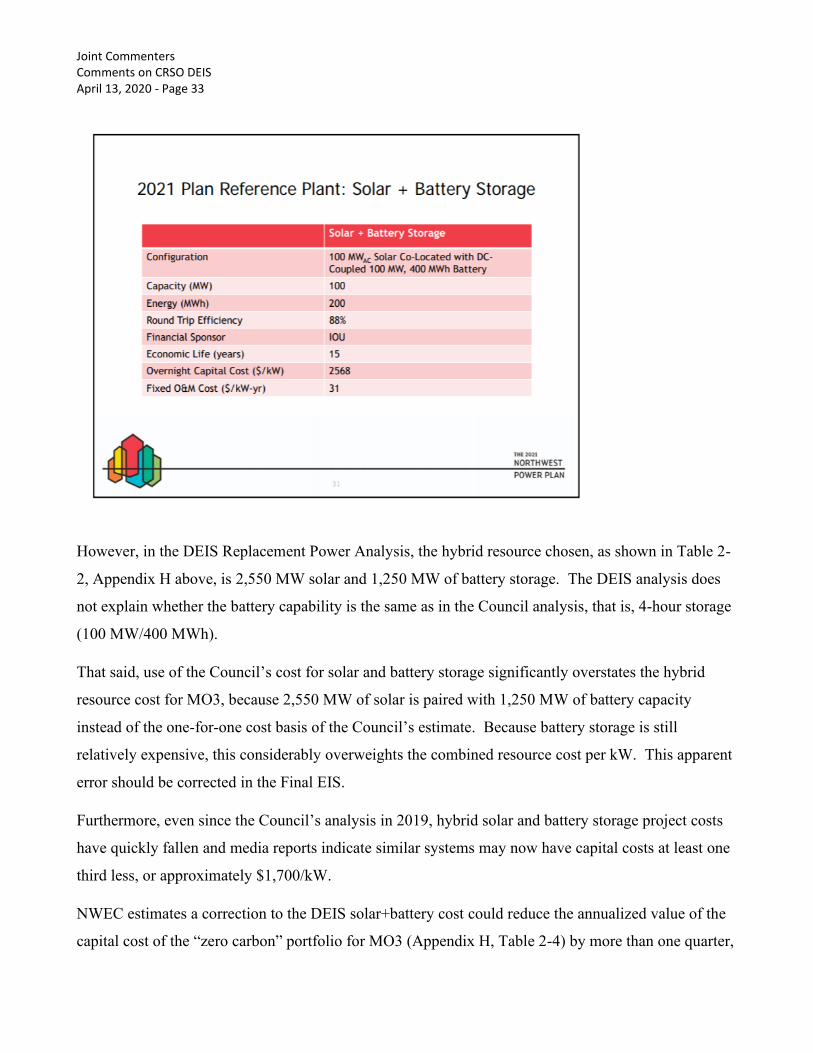
Joint Commenters Comments on CRSO DEIS April 13, 2020 - Page 33
However, in the DEIS Replacement Power Analysis, the hybrid resource chosen, as shown in Table 2-
2, Appendix H above, is 2,550 MW solar and 1,250 MW of battery storage. The DEIS analysis does
not explain whether the battery capability is the same as in the Council analysis, that is, 4-hour storage
(100 MW/400 MWh).
That said, use of the Council’s cost for solar and battery storage significantly overstates the hybrid
resource cost for MO3, because 2,550 MW of solar is paired with 1,250 MW of battery capacity
instead of the one-for-one cost basis of the Council’s estimate. Because battery storage is still
relatively expensive, this considerably overweights the combined resource cost per kW. This apparent
error should be corrected in the Final EIS.
Furthermore, even since the Council’s analysis in 2019, hybrid solar and battery storage project costs
have quickly fallen and media reports indicate similar systems may now have capital costs at least one
third less, or approximately $1,700/kW.
NWEC estimates a correction to the DEIS solar+battery cost could reduce the annualized value of the
capital cost of the “zero carbon” portfolio for MO3 (Appendix H, Table 2-4) by more than one quarter,
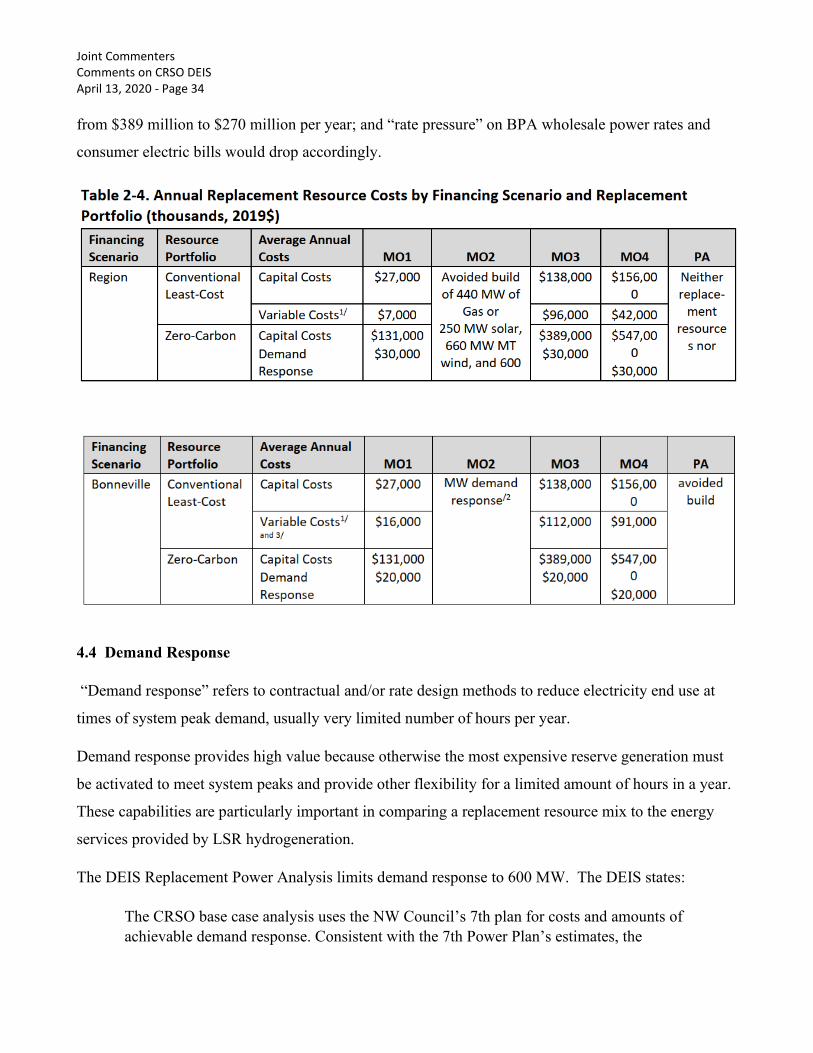
Joint Commenters Comments on CRSO DEIS April 13, 2020 - Page 34
from $389 million to $270 million per year; and “rate pressure” on BPA wholesale power rates and
consumer electric bills would drop accordingly.
4.4 Demand Response
“Demand response” refers to contractual and/or rate design methods to reduce electricity end use at
times of system peak demand, usually very limited number of hours per year.
Demand response provides high value because otherwise the most expensive reserve generation must
be activated to meet system peaks and provide other flexibility for a limited amount of hours in a year.
These capabilities are particularly important in comparing a replacement resource mix to the energy
services provided by LSR hydrogeneration.
The DEIS Replacement Power Analysis limits demand response to 600 MW. The DEIS states:
The CRSO base case analysis uses the NW Council’s 7th plan for costs and amounts of
achievable demand response. Consistent with the 7th Power Plan’s estimates, the
Joint Commenters Comments on CRSO DEIS April 13, 2020 - Page 35
analysis assumes 400 MW of demand response developed in the near-term by
Bonneville, in partnership with Bonneville’s power customer utilities, and another 200
MW of demand response developed by regional investor owned utilities.
DEIS Appendix 3 at line 25495
However, this is not “consistent with the Council’s estimates.” The Council 7th Plan recommendations
identified 600 MW of demand response as the minimum amount available, not the ceiling assumed in
the DEIS:The Council’s assessment identified more than 4,300 megawatts of regional demand
response potential. A significant amount of this potential, nearly 1,500 megawatts, is available at
relatively low cost; less than $25 per kilowatt of peak capacity per year.
As the Council explained, “When compared to the alternative of constructing a simple cycle gas-fired
turbine, demand response can be deployed sooner, in quantities better matched to the peak capacity
need, deferring the need for transmission upgrades or expansions.” Council 7th Power Plan at 1-10.
The Council summarized their recommendation for demand response as follows: “The Council’s
analysis indicates that a minimum of 600 MW of demand response resources would be cost-effective to
develop under all future conditions tested across all scenarios which do not rely on increased firm
capacity imports.” Council 7th Power Plan at 3-4 (emphasis supplied).
Furthermore, the Council’s Plan clearly shows that substantially more demand response would be
available at lower cost than other alternatives selected by the DEIS analysis within five years if the
region chose to develop it.
For example, as shown in Fig. 3-7 of the 7th Power Plan below, over 2,000 MW of cost-effective
demand response is available in the 7th Plan at less than $77/kW-year (2012$), compared to new
natural gas power plants at $125/kW-year and above. 7th Plan, Table H-10, Frame Gas Turbine Cost
Summary.
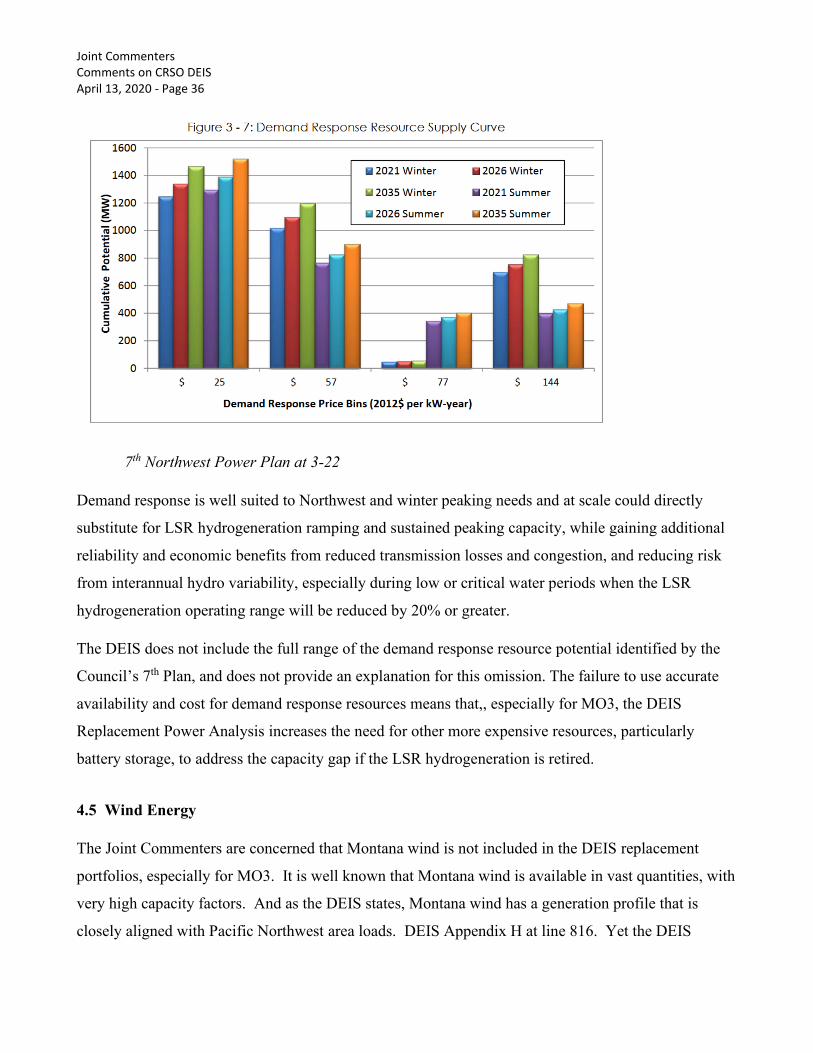
Joint Commenters Comments on CRSO DEIS April 13, 2020 - Page 36
7th Northwest Power Plan at 3-22
Demand response is well suited to Northwest and winter peaking needs and at scale could directly
substitute for LSR hydrogeneration ramping and sustained peaking capacity, while gaining additional
reliability and economic benefits from reduced transmission losses and congestion, and reducing risk
from interannual hydro variability, especially during low or critical water periods when the LSR
hydrogeneration operating range will be reduced by 20% or greater.
The DEIS does not include the full range of the demand response resource potential identified by the
Council’s 7th Plan, and does not provide an explanation for this omission. The failure to use accurate
availability and cost for demand response resources means that,, especially for MO3, the DEIS
Replacement Power Analysis increases the need for other more expensive resources, particularly
battery storage, to address the capacity gap if the LSR hydrogeneration is retired.
4.5 Wind Energy
The Joint Commenters are concerned that Montana wind is not included in the DEIS replacement
portfolios, especially for MO3. It is well known that Montana wind is available in vast quantities, with
very high capacity factors. And as the DEIS states, Montana wind has a generation profile that is
closely aligned with Pacific Northwest area loads. DEIS Appendix H at line 816. Yet the DEIS
Joint Commenters Comments on CRSO DEIS April 13, 2020 - Page 37
includes solar plus battery resources in MO3, but not Montana wind. Nor does the DEIS assess wind
plus battery storage or pumped storage, a significant possibility in Montana due to the potential
availability of the Absaroka Gordon Butte project, a proposed highly efficient 400 MW project that
could be available by 2025. The fragmentary comments on wind analysis in the DEIS make it difficult
to discern the reason for this result. One possibility is that when solar PV was picked for the MO3
alternative, and then battery storage resources were added to provide winter flexibility, this sequence
precluded the full consideration of Montana wind. Again in this instance, the DEIS energy analysis
fails to provide sufficient information about the resource portfolio assessment, and a comprehensive
IRP analysis may well have resulted in the inclusion of significant quantities of Montana wind.
4.6 Renewable Energy and Storage Capacity and Flexibility Value
The DEIS Replacement Portfolio Analysis takes a limited view of renewable energy and storage
resource capabilities, and misrepresents the capabilities of hydrogeneration. The DEIS states:
Solar, however, does not produce energy during the night. Wind, however, can produce
energy during both the daytime and nighttime hours. Together, these resources would
allow for generation day and night, mitigating the lost firm energy production of the
lower Snake River projects. Utility-scale batteries would replace the lost flexibility and
ramping capability of the lower Snake River projects. However, the batteries provide an
imperfect replacement for the lost capability of the lower Snake River projects because,
while batteries can be discharged to provide energy, they also need to be recharged and
consume energy on a net basis.
DEIS Chapter 3 at line 27404
While it is appropriate and necessary to measure the net contribution any particular resource makes to
system value, no resource stands alone. Wind, solar and battery resources will be operated in
conjunction with CRS hydrogeneration and other resources. One of the important missing pieces of
the DEIS analysis is full consideration of how CRS hydrogeneration and new renewable, storage and
demand response resources can be operated in coordinated and complementary fashion, increasing
overall system value. For MO3, the DEIS did not assess system flexibility following LSR dam breach
and hydrogeneration retirement and optimize the resource portfolio accordingly. For example, an
optimized mix of advanced energy efficiency, demand response, storage, and renewable generation
diversity could enhance the ability of the remaining CRS hydrogeneration to provide flexibility.
Joint Commenters Comments on CRSO DEIS April 13, 2020 - Page 38
Concerning resource diversity, considerable research has shown that diversifying the system portfolio
by resource type, performance and geographic diversity will add significant value. For example, the
comprehensive Western Wind and Solar Integration Study found that increasing the size of the
geographic area over which wind and solar resources are drawn substantially reduces variability.13
The claim that energy storage such as batteries are an “imperfect replacement” is incomplete and
misleading. Hydropower is indeed a form of renewable energy, subject to variable energy input from
climate and weather patterns just as wind and solar are. Hydropower also inherently combines energy
storage and energy generation capability, the same as hybrid wind or solar plus battery storage
systems. It is possible that an optimized combination of clean energy resources could provide more
system flexibility year-round. Again, because the DEIS did not conduct an IRP analysis, this
opportunity was not explored, and particularly for MO3, the analysis is incomplete and inaccurate.
4.7 Battery Storage
The DEIS Replacement Portfolio Analysis considerably underestimates the potential size and
capabilities of battery storage. The DEIS states:
To provide a similar level of sustained ramping (Table 3-160, above) as the lower
Snake River projects, 2,265 MW of batteries would be needed. Additionally, the lower
Snake River projects provide 250 MW of operating reserves. This would bring the total
to 2,515 MW of batteries needed to replicate the peaking and flexibility of the lower
Snake River projects. Developing utility-scale batteries of this size is untested. The
largest battery facility in the world is currently 100 MW.
DEIS Chapter 3 at 27427
This statement is incomplete and misleading. Large grid battery storage projects with contract
commitments that are expected be completed by the end of 2021. Major utilities and producers are
scaling up battery storage globally.14 In California alone these include Strata Oxnard (100 MW/400
MWh, online data December 2020), AES Alamitos (100 MW/400 MWh, 2021), Tesla Moss Landing
13 See National Renewable Energy Laboratory, Western Wind and Solar Integration Study,
https://www.nrel.gov/grid/wwsis.html 14 GreenTech Media, The Biggest Batteries Coming Soon to a Grid Near You, September 3, 2019,
https://www.greentechmedia.com/articles/read/the-biggest-batteries-coming-soon-to-a-grid-near-you
Joint Commenters Comments on CRSO DEIS April 13, 2020 - Page 39
(182.5 MW/730 MWh, December 2020) and Vistra Moss Landing (300 MW/1,200 MWh, December
2020). And notably, the FPL Manatee Energy Storage Center will combine an existing solar project
and a new 409 MW/900 MWh battery storage facility in Florida by late 2021.
In Oregon, new storage development15 includes:
▪ The 2019 acquisition by Portland General Electric of a part of the Wheatridge three-
way hybrid project developed by NextEra Energy Resources LLC, including 300 MW
of wind, 50 MW of solar and 30 MW of battery storage starting in December 2021.
▪ Obsidian Renewables LLC has broken ground for the planned 400-MW Obsidian Solar
Center in Lake County with a potential 50-MW flow battery storage system.
▪ The Avangrid Bakeoven Solar Project in Wasco County, under review by the Oregon
Energy Facility Siting Council, would combine 100 MW of lithium-ion or flow
batteries and 303 MW of solar generation with construction starting in 2020.
▪ Ecoplexus is pursuing the proposed 63-MW Madras Solar Energy Facility in Jefferson
County, with up to 240 MWh of energy storage.
Much of the capacity for these projects is already in the Bonneville transmission interconnection queue
since it will require federal transmission to wheel power to offtakers. The DEIS does not accurately
represent the current capability of battery storage resources.
4.8 Inverter-Based Resources
The DEIS Replacement Power Analysis completely sets aside the value of essential reliability services
from inverter-based resources, for example, solar, wind and battery storage. The DEIS states:
Another limitation of the wind, solar, and battery portfolio is its inability to provide
voltage and inertia benefits. As described above, the lower Snake River projects provide
voltage and inertia benefits to the transmission system. Currently, wind, solar, and
batteries do not provide the same level of voltage support as an installed generator,
though this may change with advancements in technology. Providing inertia benefits
from solar and wind resources and battery technology, however, would be more
challenging because these facilities do not have the same heavy rotating mass as hydro
15 S&P Global, “Kicking coal, Oregon emerges as a solar and energy storage development hub," March 6, 2020,
https://www.spglobal.com/marketintelligence/en/news-insights/latest-news-headlines/kicking-coal-oregon-emerges-as-a-
solar-and-energy-storage-development-hub-57104313
Joint Commenters Comments on CRSO DEIS April 13, 2020 - Page 40
generators. New technologies that would allow wind, solar, and batteries to mimic the
inertia characteristics of synchronous generators have yet to be developed.
DEIS Chapter 3 at line 27439
The technical and field test evidence is totally contrary to this statement. According to the North
American Electric Reliability Council (NERC) Essential Reliability Services Working Group
(ERSWG), these services are broadly grouped together as frequency support, voltage support and
ramping and balancing.16
Inverter-based resources have inherent advantages over conventional resources using “spinning mass,”
including coal, nuclear, gas and hydro. While hydrogeneration is clearly superior to thermal
generation in terms of ramp rates, minimum power levels (Pmin), emissions and other attributes,
inverter-based resources rely on power electronics and can be much faster and more faithful to a
control signal for fast frequency response, voltage support, ramping and other essential reliability
services.17
Two recent major field studies have validated these findings. In the first study, CAISO, NREL and
FirstSolar conducted a rigorous field test of a 300 MW solar facility in Arizona. The results showed
that solar projects can reliably provide frequency control, voltage control and ramping capability at
scale, with much better response time and fidelity than conventional resources.18 In the second study,
CAISO, Avangrid Renewables, NREL and General Electric conducted tests at a 131 MW wind facility
near San Diego, also finding the wind plant performed as well as or better than conventional units.19
16 NERC, “Essential Reliability Services Whitepaper on Sufficiency Guidelines,” December 2016,
https://www.nerc.com/comm/Other/essntlrlbltysrvcstskfrcDL/ERSWG_Sufficiency_Guideline_Report.pdf 17 Michael Milligan, “Sources of grid reliability services,” Electricity Journal, 2018,
https://doi.org/10.1016/j.tej.2018.10.002 18 Utility Dive, "California solar pilot shows how renewables can provide grid services," October 16, 2017,
https://www.utilitydive.com/news/california-solar-pilot-shows-how-renewables-can-provide-grid-services/506762/ Also
see Clyde Loutan et al., Demonstration of Essential Reliability Services by a 300-MW Solar Photovoltaic Power Plant
https://www.nrel.gov/docs/fy17osti/67799.pdf 19 Utility Dive, “Wind plants can provide grid services similar to gas, hydro, easing renewables integration: CAISO,”
March 13, 2020, https://www.utilitydive.com/news/wind-plants-can-provide-grid-services-similar-to-gas-hydro-easing-
renewab/574070/ Also see California ISO, Avangrid Renewables and NREL, "Avangrid Renewables Tule Wind Farm:
Demonstration of Capability to Provide Essential Grid Services, March 2020,
http://www.caiso.com/Documents/WindPowerPlantTestResults.pdf
Joint Commenters Comments on CRSO DEIS April 13, 2020 - Page 41
To be sure, much work remains to provide full system integration and compensation to enable the
capabilities of inverter-based resources. However, as the electric power system expands and requires
additional reliability and resilience, the superior performance of inverter-based resources will surely
mean an important and growing role for wind, solar and battery systems in providing essential
reliability services. By focusing its analysis on 2022 as a replacement date, the DEIS arbitrarily avoids
addressing any of these developments and their potential role in replacing the power from the Lower
Snake River dams.
The DEIS does not explain why, in the face of abundant engineering analysis and field testing, it
rejected consideration of these capabilities. This failure means it is likely the Replacement Power
Analysis assumes additional resources at greater cost than necessary over time – especially inflating
the overall costs of MO3.
4.9 Pumped Storage
While the DEIS Replacement Power Analysis provides a short description of the pumped hydro
resource, it does not further review directly relevant developments in the Northwest. There are at least
three pumped storage projects that could be constructed in the region by the mid to late 2020s, Swan
Lake (Klamath County, Oregon), Goldendale (Klickitat County, Washington), and the Absaroka
Gordon Butte project ( Meagher County, Montana). Each could provide significant support and
increase the capacity and flexibility of the CRS. The DEIS only discusses the prospective cost of
pumped storage, and does not discuss whether these important resource characteristics were
considered.
4.10 Future Market Value
Over the last decade, power markets in the Western Interconnection have started undergoing a
profound change on both the supply and demand side. These changes have already substantially
affected the operation and net revenues of the CRS. The DEIS Replacement Power Analysis does not
consider these factors with regard to the alternatives, particularly MO3.
The first key factor is the persistently low natural gas commodity prices since 2010, when shale gas
became a dominant factor in the North American market. The price of gas has varied between about
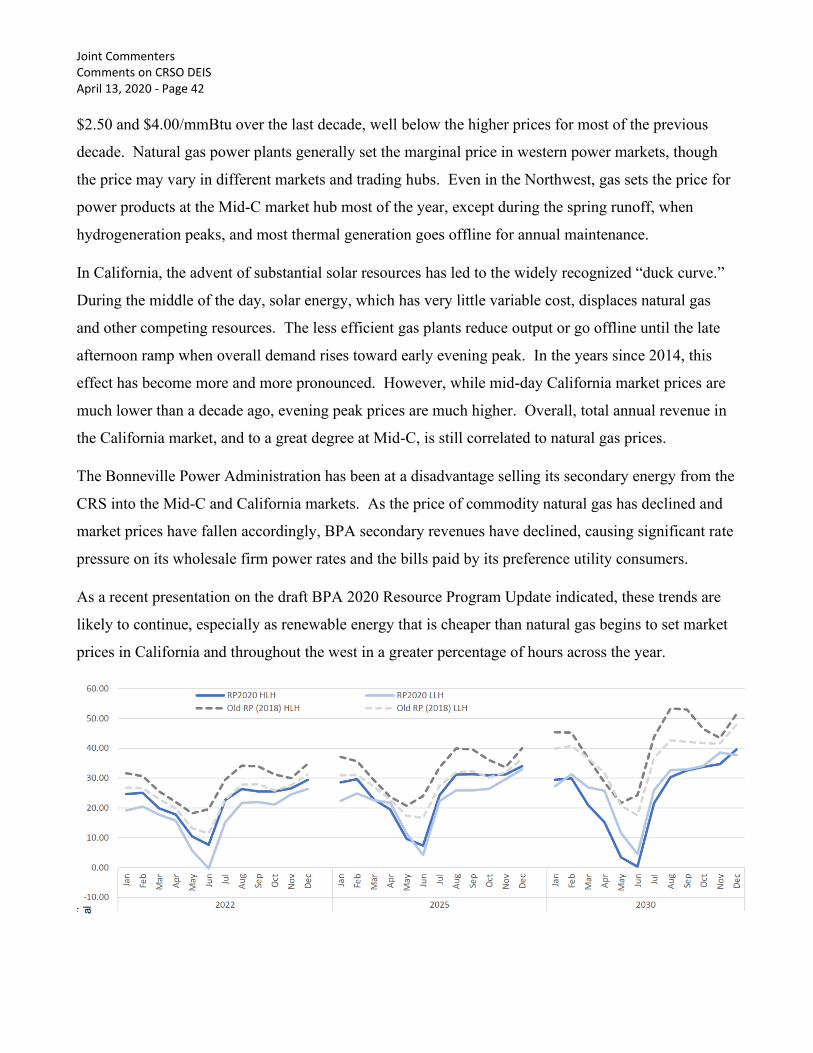
Joint Commenters Comments on CRSO DEIS April 13, 2020 - Page 42
$2.50 and $4.00/mmBtu over the last decade, well below the higher prices for most of the previous
decade. Natural gas power plants generally set the marginal price in western power markets, though
the price may vary in different markets and trading hubs. Even in the Northwest, gas sets the price for
power products at the Mid-C market hub most of the year, except during the spring runoff, when
hydrogeneration peaks, and most thermal generation goes offline for annual maintenance.
In California, the advent of substantial solar resources has led to the widely recognized “duck curve.”
During the middle of the day, solar energy, which has very little variable cost, displaces natural gas
and other competing resources. The less efficient gas plants reduce output or go offline until the late
afternoon ramp when overall demand rises toward early evening peak. In the years since 2014, this
effect has become more and more pronounced. However, while mid-day California market prices are
much lower than a decade ago, evening peak prices are much higher. Overall, total annual revenue in
the California market, and to a great degree at Mid-C, is still correlated to natural gas prices.
The Bonneville Power Administration has been at a disadvantage selling its secondary energy from the
CRS into the Mid-C and California markets. As the price of commodity natural gas has declined and
market prices have fallen accordingly, BPA secondary revenues have declined, causing significant rate
pressure on its wholesale firm power rates and the bills paid by its preference utility consumers.
As a recent presentation on the draft BPA 2020 Resource Program Update indicated, these trends are
likely to continue, especially as renewable energy that is cheaper than natural gas begins to set market
prices in California and throughout the west in a greater percentage of hours across the year.
Joint Commenters Comments on CRSO DEIS April 13, 2020 - Page 43
As the chart above20 illustrates, the Mid-C High Load Hour product (heavy blue trace) is projected to
decline substantially over this decade, partly because of continued decline in gas prices and partly from
the increase in less expensive renewable energy.
As the secular trend in both the Northwest and California power markets goes downward, CRS
secondary energy sales revenue will decline. But because of the need for system flexibility, both in the
morning and late afternoon ramp periods, the value proposition of the non-firm power capabilities of
the CRS will shift from bulk secondary energy to flexibility, capacity and ramping products.
Because LSR dams are primarily run-of-river facilities, their hydrogeneration is less flexible than the
mainstem Columbia CRS projects, and the relative value of the LSR hydrogeneration flexibility as
well as energy will decline going forward. But because the DEIS Replacement Power Analysis only
considers conditions in the study year of 2022, these effects are not adequately captured, leading to an
arbitrary overvaluation of the LSR hydrogeneration in the DEIS.
4.11 Interregional Imports
The DEIS Replacement Power Analysis does not consider increasing interregional power imports from
California and other areas in the Western Interconnection for the replacement portfolios, especially
MO3. The Northwest power market, particularly at the Mid-C trading hub, has followed the California
market more closely in recent years, with the exception of the spring runoff period in the Northwest.
That is because the Pacific Intertie allows for substantial trading between the two regions.
In the near future, significant amounts of California surplus power will flow from the low-priced
CAISO market to the Northwest when system conditions price the Mid-C market at a higher level.
Thus, both markets will converge and, on average, decline in price.
20 Bonneville Power Administration, 2020 Resource Program Update, March 17, 2020,
https://www.bpa.gov/Finance/RateCases/BP-22-Rate-
Case/Documents/Combined%20PPT%20for%20workshop%203.17.pdf

Joint Commenters Comments on CRSO DEIS April 13, 2020 - Page 44
The chart above21 illustrates these ongoing developments. It shows net power exports from the
Northwest to California in March 2020 on the AC Intertie. The red trace shows North-South transfer
capacity and the yellow trace shows South-North capacity, which vary when there are outages or
planned maintenance on the AC Intertie system. The blue trace shows net exports. Over the last year,
net imports to the Northwest – where the blue line goes below zero, have been occurring more
frequently than in the past.
In the month of March, when the Northwest snowpack is beginning to melt and winter demand peaks
have declined, Mid-C prices are generally lower than California market prices. As a result, over the
last two decades, power almost never flowed from California to the Northwest in March. However,
starting in 2019, that has changed, whenever California prices are low enough relative to the Mid-C
market.
It now seems clear that imports into the Northwest will continue to grow and costs will decline. There
are a number of factors including the continued decline in natural gas prices, increasing solar energy,
21 https://transmission.bpa.gov/BUSINESS/Operations/Paths/Interties/monthly/AC/2020/AC_2020-03.xls
Joint Commenters Comments on CRSO DEIS April 13, 2020 - Page 45
changes in demand and the interannual variation of hydro in each region. This provides an important
opportunity to include interregional imports as a potential replacement resource, especially during the
winter. Increased imports would be a particularly good choice for mid-winter replacement of LSR
hydrogeneration. However, the DEIS Replacement Power Analysis does not address this possibility
nor explain why it did not do so. Again, this likely inflates the costs of the MO3 alternative.
4.12 Power Market Structure
Because the Replacement Power Analysis only included the study year of 2022, it did not consider the
profound changes in power market structure in the Northwest and the Western Interconnection. We
provide two examples. In March 2022, the Bonneville Power Administration expects to become a
participant in the Western Energy Imbalance Market (EIM), which optimizes generation dispatch and
use of reserves within each hour across most of the Western Interconnection. On Sept. 26, 2019, BPA
signed an implementation agreement with the California Independent System Operator and a record of
decision in a move toward joining the EIM in 2022.22
In addition, after becoming an EIM Entity, Bonneville will be eligible to join the proposed Enhanced
Day Ahead Market extension to the EIM, enabling it to change CRS operations to reduce operating
costs and risks and increase revenues for both firm power and secondary sales. While the eventual
fruition of the EDAM is not certain, the growing consensus through the Western Interconnection is that
market expansion offers substantial reliability, economic and environmental benefits.
Bonneville engaged in two substantial studies including a full net benefits study to assess the relative
value of joining the EIM. The EIM Record of Decision indicates that net benefits could fall in the
range of $29 to $34 million per year.23 The anticipated benefits of the EDAM are expected to be much
larger, and if it commences operation in the coming years, the existing Mid-C market and other trading
hubs in the Western Interconnection will diminish in participation, reducing market depth, stability and
efficient price discovery.
22 Bonneville Power Administration, Energy Imbalance Market,
https://www.bpa.gov/Projects/Initiatives/EIM/Pages/Energy-Imbalance-Market.aspx 23 Administrator's Record of Decision, Energy Imbalance Market Policy, September 2019, at 112,
https://www.bpa.gov/news/pubs/RecordsofDecision/rod-20190926-Energy-Imbalance-Market-Policy.pdf
Joint Commenters Comments on CRSO DEIS April 13, 2020 - Page 46
Yet because the Replacement Power Analysis only included the study year of 2022, no analysis was
conducted to examine the potential benefits and challenges of CRS participation in the changing power
market structure, even though ample information to do so was available and the effects of this
interconnection process are highly relevant to assessing the feasibility and costs of implementing MO3.
The DEIS does not discuss the EIM and EDAM, and does not explain this omission.
4.13 Transmission Resources and Operations
Because the Replacement Power Analysis only included the study year of 2022, it did not consider
potential transmission expansion, grid modernization and more efficient operations. Among other
elements directly relevant to the CRS, this includes the ongoing efforts by BPA to revise its open
access transmission tariff, reshape its transmission products for the emerging needs of more diverse
and flexible resources, engage in a major grid modernization program supporting its participation in
the EIM and other system optimization purposes, and potentially add new transmission lines and
supporting resources.
One major example is the possible Montana-to-Washington transmission expansion, which would add
600 MW of transfer capacity in the federal transmission system between western Montana and eastern
Washington. An earlier environmental review of the projected was halted in 2013 when Bonneville
determined that commercial offtaker potential had dwindled. Now, as a result of the review of the
Montana Renewable Development Action Plan in 2018, co-sponsored by Bonneville and the Governor
of Montana, and with further state energy policy developments and cost reductions favoring expanded
transmission capacity to carry Montana wind to load in northern Idaho, Washington and Oregon, the
prospects of M2W are improving. An even larger new transmission project known as Garrison-to-
Ashe is also on the drawing boards, with a prospective completion date of 2030.
Federal transmission expansion, grid modernization, tariff reform and more efficient transmission
system operations will improve the value of renewable energy resources that could replace LSR
hydrogeneration. But the DEIS fails to address these opportunities.
Joint Commenters Comments on CRSO DEIS April 13, 2020 - Page 47
4.14 Columbia River Treaty
The DEIS has been conducted in parallel with ongoing negotiations between the US and Canada over
the future of the Columbia River Treaty, with two of the co-lead agencies, the Bonneville Power
Administration and US Army Corps of Engineers jointly constituting the US Entity. Certain
provisions of the Treaty expire in 2024. The DEIS states:
The 2016 CRT-related operations, were applied in the EIS analysis, as the best-
available information. If CRT-related operations change in a manner that presents new
information or circumstances resulting in significant changes that were not previously
addressed, those changes will be addressed by this NEPA process if they are identified
in time or subsequently in another NEPA process, if necessary.
DEIS Chapter 2 at 2326
Because the Columbia River Treaty drives CRS planning and operations in a foundational way, it
should have been analyzed in the Replacement Power Analysis, but was not due to the limitation of the
analysis only to the study year of 2022.
4.15 Inappropriate and Incomplete “Coal Sensitivity”
In a complete diversion from the trend of not considering anything outside of the 2022 study year, the
DEIS conducts a self-styled “coal sensitivity” considering the impact on regional energy, capacity and
resource adequacy if additional coal generation serving the Pacific Northwest is retired beyond
announced retirements as of the Replacement Power Analysis in 2022. With regard to MO3, the DEIS
states:
In the future condition with additional coal-plant retirements, this option would not be
sufficient to return the LOLP to the No Action level, because without coal, more of the
capability or replacement capability of the Lower Snake River (LSR) projects would be
needed for power system reliability.
DEIS Appendix H at line 653
This sensitivity is built upon completely erroneous assumptions and completely disregards the
likelihood that the relatively inflexible and risky coal resource can be replaced with a more diverse,
reliable, less polluting and less costly portfolio that affords additional flexibility to the CRS and
improves Northwest power system performance.
Joint Commenters Comments on CRSO DEIS April 13, 2020 - Page 48
Noting the ongoing development of public policy promoting a transition from fossil fuel generation to
clean energy resources, the DEIS further states:
In light of this legislative and policy trend, the co-lead agencies assume that no new
gas-fired generation would be built to replace the lost generation from the lower Snake
River dams, only zero-carbon resources may be selected. At the utility-scale, the current
best options are solar and wind resources, some batteries, and demand response
programs. For MO3, the EIS analysis identified a potential zero-carbon replacement
portfolio consisting of 2,550 MW of solar resources, , and 600 MW of demand response
to restore LOLP. Tis portfolio relies on using the existing regional system to help make
up for some of the lost capabilities of the lower Snake River projects - primarily by
operating thermal plants more frequently to meet regional load. However, in light of
regional policy initiatives to curtail or cease the operation of thermal plants, a zero-
carbon resource replacement portfolio with insufficient dispatchable sustained capacity
may not be feasible. If the replacement does not include firm generating capacity with
only 600 MW of dispatchable capability, it is likely not a realistic assumption for MO3
where a substantial amount of generation capacity is lost.
DEIS Chapter 7 at line 386
The Joint Commenters agree that new gas-fired generation should not be built to replace LSR
hydrogeneration. But we strongly disagree that regional clean energy policy undermines the feasibility
of replacing LSR hydrogeneration with a clean energy portfolio. Indeed, as explained at length in
these comments, the DEIS does not provide a valid test of that assertion. Furthermore, the manifest
goal of Northwest clean energy policy is to expand the capability of those resources to replace thermal
generation in a reliable, clean and affordable manner. The success already accomplished under these
policies is a matter of record. Here we cite two examples.
The respective utilities with requirements under the 2006 Washington Energy Independence Act have
met their responsibilities to acquire all cost-effective energy efficiency and to achieve the targets under
the Act’s Renewable Portfolio Standards, and often exceeded them.24 And in Oregon, SB 1547, the
“coal-to-clean” legislation passed in 2016, sets a new Renewable Portfolio Standard of 50% by 2040
and requires utilities to cease using coal-fired power no later than 2025. All three of Oregon’s investor
24 NW Energy Coalition, “I-937: The only thing we had to fear was fear itself: The first in a series celebrating the passage
of Initiative 937 and its many benefits for Washington," September 27, 2016, https://nwenergy.org/uncategorized/i-937-the-
only-thing-we-had-to-fear-was-fear-itself/
Joint Commenters Comments on CRSO DEIS April 13, 2020 - Page 49
owned utilities, Portland General Electric, PacifiCorp and Idaho Power, have responded by
accelerating coal retirement plans and committing to major clean energy acquisitions. Those clean
energy actions replicated throughout the region by coal-owning utilities will rapidly reduce the
apparent “resource adequacy gap” resulting from coal retirement. The Joint Commenters fully
anticipate this will result in reduced energy costs, major reductions in greenhouse gas emissions, and
improved environmental performance.
Turning to the DEIS “coal sensitivity” analysis itself, as noted in the DEIS, announced coal retirements
as of 2022 are already included in the energy assessment. Yet the DEIS forges on to assess how
further retirements of part or all of the remaining coal fleet could affect the CRS as if they occurred in
2022. The DEIS states:
While the scope of the CRSO EIS analysis is not necessarily to address resource
adequacy issues related to the No Action Alternative because the coal-plant retirements
are not serving Federal load, resource acquisitions made by the region for the coal-plant
retirements will affect how changes in CRS hydropower would impact the region.
DEIS Chapter 3 at line 25385
Yet no one would argue that all regional coal could be, or even should be retired in 2022, despite the
reduction in climate change that might entail. Retiring the entire coal fleet, with its far greater
contribution to the Northwest power system than LSR hydrogeneration, will require a careful and
measured effort to phase out those resources and replace them with a clean energy portfolio. As
discussed above, state policy and utility IRP processes under way in the region are fully taking up that
task. The DEIS ignores these processes and instead makes unfounded assertions.
In particular, the coal retirement sensitivity appears to build linkages between MO3 and coal-plant
retirements that do not exist. In reality, coal units in the West are used to meet capacity needs of their
owners. No preference customer of the Bonneville Power Administration is an owner of a share of any
existing coal generation. The preference customers and Bonneville itself have no legal obligation
whatsoever for the future course of such coal plants, nor for resource replacement as they are retired.
Rather coal plant retirement decisions that ensure reliable, affordable energy services are the
responsibility of the owners and the respective state utility commissions that regulate them. At the date
of submission of these comments, Portland General Electric (PGE) is pursuing a comprehensive
strategy to replace the energy and capacity services of its Boardman coal plant in Oregon and its share
Joint Commenters Comments on CRSO DEIS April 13, 2020 - Page 50
of the Colstrip coal plant in Montana, as well as other system changes. In 2019, PGE and the
Bonneville Power Administration executed two contracts for 100 MW of power services for five years.
This contract, executed before filing of the DEIS, does not appear to be included in the coal sensitivity
analysis. PGE is also currently seeking consideration of acknowledgement by the Oregon Public
Utility Commission (OPUC) of its 2019 Integrated Resource Plan, including up to 150 aMW of
renewable energy resources and up to 690 MW of capacity resources.
PacifiCorp is addressing coal retirement and replacement in its 2019 IRP, and is also seeking
acknowledgement from the OPUC and approval by other regulatory commissions in its six-state
service area targeting almost 2,400 aMW of new solar resources collocated with about 600 MW of
battery storage as well as almost 2,000 MW of new wind resource by the end of 2023, and construction
of a new high-capacity transmission line by 2024 in order to transfer additional wind resources to
replace coal, to improve reliability and address other system needs.
Other investor owned utilities that own coal generation resources in the Northwest that are retiring or
may retire within this decade are also considering replacement portfolios. None of these replacement
plans are considered in the DEIS “coal sensitivity”.
The assumption that nothing will be done until coal generation actually retires is false. The DEIS does
not assess that state utility commissions will mandate that utility coal-owners develop fully optimized
and least-cost resource portfolios as part of the approval process to replace the coal resources, thus
maintaining overall operational reliability and resource adequacy on their systems and assuring
continuity of operation for the Northwest power system as a whole. Indeed, the DEIS does not
reference the comprehensive and detailed IRP analyses being conducted to address exactly this
question by every utility owning coal resources in the Northwest and the Western Interconnection.
Nor does the DEIS explain why this information was not studied.
Furthermore, increased coal retirements in the West will change the landscape of operational reliability
and resource adequacy. The new resource portfolios being developed by PGE, PacifiCorp and others
are more diverse by resource type, performance and geography than has ever been the case in the past.
They rely strongly on fast-response generation, demand side and storage resources, all with inverter-
based grid interconnections that can respond much faster and more precisely to a control signal that
coal generation. They do not require minimum run rates that require uneconomic operation during
Joint Commenters Comments on CRSO DEIS April 13, 2020 - Page 51
periods of low system demand. They do not produce the wide array of environmental pollutants and
greenhouse gases of coal generation. They do not depend on volatile fuel markets. The replacement
portfolios will not only be cheaper than continuing operation of most of the Northwest coal fleet, they
will also provide improved reliability and resource adequacy. None of these factors, well developed in
technical literature and demonstrated in the IRPs referred to here, are reflected in the DEIS energy
analysis.
The timing of coal generation retirements and the nature of potential replacement resources will have
an effect on CRS operations, given that the Western Interconnection is a synchronous system under
federal mandatory reliability standards for frequency regulation and other compliance requirements.
Under the NERC transmission planning (TPL) mandatory reliability standards, studying these factors
is a legal requirement for the BPA transmission system, and studies must be conducted for time frames
out to 10 years. However, no such analysis was undertaken for the DEIS energy analysis.
Indeed, the related transmission studies in Step 4 of the DEIS energy analysis framework have
deficiencies of their own. The transmission reliability analysis (Appendix H, page H-3-14) was only
performed for the base case for a 2023 study year using WECC powerflow cases. Oddly, the DEIS
used a summer WECC case but performed a peak load analysis where it assumed minimum hydro
output. Yet the DEIS transmission analysis appears not to have made use of the WECC Heavy Winter
powerflow case. In any event, there was no explanation nor any demonstration of analytical results to
justify this choice.
In summary, the DEIS “coal sensitivity” completely ignores the policy, planning and resource
acquisition steps that are being taken to retire coal and gain immense economic, climate,
environmental and reliability gains. The DEIS justifies its inadequate and misleading analysis with
vague references to impacts on the CRS, but provides very little analysis or evidence, especially on
transmission impacts. The DEIS does not explain why it did not conduct the long-term IRP analysis
that would be required to assess potential impacts of coal retirement on the CRS and the resource
portfolios for the DEIS alternatives.
Joint Commenters Comments on CRSO DEIS April 13, 2020 - Page 52
4.16 “Conventional Least-Cost Portfolio”
The Replacement Power Analysis refers to the all-gas replacement scenario for MO3 as a “least cost”
portfolio. However, an IRP analysis would not determine that a specific resource is “least cost” by
assessing only one attribute, such as contribution to resource adequacy. “Least cost” resources are
identified through replacement portfolio optimization, which was not accomplished in the DEIS. The
blanket assumption that the specific type of natural gas generation chosen for the “least-cost
conventional” portfolio is without technical merit and is inconsistent with economic conclusions from
almost every recent Western Interconnection IRP process, which favor mixes of renewables, gas,
energy storage and demand side resources.
4.17 Substantial Costs for Necessary LSR Powerhouse Upgrades Not Considered
The Lower Snake River hydro generation facilities commenced commercial operation between 1962
and 1975. Since these facilities are assumed to have an engineering and economic life of 50 years, the
risk of unforced outage and longer shutdown for extended maintenance, and even forced retirement,
continues to grow as the 50-year anniversary approaches.
The common language metaphor for this process is the “bathtub curve” 25 – high maintenance costs
when a facility is first put into place, followed by a long period of reliable and low-cost operation, and
then increasing costs as parts begin to weaken and fail, followed either by refurbishment, replacement
or retirement. The bathtub curve is a useful way to conceptualize the future of the LSR
hydrogeneration facilities.
Of the 24 generation units at the LSR dams, the first three at Ice Harbor dam are now undergoing a
refurbishment and replacement program. In a news release in June 2019, the project manager stated,
“After 50 years of operation and increasing maintenance requirements, the need to replace the existing
turbine runners at Ice Harbor presented the opportunity to pursue new turbine runner designs with fish
passage improvement as a priority.”26 The project cost is currently estimated at $92 million. The first
25 Sumereder, C. (2008). Statistical lifetime of hydro generators and failure analysis. IEEE Transactions on Dielectrics and
Electrical Insulation, 15(3), 678–685. doi:10.1109/tdei.2008.4543104 26 US Army Corps of Engineers Walla Walla District, “New high-tech turbines at Ice Harbor improve safety for fish,
produce more power.” https://www.nww.usace.army.mil/Media/News-Releases/Article/1866445/19-067-new-high-tech-
turbines-at-ice-harbor-improve-safety-for-fish-produce-mor/
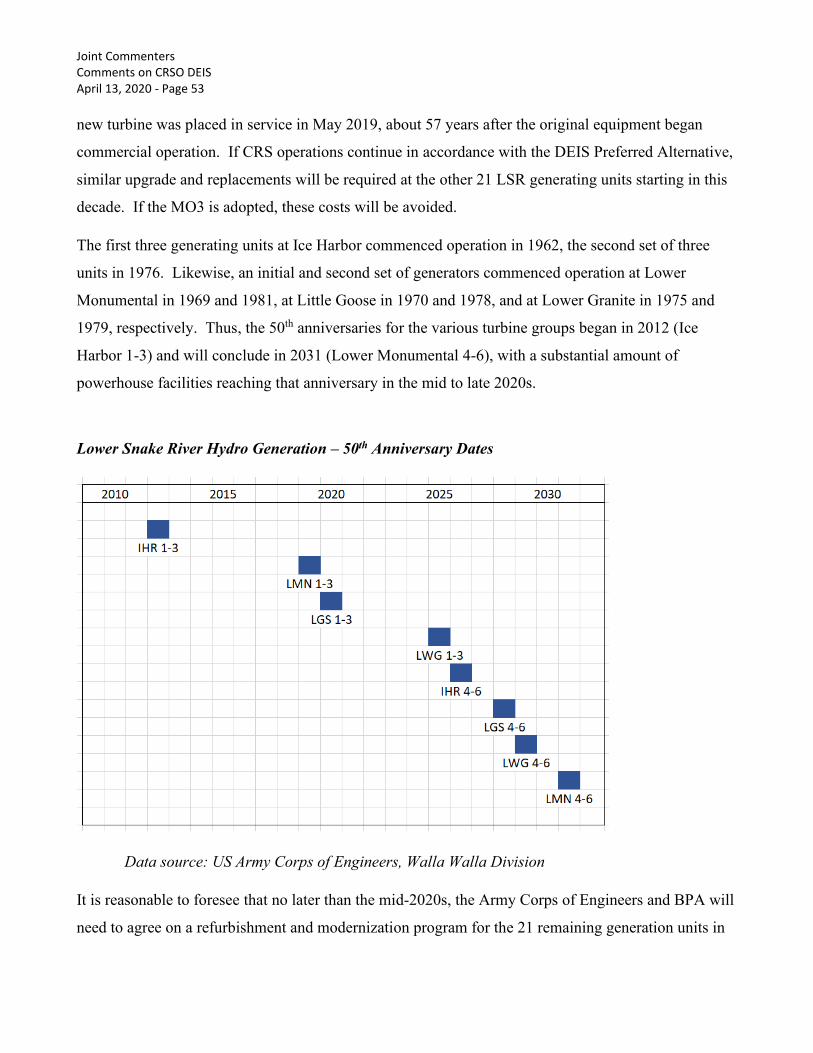
Joint Commenters Comments on CRSO DEIS April 13, 2020 - Page 53
new turbine was placed in service in May 2019, about 57 years after the original equipment began
commercial operation. If CRS operations continue in accordance with the DEIS Preferred Alternative,
similar upgrade and replacements will be required at the other 21 LSR generating units starting in this
decade. If the MO3 is adopted, these costs will be avoided.
The first three generating units at Ice Harbor commenced operation in 1962, the second set of three
units in 1976. Likewise, an initial and second set of generators commenced operation at Lower
Monumental in 1969 and 1981, at Little Goose in 1970 and 1978, and at Lower Granite in 1975 and
1979, respectively. Thus, the 50th anniversaries for the various turbine groups began in 2012 (Ice
Harbor 1-3) and will conclude in 2031 (Lower Monumental 4-6), with a substantial amount of
powerhouse facilities reaching that anniversary in the mid to late 2020s.
Lower Snake River Hydro Generation – 50th Anniversary Dates
Data source: US Army Corps of Engineers, Walla Walla Division
It is reasonable to foresee that no later than the mid-2020s, the Army Corps of Engineers and BPA will
need to agree on a refurbishment and modernization program for the 21 remaining generation units in
Joint Commenters Comments on CRSO DEIS April 13, 2020 - Page 54
the four Lower Snake River dams if the Preferred Alternative or another option other than MO3 is
pursued. Indeed, the first set of units at Lower Monumental and Little Goose have already passed the
50th anniversary.
However, the CRSO DEIS steadfastly refuses to directly address this likelihood. Instead, the DEIS
states,
DEIS, Appendix Q, Annex A, Q-A-7 and 8
It appears from this language that the prospect for avoiding the future necessary refurbishment and
modernization of the four Lower Snake River dam powerhouses is not considered in the DEIS energy
analysis for MO3.
Furthermore, on March 31, 2020, the Bonneville Power Administration issued a message by email that
included the following statement:
Major powertrain replacements for the Snake River Dam hydroelectric assets are not
currently forecasted to occur within our 20-year system asset plan. Long-term planning
analyses that calculate the optimal economic time to replace equipment based on current
and expected equipment health, probability of failure and outage consequence, point to
the late 2030s as the earliest replacement dates. In fact, most of the optimal replacement
Joint Commenters Comments on CRSO DEIS April 13, 2020 - Page 55
dates are spread between the 2040s and 2060s for the Lower Snake dams for turbine
and generator replacements.27
To the knowledge of the Joint Commenters, this is the first statement made publicly by Bonneville that
the LSR powerhouse upgrades can be delayed until the original equipment is 70 to 90 years old.
As previously noted, current work on the first three generation units at Ice Harbor will cost about $92
million under contracts executed several years ago. Similarly, a major modernization project for the
powerhouse at McNary dam on the Lower Columbia River is also in progress. The McNary project
will cost approximately $340 million to upgrade 980 MW of generation.
Together, the Lower Snake River dams have a combined nameplate capacity of over 3,000 MW, more
than three times as much as McNary. While it is not possible to make a direct comparison, it seems
likely that a complete Lower Snake River hydrogeneration upgrade could cost well in excess of $1
billion. Whether this occurs starting in the mid to late 2020s, or is mostly accomplished after 2040, the
DEIS totally fails to address this crucial element affecting future CRS operations and costs.
5. Conclusion
The Joint Commenters conclude these comments by summarizing the main findings:
1. The DEIS confirms that dam breaching and clean energy power replacement can
maintain electric system reliability while providing the best chance for fish restoration.
2. The DEIS fails to meet energy industry resource planning standards, resulting in
numerous inaccuracies and an exaggerated cost for clean energy power replacement.
3. Because the DEIS fails to provide the accurate information needed to make informed
decisions, a new, more rigorous study is required.
The preceding comments of the Joint Commenters demonstrate conclusively that the DEIS energy
analysis failed to meet industry standards and did not achieve optimized, least cost/least risk outcomes
for the energy resource portfolios for each of the DEIS alternatives, especially MO3, the dam
breach/hydrogeneration retirement alternative. This has resulted in proposed replacement portfolios
that are nearly certain to be substandard in performance and excessively high in cost, with
27 “BPA Finances and Snake Dam hydroelectric information,” G. Douglas Johnson, Senior Spokesman, BPA, March 31,
2020.
Joint Commenters Comments on CRSO DEIS April 13, 2020 - Page 56
proportionally excessive costs for wholesale and retail electric rates. These failures directly result in
the agencies selecting a preferred alternative without adequate justification.
Thus, the CRSO DEIS fails to accomplish a “hard look” at the energy options to mitigate impact to
protected species required by the National Environmental Policy Act and the Endangered Species Act.
The Joint Commenters recommend that the entire energy analysis be redone for the final EIS,
employing comprehensive long-term portfolio analysis consistent with standard industry practices.
Respectfully submitted,
/s/ Fred Heutte
Fred Heutte
Senior Policy Associate
NW Energy Coalition
206-621-0094
Dated: April 13, 2020