Embed Size (px)
Citation preview

Title: Optimization Tools for the Design of Structures
Authors: Mark Sarkisian, Director, Skidmore, Owings & Merrill LLPEric Long, Associate Director, Skidmore, Owings & Merrill LLPChung-Soo Doo, Skidmore, Owings & Merrill LLPDavid Shook, Skidmore, Owings & Merrill LLP
Subject: Structural Engineering
Keyword: Optimization
Publication Date: 2009
Original Publication: ASCESEI 2009
Paper Type: 1. Book chapter/Part chapter2. Journal paper3. Conference proceeding4. Unpublished conference paper5. Magazine article6. Unpublished
© Council on Tall Buildings and Urban Habitat / Mark Sarkisian; Eric Long; Chung-Soo Doo; David Shook
ctbuh.org/papers

SEAOC 2009 CONVENTION PROCEEDINGS
1
Optimization Tools for the Design of Structures
Mark Sarkisian, SE, Director Eric Long, SE, Associate Director
Chung-Soo Doo, SE David Shook
Skidmore, Owings & Merrill LLP San Francisco, California
Abstract Inspired by the seminal paper by A.G.M. Michell (1904), engineers have investigated several tools for the optimization of structural shapes and systems. Structural optimization has attracted increasing interest in the building industry, especially in the design of high-rise buildings. By selectively distributing structural members in a building, the efficiency of the resulting design can be optimized; often resulting in aesthetically interesting forms. Often these forms are not intuitive. Although derived only for relatively simple geometries and load conditions, Michell trusses represent a valuable starting point in defining optimal structural configurations. In recent years efficient numerical methods have been developed, along with increased computing power, to assist in the search of optimal structural solutions. Among these techniques are deterministic methods such as gradient-based algorithms and non-deterministic methods such as evolutionary algorithms. This paper presents an application of these concepts for the design of the 365 meter tall Al Sharq Tower to be located in Dubai, United Arab Emirates. This unique and slender building (aspect ratio of 10:1) employs a perimeter spiraling filigree of high-strength steel cables to resist gravity and lateral loads resulting in a column free exterior. Genetic optimization is employed to facilitate a broader search of cable profile solutions. Perimeter cable size, spacing and pitch are varied to identify an optimal cable arrangement. Results provide information about the flow of forces in the structure and aid designers in the characterization of efficient structural systems. Introduction Structures found in nature often appear confused or out of place when considered independent of their indigenous habitat. To fully appreciate a structure it must be considered with its constraints and boundary conditions. The tall redwood sequoias of northern California (Figure 1), like
many other trees, possess inherent aspirations and constraints. One goal of a sequoia tree is the maximization of nutrient gathering and one constraint could be poor soil strata. Two facets of nutrient gathering include leaf exposure to sun and root exposure to subterranean nutrients. Constraints may also include neighboring trees, climate, insects, etc. Even with all these objectives and limitations, trees find success without a set of drawings indicating trunk section properties or what elevation branches should be located. .
Figure 1. Redwood Sequoia Tree

2
In many ways the structures that engineers design are no different than their sapling counterparts. What stands in contrast is planning and execution. Engineers aspire to efficient designs, and spend months carefully detailing members and materials in harmony with constraints placed by clients, architects, codes, site conditions, etc. Unfortunately, buildings lack the opportunity to adapt their configuration after construction. In what follows, an investigation involving a novel residential tower is conducted to determine structural systems which satisfy various client aspirations, code limitations, and performance. Methods and schemes observed in nature formulate an efficient and complimentary structural system. The current study involves the 365 meter (1,200 ft) tall Al Sharq Tower to be located in Dubai, United Arab Emerits (Figure 2). The plan form of the structure includes nine-adjoining 13.4 meter (44ft) diameter cylinders. When combined, half and corner modules are derived with all cylinders surrounding a central transportation core. The client has large residential program area requirements, a small site footprint, and aspirations of standing out among a forest of new construction with uninterrupted views. As a result of these requirements, the tower has an aspect ratio of approximately 10:1, a building floor plan larger than the site footprint, and a column-free perimeter. Since traditional perimeter columns were not permitted, the design teams considered a cable-supported perimeter. Due to the height of the structure the cables need to traverse the structure and terminate in shear walls for anchorage. Early efforts by the architectural and structural design teams to generate an aesthetically appealing profile followed classic geometric definitions such as that of a helix. With initial concepts conceived, the design team contemplated the question “What is the optimal configuration of perimeter cables within this structure?” With this charge, the structural design team conducted several studies as outlined in the following text.
Figure 2. Al Sharq Tower

3
Structural System Description General The 102-story residential tower is 365 meters (1200 ft) tall above grade with two basement levels below grade and a total building area of approximately 136,000 square meters (1.46 million sq.ft). The typical floor plan footprint is approximately 40m x 40m (131ft x 131ft) tapering to 36m x 36m (118ft x 118ft) at the base resulting in an aspect ratio of 10:1. The proposed structural system consists of reinforced concrete from the foundation to roof combined with perimeter spiraling high-strength galvanized steel cables. The structural systems are conceived considering seismic and wind requirements based on the 1997 Uniform Building Code and local Dubai requirements in addition to gravity loads. Lateral System The lateral system consists of intersecting sets of parallel shear walls and perimeter high-strength galvanized steel cables. A typical floor framing plan is shown in Figure 3. At the base, shear walls are 1000 mm (3.3ft) thick and reduce to 800 mm (2.6ft) and 600 mm (1.96ft) at levels 34 and 66, respectively. All shear walls utilize C60 concrete (60 MPa cube strength, 7,250 psi cylinder strength). Reinforced concrete link beams are utilized at openings required for doors and other services. For increased capacity, composite link beams are utilized at middle and lower level floors. A typical partial shear wall elevation is shown in Figure 4. Repetitious shear wall openings at most floors induce a regular pattern of link beams and T-shaped shear wall end-zone conditions. The axial load in the perimeter T-shaped end-zones of the shear wall is significant when compared to the typical interior portions of shear wall. Thus, differential axial shortening of the T-shaped end-zones over time is potentially considerably larger than in the interior core locations. To minimize the effects of axial-shorting over time and to minimize the impact on program area, four I-shaped built-up steel members with headed shear studs are included in each shear wall T-shaped end. One additional built-up I shape steel member is included on the interior side of the typical wall opening for local axial shortening at the end of the wall and for framing of composite link beams. Twin sloshing dampers are introduced at the roof to help resist lateral and torsional motions and reduce wind-induced accelerations and occupant perception to motion.
Figure 3. Typical Floor Framing Plan
Figure 4. Partial Shear Wall Elevation

4
Gravity System The gravity system consists of reinforced concrete shear walls, post-tensioned flat-plate floor slabs, and perimeter high-strength galvanized steel cables. Typical residential floors utilize a 220mm (8¾ in) thick post-tensioned flat-plate slab system supported by shear walls along the interior and high-strength galvanized steel cables at the perimeter, see Figure 3. Post-tensioning of the floor slab is included to ensure deflections are minimal at the center of each module and to minimize slab thickness for increased floor-to-floor heights. Flat-plate post-tensioning cables are typically 12mm (1/2 in) in diameter and unbonded. A typical floor plan including the post-tensioning tendon layout can be seen in Figure 5. The post-tensioning tendon layout is derived with the extreme event of partial or total perimeter cable failure in mind. If some or all of the cables were damaged, due to fire for example, the slab would lose support at its edge and deflect significantly. The post-tensioning layout and design considers a collapse prevention load case without perimeter slab support.
Figure 5. Typical Post-Tensioning Tendon Layout
Foundations Below grade strata consists of sandstone, calcareous sandstone, and calcarenite. Due to the tower’s height and limited vertical supports, high compressive stresses are expected at the base of the shear walls. Thus, a 5000mm (16.7ft) thick mat foundation is placed over 1500mm (5ft) diameter bored piles. Foundation walls are 750mm (30in) thick at the perimeter.
Perimeter Cable System The perimeter cable system consists of approximately 70 kilometers (44 miles) of high-strength galvanized steel cable varying in diameter from 15mm (5/8 in) to 50mm (2in). Perimeter cables typically originate and terminate at the T-shaped shear wall end-zones. Initial architectural concepts of the cable profile included cables traversing up 9 floors of the middle modules and 14 floors of the corner modules at 1.5m (5ft) spacing. Initial cable profiles suggested a helical formulation for each cylinder as described by Equations 1 through 3:
( )( ) cosX z r t= (1)
( )( ) sinY z r t= (2)
z t= (3) where X and Y are the coordinates in plan of the cable relative to each cylinder’s origin, z is elevation of the portion of cable considered, r is the radius of the cylinder, and t is typically given over a discrete range and determines helix height. The perimeter cable pitch and elevation are correlated by Equation 3 and proportional to π. The helix definition is propagated to each perimeter cylinder. Finally the helices are truncated at the building perimeter leaving the out-board cable definition as the cable filigree. The perimeter cable elevation is shown in Figure 6. Since the employed cables are tension-only members, the direction of cable spiral is important. From statics it can be observed that an inherent torsion would be induced on the tower if all cables spiraled in the same direction. To alleviate this condition, four of the eight perimeter cylinders will employ clockwise spiraling cables and the remaining four will employ counter-clockwise spiraling cables. The induced torsion by each cylinder will be mitigated by the opposing cylinder. A similar idea is observed in nature in the orientation of fibers in insect exoskeleton cuticle. Even though the fibers are tension-only members, their contrasting orientation allow for stiffness in multiple direction (Wainwright et al., 1976). Non-parallel fiber orientation allows for a robust and stiff composite which is effective in resisting loads from any direction. From analysis, the perimeter cable system is determined to increase the lateral stiffness by 15% and the torsional stiffness by 30% when compared to a lateral system with the interior intersecting shear-walls only.

5
Figure 6. Typical Perimeter Cable Elevation
Construction Sequence The perimeter cables are required for the vertical support of the flat plate floor slabs thus requiring a unique construction sequence. To avoid require continuous shoring/reshoring over the entire height of the tower, the perimeter cables are integrated into the concrete construction sequence as described below and shown in Figure 7. 1. Core construction to be completed with cable anchors 10
stories in advance. 2. Form and pour first floor with embed plates for edge of
slab to cable connection. 3. Form and pour second floor with embed plates for edge
of slab to cable connection. 4. First floor forms removed and reshored. 5. Install cables which bypass the first floor only. Prestress
cable and install cable connection at the edge of slab to provide vertical support.
6. Form and pour third floor with embed plates for edge of slab to cable connection.
7. Remove reshoring at first floor where cables provide vertical support.
8. Repeat the above process moving in an upward diagonal progression.
Figure 7. Construction Sequence Diagram

6
Cable Profile Study At the onset of design, the architecture team provided a conceptual layout of the exterior cables, but requested that the structural design team provide a rational cable profile which assisted the lateral and/or gravity systems. The design opportunity was approached with contemporary optimization tools. Gravity Load Investigation Since gravity loads induce a vertical load component to the cable system, their most efficient orientation would be vertical. Due to the height of the structure, this is not feasible. Additionally, as the cables traverse the tower, each floor will add additional load to the cable. Thus, if too many floors are traversed (i.e. cables are to vertical), then too much gravity load will be transferred to the cables. To identify the most efficient cable pitch with respect to gravity loads, a study is conducted by altering the cable pitch and observing how much load is incurred. Since gravity and lateral loads will be additive in the cables the proportion of gravity load needs to be limited such that reserve capacity is maintained for the lateral event. A reserve capacity of 15-25% is needed to ensure sufficient cables will not yield in a lateral event. The most efficient cable pitch will maximize cable spacing and maintain the specified reserve capacity. From this study, a cable pitch of 30° is identified as the optimal cable pitch for gravity loads. Lateral Load Investigation Observation of principle stress as a means of form generation is well established in nature as demonstrated by the growth pattern of nautilus shells, fiber-reinforcement of palm tree branches, structure of bones, etc (see Figure 9). As is evidenced in nature and proposed by Michell’s Theorem (1904) (Figure 8), ‘the optimum framework of minimum weight is also the stiffest of all possible frameworks’ (Wainwright, 1976). Since the minimization of weight and maximization of stiffness are goals of the cable profile study, principle stress observation is undertaken for the identification of the optimal cable profile for the Al Sharq Tower. An investigation of principle stresses over the building’s perimeter skin is conducted to determine how the nine-cylinder form of the building might react to lateral loads. For this study, the building’s skin is modeled with shell elements using Strand7 finite element analysis software and subjected to a uniform wind load. Gravity loads are neglected. Results of the investigation show that the tower’s deformed shape is similar to that of a cantilever beam. This is expected
due to its high aspect ratio and relatively fixed boundary conditions at the base. Additionally, principle stresses are obtained and illustrated in Figure 10. The direction of principle stress is influenced by the elevation and location in plan with respect to the applied lateral load direction.
A single force F applied at A, and acting at right angles to the line AB, is balanced by an equal and opposite force and a couple, of moment FxAB, applied at B. The minimum frame is formed of two similar equiangular spirals having their origin at B and intersecting orthogonally at A, together with all other spirals orthogonal to these and enclosed between them.
Figure 8. Michell Truss Diagram and Excerpt (1904)
Nautilus Shell
Base of Palm Branch
Cross Section of a Bird’s Wing
Figure 9. Examples of Optimal Framework in Nature

7
Figure 10. Principle Stress Analysis and Resulting Cable Profile

8
If the Al Sharq Tower were a simple square shape in plan, the principle stress contours would generally be tensile (vertical) at the windward face, shear (45º) at the side faces, and compressive (vertical) at the leeward face. For the bundled cylinder plan of the Al Sharq Tower, the four corner modules exhibit vertical (tension or compression) principle stress contours at the base and transition to 45º (shear) near the top whereas the middle modules exhibit vertical (tension or compression) principles stress contours over the entire height at the windward and leeward faces and 45º (shear) over the entire height at the side faces. The most notable deviation from the above mentioned square plan is the appearance of shear (45º) principle stresses near the top of the tower at the windward and leeward faces. The influence of stresses at the side faces as well as curvature in plan is the cause of their manifestation. Since cables are tension-only members, their most efficient orientation is in alignment with the direction of principle stress. This is not always possible since lateral loads can originate from any direction. To account for various wind load directions, each face of the tower should have the same cable profile definition. With this in mind, it might be advantageous to align the cables with the principle stress directions observed at the windward face as they are primarily tensile or shear and non-compressive. This would result in all middle modules having vertical cables and all corner modules having vertical cables at the base and transitioning to a 45° pitch at the top. Unfortunately, this would mitigate utilization of the cables of the middle modules at the sides of the tower. Since the sides of the tower are primarily in shear. To maximize the effectiveness of all cables in a lateral event the windward corner module profile of transiting from vertical to a pitch of 45° is considered the most effective and applied to all modules. To define this transition a modified helical formulation is employed based on Equations 1 through 3. The modified-helical formation is shown in Equations 4 through 6:
( )( ) cosX z r t= (4)
( )( ) sinY z r t= (5)
Total
nzt zz
⎛ ⎞= ⎜ ⎟
⎝ ⎠ (6)
where zTotal is the total height of the building (365m), and n is an adjustable parameter that defines the rate of pitch transition over the height of the structure. The ratio of current to total height raised to the power n alters the cable pitch as a function of tower height. A value of n = 0 yields no transition of pitch, n = 1, yields a linear transition from vertical to 45° over the height of the structure, n = 2
yields a parabolic transition, n = 3 yields a cubic transition, etc. In the context of Equations 4 through 6, initial architectural concepts employed n = 0. Various potential helices are illustrated in Figure 11. From observation of the principle stresses, it is determined that the transition of principle stress orientation over the face of the windward corner modules is approximately parabolic (n = 2). Thus, a parabolic-tapered helix definition could be used to fully define the cable profile over the height of the structure as illustrated in Figure 10. As can be observed, the illustrated parabolic-taper helix definition closely matches that of the corner module of the windward face of the principle stress contours.
Figure 11. Various Taper-Helices
Observation of principle stresses at the building perimeter for the determination of cable profile is reasonable if the exterior were monolithic and homogenous. The perimeter is actually a series of discrete tension-only cables. Thus, the principle stress investigation may provide a rational basis of global-perimeter load paths, but further investigation is needed to determine an optimal cable profile. Cable Profile Optimization With a rational basis of perimeter load path established, further investigation is needed to develop an efficient cable profile for the resistance of lateral loads. Improved performance is pursued through the employment of a genetic algorithm (GA) optimization routine. Two phases of optimization are conducted. In Phase I, the GA is to identify the optimal combination of cable diameter, spacing, and pitch. For this phase, the pitch is to be uniform over the height of the tower. With these results, Phase II optimization considers a pitch which varies over the height of the tower. In what follows a general description of the employed GA is provided. Then results from Phase I and Phase II optimization studies are discussed.

9
Description of Genetic Algorithm Genetic algorithms have been used in a wide-range of applications for improved performance in numerous trades such as the aerospace, automobile, and medical industries. This simple, yet robust algorithm facilitates multi-variable and multi-objective searches in large, often poorly defined, search spaces. Early investigations of evolutionary algorithms were conducted by Holland (1975) and inspired from observations made by Darwin (1859). GA is a heuristic optimization method which utilizes trial-and-error of mass populations as a basis of optimization. Although numerous variations of this algorithm have been developed, a traditional approach is employed here. To demonstrate GA concepts, a simple truss optimization problem is illustrated in the following text. GA procedure is summarized in Figure 12.
Figure 12. GA Operation Flow Chart For GA optimization to begin, an initial population must first be generated. A population is a group of candidate-solutions.
For the example truss problem, a population would consist of a set of various truss configurations. Each truss would have a different member configuration but the loading and boundary conditions would be the same. This concept is illustrated in Figure 13.
Example Population of Trusses
Example Crossover Operation
Example Mutation Operation
Conduct
Crossover
Administer
Mutation
Figure 13. Example GA Illustrations With an initial population generated, candidate-solutions are evaluated. Their fitness, or score, is determined by a fitness function (J). For this example a truss’s fitness is the sum of normalized deflection and normalized weight. Both deflection and weight must each be normalized to minimize bias in the fitness score. Analysis software can be used to quickly determine the deflection and weight of each truss in the population. The initial population is the first parent population and is used to generate the child population. The child population is a new set of candidate-solutions which are derived from the parent population. The child population is to be the same size as the parent population. Each member of the child population is to be generated using one of three GA-operators.

10
The first type of GA operation is called ‘crossover’. A crossover operation takes two parents and combines characteristics from each parent to form a child. This concept is illustrated in Figure 13. Parent truss A and Parent truss B are combined to form a child truss. As can be observed, the child truss contains characteristics of both parents. The second type of GA operation is called ‘mutation’. A mutation operation takes one parent and alters one or more characteristics of the parent to form a child. This concept is also illustrated in Figure 13. As can be observed, one member of the parent truss is altered for form the child truss. The third type of GA operation is called ‘survivor’. This operation simply allows a parent to directly enter the child population without alteration. Typically, a favorable solution is elected for this operation to preserve top-performing solutions. After the child population is generated, each child is evaluated and fitness (J) determined. Next, parent and child populations are combined into a single pool of candidate-solutions. The pooled set is ranked according to each members fitness score. For the truss example problem, the truss with lowest fitness score (J) is considered best and the truss with highest fitness score is considered worst. With the pooled parent and child populations ranked, the top 50% are elected to be the parent population for the next generation. The remaining trusses are discarded. The employed GA utilizes is a generation-based approach as described graphically in Figure 12 where k is the current generation number, K is the maximum number of allowed generations, and h is a prescribed number of previous generations to observe for convergence. Generation-cycles are to continue until one of two criteria is satisfied. The first criterion is termed Type A. This condition monitors the current top-performing solution in comparison to the previous h generations. If the previous h generations yield similar fitness to the current top-performing solution, then optimization is considered converged and is terminated. In some cases, it may be difficult to obtain steady-state fitness over h generations. This is especially true for large search spaces. The second criterion is termed Type B. This condition stops optimization when a prescribed maximum number of generations, K, are obtained. Values for K are estimated by the engineer. Variables of a candidate-solution are termed genes and are contained in a chromosome. A chromosome is a matrix of values which represent a candidate-solution. For example, truss member locations could compose a chromosome. The matrix formulation facilitates genetic operations such as crossovers and mutations in a programming environment.
A key attribute of an effective GA is the ability to maintain a sufficient level of diversity in the population of solutions. Too little diversity can stagnate generation cycles and too much diversity can disorient the optimization process. To ensure adequate diversity is obtained, several types of crossover and mutation operations are employed. Some operations are aggressive in searching out new regions of the search-space while others are more focused and seek to improve local minima. Two types of crossover operations are conducted as described in Figure 14. The first is a single-point crossover of genes between two randomly selected chromosomes. Here, a random slice-point is selected and information is exchanged between chromosomes. The second is shuffle crossover where every-other gene is exchanged between chromosomes.
Figure 14. GA Mutations and Crossovers
During single-point crossover operations, favorable or unfavorable genes are combined to form a child. This process yields moderate diversity in the pool of solutions where much of the genetic information remains intact. The shuffle crossover is more aggressive and exchanges significant quantities of information among chromosomes. This process produces high levels of diversity in the pool of

11
solutions since genetic information is heavily diffused among child chromosomes. Two types of mutation operations are employed as described in Figure 14. The first is a blind mutation where one or more genes in a chromosome are multiplied by a random value. The second is a Gaussian mutation where one or more randomly selected genes are multiplied by a random number determined by a Gaussian distribution. In both mutation operations the mutated value is maintained within the pre-defined search space. The number of genes to be mutated is specified by the user. The blind mutation operator provides moderate diversity to the pool of solutions. The Gaussian mutation operator provides modest diversity to the pool of solutions since the modified value is likely near in value to the current gene. Both types of operations can be made more aggressive if a large percentage of the chromosome (>20%) is to be mutated. The inclusion of multiple crossover and mutation types allow for each type of operation to distribute genetic information across the population in different manners. Thus, a sufficient level of diversity can be maintained. The concept of diversity in the pool of solutions is illustrated in Figure 15. Here, horizontal and vertical axes represent values x1 and x2 which are genes in the chromosome. Recalling the truss example, at the first generation all trusses have been randomly generated; thus, their location in the search space is widely scattered and diverse. Midway through the optimization process many candidate-trusses have navigated to regions of local minima. These are regions where trusses find success in minimizing their fitness score. At the end of optimization most, if not all solutions have centered near the global minimum. The global minimum is the optimal solution. For the truss example it would be the optimal arrangement of members considering weight and deflection criteria. The progression of solutions to local minima, and then to the global minimum indicates that a satisfactory level of diversity is obtained. Most GA optimizations begin with a sufficient level of diversity due the random creation of the initial population, but often converge towards local minima before the global minimum has been obtained. There is no guarantee that the global minimum will be a part of in the final generation, but an investigation into GA-search space results (as illustrated in Figure 15) can reveal if a reasonable progression of local to global optimal solutions is obtained.
Var
iabl
e
Global Minimum
Regions of Local Minima
1st Generation Mid-run GenerationFinal Generation
Variable
Figure 15. Example Search Space Application of Genetic Algorithm to Al Sharq Tower With the concepts of the genetic algorithm described, its application to the optimization of cable filigree of the Al Sharq Tower is now considered. GA operations are to optimize three types of variables which include cable diameter, spacing and pitch. The values are stored in a chromosome, as previously discussed, and illustrated in Figure 16.
Figure 16. GA Variables

12
At each generation the child population is formed by executing the previously mentioned crossovers and mutations. 25% of the child population is created by crossovers, 25% by mutations, and 50% are survivors from the parent generation. Of children produced by a crossover, 50% are single-point crossover operations and 50% are shuffle crossover operations. Of children produced by a mutation, 40% are blind mutations and 60% are Gaussian mutations. Since children are produced by moderate and aggressive GA-operations, sufficient diversity should be maintained in the population. This is done to ensure the search space is adequately interrogated. To implement GA for the optimization of Al Sharq cable filigree, several tools are needed. A general purpose programming environment is needed for GA-operations, interaction with finite element software, and collection of results. Visual Basic .NET (2009) of Microsoft’s Visual Studio is well-suited for this task due to its robust interaction with other software, relative ease of use, and Microsoft Windows (2009) interface. An illustration is provided in Figure 17 of GA tools and their relationships.
Figure 17. Implementation of GA First, a master-script is written in Visual Basic .NET to manage the GA at each generation. The purpose of the master-script is to initiate optimization, access sub-functions, pass information to other software, etc. It is the central manager of GA operations.
For each GA operation a sub-function script is generated in the Visual Basic .Net language (2009). Examples of GA sub-functions include crossover operator, mutation operator, fitness calculation, solution ranking, analysis model generation, etc. Most processes in Figure 12 require an individual script for execution in GA optimization. All GA-related scripts are compiled into a dynamically linked library (.dll) termed ‘GA Toolbox Library, for use by Visual Basic .NET during GA optimization. Two graphical user interfaces (GUI) are created for ease of use. The engineer inputs values such as number of generations (K) and percentage of mutations to conduct. Also, the GUI displays a running list of results for the engineer to observe in real-time during GA-optimization. Furthermore, the GUI allows other engineers who are less familiar with underlying scripts to use the tool. Two GUIs appear for user input and are shown in Figure 18.
Figure 18. Graphical User Interfaces Finite element analysis software Strand7 (2009) is utilized for analysis of GA-generated cable profiles. A sub-function is generated which obtains values from the GA-generated chromosome (cable spacing and diameter, for example) and generates a new analysis model. The script generates a new model for each member of the population at each generation using Strand7’s Advanced Programming Interface (API). API facilitates communication between Strand7 software and Visual Basic .NET. Since analyses models average about 45,000 elements, a fast analysis solver is needed. Since Strand7 solver utilizes contemporary sparse solvers, it is well suited for rapid analysis. A full recording of results is exported to Microsoft Excel (2009) for observation, filtering, and graphical representation. Candidate fitness attributes, as well as crossover and mutation operations are recorded at each generation. Later, results from Microsoft Excel are used for investigation and interpretation.

13
Phase I Optimization GA is to identify optimal values for cable diameter, spacing, and pitch for Phase I optimization. Cable spacing and pitch are proportional for this phase of optimization since all cable-slab connections align in elevation; thus, larger cable spacing results in lower cable pitch. Cable pitch, and therefore spacing, is uniform over the height of the tower. The goal of Phase I optimization is to minimize cable weight while simultaneously minimizing roof drift. Cable weight is quantified by the product of cable area and total cable length. A candidate-solution’s fitness score (J1) is taken to be as follows:
)**(1
1 RoofDriftLengthTotalCableCableAreaJ =
(7)
By maximizing the inverse of specified values, a minimization of roof drift and total cable weight is undertaken. A total of 50 generation-cycles are conducted with a population size of 100, thus evaluating a total of 5000 models. Total run time of 50 generations is approximately 40hrs. Only Type A GA-search termination condition is employed for this phase. As can be seen in Figure 20, the global top performing solution is determined at the seventh generation after 700 models have been evaluated. Diversity is maintained in the pool of solutions throughout all generation cycles as indicted by the average of population at each generation. Large population pool of 100 candidates facilitates an aggressive search.
Diversity aids in ensuring that the identified top performing solution is the global best solution in the search space. Since diversity is observed in the pool of solutions and steady-state behavior is observed in the results, a global-optimal may be considered identified for the Phase I investigation. A graphic summary of results from early-, mid-, and final top performers is summarized in Figure 19. Early top-performing solutions utilized a larger cable diameter and tighter spacing. This results in a small roof drift, but heavy system. As optimization progresses, cable diameter is reduced and spacing increased. The increase in cable spacing results in a lower cable pitch. Thus, roof drift increased, but weight was reduced. As can be observed, a compromise between drift performance and cable weight is achieved.
Figure 19. Summary of Phase I Results
4
5
6
7
8
9
10
11
0 5 10 15 20 25 30 35 40 45 50
Generation Number (k )
Fitn
ess
Scor
e (J
1)
Best of Current Generation Average of Top Performers Average of Population
Figure 20. Results of Phase I GA Optimization
Global Best

14
Phase II Optimization Phase II optimization seeks to further refine the results of Phase I GA optimization. Results of Phase I optimization yielded a global best cable profile of 15mm (5/8in) diameter cable at 3.9m (12.7ft) spacing which corresponds to a 35° pitch. As already observed in the principle stress analysis, optimal cable pitch may vary over the height of the tower. With this in mind, Phase II optimization is to allow pitch at each floor to be varied. This results in one variable per floor (102 total) being optimized. This broad search space is employed to ensure that bias in the search space is minimized. Furthermore, the fitness function is to only consider roof drift as shown in Equation 8:
RoofDriftJ 1
2 = (8)
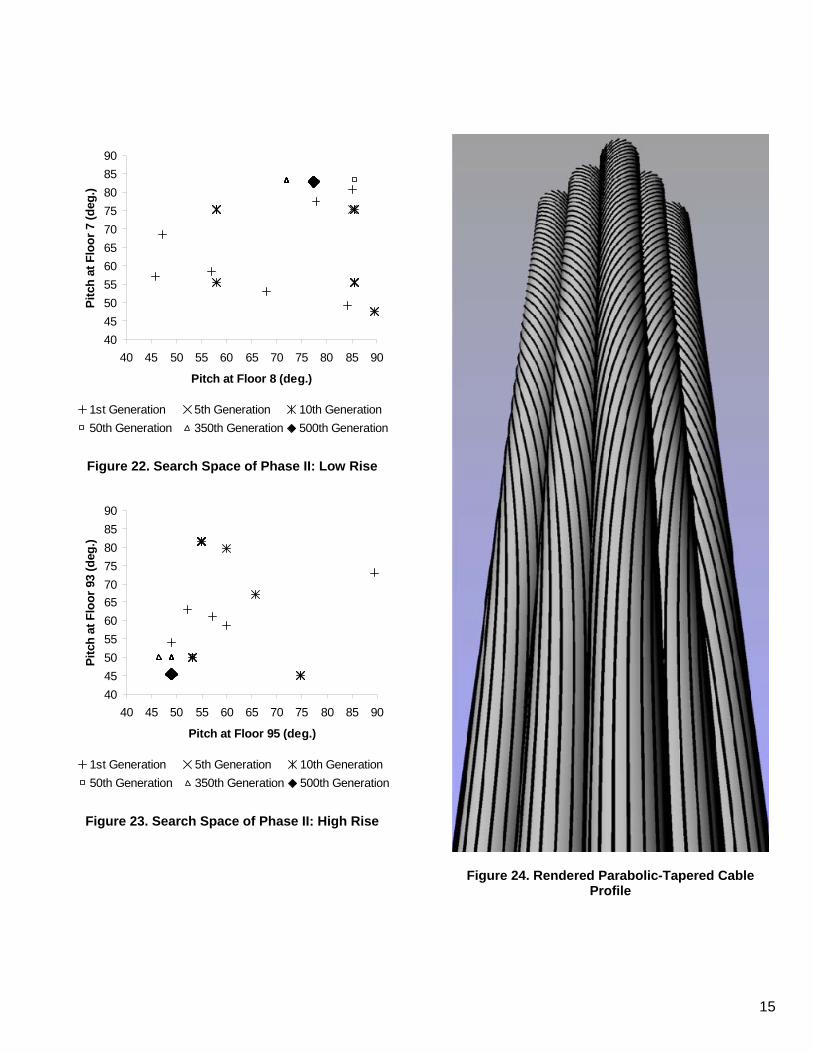
A total of 500 generation-cycles are conducted with a population size of 10, thus evaluating a total of 5000 models. Total run time of 500 generations is approximately 40hrs. Type A and B GA-search termination conditions are employed. As can be observed in Figure 21, the Type A GA-search termination condition was not activated. By observing GA improvement trends over the 500 generations, 67% of improvements are made during the first 250 generations. Furthermore, the final 100 generations only observed 8% of overall improvement. Thus, the GA began converging towards a global minimum near the end of GA optimization. Furthermore, observations of GA search spaces yield strong evidence of convergence. Pitch values for typical low-rise levels 7 and 8 are plotted in Figure 22 for generations 1, 5, 10, 50, 350, and 500. Early generations show high diversity
for pitch values, but as generations progress, they trend towards 80°. Similar results are shown in Figure 23 for typical high-rise levels 93 and 95. Here, pitch levels trend towards 48°. Thus, by observation of search space trends, convergence is shown for typical low- and high-rise levels. The GA could be extended several generations to verify the obtained results, but sufficient evidence has already been attained to indicate convergence towards a global minimum. Of further interest is the cable pitch determined by the Phase II GA study. It has been previously determined in the principle stress investigation that if cables were to align to principle stresses, then the most favorable cable profile would orient cables vertically (90°) at the low-rise levels and transition to 45° at high-rise levels. These results are confirmed by Phase II of GA optimization as demonstrated in Figures 22 and 23. Low rise levels are observed to trend towards a vertical (90°) orientation and high-rise levels are observed to trend towards a 45° pitch. With agreement between principle stress investigation and GA Phase II optimization, it is determined that the optimal cable profile for lateral system performance is vertical (90°) at the base and transitioning to 45° at the top. The transition is determined to be parabolic and is rendered in Figure 24.
1012
1014
1016
1018
1020
1022
1024
0 50 100 150 200 250 300 350 400 450 500
Generation Number (k )
Fitn
ess
Scor
e (J
2)
Best of Current Generation Average of Top Performers Average of Population
Figure 21. Results of Phase II GA Optimization
Global Best
15
4045505560657075808590
40 45 50 55 60 65 70 75 80 85 90
Pitch at Floor 8 (deg.)
Pitc
h at
Flo
or 7
(deg
.)
1st Generation 5th Generation 10th Generation50th Generation 350th Generation 500th Generation
Figure 22. Search Space of Phase II: Low Rise
4045505560657075808590
40 45 50 55 60 65 70 75 80 85 90
Pitch at Floor 95 (deg.)
Pitc
h at
Flo
or 9
3 (d
eg.)
1st Generation 5th Generation 10th Generation50th Generation 350th Generation 500th Generation
Figure 23. Search Space of Phase II: High Rise
Figure 24. Rendered Parabolic-Tapered Cable Profile

16
Results of Principle Stress and GA investigations Early efforts to determine an efficient and rational cable profile in response to lateral loads have yielded a cable profile derived from the observation of principle stress contours and confirmed by GA optimization. This cable profile follows a parabolic-helical definition which closely matches the principle stress contours observed at a corner module; vertical at the base transitioning to 45° at the top. Investigation of optimal cable orientation for gravity loads is determined to be 30°. This orientation is generally compliant with cable profiles which are optimized for lateral loads. Furthermore, GA optimization provides additional information regarding cable size and spacing. With all of these studies in mind, the parabolic-tapered helix profile is identified as the optimal cable profile. Conclusions Design of structural systems for the Al-Sharq Tower is conducted with consideration to client aspirations and material limitations. This process is not too dissimilar from the optimization processes which occur in nature. Palm trees, for example, have found success in climates of high winds and poor soil conditions such as costal zones. Similar to the studied tower, they utilize a central core and perimeter fiber-skin for the resistance of lateral loads. In some species, the height to trunk diameter ratio can exceed 20:1. As discussed by D’Arcy Thompson (1917), if an unfolded elevation were taken of palm tree fibers just below the bark level, ‘we can observe, towards the apex, the bundles of fibre curving over and intercrossing orthogonally with one another’. Considering the slenderness similarities between palm trees and the Al Sharq Tower, it is no surprise that a pattern would be revealed which is similar to parabolic-tapered cable profile developed in the current study. D’Arcy Thompson further generalized the concept of mechanical efficiency and form in nature as follows:
In short, the form of an object is a ‘diagram of forces’, in this sense, at least, that from it we can judge of or deduce the forces that are acting or have acted upon it: in this strict and particular sense, it is a diagram…
The Al Sharq Tower challenges the definition of what a tower can be and inspires engineers to seek more natural solutions to complex problems.
References Darwin, C., The Origin of Species by Mean of Natural Selection, or the Preservation of Favored Races in the Struggle for Life, November 1859, John Murray. ETABS, Computers and Structures Inc., 2009, Berkley, California. Holland, J., Adaptation in Natural and Artificial Systems, The University of Michigan Press, Ann Arbor, Michigan, 48016. Michell, A.G.M., “The Limits of Economy of Material in Frame-Structures”, Phil. Mag., 1904, Vol. 8, pp. 589-597. Microsoft Excel, 2009, Microsoft, Redmond, Washington. Microsoft Windows, 2009, Microsoft, Redmond, Washington. Strand7, 2009, Sydney, Australia. Thompson, D’Arcy, On Growth and Form, 1917, Cambridge University Press, Cambridge, United Kingdom. Visual Basic .Net, 2009, Microsoft, Redmond, Washington. Wainwright, S., Biggs, W., Currey, J., and Gosline, J., Mechanical Design in Organisms, 1976, Princeton University Press, Princeton, New Jersey.