Embed Size (px)
Citation preview


Preface
Performance measurement in purchasing and supply management has become an important theme during the last decades. Key Performance Indicators (KPIs) have turned out to be useful in systematic efforts to improve the performance of suppliers from a buying company’s point of view. However, in parallel to this development the notion of considering the content and functions of buyer-‐supplier relationships have also advanced in recent years. Setting the focus on supplier relationships and on the interaction with suppliers directs the attention from the suppliers as independently performing their tasks into a focus on how the buyer and supplier can improve their performance jointly. In particular, there may be huge potentials in considering what the buying firm can do in order for the supplier to be able to improve its performance in the relationship.
In this book, authored by a group of six students in the master’s program in Supply Chain Management at Chalmers University of Technology, these issues are explored. By focusing on measurement of supplier relationship performance, buying firms may become inspired to extend their views on how to improve their operational performance. Considering the importance of relational factors such as trust, commitment and cooperation, new avenues to improvements in productivity and innovation may open up.
This book project would not have been possible without the support of SILF (The Swedish Purchasing and Logistics Association) or the companies who have been used as examples in the book. Last, but not least, the book project had not been possible without a group of hard working students. Thank you all!
Anna Dubois
Examiner
Gothenburg, December 2012

Acknowledgement This book is the result of the combined work of the students in the course Purchasing and Supply Management II, class of 2012, at Chalmers University of Technology. The book would however not have been possible without the help from a number of people. These are the author’s personal thanks to those who have contributed especially.
We would like to thank Anna Dubois, Professor in Industrial Marketing and Purchasing, and Nojan Najafi, Doctoral student, Technology Management and Economics, who have made this book possible. Both Anna and Nojan have guided us on the path to success and we are grateful for their tutoring and support. We would also like to thank the representatives from the interviewed companies, who took the time to contribute with an industry perspective. Their knowledge has truly provided insight, adding a great deal of value to the book.
Furthermore we especially thank Daniel Gustavsson, who helped us design the inspiring book cover.
Finally, we would like to thank the members of SILF and others in the audience for their attendance and reflections during the presentation of the book. The purchasing and supply management group of 2012,
Alexander Damlin Kría Súsanna Dietersdóttir
Daniel Fornander Jonatan Moen Brykt
David Sundquist Ekaterina Polyantseva
Gothenburg, December 2012


About the authors
Alexander Damlin Born in 1988 in the idyllic countryside close to Bengtsfors in Southwest Sweden. He holds a Bachelor of Science in Industrial Engineering and Management from Chalmers University of Technology and is currently pursuing a Master of Science in Supply Chain Management. He has previously worked with logistics planning in a large Swedish company and during the latest years of his academic career he has become interested in purchasing and strategic sourcing. Kría Súsanna Dietersdóttir Born in 1982 in Reykjavík, the capital of Iceland. She holds a Bachelor of Science in Industrial Engineering from University of Iceland and is currently pursuing a Master of Science in Supply Chain Management from Chalmers University of Technology. During the past half year she has been working in collaboration with Schenker Logistics at her master thesis on administrative processes. Daniel Fornander Born in 1987 in Stockholm, the capital of Sweden. He holds a Bachelor of Science in Industrial Engineering and Management from Luleå University of Technology and is currently pursuing a Master of Science in Supply Chain Management from Chalmers University of Technology. Through his academic career, he has had internships working in the field of logistics and purchasing. During the summer of 2012, Daniel worked as a purchasing analyst focusing on building pricing models in Excel and calculating long-‐term cost developments. Jonatan Moen Brykt Born in 1985 in Ängelholm, a city in the south of Sweden. He holds a Bachelor of Science in Industrial Engineering and Management from Chalmers University of Technology. In 2008 he moved to Spain, where he gathered three years of expertise in sales analysis and system support and development. He is currently, in 2012, finalizing his studies with a Master of Science in Supply Chain Management at Chalmers University of Technology as well as a Bachelor of Economics in Industrial and Financial Management at University of Gothenburg.

David Sundquist Born in 1989 in Varberg located on the Swedish west coast. Studies his last year at the master program Supply Chain Management at Chalmers University of Technology. He holds a Bachelor of Science in Mechanical Engineering from Chalmers University of Technology. He had a summer internship at a large company where he worked as a purchase planner mainly focused on the operational level of purchasing by being suppliers first contact person and enforcing compacts set by the purchasing department. Ekaterina Polyantseva Born in Khabarovsk in the Russian Far East. In 1993 moved with her family to Saint-‐Petersburg that is often called as a northern capital of Russia. She is a graduate of Saint-‐Petersburg State University of Economics and Finance. In June 2011 she achieved a Bachelor of Commerce. In June 2012 she graduated from the University with the Diploma of Logistics Specialist majoring in Service Logistics and Supply Chain Management. In July 2012 has completed an intensive course of TERP10 SAP ERP and was successfully certified. During the last one and a half year she is a student at the master program Supply Chain Management, at Chalmers University of Technology.

Table of content Introduction ............................................................................................................................................ 1
Company A .......................................................................................................................................... 3
Company B .......................................................................................................................................... 3
Company C .......................................................................................................................................... 4
Chapter 1 -‐ Why measure buyer-‐supplier relationship performance? ................................................... 5
1.1 Potential advantages in measuring relationship performance ..................................................... 5
1.1.1 Strategic level ......................................................................................................................... 5
1.1.2 Tactical level ........................................................................................................................... 6
1.1.3 Operational level .................................................................................................................... 7
1.2 Business environment trends ........................................................................................................ 8
1.2.1 Continued financial uncertainties .......................................................................................... 8
1.2.2 Globalization .......................................................................................................................... 9
1.2.3 Supplier base reduction ........................................................................................................ 10
1.2.4 Outsourcing .......................................................................................................................... 11
1.3 Different perspectives on performance evaluation .................................................................... 12
1.3.1 Supplier evaluation ............................................................................................................... 13
1.3.2 Buyer-‐supplier relationship evaluation ................................................................................ 15
1.3.3 Supply chain evaluation ....................................................................................................... 16
Summary ........................................................................................................................................... 17
Chapter 2 – The context of relationships .............................................................................................. 19
2.1 Buyer-‐supplier relationships ....................................................................................................... 19
2.2 Buyer-‐supplier dependency ........................................................................................................ 20
2.3 Strategic relationships ................................................................................................................. 22
2.4 Strategic Suppliers ....................................................................................................................... 25
2.4.1 Initial supplier qualification .................................................................................................. 26

2.4.2 Measurement standards ...................................................................................................... 27
2.4.3 Obtain relevant information ................................................................................................ 27
2.4.4 Make selection ..................................................................................................................... 28
2.5 Product importance .................................................................................................................... 29
2.5.1 Routine products .................................................................................................................. 29
2.5.2 Bottleneck products ............................................................................................................. 30
2.5.3 Leverage products ................................................................................................................ 30
2.5.4 Strategic products ................................................................................................................ 30
2.6 Risk in business relationships ...................................................................................................... 31
2.6.1 Risk management process .................................................................................................... 32
2.6.2 Supplier relationships and impact on risk assessment ......................................................... 33
Summary ........................................................................................................................................... 34
Chapter 3 -‐ Sourcing strategies ............................................................................................................. 37
3.1 Single sourcing ............................................................................................................................. 37
3.2 Multiple sourcing ......................................................................................................................... 39
3.3 Hybrid sourcing ........................................................................................................................... 40
3.3.1 Delegated sourcing (Network sourcing) ............................................................................... 40
3.3.2 Parallel sourcing ................................................................................................................... 41
3.4 Triadic sourcing ........................................................................................................................... 43
Summary ........................................................................................................................................... 44
Chapter 4 – Measurements of relationships ......................................................................................... 45
4.1 Traditional KPIs ............................................................................................................................ 45
4.1.1 Cost ....................................................................................................................................... 45
4.1.2 Lead-‐time ............................................................................................................................. 45
4.1.3 Quality .................................................................................................................................. 46
4.1.4 Flexibility .............................................................................................................................. 46
4.2 Buyer-‐supplier relationship performance KPIs ............................................................................ 47

4.2.1 Trust ..................................................................................................................................... 47
4.2.2 Power ................................................................................................................................... 49
4.2.3 Commitment ........................................................................................................................ 53
4.2.4 Transparency/ information sharing ...................................................................................... 54
4.2.5 Cooperation .......................................................................................................................... 55
4.2.6 Communication .................................................................................................................... 57
4.3 Correlations between KPIs .......................................................................................................... 59
Summary ........................................................................................................................................... 60
Chapter 5 – The relationship-‐improvement-‐cycle ................................................................................. 63
5.1 The relationship-‐improvement-‐cycle .......................................................................................... 63
5.1.1 Define ................................................................................................................................... 63
5.1.2 Measure ............................................................................................................................... 64
5.1.3 Analyse ................................................................................................................................. 64
5.1.4 Improve ................................................................................................................................ 64
5.1.5 Control .................................................................................................................................. 65
5.2 Measuring the performance ....................................................................................................... 66
5.3 Analysing the results ................................................................................................................... 67
5.4 The model applied to company C ................................................................................................ 68
Summary ........................................................................................................................................... 69
Chapter 6 – Applying the model on company A and company B .......................................................... 71
6.1 Company A .................................................................................................................................. 71
6.1.1 Trust ..................................................................................................................................... 71
6.1.2 Power ................................................................................................................................... 72
6.1.3 Communication .................................................................................................................... 72
6.1.4 Transparency/Information sharing ....................................................................................... 73
6.1.5 Commitment ........................................................................................................................ 73
6.1.6 Cooperation .......................................................................................................................... 73

6.2 Company B .................................................................................................................................. 74
6.2.1 Trust ..................................................................................................................................... 74
6.2.2 Power ................................................................................................................................... 75
6.2.3 Communication .................................................................................................................... 75
6.2.4 Transparency/information sharing ....................................................................................... 76
6.2.5 Commitment ........................................................................................................................ 76
6.2.6 Cooperation .......................................................................................................................... 76
6.3 Merging the results ..................................................................................................................... 77
Summary ........................................................................................................................................... 81
Chapter 7 – Concluding discussion ........................................................................................................ 83
List of references ................................................................................................................................... 85

1
Introduction The introduction gives a background to the topic of the book. It presents how the book is structured and how the chapters are combined and interrelated. The introduction aims at catching the reader’s interest for the subject through a brief collection of findings.
The traditional perception of how to measure the performance of a business relationship is to focus on the outcome of one or the other party, with little consideration of ones own influence. This is a one-‐sided evaluation of the counterparts’ activities, which is fairly simplistic, but also easy to use and to interpret. A relationship between two companies is however not much different from any other relationship between friends, in a couple or between a student and its teacher. In those kinds of relationships it is easier to understand that the relationship depends on both parties. This book argues that the same goes for business relationships and that both parties have the ability to influence the relationship performance. Some different perspectives of evaluation is presented chapter 1.
Traditional ways of measuring performance most often comes down to four key performance indicators (KPI) – cost, quality, lead-‐time and flexibility. The academic world is flooded with literature and case studies treating these KPIs, how to define them and how to measure them. This book however, contributes with a different perspective of how to assess the relationship from a dual perspective to affect the outcome. An extended literature search resulted in six relationship-‐influencing KPIs – trust, power, transparency/information sharing, communication, commitment and cooperation. Obviously neither of these KPIs are direct measurements of outcome, but they all affect the outcome in one way or another, as is illustrated in Figure 1. These KPIs are elaborated further in chapter 4 as separate topics and in relation to each other.
!
!
!"#$%
!"#$%
!"#$%&#"'$()
!"##$%&'()&"%
!"##$%#&'%
!""#$%&'(")
!"#$%&'()*&+
!"#$
!"#$%&'
!"#$!!"#$
!"#$%&%"%'(
!"#$%&'()*&+,-./) !"#$%&'()*+,
Figure 1: Correlation between the relationship KPIs and the traditional ones

2
To understand the environment of different relationships the book presents the context of relationships in chapter 2. This chapter in particular singles out characteristics of strategic relationships, which is the focal area of investigation throughout the book. Strategic relationships were chosen because in such constellation both parties probably consider the relationship to be worthy of consideration. Closely related to the context of relationships are sourcing strategies, which are elaborated in chapter 3. Sourcing strategies are presented according to a portfolio matrix, where single-‐, hybrid-‐ and multiple sourcing are central concepts.
In order to work with qualitative relationship KPIs, a model for evaluating them is presented in chapter 5. This model was named the relationship-‐improvement-‐cycle by the authors, and is based on the DMAIC-‐cycle, which is used in Six Sigma. The five steps in the cycle are: define, measure, analyse, improve and control, as illustrated in Figure 2. For the measuring and analysing events a tool was developed to rank the KPIs based on the perception of the actors involved in a particular relationship. This tool takes into account the perceived actual state of the relationship, the desired state and it furthermore includes the perceived importance of measuring the different KPIs. The aim is to find focal areas to target and discuss mutually within the relationship.
The book frequently uses input from empirical data gathered through a number of interviews. This gives a business perspective to the defined relationship KPIs and tests the validity of the relationship-‐improvement-‐cycle. Chapter 6 focuses on measuring and analysing data assessed from both the buyer’s and the supplier’s perspective of their specific relationship. This dual perspective enlightens differences and similarities in how the relationship is perceived and what would be desired for the different parties. Trust is for example considered of vital
!"#$"%&$'%()&*"+,&$-%./"%012(%
3"&(4,"%./"%012(%
5$&*67"%./"%,"*&89$(/:;%
2<;,9="%./"%,"*&89$(/:;%
>9$.,9*%&$'%(4(.&:$%./"%,"(4*.(%
Figure 2: The relationship-‐improvement-‐cycle

3
importance as it relates to the other KPIs in many ways. Trust is though believed to develop over time as other KPIs improve, e.g. commitment and collaboration. To be transparent and share information, on the other hand, often comes as an effect of having a high level of trust, something that further emphasizes the interconnection between the KPIs. Communication is stressed as the first order of business to target mutually, as it is believed that rather simple structuring of communication frames could yield notable results. The case companies who have contributed with information through interviews are presented next. These companies have all chosen to remain anonymous. The interesting aspect of these companies is that company B is a supplier to company A, which have enabled the assessment of that specific relationship to be performed from both the buyer and the supplier perspective (Figure 3). The departments interviewed at the different companies thereby are different. Here follows a short description of the different case companies:
Company A Company A is a large retailer within the Do-‐It-‐Yourself-‐segment (DIY). The employees interviewed were a part of the strategic purchasing unit. The company operates in northern Europe but has suppliers located all over the world. The company is stock-‐listed on the OMX mid cap-‐list and has a strong focus on providing customers with lowest price. Company B is considered an important supplier to company A.
Company B Company B is a part of a large conglomerate with branches in several industries. The company is considered a large supplier of raw-‐material. The employees interviewed were a part of the sales department at the company. Company B is not stock-‐listed and can enjoy a complete long-‐term focus without quarterly reports. Company A is considered an important customer of company B’s products.
!"##$%&'()*+,#-./)0)
0"/&'()*+,#-./)1)
Figure 3: Company B is the supplier of company A
4
Company C Company C is an industry leader in the automotive industry. They operate globally with sales all over the world. The four core values: Environment, Design, Safety and Quality reflects their product portfolio and production philosophy. The company is listed on the OMX large cap-‐list and source approximately 120 000 articles for its aftersales market alone. The company mainly utilizes single sourcing and some hybrid solutions for specific articles. The persons interviewed at company C were all a part of the purchase-‐planning department.
5
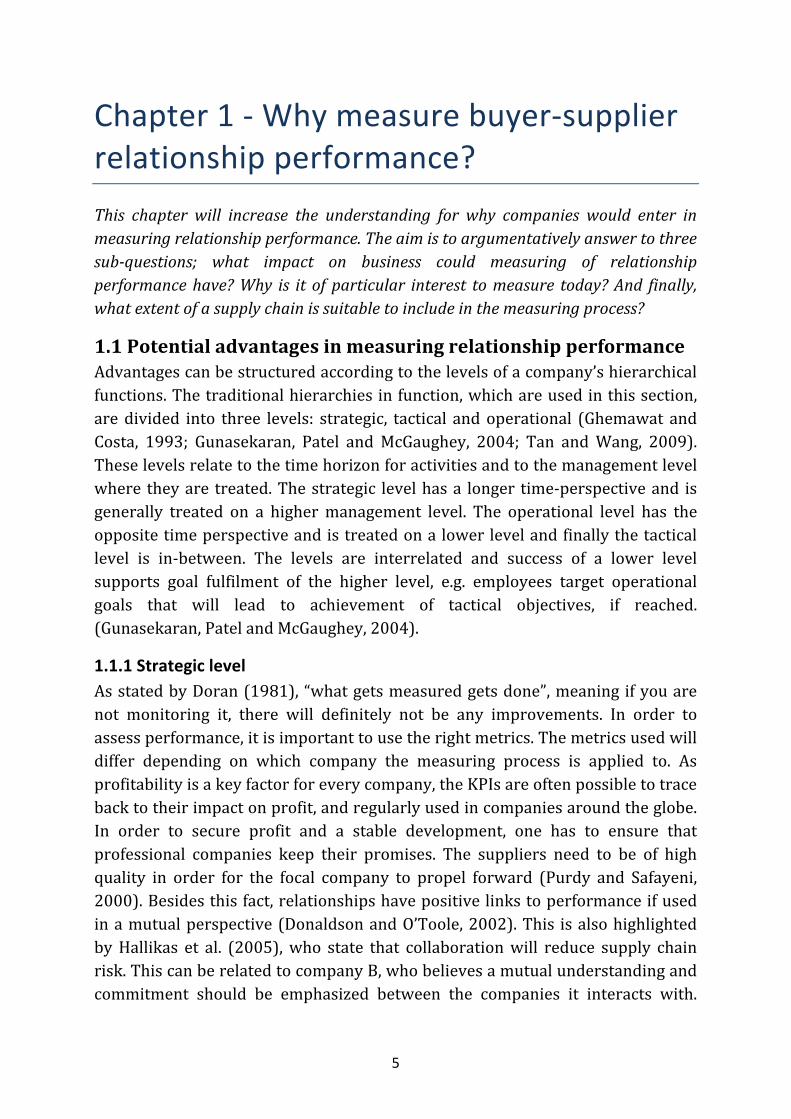
Chapter 1 -‐ Why measure buyer-‐supplier relationship performance? This chapter will increase the understanding for why companies would enter in measuring relationship performance. The aim is to argumentatively answer to three sub-‐questions; what impact on business could measuring of relationship performance have? Why is it of particular interest to measure today? And finally, what extent of a supply chain is suitable to include in the measuring process?
1.1 Potential advantages in measuring relationship performance Advantages can be structured according to the levels of a company’s hierarchical functions. The traditional hierarchies in function, which are used in this section, are divided into three levels: strategic, tactical and operational (Ghemawat and Costa, 1993; Gunasekaran, Patel and McGaughey, 2004; Tan and Wang, 2009). These levels relate to the time horizon for activities and to the management level where they are treated. The strategic level has a longer time-‐perspective and is generally treated on a higher management level. The operational level has the opposite time perspective and is treated on a lower level and finally the tactical level is in-‐between. The levels are interrelated and success of a lower level supports goal fulfilment of the higher level, e.g. employees target operational goals that will lead to achievement of tactical objectives, if reached. (Gunasekaran, Patel and McGaughey, 2004).
1.1.1 Strategic level As stated by Doran (1981), “what gets measured gets done”, meaning if you are not monitoring it, there will definitely not be any improvements. In order to assess performance, it is important to use the right metrics. The metrics used will differ depending on which company the measuring process is applied to. As profitability is a key factor for every company, the KPIs are often possible to trace back to their impact on profit, and regularly used in companies around the globe. In order to secure profit and a stable development, one has to ensure that professional companies keep their promises. The suppliers need to be of high quality in order for the focal company to propel forward (Purdy and Safayeni, 2000). Besides this fact, relationships have positive links to performance if used in a mutual perspective (Donaldson and O’Toole, 2002). This is also highlighted by Hallikas et al. (2005), who state that collaboration will reduce supply chain risk. This can be related to company B, who believes a mutual understanding and commitment should be emphasized between the companies it interacts with.

6
Having a mutual understanding of long-‐term goals and objectives will help reduce the uncertainty of being misaligned and minimizes the probability of working in the wrong direction. This can be linked to the trust-‐aspect, which company A highlighted as the most important factor. Trust is built up gradually over time, not over a short period, further emphasizing long-‐term thinking. Globerson (1985) argues that many of today’s performance measurement systems lack long-‐term focus and instead encourage short-‐term attention. Noted in the relationship between company A and company B was that they believe a long-‐term focus is vital and perhaps most important. If one party does not focus on long-‐term relationship development, it is desired to change partner. Long-‐term commitment must be present in order to align the companies towards the same direction.
Through monitoring the relationship development, one will have a better understanding of how interaction between the companies works. Furthermore, by having thoroughly established trust within the chain, the companies interacting will experience commitment to a larger extent and a higher degree of transparency and information sharing. A highly transparent relationship will only be possible through continuous communication, which is emphasized by both company A and company B.
Having relationships working effectively will help secure a steady flow of products keeping the desired quality with a minimum level of defects. Achieving a high level of product reliability will in turn lead to increased customer satisfaction. Moreover, it might reduce costs incurred by the company, since a decrease of warranty claims could be expected as a result of high-‐quality products (Neely, Gregory and Platts, 2005).
1.1.2 Tactical level The tactical level considers, in particular, resource allocation and measuring performance to achieve expected results (Gunasekaran, Patel and McGaughey, 2004). On the tactical level, advantages can be identified in terms of e.g. efficiency and flexibility. Although some aspects of the tactical level overlap with both the strategic and the operational level, they can also be singled out and analysed in terms of advantages.
Flexibility represents such an overlap as it is considered on all three levels. Flexibility becomes increasingly important in order to cope with a volatile customer demand. It relates to the ability to satisfy customers’ varying volume-‐ and lead-‐time demands. According to company B it would be beneficial to improve the relationship in terms of communication and information sharing to better cope with company A’s variation in demand. Failure to communicate forecasts can easily result in overproduction or stock-‐outs for the supplier

7
(company B). It could therefore be argued that flexibility could be improved through a tighter and more open relationship.
Efficiency is a measure of performing in the right way, often related to effectiveness, which is an indication of doing the right things. Both parameters are highly applicable in a relationship situation. If they fail or succeed to function they will either affect the business outcome negatively or positively. Supplier effectiveness implies to what extent customer requirements are fulfilled whereas efficiency refers to the financial impact of using a firm’s resources in providing a certain customer satisfaction. This illustrates the interrelationship between satisfying the customer through a high level of efficiency and still performing well financially through effective resource usage. An example of a mutual high level of efficiency and effectiveness is given by Neely, Gregory and Platts (2005). They argue that high quality products can lead to increased customer satisfaction as well as reduction in defected products and warranty claims, which in turn has a positive impact on the financial result. If the relationship somehow could be impacted and the level of efficiency and effectiveness improved one could expect higher customer satisfaction and profit.
1.1.3 Operational level The flexibility within the operational segment is associated with having a shorter focus. It is often defined as “built in procedures which permit a high degree of variation in sequencing and scheduling (Ghemawat and Costa, 1993). Not everything can be standardized, as business relationships are dynamic. This is very similar to the context in which a company operates in general, which always changes. It highlights the importance of being “on your toes” and to always stay flexible. In order to stay adaptable towards both customers and suppliers, it is essential to measure the relationship performance to grasp how the interactions are developing. By not having flexible companies to rely on, the extent of being competitive will be very limited.
The operational level deals with the day-‐to-‐day activities performed in a company. It is what keeps the business running within the limitations set by the higher hierarchical levels. The time horizon is short and the focus is on complying with schedules, ability to produce defect free products and technical representation. Companies are increasingly seeing the advantages in a well function relationship on the operational level, as this reduces uncertainty and enhances control. Through operational collaboration tactical and strategic goals are fulfilled, therefore it is just as important level of measuring. Operational level could especially increase the performance of relationships through reducing total

8
cost of operation, reduced inventories and increased information sharing (Gunasekaran, Patel and McGaughey, 2004).
1.2 Business environment trends Today’s business climate is characterized differently than 20 years ago. One of the biggest shifts is that businesses no longer compete as single entities, but rather as a network of companies. Managing supply chains effectively is complex and challenging, due to the current business trends of short product life cycles, increasing outsourcing, expanding product variety, globalization of businesses and the continuous advancement in information technology (Lee, 2002). Therefore, it is important for companies to measure the performance within the company, as well as between the companies interacting (Cai et al., 2008).
Besides trends within the field of supply chain management and thoughts about this particular area, there are trends affecting companies around the globe on a more generic level. According to Christopher (2011), there are three megatrends affecting the overall global setting: continued financial uncertainties, global supply/demand imbalances and the impact of “Peak Oil” on energy costs. These trends have led to e.g. increased complexity of the supply chain, increased focus on interdependencies and tighter relationships amongst suppliers and buyers and thus the buyer-‐supplier relationship as well as relationship performance measurements have become increasingly important for companies. The trends described in the preceding sub-‐chapters is a collection of four of many trends, which have been dominant during past years and show examples of how the supply chain has evolved. Thus they offer a background to why the importance of buyer-‐supplier relationships has increased.
1.2.1 Continued financial uncertainties Access to capital becomes more difficult and more expensive. Since the recession in 2009, banks have been unwilling to lend money in the same extent as before. This in turn forces companies to innovate new solutions in order to make the supply chain “asset-‐light”. Relating to company B, they argue that it is important to understand each other’s financial situation and work for the good of both parties. Investments should only be done if the gains are higher than the costs, and that both parties are dedicated and have the resources for doing it. When having a measure on the relationship, it will be easier to grasp how viable the initiative will be. A close collaboration is likely to increase the possibility of taking more risks, as argued by both company A and company B. It is increasingly important to truly benefit the most from every single relationship to stay competitive.

9
The post-‐2000 management practice has entered the “internetwork” competition-‐era (Lambert and Cooper, 2001). The Internet has provided companies with the possibility to connect in real time with continuous and easy accessible information and knowledge sharing (Lee, 2002). Although information sharing is vital, it must encompass both strategic and technical information in order to make joint efforts in having transparency. This in turn will help facilitate a profound decision-‐making structure and joint planning (Graham et al. 1994). Getting the right product to the customer at the right time with the right price is key to competitive success and ultimately, survival. The initiatives always strive to match supply with demand, improve customer satisfaction and reduce costs simultaneously (Christopher and Towill, 2001). To stretch this further, it is emphasized to assess the right buyers and suppliers in order to propel the supply chain and its performance to the absolute maximum. Improving the supply chain performance has thus become one critical issue for gaining a competitive advantage in today’s business climate (Cai et al., 2008).
1.2.2 Globalization Globalization is a trend that has grown substantially during the past decades and has changed the supply chains considerably. Rushton and Walker (2007) define globalization as the exchange of services, goods, cultures, and politics between different countries and continents of the world. They further argue that it is a result of opportunities, which have been created by modern information systems and transportation. As stated by Johnson (2006) manufacturers, products, designers and markets which were previously accommodated within a single facility are now spread over a number of continents in companies with different business strategies, cultures and languages and thus in many cases the supply chains are literally decomposing. According to van Weele (2010) companies have to a larger extent adopted a global scope towards sourcing issues in order to create a competitive advantage. Furthermore, organizations all around the world are noticing the shift in the global balance and thus are changing their business strategies in order to take advantage of the emerging markets. (ibid.)
There are general supply/demand imbalances between different regions around the globe. If, and when the economic growth accelerates, the gap between supply and demand will increase. Understanding the relationships you have, and nurturing them, becomes essential when dealing with these products. When measuring the existing relationships, it will provide a clear picture of which suppliers it is possible to rely on, and which ones do not dedicate themselves to the relationship. By gaining this knowledge, it will be more transparent which ones to change, and which ones to develop. Facing an increased globalization

10
imply complexity in dealing with different cultures, languages and business models.
The increased globalization of supply chains can influence the time it takes to complete all needed steps in a process, thus the visibility of the network can decrease. Therefore, in many cases not all members of the chain have detailed knowledge of what is taking place in other parts of the supply chain, e.g. material inventory, actual demand capacity (Christopher, 2004). Therefore it is apparent that in order to minimize the supply risks, e.g. disruptions and loss of control, it is imperative that a company monitors the performance of the parties involved. Furthermore, since more actors are involved which are situated in different countries/ continents, the supply chain complexity also increases significantly which can result in e.g. longer lead-‐times, unreliable transport times and increased handling costs. (van Weele, 2010) Differences in norms, political views and cultures also increase the overall complexity of the chain making it harder for companies to access new markets. Due to the various affects that globalization can have on the overall the supply chain the buyer-‐supplier relationship has become increasingly important and consequently relationship performance measurements.
1.2.3 Supplier base reduction Supplier base reduction (SBR) is one of the trends that have been dominant during the past decade. The main idea of the concept is that a company only has a limited amount of resources and by reducing the number of suppliers the company can focus on those resources (Cousins et al., 2008). However, Monczka et al. (2010) argue that the main reason to why a company reduces its supplier base is to maintain and develop relationships with the suppliers that are considered most valuable to the company. As stated by Gadde, Håkansson and Persson (2010) in most cases firms’ performance on the supply side is determined on how companies work and coordinate with their suppliers and therefore the supplier base is one of the most valuable assets of a company. The trend has affected the individual buyer-‐supplier relationship to a large extent. This is discussed by Stamatis (2012) which state that one of the major results of SBR from the buyers’ perspective is volume consolidation i.e. a larger portion of supplies are bought from a single supplier. According to Cai, Yang and Hu (2010) this has normally led to increased importance of inter-‐firm coordination and integration with the supplier and thus the dependency between the two parties has increased. Stamatis (2012) agrees with this and states that SBR has changed the buyer-‐supplier relationship towards a high-‐dependency focus. Stamatis (2012) argues that this has increased the supply chain risk
11
considerably since buyers are dependent on fewer suppliers. However, Monczka et al. (2010) argue that the supply risk can be reduced since these suppliers are carefully selected and close relationships are developed with them. According to Stamatis (2012) there are mainly three factors that have to be achieved for a successful SBR, these are:
• A focus on long-‐term relationship development • Realignment of internal systems and approaches • The suppliers’ performance evaluation system should be adjusted towards
a dual relationship perspective.
As there is a need for short supply chains with efficient product flows, there is a need to develop the relationships within the chain. If the focal company is aiming at delivering products to the end-‐user within a certain time frame, it is suggested to communicate this to the relevant partners. For this initiative to work, the focal company needs to know how its relationships with other companies functions. This is relevant in order to know how to approach the affected companies and how much they can stretch the initiative, something that could be considered easier with a reduced supplier base. As highlighted by company A, who states that a committed supplier and a well-‐working relationship are prerequisites to get the best output.
1.2.4 Outsourcing A widespread trend, which has been prevailing over many years, is the tendency to outsource activities that formerly were handled within the company (Stamatis, 2012). As stated by van Weele (2010) the growth of the market for outsourcing has amplified during the past years and the reason for this development is that organizations see outsourcing as a way to achieve effectiveness and efficiency improvements (e.g. increase customer satisfaction, reduce costs, reach strategic goals, shared risks). Christopher (2011) further argues that the reason for this growth is that organizations are believed to be more likely to succeed if they focus on superior offerings that distinguish them from their competitors. Thus, it has been viewed as a mandatory business strategy for organizations to strive for in today’s competitive environment (van Weele, 2010). According to Christopher (2011) not a single part of the value chain has been immune to the trend, firms are outsourcing a variety of activities such as; manufacturing, accounting, distribution, and in some occasions these companies can be viewed as virtual organizations.

12
According to Christopher (2011) this has increased the complexity of the supply chain network considerably. This is mainly since the number of both links and nodes in the network has increased. Christopher (2011) further argues that this has led to a higher supply risk that in turn increases the risk of supply disruption. Stamatis (2012) agrees with this and states that supply disruption is most often related to a failure of one of the nodes and links in the supply chain. Due to this the importance of the buyer-‐suppler relationship has increased. According to Mosher and Mainquist (2011) it is crucial that both parties focus on preserving a strong communication channel and understand each other’s dependencies and expectations.
1.3 Different perspectives on performance evaluation Any relationship can appear differently depending on by whom and from what perspective it is being observed. In a buyer-‐supplier relationship, three perspectives can be distinguished – the buyer’s perspective, the supplier’s perspective and the mutual perspective, represented by a perspective of an external observer. A relationship considered from just one perspective might not be sufficient to fully grasp the context of a relationship, therefore the mutual perspective is embraced in this book, as the title implies. For example the buyer’s perspective of a supplier relationship could turn out quite similar to an evaluation of supplier performance rather than an evaluation of the relationship performance.
Hald and Ellegaard (2010) make a similar point when they address the development of performance measurement systems and divide it into three categories of research – supplier evaluation, buyer-‐supplier relationship evaluation and supply chain evaluation. These categories are illustrated in Figure 1.1 and explored next.
!"##$%&'()*+&,-)$")./+&
!"##$*,0&0,$)./+1(*#&,-)$")./+&
!" #"!$%%&'()"(*+&$+,-."
Figure 1.1: The three different levels of performance measurements

13
1.3.1 Supplier evaluation The supplier evaluation is defined as the process of quantifying the efficiency and the effectiveness of supplier actions. From the buyer’s perspective supplier evaluation can be seen as a tool to influence their supplier-‐base to align with the buying company’s interests. This means that the suppliers are expected to improve their capabilities and performance to better benefit the buyer (Hald and Ellegaard, 2010).
Hald and Ellegaard (2010) present a three-‐step model for establishing and executing supplier evaluation.
1. Design the evaluation system by defining key performance indicators and how they are measured.
2. Implement the evaluation system to collect and process data. 3. Review and act upon the collected data.
According to Prudy and Safayeni (2000) two domains of information could be evaluated, either processes or products. Information about these domains could furthermore be collected, indirectly or directly. Indirect information is gathered in retrospect, most often upon request from the buyer. This includes for example asking the supplier for information regarding business aspects, policies or practices, such as safety procedures and quality practices. It can also refer to acquiring information about the supplier’s output, by requesting statistical process control data or inventory levels. In either case, the indirect information is given to the customer by the supplier. Table 1.1 summarizes key features of process-‐ and product evaluation gathered directly or indirectly.
Information Acquisition
Mode
Information Domain Process Product
Indirect
Supplier provides customer with information about manufacturing and / or management processes.
Supplier provides customer with performance information (e.g., cost, quality, delivery)
Direct Customer goes to supplier and examines manufacturing and management processes.
Customer tests outputs or collects its own performance
Direct information is based on buyer observations of their suppliers’ products or processes. Such information is gathered by visiting suppliers and observing their inventories, work-‐in-‐progress or manufacturing processes. Direct information
Table 1.1: Supplier evaluation strategies (Adapted from Prudy and Safayeni, 2000:437)
14
can also be gathered through evaluating suppliers’ output, e.g. quality and delivery lead-‐time fulfilments.
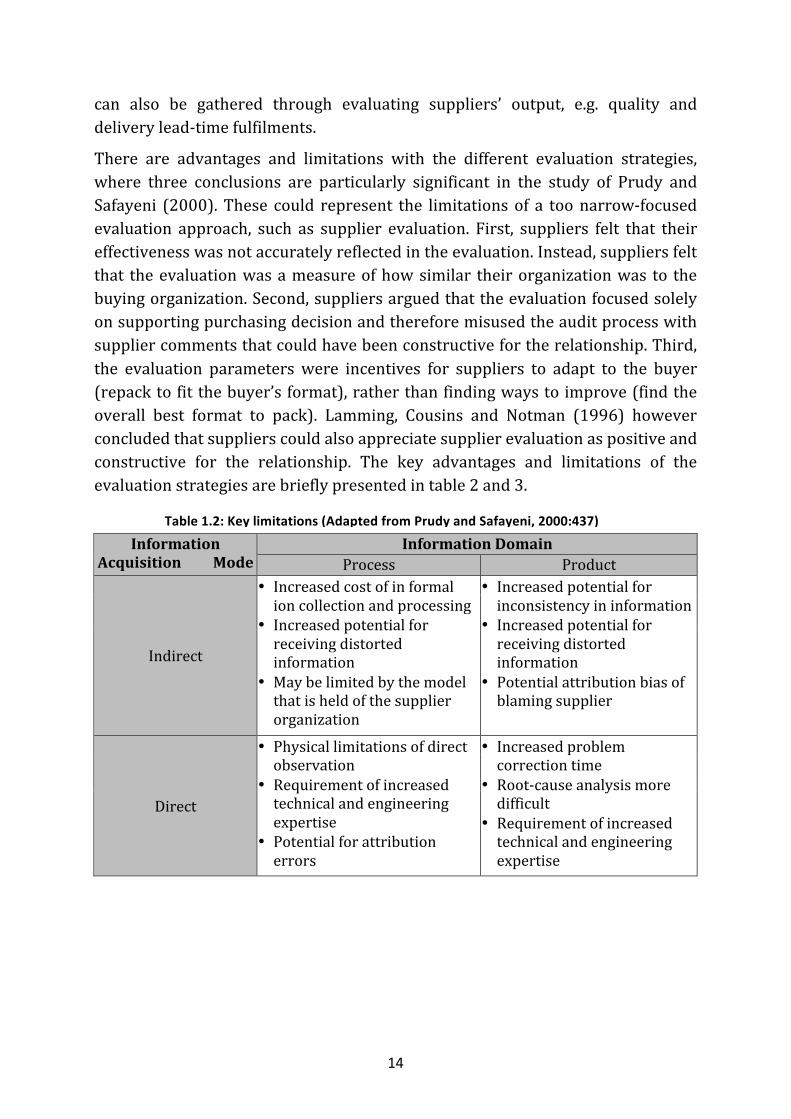
There are advantages and limitations with the different evaluation strategies, where three conclusions are particularly significant in the study of Prudy and Safayeni (2000). These could represent the limitations of a too narrow-‐focused evaluation approach, such as supplier evaluation. First, suppliers felt that their effectiveness was not accurately reflected in the evaluation. Instead, suppliers felt that the evaluation was a measure of how similar their organization was to the buying organization. Second, suppliers argued that the evaluation focused solely on supporting purchasing decision and therefore misused the audit process with supplier comments that could have been constructive for the relationship. Third, the evaluation parameters were incentives for suppliers to adapt to the buyer (repack to fit the buyer’s format), rather than finding ways to improve (find the overall best format to pack). Lamming, Cousins and Notman (1996) however concluded that suppliers could also appreciate supplier evaluation as positive and constructive for the relationship. The key advantages and limitations of the evaluation strategies are briefly presented in table 2 and 3.
Information Acquisition Mode
Information Domain Process Product
Indirect
• Increased cost of in formal ion collection and processing
• Increased potential for receiving distorted information
• May be limited by the model that is held of the supplier organization
• Increased potential for inconsistency in information
• Increased potential for receiving distorted information
• Potential attribution bias of blaming supplier
Direct
• Physical limitations of direct observation
• Requirement of increased technical and engineering expertise
• Potential for attribution errors
• Increased problem correction time
• Root-‐cause analysis more difficult
• Requirement of increased technical and engineering expertise
Table 1.2: Key limitations (Adapted from Prudy and Safayeni, 2000:437)

15
Information Acquisition
Mode
Information Domain Process Product
Indirect
• Extensive documentation of processes provided to customer
• Good fit for large bureaucratic customer
• Mechanism for supplier pool reduction
• Summarized product information provided to customer
• Minimized expense for product testing
• Ability lo rely on supplier reputation
Direct
• First-‐hand observation of process
• Holistic view of supplier organization
• Opportunity for active supplier development
• First-‐hand knowledge of • Testing procedures • Increased organizational learning for customer
• Additional level of product quality control
In a liberal manner the study of Hald and Ellegaard (2010) concludes that the outcome of evaluating suppliers cannot simply be engineered by optimizing evaluation systems, performance measures and data collection.
1.3.2 Buyer-‐supplier relationship evaluation Lamming, Cousins and Notman (1996) argue for widening the scope of performance measurement from internally focused to also include the counterpart of the relationship. Through this mutual approach to the buyer-‐supplier relationship the actors can better allocate resources to relationships and act appropriately towards their counterpart.
Lamming, Cousins and Notman (1996) question traditional simplistic evaluation models to be based on the perspective of either a supplier or a customer, as is the case for supplier evaluation. For example buyers, although thinking they implement supplier development processes for mutual benefits, probably still lack involvement of suppliers in the design and development of those processes, which is in line with Prudy and Safayenie’s (2000) argumentation in the previous section. To overcome this, Lamming, Cousins and Notman (1996) present a relationship assessment program as a system to diagnose the health of relationships through a combined or integrated perspective. This relationship assessment takes into account the perceived needs for both parties in its perfection of value adding and waste reduction. The assessment-‐model considers internal and external factors that impact a relationship and also takes into account enablers and influencers of the two parties. This provides a useful tool to
Table 1.3: Key advantages (Adapted from Prudy and Safayeni, 2000:438)

16
better understand what is going on between the buyer and the supplier in terms of perceived, desired and actual status of a relationship. This is quite similar to the approach and perspective considered in this book.
The more extensive the evaluation becomes, the more it requires from the involved companies. It requires willingness and incentives for both to improve the relationship. This is achieved by understanding long-‐term and short-‐term gains of improvements for both companies. Furthermore, it requires dedication to the evaluation and actions and an acceptance for a continuous process of evaluating and improving. On an operational basis it requires periodic re-‐evaluation of assessment procedures, regular feedback of supplier and customer performance and a close collaboration between the buyer and the supplier. Customers could however consider that data sharing of performance is unwise and unnecessary (Lamming, Cousins and Notman, 1996), something that will have to be overbridged to get the best evaluating outcome. Therefore the relationship approach is better suited for already existing, deeper and closer relationships, where both parties consider the relationship worthy of consideration.
1.3.3 Supply chain evaluation Selecting appropriate performance measures for supply chains is especially important, as there is no single optimal performance indicator that is inclusive, universal, measurable and consistent to represent the overall supply chain performance. If the variety of relationship constellations requires different measures the supply chain approach will rather look like a collection of separate relationship evaluations. As highlighted by Shepherd and Günter (2006), to measure a supply chain performance output, one has to go further than just measure internal processes, and instead assess performance measures from in between companies, namely relationships. It could be argued that if relationships are considered separately they could be improved in their different environment. Furthermore, it could be argued that such separation of relationships would in that case sub-‐optimise the supply chain with less consideration to relationship interactions.
Beamon (1999) supports the full supply chain evaluation but at the same time recognizes the challenge in measuring effectively as the scope is larger and more complex. Perhaps the most notable difficulty with the supply chain approach is the complexity in defining common boundaries for the supply chain, as all actors consider the supply chain from their perspective as a focal company. Traditionally two models of measuring supply chain performance are used, the cost approach and the combination of cost and customer responsiveness. Cost
17
includes all costs related to the processes, e.g. inventory cost and operating cost. Customer responsiveness instead refers to for example lead-‐time and stock-‐out. Many supply chains limit themselves to only measure cost. This might limit the inclusiveness as it takes little consideration to the output, namely customer responsiveness. In a framework for evaluating supply chain performance Beamon (1999) suggests a usage of at least one performance indicator from the areas resources, output and flexibility. It is important to still keep in mind that the complexity of selecting appropriate performance indicators increases with the number of actors included in the evaluation.
The evaluation approach depends on the context. Many times it is neither possible nor interesting to just single out one particular relationship without considering the impact of other relationships as well. In the relationship studied between company A and company B, it is understood that the particular relationship is only impacted to a small extent by other relationships. In such a situation the buyer-‐supplier relationship evaluation is probably preferable.
Summary The reason to why one should measure relationship performance is simple, what gets measured gets done (Doran, 1981). To measure performance is thus a pre-‐requisite if a relationship is to be improved. This chapter has argued for potential advantages on three hierarchical levels. On a strategic level measuring performance will help to reach long-‐term goals and to profit over time. On a tactical level it will support resource allocation that increases efficiency and flexibility. Finally on the operational level measuring performance will target the day-‐to-‐day operations to reduce uncertainties and enhance control.
It has also been argued that there are a number of trends making the measuring aspect increasingly important. Supplier base reduction, outsourcing, globalization and global financial uncertainties are current trends all implying that companies must assess their relationships and yield the best result out of each relationship to stay competitive.
Finally three different perspectives of evaluation are presented, much related to the number of actors included in the evaluation task. The traditional approach is the simple supplier evaluation conducted by the buying firm to measure a supplier’s performance. The approach embraced in this book is where the buyer and the supplier mutually evaluate and improve the relationship. There is also a third perspective taking the whole supply chain into account in the evaluation process. This extended perspective could grasp the whole picture in a better way, but it is also more complex to conduct and it is furthermore difficult to define common boundaries of the supply chain to evaluate.

18

19
Chapter 2 – The context of relationships This chapter will describe the historical view on business relationships and provide a new view on the modern perception and how to handle them. Furthermore, it will recommend tools for how to evaluate a company’s supplier base, as well as how to take actions based on the result of this evaluation. Strategic relationships will also be described and discussed with parallels to the authors’ own empirical findings.
2.1 Buyer-‐supplier relationships “It must be remembered that all firms are ‘snakes’; they are maximizers and satisfiers concerned with their own survival and self-‐interest. If that self-‐interest is best served by working closely with another firm then they will do so. However, when that interest is no longer served, rest assured, they will bite you!” (Cousins, 2002:82)
As highlighted in the quote above, some would argue that companies are acting opportunistically; trying to maximize their own profits without consideration to the partner they are dealing with. However, during the last decades buyer-‐supplier relationships have undergone substantial changes and have become more complex. Each party wants to minimize its costs while achieving higher profits. Because of this fact, competing priorities may also strain the relationship. To achieve success and prosperity, it is necessary to have a mutual commitment in terms of goals and objectives. Currently, the policy of mutually beneficial relations is becoming more popular. Some companies have come to the understanding that the success of one can contribute to the success of the other (Ireton, 2007).
Over the past decade, large manufacturing companies have paid particular attention to developing their relationships with suppliers. Many of them have made efforts to establish partnerships, working closer together (van Weele, 2010). Ellram and Hendrick (1993) defined a “partner” as “a firm with whom your company has an on-‐going buyer-‐seller relationship, involving commitment over an extended period of time, a mutual sharing of information and a sharing of risks and rewards resulting from the relationships”. There has been a trend away from short-‐term contracting with numerous suppliers moving towards greater commitment with few suppliers focusing on a longer perspective. Several companies, such as Xerox, Procter & Gamble, Rover, ICL and Laing Homes, were among the first companies moving towards a bigger focus on cooperation in the buyer-‐supplier relationship (Mudambi and Schründer, 1996).

20
Philips Electronics was one of the first companies in Europe with a focus on partnership and had their own structure for the process of developing and managing supplier relationships. Firstly, the company grouped all their suppliers into three distinctive categories (van Weele, 2010);
• Commercial suppliers – Delivering goods and services according to agreed terms
• Preferred suppliers – With whom the company develops mutual objectives and improvements
• Supplier partners – Actively involved in the development of new technology, products and business opportunities
Philips was the first company that introduced the term “co-‐makership”. The main idea was to build long-‐term relationships, with a limited number of suppliers, based on mutual trust (van Weele, 2010).
There are examples of companies aiming for partnership collaboration, but the result was only conflicts, resentment and disappointment (Cousins, 2002). The main obstacle to successful cooperation was the fact that in many companies the functional structure interfered with effective internal collaboration and therefore was a barrier to achieve a close and effective relationship with the supplier. At the same time it is impossible to say that all companies seek to have partnerships with their suppliers. Selection of the desired type of relationship often depends on the needs and desires of the companies interacting.
2.2 Buyer-‐supplier dependency In 1990, Carlisle and Parker presented a model called the “Red/Blue game”, also known as “The prisoners’ dilemma” (Figure 2.1). The authors argued that economic success is a matter of who is dependent on whom, which one is the influencer and how the two parties can reach solutions on different problems. The main principle of this “game” is that teams will collaborate if they believe that the payoff will be higher than the costs of doing so (Cousins, 2002).

21
Cousins et al. (2008) presented four distinct categories of dependencies that can arise in byer-‐supplier relationships: Historic, Economic, Technological and Political (Table 2.1).
Dependency Description
Historic
• Presence of previous interactions with each other • Creation of a level of knowledge and shared experience (both positive
and negative) • Existence of the information base about what the parties can expect
in the future from the relationship
Economic
• ‘Switching costs’ incurred of moving the supply relationship from one supplier to another
• Easy to quantify these costs (e.g. tooling costs, investment in labor, training, patents, and investment in plant, machinery, and so on)
• The buyer-‐supplier dependency on each other for the delivery of the product or service by investing in these types of costs
• The higher the level of investment the more difficult it becomes to switch from one supply source to another
Technological (product and/or process)
• Dependency centered on technological competencies and capabilities (product based or process based)
• It is very powerful • Dependencies can be created on other aspects of business and are not
confined to purely economic size • Represent a significant supply chain risk if it is not managed carefully
Political
• Dependency highly influential, but often ignored by practitioners • A large influence can be over which suppliers are selectedand
deselected and how the relationship is managed • Government policy in some industries (particularly military and
aerospace applications) can have a significant impact on which suppliers are chosen for particular contracts.
• Internal politics can drive supplier selection and management
Figure 2.1: A dependency and certainty conceptual model of inter-‐firm relationships (Adapted from Cousins, 2002:78)
Table 2.1: Types of buyer-‐supplier dependencies (Adapted from Cousins et al., 2008:180)
22
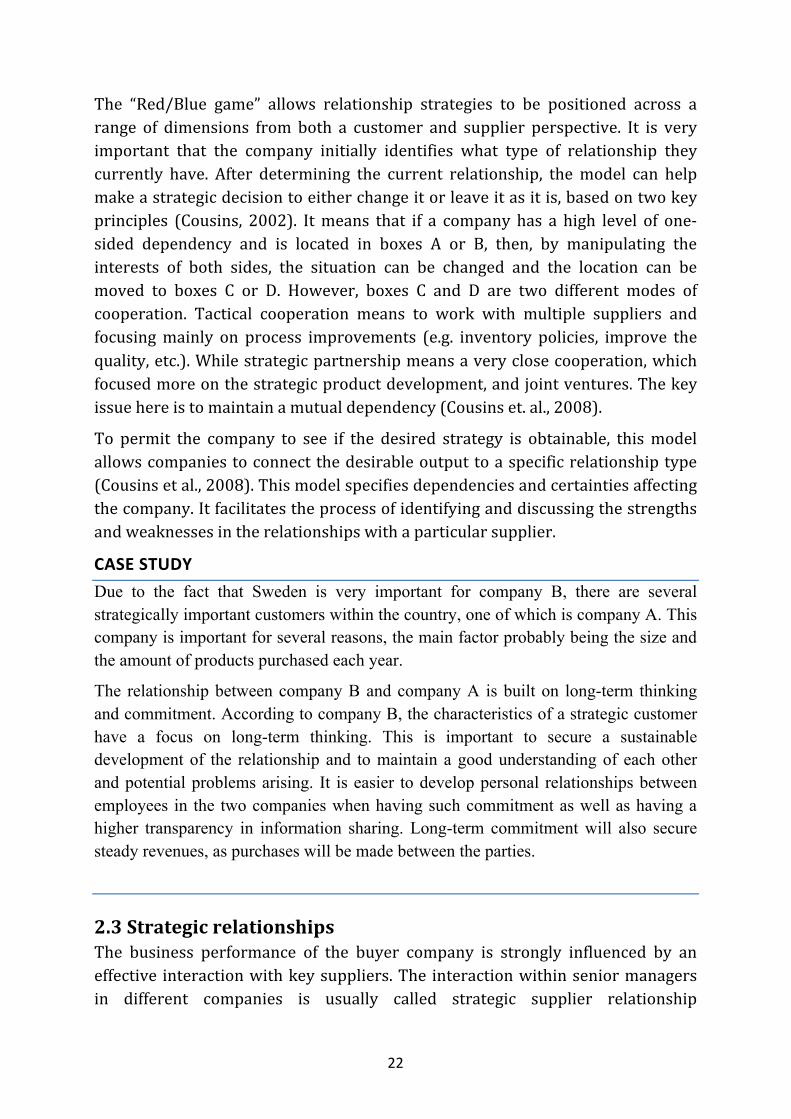
The “Red/Blue game” allows relationship strategies to be positioned across a range of dimensions from both a customer and supplier perspective. It is very important that the company initially identifies what type of relationship they currently have. After determining the current relationship, the model can help make a strategic decision to either change it or leave it as it is, based on two key principles (Cousins, 2002). It means that if a company has a high level of one-‐sided dependency and is located in boxes A or B, then, by manipulating the interests of both sides, the situation can be changed and the location can be moved to boxes C or D. However, boxes C and D are two different modes of cooperation. Tactical cooperation means to work with multiple suppliers and focusing mainly on process improvements (e.g. inventory policies, improve the quality, etc.). While strategic partnership means a very close cooperation, which focused more on the strategic product development, and joint ventures. The key issue here is to maintain a mutual dependency (Cousins et. al., 2008).
To permit the company to see if the desired strategy is obtainable, this model allows companies to connect the desirable output to a specific relationship type (Cousins et al., 2008). This model specifies dependencies and certainties affecting the company. It facilitates the process of identifying and discussing the strengths and weaknesses in the relationships with a particular supplier.
CASE STUDY Due to the fact that Sweden is very important for company B, there are several strategically important customers within the country, one of which is company A. This company is important for several reasons, the main factor probably being the size and the amount of products purchased each year.
The relationship between company B and company A is built on long-term thinking and commitment. According to company B, the characteristics of a strategic customer have a focus on long-term thinking. This is important to secure a sustainable development of the relationship and to maintain a good understanding of each other and potential problems arising. It is easier to develop personal relationships between employees in the two companies when having such commitment as well as having a higher transparency in information sharing. Long-term commitment will also secure steady revenues, as purchases will be made between the parties.
2.3 Strategic relationships The business performance of the buyer company is strongly influenced by an effective interaction with key suppliers. The interaction within senior managers in different companies is usually called strategic supplier relationship

23
management (SSRM). Day et al. (2008) defines SSRM as “a structured cross-‐company process that enhances value capture between customers and suppliers.” SSCM can result in considerable paybacks for both companies as it can form the basis for a deeper, mutually beneficial relationship that can bring new value to both sides.
To understand a supplier’s position in relation to other suppliers, one could use analytical tools. They can help the company to understand how to execute sourcing strategies and tactics to maximize their own and their suppliers’ benefits. Working with suppliers understanding these basic purchasing analysis will have a better understanding of its own value proposition and in turn, will work more effectively with their suppliers. The Kraljic-‐matrix (Kraljic, 1983) is an important tool linking the supplier impact on financial results as well as the projected risk of using this supplier (Cheveton and van der Velder, 2010).
High
Supplier impact on financial results
Low
Leverage suppliers § many competitors § commodity products
Buyer dominated segment
Strategic suppliers § market leaders § specific know-‐how
Balance of power may differ among buyer-‐supplier
Routine suppliers § large supply § many suppliers with dependent position
Reduce number of suppliers
Bottleneck suppliers § technology leaders § few, if any, alternative supplier
Supplier Dominated segment
Low High Supply Risk
Depicting suppliers in the matrix presented in Figure 2.2 will help facilitate a transparent view on where the current suppliers are positioned, as well as where they should be positioned in an optimal state. This perspective provides a broader vision of opportunities and risks, and allows companies to see the pros and cons of a certain supplier more easily.
If the analysis reveals a supplier as being Routine (lower left quadrant), it means that this particular supplier is not believed to be of any significant importance, hence close collaboration should not be prioritized and instead reducing the amount of suppliers might be a solution. If the supplier is depicted as Leverage
Figure 2.2: Supplier portfolio matrix (Adapted from van Weele, 2010:197)

24
(upper left quadrant), the financial impact shows that it might be necessary to have several suppliers. This can help the negotiating-‐aspect with lower prices, as it is a buyer’s market on these particular products. Argued by Cheveton and van der Velder (2010), this collaboration can be depicted in the left part of Figure 2.3.
If suppliers are defined as “Strategic” or “Bottleneck”, in the right part of the matrix, it means that there is a high risk associated with these suppliers. This risk stems from the fact that these suppliers are hard to replace. Most often, these relationships are characterized by a “diamond team” model as depicted in Figure 2.3 (Cheveton & van der Velder, 2010). Because of the stronger integration between the companies, this model can lead a reduced risk of having shortages in supplies, faster deliveries, better forecasting, improved quality or reduction of costs.
The “diamond team” model should not be considered as an opportunity for the supplier to roam the corridors of the buyer for their own interest, but as an opportunity for both companies to get valid results through greater employee involvement.
The structure and results of the supplier portfolio can be reviewed regularly as it depends on market circumstances, the buying focus (value, cost or price), the current performance of the suppliers and several other buyer-‐supplier requirements.
!"#$%&'()
*+,-'-./#"&0')
12%#"&0'.)
30"#+)
!"#$%&'()
*+,-'-./#"&0')
12%#"&0'.)
30"#+)
!"##$%&'()*+,%-' ./-$%&'()*+,%-'
!"-')40'/"4/).%55%#)
!"-')40'/"4/)678%#)
*+,-'-./#"&0')
12%#"&0'.)
17/607'+)50(-.&4)
30"#+)
!"##$%&'()*+,%-' ./-$%&'()*+,%-'
9%8)"4407'/),"'"(%#)
9%8).7225-%#),"'"(%#)
:;<)
*+,-'-./#"&0')
12%#"&0'.)
='607'+))50(-.&4)
30"#+)
:;<)
Figure 2.3: Relationship models (Adapted from Cheveton and Van der Velder, 2010:177)
25
CASE STUDY
A purchase planner at company C works with upholding the agreements and contacts set by the purchasing department. Their job is to keep the suppliers “on their toes” and to make sure that they follow the agreements. The purchase planners are often the ones initiating the first contact, hence being the ones the suppliers first interact with.
For a purchase planner, the desired supplier is that of full obedience with as little contact as possible. Since the delivery plans are sent automatically the need for eye-to-eye contact is not eminent for a relationship to work. The only time the purchase planners need to have continuous contact with a supplier is when an article is volatile and there might be need for early or additional deliveries.
The purchase planner’s view of a relationship can be derived from the KPIs they use. KPIs such as stock availability, in-voices, waiting customers and stock levels do not put much emphasis on keeping up a well-working relationship. However, the need of having relevant personnel to interact with at the supplying firm is still something the purchase planner values to a high extend. The reason for this is to get rapid answers on delivery times and possible delays, to help minimize problems further down in the chain. Important to remember is that these contacts should not be too personal since this could lead to less pressure of debiting due to a friendly atmosphere.
The purchase planner’s power originates from the ability to debit suppliers due to late deliveries. This factor is enough to make small companies work proactively with the problems. However, for larger more powerful companies, these debits or threats of debiting are often futile attempts since the companies believe it is a way to “buy them free from responsibility” hence they do not have as much effect.
Concerning the relationship KPIs presented in this book; communication was stated as the most important one. This can be related to the importance of having a great contact a great contact at the suppliers. In combination with a high power over the supplier, so that the debiting will actually have a significant impact, these are the two most important characteristics of a buyer-supplier relationship from a purchase planner perspective.
2.4 Strategic Suppliers Before the process of relationship evaluation and its development starts, the company should identify its key suppliers and understand the role they play for the company. It is necessary not only to select strategic suppliers, but also to determine for which products they are most valuable. This requires considering the stages of strategic supplier selection and how the product or services supplied affects the dependency of one party to another.

26
20-‐30 years ago, the process of selecting strategic suppliers had little interest on the strategic level of organizations (Cousins et al., 2008). Many companies based their selection principle on choosing the supplier with the lowest price and the development of relationships was not considered important. It can be argued that some companies still works according to this principle today, but recent business trends make this approach appear outdated.
There are two main categories of strategic suppliers; "breakthrough partners" and "development suppliers". As a rule, the first supplier segment is determined by a small number of suppliers being strategically very important. Decisions at this level must be mutual and initiatives should be made to create and maximize value both for customer and the supplier. The second supplier category is very important operationally and relationships will be characterized by a high expectation of continuity, a requirement for interdependence and close integration as these suppliers will be key targets for continuing development and investment in both time and resources (Day et al., 2008).
For many organizations, the process of identifying strategic suppliers is a complex task. In order to identify the strategic suppliers, the company should concentrate on the ones having the greatest impact. The number of strategic suppliers depends on the organization's size, scope, sophistication and the nature of its supply market landscape.
According to Cousins et al. (2008), the strategic supplier selection process is comprised by four stages (Figure 2.4).
2.4.1 Initial supplier qualification The main purpose of this phase is to identify suppliers who can meet the necessary requirements set by the company. Qualification helps the buying company to reduce the pool of potential suppliers to a more manageable amount for further evaluation and selection. It is a “sorting” exercise, where suppliers must meet a minimum standard to be eligible for later selection (de Boer, Labro and Morlacchi, 2001). Usually buyers receive information via surveys or requests that they send to the supplier including questions regarding financial viability and manufacturing capabilities. There are three common types or requests (Cousin et al., 2008):
ini_al supplier qualifica_on
agree measurement
criteria
obtain relevant
informa_on make selec_on
Figure 2.4: Strategic supplier selection (Adapted from Cousins et al., 2008:61)

27
Request for Quotation (RFQ) – is used to announce a desire to procure an item, product or service and to collect competitive bids from suppliers. Suppliers respond with prices and availability. RFQs are issued depending on the value of the concerned item and the presence of suppliers who have been contracted earlier. If the value of the item is significant and there are no earlier suppliers the standard practice is to collect and compare at least three quotations.
Request for Proposal (RFP) – is used when the buying firm requires complete or partial design input from the supplier on an item, product or service. Suppliers respond with design, price and availability. RFPs in contrast to RFQs are therefore affected by the complexity of the product and include innovativeness and R&D strength of the suppliers.
Request for Information (RFI) – is used to collect further information regarding a product or a supplier, e.g. capacity or capability to supply. RFIs may result in issuing RFQs or RFPs.
Furthermore, the buyer can visit the potential supplier to gather additional information. A visit could be beneficial because of the detailed exchange of information as well as making it possible for both parties to increase their understand of each other in other aspects, e.g. culture (Cousins and Menguc, 2006).
2.4.2 Measurement standards In this step the buyer should identify all relevant and appropriate selection standards. It is important to carefully evaluate why the measures are necessary and what value they will add. Here the buying company should think not only about price but move towards a total cost of ownership-‐approach. A buying firm should always keep in mind additional costs arising after the initial purchase (e.g. costs of poor quality, late delivery, environmental penalties) to grasp a comprehensive picture of the cost on the bottom line. Price is perhaps the most visible measure as it is easily accessed from any supplier bid or quotation but it rarely reflects the total cost.
2.4.3 Obtain relevant information Information can be obtained from new suppliers as well as from existing ones to benchmark against current performance. It is important for the information to be comparable between the suppliers in order to make transparent comparisons.

28
2.4.4 Make selection The final selection between potential suppliers can be done using a variety of models ranging from highly quantitative to highly qualitative and from being simple to more complex.
According to Cousins et al. (2008) the model and the amount of effort put into the final selection should reflect:
Impact on the business • For low-‐value products, selection may involve little more than a
comparison of the information contained within the responses to the RFQ or RFP.
• For high-‐value strategic products, selection should be more thoroughly conducted and will often involve the use of multi-‐criteria decision-‐making models (e.g. the analytic hierarchy process technique)
Market complexity
• For products with few alternative sources of supply, selection should be comprehensive because the possibility of substitution is low.
• For products with many alternative sources of supply, selection can be less comprehensive.
The experience of using this process in various organizations has shown that it can be extremely useful in bringing people together to discuss otherwise implicit issues. It also has substantive benefits in creating transparency in a process being beneficial for both parties (Cousins et al., 2008).
The relationship constellation could be discussed already during the initial supplier selection, however normally not practiced. The supplier selection is anyway highly important to understand, and could be even more so if the buyer-‐supplier relationship improvement focus eventually becomes standard practice in business. Company A presented that little consideration was taken to the relationship aspect when a new supplier was selected. The focus is solely on the product in question and the relationship develops along the way. It could be argued that assessing the relationship earlier on one has the possibility to do right from the beginning. In another way one could argue that assessing a relationship before an understanding and respect for the counterpart has been built up is of less interest.

29
2.5 Product importance As mentioned earlier, product type is a factor influencing what relationship will be formed between the buyer and the supplier. In order to understand what type of product is related to the relationship with a strategic supplier, it is necessary to conduct a product portfolio analysis and investigate all types of products and what kind of relationship is required for each of them (Figure 2.5).
Some products and services being purchased require simple relationships to achieve the desired results, while complex products or services demands more profound relationships with a larger commitment from both sides. Thus it can be claimed that the type of product or service does not only affect the type of relationship, but it dictates the actions and conditions in how to achieve the optimal relationships.
High
Purchasing’s impact on financial results
Low
Leverage suppliers § alternative sources of supply available
§ substitution possible
Competitive bidding
Strategic suppliers § critical for product's cost price
§ dependence on supplier
Performance based
partnership Routine products § large product variety § high logistics complexity
§ labor intensive
Systems contracting + E-‐Procurement solutions
Bottleneck suppliers § monopolistic market § large entry barriers
Secure supply + search for
alternatives Low High Supply Risk
For a better understanding of what kind of relationship is required for each product category, four product types will be discussed in detail.
2.5.1 Routine products Typically, products or services relating to this quadrant is of low value and involve low technical or supply risk Cousins et al. (2008). The objective here is to pay the most reasonable price for the product, at the same time as providing delivery and quality standards. In most cases buyers would negotiate with their suppliers on price as a focus since switching costs are fairly low.
Figure 2.5: Product portfolio matrix (Adapted from van Weele, 2010:197)

30
2.5.2 Bottleneck products The items belonging to the bottleneck category can have deep impact, affecting the products or services further down in the chain if being out of stock. Since these products have a tendency of being short in supply, there is a focus on always securing these products, as they are essential for completing the end product. In this context, the buyer is focused not only on the purchase price, as in the case with routine products, but more on the total cost of the finished goods. With such product type, the supplier will always be dominant in the relationships that can lead to high price, long delivery time, bad service, etc. (van Weele, 2010).
2.5.3 Leverage products The focus for this type of strategy is on assessing the best price as leverage products can be obtained from various suppliers, hence no real risk of shortage is present (van Weele, 2010). Leveraging involves pulling together a range of similar products to increase contract size and power in negotiations. Thus it can be argued that the dominant part in these relationships is the buyer. This can be related to Company B, which stated that in times of good supplies there is a tendency of being high buyer power, and when times of shortage in supplies there is a tendency of being supplier power. This empirical finding strengthens this statement further.
2.5.4 Strategic products In this quadrant, there are high-‐tech, high-‐volume products, which are often sup-‐plied at customer specification and “cooperation” is the most predominant strategy for buyers as these suppliers are both high risk and can have a high impact on the buyer firm’s profitability (van Weele, 2010).
Returning to the supplier portfolio analysis (Figure 2.2), this box with strategic products will have strategic suppliers, where the top 20 per cent of suppliers account for 80 per cent of the value (Cousins et al., 2008). These types of products should be secured by developing the supplier relationships as much as possible. These relationships tend to be very complex since it involves important products being monitored closely by the buying firm. To allow a constructive development of the relationship with a minimal amount of surprises, the buyer-‐supplier communication and interaction should be highly qualitative as well as frequent.
Returning to the question of dependence, van Weele (2010) identified three main segments of dependency/power for strategic products;

31
• Buyer-‐dominated segment – In this segment, a buyer dictates the demand to the supplier that has to meet these requirements as supplies exceeds demand.
• Supplier-‐dominated segment – Here, the situation is the opposite. In this case, the provider locks a buyer in a relationship by its products or by possessing unique technologies. Usually the buyer gets the performance guarantee, only if all products and services are bought from the same supplier. In that dependency segment the buyer can only accept the conditions imposed by the supplier with little flexibility in general.
• Balanced relationships – It means that both the supplier and the customer have a mutual interest in maintaining a stable relationship and that partnership may develop over time. Both parties believe that the relationship is important for the others success.
As can be seen, sourcing strategies plays an important role as it describes how many suppliers the company favors for this or that type of product, what type of purchasing relationship can arise between suppliers and buyers and what type of contract to negotiate. Based on the type of product it can help the company to build relationships with the best possible suppliers for the company in a global setting. Sourcing strategies and today's existing trends will be described further in Chapter 3.
2.6 Risk in business relationships Supply chains nowadays form networks of many actors that intend to extract the best of every actor and strengthen overall competitive advantage through specialization. Supply network constellations imply a number of supplier relationship risks that need to be dealt with, as actors tend to become more and more dependent on their network environment. Harland, Brenchley and Walker (2003) argue that the increased complexity of supply networks, e.g. outsourcing, product complexity and demanding customer needs, has made supply networks more vulnerable to risks.
In a simple way, risks in supplier relationships can be defined as losses and their probability of occurrence. What must be considered though is that unexpected events have different impact on different actors. This means that to fully understand risks and their impact on supplier relationships they must be studied both from the buyer perspective as well as from the supplier perspective.
Risks can be derived from uncertainties of fulfilling objectives, such as profit, market shares or future positioning of the company. Hallikas et al. (2004) examined two example networks and grouped the encountered risks into four sources of risks: demand problems, customer deliveries, cost management and

32
pricing, and weaknesses in resources, development and flexibility. In another study Hallikas et al. (2005) referred to Johnson’s (2001) simple categorization of risks, where he associated them with either product demand or product supply. Harland et al. (2003) instead presented different risks depending on their impact on business and its environment, e.g. strategic risk, supply risk, customer risk, competitive risk, reputation risk, legal risk, etc.
2.6.1 Risk management process Risk management aims at developing strategies to manage or avoid risks. Risk management is a complicated process, as risks are difficult to predict and neither what nor how and when is known. To succeed it is important that many network actors are involved in formulating strategies for risk management and making them holistic by embracing multiple approaches to avoid risks (Harland et al., 2003). Hallikas et al. (2004) present a typical four-‐step risk management process from the perspective of any single company:
Risk identification – Be observant to signals of interruptions, quality issues, delivery fluctuations or other indications of uncertainties. Every company is responsible for identifying risks from their point of view, however information sharing and collaborative work with other network partners could decrease external and internal uncertainties.
Risk assessment – Prioritize among risks and find suitable actions to reduce the impact or the likelihood of the risks. Hallikas et al. (2004) introduce the risk diagram as a tool for quantifying the importance of risks, see Figure 2.6. The risk diagram is built up by the probability of occurrence and the consequences of a risk event. When risks have been mapped in the risk diagram it can be used to decide measurement to counteract the risks by either reducing the probability of occurrence or reducing the impact in case of occurrence. Furthermore risks of little importance will be visible in the bottom left square.

33
Decision and implementation of risk management actions – Risk management actions are closely related to the distribution of risks in a relationship. Two possible actions are therefore risk taking or risk transferring. Consider for example suppliers taking the risk of investing in a relationship by acquiring dedicated resources. Original Equipment Manufacturers (OEM) are known for transferring risks to their suppliers, whose incentives for embracing risk taking are justified by the importance of the relationship. From a network perspective risk taking should however be distributed to best balance risk at network level.
Risk monitoring – The dynamic development of risks and trends in probability and consequences is monitored to update the risk assessments accordingly. Changes in network composition, partner strategies, competitors, technologies and customer needs can all impact the identified risks as well as introduce new risks.
2.6.2 Supplier relationships and impact on risk assessment Focusing on the second step of the risk management process, risk assessment, it can differ depending on the type of relationship a company has with its different suppliers. It is easier to understand that the type of relationship has an impact on the collaborative risk management activities rather than the opposite. However, even though the risk management activities may not change the type of relationship it can still impact the performance of the same, for good or for bad.
Hallikas et al. (2005) formulated a number of hypotheses and applied them on a Finish OEM of large high-‐tech machines. The results showed for example that collaborative learning in supplier relationships differs depending on the risks involved. Furthermore risk management activities also differ according to the
Figure 2.6: Risk diagram (Adapted from Hallikas et al., 2004:53)

34
risks. The investigated supplier relationships were classified depending on buyer dependency risk and supplier dependency risk. The result implied that as mutual dependency increased so did collaborative risk management and joint learning. However in both asymmetric and non-‐strategic relationships the incentives for collaborative work or learning were weaker.
Relating these findings to the performance of supplier relationships one must keep in mind that collaborative work also introduces collaborative risks. There is for example a risk of suppliers or buyers acting opportunistically on the same collaborative activities, e.g. information sharing.
CASE STUDY
Looking back to 2009, company A had roughly 50 suppliers, compared to today’s 200. The increasing amount is due to several reasons. The most important probably being expansion of the total product portfolio. All suppliers used to be strategic, as they delivered to a special set of end-stores, depending on where they were located. As for today, the web-assortment has increased the supplier base, and if they are not delivering unique products, they are not believed to be as strategically important. Important to note is if a supplier stands for a large amount of supplies or a wide range of products, it definitely makes them more important.
With the Lean-implementation at company A, there have been some general improvements in how they work with suppliers. It is however small things, but adding up to a gain in efficiency. They show the suppliers how they are performing, but mostly on the initiative of company A. There is no clear segmentation between suppliers. All of them are more or less important.
Summary Relationships has become more complex today than a decade ago, and there is at present a larger focus on developing existing relationships based on long-‐term thinking, since developing relationships takes time. To understand which relationships to develop first depends on how important they are believed to be in supporting the overall business strategy. A general belief is that a relationship will develop in a good way if both companies can reap benefits from such collaboration. A main obstacle for unsuccessful collaboration is due to non-‐effective internal collaboration.
With the help of e.g. the Kraljic-‐matrix, companies can position their suppliers in different categories depending on their features, making the supplier evaluation more transparent. Executing a supplier selection assessment have shown to be

35
very useful in bringing people together and discuss issues that earlier was considered hidden, as it creates a new type of transparency.

36
37
Chapter 3 -‐ Sourcing strategies Different sourcing structures, with their advantages and disadvantages, offer different ways to structure the supply base. The choice to use a particular structure depends on the needs and desires of the buying-‐company, the required type of relationship, the level of relationship between buyer and supplier, and the nature of market competition (Cousins et al., 2008). The choice of sourcing strategy will influence the characteristics of the relationship between a buyer and a supplier. Some strategies emphasizes close relationships and some contradicts it. In this chapter different ways to perform sourcing will be explained.
3.1 Single sourcing Single sourcing has received increased attention across the globe as an effect of the supplier base reduction trend, which was presented in chapter 1. Monczka et al. (2010) states that the main reason for choosing to implement single sourcing is the focus on developing closer relationships with suppliers. Another major reason for utilizing single sourcing is the reduction of complexity within the supply chain.
The most obvious negative effect of single sourcing is the increased dependency on one single supplier. According to Stamatis (2012) this dependency has increased the supply chain risk. However, it has also been stated that this risk decreases with the closeness in supplier relationships.
According to van Weele (2010), reducing the number of suppliers should never be a goal in itself, but rather a way to achieve cost reductions or complexity in the value chain. He further argues that having a larger volume concentrated to fewer suppliers may lead to beneficial negotiations. If embracing a single sourcing strategy, it is though important to clarify terms and conditions through a seamless integration between the companies in order to secure a continuous flow of goods.
The British Deming Association (1988) argues that single sourcing may be a good way to decrease total cost through Total Quality Management. Even if products from several suppliers fulfill specified requirements, the companies will surely be a different somehow, and as a consequence a company will face higher costs compared to using only one company for the same products. However, a prerequisite for a single sourcing strategy to work is to use suppliers with a thorough TQM-‐knowledge. One may argue that two suppliers would be better to hedge against unexpected events, e.g. fire outbreaks. It is not certain that the

38
other company can comply with additional delivery due to constrain in production capacity and even if they are able to produce the buying firm would still have to pay a premium price. This further emphasizes importance of the buying firm’s conduction of a proper Total Cost and Risk analysis. Using single sourcing, business relationships will build a solid ground based on mutual dependency supported by trust.
Inderst (2008) argues that single sourcing is best suited for a buyer controlling a sufficiently large share of the market. Whether single sourcing is optimal or not depends on a buyer’s relative size, which means the amount of the total procurement market that the buyer accounts for. This means that only adequately large companies are able to change its allocation of supplies, and smaller firms will only reshuffle the purchases, with little effect on suppliers’ production effectiveness.
Depending on the company itself and its goals and objectives, there will be some inertia depending on the alignment of the business units. From the financial aspect, cost is always an issue, to the engineering department, quality is the main concern and to production supervisors, the timely arrival may be of crucial importance (Tullous and Utecht, 1992). There is no clear cut way to define if single sourcing is the best fit for a company, it depends on the context and the setting in which it acts. However, in order to develop an understanding for which sourcing strategy to go for, a company must be aligned towards the long-‐term strategy and goals. As stated by Tullous and Utecht (1992), the reason for companies to use single sourcing may be the same argument used by other companies implementing a multiple-‐sourcing strategy. The main conflicts lie in the context of the firms, where for example one buying company decides to source the best products from different suppliers in order to get the best end product, whereas another buying company sources all components from one supplier in order to get a mutual understanding of how the end product development.
CASE STUDY
Sometimes companies have environmental factors that affect their choice of suppliers and choice of sourcing strategy. The studied company A describes some of these environmental factors:
“If the supplier for certain products are located more than approximately 400 km from the final drop-off, it will not be profitable to conduct the transport”. The available suppliers in the case of company A comprise both large actors operating on a global

39
market, as well as smaller local manufacturers. They believe this is a good mix in order to not be too dependent on one or a few giants.
Thus, the factors affecting the decision here are distance and dependence.
3.2 Multiple sourcing Instead of relying solely on one supplier a company can choose to use several suppliers for the same product in order to spread its risk and create competition among suppliers. (van Weele, 2010) Using several suppliers usually leads to less integration between the customer and its suppliers and the companies furthermore become less dependent on each other. This means that the buyer is able to switch supplier should one fail to meet their needs. Tullous and Utecht (1992) Multiple sourcing is more common for products that are commodities, as commodities are fairly standardized and easier to source from several suppliers. (van Weele, 2010) This type of sourcing is also more common for larger companies. A large company usually buys in larger quantities that are easier to spread among multiple suppliers. Tullous and Utecht (1992) An example that illustrates the spreading of risk is the petroleum industry. When the OPEC countries created a cruel-‐oil embargo many buyers ended up without suppliers and had to find oil elsewhere, on the “open market”, to a substantially higher cost. However if the buyer had several suppliers from the beginning, spread over the world, suppliers outside of the OPEC countries could have stepped in when additional supplies were required. Tullous and Utecht (1992)
One way of utilizing a multiple sourcing strategy beneficially is to conduct auctions for orders. The buyer simply lets the suppliers bid for the lowest price and thereafter chooses the supplier who offers the lowest price while still fulfilling the desired quality and, if applicable, other requirements. However, holding auctions could be a time consuming event. Reviewing offers and managing the auction requires resources, possibly turning it into a quite expensive strategy. In this aspect the price must be lowered more than the cost of holding the auction (Inderst, 2008). Another way of dealing with multiple sourcing is to have online ordering systems. These systems are favorable for simple products and have the advantage of being easy to maintain and handle, still creating competition among suppliers. (van Weele, 2010)
The common perception among companies using multiple sourcing is that competition among suppliers assures that they will get the lowest possible price. Elmaghraby (2000) on the other hand argues that the lack of a close relationship between the buyer and supplier may lead to a higher total cost. A close relationship means closer collaboration, which could lower the cost just as much.
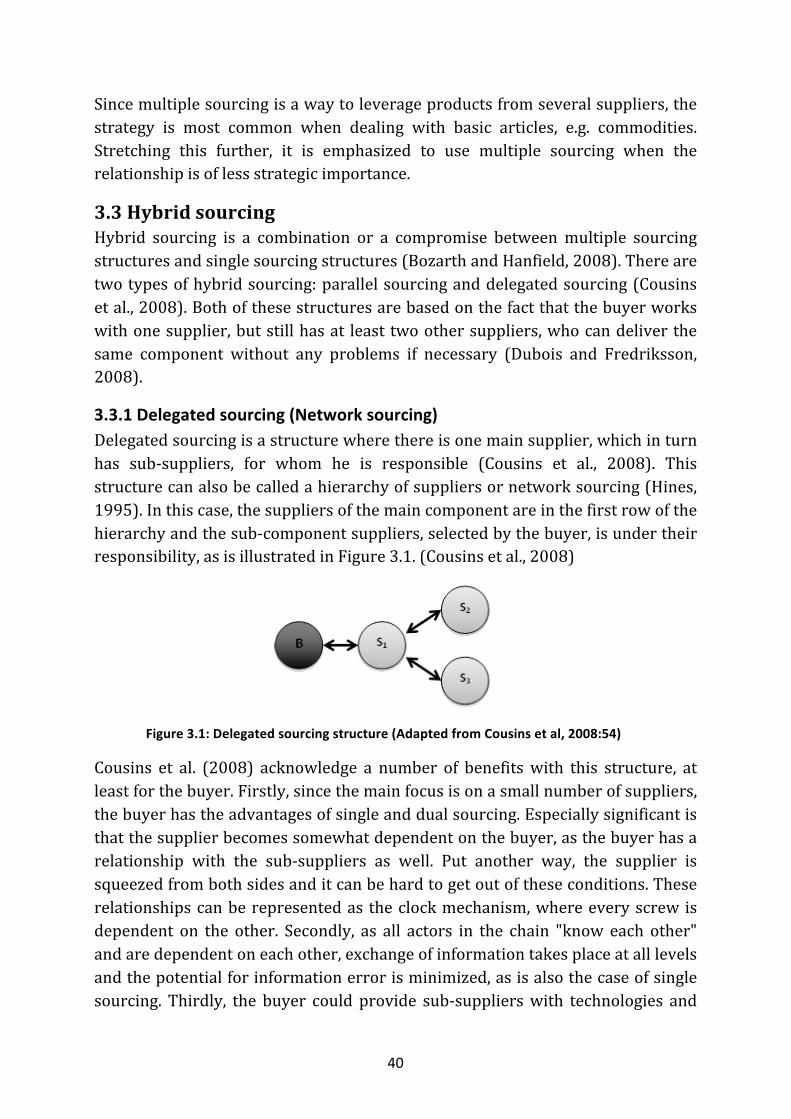
40
Since multiple sourcing is a way to leverage products from several suppliers, the strategy is most common when dealing with basic articles, e.g. commodities. Stretching this further, it is emphasized to use multiple sourcing when the relationship is of less strategic importance.
3.3 Hybrid sourcing Hybrid sourcing is a combination or a compromise between multiple sourcing structures and single sourcing structures (Bozarth and Hanfield, 2008). There are two types of hybrid sourcing: parallel sourcing and delegated sourcing (Cousins et al., 2008). Both of these structures are based on the fact that the buyer works with one supplier, but still has at least two other suppliers, who can deliver the same component without any problems if necessary (Dubois and Fredriksson, 2008).
3.3.1 Delegated sourcing (Network sourcing) Delegated sourcing is a structure where there is one main supplier, which in turn has sub-‐suppliers, for whom he is responsible (Cousins et al., 2008). This structure can also be called a hierarchy of suppliers or network sourcing (Hines, 1995). In this case, the suppliers of the main component are in the first row of the hierarchy and the sub-‐component suppliers, selected by the buyer, is under their responsibility, as is illustrated in Figure 3.1. (Cousins et al., 2008)
Cousins et al. (2008) acknowledge a number of benefits with this structure, at least for the buyer. Firstly, since the main focus is on a small number of suppliers, the buyer has the advantages of single and dual sourcing. Especially significant is that the supplier becomes somewhat dependent on the buyer, as the buyer has a relationship with the sub-‐suppliers as well. Put another way, the supplier is squeezed from both sides and it can be hard to get out of these conditions. These relationships can be represented as the clock mechanism, where every screw is dependent on the other. Secondly, as all actors in the chain "know each other" and are dependent on each other, exchange of information takes place at all levels and the potential for information error is minimized, as is also the case of single sourcing. Thirdly, the buyer could provide sub-‐suppliers with technologies and
Figure 3.1: Delegated sourcing structure (Adapted from Cousins et al, 2008:54)

41
developments for the production of necessary sub-‐components, which enables the main supplier to provide the buyer with fully finished components. The buyer obviously becomes the main player of this supply chain and will therefore have the power to formulate the standards of the relationship. Still the main supplier could in a way enjoy empowerment if entitled with power and control over the supply and production of sub-‐components (Cousins et al., 2008). “The key to the success of network sourcing is to develop an intercompany environment where the creative tension between cooperation and competition is used to maximize the benefits to all supply sources, the customer, and ultimately the end consumer as well” (Hines, 1995:22) The main difference with delegated sourcing is that the buyer has a contractual agreement with all suppliers, main suppliers as well as sub-‐suppliers. This means that all suppliers from this hierarchy are considered to be included in the supplier base of the buyer (Dubois and Fredriksson, 2008).
Choi and Krause (2006) point out that the hierarchy of this sourcing structure could be deepened into the third and fourth level of suppliers, as shown in Figure 3.2. Supplier base can grow as long as the buyer can actively manage all the cogs of the mechanism.
3.3.2 Parallel sourcing The concept of parallel sourcing was developed by Richardson in 1993. Richardson (1993) argues that parallel sourcing could provide all the advantages of multiple-‐ and single sourcing, and also has the possible drawbacks of the same.
!"#$%&'(()*+%),&
!",(-&."),&/0+12#-,$1-2,(&
/)12#3&."),&/0+12#-,$1-2,(&
.4",3."),&/0+12#-,$1-2,(&
5
5 5 5
5 5 5 5 5 5
5 5 5 5 5 5 5 5 5 5 5 5
Figure 3.2: Supply Chain tree (Adapted from Hines, 1995:21)
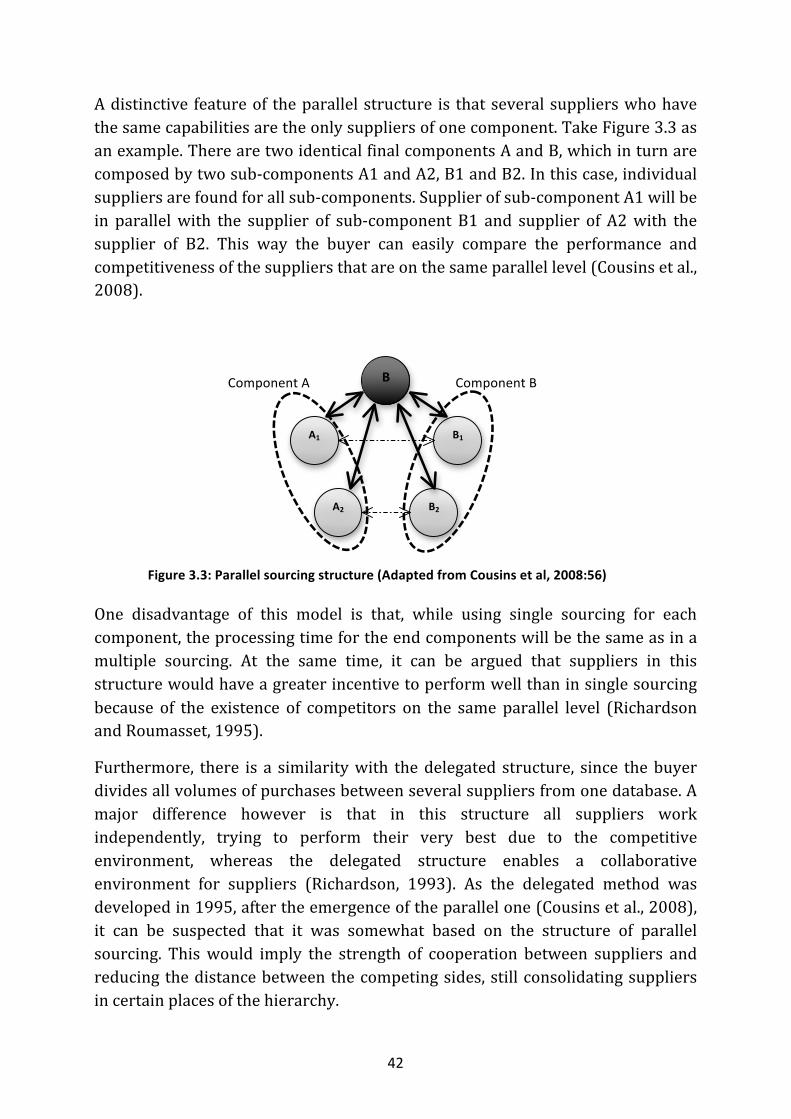
42
B
A1
A2
B1
B2
Component A Component B
A distinctive feature of the parallel structure is that several suppliers who have the same capabilities are the only suppliers of one component. Take Figure 3.3 as an example. There are two identical final components A and B, which in turn are composed by two sub-‐components A1 and A2, B1 and B2. In this case, individual suppliers are found for all sub-‐components. Supplier of sub-‐component A1 will be in parallel with the supplier of sub-‐component B1 and supplier of A2 with the supplier of B2. This way the buyer can easily compare the performance and competitiveness of the suppliers that are on the same parallel level (Cousins et al., 2008).
One disadvantage of this model is that, while using single sourcing for each component, the processing time for the end components will be the same as in a multiple sourcing. At the same time, it can be argued that suppliers in this structure would have a greater incentive to perform well than in single sourcing because of the existence of competitors on the same parallel level (Richardson and Roumasset, 1995).
Furthermore, there is a similarity with the delegated structure, since the buyer divides all volumes of purchases between several suppliers from one database. A major difference however is that in this structure all suppliers work independently, trying to perform their very best due to the competitive environment, whereas the delegated structure enables a collaborative environment for suppliers (Richardson, 1993). As the delegated method was developed in 1995, after the emergence of the parallel one (Cousins et al., 2008), it can be suspected that it was somewhat based on the structure of parallel sourcing. This would imply the strength of cooperation between suppliers and reducing the distance between the competing sides, still consolidating suppliers in certain places of the hierarchy.
Figure 3.3: Parallel sourcing structure (Adapted from Cousins et al, 2008:56)
43
3.4 Triadic sourcing Dubois and Fredriksson (2008) introduce another sourcing strategy called triadic sourcing. Triadic sourcing can be viewed as a modification of hybrid sourcing. This strategy involves two suppliers and one buyer, forming a triad. In the triad the buyer actively creates interdependencies with both suppliers. Doing this, the buyer can nurture and benefit from the close cooperation with both suppliers and at the same time create a competitive environment through overlapping capabilities. The triadic strategy is dynamic and can lead to higher efficiency and innovation within the triad.
Triadic sourcing is most useful when the production volume is large enough to be divided between the two suppliers and the “prerequisites for exploitation of economies of scale change over time”. Since a triad consists of three relationships all three parties can be involved and cooperate in dividing labor in accordance to changes over time.
Managing a triadic sourcing scenario is a delicate managerial issue. The buyer wants to keep the suppliers on their toes so that they continuously offer favorable solutions and at the same time promote sharing of knowledge with the buyer in order to enable tailored solutions. To do this and at the same time be competing with the other supplier is truly a challenge for the supplier, why it is important that the buyer does not try to control the suppliers to much in order to keep the innovativeness at the highest possible level (Dubois and Fredriksson, 2008).
So what is it that makes this seemingly complicated type of strategy worth it in the long run?
This quote may make that clearer:
“A triadic sourcing strategy provides a unique platform for managing the relation between general and customized solutions, including considerations of the suppliers’ other customers’ needs, since it rests on long-‐term commitments and a balance between the two suppliers’over time.” (Dubois and Fredriksson, 2008:178) For a supplier within a triadic scenario one of the most important tasks is to separate the competitive side and the cooperative side of the relationship in order to enable a well-‐functioning relationship with the other supplier in order to perform in accordance to the buyers’ need (Dubois and Fredriksson, 2008).
44
Summary The different sourcing strategies that exist can all fit fairly into the three categories of single sourcing, multiple sourcing and hybrid sourcing. Different sourcing strategies are suitable for different business environments, e.g. single-‐ and hybrid sourcing are most suitable for strategic partnerships where close relationships are emphasized whereas multiple sourcing are most suitable for commodities and does not require any closer collaboration with the supplier, therefore no meaning in assessing such a relationship exists.
All strategies have strengths and weaknesses and hybrid sourcing is often used as a way to minimize the drawbacks and maximize the positive aspects. Two types of hybrid sourcing are presented, the delegated sourcing and the parallel sourcing. Delegated sourcing considers different levels of hierarchy in a supply chain, where the buyer forms relationships also with sub-‐suppliers even though they are still under the responsibility of the main supplier. Parallel sourcing identifies levels of component supply where suppliers on the same level can be compared to each other to create a competitive incentive for the suppliers to perform well. Finally triadic sourcing was elaborated as a way for the buyer to create interdependencies with two suppliers in a triadic constellation, to create a both competitive and cooperative environment at once.

45
Chapter 4 – Measurements of relationships Traditional KPI are often used by companies to evaluate their suppliers. However, when measuring the performance of a relationship these quantitative measures can be hard to use and thus other factors such as level of trust and power are regarded by many authors as a more appropriate measurement. This chapter present and reflect briefly upon on the traditional KPIs and develop a number of relationship affecting KPIs further.
4.1 Traditional KPIs Supply chain performance measurements are often classified into four categories: cost, quality, time and flexibility. Shepherd and Günter (2006) argue that it is essential to continuously measure and monitor the supply chain performance in these aspects and act upon the results in order to stay competitive. These performance indicators are highly interdependent (Bamford and Forrester, 2010), for example if a company wants to be the fastest and provide the best quality, cost could increase.
4.1.1 Cost Many authors agree that cost is the single most important factor in evaluating and monitoring suppliers. According to Bamford and Forrester (2010) cost remains an important factor to measure since it correlates to profit, labor productivity and selling prices. However, they state that today much more importance is given to the reduction of costs through decreased stock levels and increasing stock turnovers. In that aspect it can be argued that cost and time measurements are somewhat interrelated, e.g. shorter delivery lead-‐times allows companies to decrease their inventory levels.
4.1.2 Lead-‐time As product lifecycles are continuously shortened, organizations are adopting just-‐in-‐time practices and the power is shifting from the seller to the buyer. It has become increasingly important for companies to respond quickly to demand fluctuations (Christopher, 2011) and as a consequence the significance of time measurements has increased. According to Bamford and Forrester (2010) companies have shifted their attention to lead-‐time reduction in product design. This is mainly since the faster a company can move from the design phase to provision from the service/product the more appealing it will become for the market.
46
4.1.3 Quality Shepherd and Günter (2006) state that quality displays the ability of the supply chain to deliver superior customer service. According to Bamford and Forrester (2010) quality plays an important role in the operation strategy of any market driven company and can be considered from two different dimensions; a product and an organizational context. They further argue that quality is an important feature of any product or service and sales levels are often associated to a company´s reputation of quality.
4.1.4 Flexibility Flexibility is defined as the ability to increase production volumes as well as having customizable business processes, adaptable supply relationships, and quick and streamlined data flow (Jacoby, 2009). Flexibility measures allow companies to determine whether they have the appropriate level of flexibility in order to cover fluctuations in future demand and to arrange activities accordingly (Supply-‐Chain Council, 2008). Shepherd and Günter (2006) even argue that by measuring flexibility a company not only gets a reflection on how parties cope with rapid changes in demand but also rapid changes in supply. Flexibility measures are either based on historical data or on assumptions (Supply-‐Chain Council, 2008) and can be measured from different aspects, such as supply chain response time and product flexibility. CASE STUDY Company A uses a specific set of traditional KPIs to evaluate their suppliers, which are aligned with the company’s long-term thinking in providing desired products at the best price. Examples of these KPIs are Total Cost of Ownership (cost measurement designed to assess both direct and indirect costs related to a purchase of a capital investment) and cycle time. Company B considers four main KPIs when evaluating their buyers (e.g. company A): volume (the amount of articles purchased annually), turnover (how much of the company’s total turnover accounts for purchases from company A), average price (the average price that company A pays for different articles) and fill rate of truckloads in transportation. Availability is considered by company C to be one of the most important KPIs when evaluating their suppliers. Quality measurements are also believed to be of great importance, such as defect products compared to the number of scheduled items delivered on time.

47
4.2 Buyer-‐supplier relationship performance KPIs There are many factors identified by various authors as being important in a buyer-‐supplier relationship and thus are important to measure. The six factors described below are the once affecting the relationship to the greatest extent. What distinguishes them from the traditional KPIs is that they are soft qualitative measures. According to Harland (1996) in most cases performance measurements include hard quantitative measures, which can be hard to use when measuring soft and intangible traits of relationships. It can be argued that improving these qualitative measures will increase the performance of the traditional KPIs (Figure 4.1)
4.2.1 Trust As companies become more and more specialized, focusing on core competences, the dependency on other companies increases. Due to this trend, trust between companies becomes increasingly important. As companies to a decreasing extent compete on their own, but rather compete with their entire supply chain against other supply chains the importance of trust is even more relevant. (van Weele, 2010)
Trust can be defined as “one party’s belief that the other party in the relationship will not act opportunistically and not exploit its vulnerabilities even when such exploitation would not be detected” (Stuart, Verville and Taskin, 2012:394). It is important to notice that trust is only a belief from one side of the relationship and not clear evidence that the other party will not act opportunistically. This is a reason why most companies work with contractual agreements and not only base their decisions on trust.
Trust can be divided into different levels, which describe how deep the trust goes. These levels can be characterized as Calculative, Cognitive, Normative and Trustworthiness. On a calculative level suppliers or buyers only trust each other
Trust
Power
Transparency
Communication
Commitment
Cooperation
Relationship
Cost
Quality
Lead-‐time
Flexibility
Relationship KPIs
Outcome KPIs
Figure 4.1: Correlation between the relationship KPIs and the traditional ones

48
because it is in their self-‐interest to do so. Cognitive trust is where actors share common cognitions but nothing more. The normative trust is established by common views, expectations and responsibilities that are agreed upon through industrial or social norms and good fit between company cultures. The deepest level of trust is described as trustworthiness and is characterized by day-‐to-‐day demonstrations of trust, such as kept promises. (Giannakis, 2007)
According to van Weele (2010), trust can be narrowed down to two factors, competence and trustworthiness. Competence through skilled and experienced employees will lead to higher trust towards a company. Trustworthiness can be gained through strict ethical principles and procedures that are conveyed in a consistent and reliable way by the entire company. It is therefore important that companies have clear policies on business integrity and ethics in order to convey trust to their suppliers and customers (ibid.). Van Weele adds another important dimension to trust, competence, and defines the deepest level of trust, trustworthiness, as something the entire company expresses in everything they do. The trustworthiness dimension of trust can almost be seen as the firm reputation which Suh and Houston (2010) argues to be more important than trust when forming and maintaining buyer-‐supplier relationships. Since trust is based on the impression of the entire company the two concepts of trust versus firm reputation may however not contradict each other.
Concerning competitiveness, Stuart, Verville and Taskin, (2012) claims that a supply chain without this mutual trust between businesses will not be able to compete with one where mutual trust exists. To be able to form competitive inter-‐organizational alliances such as strategic partnerships mutual trust is critical and mandatory.
Stuart, Verville and Taskin, (2012) explains that trust can lead to several benefits for companies: First, trust can help lower transaction costs, for example by implementing Vendor Managed Inventory (VMI). Second, safeguarding costs can be reduced by less need of extensive contracts. Third, trust will reduce opportunistic behavior and lead to more effective information flows and information sharing. The two latter benefits can be achieved by increasing transparency between organizations as is suggested by most researchers in the field of Supply Chain Management. To sum up the potential benefits of trust, it can lead to: improved financial performance (Verville, Taskin and Law, 2011), greater market penetration and improved customer relationships. (Stuart, Verville and Taskin, 2012)

49
However, trust has not always been considered as something important in corporate culture. During the early years of studying the subject most western companies saw trust as something unnecessary and preferred competition in every new business relationship. A quote from a leading practitioner during this time explains the mindset: “Having suppliers fight each other for my business means I get the best price.” (Stuart, Verville and Taskin, 2012:393) It was with the introduction of lean thinking in the western world, at the same time as the competition from eastern countries, such as Japan, grew tougher, that practitioners started to understand the potential of trust-‐based relationships between suppliers and buyers. Risk reduction and speed-‐to-‐market strategies were leading arguments that emphasized more cooperative relationships. (Stuart, Verville and Taskin, 2012)
Measuring trust Since trust has so many benefits and is crucial to enable strategic partnerships it can be used as a qualitative measure of performance for a relationship. To measure trust is not an easy task and requires opinions from both parties within a relationship.
Trust will be used as a KPI when measuring the performance of buyer-‐supplier relationships. Trust is mentioned by several authors (Johnston, 2004; Giannakis, 2007; Stuart, Verville and Taskin, 2012) as an important aspect of a good relationship between a buyer and a supplier. Since the level of trust greatly can affect the relationship itself as well as other aspects of a relationship, such as information sharing, willingness to cooperate and communication, it is considered an important aspect to consider when assessing a buyer-‐supplier relationship.
When measuring trust, the four different levels of trust; Calculative, Cognitive, Normative and Trustworthiness, presented above, will be taken into consideration. A scaling ranging from 1 to 5 is created to make the assessment. In this scaling five is considered the highest level of trust and is describes as “Trust in all aspects of the relationship”. For the other four ranks the 4 levels of trust has been chosen so that rank 1 means calculative trust, rank 2 cognitive trust, rank 3 normative trust and rank 4 trustworthiness.
4.2.2 Power Power in relationships between companies arises due to dependences. These dependences are formed when one of the companies´ goals become dependent on the actions of the other company. Dependency is therefore considered to be the inverse of power (Gadde, Håkansson and Persson, 2010). The reason for this

50
dependency is often characterized as a high need of the specific product or service but low possibilities of receiving this product or service from other sources as well as low possibilities for integration with the current supplier (Böhme et al., 2008).
The power structure is a key element to assess in supply chain management (Hingley, 2005). Similarly, Böhme et al. (2008) considers it to be important to understand the dependency and power between two companies in order to understand the relationship.
There are five major variables that determine the level of dependency a buyer has on a supplier, and thereby the power the supplier has over the buyer (Böhme et al., 2008):
• Capabilities/supplier skills – If the supplier has certain capabilities or skills that are hard to copy or even unique the buyer-‐dependency will be high.
• Switching cost – If the buyer has made large investments in the relationship with the supplier, the dependency on the supplier will be high.
• Supplier resources – Scarce resources could lead to dependencies. If a supplier are in possession of, or has good means to get a scarce resource that the buyer is dependent on, this could lead to dependencies on the supplier.
• Branding/reputation – If a buyer prefers or needs a specific brand a dependency on that supplier will arise.
• Number of alternative suppliers – If there are only few or none alternative supplier of a specific product or service the dependency on the current supplier will be high.
Another important aspect is the size differences between the two companies. If the buyer is contributing to a very small part of the total revenue stream for the supplier, and there already is a dependency on this supplier, the supplier power will increase even more due to the insignificant role of the buyer.
When a buyer has a high dependency on a supplier for a specific item and the supplier does not have the same dependency on the buyer as a customer, this item is considered a bottleneck item. This is the least suitable scenario for the buyer and can be visualized in the bottom right corner of Figure 4.2 (Böhme et al., 2008).

51
High
Supplier dependency
Low
Buyer dominance Leverage items
Interdependence Strategic items
Interdependence Non-‐critical items
Supplier dominance
Bottleneck items
Low High Buyer dependency
This can be achieved by four different strategies (Böhme et al., 2008):
• Insourcing – Buyers try to build or supply themselves to reduce dependency
• Volume increase – Buyers choose suppliers for sourcing of more products than the bottleneck one in order to change the dynamics of the relationship
• Global sourcing – Buyers investigate new potential supplier with from a wider geographical perspective
• Socialisation – Buyers try to earn trust through socialization in order to reduce the risk of opportunistic behaviour. This will not reduce the dependency but can make the situation more bearable for the buyer.
But to think that each relationship with suppliers can be balanced in power is not realistic. Asymmetries have to exist sometimes and that does not necessarily mean that the relationship is unstable or cannot last. Asymmetries between organizations are more likely to exist than perfect matches and the dependent organization will have to cope with that. (Hingley, 2005)
Buyer power instead considers the buying firm’s perspective and thus the supplier’s dependency. Buyer power derived from supplier dependency most often exists when the buying company holds a high percentage of the supplying company’s business or is significant in other ways. Having buyer power implies a higher commercial value of the buying organization and results in a stronger bargaining position when it comes to setting prices and making quality trade-‐offs. (Böhme et al., 2008)
Similar to the supplier power variables, Böhme et al. (2008) mention five supplier dependency variables:
• Purchasing volume/profit margin – As mentioned earlier the strongest reason for buyer power comes from the volume they purchase from the
Figure 4.2: Power and dependency dyadic relationship model (Adapted from Böhme et al., 2008:125)

52
same supplying company. Buying a high percentage from the same unit implies a higher power over that supplier and vice versa.
• Switching cost – If the supplier has made significant investments in their customer relationship the buyer enjoy a higher buyer power, as the supplier is dependent on their customer to be able to profit from their investments.
• Branding reputation – If the customers demand products from a certain company, the suppliers to this company will become dependent on supplying to this particular company.
• Real-‐time demand information – Ownership of data, e.g. customer demand insight, could be practiced to increase a buying company’s power over its suppliers.
• Number of alternative customers – If the number of customers is few, the suppliers naturally depend on supplying to this or these few customers.
In a buyer power position the buyer has the ability to dictate the relationship with its suppliers. It can therefore be expected that short-‐term contracts, reduction of the supplier base, lower level of information exchange, less time on contract negotiation and less time on monitoring relationship performance be the result (Böhme et al., 2008).
However Böhme et al. (2008) also conclude in a study that surprisingly many suppliers were treated as partnerships, 37 per cent, rather than just as close suppliers or transactional-‐based suppliers. This implies that despite the buyer’s dominant position much focus is still on the relationship and not solely on achieving the best price. This is supported by Hallikas et al. (2005) study of a large Finish OEM company with high power over suppliers, where it is concluded that the investigated relationships are long-‐lasting and that both parties are strongly committed to the relationship.
In a situation where both supplier dependency and buyer dependency are relatively high the relationship tends to take a completely different shape. This interdependency situation, illustrated in the top right corner of Figure 4.2, mainly concerns strategic products. In such case the contracts are long-‐term, information sharing and openness is vital, production is tailored to fit the situation (Böhme et al., 2008) and collaborative practices of risk management and learning is stronger (Hallikas et al., 2005).
Measuring power The power structure between two companies will affect the nature of their relationship. Therefore, power will be used as a KPI when measuring the performance of the relationship. As stated in above, power originates from dependencies between the companies. Power is regarded as the inverse of the

53
dependencies meaning that if the supplier is very dependent on the buyer, the buyer will be the one with the power.
It is important to have in mind that large power distance does not automatically mean that the relationship is a bad one. As long as the powerful part of the relationship does not act upon its power a well-‐working relationship might still be kept. However, it is easier to conduct a well-‐working relationship between two parties of equal dependency due to the fact that integration between the two companies are more likely to be enabled leading to better supply chain performance. (Böhme et al., 2008)
When measuring power a different scaling will be used than the one for trust. The scale from one to five still remains but in the assessment the rank 3 will stand for power balance. To make it easier to understand the measurement can be referred to as buyer power meaning that a rank 5 will mean that the buyer got all the power and rank 1 will mean that the supplier got all the power.
4.2.3 Commitment Commitment concerns the willingness of the trading partner to put effort in to the buyer-‐supplier relationship (Mohr and Spekman, 1994). Rangan and Bell (2006) however describes it as a “pledge of continuity and adaptation of a long-‐term view, with the willingness to make investments and sacrifices to get there”. Therefore it can be seen as a declaration of future intentions to either maintain or improve the relationship.
Mohr and Spekman (1994) suggest that a high level of commitment from both parties involved in the relationship can lead to that both individual as well as joint goals can be reached without increasing the possibility of opportunistic behavior. This is mainly since committed partners will place more effort in balancing short-‐term problems with long-‐term goals. It is suggested by Little and Marandi (2003) that relationship commitment is directly related to the duration of the relationship, therefore the longer the relationship, the greater the commitment and or loyalty is. However, Hausman (2001) argues that the long-‐term endurance of a relationship is a consequence of the strength of the relationship. Rangan and Bell (2006) although suggest that trust between the supplier and buyer stimulates the development of commitment. Therefore, trust can build commitment and in turn commitment lays the foundation for trusting interactions between the two parties.
According to Giannakis (2007) there are three factors that affect the level of commitment: effort, loyalty and length of supplier relationship. Loyalty refers to the attachment and recurrence of interaction with the trading partner, whilst

54
effort refers to the tendency of the associate to maintain the business relationship. Length of the supplier relationship however refers to the length of the contract with the supplier.
Measuring commitment Commitment is one of the KPIs, which will be used to measure the performance of the supplier relationship. Several authors (Giannakis, 2007; Autry and Golicic, 2010; Bove and Johnson, 2001) point out that commitment is one of the main factors that contributes to a buyer-‐supplier relationship and thus can be seen as an important aspect to measure.
The three factors (effort, loyalty and length of supplier relationship) mentioned by Giannakis (2007) will be taken into consideration when measuring the level of commitment. As for the other indicators the scaling will span a ranking from one to five and shows how the buyer/supplier perceives the commitment of the other party. The rank of 5 is the highest level of commitment or; full commitment and adaptability whereas a rank of 1 is no commitment or adaptability. A rank of 3 therefore indicates that the supplier/buyer fulfills a basic effort in regards of commitment to the other party.
4.2.4 Transparency/ information sharing Transparency is defined by Cunningham et al. (2003) as the amount of information exchange between supply chain partners. According to Mohr and Spekman (1994) transparency refers to the “extent to which critical, often proprietary, information is communicated to one's partner”. Hsu et al. (2008) concur with this definition and state that information sharing/transparency can be either tactical (e.g. logistics, purchasing, operations scheduling) or strategic (customer and marketing information, corporate objective, etc.). As stated by Rangan and Bell (2006) a higher level of transparency involves knowing each other’s business plans and strategies and if such a foundation is present the parties can engage in a trusting relationship. They further argue that trust and transparency are very interrelated and can’t be achieved without one another.
As product lifecycles are continuously decreasing it has become increasingly important for organizations to find alternative ways to deliver and design high-‐quality products and services in a timely manner (Hsu et al. 2008). In order to accomplish this, the authors state that it is essential that adequate and sufficient information sharing remain between the two parties. Monczka et al. (2011) reason that transparency of critical information combined with joint efforts is essential to attain both incremental and breakthrough results beyond what each party can achieve. Mohr and Spekman (1994) further argue that closer

55
relationships can result in both more frequent and relevant information exchanges between the two parties. Furthermore, by understanding each other’s businesses and by sharing relative information the partners can act independently in preserving the relationship over a longer period (ibid.). Hsu et al. (2008) further suggest that information sharing can create opportunities for the two parties to work collectively to identify and eliminate inefficiencies in the supply chain, which in turn directly impacts the buyer-‐supplier relationship. Mohr and Spekman (1994) agree with this and further state that availability of relative information allows employees to perform different tasks in a more efficient way which leads to an increased level of satisfaction and therefore it is an important factor for a successful partnership. Crotts et al. (2001) state that if there is insufficient understanding regarding the factors that promote relationship development it can lead to a premature termination of the buyer-‐supplier relationship. Therefore, it can be seen that it is essential that both parties understand these factors and inform each other about the most important once in order to build a strong buyer-‐supplier relationship.
Angdal and Nilsson (2010) studies open book accounting, a term that in this case means a policy of high degree of data disclosure in long-‐term byer-‐seller relationships. They argue that another aspect of sharing cost data is that the partner becomes committed to keeping these costs and therefore the behavioral uncertainty is reduced.
Measuring transparency/ information sharing The importance of Transparency and information sharing in relation to relationship performance is mentioned by many authors (Rangan and Bell, 2006; Monczka et al., 2011; Cunningham et al., 2003) as an important factor to measure.
As for the other indicators, transparency will be measured on the scale from 1 to 5 where a rank of 5 is full transparency and information sharing, that is, the buyer/supplier shares all information with the other party whether it is information inside or outside of the boundaries of that specific relationship. This deep level of trust can also be called open book accounting. A rank of 1 is the reverse and indicates that there is no transparency or information sharing whilst a rank of 3 indicates that the trading partner only shares the information relevant to that specific relationship.
4.2.5 Cooperation Cooperation is defined by Crotts et al. (2001) as either similar or complementary actions that are taken by both parties within an interdependent buyer-‐supplier relationship in order to reach singular or mutual objectives. Hardy et al. (2005)

56
although define cooperation as “a cooperative, inter-‐organizational relationship in which participants rely on neither market nor hierarchical mechanisms of control to gain cooperation from each other”. Rolstadås et al. (1995) state that a buyer-‐supplier relationship characterized by cooperation comprises exchange of both market-‐oriented and technical ideas and in some cases even includes adaptations to a product process. They further suggest that cooperation can result in lead-‐time reduction as well as substantial savings in the material flow. One example of this is when a supplier and a buyer work closely together when introducing new products, which is done to achieve both high quality and low cost production of the product. Crotts et al. (2001) state that the interaction between: cooperation, trust and commitment can result in cooperative behavior which ensures that the relationship is beneficial for both parties involved.
Cousins et al. (2008) suggest that through cooperation, partners are able to profit substantially from rents, which can only be created if the parties work together. They further argue that the ability for an organization to generate these relational rents is dependent to some extent on how effective the supply function is in both leveraging and developing collaborative relationship with the supplier. However, it is essential that conditions are created so that both the buyer and the supplier can develop and contribute to the relationship.
Gadde, Håkansson and Persson (2010) argue that since parties within a buyer-‐supplier relationship have both shared and conflicting interests it is always characterized by both conflicts and cooperation. They further suggest a 2X2 matrix that describes relationship interaction characteristics in terms of cooperation and conflicts (Figure 4.3).
High Extent of cooperation
Low
Nice Creative
Marginal Hostile
Low High Level of conflict
A relationship characterized by low cooperation and high conflict is considered hostile and therefore not expected to last, unless it is considered valuable by one of the parties. However, within a relationship where both cooperation and conflict are low the relationship is considered unimportant for both parties.
Figure 4.3: Relationship interaction characteristics in terms of cooperation and conflicts (Adapted from Gadde, Håkansson and Persson, 2010:177)

57
Relationships characterized by high degree of cooperation are considered to be the most significant. If conflicts can be managed effectively an increased level of it can improve both product development and innovation. Conflicts can therefore be seen as an essential element in a working relationship. However, if the relationship scores high in cooperation and low in conflict it can be seen as being too “nice” which can imply that the parties place to low demand on each other.
Measuring the extent of cooperation As for the other key performance measurements the extent of cooperation will be measured on the scale from 1 to 5. A ranking of 1 indicates that the cooperation is insufficient whereas a ranking of 5 implies that there is full cooperation between the two parties. A score of 3 implies that the cooperation is on a basic level.
4.2.6 Communication Communication can be seen as the glue that holds the supply chain together (Mohr and Nevin, 1990). According to Mohr and Nevin (1990) communication allows a supplier to improve its performance in accordance to the buyer needs and thus and it is a key factor in the integration with the supply chain. Paiva, Phonlor and D’avila (2008) concur with this and state that since communication allows a supplier to improve its performance to correspond with the need of the buyer it plays an important role in the supply chain. Mohr and Nevin (1990) further suggest that by developing appropriate strategies for communication between the buyer and supplier the risk of problems or conflicts reduces substantially. This is mainly since conflicts are often caused by insufficient communication and therefore lead to misunderstanding between the two parties and mutual feeling of frustration. Moreover, timely and frequent communication between the parties can help to resolve disputes as well as align perceptions and expectations (Morgan and Hunt, 1994). According to Mohr and Spekman (1994) communication quality is the key success factor for any partnership. They further argue that the higher the communication quality is, when measured in terms of accuracy, adequacy, credibility and timeliness, the higher the level of satisfaction is within the buyer-‐supplier relationship.
Cousins and Menguc (2006) suggest that if communication is more personal and open it can enhance and increase the “prosperity” of the communication itself. They further argue that higher level of interaction and communication strengthens the supplier-‐ buyer relationship which in turn leads to improved performance. Mohr and Spekman (1994) agree with this and reason that honest and open lines of communication are essential for the relationship growth. Furthermore, they state that effective communication between the two parties is essential in order to obtain the benefits of collaboration.

58
According to Mohr and Nevin (1990), there are four factors that shape the communication integration and intensity between the buyer and supplier, these are: frequency, direction, modality and content.
Frequency – Frequency relates to how often communication occurs and the duration of that contact. Communication is although not considered to be better with increased frequency. This is mainly since both too high and to low frequency can lead to less optimal results in communication. Too little communication and the efforts in the relationship are not coordinated enough but on the other hand, too much communication and the members of the organization becomes overloaded with information. Therefore one should not only consider the amount of information exchange but also the amount of information necessary to exchange.
Direction – In communication between organizations the information flow can follow a hierarchical structure and flow from the more powerful organization to the one lower in structure or it can flow freely in both directions. It is often difficult to clearly specify if one organization is more powerful than the other. Therefore Mohr and Nevin (1990) focuses on if the information is “unidirectional”, flowing in one direction or if it flows in both directions, “bi-‐directional”. When the information flows in both directions problems in the relationship can usually be discovered earlier and thus can be resolved more easily.
Modality – Modality is the way in which the information is sent between organizations. Mohr and Nevin (1990) suggest that one way to define modality is to categorize the modes as formal or informal. The main difference between these two is that the formal modes have a routine connected to them, whereas the informal does not. The information shared is structured in a specific way and thus there is a predefined way in which the mode or channel should be used. This usually refers to written communication or formal meetings. Informal communication is not structured and is more “spontaneous”. This occurs in informal meetings or word-‐of-‐mouth contacts.
Content – The actual information being communicated is the content in this case. Mohr and Nevin (1990) have chosen do divide the content in direct or indirect communication. The purpose of direct communication is, to some extent, to alter the behavior of the partner. For instance, by sharing information about sales and inventory a buyer can help the supplier to balance production. The indirect communication has the purpose of changing the behavior of the partner in a more indirect way. Examples of this can be discussions about future strategy. This will

59
not cause a direct change in how the partner works but might change the behavior in a long-‐term perspective.
Measuring communication Communication is regarded by many authors (Mohr and Nevin, 1990; Mohr and Spekman, 1994; Cousins and Menguc, 2006) as one of the main factors that contribute to a high performance buyer-‐supplier relationship. Therefore, it can be seen as a critical aspect to measure.
The four factors (frequency, modality, direction and content) identified by Mohr and Nevin (1990) will be taken into consideration when measuring communication. These factors are considered to reflect the overall quality of the communication and thus it will be considered from that aspect.
When measuring the level of communication, a rank of 5 represents high quality communication between the two parties whereas a ranking of 1 indicates that the quality is poor. The scaling of 3 therefore implies that the communication is of medium quality.
4.3 Correlations between KPIs As previously mentioned correlations and interdependencies exist between the different relationship KPIs (Figure 4.4). Starting off, there is a correlation between trust and power that is rather one-‐sided. In a relationship where the power distance is large, the trust will be harder to achieve than when there is a power balance. This might be due to the fact that trust is defined as “one party’s belief that the other party in the relationship will not act opportunistically and not exploit its vulnerabilities even when such exploitation would not be detected” (Stuart, Verville and Taskin, 2012) and if there are no major vulnerabilities the trust is more likely higher.
Regarding the trust and transparency there is a two way correlation. If the trust is high the companies are more willing to share information and at the same time if the companies are willing to share information it is more likely that trust between the companies will increase.
Regarding commitment and trust there is the same correlation as above. If the a company shows great commitment the other company is more likely to trust them and if there is trust in the relationship the likelihood of committed companies increases. A similar scenario can be seen between commitment and transparency.
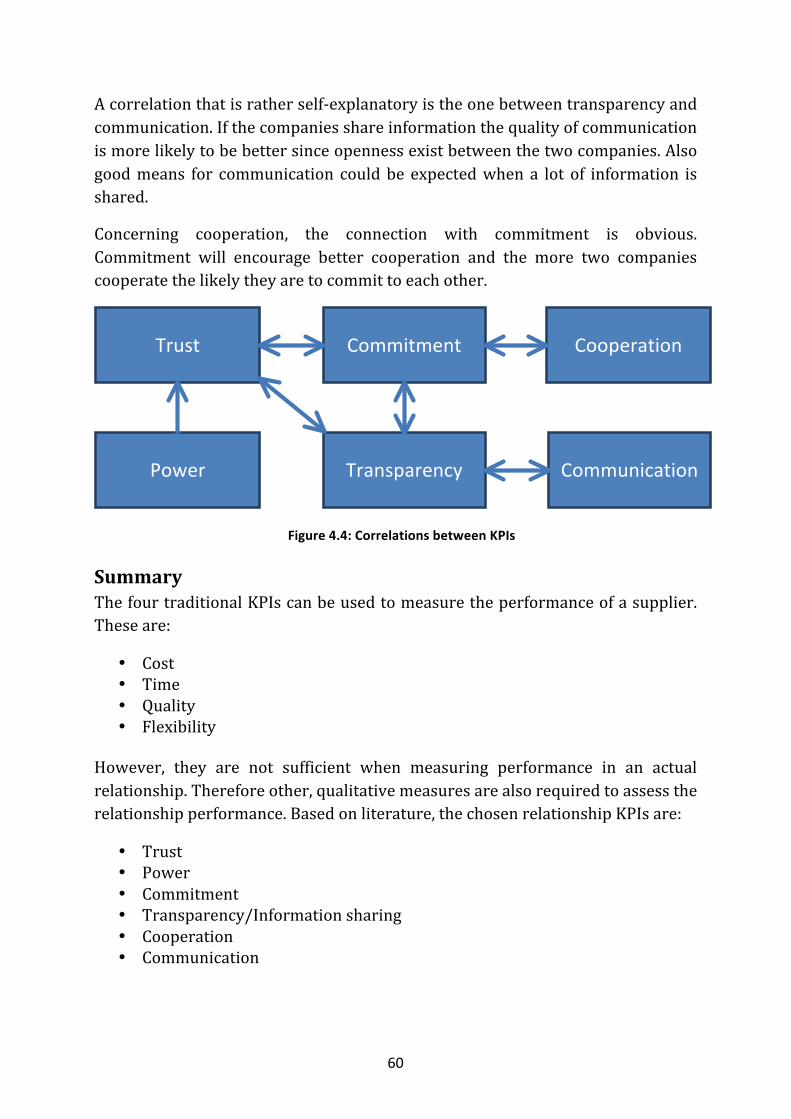
60
A correlation that is rather self-‐explanatory is the one between transparency and communication. If the companies share information the quality of communication is more likely to be better since openness exist between the two companies. Also good means for communication could be expected when a lot of information is shared.
Concerning cooperation, the connection with commitment is obvious. Commitment will encourage better cooperation and the more two companies cooperate the likely they are to commit to each other.
Summary The four traditional KPIs can be used to measure the performance of a supplier. These are:
• Cost • Time • Quality • Flexibility
However, they are not sufficient when measuring performance in an actual relationship. Therefore other, qualitative measures are also required to assess the relationship performance. Based on literature, the chosen relationship KPIs are:
• Trust • Power • Commitment • Transparency/Information sharing • Cooperation • Communication
Trust Commitment
Power
Cooperation
Transparency Communication
Figure 4.4: Correlations between KPIs

61
These are all in some way interrelated, but still important to assess individually to get a good grasp of the characteristics of the relationship. It is believed that there is an interrelation between the traditional KPIs and the relationship performance KPIs in a way that if you improve the relationship you will be able to reach better performance in Cost, Time, Quality and Flexibility as well.

62
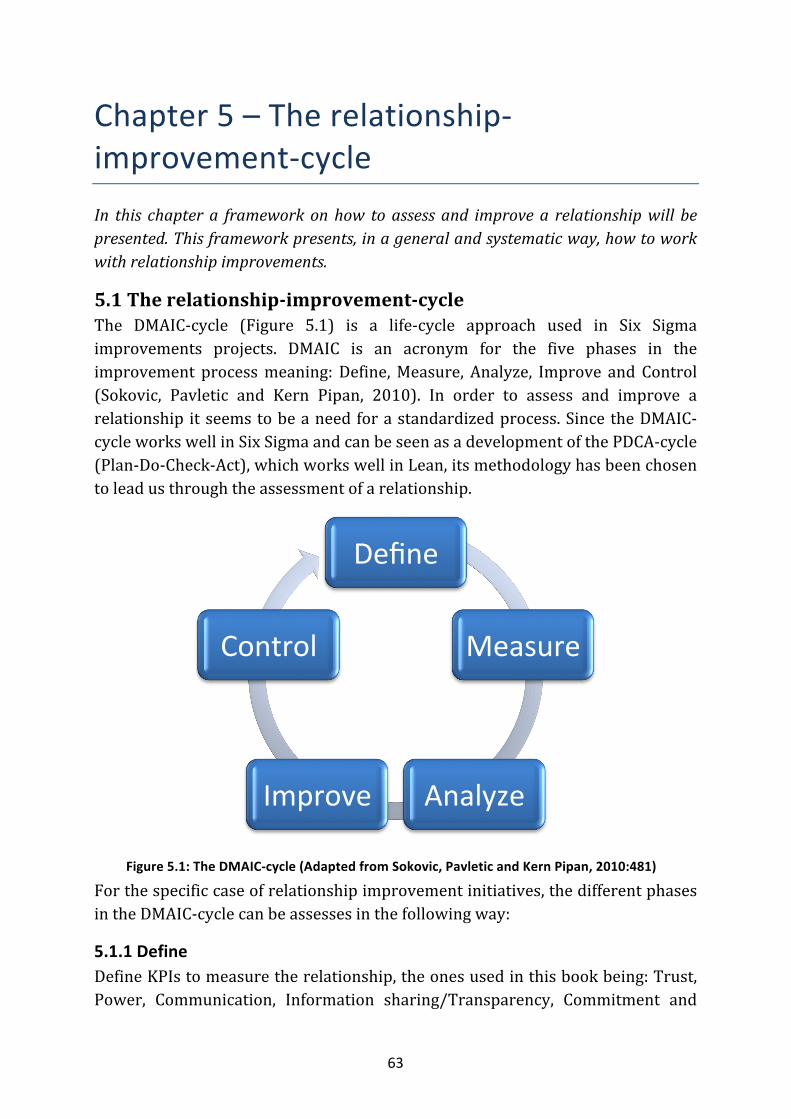
63
Chapter 5 – The relationship-‐improvement-‐cycle In this chapter a framework on how to assess and improve a relationship will be presented. This framework presents, in a general and systematic way, how to work with relationship improvements.
5.1 The relationship-‐improvement-‐cycle The DMAIC-‐cycle (Figure 5.1) is a life-‐cycle approach used in Six Sigma improvements projects. DMAIC is an acronym for the five phases in the improvement process meaning: Define, Measure, Analyze, Improve and Control (Sokovic, Pavletic and Kern Pipan, 2010). In order to assess and improve a relationship it seems to be a need for a standardized process. Since the DMAIC-‐cycle works well in Six Sigma and can be seen as a development of the PDCA-‐cycle (Plan-‐Do-‐Check-‐Act), which works well in Lean, its methodology has been chosen to lead us through the assessment of a relationship.
For the specific case of relationship improvement initiatives, the different phases in the DMAIC-‐cycle can be assesses in the following way:
5.1.1 Define Define KPIs to measure the relationship, the ones used in this book being: Trust, Power, Communication, Information sharing/Transparency, Commitment and
Define
Measure
Analyze Improve
Control
Figure 5.1: The DMAIC-‐cycle (Adapted from Sokovic, Pavletic and Kern Pipan, 2010:481)

64
Cooperation. The definition-‐phase should be done together with the supplier since it is important to use the same KPIs if having a transparent evaluation of the relationship. The cooperation at this level will also lead to a feeling of being a joint effort initiative meaning both companies can gain something from this initiative. In the definition there also need to be a scaling or ranking of each KPI as an initiative to make the qualitative measure’s more quantitative to get a better assessment of the relationship.
5.1.2 Measure This measure should be performed without cooperation between the companies in order to get an independent view from both companies. It is important to align the views of the company in order to get a holistic view. This will require cross-‐functional work since different interpretations of the relationship might be present in different business units. Honesty is of vital importance in order for this effort to result in significant improvements. As the more powerful actor, it is especially important to emphasize that the less powerful one can be honest without endangering the relationship.
5.1.3 Analyse Analyze the result of the measurement by analyzing the following questions:
• Why are we here? • Where do we want to be? • What can we do to improve? • How do we get to the desired state?
This part should also be performed by the companies individually, without communication between the two parties, since this is where each company sets up their own objectives for this improvement effort.
5.1.4 Improve This needs to be done in cooperation to reach desired results. Since both companies have done its own analysis this is the first time a sharing of the results takes place. It is important to have an open discussion about each other’s results. This is done in order to reach compromises and align objectives in accordance to both the future scenario and the assessment of the importance of each KPI of both companies. In this state, power will have a large effect on which of the two companies get most of their objectives recognized. To have a mutually nurturing of the relationship it is important to find win-‐win solutions for the initiative to be sustainable.

65
5.1.5 Control Did the companies reach the desired state or do we have to re-‐do the circle? If a desired state has been reached it is now important to work with sustaining them. This can be executed by setting work-‐standards that emphasizes the new work habits and make this change part of the company culture. The culture-‐aspect is emphasized in order to not rely on a specific employee in the own company or at the supplier. One should also keep a dialogue with the supplier to reinforce that the changes are sustained. The control-‐phase is the hardest and most crucial part of the improvement cycle and needs to be thoroughly considered for the work not to be in vain.
From these descriptions above the relationship-‐improvement-‐cycle has been extracted (Figure 5.2). The cycle can be used as a systematic way of working with improvements in a relationship. In order to make this work, each step needs to be performed thoroughly.
With this general model an exhaustive evaluation is possible. To extend this research a more concrete model of the Measure and Analysis phase is presented below.
“Through this model we are able to assess the relationship performance and how to work towards a common goal” -‐ Representative from company A
Define and scale/rank the KPIs
Measure the KPIs
Analyze the relafonship
Improve the relafonship
Control and sustain the results
Figure 5.2: The relationship-‐improvement-‐cycle

66
5.2 Measuring the performance It is not possible to measure the performance of a relationship objectively without taking the perspective of one of the actors (Medlin, 2003). The following method will therefore require a perspective but it can be used in the same way regardless of which perspective is chosen (supplier or buyer). Another identified factor is the importance of individual KPIs. The importance of these can be used as a weighting factor to help determine which KPIs to focus on. The weighting in combination with the grade achieved in each parameter can be used to identify focus areas. A KPI that grades low and has a high importance (high weighting) gets a higher total grade indicating that this KPI might be a focus area. Similarly, if a KPI gets a low grading but its importance is low, the total grading will decrease, indicating that resources might be used more efficiently trying to improve other factors.
This method of measuring is explained by Sundtoft Hald and Ellegaard (2010) and is displayed in Table 5.1 below. The model is well suited for more traditional, quantifiable KPIs. The grade and the weighting can be used to calculate a total grade for the supplier and if the KPIs are standardized and tangible this model can be used to compare suppliers with a single number. The performance on each KPI is graded on a scale of 1-‐5 and the importance is weighted in percent. Another way of describing the weighting is by having 100 points distributed between the KPIs.
However, this model is less suitable when dealing with more qualitative KPIs, such as the ones used in this book when evaluating a relationship. For instance, in a relationship it is not necessarily desirable to achieve a high grade on a certain
Company A–supplier evaluation Supplier: XXX Supplier no: XXX Product: Electronics Contact person: Employee x Rated by: CM, PD, and OP
Rating: 1. Excellent 2. Good 3. Average 4. Not satisfactory 5. Not acceptable
Rating Q2–200X Grade Weight (%) Total
A Product quality 4 25 1.00
B On-‐time-‐delivery 5 25 1.25
C Cooperation 2 15 0.30
D Environment 1 10 0.10
E Total cost development
5 25 1.25
Total Grade 3.9
Table 5.1: A performance measurement method. Sundtoft Hald and Ellegaard (2010:894)

67
KPI. Achieving a high grade usually takes effort and needs a dedication of resources. As an example, communication between the supplier and buyer takes time and effort and therefore it is also important that the communication adds value to the relationship. It is not a purpose of its own to strive for the highest grade in all KPIs.
Another factor that makes this model less suitable for evaluating the relationship is that the aspects measured are less quantifiable and therefore a total grade based on the performance of each KPI is not necessarily comparable to a similar number in a different relationship. All relationships are unique and different measurements are not of the same importance.
The new design of the model for evaluation does not only use a grade on each KPI but also takes into consideration the desired state. Adding the desired state to the model becomes a method of addressing the problem previously described, that a larger number is not necessarily better. It also formalizes a way of setting goals for each KPI to work towards. In the case of relationships, an improvement means moving closer to an actual target. The model presented in this book is used in a similar way as the model presented in Sundtoft Hald and Ellegaard (2010). Once the current and desired state has been identified each KPI receives a weighting in the same way as in the model presented by Sundtoft Hald and Ellegaard (2010).
KPI Current State Desired State Weighting (%) KPI 1 3 4 50 KPI 2 4 3 50
5.3 Analysing the results The results of the measurement will be analyzed, the first step being to apply a mathematical formula to calculate the total importance of improvement for each KPI (Table 5.3):
!"##$%& − !"#$%"& ∗!"#$ℎ!"#$ = !"#$%
KPI Current State Desired State Weighting (%) Total KPI 1 3 4 50 -‐0,5 KPI 2 4 3 50 0,5
By combining the current and desired state, this model can be used to analyze any set of KPIs for the purpose of identifying focus areas. The value on the particular KPI measurements can be positive or negative, depending on how the
Table 5.2: The measuring model
Table 5.3: The measuring model with total importance of improvement

68
actual and the desired states are believed to be in relationship examined. A positive value reveals that the current state is higher than desired meaning this factor might consume more resources than necessary, and should therefor be decreased. These resources might be better utilized on improving KPIs that receive a negative value, which means that the current state is below what is believed to be desired.
Whether the value is positive or negative, being furthest from zero should be the ones to focus on hence should be addressed first. Therefore this model can be used as a strategic tool to help deciding where to focus resources. This is where the weighting adds value to the model. If it is to be used to focus resources it is desirable to have a model that not only points to the differences in current and desired state, but also the importance of each KPI.
By presenting the values in a graph, the results becomes more transparent as it it easier to assess which areas are important. This is illustrated below, using company C as an example.
5.4 The model applied to company C During the interview, company C graded one of their relationships in the following way, using the KPIs that were explained in chapter 4 (Table 5.4).
KPI Current State
Desired State
Weighting (%)
Total
Trust 4 5 20 -‐0,2 Power (Buyer power) 4 5 10 -‐0,1 Communication 3 3 20 0 Transparency/Information Sharing
3 3 10 0
Commitment 4 5 20 -‐0,2 Extent of cooperation 4 5 20 -‐0,2
By plotting the values in a graph (Figure 5.3) the focus areas becomes visible. The goal is to have a flat line at Y=0. To achieve this, company C first needs to focus on Trust, Commitment, and Cooperation as they are currently underperforming in these areas.
Later in the improvement-‐phase, it will be valuable to compare the results, as can been seen in Figure 6.3 in Chapter 6, with the results from the supplier. By comparing the two graphs, differences in the view of the relationship can be identified. If there are substantial differences the partners will have a discussion
Table 5.4: The measuring model applied on company C

69
and openly discuss the different views and try to conclude what the cause of the differences is and how to work with them. How to use this method will be further explained further in chapter 6.
Summary ”The relationship improvement cycle” is an iterative step-‐by-‐step process to assess and improve relationships. The five steps are:
1. Define and scale KPIs 2. Measure the KPIs 3. Analyze the relationship 4. Improve the relationship together 5. Control and sustain the results
The most important thing is to see the improvements as a joint effort between the two parties involved and to be willing to find win-‐win solutions.
One way to measure the KPIs chosen in step one is to use a tweaked version of the rating-‐system designed by Sundtoft, Hald and Ellegaard (2010). By combining the importance together with the current state and the desired state, it is possible to find out which KPIs are most important to assess by using the formula:
!"##$%& − !"#$%"& ∗!"#$ℎ!"#$ = !"#$%
Figure 5.3: The graph resulting from the measuring method

70
The graph resulting from this formula provides visualization over which KPIs to assess first.
The relationship-‐improvement-‐cycle is a standardized way to assess and improve relationships between two parties. It has been described by representatives from industry as a way to systemize their everyday work. The cycle describes the work with relationships in general terms but when used with the KPIs defined in chapter 4 however, and together with the assessment tools and the graph presented in this chapter a more concretely defined method is described.

71
Chapter 6 – Applying the model on company A and company B This chapter makes use of the model presented in the previous chapter and apply it on the dual relationship perspective of the studied companies A and B. This provides interesting similarities and discrepancies in the supplier’s and the buyer’s perspectives of their relationship. The chapter is limited to the measuring and analyzing events and is concluded briefly with recommendations of improvements.
6.1 Company A The dynamic business environment today puts a different pressure on companies then it did in the past. Mentioned in chapter 1, these dynamics puts a bigger emphasis on interaction and transparency between companies working in the same chain. Since there is a trend of focusing on the core competence, one has to know the suppliers as well as what buyers the company interacts with. As in the case of company A, they too have a focus on low cost and high efficiency internally to be competitive. In an overall perspective, the theoretical findings mentioned above is in line with how the company perceives their environment.
6.1.1 Trust Besides having a cost focus to stay competitive, a well-‐functioning and mutual relationship is believed to be beneficial. Besides Cooperation, Trust is perceived at the most valuable KPI to measure when analyzing how the relationship is working. It was suggested that a high level of trust enables other parameters to improve and that the trust-‐aspect also limits other parameters performance. Trust is therefore considered the key KPI from a relationship measurement standpoint. Besides this fact, companies are focusing on their core competencies to a larger extent now than before as mentioned in chapter 4. Due to this trend, the trust-‐aspect becomes increasingly important. How to leverage the trust depends on the context of the company. If having large influence on a supplier, the initiative of being trustworthy probably have to come from the buying company by showing a greater deal of trust towards the smaller supplier. As highlighted by company A, trust is easier developed through a good match in personal chemistry between the interacting parts. Sometimes it could be fundamental differences between the purchasers at a buying firm and the sales personnel at the supplying firm. If personal differences are present in purchasing-‐sales relationships it is difficult to establish and build trust. As noted in Table 6.1,

72
company A believes in developing as much trust as possible in order to excel together.
6.1.2 Power Company A believes in having a slight power advantage. The term power is however hard to do anything about and depends on the context. Having a power advantage could help facilitate contract negotiations and keep emphasis on price. If the power is balanced or even in the favor of the supplier, price has to be discussed in relation to several other parameters of a contractual agreement. If being the only customer to a certain supplier, it is obvious that the buying firm has leverage in the power distribution. However, being the only customer implies being responsible for that company not going bankrupt. Furthermore, it could be hard to reduce the power distribution by extending the supplier base if the switching cost to partly source from another supplier exceeds the gains. Company A believes that power “is what it is” and hard to do anything about, therefore being less relevant to measure.
6.1.3 Communication As highlighted by Mohr and Nevin (1990) in chapter 4, communication is perceived as the glue holding the supply chain together. Argued by Paiva, Phonlor and D’avila (2008), communication allows a supplier to improve its performance to correspond to the need of the buyer and therefore plays an important role in the relationship dynamics. In the case of company A, they believe that the communication works efficient and should in an optimal state be clear, efficient and sufficient. It could be put in relation to the resource dedication of communication, or more precisely the cost for communication. If well executed it could drastically improve the performance of a relationship. If the information is accurate and the communication is efficient, a rather high level of communication is generally appreciated. However, low or no communication could imply that everything is working well and there is no particular need for communication. The desired state goes in line with this thinking, as it is desirable to only have accurate information. It should be clear, efficient and sufficient to minimize the misinterpretations and misguided work efforts.
!"#$% &''" "()%)*+ ,)%-()./012/ 3'4 5 6"7890 64 5 5
:7;;1<#:=/#7< &'4 5 6/0=<2"=09<:>?#<@7AB2C=0#<D &'4 5 5
:7;;#/;9</ 64 6 6:77"90=/#7< 5'4 5 6
Table 6.1: Measuring company A
73
6.1.4 Transparency/Information sharing Although company A consider it beneficial to know as much as possible about a supplier, it is not a purpose of its own to have full transparency for several reasons. The most obvious being a trust issue, but another highly applicable obstacle could be the capacity to act upon information. If information is provided by a supplier, the buyer is expected to take action and act upon the information, which could be time consuming and unnecessary. Still some supplier-‐relationships are considered to have a high degree of transparency. Those are also the ones with a high level of trust, where mutual strategic actions are discussed as well as the development of the market. Therefore, it is suggested to keep the transparency on a high level but with some restrictions in order to not get into unnecessary time-‐consuming activities presented above.
6.1.5 Commitment Although company A understands that both parties could benefit from dedicated solutions, the commitment is often best kept on a functional basis. This means to invest in the necessities to keep the relationship efficient, without over-‐investing. It is however important to keep in mind that investing in the necessary still implies to invest continuously since the relationship and the environment changes rapidly. Relating commitment to trust, company A considers trust as a highly important factor since it can be hard to commit if the trust between the parties is weak. Therefore to increase the commitment one first has to increase the trust. Following the same reasoning, it is fair to believe that commitment, just as trust, is developed over time. The longer a supplier has been in a relationship, the more committed he is to invest in dedicated solutions. It is important to commit appropriately, meaning the better the parties know each other and how they function the easier it is to commit to the best adaptations.
6.1.6 Cooperation Company A believes that the supplier is strategically important to them, and a high degree of cooperation is therefore vital. The relationship is also believed to be strengthening over time, which is in line with theoretical findings and highlighted in chapter 4 through Giannakis (2007), and is closely related to communication as a pre-‐requisite. To execute relationship-‐relative actions or for example to find errors might be easy. However, the cooperation comes into play when it comes to dedicating the right person to the task, get it done and conduct follow-‐up events.
The extent of the cooperation-‐KPI is somewhat a summary of the other parameters and in a way grasps a total of the other KPIs. It is therefore desired to have a certain high level of cooperation, although not necessarily full cooperation,

74
as this parameter is directly related to the cost of such an initiative. To improve cooperation one has to work with the other parameters.
Mapping company A, here noted as “Buyer” (Figure 6.1), depicts which areas of attention to focus on. There are clearly a few key insights to extract from the illustration. First and foremost there are not any areas where the company believes it is “too good” or over-‐performing. Instead, it is believed to under-‐perform in some areas and perceived as being at the desired level in half of the measured KPIs.
The main focus areas should be “Trust” and “Cooperation” as they have the weakest results. The reason for these dramatic results is the ranked importance. The higher importance is believed to be (Trust being 30% and Cooperation being 40%) the more volatile result.
6.2 Company B This section presents a mapping of company B, as well as why they have ranked the KPIs as they have.
6.2.1 Trust Trust is considered to be of great importance and thus there should be a constant focus on having a high level of trust with customers. In a perfect world full trust is desired, however not always feasible. Regardless of today’s level of trust, the
!"#$%
"%
!"#&%
"% "%
!"#'%!"#'%
!"#$%
!"#(%
!"#&%
"%
"#&%
"#(%
)*+,)% -./0*% 1.22+3415)4.3% )*53,-5*03167438.9%,:5*43;%
1.224)203)% 1..-0*5)4.3%
!"#$%&
Figure 6.1: Mapping of company A’s view of the relationship

75
KPI's 100P Present DesiredTRUST 15% 4 5POWER 15% 4 3
COMMUNICATION 15% 3 5TRANSPARENCY/INFO. SHARING 15% 4 4
COMMITMENT 10% 4 4COOPERATION 30% 3 3
ambition should always be to improve it, even though the way to get there is not always clear.
6.2.2 Power The company considers power to be as important as trust, communication and transparency (table 6.2). Power distribution depends on the market climate and one cannot simply say that the power distribution is constant over time. In times of good supply availability the buyer has leverage over the supplier and vice versa. Furthermore, a balanced distribution of power would most likely be most beneficial for the relationship in the long run, and thus it should be a goal to strive towards. Although, the company sees the advantages which supplier power can bring even if it would not necessarily be practiced.
6.2.3 Communication In relation to strategic customers/suppliers the company considers communication to be inevitable, especially when volumes are high and transactions are many. Daily contact is common for transactions and negotiations to function. Even though the contact is extended it is not necessarily executed in the best way and there is a great potential in improving the quality of communication. Furthermore, in regards to company A, communication is believed to be very important and thus it is very frequent (every day in one way or another). This is mainly since company A is considered an important client and since their forecasts are fairly inaccurate. In some cases the company produces too much and sometimes the warehouse gets empty too fast. Due to this reason, the information sharing and daily communication is vital in order to reduce uncertainties as much as possible.
The company further states that there are periods of instability in communication where matters are discussed over and over again. For example guidelines for claims and returns could be structured and communicated one way from the supplier and still the buyer fails to comply, which requires additional communication of the same matter. This instability is most often known by both parties, but not prioritized by the buyer. From the supplier’s perspective it would
Table 6.2: Measuring company B

76
be highly appreciated if the buyer could arrange such matters to avoid over-‐communication.
6.2.4 Transparency/information sharing The company believes that it is good to have a certain level of transparency. Many times transparency is more important in terms of showing the buyer that the company is open and honest. Problems in being transparent and sharing information often come from difficulties in acquiring information, even internally. For strategic relationships in particular, the company states that the ambition is to be transparent and share information. Therefore matters concerning production, future investments or other strategic plans must not always be kept internally. Still full transparency or information sharing is not necessary and probably not feasible, especially for public companies.
6.2.5 Commitment According to the company, commitment can be illustrated in terms of investment in the relationship and adaptations towards a particular counterpart of business. For strategic relationships, continuous investments are a cornerstone in the evolution of the relationship. Therefore a high level of commitment is appreciated. Full commitment is however neither possible nor desired, as this could lower the business focus in a relationship and by that be an obstacle for the individual and mutual development of the firms. Company B further states that there are certain pre-‐requisites of the relationship for committing and carrying the risk of investing. The most obvious ones are the long-‐term perspective of the relationship, where it is easier to justify investments if there is a mutual interest of continues doing business over time. Another pre-‐requisite is that there must be a “win-‐win” understanding within the relationship. In order to, collaboratively, get the most out of a business relationship a good way is to show that the company is willing to invest and adapt. Still, one part of the relationship cannot simply take without giving back. A good relationship is built on long-‐term commitment and on continually giving and receiving as in any other relationship. It is hard to build working relationships on short time frames, therefore, companies focusing on short-‐term prices and gains are not relevant to engage with. For a supplier this means to not expose the own company and invest without having a dedication from the customer to mutually share benefits from such investments. The optimal situation would be to commit in a way that would benefit the customer and at the same time get paid for their actions.
6.2.6 Cooperation As can be seen in table 6.2, company B considers cooperation as the most important aspect when measuring the supplier relationship performance. Since

77
the market is under substantial price pressure, cooperation is important and desired to help align the company with its buyers, as well as suppliers. When the supplier and the buyer are of similar strength in a relationship the cooperation is not necessarily high. It could even be argued that full cooperation would not be good for the business. Taken from a supply chain perspective it is just as important to perform well individually as it is to perform well together. If the cooperation exceeds a certain level there is a risk of weakening the competitiveness of the relationship. By having engaged parties, trying to maximize the performance of their own business is many times more constructive for the relationship. To yield the best performance of a relationship, both parties must have profitable businesses seeing to a long-‐term perspective. This is best achieved by cooperating but always consider one’s own company first.
The results from table 6.2 are illustrated in Figure 6.2. As can be seen the factors that are either considered to be under-‐ or over performing are: trust, power and communication. Since the main discrepancy is for communication (-‐0,3) the company and its supplier should focus on improving that aspect.
6.3 Merging the results When the rankings are merged into one graph it is possible to see similarities and discrepancies of their individual rankings. In Figure 6.3, the supplier-‐ and buyer-‐ranking of the same relationship is illustrated. At first glance one could say that the overall perception of the relationship is quite similar. Two KPIs are balanced
!"#$%&
"#$%&
!"#'&
"& "& "&
!"#(&
!"#'&
!"#)&
!"#$&
"&
"#$&
"#)&
*+,-*& ./01+& 2/33,4526*5/4& *+64-.6+14278549/:&-;6+54<&
2/335*314*& 2//.1+6*5/4&
!"##$%&'(
Figure 6.2: Mapping of company B’s view of the relationship

78
at zero and another two KPIs indicate the same perception, although with different magnitude of importance. In cases where the present performance corresponds to the desired performance and where both actors have ranked the KPIs similarly, focus should be to maintain the performance continuously. No KPIs must be regarded as fulfilled, as the relationship is ongoing. Where both actors consider improvements to benefit the relationship the actors should discuss areas of improvement. As the perception of actual and desired performance is unified, discussing the topic with the other part will be constructive for the relationship. Constructive discussions might very well yield other benefits as well, as it brings the companies closer together out of mutual interest. Where the perception is deviating the discussions could still be constructive if focus is on why the different parties have ranked certain KPIs differently. This could bring a better insight in how the counterpart perceives aspects of the relationship.
Starting with the zeros it is notable that they are not only considered to function well at current state in relation to the desired state. They are also considered fairly similar in absolute terms for both the supplier and the buyer. Table 6.3 illustrates the rankings of these two KPIs.
Figure 6.3 reveals two areas of improvement, namely trust and communication. Trust is, as argued in previous chapters, difficult to affect, it comes naturally if other parameters are improved and it is often developed over time. To increase
!"#$%&
"#$%&
!"#'&
"& "& "&
!"#'&
"&
!"#$&
"& "&
!"#(&
!"#%&
!"#(&
!"#'&
!"#)&
!"#$&
"&
"#$&
"#)&
"#'&
*+,-*& ./01+& 2/33,4526*5/4& *+64-.6+14278549/:&-;6+54<&
2/335*314*& 2//.1+6*5/4&
!"#$%&'&("))*+$%&%$*,-./01+)&
=>??@ABC& D>EBC&
Figure 6.3: Comparing the two companies’ view of the relationship

79
the development of trust, show trust towards the counterpart through KPIs, such as using power in a constructive way, commit to the relationship and be transparent.
The high ranking of transparency/information sharing and commitment indicates the long-‐term focus of the relationship. The buyer actually ranked commitment as the overall best performing KPI, emphasizing both their own dedication to the relationship as well as their perception of their supplier’s dedication.
Commitment, in particular, could be expected to rank quite high in any strategic relationship. However it depends much on the context of the relationship. In the same buyer’s ranking of two other strategic relationships the ranking was remarkably lower for transparency/information sharing and commitment (Table 6.4).
The result is of course affected by who is ranking the KPIs and how the interview object perceives the KPIs and their grading. The three different relationships of the buyer are all considered to be strategic relationships, but they differ in products and context.
Communication however is easier to approach and work with. It comprises two aspects, the volume and the quality. Communication, as ranked in this study, refers to the qualitative aspect and puts less emphasis on the volume. Still volume can in a way be affected if quality is improved. In all studied relationships communication was considered to underperform in quality, even though many
!"#$%&'()* +%*,*(& -*,.%*/ !"#$%&'()* +%*,*(& -*,.%*/01230 456 7 8 986 7 8+:;<1 86 7 7 986 7 4
=:>>2?!=@0!:? 956 7 8 986 4 801@?3+@1<?=AB!?C:DE3F@1!?G 956 7 7 986 7 7
=:>>!0><?0 86 8 8 956 7 7=::+<1@0!:? 756 7 8 456 4 4
=$"#'(HE@EIE=$"#'(HEJK+! JLH*%EM=$"#'(HE@N 3L##O.*%EM=$"#'(HEJN
!"#$%&'()* +%*,*(& -*,.%*/ !"#$%&'()* +%*,*(& -*,.%*/01230 456 4 7 586 4 9+:;<1 56 5 7 56 7 7
=:>>2?!=@0!:? 456 9 5 486 7 501@?3+@1<?=AB!?C:DE3F@1!?G H86 4 7 H86 7 7
=:>>!0><?0 456 9 9 H86 4 9=::+<1@0!:? H86 4 7 56 9 9
I+! 1*J'&.$(,K.#E4ELMNO*%P,E#*%,#*)&.Q*R 1*J'&.$(,K.#E9ELMNO*%P,E#*%,#*)&.Q*R
Table 6.3: Ranking for Relationship 1
Table 6.4: Company A ranking two other relationships

80
actions were taken to improve it. To improve the quality of communication it is important to set clear frames for communication. These communication frames are best discussed between the actors in a relationship. They should include routines for what and to whom communication is directed. They should furthermore take into account the different levels of the companies and by that clarify matters to be discussed at different hierarchical levels. Managers are typically bothered with matters that very well could be solved at an operational level.
Power and cooperation (Figure 6.3) are the two KPIs deviating in perception. In the case of power, the buyer is satisfied with a slight overhand, as perceived by both parties. The supplier on the other hand would rather see a balanced situation. If a balanced situation would be reached the supplier might feel more comfortable in negotiations. For the buyer on the other hand they could get a feeling of losing a part of the suppliers specific dedication to the business as other customers would probably increase in importance for the supplier. If the supplier decides to develop its business to include more customers a constructive way to do so would be to present and discuss this development with the buyer to avoid negative effects on other relationship KPIs, such as trust, communication and cooperation.
Cooperation is deviating substantially, mainly because of the high ranking of importance (40%) by the buyer. Although an increase from 4 to 5, as ranked by the buyer, might not seem much, the importance still emphasizes the buyer’s interest in this particular KPI. Perhaps different perceptions of the KPI are the reason to the magnitude of deviation. In such case it is important to understand how the two parties have perceived the ranking and even more important to understand why the buyer decided to give it such importance. This could be revealed following the discussion from the previous section, where the supplier appreciates lively discussions in a cooperative environment, whereas the buyer in a way considers this KPI to be representative for the overall perspective of the relationship.
To summarize the discussion above a number of possible actions towards the relationship development are given:
• Discuss interpretation of cooperation to balance perspectives • Monitor transparency and commitment, and assure that they evolve
accordingly with the relationship • Set communication frames to avoid having underperforming exchange of
information

81
• To assess a strong relationship, earn the trust of your partner and he will respond with putting more trust in you
• Discuss how shifts in power distribution would affect the relationship and use it as constructive fuel to the business
By plotting several relationships as noted in Figure 6.4, the result could generate important insights, as in this case. One could conclude that the three relationships are perceived to be functioning in a similar way. In the case of company A, it should definitely be a focus to assess how trust and communication can be increased. Since these KPIs have similar results in the three relationships studied, there might be problems internally. The resource-‐dedication could have wrong focus since several KPIs are under-‐performing. The illustration shows in an overall manner how well the relationships are performing at present from the buyer’s point of view. This illustration is therefore a guideline to find areas of attention.
Summary No KPI can be regarded as fulfilled. They should always be monitored since they are ongoing and develops over time.
!"#$%
"%
!"#&%
"% "%
!"#'%
!"#(%
"#"(%
!"#(%
!"#)%
"%
!"#)%
!"#(%
"%
!"#)%
"%
!"#&%
"%
!"#*%
!"#(%
!"#'%
!"#$%
!"#)%
!"#&%
"%
"#&%
+,-.+% /012,% 3044-5637+605% +,75./7,2538965:0;%.<7,65=%
30446+425+% 300/2,7+605%
!"#$%&'(%)*+,*-(./(01%$$(2,3$%$*0(%$4)5.*'1,6'(
,>?@ABCDEFG%&%
,>?@ABCDEFG%)%
,>?@ABCDEFG%$%
Figure 6.4: Company A’s view on three different relationships

82
The two companies have similar ranking of the six key performance indicators. Trust is believed to be of central importance as it relates to the others in one or more ways. As cooperation is believed to be a summary of the other KPIs as well, it is also of importance in order to have a clear understanding on how the relationship is working. There is a belief of having aligned objectives and to have clear channels of communication with a standard on what to send, and whom to send it to. Besides these findings, it was desired to have conflicts between the two companies in a constructive manner to develop the relationship further. Therefore, it is concluded that one should not be aligned in every aspect as this could harm the relationship development over time.
Although the two companies are working closely together, there are some discrepancies in how they believe the relationship is working. This insight contributes to the conclusion that aligning two firms is a difficult task, which requires dedication and commitment. Having transparency and long-‐term commitment from both parties will help minimize the discrepancies and increase their competitiveness on the market.

83
Chapter 7 – Concluding discussion This book has presented an interesting view on buyer-‐supplier relationship measurements, where the task of improving the relationship is approached mutually between the parties. The dual perspective enables the buyer to also consider its own activities and better align them for the benefit of the relationship. This is in a way contradictory to the traditional view, where suppliers are evaluated solely from the buyer’s perspective and interest. If both actors are willing to adjust and adapt to a better relationship it is fair to assume that the improvement potential is greater than if just the supplier is targeted.
It could be argued that just by acknowledging an interest in relationship improvement the parties have already initiated a move towards better understanding of each other. Both company A and company B welcomed the investigation of their relationship when approached with interviews and cherished the method of evaluating qualitative KPIs instead of just quantitative ones. They truly started reflecting about the actual relationship performance, not only in terms of their traditional outcome KPIs. The result of the relationship improvement initiative is of course utterly dependent on the actors’ ability to identify areas to assess and success in treating these. There is no guarantee of actually reaching improvements, but working with the relationship most certainly will target many aspects that otherwise would have gone by unnoticed. Potentially, if the relationship assessment fails, it could generate conflicts. Still, the parties are suggested to surface sensitive matters, characterized by differing perceptions and treat them in a constructive manner to come up with fresh ideas and new thinking.
One might question if the relationship measuring and improvement presented in the book focus on standardizing relationships and by that phase out personal relationships. In long-‐lasting business relationships, personal relationships develop over time. These relationships are built on interaction between two persons and are characterized by the ever-‐increasing experience of working with the counterpart. Approaching the business relationship should be considered as a complement to these personal relationships, where the relationship could be treated both on a detailed, personal level as well as on an overall level. Have in mind that personal relationships are fragile if one or the other of the interacting persons eventually leaves the company and thereby the relationship.
As the title of the book implies, there must be a relationship in order to measure it and work with. The relationship-‐improvement-‐cycle that was presented in

84
Chapter 5 is best suited for existing, deep, relationships where both actors consider the relationship worthy of consideration. This is the type of strategic relationship targeted throughout the book, even though supporting theories are mentioned. Multiple sourcing, for example might not be directly relatable to the scope of the book, but it still provides complementary views on alternative sourcing strategies and relationship constellations. Chapter 2 presents supplier selection, a task completed long before the relationship becomes deep. In one way this is therefore also beyond the scope of the book, but in another way the relationship constellation could be discussed already during the initial establishment of the relationship. Considering the latter perspective, the supplier selection is highly important to understand, and could be even more so if the buyer-‐supplier relationship improvement focus eventually becomes standard practice in business. Company A presented that little consideration was taken to the relationship aspect when a new supplier was acquired. The focus is solely on the product in question and the relationship develops along the way. It could be argued that assessing the relationship earlier on one has the possibility to do right from the beginning. In another way one could argue that assessing a relationship before an understanding and respect for the counterpart has been built up is of less interest. The particular relationship between company A and company B, is though of strategic, long-‐lasting character, where both actors could gain form improvements.
An interesting finding was that, even though the relationship between company A and company B was of strategic character for both companies, differences in perception of actual performance and desired state were still notable. This truly shows the importance of ranking and discussing aspects influencing the relationship, as different perspectives tend to surface sooner or later. If differences surface as a result of a poor situation, the probability of destructive conflicts is greater. Another finding is the uniqueness of every relationship. Company A got the opportunity to rank three different strategic relationships as a way to evaluate similarities in relationships. Even though some similarities were found, the results showed that relationships cannot fully be generalized, but instead benefit from being targeted separately. Therefore, it is suggested to apply the relationship-‐improvement-‐cycle independently for each relationship worthy of consideration.

85
List of references Agndal, H., and Nilsson, U. (2007) Activity-‐based costing: effects of long-‐term buyer-‐supplier relationships. Qualitative Research in Accounting & Management. Vol. 4, No. 3, pp. 222-‐245 Auntry, C.W. and Golicic, S.L. (2010) Evaluating Interfirm Relationships-‐Performance Spirals: A Longitudinal Study. Journal of Operations Management. Vol. 28, No. 1, pp. 87-‐100 Bamford, D. and Forrester, P. (2010). Essential Guide to Operations Management: Concepts and Case Notes. John Wiley & Sons Ltd: West Sussex Beamon, B.M. (1999) Measuring supply chain performance. International Journal of Operations and Production Management. Vol. 19, No. 3, pp. 275-‐292 Bove, L.L. and Johnson, L.W. (2001) Customer relationships with service personnel: do we measure closeness, quality or strength? Journal of Business Research. Vol. 54, No. 3, pp. 189-‐197 Bozarth, C. and Handfield, R. (2008) Introduction to operations and supply chain management, 2nd edition, New Jersey: Pers.
Böhme, T. et al. (2008) Balancing power and dependency in buyer-‐supplier relationships. International Journal of Electronic Customer Relationship Management. Vol. 2, No. 2, pp. 120-‐139 Cai. J., et al. (2008) Improving supply chain performance management: A systematic approach to analyzing iterative KPI accomplishment. Decision Support Systems. Vol. 46, pp. 512-‐521 Cai, S., Yang, Z and Hu, Z. (2010) The effects of volume consolidation on buyer-‐supplier relationships: A sudy of Chinese firms. Journal of Purchasing and supply management. Vol. 16, pp. 152-‐162
Cheveton, P. and van der Velder, J.P. (2010) Understanding the professional buyer: what every sales professional should know about how the modern buyer thinks and behaves. [E-‐book] Kogan Page.
Choi, T. and Krause, D. R. (2006) The supply base and its complexity: Implications

86
for transaction costs, risks, responsiveness, and innovation. Journal of Operations Management. Vol. 24, pp. 637-‐652
Christopher, M. (2011) Logistics & supply chain management. 4th edition. Harlow: Prentice Hall.
Christopher, M. and Hau, L. (2004) Mitigating supply chain risk through improved confidence. International Journal of Physical Distribution & Logistics Management. Vol. 34, No. 5, pp. 388-‐396
Christopher. M. and Towill. D. (2001) An integrated model for the design of agile supply chains. International Journal of Physical Distribution & Logistics Management. Vol. 31, No. 4, pp. 235-‐246 Cousins, P. and Menguc, B. (2006) The implications of socialization and integration in supply chain management. Journal of Operations Management. Vol. 24, pp. 604-‐620 Cousins, P.D. (2002) A conceptual model for managing long-‐term inter-‐organizational relationships. European Journal of Purchasing and Supply Management. Vol. 8, No. 2, pp. 71-‐82
Cousins, P.D. et al. (2008) Strategic Supply management – principles, theories, and practice. Essex: Prentice Hall
Cousins et al. (2008) Performance measurement in strategic buyer-‐supplier relationships: The mediating role of socialization mechanisms. International Journal of Operations & Production Management. Vol. 28, No. 3, pp. 238-‐258 Crotts et al. (2001) Trust-‐Commitment Model of Buyer-‐Supplier Relationships. Journal of Hospitality & Tourism Research. Vol. 25, p. 195 Cunningham et al. (2003) Building the knowledge economy: issues, applications, case studies. Amsterdam: IOS Press Day, M. et al. (2008) Strategic supplier relationship management. Supply Chain Management Review. Vol. 12, No. 4, p. 40
De Boer, l., Labro, E. and Morlacchi, P. (2001) A Review of Methods Supporting Supplier Selection. European Journal of Purchasing & Supply Management. Vol. 7, pp. 75–89

87
Doran, G. T. (1981) There's a S.M.A.R.T. way to write management's goals and objectives. Management Review. Vol. 70, No. 11, pp. 35-‐36 Dubois, A. and Fredriksson, P. (2008) Cooperation and competing in supply networks: Making sense of a triadic sourcing strategy. Journal of Purchasing & Supply Management. Vol. 14, No. 3, pp. 170-‐179
Ellram, L. and Hendrick, Th. (1993) Strategic supplier partnering: an international study. Phoenix, AZ: Center for Advanced Purchasing
Elmaghraby, W. (2000) Supply Contract Competition and Sourcing Policies. Manufacturing & Service Operations Management. Vol. 2, No. 4, pp. 350-‐371
Gadde, L. Håkansson, H. and Persson, G. (2010). Supply network strategies. Wiltshire: Wiley
Ghemawat, P., and Costa, J. (1993) The Organizational Tension between Static and Dynamic Efficiency Strategic. Management Journal. Vol. 14, pp. 59-‐73
Giannakis, M. (2007) Performance measurement of supplier relationships. Supply Chain Management: An internal Journal. Vol. 12, No. 6, pp. 400-‐411 Globerson. S. (1985) Issues in developing a performance criteria system for an organization. International Journal of Production research. Vol. 23, No. 4, pp. 639-‐646 Graham, T. et al. (1994) The long-‐term strategic impact of purchasing partnerships. International Journal of Purchasing and Materials Management. Vol. 30, No. 4, pp. 13-‐18 Gunasekaran, A., Patel, C., McGaughey, R., (2004) A framework for supply chain performance measurement. International Journal of Production Economics. Vol. 87, pp. 333-‐347 Hald, K., Ellegaard, C., (2010) Supplier evaluation processes: the shaping and reshaping of supplier performance. International Journal of Operations & Production Management. Vol. 31, No. 8, pp. 888-‐910 Hallikas, J. et al. (2004) Risk management processes in supplier networks. International Journal of Production Economics. Vol. 90, No. 1, pp. 47-‐58

88
Hallikas, J. et al. (2005) Risk-‐based classification of supplier relationships. Journal of Purchasing & Supply Management. Vol. 11, pp. 72-‐82 Han, S.-‐L., Wilson, D.T., and Dant, S.P. (1993) Buyer-‐supplier relationships today. Industrial Marketing Management. Vol. 22, No. 4, pp. 331-‐338.
Hardy, C., Lawrence, T.B., and Grand, D. (2005) Discourse and collaboration: The role of conversations and collective identity. Academy of Management Review. Vol. 30, No. 1, pp. 58-‐77
Harland, C. (1996) Supply chain management: relationships, chains and networks. British Journal of Management. Vol. 7, No. 1, pp. 63-‐80 Harland, C., Brenchley, R., and Walker, H. (2003) Risk in supply networks. Journal of Purchasing and Supply Management. Vol. 9, No. 2, pp. 51-‐62 Hausman, A. (2001) Variations on relationship strength and its impact on performance and satisfaction in business relationships. Journal of Business and Industrial Marketing. Vol. 16, No. 7, pp. 600-‐616
Hines, P. (1995) Network Sourcing: A Hybrid Approach. International Journal of Purchasing and Material Management. Pp. 17-‐24
Hingley, M. (2005) Power to all our friends? Living with imbalance in supplier-‐retailer relationship. Industrial Marketing Management. Vol. 34, pp. 848-‐858
Hsu, C. et al. (2008) Information sharing, buyer-‐supplier relationships, and firm performance. International Journal of Physical Distribution & Logistics Management. Vol. 38, No. 4, pp. 296-‐310
Inderst. R. (2008) Single Sourcing versus Multiple Sourcing. The RAND Journal of Economics, Vol. 39, No. 1, pp. 199-‐213
Ireton, S. (2007) Steps to successful supplier/buyer partnerships. Logistics today. Vol. 48, No. 9, pp. 44
Jacoby, D. (2009) Guide to Supply Chain Management: How getting it right boosts corporate performance. New York: Bloomberg Press
Johnson, M.E. (2001) Learning from toys: lessons in managing supply chain risk from the toy industry. California Management Review. Vol. 43, No. 3, pp. 106-‐124
Johnson, M.E. (2006) Supply Chain Management: Technology, Globalization, and Policy at a Crossroads. Interfaces, Vol. 36, No. 3, pp. 191-‐193

89
Johnston, D.A. et al. (2003) Effects of supplier trust on performance of cooperative supplier relationships. Journal of Operations Management. Vol. 22, No. 1, pp. 23-‐38
Kraljic, P. (1983) Purchasing Must Become Supply Management. Harvard Business Review. Pp. 109-‐115
Lambert, D., and Cooper, M., (2001) Issues in Supply Chain Management. Industrial Marketing Management. Vol. 29, pp. 65-‐83 Lamming, R., Cousins, D., Notman, D., (1996) Beyond vendor assessment. European Journal of Purchasing & Supply Managemen.t Vol. 2, No. 4, pp. 173-‐181 Lee. H., (2002) Aligning Supply Chain Strategies with Product Uncertainties. California Management Review. Vol. 44, No. 3 Little, E. and Marandi, E. (2003) Relationship marketing management. London:Thomson Learning
Medlin, C.J. (2003), Relationship performance: a relationship level construct. Proceedings of the 19th IMP-‐Conference. Lugano, Switzerland.
Mohr, J. and Nevin, J. (1990) Communication Strategies in Marketing Channels: A Theoretical Perspective. Journal of Marketing. Vol. 54, No. 4, p. 36
Mohr, J. and Spekman, R. (1994) Characteristics of partnership success: partnership attributes, communication behavior, and conflict resolution techniques. Strategic Management Journal. Vol. 15, pp. 135-‐152
Monczka, R. et al. (2010) Purchasing and supply chain management. 4th edition. Hampshire:Cengae Learning.
Monczka, R. et al. (2011) Supplier Relationship Management: An Implementation Framework. http://www.capsresearch.org/publications/pdfs-‐public/monczka2011srmEs.pdf (Accessed: December 1st, 2012)
Morgan, R. and Hunt, S. (1994) The Commitment-‐Trust Theory of Relationship Marketing. Journal of Marketing. Vol. 58, No. 3, pp. 20-‐38
Mosher, R., and Mainquist, D. (2011) The outsourcing relationship. http://www.theiia.org/intAuditor/feature-‐articles/2011/june/the-‐outsourcing-‐relationship/ (Accessed: November 15th, 2012)

90
Mudambi, R. and Schründer, C.P. (1996) Progress towards buyer-‐supplier partnerships: Evidence from small and medium-‐sized manufacturing firms. European Journal of Purchasing & Supply Management. Vol. 2, No. 2, pp. 119-‐127
Neely, A., Gregory, M. and Platts K. (2005) Performance measurement system design. International Journal of Operations & Production Management. Vol. 25, No. 12, pp. 1228-‐1263 O’Toole, T. and Donaldson, B. (2002) Relationship performance dimensions of buyer-‐supplier exchanges. European Journal of Purchasing & Supply Management. Vol. 8, pp. 197-‐207 Paiva, E.L., Phonlor, P., and D’avila, L.C. (2008) Buyer-‐Supplier Relationship and Service Performance: an Operations Perspective Analysis. The Flagship Journal of International Conference Of The Production And Operations Management Society. Vol. 1, No. 2, pp. 77-‐88
Purdy and Safayeni (2000) Strategies for Supplier Evaluation: A Framework for Potential Advantages and Limitations Transactions on Engineering Management. Vol. 47, No. 4
Rangan, K. and Bell, M. (2006) Transforming your go-‐to-‐market strategy: The three disciplines of channel management. Boston:Harvard Business School Press
Richardson, J. and Roumasset, J. (1995) Sole Sourcing, Competitive Sourcing, Parallel Sourcing: Mechanisms for Supplier Performance. Managerial and Decision Economics. Vol. 16, No. 1, pp. 71-‐84
Richardson, J. (1993) Parallel sourcing and supplier performance in the Japanese automotive industry. Strategic Management Journal. Vol. 14, pp. 339-‐350
Rolstadås, A. et al. (1995) Business Process Benchmarking Approach. London: Kluwer academic publishers
Rushton, A. and Walker S. (2007) International Logistics And Supply Chain Outsourcing: From Local to Global. Cornwall: Kogan Page Limited.
Shepherd, C. and Günter, H. (2006) Measuring supply chain performance: current research and future directions. International Journal of Productivity and Performance Management. Vol. 55, pp. 242–258

91
Sokovic, M., Pavletic, D., Kern Pipan, K., (2010), Quality Improvement Methodologies – PDCA Cycle, RADAR Matrix, DMAIC and DFSS. Journal of Achievements in Materials and Manufacturing Engineering. Vol. 43, No. 1, pp. 476-‐483
Stamatis, D. (2012) 10 Essentials for High Performance Quality in the 21st Century. Florida:CRC Press
Stuart, F. I, Verville, J. and Taskin, N. (2012) Trust in buyer-‐supplier relationships: Supplier competency, interpersonal relationships and performance outcomes. Journal of Enterprise Information Management. Vol. 25, No. 4, pp. 392-‐412
Suh T. and Houston M.B. (2010) Distinguishing supplier reputation from trust in buyer-‐supplier relationships. Industrial Marketing Management. Vol. 39, No. 5, pp. 744-‐751.
Sundtoft Hald, K., Ellegaard, C., (2010) Supplier evaluation processes: the shaping and reshaping of supplier performance. International Journal of Operations & Production Management. Vol. 31, No. 8, pp. 888-‐910
Supply-‐Chain Council (2008). SCOR: Supply Chain Operations Reference Model, Version 9.0.
Tan, J. and Wang, L. (2009) Flexibility-‐efficiency trade-‐off and performance implications among Chinese SOEs. Journal of Business Research. Vol. 63, No. 4, pp. 356-‐362
The British Deming Association (1988) Singe Sourcing. The TQM Magazine. Vol. 2, No. 2
Tullous. R. and Utecht. R. (1992) Multiple or Single Sourcing? The Journal of Business & Industrial Marketing. Vol. 3, No. 3, pp. 5-‐18
Verville, J., Taskin, N. and Law, S. (2011) Buyer-‐supplier relationships in supply chain management: relationship, trust, supplier involvement, and performance. International Journal of Agile Systems and Management. Vol. 4, No. 3, pp. 203-‐221.
van Weele, A. (2010) Purchasing and Supply Chain Management. Singapore:Seng Lee Press