Embed Size (px)
Citation preview

Boom and Bust of Information and Communication Technology and
Thereafter
by Laila Gulzar
An Honours essay submitted to Carleton University in fulfillment of the requirements for the course
ECON 4908, as credit toward the degree of Bachelor of Arts with
Honours in Economics.
Department of Economics Carleton University
Ottawa, Ontario
April 7, 2006

Acknowledgement Many people have guided me in writing this essay. First of all, I would like to thank my supervisor Professor Hashmat Khan, without whose continuous guidance and numerous suggestions for improvement, it would have been impossible for me to complete this essay. I would also like to thank Professor Kenneth Xi, the second reader of this essay. Professor Armstrong has also helped me in preparing a schedule, which greatly helped me in producing this essay in a timely manner. I would also like to thank Nan Zhou, who guided me in using Shazam for forecasting. I would like to thank my friends who have supported and helped me through out the last year. Last but not the least, I would like to thank my loving husband Rehan without whose constant help, support, trust and motivation I could not have completed this essay in time.
i
TABLE OF CONTENTS Executive Summary ........................................................................................................................ 1 1. Introduction................................................................................................................................ 2 2. Literature Reviewed................................................................................................................... 3 3. Defining the Information and Communication Technology sector ............................................ 5 4. ICT sector’s contribution to the Canadian Economy................................................................. 5 5. ICT Sector And Employment ..................................................................................................... 7
5.1 ICT Manufacturing ........................................................................................................... 9 5.1.1 Before and during the bust............................................................................................. 9 5.1.2 After the bust................................................................................................................ 10 5.2 ICT Services.................................................................................................................... 11 5.2.1 Before and during the boom ........................................................................................ 11 5.2.2 After the bust................................................................................................................ 12 5.3 Educational Distribution of the ICT Sector workforce................................................... 13
6. Change in Production for ICT Sector ....................................................................................... 15 6.1 Real GDP: ICT sector compared with Canada ....................................................................... 18
6.1.1 ICT Manufacturing Real GDP:.................................................................................... 18 6.1.1.1 Before and during the bust........................................................................................ 18 6.1.1.2 After the bust............................................................................................................. 19 6.1.2 ICT Services Real GDP ............................................................................................... 20 6.1.2.1 Before and during the bust........................................................................................ 20 6.1.2.2 After the bust............................................................................................................. 21
7. ICT Revenue ............................................................................................................................. 22 7.1 ICT revenue from boom to bust:..................................................................................... 22 7.2 ICT Sector Revenues by Region (2003) ......................................................................... 25 7.3 ICT Manufacturing Revenues (2003) ............................................................................. 26 7.4 ICT Services Revenues (2004) ....................................................................................... 28 7.4.1 Software and Computer Services Revenues (2003)..................................................... 28 7.4.2 Communication Services Revenues (2003) ................................................................. 30
8. Overview of ICT Expenditures................................................................................................. 31 8.1 Contribution of Research and Development to ICT ....................................................... 32 8.2 Current Picture of Capital Expenditure........................................................................... 38 8.2.1 Manufacturing.............................................................................................................. 40 8.2.2 Services:....................................................................................................................... 40
9. International Trade and ICT...................................................................................................... 43 10. Forecast ................................................................................................................................... 48
10.1 Methodology and Results to forecast ICT’s Performance (2005 – 2015) .................... 48 10.2 Forecasting of total ICT Investment ............................................................................. 52 10.2.1 Results........................................................................................................................ 55
11. Conclusion .............................................................................................................................. 56 Appendix....................................................................................................................................... 57 Bibliography ................................................................................................................................. 64
ii

FIGURES
Figure 1: ICT Sector Employment (1997 – 2004) ......................................................................... 8 Figure 2: Employment: ICT Sector and Canadian Economy ........................................................ 9 Figure 3: Employment: ICT and Canadian Manufacturing Industry ........................................... 10 Figure 4: Employment: Selected ICT Manufacturing Industries ................................................. 11 Figure 5: Employment: ICT and Canadian Service Industries .................................................... 12 Figure 6: Employment: Selected ICT Services Industries ........................................................... 13 Figure 7: Percentage of Workers with a University Degree ........................................................ 14 Figure 8: Real GDP: ICT sector and Canada ............................................................................... 17 Figure 9: ICT and Canada Real GDP (Manufacturing and Services) .......................................... 18 Figure 10: Real GDP of Selected ICT Manufacturing Industries ................................................ 20 Figure 11: Real GDP for selected ICT Services Industries ......................................................... 21 Figure 12: Distribution of Revenues by ICT Industry ................................................................. 23 Figure 13: ICT Sector Revenue ................................................................................................... 25 Figure 14: ICT Sector Revenues Growth ..................................................................................... 26 Figure 15 : Distribution of ICT Sector Manufacturing Revenues by Region .............................. 27 Figure 16: ICT Manufacturing Revenues Growth ....................................................................... 27 Figure 17: Distribution of Software and Computer Services Revenue ........................................ 29 Figure 18: Software & Computer Services Revenues Growth .................................................... 29 Figure 19: Distribution of Communication Services Revenues .................................................. 30 Figure 20: Communication Services Revenues Growth .............................................................. 31 Figure 21: Distribution of ICT Sector R&D Expenditures by Region ......................................... 33 Figure 22: ICT R&D Spending Growth........................................................................................ 34 Figure 23: Percentage of Total R&D Expenditures Devoted to ICT by Region .......................... 34 Figure 24: Distribution of R&D Expenditures by ICT Industry, 2005 ........................................ 35 Figure 25: R&D Expenditures for the ICT sector and The Canadian Private Sector ................... 36 Figure 26: Indexed Growth in Capital Expenditure for the ICT sector and Canadian economy.. 39 Figure 27: Distribution of Capital Expenditures by ICT Segment 2005 ...................................... 40 Figure 28: ICT Capital Expenditure 2000 - 2005 ......................................................................... 41 Figure 29: Trade of ICT Goods and Services ............................................................................... 48 Figure 30: Projected GDP with and without Telecom 2005 - 2015 ............................................. 51 Figure 31: Projection of ICT Investment in Canada..................................................................... 55
iii

TABLES Table 1: ICT sector GDP from Boom to Bust .............................................................................. 16 Table 2 : ICT Sector Revenues ..................................................................................................... 24 Table 3: Growth in ICT Sector Revenue ...................................................................................... 24 Table 4: ICT Sector R&D Expenditures....................................................................................... 37 Table 5: Growth in ICT sector Intramural R&D Expenditures(1997 – 2005).............................. 38 Table 6 : ICT sector Capital Expenditure ..................................................................................... 42 Table 7: Growth in ICT Sector Capital Expenditure .................................................................... 43 Table 8: Geographical markets of Canadian ICT goods as of 2001 ............................................. 44 Table 9: Growth in Trade of ICT Goods ...................................................................................... 45 Table 10: Growth in Trade of ICT services .................................................................................. 47 Table 11: Trade of ICT Goods and Services ................................................................................ 47 Table 12: Projected GDP with and without Telecom ................................................................... 51 Table 13: Data for Figure 5........................................................................................................... 57 Table 14: Data for Figure 8........................................................................................................... 58 Table 15: Data for Figure 10 ........................................................................................................ 59
iv

Executive Summary
This paper follows the ICT sector during its boom in the late 1990s to its bust in early 2000s, and
also examines data from more recent years. It examines the impact of the boom and bust of this
sector on some key economic indicators, like employment, GDP, revenues and expenditures of
the sector. By looking at more recent data, it tries to determine if the bust of the industry seems a
temporary or a persistent phenomenon. Finally, the study forecasts the rate of growth of the ICT
sector by employing econometric methods.
The paper draws information from a variety of sources, but I have acquired most of the data from
Statistics Canada and Industry Canada.
By observing the trends in various economic indicators like employment and output during the
boom and bust of the ICT sector, I find that the ICT manufacturing sub-sector was more deeply
affected by the bust than the services sub-sector. By observing the trends in the ICT
manufacturing sub-sector, I find that during the bust, companies generated more revenue from
ICT services than manufacturing. The ICT services sub-sector appears to have returned to steady
growth since the bust, and is on its way to recovery. I can, therefore, assert that the bust in the
ICT sector was not persistent but rather a temporary phenomenon.
Page 1 of 66

1. Introduction In this paper I will portray the picture of the boom and bust of the ICT (Information and
Communication Technology) sector in past few years, and its impact on the Canadian economy.
Several studies have examined this issue of boom and bust of the ICT sector, but most of them
were done either immediately or shortly after the bust. Therefore, in this paper I will look at
more recent employment and output statistics to examine how the effects of the bust in the ICT
sector have evolved over time. Specifically I will examine whether the bust has caused a
persistent downturn in the performance of the ICT sector. Lastly, I will forecast the future of the
ICT sector. For the purpose of this study, I have classified the data into three time periods, the
boom (1997 – 2000), the bust (2001 – 2003), and thereafter (2004 – 2005).
As a result of deep reliance on ICT in businesses, fluctuations in the ICT sector have had a
significant affect on the Canadian economy.1 But its affect on the economies of major cities of
Canada has been much more profound as compared to rural areas. For that reason, I have
included the affect of ICT sector fluctuations on some of the major cities like Toronto, Montreal,
Ottawa and Vancouver.
Most research on this topic was done shortly after the bust, in the year 2001 and 2002, but now
the data for years 2003 to 2005 is also available, which can help to determine whether the bust of
ICT sector has caused a persistent reduction in the employment and output of the sector or not. I
have drawn information from a variety of sources including Statistics Canada and Industry
Canada.
I report three main findings. First, my sectoral analysis reveals that during the period of the bust,
ICT manufacturing sector was severely affected, while ICT services industries continued to
grow. Second, although the rate of growth of ICT sector is currently slower relative to that at the
time of the boom; it is in a phase of recovery. This finding suggests that the bust in the ICT
1 Source Statistic Canada, “Information and Technology Communication, a statistical profile of the ICT sector,” Catalogue No. 56-506.
Page 2 of 66

sector was temporary. Third, using historical data I conduct a forecasting exercise for the ICT
sector. My result indicates that the ICT sector is expected to grow at a steady rate.
The next of the essay is structured as follows: Section 2 presents a brief literature review. Section
3 defines the ICT sector. I have used quarterly data from 1997 Q1 to 2005 Q3 for the next
sections. Section 4 lists the contribution of the ICT sector to the Canadian economy. Section 5
discusses the employment in the ICT sector. Section 6 describes the change in production of the
ICT sector. Section 7 explains the ICT sectors revenue. Section 8 discusses the overview of the
ICT expenditure. Section 9 explains the role of International Trade in the ICT sector. Section 10
presents forecast of the ICT sector’s performance from the year 2005 up to 2015 and total ICT
investments for major industries of Canada from the year 2005 up to 2008. Section 11 concludes
my findings.
2. Literature Reviewed In this section I provide a brief review of some of the literature I have read as background to my
research. I draw upon the ideas presented in the three articles discussed below to support my
arguments.
Bowlby and Langlois (2002) provide an overview of the boom and bust of ICT sector of Canada
between the years 1996 and 2001. The authors describe how the ICT sector experienced amazing
growth between the years 1997 and 2000, and how the sector declined dramatically at the end of
2001 especially in the manufacturing sub-sector. Due to the downfall, many companies had to
resort to layoffs and hiring freezes in order to keep their accounts in black. The authors claim
that due to this decline, women and low-skilled workers were more severally affected then
others. The authors also look at the affect of ICT downturn on employment in major urban
centers of Canada and show that Ottawa–Gatineau and Toronto were the two centres most
affected by the downturn.
Beckstead and Brown (2005) focus on employment growth and decline within the ICT sector in
Canada from 1997 – 2003. The authors found that the decline in the ICT sector was first felt in
Page 3 of 66

terms of output, and then employment, which is typical of most industries experiencing a
downturn. The question they have tried to address in their paper is “whether the recent pattern of
growth and decline within the ICT sector is simply a short-run phenomenon or does the
downturn represents a structural break, with the ICT firms entering a more mature, slower
growth stage.” They examines the number of companies entering and exiting the ICT sector in
the light of the Product Life Cycle theory to answer this question. They claim that since the ICT
sector continues to attract a relatively large number of new entrants, the slowdown is temporary
and not a structural shift. To further support their assertion, the authors also show that there has
not been a large shift in employment from larger to smaller and presumably cheaper, centres.
According to them, this is another proof that the slowdown in the ICT sector is temporary.
In both the articles the authors claimed that due to limitations of labour surveys done by
Statistics Canada, it is not possible to accurately measure the full extent of the change in ICT
employment, and, therefore, these articles use employment data from a core sub-sector of ICT:
computer and telecommunications. Beckstead and Brown (2005) claim that Computer and
Telecommunication sub-sector account for over 90% of the employment in the ICT sector.
Inklaar and McGuckin (2003) used information on value added and employment in 16 OECD
countries for 51 industries between 1990 and 2000 to estimate the contribution of ICT
investment to productivity growth. Due to a lack of ICT investment data, the study focuses on
labour productivity rather than total factor productivity. This study breaks down the contribution
of ICT investment to labour productivity growth into ICT producing industries and ICT-using
industries for the economies of Canada, the U.S., and the European Union (E.U.). The authors
claim that the growth experience of Canada is somewhere in between that of Europe and the
United States. They also assert that while labour productivity growth accelerated during the
second half of the 1990 decade, it remained slower in Canada than in the United States.
The literature reviewed here covers the period immediately following the bust in the ICT sector.
More recent data is now available which may shed light on whether the economic consequences
described in their studies have been temporary or more persistent. Based on the historical data
another interesting issue which I examine in this essay is the outlook of the ICT sector.
Page 4 of 66

3. Defining the Information and Communication Technology sector
Statistics Canada defines the ICT sector as the “manufacture and service-based provision of
advanced information technologies that rely on programming or other automated control
mechanisms.” For the purpose of this study, I use the same definition in this essay.
The manufacturing industry includes: computer and peripheral equipment, commercial and
service industry machinery, communication and audio video equipment, and semiconductor and
other electronic component manufacturing. The service industry includes: ISPs, web search
portals, data processing services, communication services including wired and wireless
communication, and computer system design and related services.
I have not examined industries like biotech, pharmaceutical, and oil and gas in this study. These
industries have a knowledge-intensive production process, which is reflected in an advanced skill
base and extensive R&D investments; however, they tend to play a much smaller role than
overall ICT sector in the local economy. 2 Also, the demand and innovation cycle of these
industries is independent of those directly related to the ICT sector as these industries did not
directly share the recent boom and bust cycle of the ICT sector.
4. ICT sector’s contribution to the Canadian Economy To establish the importance of the ICT sector in the Canadian economy, it is useful to look at its
contribution to the economy. I list some key indicators of the ICT sector:3
• During the 1997 – 2004 periods, the ICT sector’s GDP grew at a compound annual
growth rate (CAGR) of 8.4% compared to 3.6% for the Canadian economy.
2 According to the Statistic Canada report Catalogue No. 81-004 titled Information and Communication technology. 3 The numbers taken from Industry Canada report titled “Canadian ICT Statistical Overview (ICTSO) last updated October 2005.
Page 5 of 66
Consequently, the share of ICT sector to the Canadian GDP increased from 4.0% to
5.5%. In dollar terms, the ICT sector’s contribution to the Canadian GDP reached $57.5
billion in 2004. This is the first time since 2000 when the growth of the ICT sector
outperformed the growth of overall economy.
• During the 1997 – 2004 periods, the employment in the ICT sector grew at CAGR of
3.7% as compared to the 2.2% growth rate in the Canadian economy.
• During the 1997 – 2004 periods, the revenues of the ICT sector grew at a CAGR of 4.9%.
• The ICT sector’s export gained a momentum during the 1997 – 2000 periods; however, it
slowed down during the 2001 – 2004 period and accounted for a total of 6.3% of the
Canadian exports in 2004 compared to 10.0% in 2000.
• Employment in the ICT sector in 2004 kept growing at a slower rate of 0.8% as
compared to 2003’s growth rate of 5.3%, resulting in 570 thousand people.4
• In 2004, the ICT sector revenues were expected to reach $136 billion, which represented
a recovery of 4.4% from 2003.
• The total private sector R&D expenditures were expected to be $13.8 billion in 2005, an
increase of about 1.6% from 2004. The ICT sector remains the largest R&D player in
Canada, with investments reaching about $ 5.2 billion.
• Imports of ICT sector also recovered in 2004 and increased about 9.3% from 2003, which
translates to $47.4 billion (12.1% of all Canadian imports)
The statistics establish the importance of the ICT sector for the Canadian economy. I now
examine how employment, GDP, International Trade, ICT Revenue and Expenditures of the
sector were affected by the ups and downs of the sector. 4The numbers collected from Statistic Canada report No. 56-506 XIE.
Page 6 of 66

5. ICT Sector And Employment5
ICT sector is considered to be a major source of jobs in the Canadian job market. Statistics
Canada collects employment statistics for the ICT sector in to two categories: manufacturing and
services. In this section I describe the employment in ICT sector as a whole, and then consider
the employment trends in the manufacturing and services sub-sectors.
From boom to bust:
After a recession in 1990, the ICT sector was severally affected. It took this sector about 5 years
to recover while other sectors recovered a year earlier6. In the few years after the recovery of the
ICT sector, its growth outperformed the growth of the Canadian economy, but the sector saw a
decline in 2002. Employment within the sector followed the same cycle of growth and decline.
Between 1990 and 2000, ICT industry employment increased by 66.0% – four times that of the
rest of the economy (16.4%). But this did not last long. Employment in this sector reached its
peak in 2000 and then started to decline, while other industries continued to grow into 2002.
The growth in ICT industry employment slowed down in 2001 and 2002, though employment
still increased in both industry groups. In 2002, however, there was a marked decrease in ICT
industry employment. The substantial drops in employment in 2001 and 2002 in the
manufacturing industries resulted in a structural shift of the ICT sector from manufacturing to
services.
After the bust
The year 2003 proved to be the year of recovery for the ICT sector. By 2004, the ICT sector
employed about 3.6% of all Canadian workers. The software and computer services industries
5 All the data collected from Industry Canada: The Information and Communications Technologies Statistical Overview (ICTSO). 6 Statistics Canada Report - Catalogue No. 56F0004MIE.
Page 7 of 66

within the sector experienced the most gain, where the number of employees increased by 64%
in 2004 as compared to 1997.
ICT Sector Employment (1997 - 2004)
350
400
450
500
550
600
1997 1998 1999 2000 2001 2002 2003 2004
Thou
sand
s ($
)
3
3.2
3.4
3.6
3.8
4
Perc
enta
ge (%
)
ICT Employment Level ICT Share of Canadian Employment
Figure 1: ICT Sector Employment (1997 – 2004) 7
Figure 1 shows the trend in employment in the ICT sector from 1997-2004. It is evident that the
boom was fast and so was the bust. But the sector appears to have recouped most of the
employment it lost during the bust. However, as I discuss later when I look at employment
distribution within the sector, not all sub-sectors faired equally in this comeback. The aggregate
picture, therefore, masks the sectoral differences.
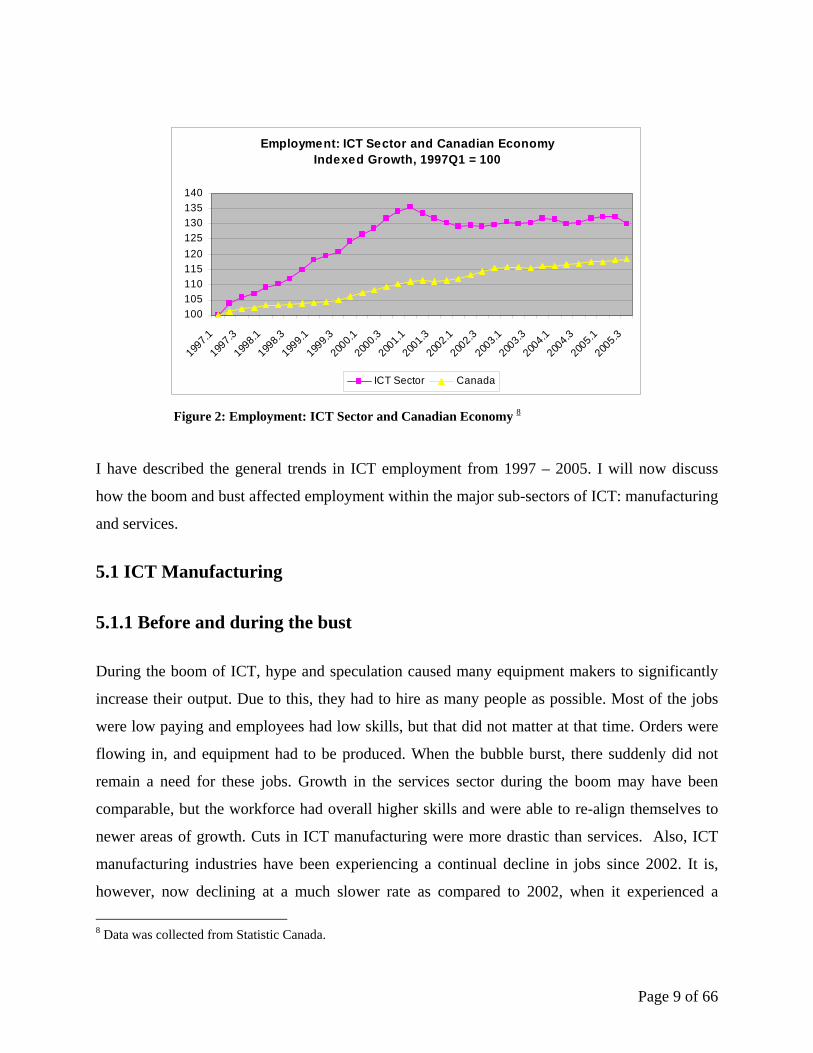
Figure 2 shows the ICT employment from 1997-2005. As a general trend, the employment has
increased since the bust. However, the same figure shows that the situation changed in the third
quarter of 2005 when the ICT sector experienced a drop in the employment rate by 1.8%, which
brought the ICT employment to its lowest level since the second quarter of 2003. Also, the
overall Canadian employment was up by 0.4% for this quarter. Figure 2 compares the growth in
employment within the ICT sector to that of the Canadian economy. The drop in growth is
clearly noticed during the third quarter of 2005, but another important observation is that the
indexed growth in employment of ICT sector has continuously outperformed the indexed growth
in the Canadian economy, even during the bust period.
7 Data was collected from the Statistic Canada, only available up to 2004.
Page 8 of 66
Employment: ICT Sector and Canadian Economy Indexed Growth, 1997Q1 = 100
100105110115120125130135140
1997.1
1997.3
1998.1
1998.3
1999.1
1999.3
2000.1
2000.3
2001.1
2001.3
2002.1
2002.3
2003.1
2003.3
2004.1
2004.3
2005.1
2005.3
ICT Sector Canada
Figure 2: Employment: ICT Sector and Canadian Economy 8
I have described the general trends in ICT employment from 1997 – 2005. I will now discuss
how the boom and bust affected employment within the major sub-sectors of ICT: manufacturing
and services.
5.1 ICT Manufacturing
5.1.1 Before and during the bust
During the boom of ICT, hype and speculation caused many equipment makers to significantly
increase their output. Due to this, they had to hire as many people as possible. Most of the jobs
were low paying and employees had low skills, but that did not matter at that time. Orders were
flowing in, and equipment had to be produced. When the bubble burst, there suddenly did not
remain a need for these jobs. Growth in the services sector during the boom may have been
comparable, but the workforce had overall higher skills and were able to re-align themselves to
newer areas of growth. Cuts in ICT manufacturing were more drastic than services. Also, ICT
manufacturing industries have been experiencing a continual decline in jobs since 2002. It is,
however, now declining at a much slower rate as compared to 2002, when it experienced a
8 Data was collected from Statistic Canada.
Page 9 of 66

sudden fall. Bowlby and Langlois (2002) have also claimed that low-skilled workers were
affected more than high skilled ones during the bust.
5.1.2 After the bust
Employment in ICT manufacturing has been continuously declining since 2002. Employment
levels in Canadian manufacturing industry dropped by 0.6%, and the ICT manufacturing
employment also took a dip by 1.2% in the third quarter of 2005 compared to 2004. Currently
(2005, Q3) it is 4.5% below from the second quarter of 2002 whereas the overall Canadian
manufacturing employment has fallen about 4.8% for the same period.
Employment: ICT and Canadian Manufacturing Industries Indexed Growth, 1997Q1 = 100
90
100
110
120
130
140
150
1997.1
1997.3
1998.1
1998.3
1999.1
1999.3
2000.1
2000.3
2001.1
2001.3
2002.1
2002.3
2003.1
2003.3
2004.1
2004.3
2005.1
2005.3
ICT Mfg CDN Mfg
Figure 3: Employment: ICT and Canadian Manufacturing Industry 9
Figure 3 compares employment in ICT manufacturing with employment in Canadian
manufacturing. Whereas overall indexed growth in the ICT sector has outperformed indexed
growth in the Canadian economy, decline in employment in ICT manufacturing is significantly
higher than that of Canadian manufacturing since the bust.
9Data was collected from Statistic Canada Annual Survey of Manufactures (ASM) (no 2103), Catalogue no. 31-203, CANSIM Table 301-0003,
Page 10 of 66

Within the manufacturing sub-sector, the computer and peripheral equipment industries,
commercial and service machinery industries and instruments industries experienced the most
employment losses. The third quarter of 2005 is the fifth consecutive quarter in which the
computer and peripheral equipment industries witnessed loss in employment, and employment
level is 45% below to the 1997 level. Employment in communication equipment industries and
electronic component industries were stable in this quarter.
Figure 4 shows employment trends in various sub-sectors of ICT manufacturing from 1997 Q1–
2005 Q3.
Employment: Selected ICT Manufacturing Industries Indexed Growth, 1997Q1 = 100
50
60
70
80
90
100
110
120
130
1997
.1
1997
.3
1998
.1
1998
.3
1999
.1
1999
.3
2000
.1
2000
.3
2001
.1
2001
.3
2002
.1
2002
.3
2003
.1
2003
.3
2004
.1
2004
.3
2005
.1
2005
.3
Computer & Peripheral Equipment Communications EquipmentElectronic Components Instruments
Figure 4: Employment: Selected ICT Manufacturing Industries 10
5.2 ICT Services
5.2.1 Before and during the boom
Like ICT manufacturing, growth in ICT services during the boom was spectacular. New
graduates were being hired before they graduated. The atmosphere of hype and speculation had
tainted judgement of those in authority. All they could see was that if they could not grow fast
enough, someone else would happily take the pie. When the industry crashed, cuts to the services 10 Source: Industry Canada Quarterly Monitor of the Canadian ICT Sector, Third Quarter 2005 Annual Survey of Manufactures (ASM) (no 2103),Catalogue no. 31-203, CANSIM Table 301-0003.
Page 11 of 66

sector were harsh. However, due to the nature of the jobs in this sector, many employees that
were let go were highly skilled, and were able to realign their careers. Nevertheless, many had to
change their fields and re-train themselves to make a living. I consider the educational
distribution of the ICT sector workforce in the next section.
5.2.2 After the bust
After the bust, employment in ICT services started growing back as early as the second quarter
of 2002. This growth, however, was much slower than what was experienced during the boom.
According to the latest data (2005 Q3), employment in the sub-sector is about 1.7% higher than
2002. The sector, however, experienced a significant job loss of 1.9% in 2005 Q3. Figure 5
compares employment in ICT services with employment in the Canadian services industry.
Whereas overall growth in the ICT services sector since the bust has been very small, it is worth
noting that the employment in ICT services has been significantly higher than that of Canadian
services industry even during the bust.
Employment: ICT and Canadian Services IndustriesIndexed Growth, 1997Q1 = 100
90
100
110
120
130
140
150
1997
.1
1997
.3
1998
.1
1998
.3
1999
.1
1999
.3
2000
.1
2000
.3
2001
.1
2001
.3
2002
.1
2002
.3
2003
.1
2003
.3
2004
.1
2004
.3
2005
.1
2005
.3
ICT Services CDN Services
Figure 5: Employment: ICT and Canadian Service Industries 11
Within the ICT services sub-sector, the telecommunication services saw the most job loss, falling
by 4.1% in this quarter after four consecutive quarters of growth. Data processing services 11 Source: Industry Canada Quarterly Monitor of the Canadian ICT Sector, Third Quarter 2005.
Page 12 of 66

industry also fell down by 2.8% but the computer system design industry remained stable. On the
other hand, the software services industry showed an improvement of 3.3% in this quarter,
following an upward trend since the last quarter of 2003 and showed a rise of 17 % since then.
Figure 6 shows employment trends in various sub-sectors of ICT services from 1997 – 2005Q3.
Employment Selected ICT Services Industries, Indexed Growth 1997 Q1 =100
050
100150200250
1997
.119
97.319
98.119
98.319
99.119
99.320
00.120
00.320
01.120
01.320
02.120
02.320
03.120
03.320
04.120
04.320
05.120
05.3
Time Period
Inde
xed
Gro
wth Software
TelecommunicationsServices
Computer SystemsDesign
Data ProcessingServices
Figure 6: Employment: Selected ICT Services Industries 12
5.3 Educational Distribution of the ICT Sector workforce
The ICT sector has a knowledge-intensive workforce as compared to the other sectors.
According to a survey in 2004, 38% of all workers have a college degree, which is significantly
higher than the national average of 21% (of all other sectors).
Within the ICT sector, the communication equipment manufacturing industries have the most
educated workforce of 51%, followed by the computer and software services industries which
come close to 46%. The telecommunication services industry has the lowest level of educated
12 Source: Annual Survey of Software Development and Computer Services (no 2410), Catalogue no. 63-222, CANSIM Table 354-0005.
Page 13 of 66

workforce (26%), which is still higher than the national average of 21%. Figure 7 breaks down
the percentage of workers with a university degree by industries in the ICT sector.
Percentage of Workers with a University Degree by Major ICT Industry (2004)
51%
46%
36%
33%
26%
23%
38%
21%
Communications Equipment Manufacturing
Software and Computer Services
Computer Equipment Manufacturing
Electronic Component Manufacturing
Telecommunications Services
Instruments Manufacturing
Total ICT Sector
All Canadian Industries
Figure 7: Percentage of Workers with a University Degree 13
The ICT sector is not just limited in creating high number of jobs and having the most skilled
workforce; the earnings in this sector also out perform the average wages in the overall Canadian
job market. The earnings in this sector are about 45% more than the economy-wide average,
which is $36,695 as compared $53,335 in the ICT sector.
The most highly paid industries among the ICT sector are the computer and software services
industries in which the earnings were about $58,069 on average, followed by the
communications and instruments equipment manufacturing industries that earned 46% more than
the economy-wide average.
13Data was collected form the Statistic Canada.
Page 14 of 66

6. Change in Production for ICT Sector
Like employment, output of the ICT sector contributes significantly to the Canadian economy. It
is, therefore, interesting to see how the output of the sector changed from 1997 to 2002 and
beyond. As in the previous section, I first described the trends in the output of the ICT sector as a
whole, and then consider the output trends in the manufacturing and services sub-sectors. For the
sake of understanding the effects of bust on the output of the sector, I divide our study of the
output as a whole into two periods: from boom to bust; and after the bust.
From Boom to Bust (1997 – 2002) 14
According to the report “Canada’s Journey to an Information Society” by Statistic Canada, the
ICT sector continued to make its contribution to the Canadian economy in 2002 despite of slight
decline in 2001. In 2002 the ICT sector contributed $58.7 billion to Canada’s GDP, which
represents 7.1% of business sector GDP and 6.0% of total economy GDP (in 1997 chained
dollars). This amount was about 2.5% more than 2001 GDP of $57.2 billion (1997 chained
dollars).
The ICT sector’s average annual compounded growth was 12.4% for the 1997 – 2002 segments.
For the same period, the economy-wide growth was 3.7% and business sector growth was 4.1%.
The total growth for the ICT sector for 1997 – 2002 periods was 79.3%, about four times the
growth of total economy, which was 9.7% and considerably higher than business sector growth
which was 22.0% for the 1997 – 2002 period. The ICT manufacturing output dropped nearly
30% between 2000 and 2001; however, the situation improved a bit in 2002 when the drop was
about 17%. The ICT services sector output grew 8.1% between 2001 and 2000.
ICT manufacturing, at its peak in 2000 contributed about 31.2% to the total ICT sector GDP and
started declining after that, reaching 18.1% in 2002. This downfall was mainly caused by the
slow demand in communication and telephonic devices industry causing many businesses to
shutdown their operations. On the other hand, the ICT services industry’s share to GDP
14 Data from Statistic Canada Catalogue no. 56-508-XIE titled Canada’s Journey to the Information Society.
Page 15 of 66

decreased continually from 1997 to 2000; however, it picked up some pace when the ICT
manufacturing slowed down. This illustrates that the GDP shares of ICT manufacturing and
services sector were inconsistent between 1997 and 2002. Within the ICT services sector, the
telecommunication services industry made the largest contribution to ICT GDP reaching at
81.9% of all ICT services in 2002.
Table 1 presents a breakdown of ICT sector output and percentage contribution of each sub-
sector to the overall output of the ICT sector from 1997-2002.
ICT Sector GDP (1997 – 2002) 15
Year 1997 1998 1999 2000 2001 2002 02/97 CAGR(02/97)
Billions of 1997 chained dollars %
Manufacturing % of ICT
8.2
25.2
9.7
25.8
13.2
27.7
18.1
31.2
12.8
22.3
10.6
18.1
28.9
----
5.2
----
Services
% of ICT
24.5
74.8
28.0
74.3
34.3
72.3
39.9
68.9
44.5
77.7
48.1
81.9
96.3
----
14.4
----
Total ICT Sector 32.7 37.7 47.5 57.9 57.2 58.7 79.3 12.4
Business sector
ICT as a %
679.6
4.8
710.2
5.3
752.2
6.3
791.3
7.3
801.9
7.1
828.8
7.1
22.0
----
4.1
----
Total economy
ICT as a %
816.8
4.0
848.4
4.4
892.9
5.3
933.7
6.2
947.0
6.0
977.3
6.0
19.7
----
3.7
----
Table 1: ICT sector GDP from Boom to Bust
After the Bust (including 2003-2005): While in the bust era, ICT sector’s downturn was clear, more recently, the sector has shown
some steady growth. According to Industry Canada’s quarterly report, Canada’s ICT sector
output (GDP) expanded by 1.1% in the third quarter of 2005, keeping pace with growth in the
Canadian economy as a whole. According to the same report “economic activity in the ICT
sector has grown almost continuously since the last quarter of 2001, and the ICT sector’s output
15 Statistic Canada Catalogue no. 56-508-XIE titled Canada’s Journey to the Information Society.
Page 16 of 66

was 18% higher in the third quarter of 2005 than it was at the end of 2001. As a whole, over this
period according to Industry Canada it adds up to the growth of 12.7% for the Canadian
economy.” Overall, the performance of the ICT sector has been impressive as it has grown by
96% since the first quarter of 1997, almost three times as much as the Canadian economy
(+37%).
Figure 8 shows the trend in output of the ICT sector from 1997 Q1 to 2005 Q3. The affect of the
boom and the bust can be clearly seen on the graph. It may also be noted from the Figure 8 that
the sector’s output in 2005 Q3 is higher than what it used to be just before the bust. However, it
is also worth noting that rate of growth since the bust has been much slower.
REAL GDP: ICT sector AND CANADA
0
50
100
150
200
250
1997
.1
1997
.3
1998
.1
1998
.3
1999
.1
1999
.3
2000
.1
2000
.3
2001
.1
2001
.3
2002
.1
2002
.3
2003
.1
2003
.3
2004
.1
2004
.3
2005
.1
2005
.3
TIME PERIOD
GDP ICT Sector
Canada
Figure 8: Real GDP: ICT sector and Canada 16
Figure 9 compares the output of ICT manufacturing and services to the output of the overall
services and manufacturing industries. As for employment, the decline in the ICT manufacturing
output is much more dramatic than the decline in ICT services output. An interesting point to
note here is that although the ICT manufacturing output fell significantly, it was only slightly
below the overall manufacturing output, and since then, has surpassed it. Another interesting
16 Source: Catalogue no. 15-001, CANSIM Tables 379-0017 and 379-0020, Industry Measures and Analysis Division, Statistics Canada.
Page 17 of 66

observation is that the output of ICT services never showed a significant decline even during the
bust period.
ICT and Canada (Manufacturing and Services)
050
100150200250300
1997.11997.3
1998.119
98.31999
.11999.3
2000
.12000.3
2001.12001
.32002.1
2002.320
03.1
2003.320
04.12004.3
2005.120
05.3
Time period
Inde
xed
Gro
wth
ICTManufacturing
ICTServices
ManufacturingCanada
ServicesCanada
Figure 9: ICT and Canada Real GDP (Manufacturing and Services) 17
6.1 Real GDP: ICT sector compared with Canada
I have seen the general trends in ICT output from 1997 – 2005. I shall now examine in depth
how the boom and bust affected major sub-sectors of ICT: manufacturing and services.
6.1.1 ICT Manufacturing Real GDP:
6.1.1.1 Before and during the bust
As expected, the growth in the output of ICT manufacturing followed a trend similar to that
shown by employment in the sector. The growth rate was extremely high during the boom, thus
bringing a major decline during the bust. A sudden growth in demand for ICT related equipment
left suppliers with no other choice than to grow their operations out of control. The crash, 17 Source: Data from Industry Canada Quarterly Monitor of the Canadian ICT Sector, Third Quarter 2005.
Page 18 of 66
therefore, left the suppliers with a lot of unwanted inventory. The trends in ICT manufacturing
sub-sector employment and output paint a very similar picture: both show a period of extremely
high growth just before the bust, followed by a significant decline.
6.1.1.2 After the bust
According to Industry Canada, ICT manufacturing industries grew by a modest 0.3% in the third
quarter of 2005, while Canadian manufacturing as a whole grew by 0.7%. After a decline in the
first quarter of 2004, ICT manufacturing output has expanded for six consecutive quarters. Since
the end of 2001, the ICT manufacturing industries have grown by 36%, driven by sharp increases
of 98% and 60% in the production of electronic components and communications equipment,
respectively. Since the beginning of 1997, output in the ICT manufacturing sub-sector has grown
by 53%, compared to 34% growth in the entire Canadian manufacturing sector. A comparison in
the trends of ICT manufacturing sub-sector employment and output shows a remarkable
discrepancy. Comparing figure 5 and figure 10, I note that while the ICT manufacturing
employment has continued to decline since the 2001 Q1, ICT manufacturing output has shown
growth since 2001 Q4.
Figure 10 shows a breakdown of output of ICT manufacturing by its sub-sectors. The computer
and peripheral sub-sector of ICT manufacturing has had a rollercoaster ride, whereas the
instruments sub-sector has shown remarkable stability in its output, even during the bust. Some
of this can be attributed to the steep rise in demand for computer equipment with the boom of
dot-coms and 1 person companies with no real business models. I discuss this point in more
detail to understand the reasons for the bust.
Page 19 of 66

Real GDP of Selected ICT Manufacturing Industries
0
100200
300400
500
1997.11997.3
1998.11998.3
1999.11999.3
2000.12000.3
2001.12001.3
2002.12002.3
2003.12003.3
2004.12004.3
2005.12005.3
Time period
Inde
xed
Gro
wth
Computer andPeripheralEquipmentCommunicationsEquipment
ElectronicComponents
Instruments
Figure 10: Real GDP of Selected ICT Manufacturing Industries 18
6.1.2 ICT Services Real GDP
6.1.2.1 Before and during the bust
ICT services seem to be growing continuously since 1997. While it is surprising that ICT
services was not affected by the bust, a sneak peek into the breakdown of sub-sectors of ICT
services paint an even interesting picture. A quick comparison of the Figure 10 and Figure 11
above shows that most sub-sectors of ICT manufacturing were having a free fall from the
beginning of 2001 to the first quarter of 2002. At the same time, ICT services were growing
(Figure 9). Only at the beginning of 2002 did ICT services show some signs of weakness. This is
an interesting observation because it shows that during 2001, there was a structural shift from
ICT manufacturing to ICT services. To further elaborate this point, I discuss what happened after
the bust.
18 Source: Data from Industry Canada Quarterly Monitor of the Canadian ICT Sector, Third Quarter 2005.
Page 20 of 66
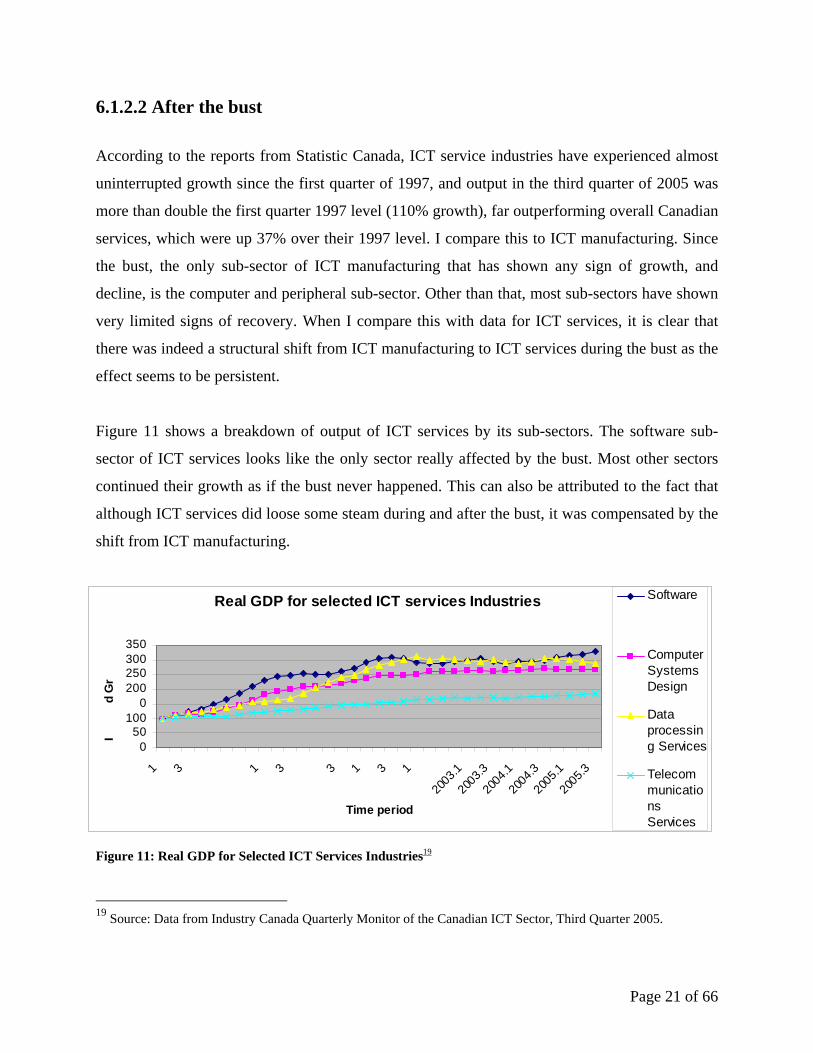
6.1.2.2 After the bust
According to the reports from Statistic Canada, ICT service industries have experienced almost
uninterrupted growth since the first quarter of 1997, and output in the third quarter of 2005 was
more than double the first quarter 1997 level (110% growth), far outperforming overall Canadian
services, which were up 37% over their 1997 level. I compare this to ICT manufacturing. Since
the bust, the only sub-sector of ICT manufacturing that has shown any sign of growth, and
decline, is the computer and peripheral sub-sector. Other than that, most sub-sectors have shown
very limited signs of recovery. When I compare this with data for ICT services, it is clear that
there was indeed a structural shift from ICT manufacturing to ICT services during the bust as the
effect seems to be persistent.
Figure 11 shows a breakdown of output of ICT services by its sub-sectors. The software sub-
sector of ICT services looks like the only sector really affected by the bust. Most other sectors
continued their growth as if the bust never happened. This can also be attributed to the fact that
although ICT services did loose some steam during and after the bust, it was compensated by the
shift from ICT manufacturing.
th
ow
Source: Data from Industry Canada Quarterly Monitor of the Canadian ICT Sector, Third Quarter 2005 15e
ndex
Figure 11: Real GDP for selected ICT Services Industries 19
1997
.19
97.19
98.1
1998
.3
1999
.19
99.20
00.1
2000
.20
01.
2001
.20
02.
2002
.3
Real GDP for selected ICT services Industries
050
1000
200250300350
1 3 1 3 3 1 3 1
2003
.1
2003
.3
2004
.1
2004
.3
2005
.1
2005
.3
Time period
Id
Gr
Software
ComputerSystemsDesign
Dataprocessing Services
TelecommunicationsServices
Figure 11: Real GDP for Selected ICT Services Industries19
19 Source: Data from Industry Canada Quarterly Monitor of the Canadian ICT Sector, Third Quarter 2005.
Page 21 of 66

7. ICT Revenue Data for this section is only available from 1997 to 2004.
7.1 ICT revenue from boom to bust:20
After strong and steady growth throughout much of the 1990s, ICT sector revenues fell by 6.1%
in 2001. The sector contributed about 5.7% of total industry revenue, down from its share of
6.3% in the previous year. Between 1998 and 2001, annual average revenue growth for the ICT
sector was 6.8%, while total revenue growth over the reference period stood at 21.7%. Within
the ICT services sector, ICT wholesaling generated the highest revenues ($36.9 billion), while
telecommunications services followed closely with $32.8 billion. ICT sector services revenue
increased steadily since 1998 – its share of total industry revenue reached 75.1% in 2001.
Revenue for ICT manufacturing peaked in 2000 at $44.7 billion. This represented 30.7% of total
ICT sector revenue, which has since dropped to 24.9% or $34 billion. Communications
equipment manufacturing was responsible for most of the decline.
A look at revenues after the bust (2004) In 2004, ICT manufacturing revenues recovered for the first time after 2000, reaching $26.4
billion. Wireless communication equipment was the largest contributor, making up 33% of the
shipments, followed by electronic components accounting for 6.6% of the ICT manufacturing
revenues. However, computer equipment shipments declined by 18.7%.
On the other hand, ICT services sector revenues increased by 3.8% in 2004 reaching $70 billion.
Cable and other program distribution showed the most growth, which increased by 8.5%,
followed by sales in ISP, data processing and software industries, which grew by 6.1%, 5.6% and
3.3% respectively.
The distribution of ICT sector revenues changed due to growth in the services sector and decline
in the manufacturing sector since 2000. Share of services sector increased from 42% to 52%, and
20 Statistics Canada - Catalogue No. 56-508-XIE.
Page 22 of 66

share of manufacturing sector decreased from 31% to 19% from 2000 to 2004. However, share
of ICT wholesaling, rental and leasing sector remained the same (29%).
Revenues of overall ICT sector grew at a CAGR of 4.9% from 1997 to 2004. The services sector
grew at a CAGR of 9.0%, within which computer systems design and telecommunication
services showed the most increase, accounting for 56% of this growth.
Figure 12 shows a breakdown of ICT revenues by industry.
Distribution of Revenues by ICT Industry2004 (Total: $136 Billion)
Telecommunications ServicesSoftware
Publishers
ICT Wholesaling, Rental and
Leasing
ICT Manufacturing
Cable and Other Program
DistributionISPs and Data
Processing
Computer System Designs
and Related Services
Figure 12: Distribution of Revenues by ICT Industry 21
Table 2 shows a breakdown of ICT revenues by industry from 1997 – 2004. As noted in the ICT
sectors output above, ICT services showed continuous growth through the bust. However, I take
this observation with a pinch of salt. Considering that ICT services sub-sector revenues grew
about 11.9% from 1998-1999, and about 10.5% from 1999-2000, growth did slow down in 2001
when the sub-sector revenues grew only about 6.5%. So it is not entirely true that the bust did not
affect ICT services.
21 Source: Statistic Canada.
Page 23 of 66

ICT Sector Revenues (1997 – 2004)
ICT Sector ($’000,000)
1997 1998 1999 2000 2001 2002 2003 2004
Manufacturing 26,786 29,326 33,707 44,830 34,147 26,552 25,523 26,360
Services 38,356 48,846 54,652 60,368 64,276 65,953 67,401 69,991
ICT Wholesaling, Rental & Leasing
32,131 34,059 38,716 40,165 38,614 38,249 37,276 39,600
Total ICT Sector 97,273 112,232 127,075 145,363 137,037 130,754 130,200 135,951
Table 2 : ICT Sector Revenues22
Table 3 shows percentage change in ICT revenues and compound annual growth rate by
industry. Although all industries with the ICT sector slowed down during the bust, growth has
been positive for all of them between 2003 and 2004.
Growth in ICT Sector Revenues (1997 – 2004)
Industry % Change 2003-2004
% Change 1997-2004
CAGR 1997-2004
ICT Manufacturing 3.3% -1.6% -0,2%
ICT Services 3.8% 82.5% 9.0%
ICT Wholesaling, Rental and Leasing
6.2% 23.2% 3.0%
Total ICT Sector 4.4% 39.8% 4.9%
Table 3: Growth in ICT Sector Revenue23
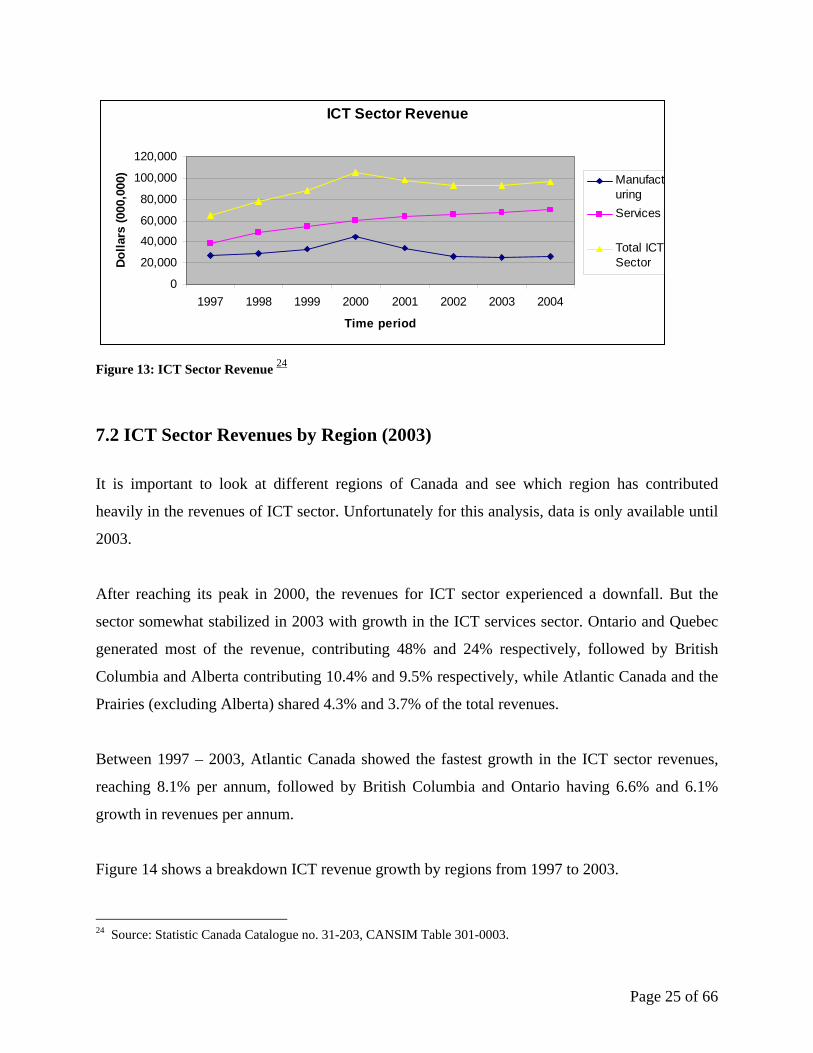
Figure 13 shows a breakdown of ICT sector revenues by main sub-sectors from 1997-2004, and
compares that to overall ICT revenues. As for output, ICT services seems to be unaffected by the
bust.
22 Source: Statistic Canada. 23 Source: Statistic Canada.
Page 24 of 66
ICT Sector Revenue
0
20,000
40,000
60,000
80,000
100,000
120,000
1997 1998 1999 2000 2001 2002 2003 2004
Time period
Dolla
rs (0
00,0
00) Manufact
uringServices
Total ICTSector
Figure 13: ICT Sector Revenue 24
7.2 ICT Sector Revenues by Region (2003)
It is important to look at different regions of Canada and see which region has contributed
heavily in the revenues of ICT sector. Unfortunately for this analysis, data is only available until
2003.
After reaching its peak in 2000, the revenues for ICT sector experienced a downfall. But the
sector somewhat stabilized in 2003 with growth in the ICT services sector. Ontario and Quebec
generated most of the revenue, contributing 48% and 24% respectively, followed by British
Columbia and Alberta contributing 10.4% and 9.5% respectively, while Atlantic Canada and the
Prairies (excluding Alberta) shared 4.3% and 3.7% of the total revenues.
Between 1997 – 2003, Atlantic Canada showed the fastest growth in the ICT sector revenues,
reaching 8.1% per annum, followed by British Columbia and Ontario having 6.6% and 6.1%
growth in revenues per annum.
Figure 14 shows a breakdown ICT revenue growth by regions from 1997 to 2003.
24 Source: Statistic Canada Catalogue no. 31-203, CANSIM Table 301-0003.
Page 25 of 66

ICT Sector Revenues Growth (CAGR 1997 - 2003)
8.10%
4.80%
6.10%
5.60%
4.50%
6.60%
Atlantic
Quebec
Ontario
Prairies
Alberta
British Columbia
Figure 14: ICT Sector Revenues Growth 25
My analysis of ICT sector revenues would not be complete without looking at the revenues
generated by ICT’s main sub-sectors: manufacturing and services.
7.3 ICT Manufacturing Revenues (2003)
ICT manufacturing revenues (for computer and electronic product manufacturing) were $39.6
billion in 2000 but reduced to $22.9 billion in 2003. This was mainly due to the dot-com crash
with which the whole ICT manufacturing came down. However, the decrease in revenues was
much small in 2003 (3.6%) as compared to 2002 (18%) and nearly 30% in 2001.
Among the provinces, Ontario and Quebec contributed over 80% of the ICT manufacturing
revenues with Alberta and British Columbia at 8.0% and 6.0% respectively, followed by Atlantic
Canada and the Prairies (excluding Alberta) with 1.1% and 1.2% of the total generated revenue.
Figure 15 shows a breakdown ICT manufacturing revenues by regions in 2003. With the recent
rise in oil prices and a resulting boom in oil rich Alberta, there is a big chance that this
distribution has changed in 2003. Unfortunately, I do not have statistics to substantiate this
claim.
25 Source: Statistic Canada.
Page 26 of 66

Distribution of ICT Sector Manufacturing Revenues by Region, 2003 ($22.9 Billion)
Quebec, 30%
Ontario, 54%
British Columbia Atlantic, 1%
Alberta, 8%
Prairies, 1%
Figure 15 : Distribution of ICT Sector Manufacturing Revenues by Region 26
Figure 16 shows a breakdown of CAGR of ICT manufacturing by regions.
ICT Manufacturing Revenues Growth (CAGR 1997 - 2003)
10.30%
-5.50%
-4.30%
3.90%
-1.20%
-0.90%
Atlantic
Quebec
Ontario
Prairies
Alberta
British Columbia
Figure 16: ICT Manufacturing Revenues Growth 27
In 2003, British Columbia experienced the most growth in revenues, showing an increase of
13.2%, followed by Atlantic Canada and the Prairies with 11.8% and 7.7% growth in the
revenues but still making a very small proportion of the national revenues. On the other hand,
26 Source: Statistic Canada. 27 Source: Statistic Canada.
Page 27 of 66

Alberta, Ontario and Quebec experienced a decline of 9.6%, 4.3% and 4.5% respectively in their
ICT manufacturing revenues. Once again, more recent data may be significantly different.
7.4 ICT Services Revenues (2004)
ICT services revenues have showed a totally different picture then the ICT manufacturing
revenues. Looking at Figure 13, I observe that the ICT services revenues have been steady
through out the boom and bust of ICT, and beyond. This is a different result compared to the ICT
manufacturing sub-sector. “Software and Computer” and “Communication” industries are the
highest contributor of revenues in the ICT services sub-sector. As such, I now examine the affect
of boom and bust on these specific industries to determine the affect of boom and bust on the
ICT services revenues.
7.4.1 Software and Computer Services Revenues (2003)
The software and computer services industries experienced a continuous rise in revenues since
1997. In 2003, its revenues increased by 4.3%, reaching $27.3 billion..
About 53% of the total revenues for this sub-sector came from Ontario. Quebec came second
with 21% share of the total revenues, followed by Alberta with 9.4% and British Columbia with
10.2% share of the national revenues. Figure 17 shows a breakdown of Software and Computer
Services revenues by regions.
Page 28 of 66

Distribution of Softw are & Com puter Services Revenues by Region, 2003 ($27.3 Billion)
Atlantic, 3%
Quebec, 21%
Ontario, 53%
Prairies, 3%
Alberta, 9%
British Colum bia, 10%
Figure 17: Distribution of Software and Computer Services Revenue 28
The Figure 18 shows a breakdown of Software and Computer Services CAGR by region from
1997 – 2003.
Software & Computer Services Revenues Growth (CAGR 1997 - 2003)
13.40%
14.50%
13.70%
13.20%
12.00%
13.10%
Atlantic
Quebec
Ontario
Prairies
Alberta
British Columbia
Figure 18: Software & Computer Services Revenues Growth 29
Between 1997 and 2003, Quebec experienced the most growth in the software and computer
services sub-sector with CAGR of 14.5%, followed by Ontario, Atlantic Canada and The Prairies
with a CAGR of 13.7%, 13.4% and 13.2% respectively.
28 Source: Statistic Canada. 29 Source: Statistic Canada.
Page 29 of 66
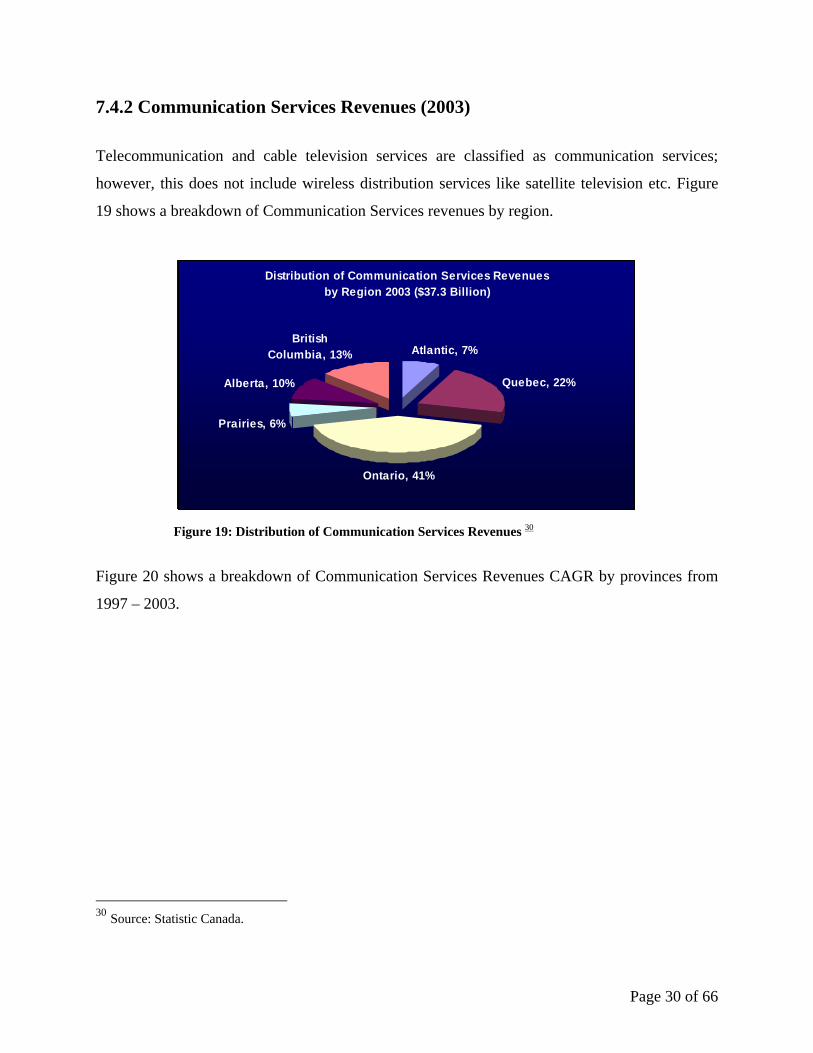
7.4.2 Communication Services Revenues (2003)
Telecommunication and cable television services are classified as communication services;
however, this does not include wireless distribution services like satellite television etc. Figure
19 shows a breakdown of Communication Services revenues by region.
Distribution of Communication Services Revenues by Region 2003 ($37.3 Billion)
Atlantic, 7%
Quebec, 22%
Ontario, 41%
Prairies, 6%
Alberta, 10%
British Columbia, 13%
Figure 19: Distribution of Communication Services Revenues 30
Figure 20 shows a breakdown of Communication Services Revenues CAGR by provinces from
1997 – 2003.
30 Source: Statistic Canada.
Page 30 of 66

Communication Services Revenues Growth(CAGR 1997 - 2003)
4.60%
6.40%Alberta
Prairies 5.10%
Ontario 7.80%
Quebec 5.70%
Atlantic 6.70%
British Columbia
Figure 20: Communication Services Revenues Growth 31
Distribution of these services closely matches the demographic dispersion of local population as
these services are mainly for individual and household customers. Between 1997 and 2003,
revenues for these industries grew by 6.5%. However, the growth was slow in recent few years
mainly due to contractions in the Ontario and Quebec region.
Communication services revenues were $37.3 billion in 2003, out of which Ontario’s share was
41% and Quebec contributed another 22%. British Columbia, Alberta, Atlantic Canada and The
Prairies contributed 13.3%, 10.4%, 7.4% and 5.6%, respectively.
8. Overview of ICT Expenditures
Expenditure within a sector is not only a good indication of its present health, but also its future.
Expenditures in ICT can be divided in to two sections: R&D expenditure and Capital
expenditure.
31 Source: Statistic Canada.
Page 31 of 66

8.1 Contribution of Research and Development to ICT
Telecommunications sub-sector of ICT has been the top R&D performing industry for many
years in Canada. It would be interesting to look at how R&D expenditure changed during and
after the bust.
From Boom to Bust32:
Over the period of 1994 up to 2000 the ICT sector has spent about $26.9 billion on research and
development. ICT sector’s R&D expenditures grew at an annual average rate of about 8.6%
between these years which is about 2% more then that of annual average of private sector’s R&D
expenditure.
Taking a look at how R&D expenditure was distributed between the manufacturing and services
industries, notice that it grew at an annual average rate of 11% and at an overall rate of 86.6%
between 1994 and 2000 in the manufacturing domain; where as, for the service industries, it
increased little over this period at an annual average rate of 2.3% contributing to a slower
growth. In 2001, there was some amount of increase in R&D expenditure as well. But the picture
changed after that. I discuss this further in the next section.
A look at the distribution of R&D expenditure by provinces and regions reveal that before and
during the bust, Ontario was the highest contributor to R&D spending in all of Canada. Ontario’s
share to R&D in 2002 was 69% of the total Canadian R&D expenditures. With other provinces
not even making half of it. Figure 21 shows the distribution of R&D expenditure by provinces
and regions as of 2002.
32 Statistic Canada Catalogue No. 56-506-XIE titled Information and Communication in Canada, a statistical profile of the ICT sector.
Page 32 of 66

Distribution of ICT Sector R&D Expenditures by Region2002 (5.2 Billion)
Quebec, 18%
Ontario, 69%
British Columbia, 7%
Atlantic, 1%
Prairies, 5%
Figure 21: Distribution of ICT Sector R&D Expenditures by Region33
In 2002, all the provinces saw a decrease in the R&D spending. Ontario experienced the steepest
decline of almost 25%, from $4.7 billion to $3.5 billion. British Columbia, Atlantic Canada, and
Quebec also experienced a drop of 23%, 22%, and 19% respectively. The Prairies (including
Alberta) showed some stability in their R&D spending.
Considering the period leading up to the bust (1997 – 2003), the highest growth in the ICT
sector’s R&D was observed in British Columbia with a CAGR of 13.8%, while Atlantic Canada
was the only province that showed a decline in their R&D spending from 1997 to 2002.
33 Source: Statistic Canada.
Page 33 of 66

ICT R&D Spending Growth (CAGR 1997 - 2002)
10.70%
7.00%
5.40%
13.80%
-3.30% Atlantic
Quebec
Ontario
Prairies
British Columbia
Figure 22: ICT R&D Spending Growth34
Looking at what percentage of total R&D expenditure each province puts towards ICT, Ontario
still leads all other provinces and regions. Figure 23 shows percentage of total R&D expenditures
devoted to ICT by region and provinces. It also compares that to the portion of R&D expenditure
dedicated to ICT in Canada.
Percentage of Total R&D Expenditures Devoted to ICT by Region, 2001 - 2003
70.00%
60.00%50.00%
40.00%
30.00%
20.00%10.00%
0.00%Canada Atlantic Quebec Ontario Prairies British
Columbia
2001 2002 2003
Figure 23: Percentage of Total R&D Expenditures Devoted to ICT by Region35
34 Source: Statistic Canada. 35 Source: Statistic Canada.
Page 34 of 66

The ICT sector saw significant decline in the R&D spending in 2002; however, it still remained a
major contributor to the overall provincial R&D spending. ICT’s R&D accounted for more than
50% of the total R&D spending for Ontario, followed by 39% in British Columbia (including
Territories) and 28% for the Prairies (including Alberta). Quebec and Atlantic Canada’s
spending on ICT R&D were 25% and 22% respectively (of their total R&D spending).
Note: Regional data for the year 2003 is not available yet. However, based on the 2003 national
data, I can predict that the reduction in the importance of ICT R&D spending may have
stabilized.
After the Bust
For the year 2005, overall Canadian R&D expenditures (private sector) are expected to reach
$13.8 billion, which is an increment of 1.6% from previous year. R&D expenditures for ICT are
expected to recover by 2.0% ($103 million) in 2005 with total expenditures of $5.2 billion. The
ICT sector experienced a decline in R&D investments for three years but still remains the largest
contributor to the national R&D investments. Figure 24 shows a breakdown of R&D
expenditures by ICT industries as of 2005.
Distribution of R&D Expenditures by ICT Industry, 2005 Intentions (Total: 5.2 Billion)
Com puter System Designs
and Related Services, 20.60%
Other, 4.70%
Com m municationEquipment/Wire
and Cable Manufacturing,
31.70%
Softw are Publishers, 7.70%
Electronic Com ponent
Manufacturing, 15.50%
Instrum ents Manufacturing,
7.50%
Com puter Equipm ent
Manufacturing, 3.40%
Com m munications Services, 8.80%
Figure 24: Distribution of R&D Expenditures by ICT Industry, 2005 36
36 Source: Statistic Canada.
Page 35 of 66
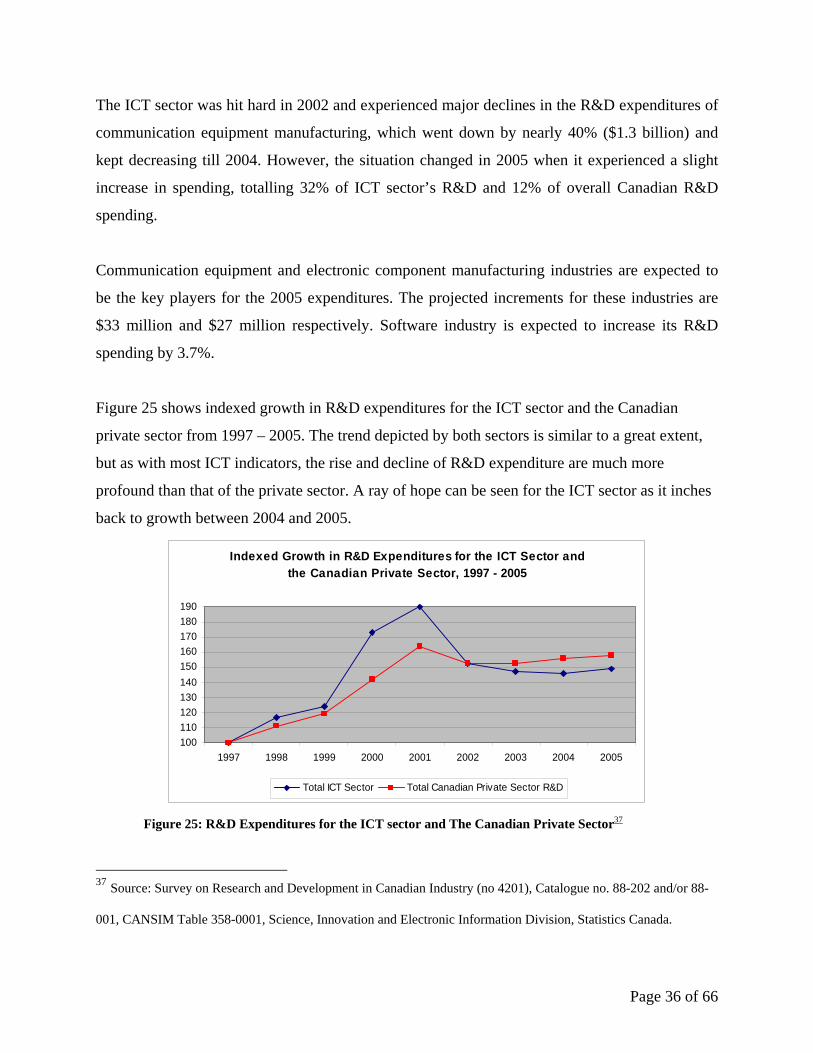
The ICT sector was hit hard in 2002 and experienced major declines in the R&D expenditures of
communication equipment manufacturing, which went down by nearly 40% ($1.3 billion) and
kept decreasing till 2004. However, the situation changed in 2005 when it experienced a slight
increase in spending, totalling 32% of ICT sector’s R&D and 12% of overall Canadian R&D
spending.
Communication equipment and electronic component manufacturing industries are expected to
be the key players for the 2005 expenditures. The projected increments for these industries are
$33 million and $27 million respectively. Software industry is expected to increase its R&D
spending by 3.7%.
Figure 25 shows indexed growth in R&D expenditures for the ICT sector and the Canadian
private sector from 1997 – 2005. The trend depicted by both sectors is similar to a great extent,
but as with most ICT indicators, the rise and decline of R&D expenditure are much more
profound than that of the private sector. A ray of hope can be seen for the ICT sector as it inches
back to growth between 2004 and 2005.
Indexed Growth in R&D Expenditures for the ICT Sector and the Canadian Private Sector, 1997 - 2005
100110120130140150160170180190
1997 1998 1999 2000 2001 2002 2003 2004 2005
Total ICT Sector Total Canadian Private Sector R&D
Figure 25: R&D Expenditures for the ICT sector and The Canadian Private Sector37
37 Source: Survey on Research and Development in Canadian Industry (no 4201), Catalogue no. 88-202 and/or 88-
001, CANSIM Table 358-0001, Science, Innovation and Electronic Information Division, Statistics Canada.
Page 36 of 66

R&D expenditures have grown at a CAGR of 5.1% during 1997 – 2005 periods, whereas the
overall Canadian R&D spending grew at 5.9% for the same period. This was mainly due to
reduction in R&D spending in 2002, which made the ICT sector’s share of R&D to overall
Canadian R&D drop from 49% in 2000 to 38% in 2005.
Table 4 presents a breakdown of ICT expenditure by industries from 1997 – 2005. It is
interesting to note that while R&D expenditure in manufacturing suffered continuously from
2001 to 2004, investment in R&D services, although more tamed since 2001, continued to grow.
The table also shows that the growth in the manufacturing R&D expenditure was highest
between 1999 and 2000, when it grew by 36%. Growth in ICT services R&D expenditures was
most profound between 2000 and 2001, when it grew by a whopping 52%
ICT Sector Intramural R&D Expenditures (1997 – 2005)
(Manufacturing and Services)
Industry ($'000,000)
1997 1998 1999 2000 2001 2002 2003 2004 2005
ICT Manufacturing 2,702 3,238 3,472 4,729 4,859 3,482 3,079 3,035 3,112
ICT Services 739 814 854 1,087 1,659 1,773 1,943 1,951 1,975
ICT Wholesaling, Rental & Leasing
85 70 59 296 170 136 159 160 161
Total ICT Sector 3,526 4,123 4,385 6,112 6,687 5,390 5,181 5,146 5,249
Total Canadian
Private Sector R&D 8,739 9,682 10,400 12,450 14,320 13,367 13,391 13,630 13,848
ICT R&D as a Percentage of
Canadian Private Sector R&D
40.3% 42.6% 42.2% 49.1% 46.7% 40.3% 38.7% 37.8% 37.9%
Table 4: ICT Sector R&D Expenditures38
38 Source: Statistic Canada CANSIM Table 358-0001.
Page 37 of 66

One does not get a complete appreciation of how quickly and profoundly expenditures in ICT
manufacturing grew by looking at the percentage change in expenditure between 1997 and 2005.
Expenditure in the sector rose and fell sharply, making the overall change just 15.2% between
1997 and 2005. In comparison, percentage change in ICT services expenditures present a more
remarkable sight. This is consistent to our observation for output of ICT services. Table 5 shows
growth in ICT sectors R&D expenditures from 1997 to 2005
Growth in ICT Sector Intramural R&D Expenditures (1997 – 2005)
(Manufacturing and Services)
Industry % Change
2004-2005
% Change
1997-2005
CAGR
1997-2005
ICT Manufacturing 2.5% 15.2% 1.8%
ICT Services 1.2% 167.2% 13.1%
ICT Wholesaling,
Rental & Leasing 1.0% 89.3% 8.3%
Total ICT Sector 2.0% 48.8% 5.1%
Total Canadian Private
Sector R&D 1.6% 58.5% 5.9%
Table 5: Growth in ICT sector Intramural R&D Expenditures(1997 – 2005)39
8.2 Current Picture of Capital Expenditure
While companies need to continually invest in R&D to maintain their competitive advantage,
they also need, from time to time, to buy or upgrade physical assets or equipment. This
expenditure is usually called capital expenditure as it increases the capital assets of a company.
In 2005, the capital expenditures of the ICT sector are expected to increase (for a second 39 Source: Survey on Capital and Repair Expenditures (no 2803), Catalogue no. 61-205, Investment and Capital Stock Division, Statistics Canada.
Page 38 of 66

consecutive year), totalling to $11.5 billion, an increase of 4.9% from 2004, whereas the overall
Canadian capital expenditures are expected to grow by 8.4%.40 Let us take a look at how capital
expenditures fared before and during the bust, and beyond.
Before and during the bust
By nature, capital expenditures are long term investments. Before the bust, when expectations of
growth were high, it was easy to justify long term growth plans, and thus, huge capital expenses.
As the orders sagged, so did capital investment in the sector. Figure 26 compares indexed growth
in capital expenditures of the ICT sector and the Canadian economy from 2000 – 2005. It is
evident that huge capital investments were being made in ICT even up to 2001. It nose-dived
between 2001 and 2003, but has since picked up a bit.
Indexed Growth in Capital Expenditures for the ICT Sector and the Canadian Economy, 2000 - 2005
70
80
90
100
110
120
130
2000 2001 2002 2003 2004 2005
Total ICT Sector Total Canadian Capital Expenditures
Figure 26: Indexed Growth in Capital Expenditure for the ICT sector and Canadian economy41
As expected, capital expenditures are made in both the manufacturing and services industry. Let
us take a look the state of capital expenditures in these two industries. The distribution of capital
expenditures is highly unequal between manufacturing and services industries. Figure 27 shows
40 Information and Communications Technologies Statistical Overview by Industry Canada. 41 Source: Statistic Canada.
Page 39 of 66

an estimate of the distribution of capital expenditures in ICT by segment. There is no comparison
between the investments in ICT services and ICT manufacturing.
Distribution of Capital Expenditures by ICT Segment2005 Intentions (Total: $9.6 Billion)
ICT Services, 83.40%
ICT Wholesaling,
Rental and Leasing, 10.10%
ICT Manufacturing,
6.50%
Figure 27: Distribution of Capital Expenditures by ICT Segment 200542
8.2.1 Manufacturing
Although in ICT manufacturing, capital investments is much lower than capital investments in
ICT services, investments are estimated to increase in manufacturing by 22.2% in 2005, making
$752 million for the sector. Instruments, electric components and communication equipment
industries are expected to have the largest increases, accounting for 30.7%, 29.3% and 26.5%,
respectively. However, ICT wholesaling, rental and leasing industries are expected to remain
stable at $1.16 billion after declines experienced in 2003 and 2004.
8.2.2 Services:
The ICT services sector is set to increase its investments in 2005 by 4.4% to $9.6 billion. This is
mainly due to increase in spending by communication services industries, which includes
telecommunication and cable program distribution. Also, data processing services, ISPs and web
42 Source: Statistic Canada.
Page 40 of 66

search portals industries intend to spend more in 2005; however, according to Statistics Canada,
the computer systems design industry intend to reduce its capital investments.
I have already highlighted that the difference in capital expenditures in ICT services and
manufacturing is large. But a look at the trends followed by both before and during the bust
reveals that they both behaved remarkably similar to each other. Capital expenditures in both
ICT services and manufacturing started to decline in 2001 and continued the downward trend
until 2003. Figure 28 compares ICT capital expenditures in services and manufacturing
industries.
ICT Capital Expenditure
02,0004,0006,0008,000
10,00012,00014,000
2000 2001 2002 2003 2004 2005
Time period
$000
,000 ICT ManufacturingICT Services
Figure 28: ICT Capital Expenditure 2000 - 200543
While capital expenditures in both ICT services and manufacturing declined significantly
between 2001 and 2003, the decline was more prominent in ICT manufacturing. This may come
as a surprise because in Figure 28, the rate of decline of capital expenditures in ICT services
seems to be higher than that of ICT manufacturing. However, the Figure 28 may be a bit
deceiving in the sense that although capital expenditures in ICT services have declined more
sharply in dollars, the percentage change has been less than that of ICT manufacturing. Between
2001 and 2002, capital expenditures in ICT services declined by 19% and between 2002 and
43 Source: Statistic Canada.
Page 41 of 66

2003 by about 15%; capital expenditures in ICT manufacturing declined by 46% and 40.5%
during the same time periods.
Table 6 presents a breakdown of capital expenditures by industries from 2000 – 2005. It also
shows ICT sector’s share of overall Canadian capital expenditures.
ICT Sector Capital Expenditures (2000 – 2005)
Industry
($’000,000) 2000 2001 2002 2003 2004 2005
ICT Manufacturing 1,844 1,755 933 555 615 752
ICT Services 10,736 11,984 9,707 8,252 9,213 9,617
ICT Wholesaling,
Rental & Leasing 1,525 1,734 1,890 1,401 1,160 1,159
Total ICT Sector 14,106 15,473 12,530 10,208 10,988 11,527
Total Canadian
Capital Exp. 153,702 160,307 158,611 163,242 173,661 188,257
ICT Capital Exp. as
a % of Canadian
Capital Exp.
9.2% 9.7% 7.9% 6.3% 6.3% 6.1%
Table 6 : ICT sector Capital Expenditure
ICT sector’s share of overall Canadian capital expenditures is expected to decline to 6.1% in
2005 because of major cut backs in 2002 and 2003. Within the ICT services industries, the
communication services industries remains the largest capital investor with investments reaching
$7.5 billion in 2005 accounting for 65% of the total ICT sector’s capital expenditures.
The table below shows the growth, or rather the decline, in ICT sector capital expenditures from
2000 – 2005. Consistent with other data I have looked at, the decline in capital expenditure in
ICT manufacturing is much higher than other industries within the sector.
Page 42 of 66

Growth in ICT Sector Capital Expenditures (2000 – 2005)
Industry % Change
2004 – 2005
%Change
2000 – 2005
CAGR
2000 – 2005
ICT Manufacturing 22.2% -59.2% -16.4%
ICT Services 4.4% -10.4% -2.2%
ICT Wholesaling, Rental &
Leasing -0.1% -24.0% -5.3%
Total ICT Sector 4.9% -18.3% -4.0%
Total Canadian Capital
Expenditures 8.4% 22.5% 4.1%
Table 7: Growth in ICT Sector Capital Expenditure44
9. International Trade and ICT
Canada has leveraged growth in the ICT sector to increase its exports of ICT goods, especially to
the US. United States was, and still is, the biggest importer of ICT goods from Canada. Before I
start a discussion on the impact of ICT sector fluctuations on International trade, it is worth
noting that International Trade data for ICT is only available from 1997 to 2004.
Exports of ICT Goods by Destination, Value and Share at the time of Bust
Canada was not the only country to suffer significant decline in ICT goods and services. The
same trend was observed in the US, which is the biggest market for Canadian ICT products and
services. At the time of the bust, the shipments to the United States dropped by 32.1% in 2001.
In 2001, exports to the U.S. accounted for 81.5% of all exports of ICT goods, compared to
80.0% in 1995. Canada’s next biggest importer was Asia-Pacific region, whose imports for
Canadian goods also went down by 8.3% in 2001 to a value of $1.7 billion. Despite a slight
44 Source: Statistic Canada.
Page 43 of 66
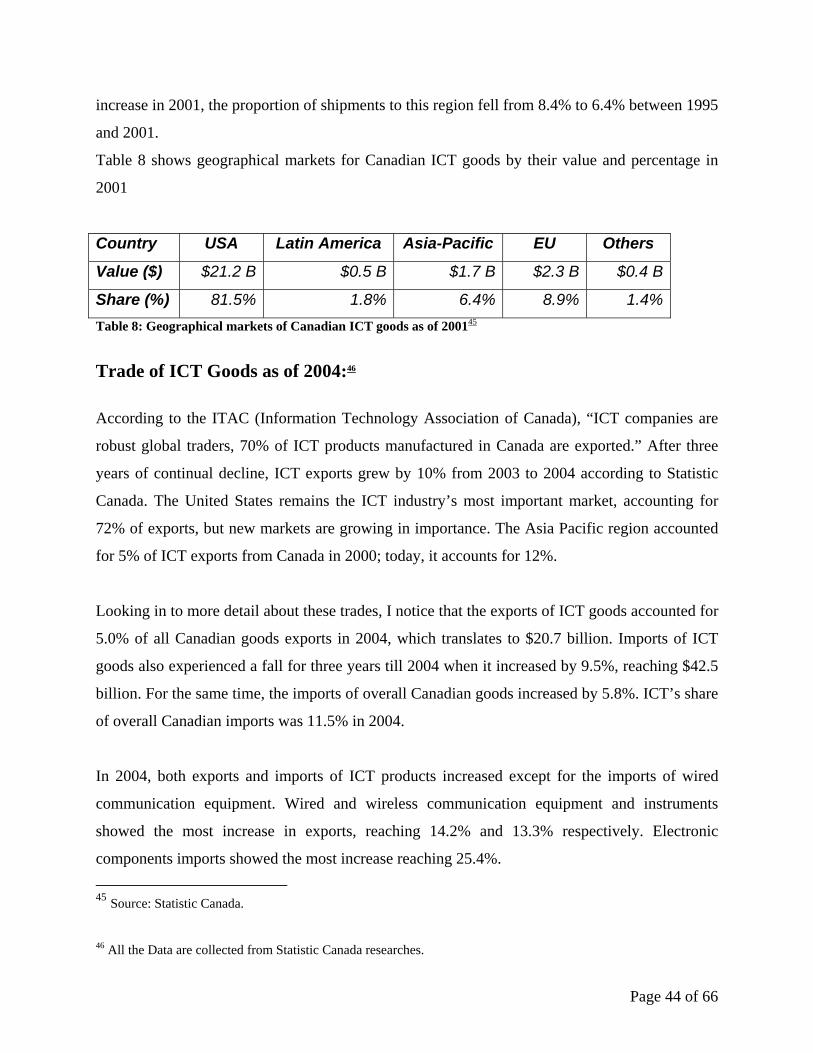
increase in 2001, the proportion of shipments to this region fell from 8.4% to 6.4% between 1995
and 2001.
Table 8 shows geographical markets for Canadian ICT goods by their value and percentage in
2001
Country USA Latin America Asia-Pacific EU Others
Value ($) $21.2 B $0.5 B $1.7 B $2.3 B $0.4 B
Share (%) 81.5% 1.8% 6.4% 8.9% 1.4%Table 8: Geographical markets of Canadian ICT goods as of 200145
Trade of ICT Goods as of 2004:46
According to the ITAC (Information Technology Association of Canada), “ICT companies are
robust global traders, 70% of ICT products manufactured in Canada are exported.” After three
years of continual decline, ICT exports grew by 10% from 2003 to 2004 according to Statistic
Canada. The United States remains the ICT industry’s most important market, accounting for
72% of exports, but new markets are growing in importance. The Asia Pacific region accounted
for 5% of ICT exports from Canada in 2000; today, it accounts for 12%.
Looking in to more detail about these trades, I notice that the exports of ICT goods accounted for
5.0% of all Canadian goods exports in 2004, which translates to $20.7 billion. Imports of ICT
goods also experienced a fall for three years till 2004 when it increased by 9.5%, reaching $42.5
billion. For the same time, the imports of overall Canadian goods increased by 5.8%. ICT’s share
of overall Canadian imports was 11.5% in 2004.
In 2004, both exports and imports of ICT products increased except for the imports of wired
communication equipment. Wired and wireless communication equipment and instruments
showed the most increase in exports, reaching 14.2% and 13.3% respectively. Electronic
components imports showed the most increase reaching 25.4%. 45 Source: Statistic Canada.
46 All the Data are collected from Statistic Canada researches.
Page 44 of 66

Trade deficit of Canada for ICT goods increased by 8.6% in 2004 accounting for $21.7 billion.
Most of trade deficit was caused by loss in exports of Computer equipment, which accounted for
41% of this deficit. The audio/video equipment and instruments also contributed largely to this
deficit, accounting to 23% and 20% respectively.
The only ICT product group showing a positive balance for more than ten years was the wired
communication equipment group, which showed a trade surplus of $2.5 billion in 2004
regardless of the loss in exports in 2000.
The Export Development Canada (EDC) expects that the export of telecommunication
equipment will grow by 8% in 2005 and by 5% in 2006. Also exports of computers and
peripheral devices, semiconductor instruments, satellites and electrical equipment are expected to
grow by 3% for the year 2005 and 2006.
Table 9 shows the growth in imports and exports of ICT goods from 1997 – 2004 as well as the
compound annual growth rates for trade for the same period. This is not a pretty picture for
Canada as it seems that even though exports of ICT goods increased by 10.5% between 2003 and
2004, the overall change from 1997 to 2004 remains negative. Even the CAGR for exports of
ICT goods remain negative.
Growth in Trade of ICT Goods (1997 – 2004)
ICT Goods % Change
2003-2004
% Change
1997-2004
CAGR
1997-2004
Exports 10.5% -6.3% -0.9%
Imports 9.5% 8.0% 1.1%
Table 9: Growth in Trade of ICT Goods47
47 Source: Industry Canada
Page 45 of 66
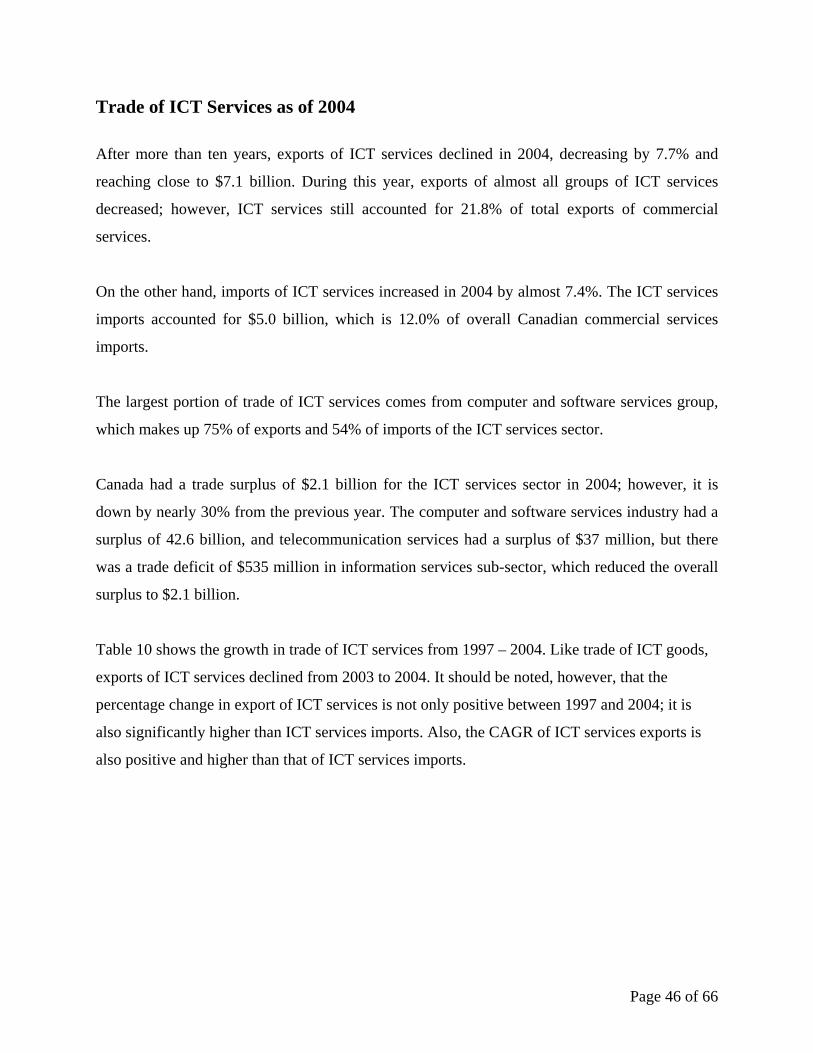
Trade of ICT Services as of 2004
After more than ten years, exports of ICT services declined in 2004, decreasing by 7.7% and
reaching close to $7.1 billion. During this year, exports of almost all groups of ICT services
decreased; however, ICT services still accounted for 21.8% of total exports of commercial
services.
On the other hand, imports of ICT services increased in 2004 by almost 7.4%. The ICT services
imports accounted for $5.0 billion, which is 12.0% of overall Canadian commercial services
imports.
The largest portion of trade of ICT services comes from computer and software services group,
which makes up 75% of exports and 54% of imports of the ICT services sector.
Canada had a trade surplus of $2.1 billion for the ICT services sector in 2004; however, it is
down by nearly 30% from the previous year. The computer and software services industry had a
surplus of 42.6 billion, and telecommunication services had a surplus of $37 million, but there
was a trade deficit of $535 million in information services sub-sector, which reduced the overall
surplus to $2.1 billion.
Table 10 shows the growth in trade of ICT services from 1997 – 2004. Like trade of ICT goods,
exports of ICT services declined from 2003 to 2004. It should be noted, however, that the
percentage change in export of ICT services is not only positive between 1997 and 2004; it is
also significantly higher than ICT services imports. Also, the CAGR of ICT services exports is
also positive and higher than that of ICT services imports.
Page 46 of 66

Growth in Trade of ICT Services (1997 – 2004)
ICT Services % Change
2003-2004
% Change
1997-2004
CAGR
1997-2004
Exports (Receipts) -7.7% 70.2% 7.9%
Imports (Payments) 7.4% 38.5% 4.8%
Table 10: Growth in Trade of ICT services48
Table 11 shows a combined view of ICT goods and services trade between 1997 and 2004. An
analysis of the data shows that the trade balance of ICT goods and services has remained
negative before, during and after the bust. One of my observations is that the balance has
remained more or less constant from 1997 to 2004.
Trade of ICT Goods and Services (1997 – 2004)
ICT Goods & Services
($'000,000) 1997 1998 1999 2000 2001 2002 2003 2004
Exports 26,312 28,784 32,110 44,220 33,225 28,315 26,473 27,855
Imports 42,892 46,726 51,253 61,371 51,434 46,903 43,409 47,438
Trade Balance -16,580 -17,942 -19,142 -17,151 -18,209 -18,588 -16,936 -19,583
Table 11: Trade of ICT Goods and Services49
Figure 29 shows the same information graphically. It is remarkable that both the imports and
exports of ICT good and services have followed the same trend. They look like almost parallel
lines on the Figure 29, with both of them peaking in 2001, declining till 2003 and then beginning
to return to growth in 2004. Rate of growth of ICT goods and services exports, however, seem to
be lagging behind slightly as compared to imports.
48 Source: Industry Canada.
49 Source: Industry Canada.
Page 47 of 66
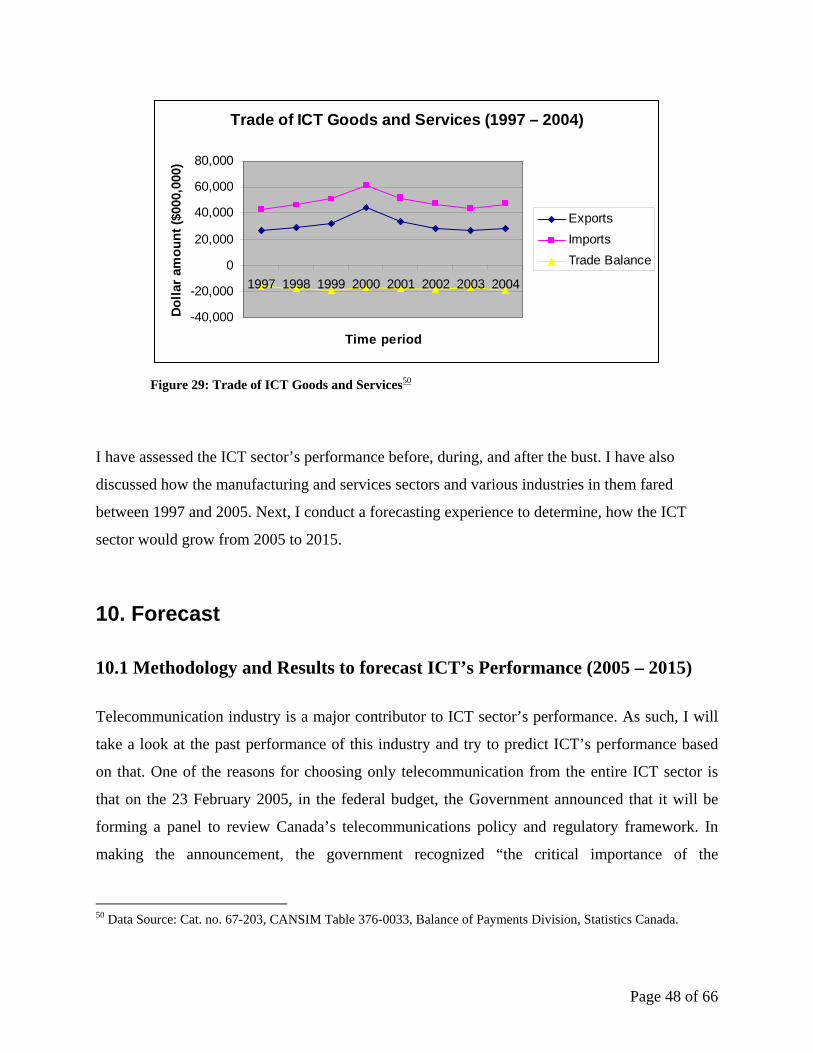
Trade of ICT Goods and Services (1997 – 2004)
-40,000
-20,000
0
20,000
40,000
60,000
80,000
1997 1998 1999 2000 2001 2002 2003 2004
Time period
Dolla
r am
ount
($00
0,00
0)
ExportsImportsTrade Balance
Figure 29: Trade of ICT Goods and Services50
I have assessed the ICT sector’s performance before, during, and after the bust. I have also
discussed how the manufacturing and services sectors and various industries in them fared
between 1997 and 2005. Next, I conduct a forecasting experience to determine, how the ICT
sector would grow from 2005 to 2015.
10. Forecast
10.1 Methodology and Results to forecast ICT’s Performance (2005 – 2015)
Telecommunication industry is a major contributor to ICT sector’s performance. As such, I will
take a look at the past performance of this industry and try to predict ICT’s performance based
on that. One of the reasons for choosing only telecommunication from the entire ICT sector is
that on the 23 February 2005, in the federal budget, the Government announced that it will be
forming a panel to review Canada’s telecommunications policy and regulatory framework. In
making the announcement, the government recognized “the critical importance of the
50 Data Source: Cat. no. 67-203, CANSIM Table 376-0033, Balance of Payments Division, Statistics Canada.
Page 48 of 66

telecommunications sector to Canada’s future well being.” In announcing this review panel the
government recognized that telecommunications policy is to benefit consumers and industry.
The panel was formed in an announcement of 11 April 2005 by then Industry Minster David
Emerson. He indicated that the mandate of the panel is to make recommendations for a 21st
century model of regulation for Canada’s telecommunications sector. The objective set for the
panel was stated as follows:
“The government’s objective is to ensure that Canada has a strong, internationally competitive
telecommunications industry, which delivers world class affordable services and products for the
economic and social benefits of all Canadians in all regions of Canada.”
As presented in earlier section and the evidence suggests that the telecommunications sector is a
strong driver of overall economic performance (which is a similar conclusion as that of a report
presented by IAC).51
Trethewa (2005) discusses the concept of evaluating and forecasting the performance of a sector.
The main entity I would use to evaluate performance in this paper is the estimated NPV of
economic gains contributed by the telecommunications sector between 2005 and 2015. I will
achieve this by calculating growth projections including and excluding the telecom sub-sector.
Including telecom and other ICT sub-sectors, the forecasted growth rate of Canadian GDP was
obtained from the Conference Board of Canada, which forecasts economic growth of 2.6% per
annum between 2006 and 2025.
The baseline growth was computed by:
Forecasted economic growth – annual contribution of ICT to economic growth
(1981 -2004)
Which comes to 2.1 (2.6 - 0.5)
51 Report from International Association of Canada .
Page 49 of 66

To calculate GDP growth (with telecom) involves adding telecommunication’s share of ICT
contribution to GDP growth to the bottom line growth rate of 2.1%.
The lower and upper bound contribution of telecom to ICT is assumed to be 30% and 70%
respectively. I then scaled the ICT contribution to GDP growth by these telecom percentages and
added these values to the baseline growth rate of 2.1%. Below are the upper and lower bound
GDP growth rates which include the telecom sub-sector:
• Upper bound 70%: 2.1% + (0.3*(0.5%)) = 2.250%
• Lower bound 30%: 2.1% + (0.7 * (0.5%)) = 2.450%
I then calculate the projected GDP for both the ICT sector and the whole economy.
• With telecom: = tGDP2005
mwithteleco2005 )r (1*GDP−
+t
• Without telecom: = tGDP2005
lecomwithout te2005 )r(1*GDP−
+t
Baseline growth rate 2.10 % Lower bound 2.450%
10 year Benchmark bond yields 4.12 % Upper bound 2.250 %
NPV t= )1(,, rGDPGDP ecomwithoutteltmwithtelecot +÷−
Discount rate (r) = 4.12% which is 10 year benchmark bond yield.
Using the method described above, the following table forecasts projected GDP with and without
the telecom sector and the NPV from 2005 to 2015.
Page 50 of 66

Year Projected GDP
with telecom
Projected GDP
without telecom
Difference
b/w the two
Net Present
Value (NPV)
2005 $1,083,916 $1,083,916 $0 $0.00
2006 $1,110,472 $1,106,678 $3,794 $3,643.59
2007 $1,137,679 $1,129,918 $7,760 $7,452.96
2008 $1,165,552 $1,153,647 $11,905 $11,433.79
2009 $1,194,108 $1,177,873 $16,234 $15,591.91
2010 $1,223,363 $1,202,609 $20,755 $19,933.34
2011 $1,253,336 $1,227,863 $25,472 $24,464.28
2012 $1,284,042 $1,253,649 $30,394 $29,191.13
2013 $1,315,501 $1,279,975 $35,526 $34,120.46
2014 $1,347,731 $1,306,855 $40,877 $39,259.05
2015 $1,380,751 $1,334,299 $46,452 $44,613.90
Total $13,496,450 $13,257,282 $239,168 $229,704.40
Table 12: Projected GDP with and without Telecom
Figure 30 shows the base growth in GDP (1.9% per annum) without the historical contribution of
ICT.
$0$200,000$400,000$600,000$800,000
$1,000,000$1,200,000$1,400,000$1,600,000
2005
2006
2007
2008
2009
2010
2011
2012
2013
2014
2015
Period
Dolla
r
Projected GDP with telecom
Projected GDP withouttelecom
Figure 30: Projected GDP with and without Telecom 2005 - 2015
Page 51 of 66

One can compute the cumulative impact of ICT’s contribution to GDP growth by using the
standard accounting method, “accumulated economic benefit”, by discounting the contributions
in each year and summing to produce the Net Present Value (NPV). Using this approach, the
NPV of ICT’s contribution to economic growth, discounted at 4.12% per annum, is roughly
$$239,168, while the NPV of the telecommunications contribution is between $3,643.59 and
$44,613.90. Thus I conclude that if current telecommunications technology deployment were to
be frozen as is today, over a course of ten years; Canada would forego an equivalent of 21.19%
of annual GDP.
10.2 Forecasting of total ICT Investment
Analysis of ICT sector help us in understanding the evolution of the Canadian economy overall.
While companies within the ICT sector invest in their own development, ICT products and
services are used by many other industries too. Contributions from these industries also impact
Canada’s GDP. It is, therefore, necessary to look in to how much other industries invest in the
ICT sector.
Data: For this purpose the data was collected from the database of the “Information and
Communication Technology (ICT) Investment and Capital Stocks Trends: Canada vs United
States.” This database is maintained by the Centre for the Study of Living Standards Centre
(CSLS). CSLS is a non-profit, national, independent organization that seeks to contribute to a
better understanding of trends in and determinants of productivity, living standards and
economic and social well-being through research.52
The ICT investment comprises of the investment in ICT by some major industries like
agriculture, forestry, fishing and hunting industry, mining and oil and gas extraction industry, 52 http://www.csls.ca.
Page 52 of 66
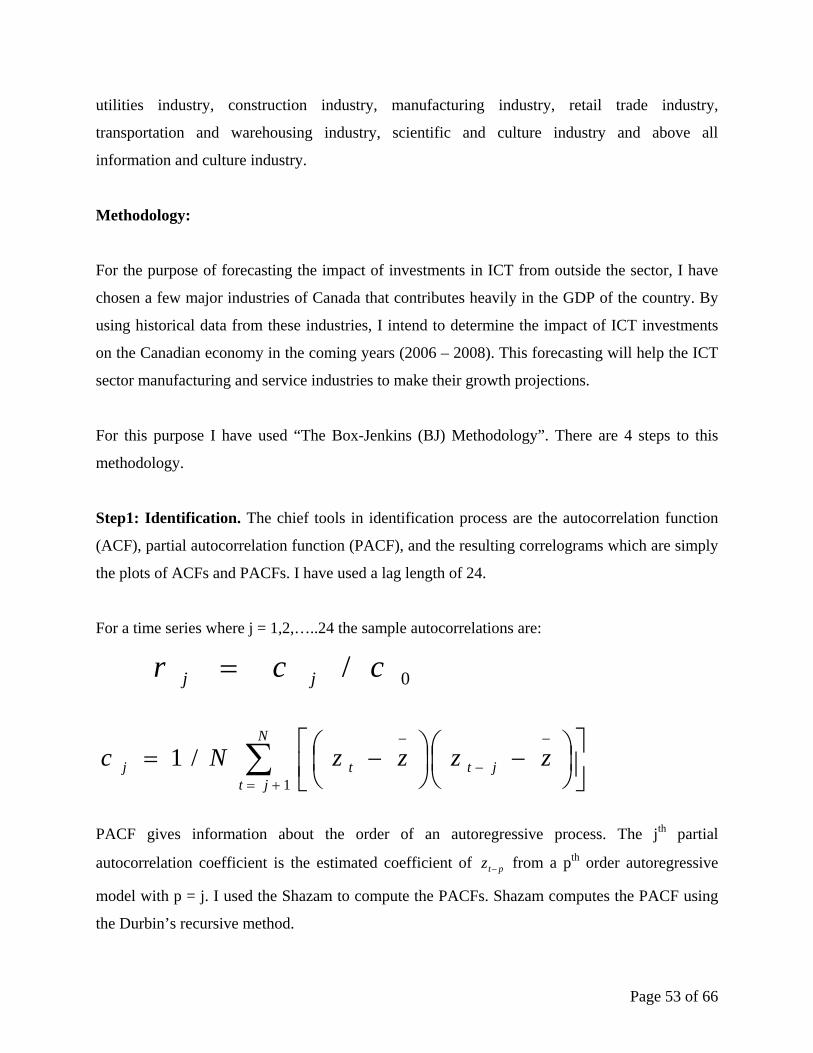
utilities industry, construction industry, manufacturing industry, retail trade industry,
transportation and warehousing industry, scientific and culture industry and above all
information and culture industry.
Methodology:
For the purpose of forecasting the impact of investments in ICT from outside the sector, I have
chosen a few major industries of Canada that contributes heavily in the GDP of the country. By
using historical data from these industries, I intend to determine the impact of ICT investments
on the Canadian economy in the coming years (2006 – 2008). This forecasting will help the ICT
sector manufacturing and service industries to make their growth projections.
For this purpose I have used “The Box-Jenkins (BJ) Methodology”. There are 4 steps to this
methodology.
Step1: Identification. The chief tools in identification process are the autocorrelation function
(ACF), partial autocorrelation function (PACF), and the resulting correlograms which are simply
the plots of ACFs and PACFs. I have used a lag length of 24.
For a time series where j = 1,2,…..24 the sample autocorrelations are:
0/ ccr jj =
∑+=
−
−
−
⎥⎦
⎤⎢⎣
⎡⎟⎠⎞
⎜⎝⎛ −⎟
⎠⎞
⎜⎝⎛ −=
N
jtjttj zzzzNc
1/1
PACF gives information about the order of an autoregressive process. The jth partial
autocorrelation coefficient is the estimated coefficient of from a pth order autoregressive
model with p = j. I used the Shazam to compute the PACFs. Shazam computes the PACF using
the Durbin’s recursive method.
ptz −
Page 53 of 66

The data for which I use the correlogram function declined at higher lags, which confirms that
the data follows the stationary time series. Step 2: Estimation. With the help of the first step, I plotted ACF and PACF and identified the
appropriate p and q values. BJ method models time series as autoregressive integrated moving
average (ARIMA) processes. The term ‘I’ stands for “integrated” in ARIMA which refers to
differencing. Once the data is stationarized, the next step is to estimate the parameters of the
autoregressive (AR) and moving average (MA) terms. The AR can be defined by using the
formula:
( ) ( ) ( ) ( ) tptpttt uYYYY +−++−+−=− −−− δαδαδαδ .........2211
Where is a pth-order autoregressive or AR (p) tY
An MA process is simply a linear combination of white noise error term. I calculated MA by
using the following formula.
qtqttttY −−− +++++= µβµβµβµβµ ........22110
Step 3: Diagnostic Checking. After choosing a particular ARIMA model, and having estimated
its parameters, I assess whether the chosen model fits the data reasonably well. For this purpose,
I tried other p and q values in my Shazam code. After running the Shazam code for these p and q
values, I observed that all of them resulted in a higher standard error, proving that the original p
and q values were indeed the best fit.
Step 4: Forecasting. Forecasting is the final step. The reason behind ARIMA’s popularity is its
success in forecasting. In many cases, the forecasts obtained by this method are more reliable
than those obtained from the traditional econometrics modelling.
Page 54 of 66

10.2.1 Results
I have attached the Shazam code and output in the Appendix. The result of the forecasting is
shown in Figure 31.
Figure 31: Projection of ICT Investment in Canada
The red line is the historical ICT investment from 1980 to 2004. The time period 1 – 30
represents 1980 – 2010. The green line represents the forecasting which was done using Box
Jenkins ARIMA methodology. My forecast starts from the year 2003 and Figure 31 shows that
the forecast was almost same as the actual. This adds to my confidence in the forecasted figures.
For the coming years, my forecast shows that the ICT investment is recovering from the bust and
soon the ICT sector will regain from the loss.
Page 55 of 66

11. Conclusion
The question which I tired to answer through this essay was that whether the bust in the ICT
sector was the temporary phenomena or a persistent one. From the trends in the economic
indicators of the ICT sector, I conclude that from the mid to late nineties, the ICT sector was
booming. This boom drew huge amount of investments into the industry which expanded
exponentially until mid of 2000. My analysis of the data suggests that during the bust of the ICT
sector ICT manufacturing was severely affected. ICT services, on the other hand, continued to
grow at a slower rate. During this time, many companies moved from the manufacturing sector
to services.
My analysis of the data suggests that since the bust, the ICT sector has recovered and has shown
a steady growth in the past couple of years. I, therefore, conclude that the decline in the ICT
sector was a temporary phenomenon. Beckstead and Brown (2005) have also reached the same
conclusion using a different methodology.
In predicting the future of the ICT sector investments by using the Box-Jenkins methodology, I
showed that investments in the sector would continue to grow at a steady rate, and would
eventually surpass the level attained during the boom. The pace of technological advances may
slow down for some period, but they cannot be stopped completely. With the advent of new
technologies comes the requirement to manage and enhance the new services. In good time, the
Canadian ICT sector has faced tough challenges from US companies offering services at lower
rates. In bad times, it is faced with declining demands. But it has shown that it can live up to the
challenges.
Page 56 of 66

Appendix
Employment: Selected ICT Manufacturing Industries, (Indexed Growth, 1997Q1 = 100)
Year.Q Computer and
Peripheral Equipment
Communications Equipment
Electronic Components Instruments
1997.1 100.0 100.0 100.0 100.0 1997.2 98.9 103.9 104.3 102.1 1997.3 100.2 105.9 105.9 104.4 1997.4 104.3 107.4 107.2 106.5 1998.1 104.8 108.0 108.2 106.6 1998.2 103.7 107.7 108.5 108.0 1998.3 101.3 108.9 110.0 109.3 1998.4 103.2 111.0 112.3 109.0 1999.1 106.6 110.1 114.4 110.2 1999.2 102.3 113.8 119.2 110.7 1999.3 104.7 111.3 113.2 109.9 1999.4 105.5 113.1 114.8 110.5 2000.1 110.2 112.9 114.0 111.4 2000.2 109.2 115.8 116.5 112.2 2000.3 110.0 120.5 120.7 113.1 2000.4 112.6 122.4 122.9 112.7 2001.1 111.0 117.3 120.1 109.6 2001.2 106.7 106.9 108.6 106.1 2001.3 103.4 101.5 102.8 102.3 2001.4 96.4 100.0 99.7 100.7 2002.1 91.8 100.4 99.5 98.5 2002.2 85.0 96.6 98.5 94.6 2002.3 81.9 92.8 98.3 94.9 2002.4 83.0 91.2 94.7 94.2 2003.1 81.2 94.2 91.9 95.3 2003.2 79.2 98.9 88.9 96.3 2003.3 76.2 97.4 87.5 94.7 2003.4 70.4 101.9 90.8 92.9 2004.1 67.5 102.5 91.8 91.1 2004.2 68.2 104.2 91.6 90.2 2004.3 66.1 101.5 83.6 90.2 2004.4 64.1 103.6 83.7 90.2 2005.1 60.4 107.8 84.4 90.4 2005.2 57.1 109.4 84.4 90.3 2005.3 54.9 109.4 84.0 89.2
Table 13: Data for Figure 553
53 Source: Industry Canada Quarterly Monitor of the Canadian ICT Sector, Third Quarter 2005.
Page 57 of 66

Employment: Selected ICT Services Industries,
(Indexed Growth, 1997Q1 = 100)
Year.Q Software Telecommunications Services
Computer Systems Design
Data Processing Services
1997.1 100.0 100.0 100.0 100.0 1997.2 108.6 101.0 108.7 109.1 1997.3 113.9 101.1 113.9 114.6 1997.4 114.8 100.5 114.8 115.0 1998.1 120.4 102.2 120.6 118.8 1998.2 124.7 102.3 125.0 123.5 1998.3 131.1 102.6 131.4 130.7 1998.4 139.9 102.7 140.0 141.4 1999.1 148.3 102.6 148.4 150.5 1999.2 152.6 102.0 152.5 157.1 1999.3 156.1 102.8 155.9 160.2 1999.4 164.4 103.8 164.0 170.1 2000.1 170.7 103.9 170.2 176.5 2000.2 178.6 104.3 178.5 181.9 2000.3 187.6 105.2 187.4 190.0 2000.4 193.3 105.4 193.2 195.6 2001.1 198.7 104.6 197.5 213.5 2001.2 195.9 105.2 192.7 221.9 2001.3 194.1 106.2 189.5 227.2 2001.4 191.7 106.7 185.7 231.0 2002.1 191.4 105.5 185.5 229.3 2002.2 194.0 106.4 189.7 214.0 2002.3 195.7 106.0 191.8 213.6 2002.4 197.3 105.9 193.8 213.0 2003.1 194.3 109.3 190.7 211.7 2003.2 191.7 109.2 187.4 213.4 2003.3 189.0 112.2 184.8 215.6 2003.4 187.6 116.4 184.8 208.3 2004.1 188.5 117.3 184.8 206.6 2004.2 190.0 112.3 186.0 219.1 2004.3 189.5 115.2 185.1 211.2 2004.4 190.6 118.2 184.3 217.3 2005.1 191.2 119.0 184.2 213.9 2005.2 190.8 120.8 185.1 207.8 2005.3 191.2 115.8 185.0 202.2
Table 14: Data for Figure 854
54Source: Industry Canada Quarterly Monitor of the Canadian ICT Sector, Third Quarter 2005.
Page 58 of 66

Table 15 shows a comparison of ICT sector output to the overall output
Table 15: Data for Figure 10 55
Period ICT Sector Canada
1997.1 100 100 1997.2 102.5 101.2 1997.3 106.7 102.7 1997.4 108.8 103.6 1998.1 112.1 104.7 1998.2 116.1 105.2 1998.3 122.5 106 1998.4 131.7 107.7 1999.1 141.5 109.4 1999.2 149.8 110.7 1999.3 157.3 112.6 1999.4 165.2 114.6 2000.1 171.9 116.2 2000.2 179.6 117.4 2000.3 187.2 118.8 2000.4 187.4 119.6 2001.1 177.1 119.7 2001.2 171.9 119.8 2001.3 167.5 119.7 2001.4 166.5 120.1 2002.1 171.4 121.7 2002.2 174.8 123.2 2002.3 175 124.1 2002.4 175.4 124.7 2003.1 174.8 125.5 2003.2 175.8 125.6 2003.3 177.3 126.3 2003.4 179.4 127.9 2004.1 180.7 128.6 2004.2 182.3 129.9 2004.3 185.1 131.3 2004.4 187.1 132 2005.1 191.4 132.9 2005.2 193.7 134 2005.3 195.7 135.3
55 Source: Industry Canada Quarterly Monitor of the Canadian ICT Sector, Third Quarter 2005.
Page 59 of 66

Shazam Output: Welcome to SHAZAM - Version 10.0 - JUL 2004 SYSTEM=WIN-XP PAR= 4000 CURRENT WORKING DIRECTORY IS: C:\SHAZAM |_sample 1 25 |_read ICT ff oil utili cons manu reta ware cult scient 10 VARIABLES AND 25 OBSERVATIONS STARTING AT OBS 1 |_Arima ict/nlag=24 nlagp=24 plotac plotpac ARIMA MODEL NUMBER OF OBSERVATIONS = 25 ...NOTE..SAMPLE RANGE SET TO: 1, 25 REQUIRED MEMORY IS PAR= 8 CURRENT PAR= 4000 IDENTIFICATION SECTION - VARIABLE=ICT NUMBER OF AUTOCORRELATIONS = 24 NUMBER OF PARTIAL AUTOCORRELATIONS = 24 0 0 0 SERIES (1-B) (1-B ) ICT NET NUMBER OF OBSERVATIONS = 25 MEAN= 9221.9 VARIANCE= 0.24769E+08 STANDARD DEV.= 4976.8 LAGS AUTOCORRELATIONS STD ERR 1 -12 0.90 0.80 0.68 0.52 0.36 0.24 0.12 0.03 -.04 -.10 -.16 -.22 0.20 13 -24 -.28 -.33 -.37 -.41 -.43 -.43 -.39 -.34 -.26 -.18 -.12 -.07 0.49 MODIFIED BOX-PIERCE (LJUNG-BOX-PIERCE) STATISTICS (CHI-SQUARE) LAG Q DF P-VALUE LAG Q DF P-VALUE 1 22.86 1 .000 13 80.24 13 .000 2 41.52 2 .000 14 87.09 14 .000 3 55.65 3 .000 15 96.52 15 .000 4 64.35 4 .000 16 109.03 16 .000 5 68.81 5 .000 17 124.86 17 .000 6 70.88 6 .000 18 142.85 18 .000 7 71.42 7 .000 19 160.18 19 .000 8 71.45 8 .000 20 176.09 20 .000 9 71.51 9 .000 21 187.92 21 .000 10 71.94 10 .000 22 195.09 22 .000 11 73.21 11 .000 23 199.96 23 .000 12 75.79 12 .000 24 203.26 24 .000 LAGS PARTIAL AUTOCORRELATIONS STD ERR 1 -12 0.90 -.08 -.14 -.28 -.10 0.11 -.05 0.04 -.03 -.08 -.16 -.12 0.20 13 -24 -.04 -.01 0.01 -.08 -.08 0.01 0.15 0.02 0.09 -.02 -.19 -.09 0.20 0 0 0 AUTOCORRELATION FUNCTION OF THE SERIES (1-B) (1-B ) ICT 1 0.90 . + RRRRRRRRRRRRRRRRRRRRRRRRRRRRRRRR . 2 0.80 . + RRRRRRRRRRRRRRRRRRRRRRRRRRRR . 3 0.68 . + RRRRRRRRRRRRRRRRRRRRRRRR + . 4 0.52 . + RRRRRRRRRRRRRRRRRRR + . 5 0.36 . + RRRRRRRRRRRRR + . 6 0.24 . + RRRRRRRRR + . 7 0.12 .+ RRRRR +.
Page 60 of 66

8 0.03 .+ RR +. 9 -.04 .+ RR +. 10 -.10 .+ RRRR +. 11 -.16 .+ RRRRRRR +. 12 -.22 .+ RRRRRRRRR +. 13 -.28 .+ RRRRRRRRRRR +. 14 -.33 + RRRRRRRRRRRR + 15 -.37 + RRRRRRRRRRRRRR + 16 -.41 . RRRRRRRRRRRRRRR . 17 -.43 . RRRRRRRRRRRRRRRR . 18 -.43 . RRRRRRRRRRRRRRRR . 19 -.39 . RRRRRRRRRRRRRR . 20 -.34 . RRRRRRRRRRRRR . 21 -.26 . RRRRRRRRRR . 22 -.18 . RRRRRRR . 23 -.12 . RRRRR . 24 -.07 . RRR . 0 0 0 PARTIAL AUTOCORRELATION FUNCTION OF THE SERIES (1-B) (1-B ) ICT 1 0.90 . + RRRRRRRRRRRRRRRRRRRRRRRRRRRRRRRR . 2 -.08 . + RRRR + . 3 -.14 . + RRRRRR + . 4 -.28 . + RRRRRRRRRRR + . 5 -.10 . + RRRR + . 6 0.11 . + RRRRR + . 7 -.05 . + RRR + . 8 0.04 . + RR + . 9 -.03 . + RR + . 10 -.08 . + RRRR + . 11 -.16 . + RRRRRR + . 12 -.12 . + RRRRR + . 13 -.04 . + RR + . 14 -.01 . + R + . 15 0.01 . + R + . 16 -.08 . + RRRR + . 17 -.08 . + RRRR + . 18 0.01 . + R + . 19 0.15 . + RRRRRR + . 20 0.02 . + RR + . 21 0.09 . + RRRR + . 22 -.02 . + RR + . 23 -.19 . + RRRRRRRR + . 24 -.09 . + RRRR + . |_ARIMA ICT / NAR=1 NMA=6 ndiff=1 COEF=BETA ARIMA MODEL NUMBER OF OBSERVATIONS = 25 ...NOTE..SAMPLE RANGE SET TO: 1, 25 DEGREE OF DIFFERENCING = 1 NUMBER OF AR PARAMETERS = 1 NUMBER OF MA PARAMETERS = 6 REQUIRED MEMORY IS PAR= 16 CURRENT PAR= 4000 ESTIMATION PROCEDURE STARTING VALUES OF PARAMETERS ARE: 0.10000 0.10000 0.10000 0.10000 0.10000 0.10000 0.10000 1.0000
Page 61 of 66

MEAN OF SERIES = 537.4 VARIANCE OF SERIES = 0.1172E+07 STANDARD DEVIATION OF SERIES = 1083. INITIAL SUM OF SQUARES = 48564050. NET NUMBER OF OBS IS 24 DIFFERENCING: 1 CONSECUTIVE, 0 SEASONAL WITH SPAN 0 NO CONVERGENCE AFTER 50 ITERATIONS INITIAL SUM OF SQS= 48564050. FINAL SUM OF SQS= 9763560.1 R-SQUARE = 0.6379 R-SQUARE ADJUSTED = 0.4795 VARIANCE OF THE ESTIMATE-SIGMA**2 = 0.59611E+06 STANDARD ERROR OF THE ESTIMATE-SIGMA = 772.08 AKAIKE INFORMATION CRITERIA -AIC(K) = 13.965 SCHWARZ CRITERIA- SC(K) = 14.358 PARAMETER ESTIMATES STD ERROR T-STAT AR( 1) 0.19274 0.9439 0.2042 MA( 1) -0.50856 0.9198 -0.5529 MA( 2) 0.56374E-01 0.5321 0.1060 MA( 3) 0.19443 0.1854 1.049 MA( 4) 0.23532E-01 0.2997 0.7851E-01 MA( 5) 0.97725 0.1665 5.870 MA( 6) 0.75347E-01 0.9305 0.8098E-01 CONSTANT 534.10 634.9 0.8412 RESIDUALS LAGS AUTOCORRELATIONS STD ERR 1 -12 -.08 -.17 0.01 -.17 -.30 0.24 0.05 -.05 0.02 -.09 0.09 0.01 0.20 13 -23 0.03 -.09 -.05 0.00 0.01 0.02 0.08 -.01 -.08 0.00 0.02 0.25 MODIFIED BOX-PIERCE (LJUNG-BOX-PIERCE) STATISTICS (CHI-SQUARE) LAG Q DF P-VALUE LAG Q DF P-VALUE 8 6.94 1 .008 16 8.40 9 .495 9 6.95 2 .031 17 8.41 10 .589 10 7.33 3 .062 18 8.45 11 .672 11 7.67 4 .104 19 9.28 12 .679 12 7.68 5 .175 20 9.28 13 .751 13 7.73 6 .258 21 10.53 14 .722 14 8.24 7 .312 22 10.53 15 .785 15 8.40 8 .396 23 10.79 16 .822 CROSS-CORRELATIONS BETWEEN RESIDUALS AND (DIFFERENCED) SERIES CROSS-CORRELATION AT ZERO LAG = 0.68 LAGS CROSS CORRELATIONS Y(T),E(T-K) 1-12 0.52 -.06 -.14 -.05 -.59 -.04 0.09 0.00 0.00 -.01 -.01 0.07 13-23 0.05 -.04 -.02 -.06 0.03 0.01 0.09 0.07 -.05 -.04 0.01 LEADS CROSS CORRELATIONS Y(T),E(T+K) 1-12 -.22 -.09 -.08 -.20 -.02 0.12 0.02 -.01 0.04 0.05 0.05 -.01 13-23 -.03 -.15 -.07 0.05 0.01 0.02 0.07 -.01 -.05 0.00 0.01 ANALYSIS OF RESIDUALS VALUES RANGE FROM -1336.1148 TO 1312.4233 SAMPLE MOMENTS OF RESIDUALS (USING THE DIVISOR 24) :
Page 62 of 66

MEAN = -114.7944 VARIANCE = 384231.3 SKEWNESS = -0.1793836 KURTOSIS = 2.991684 STUDENTIZED RANGE = 4.272773 |_GEN1 S=SQRT($SIG2) ..NOTE..CURRENT VALUE OF $SIG2= 0.59611E+06 |_ARIMA ICT/ NAR=1 NMA=6 ndiff=1 COEF=BETA fBEG=24 fend=30 Sigma=S GRAPHFORC ARIMA MODEL NUMBER OF OBSERVATIONS = 25 ...NOTE..SAMPLE RANGE SET TO: 1, 25 DEGREE OF DIFFERENCING = 1 NUMBER OF AR PARAMETERS = 1 NUMBER OF MA PARAMETERS = 6 REQUIRED MEMORY IS PAR= 10 CURRENT PAR= 4000 ARIMA FORECAST PARAMETER VALUES ARE: AR( 1)= 0.19274 MA( 1)= -0.50856 MA( 2)= 0.56374E-01 MA( 3)= 0.19443 MA( 4)= 0.23532E-01 MA( 5)= 0.97725 MA( 6)= 0.75347E-01 CONSTANT = 534.10 FROM ORIGIN DATE 24, FORECASTS ARE CALCULATED UP TO 6 STEPS AHEAD FUTURE DATE LOWER FORECAST UPPER ACTUAL ERROR 25 13963.4 15476.7 16990.0 15805.2 328.545 26 12646.9 15633.3 18619.6 27 13192.9 17214.6 21236.4 28 14709.2 19404.3 24099.3 29 14878.1 20121.5 25365.0 30 15457.8 20767.9 26078.0 STEPS AHEAD STD ERROR PSI WT 1 772.1 1.0000 2 1524. 1.7013 3 2052. 1.7801 4 2395. 1.6008 5 2675. 1.5428 6 2709. 0.5543 VARIANCE OF ONE-STEP-AHEAD ERRORS-SIGMA**2 = 0.5961E+06 STD.DEV. OF ONE-STEP-AHEAD ERRORS-SIGMA = 772.1 |_stop
Page 63 of 66

Bibliography Geoff Bowlby and Stephanie Langlois, “High tech boom and bust”, Statistic Canada – Catalogue no. 75-001-XIE, April 2002 Desmond Beckstead and W. Mark Brown, “An Anatomy of Growth and Decline: High-tech Industries through the Boom and Bust Years, 1997 – 2003.” Statistic Canada – Catalogue no. 11-624-MIE, March 2005. Van Ark, Inklaar and McGuckin, “The Contribution of ICT-Producing and ICT-Using Industries to Productivity Growth: A Comparison of Canada, Europe and the United States.” Spring Volume of 2003. Heidi Ertl and Chantal Vaillancourt, “Information and Technology Information- A Statistical profile of ICT sector” Statistic Canada - Catalogue No. 56-506-XIE, Published in 2001. C. Vaillancourt, “ A Profile of Employment in Computer and Telecommunication Industry.” Statistic Canada – Catalogue No. 56F0004 MIE, Published in 2003. Industry Canada, “Canadian, ICT Statistical Overview (ICTSO).” last updated October 2005. The Daily, Statistic Canada, “Study: The information and communication technology sector through the boom and the bust years,” March 2, 2005. The Daily, Statistic Canada, “Study: High-tech boom and bust,” April 17, 2002. Michael W. Trethewa, “Enabling Canada’s Economic Potential: ICT and National Economic Performance,” Published in Year 2005. OECD Report, “The Software Sector: A statistical Profile for Selected OECD Countries,” January 1998. Walter Enders, “Applied Econometric Time Series,” published in 1995. Whistler, White, Wong, Bates, “Shazam Econometric Software, User’s Reference Manual, Version 10,” Published in 2004. Damodar N. Gujarati, “Basic Econometrics”, fourth edition, published in 2003. Other articles read Gury Gellatly, “The Canadian Economy in Transition: A guide to research on the new economy” Statistic Canada: Catalogue no. 11-622-MIE, May 2003.
Page 64 of 66

Martin Fransman, “The Telecoms boom and bust, 1996 – 2003 puzzles, paradoxes, and processing,” published in year 2003. Mark Doms, “The Boom and Bust in Information Technology Investment,” Federal Reserve Bank of San Francisco, Year 2004. Revenues and Other Financial Data ICT Manufacturing Annual Survey of Manufactures (ASM) (no 2103), Catalogue no. 31-203, CANSIM Table 301-0003, Software Publishers Computer Systems Design and Related Services Data Processing, Hosting and Related Services Annual Survey of Software Development and Computer Services (no 2410), Catalogue no. 63-222, CANSIM Table 354-0005, Service Industries Division, Statistics Canada. Telecommunications Services From 1997 to 2003: Annual Survey of Telecommunications Services (no 2722), Catalogue no. 56-203 and/or 56-001, not available in CANSIM (terminated tables only), Science, Innovation and Electronic Information Division, Statistics Canada. EMPLOYMENT ICT Manufacturing Annual Survey of Manufactures (ASM) (no 2103), Catalogue no. 31-203, CANSIM Table 301-0003, Manufacturing, Construction and Energy Division, Statistics Canada. GROSS DOMESTIC PRODUCT (GDP) Special tabulations for Industry Canada, Gross Domestic Product by Industry (no 1301), Catalogue no. 15-001, CANSIM Tables 379-0017 and 379-0020, Industry Measures and Analysis Division, Statistics Canada.
Page 65 of 66

INTRAMURAL RESEARCH AND DEVELOPMENT (R&D) EXPENDITURES Special tabulations for Industry Canada, Survey on Research and Development in Canadian Industry (no 4201), Catalogue no. 88-202 and/or 88-001, CANSIM Table 358-0001, Science, Innovation and Electronic Information Division, Statistics Canada. CAPITAL EXPENDITURES Special tabulations for Industry Canada, Survey on Capital and Repair Expenditures (no 2803), Catalogue no. 61-205 Investment and Capital Stock Division, Statistics Canada. TRADE ICT Services Canada’s International Transactions in Services (no 1536), Cat. no. 67-203, CANSIM Table 376-0033, Balance of Payments Division, Statistics Canada. Data for Forecasting Database of ICT Investment and Capital Stock Trends: Canada vs United States
Page 66 of 66