Embed Size (px)
Citation preview

i
Boomers at Midlife:The AARP Life Stage StudyV O L U M E I F U L L R E P O R T
Boomers at Midlife:The AARP Life Stage StudyVolume I Full ReportA National Survey Conducted for AARP by Princeton Survey Research AssociatesNovember 2002
Carol Keegan, Ph.D., Project Manager, Knowledge Management, AARP
202-434-6286
Sonya Gross, Research Analyst, Knowledge Management, AARP
202-434-3556
Linda Fisher, Ph.D., Research Director, Knowledge Management, AARP
202-434-6304
Shereen Remez, Ph.D., Director of Knowledge Management, AARP
202-434-2426
AcknowledgementsIn designing the basic approach to this study, the study authors modeled key sur-
vey items on those used in the John D. and Catherine T. McArthur Foundation’s
Midlife in the U.S. (MIDUS) surveys. We also wish to acknowledge the consulting
contributions of Dr. Margie Lachman, a MIDUS research fellow and Professor of
Psychology at Brandeis University. She also serves as Director of the University’s
Lifespan Developmental Psychology Laboratory.
©2002 AARP. All rights reserved. Reprinting with permission only.
601 E Street, NW, Washington, DC 20049
www.aarp.org

Table of ContentsVOLUME I Full Report
I. Introduction . . . . . . . . . . . . . . . . . . . . . . . . . . . . . . . . . . . . . . . . . . . . . . . . . . . . . . . .5
II. Executive Summary . . . . . . . . . . . . . . . . . . . . . . . . . . . . . . . . . . . . . . . . . . . . . . . . . .7
III. Detailed Findings
A. Assessment of Current Life Status . . . . . . . . . . . . . . . . . . . . . . . . . . . . . . . . . .15
Demographic Differences in Assessment of Current Life Status Among Boomers . . . . . . . . . . . . . . . . . . . . . . . . . . . . . . . . . . . . .27
B. Near-Term Life Goals . . . . . . . . . . . . . . . . . . . . . . . . . . . . . . . . . . . . . . . . . . . . .35
Demographic Differences in Near-Term Life Goals Among Boomers . . . . . . . . . . . . . . . . . . . . . . . . . . . . . . . . . . . . . .43
C. Anticipated Problems/Barriers . . . . . . . . . . . . . . . . . . . . . . . . . . . . . . . . . . . . 49
Demographic Differences in Anticipated Problems/Barriers Among Boomers . . . . . . . . . . . . . . . . . . . . . . . . . . . . . 58
D. Planning the Future . . . . . . . . . . . . . . . . . . . . . . . . . . . . . . . . . . . . . . . . . . . . . . 61
Demographic Differences in Planning the Future Among Boomers . . . . . . . . . . . . . . . . . . . . . . . . . . . . . . . . . . . . . . . . 67
E. Ethnic and Racial Comparisons Among Boomers . . . . . . . . . . . . . . . . . . . . 73
Assessment of Life Status Among White, African American and Hispanic Boomers . . . . . . . . . . . . . . . . . . . . . . . . . 73
Near-Term Life Goals for White, African American and Hispanic Boomers . . . . . . . . . . . . . . . . . . . . . . . . . 76
Anticipated Problems/Barriers for White, African American and Hispanic Boomers . . . . . . . . . . . . . . . . . . . . . . . . . 80
Planning the Future for White, African American and Hispanic Boomers . . . . . . . . . . . . . . . . . . . . . . . . . 82
Appendix A: Methodological Report for National Survey . . . . . . . . . . . . . . . . . . . . .85
Appendix B: Annotated Questionnaire . . . . . . . . . . . . . . . . . . . . . . . . . . . . . . . . . . .101
Appendix C: Table of Critical Life Events by Generation . . . . . . . . . . . . . . . . . . . . .141
Appendix D: Methodological Report for Focus Groups . . . . . . . . . . . . . . . . . . . . . .143
Appendix E: Focus Group Moderator’s Guide . . . . . . . . . . . . . . . . . . . . . . . . . . . . . .151
1

List of TablesTable 1: Boomers’ Satisfaction with Major Life Areas . . . . . . . . . . . . . . . . . . . . . . . .15
Table 2: Satisfaction with Major Life Areas by Generation . . . . . . . . . . . . . . . . . . . .17
Table 3: Most Important Life Area by Generation . . . . . . . . . . . . . . . . . . . . . . . . . . .20
Table 4: Boomers’ Expectations of Major Life Areas . . . . . . . . . . . . . . . . . . . . . . . . .21
Table 5: Boomers’ Expectations of Major Life Areas by Marital Status . . . . . . . . . .22
Table 6: Expectations of Major Life Areas by Generation . . . . . . . . . . . . . . . . . . . . .23
Table 7: Life’s Highs and Lows by Generation . . . . . . . . . . . . . . . . . . . . . . . . . . . . . .25
Table 8: Boomers’ Satisfaction with Major Life Areas by Age . . . . . . . . . . . . . . . . . .28
Table 9: Boomers’ Satisfaction with Major Life Areas by Gender . . . . . . . . . . . . . .29
Table 10: Life’s Highs and Lows for Boomers by Gender . . . . . . . . . . . . . . . . . . . . .30
Table 11: Boomers’ Overall Life Satisfaction by Income . . . . . . . . . . . . . . . . . . . . . .31
Table 12: Boomers’ Satisfaction with Major Life Areas by Income . . . . . . . . . . . . .31
Table 13: Life’s Highs and Lows for Boomers by Income . . . . . . . . . . . . . . . . . . . . .33
Table 14: Boomers’ Satisfaction with Major Life Areas by Education . . . . . . . . . . .34
Table 15: General Hopes for the Future by Generation . . . . . . . . . . . . . . . . . . . . . .35
Table 16: Boomers’ Current Status and Hopes for Life Areas . . . . . . . . . . . . . . . . . .36
Table 17: Major Life Area Boomers Would Most Like to Change . . . . . . . . . . . . . . .37
Table 18: Boomers’ and Older Americans’ Current Status and Hopes for Life Areas . . . . . . . . . . . . . . . . . . . . . . . . . . . . . . . . . . . . . . . .40
Table 19: Boomers’ and Younger Americans’ Current Status and Hopes for Life Areas . . . . . . . . . . . . . . . . . . . . . . . . . . . . . . . . . . . . . . . .41
Table 20: Major Ambition by Generation . . . . . . . . . . . . . . . . . . . . . . . . . . . . . . . . . .42
Table 21: Boomers’ General Hopes for the Future by Age . . . . . . . . . . . . . . . . . . . .43
Table 22: Boomers’ Hopes for Life Areas by Age . . . . . . . . . . . . . . . . . . . . . . . . . . . .44
Table 23: Boomers’ Major Ambition by Age . . . . . . . . . . . . . . . . . . . . . . . . . . . . . . . .45
Table 24: Boomers’ Major Ambition by Gender . . . . . . . . . . . . . . . . . . . . . . . . . . . . .46
Table 25: Boomers’ Current Status and Financial Hopes by Income . . . . . . . . . . . . . . . . . . . . . . . . . . . . . . . . . . . . . . . . . . . . . .47
Table 26: Boomers’ Likelihood of Reaching Goals . . . . . . . . . . . . . . . . . . . . . . . . . . .49
Table 27: Likelihood of Reaching Goals by Generation . . . . . . . . . . . . . . . . . . . . . .50
Table 28: Boomers’ Control Over Major Life Areas . . . . . . . . . . . . . . . . . . . . . . . . . .51
Table 29: Life Status by Generation . . . . . . . . . . . . . . . . . . . . . . . . . . . . . . . . . . . . . . .53
Table 30: Boomers’ Control Over Work or Career . . . . . . . . . . . . . . . . . . . . . . . . . . . .54
Boomers at Midlife: The AARP Life Stage Study - Volume I Full Report
2 Prepared for AARP by Princeton Survey Research Associates

Table 31: Control Over Major Life Areas by Generation . . . . . . . . . . . . . . . . . . . . . .56
Table 32: Major Barriers by Generation . . . . . . . . . . . . . . . . . . . . . . . . . . . . . . . . . . . .57
Table 33: Control Over Finances and Religious/Spiritual Life by Age . . . . . . . . . .58
Table 34: Boomers’ Likelihood of Reaching Relationship Goals by Gender and Control Over Finances and Work by Gender . . . . . . . . . . . .59
Table 35: Boomers’ Control Over Religious/Spiritual Life and Health by Income . . . . . . . . . . . . . . . . . . . . . . . . . . . . . . . . . . . . . . . . . .60
Table 36: Thinking About the General Future by Generation . . . . . . . . . . . . . . . . .61
Table 37: Thinking About Life Areas by Generation . . . . . . . . . . . . . . . . . . . . . . . . .63
Table 38: Planning for the Future by Generation . . . . . . . . . . . . . . . . . . . . . . . . . . . .64
Table 39: Attitudes About the Future and Control Over the Future by Generation . . . . . . . . . . . . . . . . . . . . . . . . . . . . . . . . . . . . . . .64
Table 40: Describing the Next Five Years by Generation . . . . . . . . . . . . . . . . . . . . . .66
Table 41: Thinking About the General Future by Age . . . . . . . . . . . . . . . . . . . . . . . .67
Table 42: Thinking About Life Areas by Age . . . . . . . . . . . . . . . . . . . . . . . . . . . . . . . .68
Table 43: Attitudes About the Future and Control Over the Future by Generation . . . . . . . . . . . . . . . . . . . . . . . . . . . . . . . . . . . . . . .69
Table 44: Boomers’ Thinking About Life Areas by Income . . . . . . . . . . . . . . . . . . . .70
Table 45: Boomers’ Thinking About Life Areas by Education . . . . . . . . . . . . . . . . .71
Table 46: Boomers’ Overall Life Satisfaction by Race/Ethnicity . . . . . . . . . . . . . . .73
Table 47: Boomers’ Satisfaction with Major Life Areas by Race/Ethnicity . . . . . . .74
Table 48: Boomers’ Most Important Life Area by Race/Ethnicity . . . . . . . . . . . . . .75
Table 49: Boomers’ Expectations of Major Life Areas by Race/Ethnicity . . . . . . .77
Table 50: Boomers’ Current Status and Hopes for Future by Race/Ethnicity . . . .79
Table 51: Boomers’ Likelihood of Reaching Goals by Race/Ethnicity . . . . . . . . . .80
Table 52: Major Barriers for Boomers by Race/Ethnicity . . . . . . . . . . . . . . . . . . . . .81
Table 53: Boomers’ Thoughts about Life Areas by Race/Ethnicity . . . . . . . . . . . . .82
Table 54: Boomers’ Attitudes toward the Future and Control Over the Future by Race/Ethnicity . . . . . . . . . . . . . . . . . . . . . . . . . . . . . . . . . . . .84
Figure 1: Current Status and Hopes for Future by Generation . . . . . . . . . . . . . . . .38
3

Boomers at Midlife: The AARP Life Stage Study - Volume I Full Report
4 Prepared for AARP by Princeton Survey Research Associates
I. INTRODUCTIONAs boomers age into eligibility for
AARP membership, the Association is
increasingly involved in enhancing its
understanding of the needs, interests and
concerns of this generation. Accordingly,
AARP commissioned Princeton Survey
Research Associates (PSRA) to conduct
the first wave of a major tracking survey
of boomers. This survey was designed to
give boomers a platform for reporting
how they are faring in various aspects of
their lives. It addresses the following
research questions:
1. Assessments of Current Life Status:Overall, how satisfied are boomerswith their lives? How do they assesstheir lives in seven major areas: relationships with family and friends;mental health; religious or spirituallife; work or career; physical health;personal finances and leisure activi-ties? In which areas of their lives dothey report that they are doing betterthan they expected, worse than theyexpected, and about as well as theyexpected? What do they believe arethe best and worst aspects of theirlives today? What major life eventshave they experienced?
2. Near-Term Life Goals: Where doboomers want their lives to lead overthe next five years? In what aspectsof their lives do they want to see themost change? What do they describeas their major ambitions at this timein their life? In what aspects of theirlives do boomers report the widest
gaps between where they currentlysee themselves and where theywould like to be?
3. Anticipated Problems/Barriers: Whatdo boomers believe is the likelihoodof bringing their hopes for variouslife areas to fruition? What constraintsor uncertainties do they believe aremost likely to keep them from reaching their goals? In which areas dothey anticipate the greatest declinesand improvements as they age?
4. Outlook on Planning for the Future:How do boomers feel about planningtheir futures in various life areas? Aresome boomers planning more thanothers? What aspects of their near-term goals do boomers believe theywill be able to influence or shape totheir advantage? In which areas doboomers feel they have the mostcontrol and the least control?
5. Comparisons of Boomers to Youngerand Older Generations: To whatextent, and in what ways, are thenear-term life circumstances, goals,and concerns of boomers similar toor different from those of other agecohorts? Compared to other agegroups, are boomers more or lessoptimistic about their near-termfuture? Do they anticipate similar or different barriers to reaching their goals?
6. Comparisons by Race/Ethnicity:Within the boomer generation, towhat extent do life circumstances,levels of satisfaction and near-termpriorities vary by race or ethnic
Introduction
5

group? Are African American andHispanic boomers more or less optimistic about their near-termfutures? Do they report similar ordifferent constraints and uncertaintiesin their ability to achieve near-termdreams and ambitions?
In addition to the national survey, PSRA
conducted focus groups of boomers
and older Americans in three cities—
Baltimore, Maryland; Charlotte, North
Carolina; and Kansas City, Missouri—
to listen to boomers talk about their
hopes and expectations. In each city,
four focus groups were conducted: two
consisting of boomers only, and two
with adults age 57 and older.
Following this introduction is an execu-
tive summary of the survey’s key findings
and then a more detailed report.
The detailed report is organized into
five main sections. The first four
sections are: ‘An Assessment of Current
Life Status,’ ‘Near-Term Life Goals,’
‘Anticipated Problems and Barriers,’
and ‘Planning the Future.’ In each of
these sections we first describe the
nationwide survey findings for
boomers. We then compare them to
older and younger adults. Each section
ends with an even closer look at
boomers, comparing them across
several demographic traits: age, gender,
income, and education.
When discussions from the focus
groups correspond with questions from
the nationwide survey, we incorporate
the comments of various participants
in with the description of results. These
comments serve to highlight the
quantitative findings, speculate on the
reasoning behind some of the findings,
and introduce alternative ways of
thinking about the topic in question.
The final section is ‘Ethnic and Racial
Comparisons among Boomers.’ To
achieve a complete picture of boomers
at midlife, oversamples of African
American and Hispanic boomers were
collected. In this last section we
compare the survey results for white,
African American, and Hispanic
boomers.
Finally, Appendix A is a detailed
methodology of the nationwide survey,
Appendix B is the annotated question-
naire, Appendix C is a table of critical
life events by generation, Appendix D
is a detailed description of the focus
group methodology, and Appendix E
is the focus group moderator’s guide.
To supplement the abbreviated tables
incorporated in Volume I, Volume II
provides a full set of tables for all
questions fielded in the national
survey analyzed by generation and by
eight additional variables (gender,
race/ethnicity, education, household
income, marital status, presence of
children in household, health status,
and expectations for the future).
Boomers at Midlife: The AARP Life Stage Study - Volume I Full Report
6 Prepared for AARP by Princeton Survey Research Associates

II. EXECUTIVE SUMMARYBaby boomers, those Americans born
between 1946 and 1964, are members
of one of the largest generations in
American history. But more than size
sets them apart. This is the generation
that experienced Vietnam and Watergate,
the civil rights movement and the
women’s movement, assassinations and
moon landings in its formative years. It
is a generation that redefined music,
religion, leisure, and many American
norms and values, leaving an indelible
mark on American society. Now, with
boomers squarely in midlife, we ask
how they assess their lives today, and
what their hopes and expectations are
for the future.
AARP commissioned Princeton Survey
Research Associates to address these
questions in a major survey of boomers
at midlife. This unique survey asks
boomers to talk specifically about
themselves, examining seven broad life
areas in detail: relationships with family
and friends, personal finances, religious
or spiritual life, work or career, physical
health, mental health, and leisure activ-
ities. We asked boomers to tell us how
well they are doing in each of these
areas; where they hope to be five years
from now; how likely they are to achieve
their goals; and what the barriers are to
achieving these goals. Our task was to
listen to what boomers had to say
about their lives, their hopes, and their
expectations. This survey is the first
step, as we wanted to learn about as
wide a range of life areas as possible in
a 25-minute telephone survey. Probing
for the reasons behind the answers will
be the focus of future AARP research.
Here is what we found.
Key Findings
Boomers report broad satisfaction in
many areas of their lives. They are gen-
erally optimistic about what lies ahead.
As they plan for the future, boomers
hope for and expect many things to
improve in their lives:
• Chronologically, boomers are clearlyat midlife, but psychologically theybear a closer resemblance toyounger Americans than they do toolder Americans. Boomers are morelike younger adults when we compare the three age groups onhow often they think about thefuture (boomers 64%, younger 78%,older 41%) and optimism about thefuture (boomers 77%, younger 92%,older 41%).
• Boomers hope to see the greatestimprovements in the two life areasin which they are most likely to saythey feel behind. Leisure activitiesand finances are the two life areaswith which boomers are least likelyto be very satisfied (29% and 20%respectively) and most likely to saythey feel they are doing worse thanexpected (35% and 31% respective-ly). Nonetheless, they hope to seemajor improvements in five years: in
Executive Summary
7

leisure activities from 5.6 to 7.6 (on a10-point scale), and in finances from6.2 to 8.0.
• Boomers are pursuing such goals inspite of some shaky confidenceabout actually achieving them. Infact, they are least confident aboutachieving their goals in the sametwo areas where they aspire to thegreatest gains: leisure and personalfinance. Asked to describe theiroverall outlook on the next fiveyears, boomers are most likely to useupbeat words like “hopeful” (64%),“confident” (55%), “fulfilling” (49%)and “exciting” (46%).
Relationships with Family andFriends and Mental Health
On the plus side, nearly two thirds of
boomers (63%) are largely satisfied with
their relationships with family and
friends. This is good news, as a plurality
of boomers (44%) say these relation-
ships are the most important things in
their life. This emphasis on family and
friends may be, in part, because one in
two boomers are raising children. As we
heard in the focus groups, children are
the “most important thing” in many
boomers’ lives. At the same time, family
obligations may lead many boomers to
neglect other areas, such as leisure
activities and physical health, for exam-
ple, by not making time for exercise.
A solid majority of boomers (61%) are
also very satisfied with the state of their
mental health. In broad brushstrokes,
boomers are either where they expected
to be in this life area (62%) or doing
better than they expected (23%). And
while many hope to make gains in
mental health over the next five years,
the hoped-for gains are small, given
their already high level of satisfaction.
Personal Finances and Work or Career
On the negative side, substantially fewer
boomers say they are very satisfied with
their personal finances (20%) and their
work or career (39%). Many say their
personal financial status (20%) is the
worst thing in their lives. They say they
are worse off both in finances (31%)
and work or career (26%) than they
thought they would be at this point in
their lives. And many of these boomers
feel financially strapped, especially
when it comes time to pay college
tuition. Personal finances (29%) is the
area many boomers would most like to
improve, making it their top goal over
the next five years.
Physical Health and LeisureActivities
Many boomers say their physical health
(33%) and leisure activities (35%) have
suffered more than they expected.
Physical health is ranked among the
top three most important life areas by
one in five boomers, and is one area
that many boomers would like to
improve. Many focus group participants
noted that physical health deserves
Boomers at Midlife: The AARP Life Stage Study - Volume I Full Report
8 Prepared for AARP by Princeton Survey Research Associates

such a high rating because without
good health all other life areas are com-
promised. “If you don’t have your
health, then you can’t work or you can’t
do anything,” one focus group partici-
pant remarked.
Only one in three boomers are very sat-
isfied with the state of their leisure
activities, and many would like to make
gains in the near-term. But, unlike
physical health, boomers do not rate
this life area as very important. Indeed,
boomers place leisure activities at the
bottom of the list of important life
areas. This suggests that boomers will
concentrate on making improvements
in more important areas before they
tackle their dissatisfaction with this
life area.
Religious or Spiritual Life
Boomers are moderately satisfied
with their religious or spiritual life.
Most say they are doing better than
they expected (26%), or are where they
expected to be at this point in their
lives (54%). Religious or spiritual life
is among the top three most important
life areas to boomers, along with
relationships with family and friends,
and physical health. And boomers hope
to make solid gains in this domain in
the next five years. As boomers age,
their religious or spiritual life begins
to become more important to many
of them.
Target Goals and Likelihood ofAchieving Goals
Boomers hope to make improvements
in every major life area in the next five
years. But many are uncertain whether
they will achieve their goals. In fact, the
areas in which boomers hope for the
greatest improvements—personal
finances, physical health, work or
career, and leisure activities—are the
areas in which they have the least con-
fidence in reaching their goals. Around
half believe it is very likely that they
will reach their target goals in the areas
of personal finances (53%), physical
health (53%), or their leisure activities
(48%), and 59 percent believe they
are very likely to reach their work or
career goals.
Why aren’t more boomers hopeful? In
part because they feel they have less
control in these areas. Half or fewer say
they have a great deal of control over
any of them—personal finances (41%),
physical health (50%), work or career
(45%), and leisure activities (45%).
Barriers to Achieving Goals
Boomers look squarely at themselves
(17%), or in their pockets (16%), when
looking for the barriers to achieving
their goals. In a variety of ways,
boomers in the telephone survey told
us that they themselves are the reason
they are not achieving their goals: “my
lack of confidence,” or “my laziness,
lack of imagination and will,” or “just
Executive Summary
9
me—I’m in charge of my own life.” For
others, their financial situation is the
biggest barrier to achieving their goals.
In some cases, the concerns are their
own personal handling of money, such
as “credit cards,” or “working my way
out of debt.” For others, the barriers are
larger economic concerns, such as the
“stock market,” “cost of living,” and
“economic uncertainty in workplace.”
One in three boomers (35%) say “noth-
ing” is keeping them from achieving
their goals.
Boomers Look to Future
As boomers move toward older age,
they are giving substantial thought to
the future. Most boomers say they think
a lot about what is to come (64%) and
are looking to the future with self-
reliance and cautious optimism. Large
majorities of boomers believe that their
future depends largely on themselves
(68%). They say that, if they really want
to do something, they will find a way to
succeed (65%). As one boomer in the
focus groups explained, “Anything I
want to do, I feel that I can change at
this age.” This steadfast determination
and optimism about the future is not
without worry. Many boomers say
that the words “hopeful,”(64%) and
“confident”(55%) describe their view of
the next five years very well, but a
notable minority also say that
“anxious”(22%) and “stressful”(21%)
describe their feelings about the next
five years very well.
Boomers and the Younger andOlder Generations
How do boomers’ hopes and expecta-
tions compare to those of older and
younger Americans? Chronologically,
boomers are smack in midlife, but only
the calendar marks this midlife status.
Even as the oldest boomers approach
retirement, their hopes and expectations
more closely resemble those of younger
Americans than older Americans.
Boomers share with their parents the
life experiences of raising children,
working for a living, and the first unde-
niable signs of aging, yet the hopes and
expectations of boomers at midlife are
not converging with their parents’
hopes and expectations, at least not
yet. The generation gap between
boomers and the older generation
seems almost as wide as it was when
boomers were coming of age during the
Vietnam War, Watergate, and the civil
rights and women’s movements.
In short:
• In each of the seven life areas,boomers are more likely than olderAmericans to say they are worse offthan expected. Boomers andyounger Americans are more alike inthese assessments.
• More boomers (77%) and youngerAmericans (92%) are optimisticabout the future than olderAmericans (41%). And boomers andyounger Americans hope for moreimprovements in the life areas thanolder Americans.
Boomers at Midlife: The AARP Life Stage Study - Volume I Full Report
10 Prepared for AARP by Princeton Survey Research Associates

• Boomers and younger peopleexpress similar perceptions of theircontrol over the life areas, except forphysical health. Compared toboomers (50%), slightly moreyounger people (61%) feel they havecontrol over this area. Older peoplemore often feel they have controlover their finances, their leisureactivities, and their work or careerthan boomers and younger people.But fewer older Americans say theyhave control over their physical andmental health than others.
• Substantial numbers of boomers andyounger adults mention that theythemselves (boomers 17%, younger19%) and their finances (boomers16%, younger 14%) are the biggestbarriers to achieving their goals.Older people most frequently men-tion their mental and physical health(16%), followed by finances (10%),aging (7%), and themselves (6%).
• Boomers (64%) and younger people(78%) are much more likely to saythey think about the future oftenthan older people (41%). All threegroups are optimistic about thefuture, but younger adults are morelikely to be anxious, and older adultsare more often concerned aboutboredom.
Other demographic comparisons show
that boomers sometimes differ across
gender, income, education, and race
and ethnicity in their life perspective.
Intra-Generational Differences
No strong intra-generational differences
were observed between younger
boomers (ages 38 to 45) and older
boomers (ages 46 to 56).
Gender Differences
Few gender differences exist. Where
differences occur they revolve around
relationships with family and friends
and personal finances.
• Female boomers (44%) are slightlymore likely than male boomers(37%) to say their relationships withfamily and friends are the best thingin their life right now.
• Male boomers (80%) are slightlymore likely than female boomers(75%) to say they expect things to be better five years from now.
• Male boomers (32%) are slightlymore likely than female boomers(25%) to mention finances as theirmajor ambition or dream for thenext five years.
Income Differences
Income plays a modest role in shaping
boomers’ evaluation of the life areas
and their views about the future.
• Overall, lower income boomers (lessthan $30,000 household income) areless likely to be satisfied than higherincome boomers ($75,000 or morehousehold income) in each of themajor life areas.
Executive Summary
11

• Religious or spiritual life is an excep-tion. Lower income boomers (53%)are slightly more likely to be satisfiedwith their religious or spiritual lifethan higher income boomers (44%).
• Lower income boomers (26%) aremore likely to say their finances arethe worst thing in their life than arehigher income boomers (17%). Morelower income boomers hope tomake gains in their finances thanhigher income boomers.
• Lower income boomers are morelikely than higher income boomersto think a great deal about nearlyevery life area, and to prefer to bespontaneous rather than plan for the future.
• And boomers earning the lowestincomes are more likely than thosein the highest income bracket to feelthe next five years will be uncertain(21% vs. 8%), boring (18% vs. 2%),anxious (29% vs. 14%) and stressful(31% vs. 16%).
Education Differences
Education also plays a modest role in
shaping boomer assessments of the life
areas and the future.
• Better-educated boomers are slightlymore likely than less well-educatedboomers to be satisfied with theirlives overall (87% vs. 82%). Whenasked if very satisfied, somewhatsatisfied, not too satisfied, or not atall satisfied with each of the specificlife areas, better-educated boomers
are slightly more likely than lesswell-educated boomers to be satis-fied with their mental health (66%vs. 59%), work or career (45% vs. 37%),and personal finances (24% vs. 18%).
• Better-educated boomers are slightlymore likely than less well-educatedboomers to say their relationshipswith family and friends (48% vs.38%) are the best thing about theirlives right now.
• Better-educated boomers (58%) areslightly more likely than less well-educated boomers to feel that theywill achieve their financial goals (50%).
• Less well-educated boomers aremore likely to think about the lifeareas than better-educated boomers.Less well-educated boomers are alsoless likely to feel empowered tochange important things in theirlives (10% vs. 27%) and to have a lesspositive outlook for the future thanbetter-educated boomers.
Race and Ethnicity Differences
Race and ethnicity play a notable role
in shaping boomer attitudes toward the
life areas and their future.
• White, African American, andHispanic boomers are largely satis-fied with the way things are going intheir lives, but fewer African American(75%) and Hispanic (77%) than whiteboomers (86%) are satisfied.
Boomers at Midlife: The AARP Life Stage Study - Volume I Full Report
12 Prepared for AARP by Princeton Survey Research Associates
• When asked if they are very satisfied,somewhat satisfied, not too satisfied,or not at all satisfied with each of thespecific life areas, African Americanboomers are less likely to be satisfiedthan white or Hispanic boomers infive of the seven life areas: finances,work or career, relationships withfamily and friends, physical health,and leisure activities. Religious orspiritual life is one area in whichAfrican American (53%) andHispanic (54%) boomers are moreoften satisfied than white (46%)boomers.
• Religious or spiritual life is the mostimportant life area for a plurality ofAfrican American boomers (40%),while family and friends is the mostimportant life area for a plurality ofwhite (49%) and Hispanic (37%)boomers.
• African American boomers are morelikely to hope for near-termimprovements in their personalfinances, religious or spiritual life,work or career, and physical healththan white or Hispanic boomers.
• African Americans tend to be moreconfident than white or Hispanicboomers that they will achieve their goals.
• African American and whiteboomers blame themselves (20%,17%) or say that finances (17%, 16%)are their biggest barrier to achievingtheir goals. Among Hispanicboomers it is “me” (12%), finances(13%), and health (10%).
• African American boomers reporthigher levels of planning and deter-mination to be in charge of their fatethan white or Hispanic boomers.
MethodologyThis nationwide, representative
telephone survey of 3,666 adults age 18
and older was conducted April 11–June
15, 2002, by Princeton Survey Research
Associates. PSRA interviewed 2,127
boomers age 38–56; 781 younger
Americans age 18 to 37; and 758 older
Americans age 57 and older. In addition
to oversampling boomers, PSRA inter-
viewed 1,185 African Americans and
1,161 Hispanic Americans.
For results based on the total sample,
one can say with 95% confidence that
the error attributable to sampling and
other random effects is plus or minus 2
percentage points. The margin of error
for boomers is plus or minus 3
percentage points; for younger adults
18 to 37, it is plus or minus 5 percentage
points; and for older adults age 57
and older, it is also plus or minus 5
percentage points.
In addition to sampling error, question
wording and practical difficulties in
conducting telephone surveys can
introduce error or bias into the findings
of this survey.
A detailed methodological report can
be found in Appendix A.
Executive Summary
13
A companion study of boomers and
older adults was conducted using
focus groups in three cities: Baltimore,
Maryland; Charlotte, North Carolina;
and Kansas City, Missouri. In each city,
four focus groups were conducted:
two consisting of boomers only, and
two with adults age 57 and older.
These groups of approximately ten
individuals comprised a mix of both
male and female, and white, African
American, and Hispanic participants.
These groups were conducted July
17–July 25, 2002, by Princeton Survey
Research Associates.
A detailed focus group methodological
report and moderator’s guide can be
found in Appendix D and Appendix E.
Boomers at Midlife: The AARP Life Stage Study - Volume I Full Report
14 Prepared for AARP by Princeton Survey Research Associates

Assessment of Current Life Status
15
III. DETAILED FINDINGS
A. ASSESSMENT OF CURRENT LIFE STATUSBoomers, like Americans generally, are
satisfied with the way things are going
in their lives. But boomers are less likely
than older Americans to be “very satis-
fied” with many aspects of their lives,
and a sizeable minority of boomers say
they are doing worse than expected in
four major life areas. These boomers
report their physical health, personal
finances, work or career, and leisure
activities are worse than they expected
at this time in their lives.
Boomers’ Overall Life Satisfaction
Boomers are generally satisfied with
the way things are going in their lives
overall. However, they report a somewhat
lower level of satisfaction than older
Americans. Eight in 10 boomers (83%)
report a general level of satisfaction
compared to nearly nine in 10 (88%)
older Americans.
Boomers’ Satisfaction with MajorLife Areas
More specifically, boomers report
being more satisfied with some aspects
of their lives and markedly less so with
others. In fact, there are only two life
areas in which a solid majority of
boomers say they are very satisfied—
their relationships with family and
friends (63%), and their mental
health (61%).
Table 1: Boomers’ Satisfaction with Major Life Areas
Overall, how satisfied are you with your ___? Are you very satisfied, somewhat satisfied, not too satisfied or not at all satisfied?
Not Too/Very Somewhat Not at All
Satisfied Satisfied Satisfied(%) (%) (%)
Relations with family and friends 63 33 4Mental health 61 33 6Religious or spiritual life 47 43 8Work or career* 39 48 12Physical health 31 52 17Leisure activities 29 52 17Personal finances 20 54 25N=2127 adults ages 38 to 56
* Asked only of those employed either full- or part-timeN=1646 adults ages 38 to 56

Boomers at Midlife: The AARP Life Stage Study - Volume I Full Report
16 Prepared for AARP by Princeton Survey Research Associates
Boomers report that other major aspects
of their lives are less satisfying. Less than
a third say they are very satisfied with
their physical health (31%), leisure
activities (29%), or personal finances
(20%). And less than half say they are
very satisfied with their religious or spir-
itual life (47%), or work or career (39%).
In some of these areas, there is outright
dissatisfaction. As many as one in four
say they are not too satisfied or not at
all satisfied with their personal financial
situation (25%). And nearly one in five
expresses low levels of satisfaction with
their leisure activities (17%) or physical
health (17%).
These dissatisfactions came through
loud and clear in the focus groups,
whether it was finances:
I’m not too satisfied with [my personal
financial situation.] That’s basically
because I’m a single parent. I work
two jobs just to try to keep things
going at home, my bills and all, help
my daughter with college. I think
about the [financial] impact of having
two children in college at the same
time and… that’s really something
that weighs a lot on me.
– 45-year-old African American
female, Baltimore
Leisure activities…
Up until a year ago I always thought
I didn’t have enough time for leisure
activities. Now that I’ve made it one
of my premium things, I find time to
do it. I think we get bogged down
with working and making money
and trying to make ends meet. Once
you get to this age you ask, ‘What am
I working for?’ ‘What am I killing
myself for?’ I’m not going to get a
million dollars or the $250,000
house, so I may as well be happy.
– 45-year-old African American
female, Charlotte
Or physical health …
I have a treadmill that’s just collecting
dust. So I had to put that I’m just
‘somewhat satisfied’ [with physical
health] because it’s a goal that I have
not yet achieved.
– 39-year-old white female,
Baltimore
Satisfaction with Major Life Areas
by Generation
Not only does satisfaction vary across
life areas, but also across generations.
In six of the seven life areas, considerably
fewer boomers report that they are very
satisfied than older Americans. The
satisfaction gap between boomers and
older people is at least 10 percentage
points for relationships with family and
friends, religious or spiritual life, work
or career, leisure activities, and personal
finances. And the gap is nearly that
large for physical health.

Assessment of Current Life Status
17
Mental health is the only area where
boomers and older adults are equally
satisfied with the same aspect of
their lives.
Some boomers in the focus groups
report that their lower levels of satisfac-
tion are due to the stress of daily life,
including being part of the “sandwich”
generation that is looking after children
and elderly parents at the same time.
Table 2: Satisfaction with Major Life Areas by Generation
Overall, how satisfied are you with your ___? Are you very satisfied, somewhat satisfied,not too satisfied or not at all satisfied?
Boomers% who say very satisfied with 18–37 38–56 57+
Relations with family and friends 57 63 74Mental health 61 61 63Religious or spiritual life 34 47 60Work or career* 34 39 50Physical health 35 31 38Leisure activities 33 29 47Personal finances 19 20 35
N=781 N=2127 N=758
* Asked only of those employed either full- or part-timeN=572 adults ages 18 to 37N=1646 adults ages 38 to 56N=202 adults ages 57 and over

As we’re getting older, I think a lot of
us actually have more dependents.
While our kids get less dependent, a
lot of us are facing, ‘Well, what are we
doing with our parents?’ I think
there’s a slew of stress right there, and
a slew of stress for many others that’s
right around the corner.
– 50-year-old white male, Baltimore
Another idea about why boomers are
less satisfied than older people was
offered by an older focus group partici-
pant who thought boomers wanted
more, and that contributed to lower
satisfaction levels.
Because [younger people] could bor-
row the money and buy [everything]
that they wanted right away that we
worked 50 years to get. And then they
tried to figure out how to pay for it
and often they couldn’t. I think that
might be one of the keys to the dis-
satisfaction. First of all, because of
credit and the media, I think that
generation wanted more, in general,
than when we grew up.
– 73-year-old white woman,
Kansas City
Older focus group respondents were
not surprised to find out that they, as a
group, are more satisfied than younger
Americans. Some attributed these
higher levels of satisfaction to the life
experiences of their generation, partic-
ularly the Depression and World War II.
These older Americans consider how
much they have survived, and conclude
these experiences have taught them a
wisdom that positively affects their
attitude toward life.
We’ve had more conflict than the
younger people. We were children
during the Depression; we had World
War II, a major trauma. We’ve seen
the bad side of life and now we’re
sitting back and enjoying the good
side. I think we’re a little bit more
content with our lives.
– 69-year-old white male, Baltimore
And according to some boomers in the
focus groups, just having lived longer
gives older people the wisdom and
experience to enjoy life.
The older generation are the ones
who have been through the financial
burdens, have been through the
marriages, relationships, hard times,
family problems; and each time you
go through that you learn how to
deal with it in a certain way. You
don’t get excited, you don’t flare off
too much; you’ve been there and you
can step back and give an example
about how to deal with it. At a
younger age, the least little thing
will flare you off.
– 51-year-old African American
female, Charlotte
Another theory about why older people
are more satisfied than younger people
is that older people have accomplished
Boomers at Midlife: The AARP Life Stage Study - Volume I Full Report
18 Prepared for AARP by Princeton Survey Research Associates

many life goals. With the mortgage
paid, the kids out of the house, and
retirement on the horizon or already at
hand, older Americans have less to
worry about and more to feel satisfied
about than boomers.
You don’t have as many distractions
in your life as far as raising children,
your career. You can be more focused
on your inner self than everything
else in your life.
– 48-year-old white male, Charlotte
An often-heard explanation for why
older Americans are more satisfied than
boomers is that older people are more
accepting and may expect less.
It’s hard to tell, are people more
satisfied, or just accepting? They
maybe can’t do anything about a
particular situation, so they just
accept it. And there are a lot of people
that are like that.
– 44-year-old white female, Kansas City
Or as some see it, the older generation
just becomes more realistic.
You know, in your career and when
you’re working… you’re thinking
about relationships and finances and
you hope things will be better. And
then one day you wake up and say,
‘This is it. I better learn to deal with it
right where it is because it’s not going
to get any better, probably.’ And you
need to enjoy where you are.
– 68-year-old white male, Charlotte
In satisfaction levels, boomers more
closely resemble younger adults than
older ones. As Table 2 shows, younger
adults share with boomers lower levels
of satisfaction than older Americans in
major life areas. In fact, younger people
are even less satisfied than boomers in
their religious or spiritual lives (34% vs.
47%), and their personal relationships
with family and friends (57% vs. 63%).
Boomers’ Most Important Life Area
It is good news that a solid majority of
boomers describe their relationships
with family and friends as very satisfying,
because this area is the most important
one to boomers. When asked to select
the single life area most important to
them, relationships with family and
friends (44%) topped the list, followed
by religious or spiritual life (22%), and
physical health (19%).
Most Important Life Area byGeneration
Older Americans and boomers rate the
same three areas of life as most impor-
tant, but the ordering is quite different.
Older Americans put physical health
(30%), religious or spiritual life (29%),
and relationships with family and friends
(26%) at roughly equal importance.
Younger adults, on the other hand, are
very similar to boomers in the priority
they give to various parts of their lives.
Boomers are somewhat more likely
Assessment of Current Life Status
19

Boomers at Midlife: The AARP Life Stage Study - Volume I Full Report
20 Prepared for AARP by Princeton Survey Research Associates
than younger adults to consider their
physical health as the most important
life area (19% vs. 12%).
A male boomer in his early 40’s
summed up the importance of family
and friends:
If you don’t have a happy personal
relationship at home then it’s just not
worthwhile. It is a struggle to keep
going if things aren’t right at home or
with family and friends. That can
affect your physical health, that can
affect your mental health, that can
affect your work and your career.
That’s why I put it first.
– 41-year-old white male, Charlotte
Many boomers in the focus groups
told us that their religious or spiritual
life was most important to them because
it was the center around which
everything revolves.
If you’re out of balance spiritually,
you’re out of balance in every other
area of your life. That gives me the
direction I need to navigate all those
other areas.
– 40-year-old African American
male, Baltimore
Table 3: Most Important Life Area by Generation
Which one of these areas is most important to you?
Boomers18–37 38–56 57+
Relations with family and friends 48 44 26Religious or spiritual life 19 22 29Physical health 12 19 30Personal finances 9 6 4Mental health 5 3 3Work or career* 4 2 1Leisure activities 2 1 2
N=781 N=2127 N=758
* Asked only of those employed either full- or part-timeN=572 adults ages 18 to 37N=1646 adults ages 38 to 56N=202 adults ages 57 and over

Assessment of Current Life Status
21
Physical health ranks third on the list of
most important aspects of life for
boomers. Like spirituality, many
boomers in the focus groups feel that
good physical health is the foundation
on which other life areas rest.
If you don’t have your health then you
can’t work or you can’t do anything.
So that’s the most important thing.
– 49-year-old white female, Charlotte
Older Americans also place importance
on relationships with family and
friends, religious or spiritual life, and
physical health but, unlike boomers,
older people are equally divided about
which is most important.
I had to go with either religion or
relationships with family. You can
always get a job, as far as finances go.
I don’t care where you go; you can
push a broom, go to McDonald’s
where you can flip hamburgers.
– 64-year-old black/African American
male, Charlotte
Boomers’ Expectations of MajorLife Areas
Are boomers where they expected to be
at this point in their lives? The answer
varies by aspect of life, but many boomers
say they are on track. This is particularly
true in the areas of mental health (62%),
relationships with family and friends
(61%), and religious or spiritual life
(54%). In each of these areas, majorities
say they are where they expected to be
at this point. When combined with the
roughly one in four who report doing
better than expected in each of these
areas, it is clear that most boomers are
meeting or exceeding their expectations
in these three aspects of their lives.
Table 4: Boomers’ Expectations of Major Life Areas
Would you say your___ is better than you expected it to be at this point in your life, worsethan you expected, or are you where you expected to be at this point in your life?
Yes—Where Better WorseExpected Off Off
Mental health 62 23 13Relations with family and friends 61 26 12Religious or spiritual life 54 26 17Work or career* 39 34 26Physical health 44 21 33Leisure activities 44 19 35Personal finances 39 29 31N=2127 adults ages 38 to 56
* Asked only of those employed either full- or part-timeN=1646 adults ages 38 to 56

Boomers at Midlife: The AARP Life Stage Study - Volume I Full Report
22 Prepared for AARP by Princeton Survey Research Associates
On the other hand, there are a troubling
number of boomers who report that
things are worse than they expected in
the other four major aspects of their
lives. One in three boomers says they
are doing worse than they expected
they would be in their leisure activities
(35%), physical health (33%) and per-
sonal financial situation (31%). One in
four say they are doing worse than they
expected in their work or career (26%).
Boomers’ Expectations of MajorLife Areas by Marital Status
These disappointments occur more
often among boomers who have expe-
rienced marital loss or discord than
among those who are married or have
never been married.1 This is a notable
finding since two in 10 (16%) boomers
are currently widowed, divorced, or
separated. For example, nearly half of
those widowed, divorced, or separated
(48%) say that their financial situation
is worse than they expected it would be
at this point in their life. This is a
substantially larger percentage than
boomers who are married, living with a
partner, or never been married (28%).
This pattern prevails in all areas except
boomers’ religious or spiritual life
where about two in 10 in either group
(widowed/divorced/separated 21%,
married/living with/never married 17%)
Table 5: Boomers’ Expectations of Major Life Areas by Marital Status
Would you say your ___ is better than you expected it to be at this point in your life, worsethan you expected or are you where you expected to be at this point in your life?
Widdowed/ Married/ Divorced/ Living with/
% saying worse off Separated Never Married
Personal finances 48 28Mental health 22 11Physical health 40 32Relations with family and friends 16 11Religious or spiritual life 21 17Work or career* 31 25Leisure activities 42 34N=2116 adults ages 38 to 56 N=462 N=1654
* Asked only of those employed either full- or part-timeN=343 widowed/divorced/separated adults ages 38 to 56N=1293 married/living with/never-married adults ages 38 to 56
1 With the exception of personal finances and leisure activities, married and never-married boomers are equallylikely to say they are worse off. For personal finances, married boomers are better off than boomers who have nevermarried or boomers who have been divorced, separated, or widowed. For leisure activities, those who are marriedor living with a partner are better off than divorced, separated, or widowed boomers. And boomers who have nevermarried are better off than all other boomers.

Assessment of Current Life Status
23
say they are worse off. Otherwise for
all other life areas, widowed, divorced,
or separated boomers are more likely
than their married or single counterparts
to say they are worse off than they
expected to be.
Expectations of Major Life Areasby Generation
On each of the seven specific life areas,
boomers are more likely than older
Americans to say they are worse off
than expected. The difference is striking
in most of the areas. For leisure activi-
ties, 35% of boomers say they are worse
off than expected, compared with only
16% of older Americans. And even on
health—an often cited major concern
for older Americans—there are more
boomers who say they are worse off
than expected (33%) than older
Americans (20%).
The differences between boomers and
older Americans may be due, in part,
to the changes in expectations that
come with becoming an older American.
In the focus groups, some older people
emphasized how retirement, in
particular, prompted an adjustment
of their expectations.
Table 6: Expectations of Major Life Areas by Generation
Would you say your ___ is better than you expected it to be at this point in your life, worsethan you expected, or are you where you expected to be at this point in your life?
Boomers% saying worse off 18–37 38–56 57+
Leisure activities 30 35 16Physical health 32 33 20Personal finances 31 31 16Work or career* 26 26 12Religious or spiritual life 26 17 8Mental health 11 13 7Relations with family and friends 15 12 7
N=781 N=2127 N=758
* Asked only of those employed either full- or part-timeN=572 adults ages 18 to 37N=1646 adults ages 38 to 56N=202 adults ages 57 and over

When I retired at 65, I said, Okay, I’m
never going to be president of the
United States. I’ll never be a four-star
general. I’ll never be the CEO of
General Electric, Inc. What I am right
now is what I’m going to be the rest of
my life.
– 69-year-old white male, Baltimore
But there are older Americans who say
they are not meeting their expectations,
and want things to be better.
The only one I was very satisfied with
was mental health, barely. But out of
the rest of them, it was the only one. I
was somewhat satisfied with most of
them. I wanted it to be a little better,
wanted it to be a lot better.
– 72-year-old white male, Charlotte
Once again, boomers and younger
adults are more alike. Like boomers, a
quarter or more younger adults feel
they are worse off when it comes to
areas of their life such as leisure (30%),
physical health (32%), finances (31%),
and their work or career (26%).
And in-step with boomers, fewer
younger people feel worse off in terms
of the relationships they have with
family and friends (15%) or their mental
health (11%). But younger adults (26%)
are more likely than boomers (17%) to
say their religious or spiritual life is
worse than they expected.
Life’s Highs and Lows for Boomers
We asked boomers to tell us what the
best thing is about their life right now,
and consistent with their earlier
answers, many cited their relationships
with family and friends. A plurality of
41% referred to their personal relation-
ships as the best thing right now in
their lives. As answers to this question
in the telephone survey show, these
relationships reflect a multitude of
circumstances.
“My children.”
“New granddaughter.”
“I have a baby.”
“That all my kids are out of the
house.”
“Time I spend with my friends.”
“I am taking care of my mom.”
“Twenty-five years married.”
“Being single.”
“I’m divorced and have financial
independence and piece of mind.”
“I got rid of a wife and I’m on my own.”
Roughly one in 10 boomers say the best
thing in their lives is their work or
career (11%), their physical or mental
health (9%), or their religious or spiritual
life (8%). And an additional one in 10
say that “everything” or “just being
alive” (12%) is the best thing.
Boomers at Midlife: The AARP Life Stage Study - Volume I Full Report
24 Prepared for AARP by Princeton Survey Research Associates

Assessment of Current Life Status
25
Table 7: Life’s Highs and Lows by Generation
What is the best thing about your life right now?
Boomers18–37 38–56 57+
Family and friends 45 41 19Work or career 12 11 18Health (physical and mental) 6 9 13Personal finances 2 2 2Religious or spiritual life 3 8 9Leisure activities 2 1 4Other
Security/Peace/Stability/Freedom 3 3 4Home/House/Residential locale 3 2 2Education 5 1 *Everything/Being alive 10 12 17Nothing 6 7 8
What is the worst thing about your life right now?
Boomers18–37 38–56 57+
Personal finances 21 20 10Work or career 12 13 4Family and friends 8 9 11Health (physical and mental) 4 8 21Religious or spiritual life 0 0 0Leisure activities 0 0 0Other
Societal concerns 3 4 3Lack of time 2 3 1Aging 0 2 12Residential locale 2 1 *Nothing 28 25 29
N=781 N=2127 N=758

What’s the worst thing in life for
boomers? Finances, followed by work
or career.
One in five (20%) boomers say finances
are the worst thing in their life. And,
unlike work or career, very few (2%)
boomers counter this assessment
by saying that finances are the best
thing in their life. Typical comments
from the telephone survey included
concerns about bills, credit cards, and
college tuition:
“Behind on bills.”
“Bills and taxes.”
“Figuring out how to pay for college.”
“There’s not much money, credit card
debt and interest rates.”
“The worst thing in my life is
my credit.”
Work or career can be a plus for some
boomers, but an albatross for others.
One in 10 boomers cites work or career
as the best (11%) thing in their life, and
as many say it is the worst (13%). Here
are some comments from those who
said it was the worst thing in their life:
“Having to work 40 hours a week and
no play time.”
“I just lost my job because of a
corporate layoff.”
“Finding a good job.”
“I’m working too hard.”
“Probably the pressures of my job.”
And this from those who said it was
the best:
“Job security.”
“Still have a job.”
“Getting practical experience in my
work.”
“I’m getting my business going.”
“I have a pretty good job and
financial security.”
These numbers are consistent with the
earlier finding that more than a quarter
of boomers report being worse off in
their work or career than they thought
they would be. And at the other extreme,
a similarly large minority of boomers
says they are better off in their work or
career (34%) than they thought they
would be (see Table 4).
Fully one in four (25%) boomers say
“nothing” is the worst thing in their life
right now.
Life’s Highs and Lows byGeneration
Older Americans paint a very different
picture than boomers about the best
and worst things. Older people are
much less likely than boomers to
credit their relationships as the best
thing in their life. Their relationships
with various family and friends (19%)
are as commonly mentioned as the best
thing as their work or career (18%), or
the general feeling that everything is
good or that it is good to be alive (17%).
Boomers at Midlife: The AARP Life Stage Study - Volume I Full Report
26 Prepared for AARP by Princeton Survey Research Associates

This latter finding is consistent with
the finding that older people are more
satisfied with their lives overall than
are boomers and younger people.
Health and aging are more of a problem
for older adults than for boomers. One
in five (21%) older adults says their
physical and mental health is the worst
thing about their life right now, compared
to fewer than one in 10 boomers (8%).
Older adults (12%) are also much more
likely than boomers (2%) to say that
aging is the worst thing about their life.
In contrast to older people, boomers
and younger Americans respond in a
very similar manner when asked about
the best and worst in life.
A plurality of young Americans (45%)
talk about a close relationship as the
best thing in their life, and their
finances (21%) as the worst thing in
their life right now. Like boomers, work
or career is the best thing (12%) for
younger people about as frequently as
it is the worst thing (12%)
Demographic Differencesin Assessment of CurrentLife Status AmongBoomersSatisfaction with the seven life areas
does not differ substantially by age or
gender for boomers. Younger and older
boomers (see Table 8), and male and
female boomers (see Table 9), differ
little in their reported satisfaction in the
life areas. But income and education
levels do shape satisfaction levels, with
less-affluent boomers (see Table 11)
and less-educated boomers (see Table 14)
generally less satisfied. The exception
is religious or spiritual life, where
satisfaction declines as income rises.
Boomers’ Assessment of CurrentLife Status by Age
The boomer generation spans nearly
20 years. Are younger boomers more
similar to the younger generation and
older boomers more like the older
generation, or do boomers of all ages
share similar levels of satisfaction over
the seven life areas?
The answer is that both younger and
older boomers share similar levels of
satisfaction. As the table shows, there
is remarkable similarity in levels of
satisfaction between younger and
older boomers.
In addition, both groups of boomers
share similar evaluations of their
current situation across most of the life
areas. Religious or spiritual life is the
only area where younger boomers
(21%) are more likely than older
boomers (14%) to say it is worse than
they expected at this point.
Another intra-generational difference
emerges when boomers are asked to
name the best thing in their life right
now. Almost half of younger boomers
(47%) refer to a relationship with family
Assessment of Current Life Status
27

Boomers at Midlife: The AARP Life Stage Study - Volume I Full Report
28 Prepared for AARP by Princeton Survey Research Associates
and friends. Fewer, yet still a plurality of
older boomers (35%), say the same.
While this is not nearly as low as the 19
percent of older adults (57+) who say
relationships are the best thing in their
life, it still may be indicative of the
diminishing role of family and friends
as one grows older.
This is somewhat understandable when
we consider that older boomers are
experiencing much greater change in
their personal relationships than
younger boomers.
• Older boomers (45%) are three timesmore likely than younger boomers(15%) to have had their last childmove out of the house.
Table 8: Boomers’ Satisfaction with Major Life Areas by Age
Overall, how satisfied are you with your ___? Are you very satisfied, somewhat satisfied, not too satisfied, or not at all satisfied?
Younger OlderBoomers Boomers
% who say very satisfied with 38–45 46–56
Relations with family and friends 63 63Mental health 60 61Religious or spiritual life 45 49Work and career* 39 40Physical health 32 30Leisure activities 28 30Personal finances 19 21
N=945 N=1139
* Asked only of those employed either full- or part-timeN=762 adults ages 38 to 45N=851 adults ages 46 to 56

Assessment of Current Life Status
29
• Older boomers are more likely tohave experienced the death of aspouse (older boomers 6%, youngerboomers 3%), their father (olderboomers 61%, younger boomers35%), or their mother (older boomers39%, younger boomers 18%).
There are no differences between
younger and older boomers when asked
to name the worst thing in their life.
Boomers’ Assessment of CurrentLife Status by Gender
Gender is also not a dividing line among
boomers. As shown in Table 9, male
and female boomers are equally likely
to say they are satisfied with the way
things are going in the seven life areas.
Moreover, male and female boomers
report similar evaluations of their life
situation across all life areas, except
mental health. Although relatively few
men or women say their mental health
is worse than expected, female (15%)
boomers are slightly more likely than
male (10%) boomers to feel this way
(see Volume II Demographic Breakdowns).
Solid pluralities of male and female
boomers say that the best thing in their
life right now is their relationships with
family and friends, although women
(44%) express this view somewhat more
than men (37%). Male and female
boomers do not differ significantly in
their assessment of what is the worst
thing in their life (see Table 10).
Table 9: Boomers’ Satisfaction with Major Life Areas by Gender
Overall, how satisfied are you with your ___? Are you very satisfied, somewhat satisfied, not too satisfied, or not at all satisfied?
% who say very satisfied with Males Females
Relations with family and friends 61 64Mental health 62 60Religious or spiritual life 46 48Work and career* 39 40Physical health 32 30Leisure activities 28 30Personal finances 18 22N=2127 adults ages 38 to 56 N=856 N=1271
* Asked only of those employed either full- or part-timeN=709 males ages 38 to 56N=937 females ages 38 to 56

Boomers at Midlife: The AARP Life Stage Study - Volume I Full Report
30 Prepared for AARP by Princeton Survey Research Associates
Table 10: Life’s Highs and Lows for Boomers by Gender
What is the best thing in your life right now?
Males Females
Family and friends 37 44Work or career 12 11Health (physical and mental) 8 9Personal finances 3 1Religious or spiritual life 7 8Leisure activities 2 *Other
Security/Peace/Stability/Freedom 3 3Home/House/Residential locale 2 3Education 1 1Everything/Being alive 13 12Nothing 8 6
What is the worst thing about your life right now?
Males Females
Personal finances 21 19Work or career 13 13Family and friends 8 11Health (physical and mental) 7 8Religious or spiritual life 0 0Leisure activities 0 0Other
Societal concerns 4 3Lack of time 2 3Aging 3 1Residential locale 1 1Nothing 24 26
N=2127 adults ages 38 to 56 N=856 N=1271

Assessment of Current Life Status
31
Boomers’ Assessment of CurrentLife Status by Income
Income is a somewhat more informative
factor than age or gender in helping to
understand how boomers evaluate
their life status. Lower-income boomers
are much less likely to say they are
satisfied (and more likely to say they
are dissatisfied) than those making
higher incomes. Specifically, boomers
earning the lowest incomes are as
satisfied as boomers earning higher
incomes in their physical health and
leisure activities, but tend to be less
satisfied than higher-income boomers
in other categories. The one exception
is religious or spiritual life, where the
less-affluent boomers are more satisfied
than top earners.
Table 11: Boomers’ Overall Life Satisfaction by Income
Are you satisfied or dissatisfied with the way things are going in your own life today?
LT $30K $30–LT $50K $50–LT $75K $75K+
Satisfied 69 84 88 89Dissatisfied 27 13 11 9N=1896 adults ages 38 to 56 N=552 N=515 N=354 N=475
Table 12: Boomers’ Satisfaction with Major Life Areas by Income
Overall, how satisfied are you with your ___? Are you very satisfied, somewhat satisfied, nottoo satisfied, or not at all satisfied?
% who are very satisfied LT $30K $30–LT $50K $50–LT $75K $75K+
Relations with family and friends 51 60 63 69Mental health 52 55 64 67Religious or spiritual life 53 49 43 44Work and career* 33 31 41 44Physical health 31 31 27 35Leisure activities 29 30 25 29Personal finances 10 19 17 30N=1896 adults ages 38 to 56 N=552 N=515 N=354 N=475
* Asked only of those employed either full- or part-timeN=341 adults ages 38 to 56 earning less than $30KN=426 adults ages 38 to 56 earning $30K to less than $50KN=305 adults ages 38 to 56 earning $50K to less than $75KN=411 adults ages 38 to 56 earning $75K or more

Boomers at Midlife: The AARP Life Stage Study - Volume I Full Report
32 Prepared for AARP by Princeton Survey Research Associates
• Boomers with the lowest householdincomes are less likely to say theyare satisfied with the way things aregoing in their life overall. Of thosewith incomes less than $30,000, 69 percent say they are satisfied, compared to 89 percent of thoseearning $75,000 or more.
• When compared to the top earners,boomers with the lowest householdincomes are less likely to say theyare very satisfied with their personalrelationships (51% vs. 69%), mentalhealth (52% vs. 67%), work or career(33% vs. 44%), and their finances(10% vs. 30%).
• Religious or spiritual life is the onlyarea where this pattern is reversed.Those earning the least are morelikely than top earners to say theyare very satisfied with their religiousor spiritual life (53% vs. 44%).
Income also helps shape what boomers
say are the best and worst things in
their life.
• As income increases, so does thefeeling that the best thing in life isfamily and friends. Three in 10 withthe lowest incomes (28%), aboutfour in 10 in the two middle-incomebrackets (39% and 44%), and five in10 (52%) of the top earners namefamily and friends as the best thingin their lives.
• Another difference is that those withthe lowest household incomes (17%)are more likely than the top earners(8%) to say the best thing about theirlife is an overall good life.
• It is perhaps not surprising that thosewith the lowest household incomes(26%) are more likely than top earners(17%) to say that the worst thing intheir life is finances. What is surprisingis the gap between the groups is sosmall, compared with the incomegap itself.

Assessment of Current Life Status
33
Table 13: Life’s Highs and Lows for Boomers by Income
What is the best thing about your life right now?
LT $30K $30–LT $50K $50–LT $75K $75K+
Family and friends 28 39 44 52Work or career 10 11 13 12Health (physical and mental) 10 9 10 8Personal finances 2 1 1 3Religious or spiritual life 8 11 6 6Leisure activities 2 1 2 1Other
Security/Peace/Stability/Freedom 4 2 3 2Home/House/Residential locale 2 4 2 2Education 2 0 0 0Being alive/Everything 17 12 12 8Nothing 9 6 6 4
What is the worst thing about your life right now?
LT $30K $30–LT $50K $50–LT $75K $75K+
Personal finances 26 19 22 17Work or career 13 13 14 15Family and friends 8 9 11 10Health (physical and mental) 13 8 5 5Religious or spiritual life 0 0 0 0Leisure activities 0 0 0 0Other
Societal concerns 2 1 3 4Lack of time 1 1 1 7Aging 1 1 2 2Residential locale 1 2 1 1Nothing 23 30 22 24
N=1896 adults ages 38 to 56 N=552 N=515 N=354 N=475

Boomers at Midlife: The AARP Life Stage Study - Volume I Full Report
34 Prepared for AARP by Princeton Survey Research Associates
Boomers’ Assessment of CurrentLife Status by Education
Education also plays a modest role in
shaping boomers’ assessments of their
life status. Boomers with a college
degree tend to be more satisfied than
those without a college degree, both
overall and when considering many
specific life areas.
College graduates (87%) are more likely
than boomers who did not graduate
from college (82%) to say that overall
they are satisfied with the way their life
is going. And in a few life areas, college
graduates are more likely than those
without a college degree to be more
satisfied. These areas include:
• Mental health (66% vs. 59%)
• Work or career (45% vs. 37%)
• Personal finances (24% vs. 18%)
College graduates (48%) are more likely
than those without a college degree
(38%) to refer to their relationships
with family and friends as the best
thing about their life right now.
Boomers across different levels of
education otherwise share very similar
experiences when naming the best
and worst things in their life.
Table 14: Boomers’ Satisfaction with Major Life Areas by Education
Overall, how satisfied are you with your ______? Are you very satisfied, somewhat satisfied,not too satisfied, or not at all satisfied?
Less Than College% who say very satisfied with College Degree Grad+
Relations with family and friends 61 66Mental health 59 66Religious or spiritual life 46 50Work and career* 37 45Physical health 31 33Leisure activities 29 29Personal finances 18 24N=2120 adults ages 38 to 56 N=1504 N=616
* Asked only of those employed either full- or part-timeN=1123 adults with less than a college degree, ages 38 to 56N=518 adults with a college degree or more, ages 38 to 56

Assessment of Current Life Status
35
B. NEAR-TERM LIFE GOALSSome dashed hopes have not stopped
boomers from seeing what is possible,
and generally wanting more from life.
Boomers are optimistic that their lives
will be better in the future. And, without
exception, boomers hope to be doing
better in each of the seven major life
areas five years from now. Finance, and
work or career, top the list of areas
boomers are most hopeful to improve
in the near-term.
General Hopes for the Future byGeneration
Nearly eight in 10 boomers (77%) say
they expect things in their lives to be
better over the next five years. A much
smaller percentage of boomers expect
the status quo to prevail (17%), and just
a handful believe things will be worse
(3%). By contrast, substantially fewer
older Americans (41%) expect things in
their lives to be better over the next five
years. At the other end of the spectrum,
the vast majority of younger Americans
(92%) are optimistic that things will be
better in five years.
Boomers’ Current Status andHopes for Life Areas
To measure current status and hopes
for the future in detail, we asked
boomers to rate on a scale from 0 to 10
their current status in the seven life
areas, and to tell us what they realistically
hope that rating will be in five years.
Table 15: General Hopes for the Future by Generation
Five years from now, do you expect things in your life will be better, the same, or worsethan they are right now?
Boomers18–37 38–56 57+
Better 92 77 41Same 7 17 34Worse 1 3 17
N=781 N=2127 N=758

Boomers at Midlife: The AARP Life Stage Study - Volume I Full Report
36 Prepared for AARP by Princeton Survey Research Associates
Currently, boomers give themselves
moderate marks in each of the life
areas, which is consistent with their
earlier assessment of being “somewhat”
satisfied with their lives. On a 0 to 10
scale, boomers rate their mental health
the highest with an average score of 8.3,
followed by their relationships with
family and friends (8.2). At the bottom
of the list are leisure activities (5.6) and
finances (6.2).
In each one of the life areas, boomers
hope to be doing better five years from
now. Areas cited for greatest improve-
ment are the areas boomers rate the
lowest. Leisure activities top this list.
Boomers currently rate leisure activities
at a modest 5.6 on our 0 to 10 scale,
and hope it will jump to 7.6 in five
years, for a targeted gain of 2.0 points
on average. Other areas where boomers
are looking for large gains include their
personal finances (1.8 points) and their
religious or spiritual life (1.4 points).
(See Figure 1 for graphic display of these
findings for all three generations.) As
noted earlier, boomers are least likely
to be very satisfied with their leisure
activities, finances, work or career, and
physical health (see Table 1). And these
same four areas are most often cited as
the ones in which boomers are doing
worse than they expected to be doing
(see Table 4).
Table 16: Boomers’ Current Status and Hopes for Life Areas
How would you rate your ___? Please use a scale that goes from 0 to 10; 10 is the top of thescale and 0 is the bottom of the scale.Given your current ____ situation, what is the best position you could realistically hope tohave 5 years from now? Please use the 0 to 10 scale, where 10 is the top of the scale and 0is the bottom of the scale.
Target ChangeDesired Rating Over Next
Current Rating in 5 Years 5 Years
Leisure activities 5.6 7.6 2.0Personal finances 6.2 8.0 1.8Religious or spiritual life 6.8 8.2 1.4Work or career* 7.3 8.4 1.1Physical health 6.9 8.0 1.1Relations with family and friends 8.2 8.8 0.6Mental health 8.3 8.9 0.6N=2127 adults ages 38 to 56
* Asked only of those employed either full- or part-timeN=1646

Assessment of Current Life Status
37
Table 17: Major Life Area Boomers Would Most Like to Change
Which one of all the life areas we have been talking about would you most like to change?
Personal finances 35Physical health 17Work or career* 14Leisure activities 10Religious or spiritual life 8Relations with family and friends 6Mental health 1N=2127 adults ages 38 to 56
* Asked only of those employed either full- or part-timeN=1646
Major Life Area Boomers WouldMost Like to Change
We find further support for these findings
when we asked boomers to name the
one area that they would most like to
change. The list is a familiar one:
personal financial situation (35%),
physical health (17%), work or career
(14%), and leisure activities (10%).

Boomers at Midlife: The AARP Life Stage Study - Volume I Full Report
38 Prepared for AARP by Princeton Survey Research Associates
Figure 1: Current Status and Hopes for Future by Generation
Leisure
Finance
Religious Life
Work
Physical Health
Family
Mental Health
18-37
Boomers
57+
18-37
Boomers
57+
18-37
Boomers
57+
18-37
Boomers
57+
18-37
Boomers
57+
18-37
Boomers
57+
18-37
Boomers
57+
0 2 4 6 8 10
0 2 4 6 8 10
0 2 4 6 8 10
0 2 4 6 8 10
0 2 4 6 8 10
0 2 4 6 8 10
0 2 4 6 8 10
Current Future

Assessment of Current Life Status
39
These hoped-for changes correspond
with a general feeling of some boomers
that there is always hope for improve-
ment, even in areas that seem difficult
to change.
There’s always room for improvement
in any of these categories. And there’s
always another level. Even in your
financial situation or your physical
[health]. Keep striving for another
place in all of these.
– 56-year-old African American
female, Baltimore
A closer examination suggests that
boomers may be trying to find more
balance in their lives. Apparently many
boomers do not see themselves living
well-rounded lives. Some areas are
excelling and others are lagging. When
we look at where boomers hope to be
five years from now, it suggests that
boomers may be trying to bring these
different areas into some equilibrium.
In areas where boomers are already
doing well, they hope for modest
changes; whereas in life areas that have
fallen behind, boomers hope for gains
that will bring them more in line with
areas that are doing well.
As boomers told us in the focus groups:
I think they all play off each other. If
there’s not balance in all of those areas
then your whole life doesn’t feel right.
– 39-year-old white female, Baltimore
They all tie in… they all are your
way of life… how you see it… how
you use it… how you work with it…
most of those are the positive things
that you need.
– 52-year-old white male, Charlotte
Boomers’ and Older Americans’Current Status and Hopes for Life Areas
In contrast to boomers, older Americans
hope for much more modest gains, and
even acknowledge some backsliding in
the areas of relationships with family and
friends and mental health. As we have
seen, older Americans are more satisfied
with their life situation than boomers and
younger Americans, and as a consequence
may feel less of a need to make dramatic
gains in these areas than their younger
counterparts. The area that older
Americans hope for the most gain is their
religious or spiritual life, where a gain
of just about one point (0.9) is desired.
Focus group participants explain the gap
in expectations between boomers and
older people as a combination of realism
and contentment. The good news is that
older people have “arrived”—they are
settled and generally content. But the bad
news is that older people have fewer
opportunities than younger people to
change things. Focus group participants
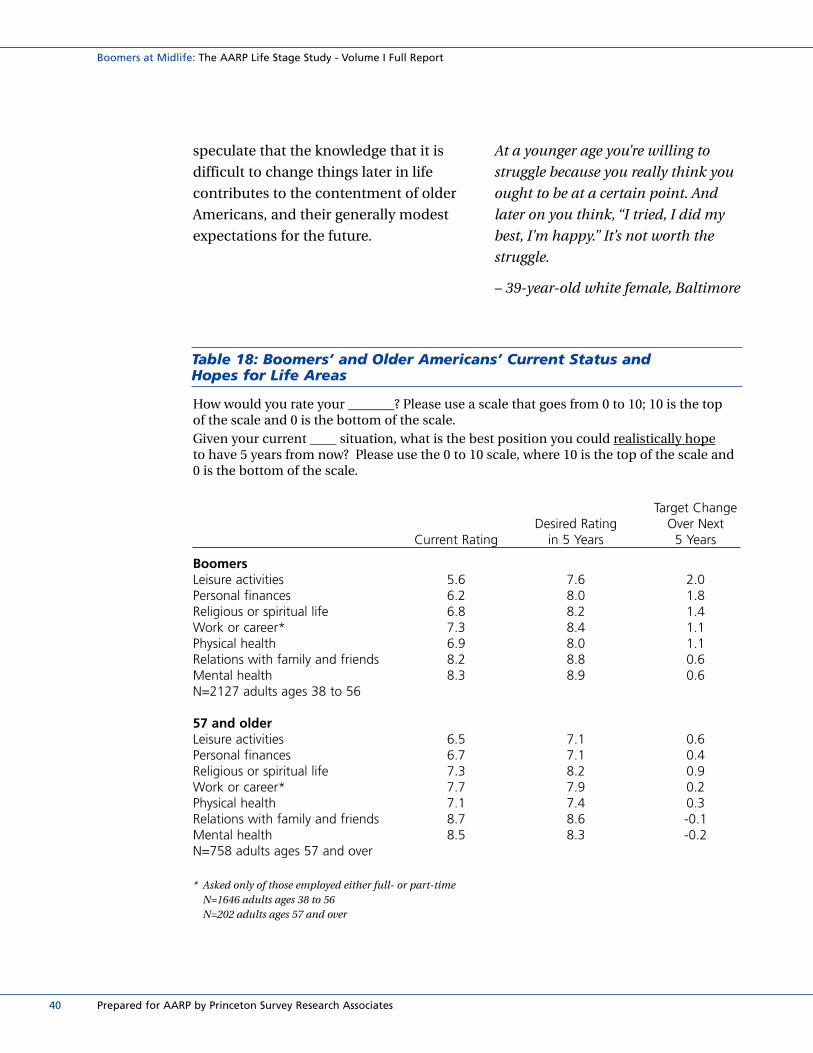
Boomers at Midlife: The AARP Life Stage Study - Volume I Full Report
40 Prepared for AARP by Princeton Survey Research Associates
Table 18: Boomers’ and Older Americans’ Current Status and Hopes for Life Areas
How would you rate your _______? Please use a scale that goes from 0 to 10; 10 is the top of the scale and 0 is the bottom of the scale.Given your current ____ situation, what is the best position you could realistically hopeto have 5 years from now? Please use the 0 to 10 scale, where 10 is the top of the scale and0 is the bottom of the scale.
Target ChangeDesired Rating Over Next
Current Rating in 5 Years 5 Years
BoomersLeisure activities 5.6 7.6 2.0Personal finances 6.2 8.0 1.8Religious or spiritual life 6.8 8.2 1.4Work or career* 7.3 8.4 1.1Physical health 6.9 8.0 1.1Relations with family and friends 8.2 8.8 0.6Mental health 8.3 8.9 0.6N=2127 adults ages 38 to 56
57 and olderLeisure activities 6.5 7.1 0.6Personal finances 6.7 7.1 0.4Religious or spiritual life 7.3 8.2 0.9Work or career* 7.7 7.9 0.2Physical health 7.1 7.4 0.3Relations with family and friends 8.7 8.6 -0.1Mental health 8.5 8.3 -0.2N=758 adults ages 57 and over
* Asked only of those employed either full- or part-timeN=1646 adults ages 38 to 56N=202 adults ages 57 and over
speculate that the knowledge that it is
difficult to change things later in life
contributes to the contentment of older
Americans, and their generally modest
expectations for the future.
At a younger age you’re willing to
struggle because you really think you
ought to be at a certain point. And
later on you think, “I tried, I did my
best, I’m happy.” It’s not worth the
struggle.
– 39-year-old white female, Baltimore

Assessment of Current Life Status
41
Boomers’ and Younger Americans’Current Status and Hopes for Life Areas
Consistent with other findings, younger
Americans are similar to boomers in the
gains they believe are possible across
various life areas. Where differences exist
between the two groups, it is younger
Americans who hope to make greater
gains in the next five years than boomers.
For example, boomers hope for, on
average, a 1.4 rating point increase in
their religious or spiritual life, moving
from a 6.8 to 8.2 rating, while younger
Americans are looking for, on average,
a 1.8 point increase (from 6.9 to 8.7).
Younger Americans, like boomers, seek
improvements in the areas where they
are currently the lowest, such as personal
finances (2.4 point gain), religious or
spiritual life (2.0), work or career (1.8)
and leisure activities (2.0).
Table 19: Boomers’ and Younger Americans’ Current Status and Hopes for Life Areas
How would you rate your ___? Please use a scale that goes from 0 to 10; 10 is the top of thescale and 0 is the bottom of the scale.Given your current ____ situation, what is the best position you could realistically hope tohave 5 years from now? Please use the 0 to 10 scale, where 10 is the top of the scale and 0is the bottom of the scale.
Target ChangeDesired Rating Over Next
Current Rating in 5 Years 5 Years
BoomersLeisure activities 5.6 7.6 2.0Personal finances 6.2 8.0 1.8Religious or spiritual life 6.8 8.2 1.4Work or career* 7.3 8.4 1.1Physical health 6.9 8.0 1.1Relations with family and friends 8.2 8.8 0.6Mental health 8.3 8.9 0.6N=2127 adults ages 38 to 56
18-37 year oldsLeisure activities 6.0 8.0 2.0Personal finances 5.9 8.3 2.4Religious or spiritual life 6.0 8.0 2.0Work or career* 6.9 8.7 1.8Physical health 7.1 8.6 1.5Relations with family and friends 8.0 8.9 0.9Mental health 8.3 9.0 0.7 N=781 adults ages 18 to 37
* Asked only of those employed either full- or part-timeN=1646 adults ages 38 to 56N=572 adults ages 18 to 37

Boomers at Midlife: The AARP Life Stage Study - Volume I Full Report
42 Prepared for AARP by Princeton Survey Research Associates
Major Ambition for Boomers
When boomers dream about what they
would like to accomplish over the next
five years, their thoughts turn to finance,
work or career and, to a lesser extent,
relationships with family and friends.
In comments made in the telephone
survey, boomers clearly state their
ambition for their financial situation:
“Financial independence.”
“Pay off all my bills.”
“Have enough money to retire
successfully.”
“I would like to pay for my children
to get through college.”
Whereas in the workplace their
short-term dream is to...
“Start my own business.”
“Better career.”
“Start my own investment company.”
“I would like to retire in the next
five years.”
“Have a career change.”
Major Ambition by Generation
Older adults differ from both younger
generations, citing their physical or
mental health most often as the area of
their lives to change (24%). Older adults
nearly as often say that they do not
have a major ambition or goal, or that
they have already accomplished it (22%).
Younger adults are similar to boomers in
these short-term aspirations, except
younger adults (19%) are more likely
than boomers (6%) to say that education
is their one major ambition or dream.
Table 20: Major Ambition by Generation
What one major ambition or dream would you like to accomplish over the next five years?
Boomers18–37 38–56 57+
Personal finances 29 29 12Work or career 19 23 9Relations with family and friends 12 11 8Education 19 6 2Leisure activities 3 5 7Other
Self improvement/New lifestyle or perspective 2 4 4
Health (physical or mental) 3 4 24Religious or spiritual life * 1 2Societal concern 0 * 2Don’t have one/Already accomplished 7 11 22
N=781 N=2127 N=758

Assessment of Current Life Status
43
Demographic Differencesin Near-Term Life GoalsAmong BoomersNear-term life goals vary somewhat by
age and gender but little by the income
or education levels of boomers.
• Younger and older boomers expresssome differences in outlook, witholder boomers somewhat less likelyto strive for greater gain thanyounger boomers.
• Both male and female boomers areoptimistic about the near-termfuture, although men are slightlymore optimistic than women. Whenasked about their major ambition ordream for the next five years, mencite finances and work more thanwomen, while women mention relationships and education morethan men.
Boomers’ Near-Term Life Goals by Age
Older and younger boomers differ
somewhat in their overall outlook for
the near-term future.
• In particular, younger boomers(84%) are more likely than olderboomers (71%) to say that theyexpect things to be better five yearsfrom now.
• Even with this difference, olderboomers (71%) are substantiallymore likely than older Americans(41%) to say they expect things to bebetter in five years.
Younger and older boomers also differ
slightly on the improvements they hope
for in several life areas. These differences
reveal a link, albeit a modest link,
between the younger and older genera-
tions in their goal-setting attitudes.
• As Table 22 shows, younger boomersstrive for greater gains than olderboomers. This is particularly true inthe areas of work or career, physicalhealth, and personal finances.
• Considered across age groups, itappears that with age comes a declinein aspirations. The focus groupssuggest, as noted earlier, that thisdecline could be related to the idea
Table 21: Boomers’ General Hopes for the Future by Age
Five years from now, do you expect things in your life will be better, the same, or worsethan they are right now?
Younger OlderBoomers Boomers
18–37 38–45 46–56 57+
Better 92 84 71 41Same 7 11 22 34Worse 1 3 4 17
N=781 N=945 N=1139 N=758

Boomers at Midlife: The AARP Life Stage Study - Volume I Full Report
44 Prepared for AARP by Princeton Survey Research Associates
that as people age they have achievedmore and have less to strive for.
When we look at boomers’ major
ambition by age groups, however, the
relationship between age and desired
change is not as clear.
• Younger boomers (33%) are morelikely than older boomers (24%) tosay that the one major ambition or
dream that they would like toaccomplish over the next five yearsis finance-related. Nonetheless, bothyounger and older boomers are stillmore similar to younger adults(29%) than older adults (12%).
• Younger boomers (8%) are morelikely than older boomers (4%) tosay that their major dream or ambition for the near future is
Table 22: Boomers’ Hopes for Life Areas by Age
How would you rate your ___? Please use a scale that goes from 0 to 10; 10 is the top of thescale and 0 is the bottom of the scale.Given your current ____ situation, what is the best position you could realistically hope tohave 5 years from now? Please use the 0 to 10 scale, where 10 is the top of the scale and 0is the bottom of the scale.
Younger OlderTarget change over the next Boomers Boomers5 years (in rating points) 18–37 38–45 46–56 57+
Personal finances 2.4 2 1.6 .4Religious or spiritual life 2 1.6 1.2 .9Work or career* 1.8 1.5 .9 .2Physical health 1.5 1.3 .9 .3Relations with family and friends .9 .7 .5 -.1Mental health .7 .7 .5 -.2Leisure activities 2.0 2.1 1.8 .6
N=781 N=945 N=1139 N=758
* Asked only of those employed either full- or part-timeN=572 adults age 18–37N=762 adults age 38–45N=851 adults age 46–56N=202 adults age 57+

Assessment of Current Life Status
45
education-related. Younger andolder boomers are closer to olderadults’ aspirations (2%) than to theeducational aspirations of youngeradults (19%).
• And while younger boomers (14%)are more likely than older boomers(9%) to say that their major dream orambition in the next five years dealswith relationships with family or
friends, these are hardly different thanyounger (12%) or older adults (8%).
• Younger (22%) and older (24%)boomers are equally likely to saythat over the next five years theirmajor goal or ambition is somethingrelated to work or their career.
Table 23: Boomers’ Major Ambition by Age
What one major ambition or dream would you like to accomplish over the next five years?
Younger OlderBoomers Boomers
18–37 38–45 46–56 57+
Personal finances 29 33 24 12Relations with family and friends 12 14 9 8Work or career 19 22 24 9Leisure activities 3 3 6 7Health (physical or mental) 3 3 5 24Religious or spiritual life * 1 2 2Other
Education 19 8 4 2Self improvement/New
lifestyle or perspective 2 3 4 4Societal concern 0 * 1 2Don’t have one/Already
accomplished 7 9 12 22N=781 N=945 N=1139 N=758

Boomers at Midlife: The AARP Life Stage Study - Volume I Full Report
46 Prepared for AARP by Princeton Survey Research Associates
Boomers’ Near-Term Life Goals by Gender
Male and female boomers differ
little, if at all, when assessing their
near-term future.
• Large majorities of men (80%) andwomen (75%) say they expect thingsin their life will be better five yearsfrom now, with men slightly moreoptimistic than women.
• Male and female boomers do notdiffer markedly in their near-termgoals for any of the seven life areas.
• When asked to share the one majorambition or dream that boomerswould like to accomplish over thenext five years, males (32%) are morelikely than females (25%) to saysomething about their finances;however, this is still the top responsefor both sexes.
• Females are somewhat more likelythan males to mention their familyor friends (females 14%, males 8%),their education (females 8%, males3%), or to say they do not have amajor dream or ambition, or thatthey have already accomplished it(females 13%, males 9%).
Table 24: Boomers’ Major Ambition by Gender
What one major ambition or dream would you like to accomplish over the next five years?
Males Females
Personal finances 32 25Relations with family and friends 8 14Work or career 25 21Leisure activities 4 5Health (physical or mental) 4 3Religious or spiritual life 1 1Other
Education 3 8Self improvement/New lifestyle or perspective 4 3Societal concern 1Don’t have one/Already accomplished 9 13
N=2127 adults ages 38 to 56 N=856 N=1271

Assessment of Current Life Status
47
Boomers’ Near-Term Life Goals by Income
Boomers’ expectations for the general
future do not differ by income level.
And only when discussing their personal
financial situation do we find differ-
ences in any specific life area by income
level, as Table 25 shows on this page.
• Boomers with the lowest householdincomes hope for the largest gains(2.7) in the next five years, whereasthose with the highest householdincomes are not expecting to makesuch large gains (1.3).
To improve their personal financial
situation, a majority (73%) of boomers
are saving or investing their money on a
regular basis. This is somewhat similar to
younger adults (69%), yet significantly
more than older Americans (59%).
Boomers’ Near-Term Life Goals by Education
• Boomers’ overall expectations forthe future vary little by educationlevel.
• Boomers without college degrees say they are doing better than theirpeers with degrees in two areas: religious or spiritual life (27% vs.21%) and mental health (26% vs.16%). In all other areas there wereno differences by education level.
• Boomers of all education levelsshare similar goals or ambitions forthe next five years. The one excep-tion is that boomers with a collegedegree (18%) are more likely to saytheir major goal is related to familyor friends than boomers without acollege degree (9%).
Table 25: Boomers’ Current Status and Financial Hopes by Income
How would you rate your personal financial situation today? Please use a scale that goesfrom 0 to 10; 10 is the top of the scale and 0 is the bottom of the scale.Given your current personal financial situation, what is the best financial position youcould realistically hope to have 5 years from now? Please use the 0 to 10 scale, where 10 isthe top of the scale and 0 is the bottom of the scale.
Target ChangeDesired Rating Over Next
Current Rating in 5 Years 5 Years
Earns less than $30,000 4.8 7.5 2.7$30,000–LT $50,000 6.0 7.9 1.9$50,000–LT $75,000 6.5 8.1 1.6Earns $75,000 or more 7.1 8.4 1.3N=2127 adults ages 38 to 56

Boomers at Midlife: The AARP Life Stage Study - Volume I Full Report
48 Prepared for AARP by Princeton Survey Research Associates

49
Table 26: Boomers’ Likelihood of Reaching Goals
How likely are you to achieve this goal—very likely, somewhat likely, not too likely, or not at all likely?*
Not TooVery Somewhat Likely/NotLikely Likely Likely At All N
Relations with family and friends 69 28 1 2084Mental health 69 28 2 2089Religious or spiritual life 60 37 3 2044Work or career** 59 38 3 1591Personal finances 53 43 4 2081Physical health 53 40 6 2079Leisure activities 48 46 5 2057
* Asked only of those who gave a desired rating of 1 to 10 for the corresponding life area** Asked only of those employed either full-or part-time
Anticipated Problems/Barriers
C. AnticipatedProblems/BarriersDo boomers think they can achieve
their goals? On reflection, do boomers
see these changes that they “realistically
hope” to make as achievable goals for
the next five years? The answer depends
on the life area. Ironically, the areas in
which boomers hope for the greatest
improvements are the areas in which
they have the least confidence in reaching
their goals. And areas where boomers
do not hope to make substantial
improvements are the areas in which
boomers have confidence they will
meet their mark.
Boomers’ Likelihood of Reaching Goals
In this section we explore the perceived
likelihood of boomers reaching goals
they “realistically hope” to achieve in
each of the life areas. This question was
designed to learn what boomers think
they can achieve if they stretch to reach
their goals. We sought to measure a
hoped-for change that was also realistic.
Our interest was to learn what boomers
would set as their goals in each of the
seven life areas when given an opportu-
nity to first rate their current life status,
and then to think about where they could
“realistically hope” to be in five years.
Boomers express greatest confidence in
their ability to achieve their target goals
in two life areas. Nearly seven in 10
boomers say they are very likely to
achieve their target goals in their
relationships with family and friends
(69%) and mental health (69%). In part,
this may be because boomers have
already achieved a relatively high level
of satisfaction in these areas, and are
seeking the smallest improvements.

Recall that when boomers rate where
they are currently, mental health (8.3)
and relationships with family and
friends (8.2) are, on average, the most
highly rated aspects of life (see Table 16).
Perhaps having achieved a relatively
high level of satisfaction in these areas
makes the task of improvement seem
less challenging.
By contrast, finances, physical health,
and leisure activities are the three life
areas in which boomers have the least
confidence they will reach their goals.
Although roughly half of boomers say
they are very likely to meet their target
goals in these areas—finances (53%),
physical health (53%), leisure activities
(48%)—nearly as many boomers say
they are not as confident. These three
life areas are those in which boomers
express the lowest levels of satisfaction
(see Table 1), and are areas where
boomers want to make significant
gains (see Table 16). Boomers’ lack of
confidence to meet their goals may be
because they have been struggling to
improve these areas, and are fully
aware of the difficulties. Nonetheless,
this does not deter them from wanting
to make progress.
Likelihood of Reaching Goals by Generation
Boomers are not the only ones who
wonder if they will achieve their goals
in the areas of leisure activities, physical
health, and finance. Both younger and
older adults voice uncertainty about
their likelihood of achieving goals in
these areas.
• Like boomers, just about half of bothyounger adults and older adults saythey are very likely to meet their goalsin leisure activities and physical health.
Boomers at Midlife: The AARP Life Stage Study - Volume I Full Report
50 Prepared for AARP by Princeton Survey Research Associates
Table 27: Likelihood of Reaching Goals by Generation
How likely are you to achieve this goal—very likely, somewhat likely, not too likely, or not at all likely?*
% who say they are ‘very likely’ Boomersto achieve their goal 18–37 N 38–56 N 57+ N
Relations with family and friends 68 765 69 2084 68 703Mental health 72 768 69 2089 62 694Religious or spiritual life 53 751 60 2044 66 692Work or career** 67 562 59 1591 72 171Personal finances 64 767 53 2081 50 673Physical health 53 771 53 2079 50 682Leisure activities 52 760 48 2057 51 684
* Asked only of those who gave a desired rating of 1 to 10 for the corresponding life area** Asked only of those employed either full- or part-time

Anticipated Problems/Barriers
51
Table 28: Boomers’ Control Over Major Life Areas
How much control do you feel you have over your _____ —a great deal, a fair amount, not too much, or no control at all?
Not Too Much/Great Deal Fair Amount None At All
Personal finances 41 44 14Leisure activities 45 40 14Work or career* 45 46 9Physical health 50 40 10Relations with family and friends 62 32 5Mental health 64 30 6Religious or spiritual life 69 25 4
N=2127 adults ages 38 to 56
* Asked only of those employed either full- or part-timeN=1646
• In addition, boomers (53%) andolder Americans (50%) share a lowerlevel of certainty than youngerAmericans (64%) about meetingtheir financial goals.
Three other differences should be noted.
• First, with age comes a greater confi-dence in reaching one’s religious orspiritual goals.
• Second, and conversely, with agecomes less confidence in reachingone’s mental health goals. Boomersand younger adults express moreconfidence than older Americans intheir ability to achieve these goals.
• And, third, boomers voice less confi-dence than either younger or olderadults in their likelihood of achiev-ing their work or career goals.
Boomers’ Control Over Major Life Areas
These data show that the larger the
hoped-for change, the more cautious
boomers are to claim that they will
reach their goal. This is due, in part, to
the fact that boomers feel they have
less control over some aspects of their
lives than others.
Boomers are less likely to say they have
a great deal of control over those areas
where they seek some of the biggest
improvements. Just half or fewer say
they have a great deal of control over
their finances (41%), leisure activities
(45%), work or career (45%), and physical
health (50%).
In the two life areas boomers are most
satisfied with—relationships with family

and friends and mental health (see
Table 1)—majorities say they have a
great deal of control (relationships
62%, mental health 64%).
Even more boomers (69%) say they
have control over their religious or
spiritual life.
Why might boomers feel they have
less control over their finances, leisure
activities, career, or physical health
than the other areas? We explore the
possibilities below.
FINANCES
Finances is the area that boomers are
least likely (41%) to feel they have a
great deal of control over. Finances are
also often cited as a reason for not
achieving what boomers really want
out of life.
These data show that a sense of control
over one’s finances is related to two
interconnected factors: the amount of
money a household earns, and the
management of that money.
• Boomers in the highest ($75,000 ormore) income brackets are morelikely to feel they have a great deal ofcontrol over their finances (51%)than those in the lowest (less than$30,000) income brackets (32%).
• Nearly three in four boomers aresaving money on a regular basis(73%), but a substantial minority ofboomers is not (26%). Saving moneyregularly is strongly related to feelingsof control over one’s finances.
Roughly half of the boomers (47%)who are saving money say they have agreat deal of control over theirfinances, while just 26 percent ofboomers who are not saving share thissense of control over their finances.
As one boomer said in the focus groups,
both aspects of finances—earning and
managing money—are hard to control,
particularly as boomers start to think
about retirement.
To some extent you’re not in control
of your finances. If you’re close to
[retirement], and you’re not really
putting much into it, you’re largely at
the mercy of wherever your finances
are at the time you retired.
– 49-year-old white male, Charlotte
LEISURE ACTIVITIES
A closer examination of boomers’ lives
may help explain why fewer than half
(45%) feel they have a great deal of con-
trol over their leisure activities (see
Table 28). Boomers are being pulled in
many different directions with work,
raising children, and caring for aging
parents. With so many demands, many
boomers may be forced to put leisure
time on the back burner.
Many boomers are raising children.
Half of boomers (50%) report they have
at least one child under the age of 18 in
their household. Nearly all older
Americans (95%) have ended that
phase of their life and have no children
under 18 at home. Boomers are more
Boomers at Midlife: The AARP Life Stage Study - Volume I Full Report
52 Prepared for AARP by Princeton Survey Research Associates

Anticipated Problems/Barriers
53
Table 29: Life Status by Generation
Boomers18–37 38–56 57+
Have at least one child under 18 in household 56 50 4
Been married once 57 88 95Become a parent 56 83 90
N=781 N=2127 N=758
likely than the younger generation to
report that they have gotten married for
the first time (88% vs. 57% respectively)
or become a parent (83% vs. 56%). (See
Appendix C)
Boomers (80%) are also much more
likely than older adults (23%), and
somewhat more likely than younger
adults (74%), to be employed. It is not
clear whether boomers expect time
demands to lessen over the next five
years because they plan to retire, see
their children leave home, or simply
make leisure time a higher priority.
But it is clear that this is the area in
which boomers hope to make the
greatest strides, yet do not see it as
very likely in the near future.
For some of the women in the
focus groups, kids leaving home are
the key to having more leisure time
for themselves.
When I’m 57 all my kids will be out
of school. Then I’ll have what I call
my time. From a woman’s standpoint,
we have always been the nurturer,
the caregiver, taking care of the home,
making sure everybody else is happy,
and we have so little time to focus on
ourselves and our own needs. This
will be the time when we really can
[have “my time”] because everybody
else is out of the way.
– 54-year-old African American
female, Baltimore
WORK OR CAREER
Work is another area where fewer than
half of boomers (45%) say they have a
great deal of control. One in three
boomers says they have had the experi-
ence of losing a job (36%), and half
have made a major career change at
some point in their lives (51%).
However, these experiences do not
seem to have affected their sense of
control over their work. (See Appendix C)

Boomers at Midlife: The AARP Life Stage Study - Volume I Full Report
54 Prepared for AARP by Princeton Survey Research Associates
Table 30: Boomers’ Control Over Work or Career
All in all, how much control do you feel you have over your work or career—a great deal, a fair amount, not too much, or no control at all?
Which of the following changes have you experienced? Have you ever lost your job?Have you ever made a major career change?
A Great A Fair Not Too No ControlDeal Amount Much At All
Lost a job 45 42 10 3Have not lost a job 44 48 6 2Made a major career change 49 44 5 2Have never made a major 40 47 9 4
career change
N=1646 adults ages 38 to 56
• Losing a job could explain why someboomers do not feel they have agreat deal of control over their workor career, but this is not the case.Boomers who have lost a job are aslikely to say they have a great deal ofcontrol over their work or career(45%) as those who have not lost ajob (44%).
• And boomers who say they havemade a major career change aremore likely to say they have a greatdeal of control over their work orcareer than those who have not hadsuch a change (49% vs. 40%).
Neither job loss nor a major career
change explains why nearly half the
boomers say they have a great deal of
control over their work or career. Focus
group participants suggested two other
explanations. At a larger economic level,
a worsening of work life over the last
decade, with private sector and govern-
ment downsizing and reorganizing, may
contribute to a sense of lack of control.
There have been a lot of layoffs. For a
lot of people their work and career
have gone upside down. They thought
they would retire at a certain age,
and all of a sudden they just got a
bucket of water thrown in their face.
– 52-year-old white male, Charlotte
And at a personal level, some focus
group participants mentioned that
finding the right job is sometimes a
matter of luck and timing, factors often
out of their control.
There’s a lot of luck and timing in
where you end up or where you get
your first job, which starts you on a
career which you may love or not love.
– 56-year-old white male, Baltimore

55
PHYSICAL HEALTH
Only half the boomers say they
have a great deal of control over their
physical health. Like finances, a sense
of control over one’s health is related
to two interconnected factors: current
health status and boomers’ manage-
ment of their health.
Health status is clearly related to
one’s sense of control over physical
health. A full 49 percent of boomers
say they are in excellent or very good
health, and the other half report being
in good (32%), fair (14%), or poor (4%)
health. Boomers in excellent or very
good health (64%) are more likely to
say they have a great deal of control
over their health than boomers who
are in good, fair, or poor health (37%).
Many boomers report taking steps to
stay healthy. A majority of boomers
say they exercise to stay fit (66%), eat
a balanced diet (69%), get routine
health care (76%), and take vitamins
(59%). Of these health-boosting
activities, exercise is the only one
that is related to a greater sense of
control over one’s health. Slightly
more than half of the boomers who
say they exercise to stay fit (53%) feel
they have a great deal of control over
their health. Boomers who do not
exercise (45%) are less likely to
express that control.
As boomers in the focus groups told us:
I know I need to lose weight, quit
smoking, exercise, but I don’t do
those things because I guess I’m lazy.
… I’m not motivated.
– 52-year-old white male, Charlotte
Control Over Major Life Areas by Generation
Older Americans are more likely than
boomers to say they feel a great deal of
control over their leisure-time activities
(55% vs. 45% respectively), their
finances (47% vs. 41%), and their work
or career (56% vs. 45%). But older
Americans are less likely than boomers
to say they feel a great deal of control
over their physical (41% vs. 50%) or
mental health (55% vs. 64%). Of all the
life areas, physical health is the one
older adults are least likely to say they
have a great deal of control over.
In the focus groups, older Americans
expressed their concerns about losing
control over their health.
Everything else I have coped with in
my life. Physical condition is the one
thing I don’t have a whole lot of control
over. That’s why it bothers me. My
financial situation, if I had half of
what I do, I’d learn how to live with it.
I’ve made my peace with my friends
and with my God. The physical thing
I don’t know what to do with.
– 74-year-old white male, Baltimore
Anticipated Problems/Barriers

Boomers at Midlife: The AARP Life Stage Study - Volume I Full Report
56 Prepared for AARP by Princeton Survey Research Associates
Younger Americans and boomers
express similar degrees of control over
all seven life areas except one—physical
health. As age increases, feelings of
control over one’s physical health
decrease. Sixty-one percent of younger
adults feel they have a great deal of
control over their physical health, while
50 percent of boomers and 41 percent
of older adults feel the same way.
Major Barriers by Generation
Boomers look within themselves and at
their finances when looking for the
barriers that keep them from achieving
their goals. When asked to identify
what, if anything, is keeping them from
achieving what they really want out of
life, one in five boomers (17%) blame
themselves, and cite their own lack of
motivation, confidence and ambition.
In their own words in our telephone
survey, boomers tell us that they are
their own barrier to accomplishing
their goals:
“Lack of confidence.”
“Laziness, lack of imagination
and will.”
“Can’t blame it on anybody but
myself.”
“Just me. I'm in charge of my own
life. If you make your own decisions
you are the biggest obstacle. If the
world throws anything my way I
should be able to adjust to it.”
Boomers as often cite a variety of finan-
cial factors (16%) that keep them from
achieving their goals. Some of these are
Table 31: Control Over Major Life Areas by Generation
How much control do you feel you have over your ____—a great deal, a fair amount, not too much, or no control at all?
% who say ‘a great Boomersdeal of control’ over ... 18–37 38–56 57+
Personal finances 39 41 47Leisure activities 46 45 55Work or career* 48 45 56Physical health 61 50 41Relations with family and friends 62 62 61Mental health 63 64 55Religious or spiritual life 64 69 70
N=781 N=2127 N=758
* Asked only of those employed either full- or part-timeN=572 adults age 18–37N=1646 adults age 38–56N=202 adults age 57+

Table 32: Major Barriers by Generation
What, if anything, is keeping you from achieving what you really want out of life?
Boomers18–37 38–56 57+
Self/Unmotivated/Lazy 19 17 6Personal finances 14 16 10Health (physical or mental) 3 7 16Situations with family or friends 7 7 3Lack of time 6 4 2Education 4 2 1Work or career situation 3 2 1Age 1 1 7Nothing 34 35 49
N=781 N=2127 N=758
larger economic concerns and others
are personal financial habits:
“The way the economy is going.”
“Economic uncertainty in workplace
and instability of your employer.”
“Cost of living.”
“Credit cards.”
“Working my way out of debt.”
“Stock market.”
Younger people tend to mention the
same barriers, with themselves (19%)
and finances (14%) the two most
frequently mentioned. The older
generation most frequently talks about
mental and physical health concerns
(16%), followed by finances (10%),
aging (7%), and themselves (6%).
Over a third of boomers (35%) and
younger people (34%), and nearly half
of older people (49%), say “nothing”
stands in the way of achieving what
they really want out of life. In the case
of older people, many say they have
already achieved their goals.
Comments from focus group participants
suggest that when boomers say nothing
stands in their way, they may mean that
they are the only thing that prevents
them from achieving their goals.
Nothing… just me, myself, and I.
– 52-year-old white male, Charlotte
In some ways the [me] category is
the same as the nothing category,
because nothing’s gonna stop you
but you. You choose not to [do
something], so in a sense you’re
stopping yourself.
– 31-year-old white male, Charlotte
Anticipated Problems/Barriers
57
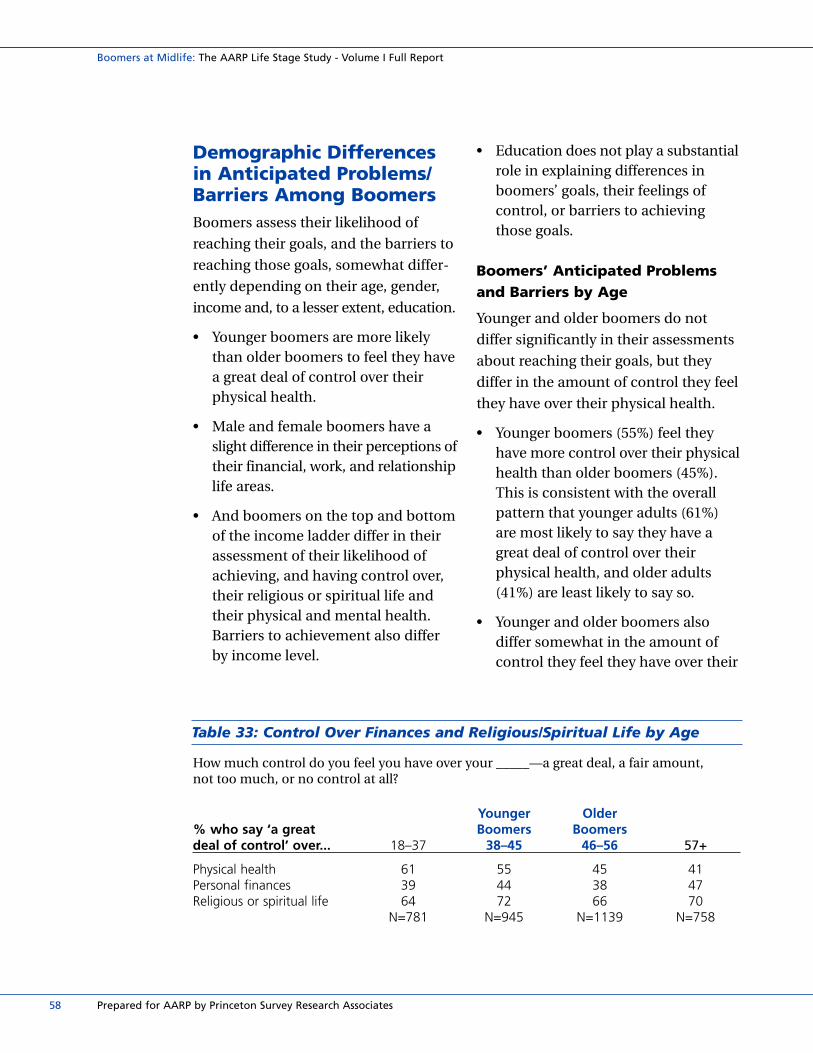
Table 33: Control Over Finances and Religious/Spiritual Life by Age
How much control do you feel you have over your _____—a great deal, a fair amount, not too much, or no control at all?
Younger Older% who say ‘a great Boomers Boomersdeal of control’ over... 18–37 38–45 46–56 57+
Physical health 61 55 45 41Personal finances 39 44 38 47Religious or spiritual life 64 72 66 70
N=781 N=945 N=1139 N=758
Demographic Differencesin Anticipated Problems/Barriers Among BoomersBoomers assess their likelihood of
reaching their goals, and the barriers to
reaching those goals, somewhat differ-
ently depending on their age, gender,
income and, to a lesser extent, education.
• Younger boomers are more likelythan older boomers to feel they havea great deal of control over theirphysical health.
• Male and female boomers have aslight difference in their perceptions oftheir financial, work, and relationshiplife areas.
• And boomers on the top and bottomof the income ladder differ in theirassessment of their likelihood ofachieving, and having control over,their religious or spiritual life andtheir physical and mental health.Barriers to achievement also differby income level.
• Education does not play a substantialrole in explaining differences inboomers’ goals, their feelings of control, or barriers to achievingthose goals.
Boomers’ Anticipated Problemsand Barriers by Age
Younger and older boomers do not
differ significantly in their assessments
about reaching their goals, but they
differ in the amount of control they feel
they have over their physical health.
• Younger boomers (55%) feel theyhave more control over their physicalhealth than older boomers (45%).This is consistent with the overallpattern that younger adults (61%)are most likely to say they have agreat deal of control over their physical health, and older adults(41%) are least likely to say so.
• Younger and older boomers also differ somewhat in the amount ofcontrol they feel they have over their
Boomers at Midlife: The AARP Life Stage Study - Volume I Full Report
58 Prepared for AARP by Princeton Survey Research Associates

59
finances and religious or spirituallife. In both cases, older boomersfeel they have less control in theseareas than younger boomers.
Younger and older boomers do not differ
in their assessments of the barriers that
keep them from reaching their goals.
Boomers’ Anticipated Problemsand Barriers by Gender
Female boomers are more confident
they will reach their target goal in their
personal relationships, while male
boomers are more likely to say they
have control in work and finances.
• Female boomers (73%) are morelikely than male boomers (65%) tobelieve that they will reach theirgoals in their relationships with family and friends.
• Male boomers are more likely thanfemale boomers to believe they havea great deal of control over theirfinances (45% vs. 38%) and work orcareer (48% vs. 41%).
• When it comes to barriers keepingboomers from achieving their goals,no significant gender differences exist.
Boomers’ Anticipated Problemsand Barriers by Income
Income is related to boomers’ attitudes
toward: their likelihood of achieving
their religious or spiritual life goals,
their sense of control over their religious
or spiritual life and their health, and
the barriers boomers cited to achieving
their life area goals. The way income
shapes these attitudes differs by
life area.
Demographic Differences in Anticipated Problems/Barriers among Boomers
Table 34: Boomers’ Likelihood of Reaching Relationship Goals andControl Over Finances and Work by Gender
How likely are you to achieve this goal (of better relationships with family and friends)—very likely, somewhat likely, not too likely, or not at all likely?
% who say very likely Males Females
Relations with family and friends 65 73
How much control do you feel you have over your _____—a great deal, a fair amount, not too much or no control at all?
% who say they have a great deal of control Males Females
Personal finances 45 38Work or career* 48 41N=2127 adults ages 38 to 56 N=856 N=1271
* Asked only of those employed either full- or part-timeN=709 males ages 38 to 56N=937 females ages 38 to 56

How much control do you feel you have over your _____—a great deal, a fair amount, not too much, or no control at all?
% who say ‘a greatdeal of control’ over... LT $30K $30–LT $50K $50–LT $75K $75K+
Religious or spiritual life 64 65 73 73Physical health 44 47 54 56Mental health 58 64 65 67N=1896 adults ages 38 to 56 N=552 N=515 N=354 N=475
Boomers at Midlife: The AARP Life Stage Study - Volume I Full Report
60 Prepared for AARP by Princeton Survey Research Associates
• Boomers with the lowest incomes(earning less than $30,000) are morelikely (71%) than those earning highincomes ($75,000 or more, 53%) to seethemselves as “very likely” to achievetheir religious or spiritual goals.
• However, it is boomers with thehighest incomes, $75,000 or more,who are most likely to report havinga great deal of control over their religious or spiritual life (73%), compared to 64 percent of thosewith the lowest incomes.
• Boomers in the two top incomegroups are also more likely to feel a great deal of control over theirphysical and mental health thanthose in the lowest-income group.
When looking at major barriers to
achievement of life goals:
• Boomers with the highest incomesare more likely than those with thelowest to claim “themselves” (19%vs. 13%) and lack of time (8% vs. 1%)as barriers to fulfilling their goals.
• Boomers with the lowest incomesare more likely than those with the
highest incomes to say finances(24% vs. 13%) and health (15% vs. 2%)are barriers to fulfilling their goals.
Boomers’ Anticipated Problemsand Barriers by Education
Education plays a limited role in
explaining differences in boomers’
likelihood of achieving their goals, their
feelings of control, and their perceived
barriers, however:
• Boomers who have completed a college degree are more likely tobelieve they will reach their financialgoal (58%) than those who have notcompleted college (50%).
• Boomers with more education aremore likely to claim lack of time (3% no college degree vs. 8% collegedegree) and family or friends as barriers (6% no college degree vs. 10%college degree), while boomers withthe least education are more likely to feel restricted by their finances(17% no college degree vs. 13% collegedegree) or their health (9% no collegedegree vs. 4% college degree).
Table 35: Boomers’ Control Over Religious/Spiritual Life and Health by Income

61
Table 36: Thinking About the General Future by Generation
How often do you think about your future? Do you think about your future often, sometimes, rarely, or never?
Boomers18–37 38–56 57+
Often 78 64 41Sometimes 18 26 25Rarely/Never 4 9 32
N=781 N=2127 N=758
D. Planning the FutureBoomers expect their lives to be better
in the next five years. How much
thought do they give to the future? And
does the future look bright? In general,
boomers think a fair amount about
the future, and they are looking to
the future with a strong feeling of
self-reliance and cautious optimism.
Thinking About the GeneralFuture by Generation
Virtually all boomers think about their
future often (64%) or at least sometimes
(26%), with few saying they rarely or
never (9%) think about it.
Boomers are much more likely to think
about the future than older people (41%),
and less likely than younger people
(78%). Consistent with this finding,
boomers (83%) are more likely to agree
with the statement “I plan a lot for my
future,” than older adults (67%),
but less than younger adults (90%).
In the focus groups, boomers gave
numerous reasons for their focus on
the future—kids, work, finances and
health concerns.
Not many men in my family make it
past the age of 60. When I look at my
life I think it’s two-thirds over. I find
myself often looking to the future to
make sure I’m progressing with the
plans that I have.
– 40-year-old African American
male, Baltimore
And for some boomers, focusing on the
future means coming up with strategies
to fight the downside of old age, which
includes seeing the positive side of getting
older and ignoring “societal myths.”
I want to be an 80-year-old fox. I
don’t want to be on a cane or walker.
If I go and sit down in the rocker and
let life pass me by, that’s just what’s
going to happen. But if I go for life,
then I think I’ll have a great ending.
– 53-year-old African American
female, Baltimore
Planning the Future

At the gym where I work out, I’ve seen
guys in their 70s and 80s working out
hard. People are realizing that this age
thing is a myth. One day at work a
lady turned 50, and they were telling
her that she was over the hill, and to
me that is a societal myth. Society puts
this thought into people ‘you get to 50
and you’re done.’ But I don’t believe
that. I believe in myself and what I
can do myself. So I see those guys at
the gym in their 60s and 70s, working
out and lifting weights, and I admire
them. I hope they keep doing that.
– Boomer Hispanic male, Kansas City
[In describing the kind of older per-
son she wants to be] I’d live in a big
house with my kids and their fami-
lies and my grandkids and great
grandkids. And I want to tell them
stories about what it was like. And I’ll
be the sage old matriarch and every-
one defers to me. That’s what I want
and everybody’s happy.
– 44-year-old white female, Kansas City
And other focus group participants
think the future will be different for
boomers, just as their younger years
were different.
Just by sheer numbers you see the
impact [of boomers] from Woodstock
to the AARP. I think from the sheer
numbers, this group is having a big
impact as we age.
– 54-year-old white female, Kansas City
Perhaps one reason that older people
are less likely than younger people to
think about the future is that some older
Americans see the future as now. Their
planning was nearly complete and now
they are taking one day at a time and
enjoying themselves.
The future is now. I say my future
is now.
– 74-year-old white male, Baltimore
I think one day at a time.
– 69-year-old white female, Baltimore
Other older focus group participants
said thinking about the future was
important to keep older people active.
Planning for the future is healthy
because when you stop planning for
the future and what you’re going to
do next, you vegetate.
– 69-year-old white male, Baltimore
Thinking About Life Areas byGeneration
What people think about when consid-
ering the future varies by generation.
Across the seven major life areas,
boomers are most likely to think a
great deal about their relationships
with family and friends (58%), and are
least likely to think a great deal about
their mental health (23%) or their leisure
activities (26%). Similar responses were
given by younger adults (relationships
57%, mental health 21%, leisure
activities 30%) and older adults
Boomers at Midlife: The AARP Life Stage Study - Volume I Full Report
62 Prepared for AARP by Princeton Survey Research Associates

Planning the Future
63
Table 37: Thinking About Life Areas by Generation
In the past month, how much have you thought about ___? Have you thought about it agreat deal, a fair amount, not too much, or not at all?
% who say they have thought‘a great deal’ about a life area Boomersin last month 18–37 38–56 57+
Relations with family and friends 57 58 55Personal finances 62 47 25Work or career* 57 46 29Religious or spiritual life 36 45 56Physical health 41 41 40Leisure activities 30 26 29Mental health 21 23 22
N=781 N=2127 N=758
* Asked only of those employed either full- or part-timeN=572 adults age 18–37N=1646 adults age 38–56N=202 adults age 57+
(relationships 55%, mental health 22%,
leisure activities 29%).
While the generations are like-minded
in these areas, finances and work occupy
the thoughts of the two younger gener-
ations more so than the older generation.
Conversely, with age comes more
thought about religion and spiritual life.
Six in 10 younger adults say they think
about their personal financial situation
(62%) or their work or career (57%) a
great deal. Boomers are less likely to
report thinking about their finances
(47%) or their work or career (46%).
Older Americans are the least likely of
the three groups to say they think a
great deal about finances (25%) or their
work or career (29%). Instead, they are
more likely than boomers (56% vs.
45%) to think about their religious or
spiritual life, and both groups are more
likely to think about this than younger
Americans (36%).
Planning for the Future byGeneration
In general, thinking about the future
declines with age. Why? Apparently
many older people think they have
done all the planning they need to do.
A majority of Americans 57 and older
(61%) say this. Boomers (30%) and
younger people (29%) are notably less
likely to share this view.
This sentiment dovetails with the desire
to be spontaneous rather than plan for
the future in detail. Slightly less than
half of boomers (45%) and younger
adults (46%) say they would rather be
spontaneous than plan for their future,

Boomers at Midlife: The AARP Life Stage Study - Volume I Full Report
64 Prepared for AARP by Princeton Survey Research Associates
Table 38: Planning for the Future by Generation
Please tell me if you strongly agree, somewhat agree, somewhat disagree, or strongly disagree with each statement.
Boomers% who say strongly/somewhat agree 18–37 38–56 57+
At this point in my life, I’ve done allthe planning I need to do 29 30 61
I would rather be spontaneous than plan my future in detail 46 45 59
N=781 N=2127 N=758
Table 39: Attitudes About the Future and Control Over the Future by Generation
Please tell me if you strongly agree, somewhat agree, somewhat disagree, or strongly disagree with each statement.
Boomers18–37 38–56 57+
What happens to me in the future mostly depends on meStrongly agree 76 68 53Somewhat agree 17 20 31Somewhat/Strongly disagree 7 11 12
When I really want to do something, I usually find a way to succeed at itStrongly agree 69 65 61Somewhat agree 28 30 32Somewhat/Strongly disagree 3 4 4
N=781 N=2127 N=758
but a majority of older adults (59%)
say spontaneity, rather than planning,
characterizes their attitude toward
the future.
Attitudes About the Future and Control Over the Future by Generation
A majority of adults of all ages solidly
feel in control of their own future.
However, with age comes a growing
sense that sometimes circumstances
beyond one’s control determine the
course of events. Boomers are somewhat
less likely than younger adults, but more
likely than older adults, to strongly
agree that what happens to them in the
future mostly depends on what they do.
Only about half (53%) of Americans 57
and older agree with this statement.
More boomers (68%) share this sense
of self-empowerment, and an even
greater number of young people (76%)
feel they are in charge of their future.

65
This does not mean that large minorities
of boomers and older people feel
powerless to direct the future. On the
contrary, these people are more circum-
spect in their assessment of how much
control they have, and say that what
happens in the future “somewhat”
depends on what they do.
The tenacity of Americans of all ages
comes through when we asked people
to agree or disagree with the statement,
“When I really want to do something,
I usually find a way to succeed at it.”
Boomers (65%) share with younger
Americans (69%) a strong sense that
when they really want to do something,
they usually find a way to succeed at it.
Older adults (61%) share this belief only
slightly less than younger adults.
As a boomer told us in the focus groups:
If I really want to do something, I’m
going to find a way. There is a way.
– 45-year-old African American
female, Baltimore
But some boomers acknowledged
that sometimes there are things that
cannot be changed, or that the desire
to change things may subside with age.
When you’re younger you’ve got this
cat by the tail. It’s very competitive.
And when you get older that drive
that pushes you to keep you thinking
you can change everything subsides
and mellows you out.
– 40-year-old African American
male, Baltimore
Describing the Next Five Years: Boomers
Overall boomers are optimistic about
the near future, however, it is not
without worry. This becomes clear
when we see how boomers describe
the next five years. The list is topped
with “hopeful” (64%), “confident” (55%),
“fulfilling” (49%), and “exciting” (46%).
Few boomers say that “uncertain”
(12%) or “boring” (9%) are optimal
words to describe their feelings. While
it seems that boomers tend to see the
next five years in a positive light, one
in five worry about it, saying that
“anxious” (22%) or “stressful” (21%)
describes the future very well.
Describing the Next Five Years by Generation
Older adults more than anything else are
optimistic about the next five years. About
half or more of older adults say that
“hopeful” (57%), “confident” (57%), or
“fulfilling” (49%) describe the near future
very well, and one-third think “exciting”
(36%) says it all. As it is for boomers,
these are much larger than the percent
who say “anxious” (18%), “stressful”
(16%), “uncertain” (14%), or “boring”
(17%) describe the future very well.
Still, when comparing these percents
to boomers, older adults are somewhat
less likely than boomers to be “hopeful”
(57% vs. 64%), “excited” (36% vs. 46%),
or “stressed” (16% vs. 21%) about the
future, and more likely to see it as
“boring” (17% vs. 9%).
Planning the Future

Like the other two generations, younger
adults think more positively than not
about the future. However, younger
adults are even more likely than
boomers to think positively, with
solid majorities saying that “hopeful”
(72% vs. 64%), “confident” (61% vs. 55%),
“fulfilling” (55% vs. 49%), and “exciting”
(57% vs. 46%) describe the future very
well. In addition, the younger generation
is somewhat more likely than boomers
to be nervous about the future, with a
quarter saying that “anxious” (28% vs.
22%) describes it very well. Both groups
are equally likely to say that “stressful”
(25% vs. 21%), “boring” (7% vs. 9%), or
“uncertain” (11% vs. 12%) describe the
future very well.
Boomers at Midlife: The AARP Life Stage Study - Volume I Full Report
66 Prepared for AARP by Princeton Survey Research Associates
Table 40: Describing the Next Five Years by Generation
When you think about the next five years how well does ______ describe your feelings—very well, somewhat well, not too well, or not at all well?
Boomers% who say it describes it ‘very well’ 18–37 38–56 57+
Hopeful 72 64 57Confident 61 55 57Fulfilling 55 49 49Exciting 57 46 36Anxious 28 22 18Stressful 25 21 16Uncertain 11 12 14Boring 7 9 17
N=781 N=2127 N=758

67
Table 41: Thinking About the General Future by Age
How often do you think about your future? Do you think about your future often, sometimes,rarely, or never?
Younger OlderBoomers Boomers
18–37 38–45 46–56 57+
Often 78 70 59 41Sometimes 18 22 30 25Rarely/Never 4 8 10 32
N=781 N=945 N=1139 N=758
Demographic Differences inPlanning the FutureAmong BoomersBoomers think about, plan for, and
assess their future somewhat differently
depending on their age, income,
education, and, to a much lesser
extent, their gender.
• Younger boomers spend more timethinking about their future thanolder boomers, a pattern that mirrors the overall population.
• Income makes a big difference inhow boomers think about the future.Lower-income boomers are muchmore likely than those with higherincomes to think a great deal abouteach life area, and, at the same time,would prefer to be spontaneousrather than plan for the future.
• Following in a similar pattern, less-well-educated boomers think moreabout the specific life areas than better-educated boomers.
• Few gender differences exist amongboomers, and those that do reflect
different levels of attention to somelife areas, and a slightly differentoutlook for the future.
Planning the Future by Age
As boomers age, they spend less time
thinking about the future overall.
• Younger boomers (70%), ages 38 to45, more than older boomers (59%),ages 46 to 56, say they think aboutthe future often. This fits with thegeneral pattern of people thinkingabout the future less as they age.
This general pattern of thinking about
the future less with age prevails in two
life areas—finance and work or career.
• As shown in Table 41, six in 10younger adults (62%) say they thinkabout their personal financial situation often, followed by youngerboomers (53%), older boomers(42%), and older adults (25%).
• Nearly six in 10 younger adults (57%)who are working say they thinkabout their work or career a greatdeal. Even fewer younger boomers
Demographic Differences in Planning the Future among Boomers

Boomers at Midlife: The AARP Life Stage Study - Volume I Full Report
68 Prepared for AARP by Princeton Survey Research Associates
Table 42: Thinking About Life Areas by Age
In the last month, how much have you thought about ___? Have you thought about it agreat deal, a fair amount, not too much, or not at all?
% who think Younger Olderabout each aspect Boomers Boomersof life ‘a great deal’ 18–37 38–45 46–56 57+
Relations with family and friends 57 62 55 55Personal finances 62 53 42 25Mental health 21 26 20 22Work or career* 57 50 44 29Religious or spiritual life 36 48 43 56Physical health 41 44 39 40Leisure activities 30 28 24 29
N=781 N=945 N=1139 N=758
* Asked only of those employed either full- or part-timeN=572 adults age 18–37N=762 adults age 38–45N=851 adults age 46–56N=202 adults age 57+
(50%), older boomers (44%) andolder adults (29%) who are workingsay they think about their work orcareer a great deal.
While many older adults feel that they
had already done their planning and
they can now be more spontaneous,
there is no indication that this seed
of spontaneity is planted in older
boomers.
• Younger (29%) and older boomers(30%) are equally likely to think theyhave done all the planning theyneed to do, and both younger (46%)and older boomers (45%) say theywould rather be spontaneous thanplan for their future in detail.
Where we see change based on age is in
the amount of control people feel they
have over their own future.
• Older boomers (64%) are somewhatless likely than younger boomers(73%) to strongly believe that whathappens to them in the future mostlydepends on what they do. And olderboomers (62%) are somewhat lesslikely than younger boomers (68%)to say that when they really want todo something, they usually find away to succeed at it.
Finally, younger boomers are more
likely to be both “excited” (51%) and
“anxious” (25%) about the near-term
future than older boomers (excited 40%,
anxious 18%).

69
Table 43: Attitudes About the Future and Control Over the Future by Generation
Please tell me if you strongly agree, somewhat agree, somewhat disagree, or strongly disagreewith each statement.
Younger OlderBoomers Boomers
% who say strongly agree 38–45 46–56
What happens to me in the future mostly depends on me 73 64
When I really want to do something, I usually find a way to succeed at it 68 62
N=945 N=1139
Planning the Future by Gender
Male and female boomers tend to
dedicate similar amounts of time to
thinking about the future in general,
but gender differences emerge when
considering the specific life areas.
When it comes to how much control
male and female boomers have over
their future, both feel the same. In
addition, male and female boomers
tend to agree on the adjectives they
would use to describe their feelings
about the next five years with two
exceptions—“anxious” and “hopeful.”
• Females are more likely than malesto put a great deal of thought intotheir mental health (females 25%,males 20%), personal relationships(females 61%, males 55%), and reli-gion and spiritual life (females 50%,males 40%).
• Males (25%) are somewhat morelikely than females (19%) to say that
“anxious” describes their feelings verywell about the next five years, andfemales (68%) are more likely thanmales (59%) to say that “hopeful”describes the next five years very well.
Planning the Future by Income
Low-income boomers are more likely
than high-income boomers to think a
great deal about nearly every life area,
to prefer to be spontaneous rather than
plan for the future, and to be more
concerned about the future.
• Boomers earning the lowest incomesare more likely than boomers earn-ing the highest incomes to give agreat deal of thought to every lifearea but leisure activities.
• Lower-income boomers (28% lessthan $30,000) are also more likelythan higher-income boomers (20%$30,000 to less than $50,000, 13%$50,000 to less than $75,000, 11%$75,000 or more) to say they would
Demographic Differences in Planning the Future among Boomers

Boomers at Midlife: The AARP Life Stage Study - Volume I Full Report
70 Prepared for AARP by Princeton Survey Research Associates
Table 44: Boomers’ Thinking About Life Areas by Income
In the last month, how much have you thought about ___? Have you thought about it agreat deal, a fair amount, not too much, or not at all?
% who think about eachaspect of life ‘a great deal’ LT $30K $30–LT $50K $50–LT $75K $75K+
Relations with family or friends 66 61 56 52Finances 66 49 41 38Work or career* 52 49 43 41Religious or spiritual life 60 43 44 36Physical health 53 49 35 27Leisure activities 25 30 23 24Mental health 34 26 19 14N=1896 adults ages 38 to 56 N=552 N=515 N=354 N=475
* Asked only of those employed either full- or part-timeN=341 adults ages 38 to 56 earning less than $30KN=426 adults ages 38 to 56 earning $30K to less than $50KN=305 adults ages 38 to 56 earning $50K to less than $75KN=411 adults ages 38 to 56 earning $75K or more
rather be spontaneous than plan indetail for their future.
• The outlook on the future is moredowncast for lower- than higher-income earners. Boomers with thelowest incomes are more likely thanhigh-income earners to feel that thenext five years will be “uncertain”(21% vs. 8%), “boring” (18% vs. 2%),“anxious” (29% vs. 14%), or “stressful”(31% vs. 16%).
Planning the Future by Education
Less-well-educated boomers think
more about the life areas, are less likely
to feel empowered, and have a less-
positive outlook for the near-term
future than boomers who have
graduated from college.
• Boomers without a college degreeare more likely than boomers with a college degree to put a great dealof thought into their finances (51% vs. 38%), religious or spirituallife (48% vs. 39%), physical health(44% vs. 33%), and mental health(26% vs. 16%).
• Boomers without a college degree(27%) are more likely to feel there islittle they can do to change importantthings in their lives than boomerswith a college degree (10%).
• More boomers without a collegedegree (49%) than those with a college degree (35%) say they wouldrather be spontaneous than plantheir future in detail.

71
Table 45: Boomers’ Thinking About Life Areas by Education
In the last month, how much have you thought about ___? Have you thought about it agreat deal, a fair amount, not too much, or not at all?
% who think about each aspect Less Than Collegeof life ‘a great deal’ College Degree Grad+
Relations with family and friends 60 54Personal finances 51 38Work or career* 46 46Religious or spiritual life 48 39Physical health 44 33Leisure activities 27 22Mental health 26 16N=2120 adults ages 38 to 56 N=1504 N=616
* Asked only of those employed either full- or part-timeN=1123 adults with less than a college degree ages 38 to 56N=518 adults with a college degree or more ages 38 to 56
• More boomers without a collegedegree say words like “boring”(11% vs. 2%), “anxious” (26% vs.11%), “uncertain” (13% vs. 9%), and“stressful” (23% vs. 17%) describetheir feelings about the next fiveyears very well than boomers with a college degree. Boomers with acollege degree are more likely thanless educated boomers to say that“fulfilling” (57% vs. 45%) describestheir feelings very well.
Demographic Differences in Planning the Future among Boomers

Boomers at Midlife: The AARP Life Stage Study - Volume I Full Report
72 Prepared for AARP by Princeton Survey Research Associates

73
Table 46: Boomers’ Overall Life Satisfaction by Race/Ethnicity
Are you satisfied or dissatisfied with the way things are going in your own life today?
White African American Hispanic
Satisfied 86 75 77Dissatisfied 12 22 19N=2083 adults ages 38 to 56 N=738 N=702 N=643
E. Ethnic and RacialComparisons AmongBoomersTo achieve a complete picture of
boomers at midlife, oversamples of
African American and Hispanic
boomers were collected. Compared
to the other demographic variables
already discussed, race and ethnicity
plays a larger role in shaping attitudes
and expectations of boomers.
Overall, African American boomers
have a somewhat different view of their
lives and their future than white or
Hispanic boomers. In some critical
areas—finance and work—African
American boomers are more dissatis-
fied than their peers, and say they
are doing worse than expected. But
African American boomers plan to
change this. They are more likely than
white or Hispanic boomers to aim for
larger gains in many areas, and to be
more confident they will meet those
goals. One possible reason for this
greater determination and confidence
is that they generally report planning
for their future more than white or
Hispanic boomers.
Assessment of Life StatusAmong White, AfricanAmerican and HispanicBoomers
Boomer Overall Life Satisfaction by Race/Ethnicity
Solid majorities of African American,
Hispanic, and white boomers say they
are satisfied with their lives, but white
boomers are more satisfied than the
other two groups. Of white boomers, 86
percent say they are satisfied with the way
things are going in their lives, compared
to 75 percent of African American and
77 percent of Hispanic boomers.
Ethnic and Racial Comparisons Among Boomers

Boomers at Midlife: The AARP Life Stage Study - Volume I Full Report
74 Prepared for AARP by Princeton Survey Research Associates
Table 47: Boomers’ Satisfaction with Major Life Areas by Race/Ethnicity
Overall, how satisfied are you with your ___? Are you very satisfied, somewhat satisfied, nottoo satisfied, or not at all satisfied?
% very satisfied in each life area White African American Hispanic
Relations with family and friends 63 57 65Mental health 61 61 63Religious or spiritual life 46 53 54Work or career* 40 27 49Physical health 30 30 39Leisure activities 29 25 34Personal finances 21 10 25N=2083 adults ages 38 to 56 N=738 N=702 N=643
* Asked only of those employed either full- or part-timeN=610 white adults ages 38 to 56N=521 African American adults ages 38 to 56N=484 Hispanic adults ages 38 to 56
Boomer Satisfaction with MajorLife Areas by Race/Ethnicity
With two exceptions, African Americans
boomers are less likely to say they are
very satisfied than either white or
Hispanic boomers in specific life areas.
African American boomers (61%) are
as likely as white (61%) or Hispanic
(63%) boomers to be satisfied with
their mental health.
The second and more notable exception
is religious or spiritual life. In this area
it is white boomers who fall behind
both African American and Hispanic
boomers. More than half of African
American (53%) and Hispanic (54%)
boomers are very satisfied with their
religious or spiritual lives, but fewer white
boomers (46%) share this assessment.
African American boomers are less
satisfied than white or Hispanic
boomers in five of the seven life areas:
finances, leisure activities, physical health,
work or career, and relationships with
family and friends. And of the five areas,
African American satisfaction levels fall
dramatically behind those of their peers
in personal finance and work or career.
• Only one in 10 African Americanssays they are very satisfied with theirfinancial situation. Although smallpercentages of white (21%) andHispanic (25%) boomers are verysatisfied with their personal finances,these two groups are twice as likelyas African Americans to say they arevery satisfied. Conversely, AfricanAmericans (19%) are twice as likelyas whites (8%) or Hispanics (9%) tosay they are not at all satisfied withtheir financial situation.
• Work or career follows a similar, but less stark, pattern. Roughly three
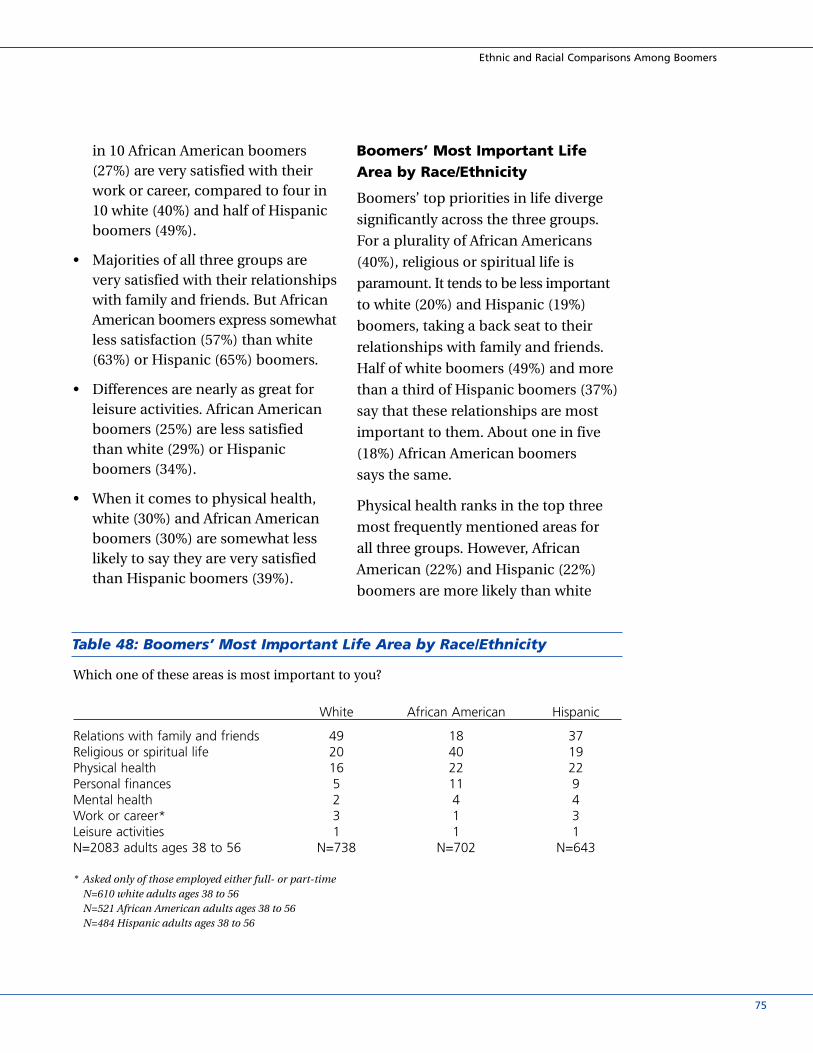
75
in 10 African American boomers(27%) are very satisfied with theirwork or career, compared to four in10 white (40%) and half of Hispanicboomers (49%).
• Majorities of all three groups arevery satisfied with their relationshipswith family and friends. But AfricanAmerican boomers express somewhatless satisfaction (57%) than white(63%) or Hispanic (65%) boomers.
• Differences are nearly as great forleisure activities. African Americanboomers (25%) are less satisfied than white (29%) or Hispanicboomers (34%).
• When it comes to physical health,white (30%) and African Americanboomers (30%) are somewhat lesslikely to say they are very satisfiedthan Hispanic boomers (39%).
Boomers’ Most Important LifeArea by Race/Ethnicity
Boomers’ top priorities in life diverge
significantly across the three groups.
For a plurality of African Americans
(40%), religious or spiritual life is
paramount. It tends to be less important
to white (20%) and Hispanic (19%)
boomers, taking a back seat to their
relationships with family and friends.
Half of white boomers (49%) and more
than a third of Hispanic boomers (37%)
say that these relationships are most
important to them. About one in five
(18%) African American boomers
says the same.
Physical health ranks in the top three
most frequently mentioned areas for
all three groups. However, African
American (22%) and Hispanic (22%)
boomers are more likely than white
Ethnic and Racial Comparisons Among Boomers
Table 48: Boomers’ Most Important Life Area by Race/Ethnicity
Which one of these areas is most important to you?
White African American Hispanic
Relations with family and friends 49 18 37Religious or spiritual life 20 40 19Physical health 16 22 22Personal finances 5 11 9Mental health 2 4 4Work or career* 3 1 3Leisure activities 1 1 1N=2083 adults ages 38 to 56 N=738 N=702 N=643
* Asked only of those employed either full- or part-timeN=610 white adults ages 38 to 56N=521 African American adults ages 38 to 56N=484 Hispanic adults ages 38 to 56
Boomers at Midlife: The AARP Life Stage Study - Volume I Full Report
76 Prepared for AARP by Princeton Survey Research Associates
(16%) boomers to say it is most
important. Similarly, African American
(11%) and Hispanic (9%) boomers are
somewhat more likely than white (5%)
boomers to say that their personal
financial situation is most important.
Still, it is considered most important
by only about one in 10 or fewer in
any group.
Near-Term Life Goals forWhite, African Americanand Hispanic Boomers When we asked if boomers were where
they expected to be at this point in
their lives, sizable majorities of each
group said they are, or are doing better
than they expected. But these assess-
ments vary in important ways among
the three groups.
Boomers’ Expectations of MajorLife Areas by Race/Ethnicity
In the areas of religious or spiritual life,
relationships with family and friends,
mental health and physical health,
African American and Hispanic
boomers are more likely than white
boomers to say they are better off than
they expected to be at this point in
their lives.
• Close to four in 10 African American(39%) and Hispanic (36%) boomerssay their religious or spiritual life isbetter than they expected, comparedto just two in 10 whites (23%).
• In the area of mental health, three in10 African American (29%) andHispanic (31%) boomers are doingbetter than expected, compared totwo in 10 white boomers (21%).
• In the area of physical health,African American (26%) and Hispanicboomers (24%) report exceedingtheir expectations slightly more thanwhite boomers (20%). But in the caseof all three groups, sizable minoritiessay their physical health is worsethan they expected it to be.
• More African American (30%) andHispanic (32%) than white (24%)boomers say relationships with family and friends are better thanthey had expected.
African American boomers are generally
disappointed with their work or career
situation, leisure activities, and finances.
By and large, experiences of white and
Hispanic boomers are more positive than
those of African American boomers.
• In work, African American boomers(31%) are more likely than white(26%) and Hispanic boomers (18%)to say their career is worse thanexpected at this point.
• In play, African American (34%) andwhite (36%) boomers are more likelythan Hispanic boomers (25%) to saythat their leisure activities are worsethan expected.

Table 49: Boomers’ Expectations of Major Life Areas by Race/Ethnicity
Would you say that your ___ is better than you expected to be at this point in your life,worse than you expected, or about where you expected to be at this point in your life?
Yes—Where Better Off Worse Off Expected
Mental health White 21 13 64African American 29 10 58Hispanic 31 11 55
Relations with White 24 12 62family and friends African American 30 10 58
Hispanic 32 13 55
Religious or White 23 17 57spiritual life African American 39 20 39
Hispanic 36 17 44
Work or career* White 33 26 39African American 28 31 39Hispanic 40 18 39
Physical health White 20 34 45African American 26 29 42Hispanic 24 29 43
Leisure activities White 18 36 44African American 21 34 43Hispanic 28 25 45
Personal finances White 29 30 40African American 21 44 34Hispanic 34 26 37
N=2083 adults ages 38 to 56 * Asked only of those employed either full- or part-timeN=738 white adults ages 38 to 56 N=610 white adults ages 38 to 56N=702 African American adults ages 38 to 56 N=521 African American adults ages 38 to 56N=643 Hispanic adults ages 38 to 56 N=484 Hispanic adults ages 38 to 56
• In personal finances, AfricanAmerican boomers have enduredmore unmet expectations than whiteand Hispanic boomers. More thanfour in 10 African American boomers(44%) say they are worse off financiallythan they expected, compared to
three in 10 white boomers (30%) andone in four Hispanic boomers (26%).Roughly three in 10 white (29%) andeven more Hispanic (34%) boomerssay they are better off than expected,compared to two in 10 AfricanAmerican boomers (21%).
Ethnic and Racial Comparisons Among Boomers
77

Boomers at Midlife: The AARP Life Stage Study - Volume I Full Report
78 Prepared for AARP by Princeton Survey Research Associates
Boomers’ Current Status andHopes for Future by Race/Ethnicity
African American boomers hope for
larger gains in most areas than white or
Hispanic boomers, especially in their
finances, religious life, work or career,
and physical health. If all three groups
achieve their goals, five years from now
each life area would be rated higher by
African Americans than it would for
either white or Hispanic boomers.
Personal Finances
For African American boomers, finances
tops the list of areas in which they hope
to make the biggest gains. For white
and Hispanic boomers, personal
finances is in second place behind
leisure activities for the greatest gains.
• On average, African Americanboomers hope for a 2.8-pointincrease in their financial situationin the next five years. This is sub-stantially more of a gain than eitherwhite (1.6 points) or Hispanic (1.6points) boomers hope for.
• African American boomers see theirfinances in a worse light than otherboomers and aspire to a higherfinancial level. When considering the state of their finances, AfricanAmericans (5.5) rate it lower thanwhites (6.3) and Hispanics (6.3). And when they rate what they realistically hope it will be in fiveyears, African Americans (8.3) set the bar higher than whites (7.9) orHispanics (7.9).
Work or Career
In their work or careers too, African
Americans hope for larger gains in the
next five years (1.4 points) than whites
(1.1 points) or Hispanics (0.7 points).
Work or career is another area in which
more African American than white or
Hispanic boomers report doing worse
than expected (see Table 48).
Leisure Activities
Leisure activities top the list of areas
with the biggest hoped-for gains for
white and Hispanic boomers.
• On a 0 to 10 scale, white and AfricanAmerican boomers realistically hopeto achieve an increase of 2.0 pointsin leisure activities over the next fiveyears. And Hispanic boomers hopefor a 1.8-point increase.
• Of the seven areas, white andHispanic boomers hope for morechange in this area than any of theothers.
Religious or Spiritual Life
Religious or spiritual life ranks third for
all three groups in hoped-for change
over the next five years.
• African American boomers’ rating(7.4) for their current situation ishigher than either whites (6.7) orHispanics (7.0). But still they want to see more growth over the next five years (1.6 points) than white or Hispanic boomers (1.3 points for both).
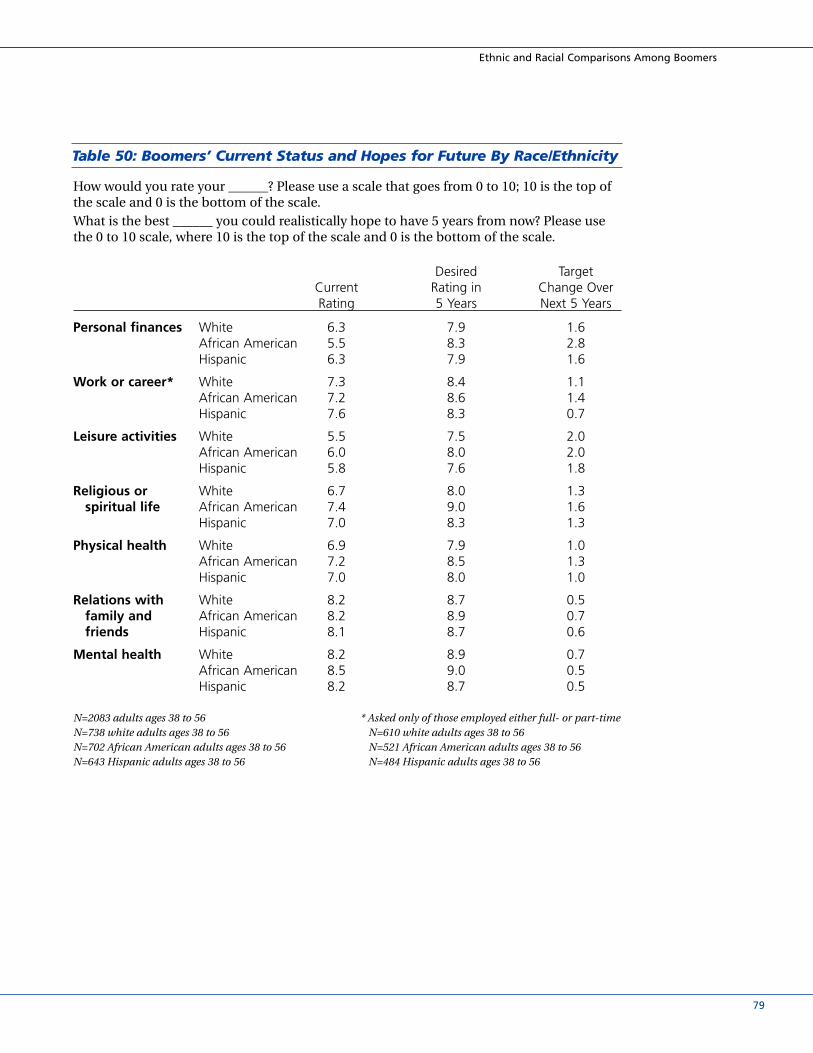
79
Table 50: Boomers’ Current Status and Hopes for Future By Race/Ethnicity
How would you rate your ______? Please use a scale that goes from 0 to 10; 10 is the top ofthe scale and 0 is the bottom of the scale.What is the best ______ you could realistically hope to have 5 years from now? Please usethe 0 to 10 scale, where 10 is the top of the scale and 0 is the bottom of the scale.
Desired TargetCurrent Rating in Change OverRating 5 Years Next 5 Years
Personal finances White 6.3 7.9 1.6African American 5.5 8.3 2.8Hispanic 6.3 7.9 1.6
Work or career* White 7.3 8.4 1.1African American 7.2 8.6 1.4Hispanic 7.6 8.3 0.7
Leisure activities White 5.5 7.5 2.0African American 6.0 8.0 2.0Hispanic 5.8 7.6 1.8
Religious or White 6.7 8.0 1.3spiritual life African American 7.4 9.0 1.6
Hispanic 7.0 8.3 1.3
Physical health White 6.9 7.9 1.0African American 7.2 8.5 1.3Hispanic 7.0 8.0 1.0
Relations with White 8.2 8.7 0.5family and African American 8.2 8.9 0.7friends Hispanic 8.1 8.7 0.6
Mental health White 8.2 8.9 0.7African American 8.5 9.0 0.5Hispanic 8.2 8.7 0.5
N=2083 adults ages 38 to 56 * Asked only of those employed either full- or part-timeN=738 white adults ages 38 to 56 N=610 white adults ages 38 to 56N=702 African American adults ages 38 to 56 N=521 African American adults ages 38 to 56N=643 Hispanic adults ages 38 to 56 N=484 Hispanic adults ages 38 to 56
Ethnic and Racial Comparisons Among Boomers

Boomers at Midlife: The AARP Life Stage Study - Volume I Full Report
80 Prepared for AARP by Princeton Survey Research Associates
Table 51: Boomers’ Likelihood of Reaching Goals by Race/Ethnicity
How likely are you to achieve this goal—very likely, somewhat likely, not too likely, or not at all likely?*
% who say they are very Africanlikely to achieve their goal White N American N Hispanic N
Mental health 67 731 77 689 71 627Relations with family and friends 68 721 76 692 70 629Religious or spiritual life 56 709 77 678 64 617Work or career** 57 594 66 507 65 462Personal finances 50 722 61 685 62 631Physical health 51 728 63 686 59 621Leisure activities 46 719 58 672 53 623
* Asked only of those who gave a desired rating of 1 to 10 for the corresponding life area** Asked only of those employed either full- or part-time
Physical Health
African Americans (1.3 points) are
looking forward to somewhat larger
gains in their physical health than
either whites (1.0 points) or Hispanics
(1.0 points).
• Nearly one in three of all boomerssay they are doing worse in theirphysical health than expected (see Table 4).
• This is the case even though AfricanAmerican (7.2) boomers currentlyrate their physical health slightlyhigher than white (6.9) or Hispanic(7.0) boomers.
Mental Health and Relations with Family and Friends
All three groups rate their mental
health and relationships with
family and friends relatively high
and anticipate smaller changes in
these areas.
Anticipated Problems/Barriers for White, AfricanAmerican and HispanicBoomers
Boomers Likelihood of Reaching Goals by Race/Ethnicity
African American boomers not only
hope to make greater strides forward
in many major life areas, but they are
more confident than whites or Hispanics
that these gains will occur.
More than other boomers, African
Americans are confident in reaching the
rating they “realistically hope” to achieve
in five years in the areas of religious or
spiritual life and mental health. Nearly
eight in 10 African American boomers say
it is very likely they will achieve their
desired rating in both areas (religious or
spiritual life 77%, mental health 77%).
Fewer whites (religious or spiritual life
56%, mental health 67%) or Hispanics

81
Ethnic and Racial Comparisons Among Boomers
(religious or spiritual life 64%, mental
health 71%) say the same.
African Americans are confident in
achieving their target goals in the other
areas as well. At least 60 percent of African
American boomers say they are very likely
to achieve their goals in their relation-
ships with family and friends (76%), work
or career (66%), physical health (63%),
and finances (61%). Only in the area of
leisure-time activities do somewhat
fewer, but still a majority of African
American boomers (58%), say it is very
likely they will achieve their target goal.
Hispanic boomers are as confident as
African American boomers in their ability
to reach their target goals in their work
or career (65%), their personal financial
situation (62%), their physical health
(59%), and their leisure activities (53%).
Across the board, white boomers voice
less confidence than African Americans
in the likelihood of reaching their target
goals, but Hispanic boomers are slightly
more confident than white boomers.
Fewer whites than Hispanics say it is
very likely they will achieve their target
goals in the areas of work or career
(57% vs. 65%), finances (50% vs. 62%),
religious or spiritual life (56% vs. 64%),
physical health (51% vs. 59%), and
leisure activities (46% vs. 53%).
What all three groups share to varying
degrees is less confidence in their ability
to reach their targeted goals in leisure
time, finances, and physical health. Fewer
boomers in each of the three groups say
they are very likely to achieve their goals
in these areas compared to the other life
areas. As with boomers overall, leisure
activities and finances are areas where
some of the greatest strides are hoped for
(see Table 16), yet confidence in achieving
them is the lowest (see Table 26).
Major Barriers for Boomers byRace/Ethnicity
The barriers boomers face in accom-
plishing their goals are largely the same
Table 52: Major Barriers for Boomers by Race/Ethnicity
What, if anything, is keeping you from achieving what you really want out of life?
White African American Hispanic
Unmotivated/Lazy/Self 17 20 12Personal finances 16 17 13Health (physical or mental) 7 7 10Situations with family or friends 7 6 7Lack of time 5 4 4Education 2 2 3Work or career situation 3 2 2Age 1 * 1Nothing 34 34 41N=2083 adults ages 38 to 56 N=738 N=702 N=643

Boomers at Midlife: The AARP Life Stage Study - Volume I Full Report
82 Prepared for AARP by Princeton Survey Research Associates
Table 53: Boomers’ Thoughts About Life Areas by Race/Ethnicity
In the last month, how much have you thought about ______? Have you thought about it a great deal, a fair amount, not too much, or not at all?
% who say they havethought ‘a great deal’ aboutlife area in last month White African American Hispanic
Relations with family and friends 57 65 58Personal finances 44 67 53Work or career* 45 60 48Religious or spiritual life 40 70 55Physical health 37 63 48Leisure activities 25 30 26Mental health 19 38 33N=2083 adults ages 38 to 56 N=738 N=702 N=643
* Asked only of those employed either full- or part-timeN=610 white adults ages 38 to 56N=521 African American adults ages 38 to 56N=484 Hispanic adults ages 38 to 56
regardless of race or ethnic background.
When asked what is keeping them
from achieving what they really want
out of life, all three groups often say
“themselves,” finances, or their health.
The most common response, however,
is “nothing.”
The only area of departure occurs for
Hispanic boomers. Hispanic boomers
(12%) are less likely than white (17%)
or African American (20%) boomers to
blame themselves for not accomplishing
goals. Hispanic boomers (41%) are more
likely than others (white 34%, African
American 34%) to say that nothing is
keeping them from achieving what
they want out of life.
Planning the Future forWhite, African Americanand Hispanic Boomers
Boomers’ Thoughts About LifeAreas by Race/Ethnicity
Perhaps one reason African Americans
have more confidence in their likelihood
of reaching their goals than whites
(and to a lesser extent, Hispanics) is
their focus on these major life areas.
Across the board, more African American
boomers than white boomers have
thought a great deal about each life
area. Likewise they have more often
than Hispanics thought about all but
two life areas—leisure activities and
mental health.

83
In every life area, but particularly
with religion, work, finances, physical
health, and relationships with family
and friends, a notably large percentage
of African Americans say they have
given it a great deal of thought in the
last month.
• Religious or spiritual life (70%),finances (67%), and relationshipswith family and friends (65%) topthe list for African American boomers.
• Nearly as many African Americanboomers say they have thought a great deal about their physicalhealth (63%) and work (60%) in the last month.
• Areas of least focus for AfricanAmerican boomers were mentalhealth (38%) and leisure activities (30%).
Similar patterns prevail among
Hispanic boomers, although with a
somewhat lower level of focus than
among African American boomers.
• A majority of Hispanic boomersreport having thought a great dealabout their relationships with familyand friends (58%), religious or
spiritual life (55%), and finances(53%) in the last month.
• And nearly as many Hispanicboomers report these high levels of focus on their work (48%) andphysical health (48%).
• Of lesser focus among Hispanicboomers, like boomers overall, is their mental health (33%) andleisure activities (26%).
There is only one area that a majority
of white boomers says they have
given a great deal of thought to, and
that is relationships with family and
friends (57%).
• After family and friends, fewer thanhalf say they have given a great dealof thought to work (45%), finances(44%), and religious life (40%).
• Even fewer white boomers say theyhave thought a great deal about their physical health (37%), leisureactivities (25%), or mental health(19%) in the last month.
Ethnic and Racial Comparisons Among Boomers
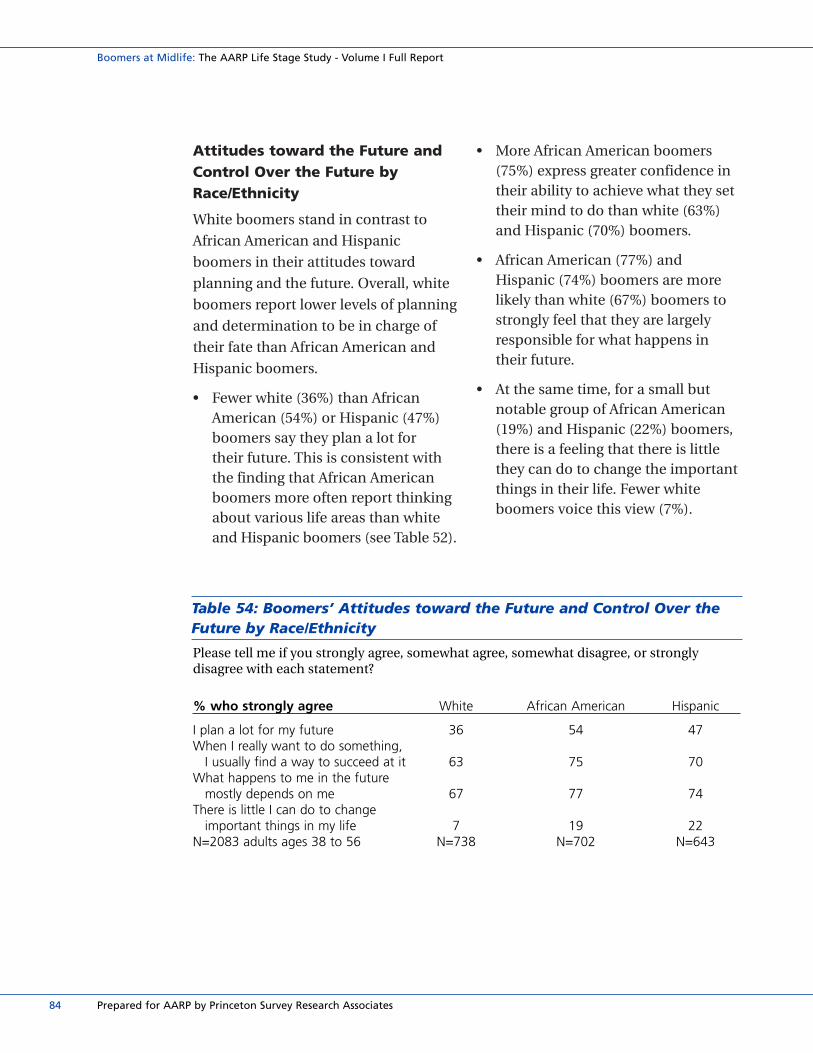
Attitudes toward the Future andControl Over the Future byRace/Ethnicity
White boomers stand in contrast to
African American and Hispanic
boomers in their attitudes toward
planning and the future. Overall, white
boomers report lower levels of planning
and determination to be in charge of
their fate than African American and
Hispanic boomers.
• Fewer white (36%) than AfricanAmerican (54%) or Hispanic (47%)boomers say they plan a lot for their future. This is consistent withthe finding that African Americanboomers more often report thinkingabout various life areas than whiteand Hispanic boomers (see Table 52).
• More African American boomers(75%) express greater confidence intheir ability to achieve what they settheir mind to do than white (63%)and Hispanic (70%) boomers.
• African American (77%) andHispanic (74%) boomers are morelikely than white (67%) boomers tostrongly feel that they are largelyresponsible for what happens intheir future.
• At the same time, for a small butnotable group of African American(19%) and Hispanic (22%) boomers,there is a feeling that there is littlethey can do to change the importantthings in their life. Fewer whiteboomers voice this view (7%).
Boomers at Midlife: The AARP Life Stage Study - Volume I Full Report
84 Prepared for AARP by Princeton Survey Research Associates
Table 54: Boomers’ Attitudes toward the Future and Control Over theFuture by Race/Ethnicity
Please tell me if you strongly agree, somewhat agree, somewhat disagree, or strongly disagree with each statement?
% who strongly agree White African American Hispanic
I plan a lot for my future 36 54 47When I really want to do something,
I usually find a way to succeed at it 63 75 70What happens to me in the future
mostly depends on me 67 77 74There is little I can do to change
important things in my life 7 19 22N=2083 adults ages 38 to 56 N=738 N=702 N=643
Appendix A: Methodological Report for National Survey
Boomers at Midlife
Prepared by Princeton Survey Research Associates for AARP
November 2002
Summary
The Boomers at Midlife survey, sponsored by AARP, conducted telephone interviews
with a nationally representative sample of 3,666 adults living in the continental
United States. Interviews were completed in both English and Spanish, according
to the preference of the respondent. The interviews were conducted by Princeton
Data Source, LLC (a subsidiary of Princeton Survey Research Associates located in
Fredericksburg, Virginia) during the period of April 11 through June 15, 2002. Quotas
were set by age to ensure sufficient interviews among boomers2 for statistical analysis.
Results are weighted to correct for oversampling and to make the final total sample
results representative of all adults living in the continental U.S. The margin of
sampling error for the complete set of weighted data is ±2 percent.
Details on the design, execution and analysis of the survey are discussed below.
Design and Data Collection Procedures
Sample Design
The sample was designed to generalize to the U.S. adult population, and to allow
separate analyses of boomers overall, and African-American and Hispanic boomers.
To oversample boomers, PSRA screened standard list-assisted random digit dial
(RDD) sample. To oversample minority groups, PSRA supplemented the RDD
sample with prescreened sample of African-American and Hispanic households.
RDD Sample
The RDD telephone sample was provided by Survey Sampling, Inc. (SSI) according
to PSRA specifications. To draw this sample, every active block of telephone numbers
(area code + exchange + two-digit block number) that contained three or more
residential directory listings is equally likely to be selected; after block selection, phone
numbers are randomly generated in proportion to the number of listed households
in each block. This method guarantees coverage of every assigned phone number
regardless of whether that number is directory listed, purposely unlisted, or too new
to be listed. After selection, the numbers are compared against business directories
and matching numbers are purged. The RDD sample yielded 1,647 interviews.
Appendix A: Methodological Report for National Survey
85
2 For this survey, boomers are those born between 1946 and 1964.

Pre-screened Sample
To supplement the RDD interviews, an additional 2,019 interviews were completed
from minority households identified in the PDS Demographic Tracking Omnibus
Survey. This short 10 minute demographic survey asked a number of questions about
individual demographics and household composition. Sample for the original
Demographic Tracking survey was drawn using the same RDD sampling as described
above. Households were originally contacted between January 18, 2001 and June 9, 2002.
Questionnaire Development and Testing
The questionnaire was developed by PSRA in collaboration with AARP. The question-
naire was pretested twice with a small number of respondents from an RDD sample.
Pretest interviews were monitored by PSRA and AARP staff and conducted using
experienced interviewers who could best judge the quality of the answers given and
the degree to which respondents understood the questions. Some final changes
were made to question wording and order based on the monitored pretest interviews.
The final questionnaire was translated into Spanish by Princeton Data Source. All
interviews, both English and Spanish, were conducted using a fully-programmed
CATI instrument.
Contact Procedures
Interviews were conducted during the period April 11 through June 15, 2002. As
many as five attempts were made to contact a person at every sampled telephone
number. Sample was released for interviewing in replicates, which are representative
subsamples of the larger sample. Using replicates to control the release of sample
ensures that complete call procedures are followed for the entire sample and that
the geographic distribution of numbers called is appropriate.
Calls were staggered over times of day and days of the week to maximize the
chance of making contact with potential respondents. Each household received at
least one daytime call in an attempt to find someone at home.
Weighting and Analysis
Weighting is generally used in survey analysis to adjust for sample design effects and
to compensate for patterns of non-response that might bias results. The weighting
for this project was accomplished in two stages; a first stage to adjust demographic
distortions due to non-response and age screening, and a second stage to put the
various racial/ethnic groups back into their proper proportions and to make the
final weighted n equal to the final unweighted n for the total sample.
Boomers at Midlife: The AARP Life Stage Study - Volume I Full Report
86 Prepared for AARP by Princeton Survey Research Associates

Appendix A: Methodological Report for National Survey
87
Table1: Total Sample Demographics
Parameter Weighted
Gender Male 47.9 46.9Female 52.1 53.1
Age 18–37 37.5 36.538–43 13.3 13.644–49 12.3 12.750–56 11.4 11.757+ 25.5 25.5
Education Less than HS 15.8 14.3HS graduate 36.3 36.8Some college 23.5 24.1College graduate 24.4 24.9
Marital Status Married 58.0 58.3Not married 42.0 41.7
Race/Ethnicity White, not Hispanic 74.1 73.8Black, not Hispanic 11.1 11.1Hispanic 10.4 10.3Other, not Hispanic 4.5 4.5
Region Northeast 19.6 19.2Midwest 23.1 23.7South 35.2 35.0West 22.2 22.1
First Stage—Demographic Adjustment
In the first weighting stage, the demographic composition of each racial/ethnic
subsample was weighted to match national parameters for sex by age, sex by
education, age by education, marital status and census region. These parameters
came from a special analysis of the March 2001 Current Population Survey (CPS)
that included all telephone households in the continental United States.
This stage of weighting was accomplished using Sample Balancing, a special iterative
sample weighting program that simultaneously balances the distributions of all
variables using a statistical technique called the Deming Algorithm. This weighting
adjusts for non-response that is related to particular demographic characteristics of
the sample and ensures that the demographic characteristics of each race/ethnic
group's sample closely approximate the demographic characteristics of that group
nationwide. Weights from this stage were trimmed to prevent individual interviews
from having too much influence on the final results. Table 1 compares weighted
sample distributions to population parameters.
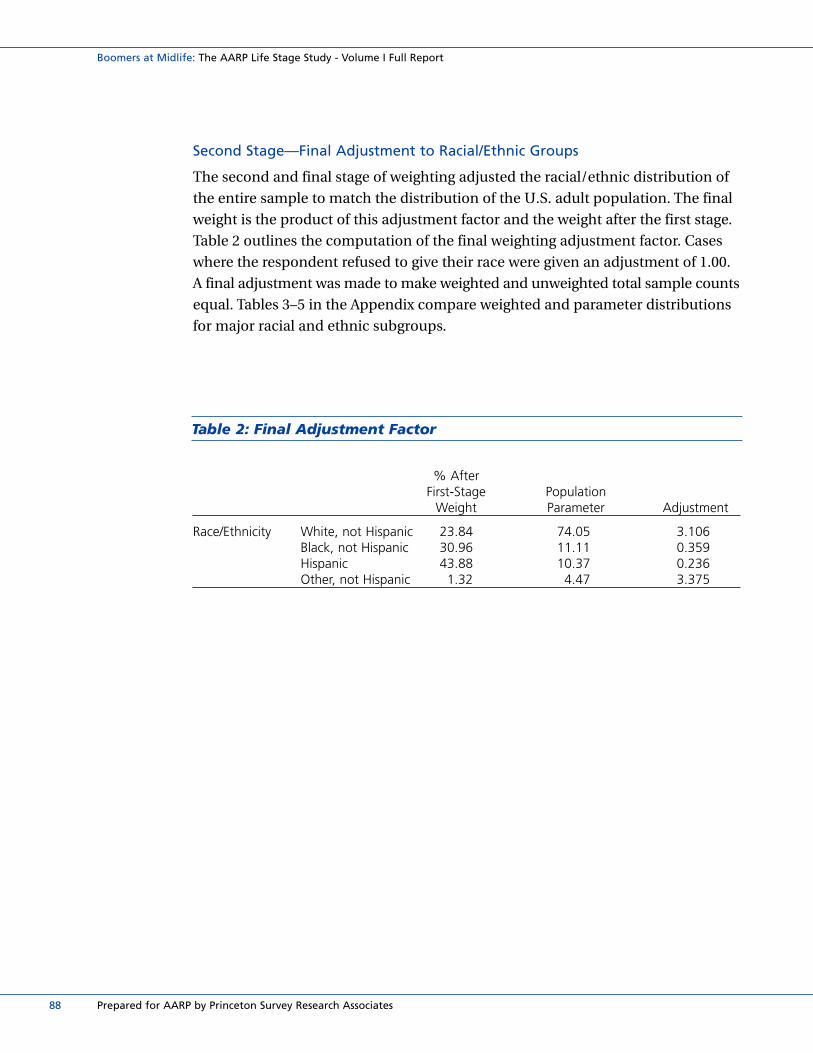
Boomers at Midlife: The AARP Life Stage Study - Volume I Full Report
88 Prepared for AARP by Princeton Survey Research Associates
Table 2: Final Adjustment Factor
% AfterFirst-Stage Population
Weight Parameter Adjustment
Race/Ethnicity White, not Hispanic 23.84 74.05 3.106Black, not Hispanic 30.96 11.11 0.359Hispanic 43.88 10.37 0.236Other, not Hispanic 1.32 4.47 3.375
Second Stage—Final Adjustment to Racial/Ethnic Groups
The second and final stage of weighting adjusted the racial/ethnic distribution of
the entire sample to match the distribution of the U.S. adult population. The final
weight is the product of this adjustment factor and the weight after the first stage.
Table 2 outlines the computation of the final weighting adjustment factor. Cases
where the respondent refused to give their race were given an adjustment of 1.00.
A final adjustment was made to make weighted and unweighted total sample counts
equal. Tables 3–5 in the Appendix compare weighted and parameter distributions
for major racial and ethnic subgroups.

Appendix A: Methodological Report for National Survey
89
Table 3: African-American Sample Demographics
Parameter Weighted
Gender Male 44.7 43.9Female 55.3 56.1
Age 18–37 43.8 42.138–43 14.0 14.444–49 12.4 12.950–56 10.1 10.657+ 19.7 20.1
Education Less than HS 20.9 18.8HS graduate 39.4 40.4Some college 24.6 25.1College graduate 15.1 15.7
Marital Status Married 38.5 39.2Not married 61.5 60.8
Race/Ethnicity White, not Hispanic NA NABlack, not Hispanic NA NAHispanic NA NAOther, not Hispanic NA NA
Region Northeast 17.1 16.6Midwest 18.5 18.3South 55.1 55.5West 9.2 9.6
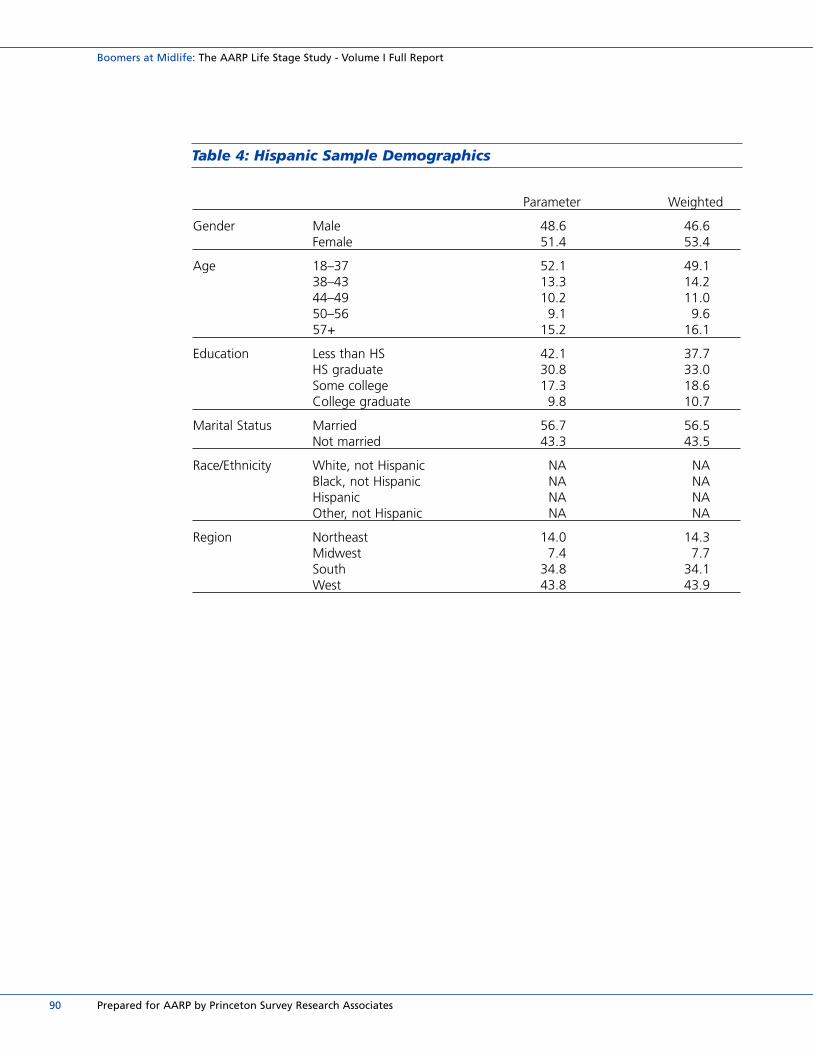
Boomers at Midlife: The AARP Life Stage Study - Volume I Full Report
90 Prepared for AARP by Princeton Survey Research Associates
Table 4: Hispanic Sample Demographics
Parameter Weighted
Gender Male 48.6 46.6Female 51.4 53.4
Age 18–37 52.1 49.138–43 13.3 14.244–49 10.2 11.050–56 9.1 9.657+ 15.2 16.1
Education Less than HS 42.1 37.7HS graduate 30.8 33.0Some college 17.3 18.6College graduate 9.8 10.7
Marital Status Married 56.7 56.5Not married 43.3 43.5
Race/Ethnicity White, not Hispanic NA NABlack, not Hispanic NA NAHispanic NA NAOther, not Hispanic NA NA
Region Northeast 14.0 14.3Midwest 7.4 7.7South 34.8 34.1West 43.8 43.9
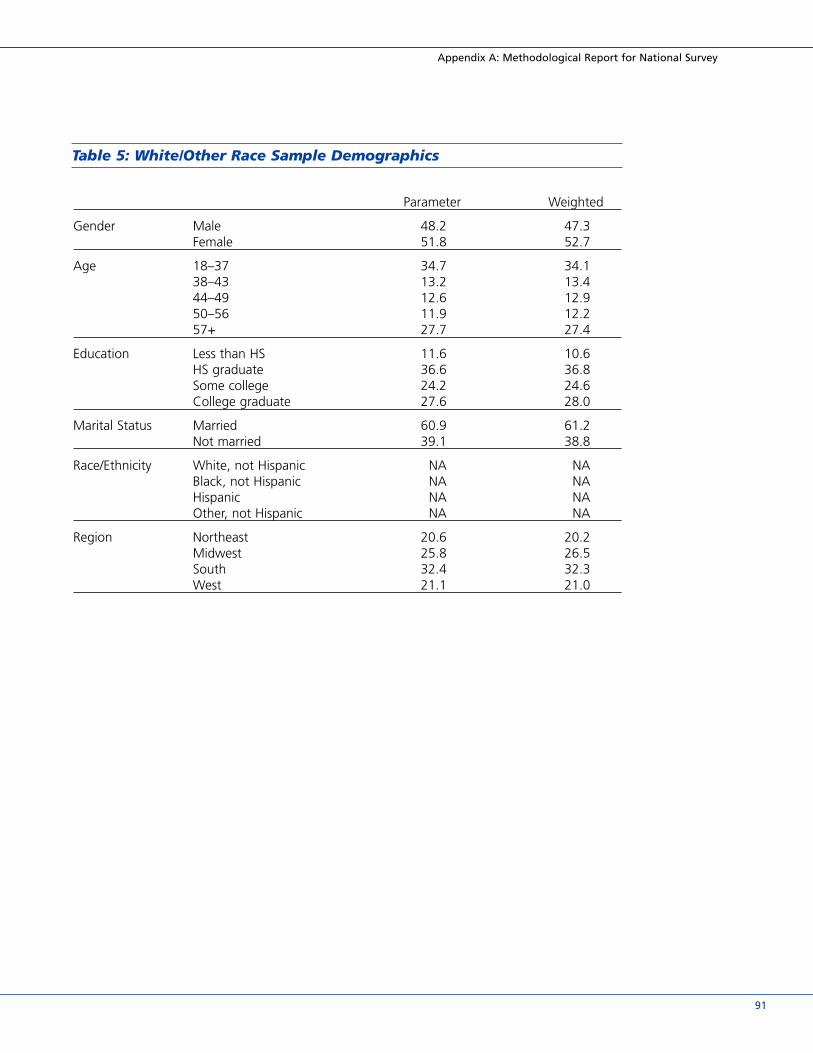
Appendix A: Methodological Report for National Survey
91
Table 5: White/Other Race Sample Demographics
Parameter Weighted
Gender Male 48.2 47.3Female 51.8 52.7
Age 18–37 34.7 34.138–43 13.2 13.444–49 12.6 12.950–56 11.9 12.257+ 27.7 27.4
Education Less than HS 11.6 10.6HS graduate 36.6 36.8Some college 24.2 24.6College graduate 27.6 28.0
Marital Status Married 60.9 61.2Not married 39.1 38.8
Race/Ethnicity White, not Hispanic NA NABlack, not Hispanic NA NAHispanic NA NAOther, not Hispanic NA NA
Region Northeast 20.6 20.2Midwest 25.8 26.5South 32.4 32.3West 21.1 21.0

( )
Effects of Sample Design on Statistical Inference
Specialized sampling designs and post-data collection statistical adjustments
require analysis procedures that reflect departures from simple random sampling.
PSRA calculates the effects of these design features so that an appropriate adjust-
ment can be incorporated into tests of statistical significance when using these
data. The so-called “design effect” or deff represents the loss in statistical efficiency
that results from a disproportional sample design and systematic non-response.
PSRA calculates the composite design effect for a sample of size n, with each case
having a weight, wi as:
In a wide range of situations, the adjusted standard error of a statistic should be
calculated by multiplying the usual formula by the square root of the design effect
( deff ). Thus, the formula for computing the 95% confidence interval around a
percentage is:
where p is the sample estimate and n is the unweighted number of sample cases
in the group being considered.
The formula for computing the 95 percent confidence interval around the difference
between two percentages, p1 and p2, of sizes n1 and n2, is:
where p1 is the estimate of p1, p2 is the estimate of p2 , and deff1 and deff2 are the
design effects for each group.
Boomers at Midlife: The AARP Life Stage Study - Volume I Full Report
92 Prepared for AARP by Princeton Survey Research Associates
deff =
n wi2
n
∑i =1
n wi
n
∑i =1
( )2
p+ deff x 1.96p(1-p)
n
deff1 p1(1-p1) deff2 p2(1-p2)n1
+n2
(p1–p2) + 1.96
ˆ
ˆ
ˆ
ˆ
ˆ
ˆ ˆ ˆ ˆ ˆ
ˆ ˆ

Appendix A: Methodological Report for National Survey
93
Table 6: Design Effects, Sample Sizes and Margins of Error
Number of Design MarginInterviews Effect of Error
Total 3666 2.38 2.4%
Age 18–37 781 1.90 4.8%38–43 708 1.90 5.1%44–49 717 1.93 5.1%50–56 702 1.95 5.2%57+ 758 2.25 5.3%
Gender Male 1413 2.20 3.9%Female 2253 2.46 3.2%
Education LT HS graduate 495 2.40 6.8%HS graduate 1323 2.41 4.2%Some college 879 2.38 5.1%College graduate 951 2.31 4.8%
Marital Status Married 1917 2.14 3.3%Not married 1726 2.72 3.9%
Race/Ethnicity White, not Hispanic 1241 1.31 3.2%Black, not Hispanic 1185 1.53 3.5%Hispanic 1161 1.63 3.7%
Region Northeast 578 2.17 6.0%Midwest 660 1.75 5.0%South 1508 2.68 4.1%West 920 2.70 5.3%
The survey’s margin of error is the largest 95% confidence interval for any estimated
proportion based on the total sample—one around 50%. For example, the margin
of error for the total sample is ±2.4%, this means that in 95 out every 100 samples
using the same methodology, estimated proportions based on the entire sample
will be no more than 2.4 percentage points away from their true values in the
population. It is important to remember that sampling fluctuations are only one
possible source of error in survey estimates. Other sources, such as measurement,
may contribute additional error of greater or lesser magnitude. Table 6 shows
design effects, sample sizes and margins of error for the total sample and selected
target subgroups.

Response Rate
Table 7 reports the disposition of all sampled telephone numbers from the RDD
sample. The response rate estimates the fraction of all eligible respondents in the
sample that were ultimately interviewed. At PSRA it is calculated by taking the
product of three component rates:3
• Contact rate—the proportion of working numbers where a request for interviewwas made—of 74.0 percent4
• Cooperation rate—the proportion of contacted numbers where a consent forinterview was initially obtained, versus those refused—of 53.2 percent
• Completion rate—the proportion of initially cooperating and eligible interviewsthat were completed—of 87.9 percent
Thus the response rate for the RDD portion of this survey is 34.6 percent.
Table 8 reports the disposition of all sampled telephone numbers from the
pre-screened African-American and Hispanic samples. These samples yielded
post-screening response rates of 42 percent for the African-American oversample
and 44 percent for the Hispanic oversample. Figures in these tables represent rates
after the pre-screening of eligible households. The response rate for the original
screening interview was approximately 33 percent.
Boomers at Midlife: The AARP Life Stage Study - Volume I Full Report
94 Prepared for AARP by Princeton Survey Research Associates
3 PSRA's disposition codes and rate formulas are consistent with standards of the American Association for PublicOpinion Research.
4 We assume that 75 percent of cases that result in a constant disposition of "No answer" over ten or more attemptsare actually not working numbers.

Appendix A: Methodological Report for National Survey
95
Table 7: RDD Sample Disposition
Total numbers dialed 16636
Business 1497Computer/Fax 900Other not-working 2426Additional projected NW 1091
Working numbers 10722 64.4%
No answer 279Busy 86Answering machine 1112Callbacks 524Other non-contacts 787
Contacted numbers 7934 74.0%
Initial refusals 2222Second refusals 1489
Cooperating numbers 4224 53.2%
No adult in HH 41SO–Age quota 2274SO–Race unqualified 0Language barrier 35
Eligible numbers 1874 44.4%
Interrupted 227Completes 1647 87.9%
Response rate 34.6%

Boomers at Midlife: The AARP Life Stage Study - Volume I Full Report
96 Prepared for AARP by Princeton Survey Research Associates
Table 8: Pre-Screened Sample Dispositions
African-American Hispanic
Total numbers dialed 4521 4475
Business 91 83Computer/Fax 73 60Other not-working 797 747Additional projected NW 157 31
Working numbers 3404 75.3% 3554 79.4%
No answer 45 6Busy 6 4Answering machine 330 98Callbacks 370 404Other non-contacts 265 431
Contacted numbers 2387 70.1% 2611 73.5%
Initial refusals 557 596Second refusals 271 359
Cooperating numbers 1558 65.3% 1655 63.4%
No adult in HH 17 14SO–Age quota 216 431SO–Race unqualified 179 143Language barrier 9 24
Eligible numbers 1137 73.0% 1043 63.0%
Interrupted 96 65Completes 1041 91.5% 978 93.8%
Response rate 41.9% 43.7%
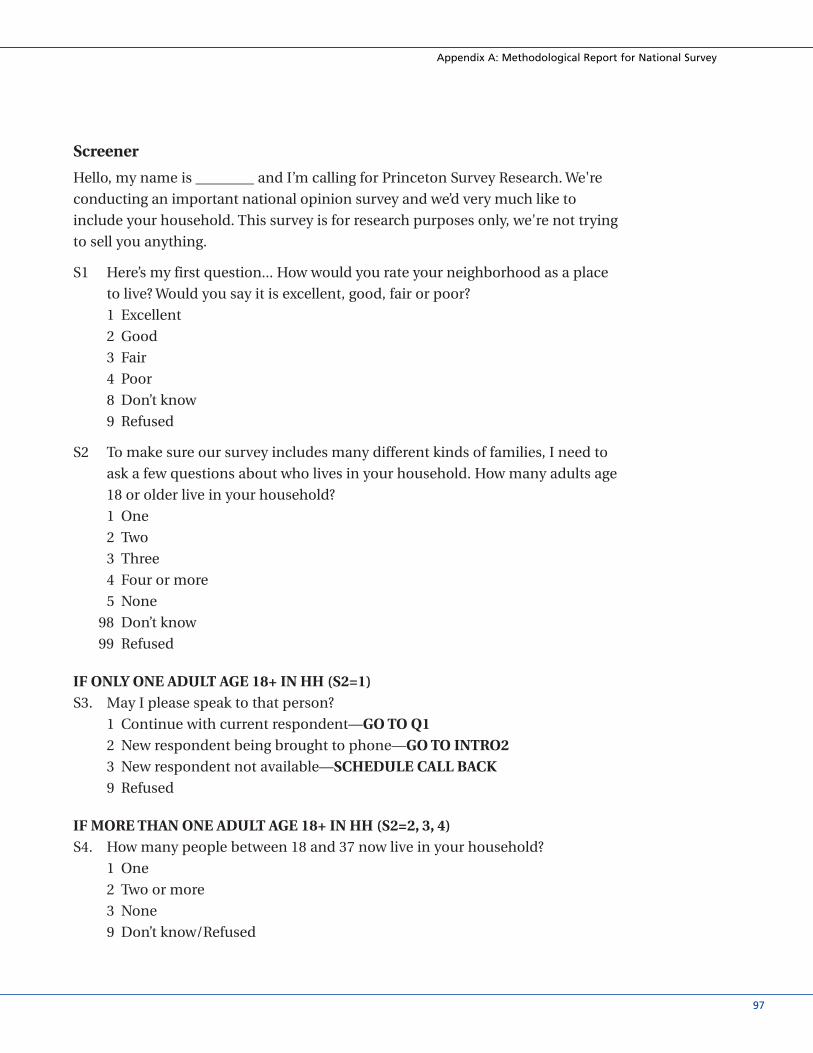
Screener
Hello, my name is ________ and I’m calling for Princeton Survey Research. We're
conducting an important national opinion survey and we’d very much like to
include your household. This survey is for research purposes only, we're not trying
to sell you anything.
S1 Here’s my first question... How would you rate your neighborhood as a place
to live? Would you say it is excellent, good, fair or poor?
1 Excellent
2 Good
3 Fair
4 Poor
8 Don’t know
9 Refused
S2 To make sure our survey includes many different kinds of families, I need to
ask a few questions about who lives in your household. How many adults age
18 or older live in your household?
1 One
2 Two
3 Three
4 Four or more
5 None
98 Don’t know
99 Refused
IF ONLY ONE ADULT AGE 18+ IN HH (S2=1)S3. May I please speak to that person?
1 Continue with current respondent—GO TO Q12 New respondent being brought to phone—GO TO INTRO23 New respondent not available—SCHEDULE CALL BACK9 Refused
IF MORE THAN ONE ADULT AGE 18+ IN HH (S2=2, 3, 4)S4. How many people between 18 and 37 now live in your household?
1 One
2 Two or more
3 None
9 Don’t know/Refused
Appendix A: Methodological Report for National Survey
97

IF MORE THAN ONE ADULT AGE 18+ IN HH (S2=2, 3, 4)S5. How many people between 38 and 56 now live in your household?
1 One
2 Two or more
3 None
9 Don’t know/Refused
IF MORE THAN ONE ADULT AGE 18+ IN HH (S2=2, 3, 4)S6. How many people 57 or older now live in your household?
1 One
2 Two or more
3 None
9 Don’t know/Refused
IF ANSWERED REFUSED TO S4, S5, S6 (S4=9 AND S5=9 AND S6=9) CONF. Just to confirm, are you over the age of 18?
1 Yes—GO TO Q12 No—CODE AS A REFUSAL
IF ANSWERED NONE TO S4, S5, S6 (S4=3 AND S5=3 AND S6=3) S7. May I please speak to any person over the age of 18?
1 Continue with current respondent—GO TO Q12 New respondent being brought to phone—GO TO INTRO23 New respondent not available—SCHEDULE CALL BACK9 Refused—THANK AND TERMINATE
Instructions for prioritizing respondent to continue with interview1 Has at least one 38–56 yr old (S5=1, 2) [Skip to S8] First Priority2 Has at least one 57+ yr old (S6=1, 2) [Skip to S9] Second Priority3 Has at least one 18–37 yr old (S4=1, 2) [Skip to S10] Third Priority
IF ONE OR MORE ADULTS BETWEEN AGES 38 AND 56 (S5=1, 2)S8. May I please speak to the person between 38 and 56 years old?
1 Continue with current respondent—GO TO Q12 New respondent being brought to phone—GO TO INTRO23 New respondent not available—SCHEDULE CALL BACK9 Refused—THANK AND TERMINATE
Boomers at Midlife: The AARP Life Stage Study - Volume I Full Report
98 Prepared for AARP by Princeton Survey Research Associates
IF ONE OR MORE ADULTS 57+ AND NO 38 TO 56 YEAR OLDS (S6=1, 2 AND S5=3)S9. May I please speak to the person 57 or older?
1 Continue with current respondent—GO TO Q12 New respondent being brought to phone—GO TO INTRO23 New respondent not available—SCHEDULE CALL BACK9 Refused—THANK AND TERMINATE
IF ONE OR MORE ADULTS BETWEEN AGES 18 AND 37 AND NO 38 TO 56 YEAROLDS AND NO 57+ (S4=1, 2 AND S5=3 AND S6=3)S10. May I please speak to the person between 18 and 37 years old?
1 Continue with current respondent—GO TO Q12 New respondent being brought to phone—GO TO INTRO23 New respondent not available—SCHEDULE CALL BACK9 Refused—THANK AND TERMINATE
IF S3=2 OR S7=2 OR S8=2 OR S9=2 OR S10=2INTRO2
Hello, my name is ________ and I’m calling for Princeton Survey Research. We’re
conducting an important national opinion survey and we’d very much like to
include your household. This survey is for research purposes only, we’re not trying
to sell you anything.
Appendix A: Methodological Report for National Survey
99
Boomers at Midlife: The AARP Life Stage Study - Volume I Full Report
100 Prepared for AARP by Princeton Survey Research Associates

101
Appendix B: Annotated QuestionnaireBoomers at Midlife
Prepared by Princeton Survey Research Associates for AARP
6.24.2002
N=3666 Total Sample (Margin of Error +2%)
N=781 18–37 year olds (Margin of Error +5%)
N=2127 38–56 year olds (Margin of Error +3%)
N=758 57 and older (Margin of Error +5%)
Field: April 11, 2002–June 15, 2002
Q1 Overall, are you satisfied or dissatisfied with the way things are going in
this country today? BOOMERS
Total 18–37 38–56 57+
51 59 51 40 Satisfied39 33 41 46 Dissatisfied8 7 7 10 Don’t know1 1 1 3 Refused
Q2 And are you satisfied or dissatisfied with the way things are going in your
own life today?BOOMERS
Total 18–37 38–56 57+
85 86 83 88 Satisfied12 12 14 9 Dissatisfied2 1 2 2 Don’t know* * * 1 Refused
Appendix B: Annotated Questionnaire

Boomers at Midlife: The AARP Life Stage Study - Volume I Full Report
102 Prepared for AARP by Princeton Survey Research Associates
Q3 What is the best thing about your life right now? BOOMERS
Total 18–37 38–56 57+
37 45 41 19 Family and friends13 12 11 18 Work/Career12 10 12 17 Overall good life/Being alive/Everything9 6 9 13 Health6 3 8 9 Religion3 3 3 4 Security/Peace/Stability/Freedom2 3 2 2 Home/House/Residential locale2 5 1 * Education2 2 1 4 Leisure2 2 2 2 Finances7 6 7 8 Nothing3 4 3 3 Other1 1 * 1 Don’t know* * * * Refused
Q4 What is the worst thing about your life right now?BOOMERS
Total 18–37 38–56 57+
18 21 20 10 Finances11 12 13 4 Work/Career10 4 8 21 Health9 8 9 11 Family and Friends4 0 2 12 Aging3 3 4 3 Societal Concern2 2 3 1 Lack of time1 2 1 * Residential Locale
27 28 25 29 Nothing14 18 14 8 Other1 1 1 1 Don’t know1 1 1 1 Refused
Q5 In general, how often do you think about your future? Do you think about your future
often, sometimes, rarely or never?BOOMERS
Total 18–37 38–56 57+
63 78 64 41 Often23 18 26 25 Sometimes9 3 7 20 Rarely4 1 2 12 Never1 1 1 2 Don’t know* * * * Refused

Appendix B: Annotated Questionnaire
103
Q6 Five years from now, do you expect things in your life will be better, the
same or worse than they are right now?BOOMERS
Total 18–37 38–56 57+
73 92 77 41 Better18 7 17 34 Same6 1 3 17 Worse3 1 2 8 Don’t know* 0 * 1 Refused
Q7 I am going to read you a list of statements. Please tell me if you strongly
agree, somewhat agree, somewhat disagree or strongly disagree with each
statement. (First|Next) (Insert).
List items were rotated
a I plan a lot for my future.BOOMERS
Total 18–37 38–56 57+
43 54 40 32 Strongly agree38 36 43 35 Somewhat agree12 7 13 16 Somewhat disagree5 3 4 11 Strongly disagree1 0 1 4 Don’t know* 0 * 1 Refused
b There is little I can do to change important things in my life.BOOMERS
Total 18–37 38–56 57+
13 8 10 23 Strongly agree14 8 12 26 Somewhat agree22 23 23 20 Somewhat disagree49 61 54 26 Strongly disagree2 * 1 5 Don’t know* 0 * * Refused
c When I really want to do something, I usually find a way to succeed at it.BOOMERS
Total 18–37 38–56 57+
66 69 65 61 Strongly agree30 28 30 32 Somewhat agree2 2 3 2 Somewhat disagree1 1 1 2 Strongly disagree1 * * 3 Don’t know* 0 * * Refused
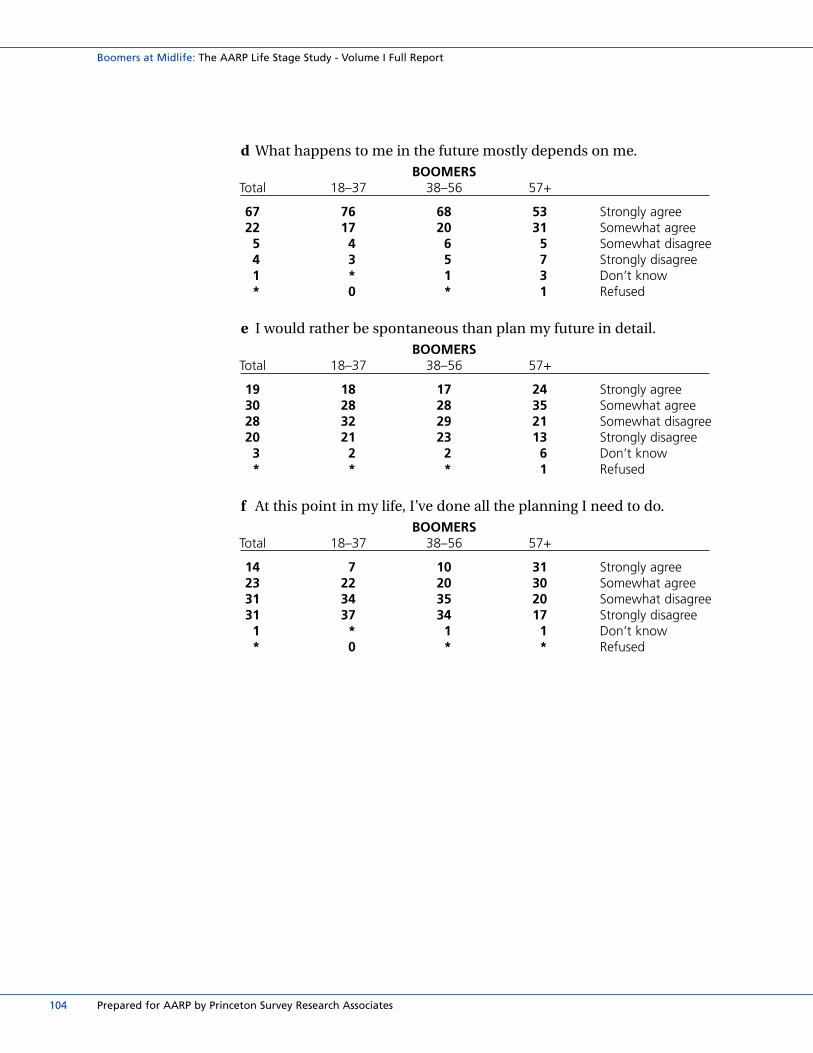
Boomers at Midlife: The AARP Life Stage Study - Volume I Full Report
104 Prepared for AARP by Princeton Survey Research Associates
d What happens to me in the future mostly depends on me.BOOMERS
Total 18–37 38–56 57+
67 76 68 53 Strongly agree22 17 20 31 Somewhat agree5 4 6 5 Somewhat disagree4 3 5 7 Strongly disagree1 * 1 3 Don’t know* 0 * 1 Refused
e I would rather be spontaneous than plan my future in detail.BOOMERS
Total 18–37 38–56 57+
19 18 17 24 Strongly agree30 28 28 35 Somewhat agree28 32 29 21 Somewhat disagree20 21 23 13 Strongly disagree3 2 2 6 Don’t know* * * 1 Refused
f At this point in my life, I’ve done all the planning I need to do.BOOMERS
Total 18–37 38–56 57+
14 7 10 31 Strongly agree23 22 20 30 Somewhat agree31 34 35 20 Somewhat disagree31 37 34 17 Strongly disagree1 * 1 1 Don’t know* 0 * * Refused

Appendix B: Annotated Questionnaire
105
Q8 What one major ambition or dream would you like to accomplish over the
next five years? BOOMERS
Total 18–37 38–56 57+
24 29 29 12 Finances18 19 23 9 Work/Career11 12 11 8 Family and Friends9 19 6 2 Education9 3 4 24 Health5 3 5 7 Leisure3 2 4 4 Self Improvement/New Lifestyle or Perspective1 * 1 2 Religion1 0 * 2 Societal Concern
12 7 11 22 Don’t have one/Already accomplished5 3 5 7 Other1 2 1 2 Don’t know* * * * Refused
D1A Which of the following best describes your current employment status—employed,
self-employed, retired and not working, are you not in the labor force, or are you
unemployed and looking for work?BOOMERS
Total 18–37 38–56 57+
54 64 67 17 Employed10 10 13 6 Self-employed19 1 3 68 Retired and not working9 10 10 4 Not in the labor force8 14 6 4 Unemployed and looking for work* * * * Don’t know* * * * Refused
D1B Is this part-time or full-time?
Based on those who are employed or self employedBOOMERS
Total 18–37 38–56 57+
17 20 13 24 Part-time83 80 86 76 Full-time* * * 0 Don’t know0 0 0 0 Refused
N=2420 572 1646 202

Boomers at Midlife: The AARP Life Stage Study - Volume I Full Report
106 Prepared for AARP by Princeton Survey Research Associates
D1C Have you retired from a previous career?
Based on those who are employed or self employedBOOMERS
Total 18–37 38–56 57+
9 3 10 31 Yes91 97 89 69 No* 0 * 0 Don’t know* 0 * 0 Refused
N=2420 572 1646 202
Q9 In the last month, how much have you thought about (Insert)? Have you
thought about it a great deal, a fair amount, not too much, or not at all?
List items were rotated
a your personal financial situationBOOMERS
Total 18–37 38–56 57+
47 62 47 25 A great deal33 26 36 38 A fair amount15 9 14 24 Not too much4 2 3 10 Not at all* 0 * 2 Don’t know* * * * Refused
b your physical healthBOOMERS
Total 18–37 38–56 57+
41 41 41 40 A great deal37 36 38 37 A fair amount17 18 16 16 Not too much5 5 5 5 Not at all* 0 * 1 Don’t know* 0 * * Refused
c your mental healthBOOMERS
Total 18–37 38–56 57+
22 21 23 22 A great deal23 22 23 23 A fair amount30 29 33 26 Not too much24 26 20 28 Not at all1 1 1 2 Don’t know* * * 0 Refused

Appendix B: Annotated Questionnaire
107
d your work or career
Based on those who are employed or self employedBOOMERS
Total 18–37 38–56 57+
49 57 46 29 A great deal33 31 34 39 A fair amount13 8 16 21 Not too much4 3 3 10 Not at all* 0 * 0 Don’t know* 0 * * Refused
N=2420 572 1646 202
e your personal relationships with family and friendsBOOMERS
Total 18–37 38–56 57+
57 57 58 55 A great deal30 31 30 28 A fair amount9 9 9 10 Not too much3 3 2 5 Not at all1 * * 2 Don’t know* * * * Refused
f your religious or spiritual lifeBOOMERS
Total 18–37 38–56 57+
45 36 45 56 A great deal28 31 29 21 A fair amount18 19 17 16 Not too much9 13 8 6 Not at all1 1 * 1 Don’t know* * * * Refused
g your leisure activitiesBOOMERS
Total 18–37 38–56 57+
28 30 26 29 A great deal40 41 41 37 A fair amount23 22 27 19 Not too much8 6 5 14 Not at all1 1 1 2 Don’t know* * * 0 Refused

Boomers at Midlife: The AARP Life Stage Study - Volume I Full Report
108 Prepared for AARP by Princeton Survey Research Associates
Q10 Overall, how satisfied are you with your (Insert). Are you very satisfied,
somewhat satisfied, not too satisfied or not at all satisfied?
List items were rotated
a personal financial situationBOOMERS
Total 18–37 38–56 57+
23 19 20 35 Very satisfied52 51 54 50 Somewhat satisfied15 18 15 9 Not too satisfied10 12 10 5 Not at all satisfied* * * 1 Don’t know* * * 1 Refused
b physical healthBOOMERS
Total 18–37 38–56 57+
34 35 31 38 Very satisfied48 48 52 42 Somewhat satisfied11 12 11 12 Not too satisfied6 4 6 8 Not at all satisfied* * * * Don’t know* * * * Refused
c mental healthBOOMERS
Total 18–37 38–56 57+
61 61 61 63 Very satisfied32 32 33 30 Somewhat satisfied3 3 4 3 Not too satisfied2 3 2 2 Not at all satisfied1 * 1 2 Don’t know* * * 0 Refused
d work or career
Based on those who are employed or self employedBOOMERS
Total 18–37 38–56 57+
38 34 39 50 Very satisfied48 48 48 44 Somewhat satisfied9 10 9 3 Not too satisfied5 8 3 3 Not at all satisfied* 1 * * Don’t know0 0 0 0 Refused
N=2420 572 1646 202

Appendix B: Annotated Questionnaire
109
e personal relationships with family and friendsBOOMERS
Total 18–37 38–56 57+
63 57 63 74 Very satisfied31 37 33 22 Somewhat satisfied3 4 3 3 Not too satisfied1 2 1 1 Not at all satisfied1 * * 1 Don’t know* 0 * * Refused
f religious or spiritual lifeBOOMERS
Total 18–37 38–56 57+
46 34 47 60 Very satisfied43 50 43 32 Somewhat satisfied6 8 6 5 Not too satisfied3 6 2 2 Not at all satisfied2 2 2 1 Don’t know* * * * Refused
g leisure activitiesBOOMERS
Total 18–37 38–56 57+
35 33 29 47 Very satisfied49 50 52 41 Somewhat satisfied10 10 12 6 Not too satisfied5 6 5 4 Not at all satisfied1 1 1 1 Don’t know* 0 * 1 Refused

Boomers at Midlife: The AARP Life Stage Study - Volume I Full Report
110 Prepared for AARP by Princeton Survey Research Associates
Q11A Which one of these areas is most important to you?
Responses were read
Respondents who are employed or self employed were asked about work
or career (N=2420, 572, 1646, 202)BOOMERS
Total 18–37 38–56 57+
6 9 6 4 Your personal financial situation19 12 19 30 Your physical health4 5 3 3 Your mental health3 4 2 1 Your work or career
41 48 44 26 Your personal relationships with family and friends23 19 22 29 Your religious or spiritual life or1 2 1 2 Your leisure activities3 1 3 4 Don’t know* * * * Refused
Q11B And which is second most important to you?
Responses were read as needed
Respondents who are employed or self employed were asked about work
or career (N=2420, 572, 1646, 202)BOOMERS
Total 18–37 38–56 57+
15 17 16 12 Your personal financial situation17 15 18 17 Your physical health7 5 6 9 Your mental health8 12 10 1 Your work or career
34 32 33 38 Your personal relationships with family and friends15 16 15 15 Your religious or spiritual life or3 3 3 4 Your leisure activities1 1 * 4 Don’t know* 0 * * Refused

Appendix B: Annotated Questionnaire
111
Q12 Which one of all the life areas we have been talking about would you
most like to change?
Responses were read
Respondents who are employed or self employed were asked about work
or career (N=2420, 572, 1646, 202)BOOMERS
Total 18–37 38–56 57+
34 40 35 24 Your personal financial situation19 14 17 27 Your physical health2 2 1 2 Your mental health
12 16 14 2 Your work or career7 7 6 7 Your personal relationships with family and friends8 9 8 7 Your religious or spiritual life or9 7 10 8 Your leisure activities9 4 7 20 Don’t know2 * 1 4 Refused
Life area sections were rotated
Q13A Turning to the subject of finances, how would you rate your personal financial
situation today. Please use a scale that goes from 0 to 10, 10 is the top of the scale
and 0 is the bottom of the scale.BOOMERS
Total 18–37 38–56 57+
6.20 5.87 6.19 6.67 Mean2 2 3 2 0 – bottom of the scale1 1 1 1 13 4 4 2 24 5 4 2 37 10 5 5 4
19 20 18 20 513 14 14 9 621 22 24 17 718 13 19 22 84 3 4 6 96 4 5 11 10 – top of the scale1 1 1 3 Don’t know1 1 * 1 Refused

Boomers at Midlife: The AARP Life Stage Study - Volume I Full Report
112 Prepared for AARP by Princeton Survey Research Associates
Q13B Would you say you are in a better financial situation than you expected to
be at this point in your life, in a worse financial situation than you expected
or are you about where you expected to be at this point in your life?BOOMERS
Total 18–37 38–56 57+
29 25 29 37 Better27 31 31 16 Worse41 43 39 43 Where expected1 1 1 2 Don’t know1 1 * 1 Refused
Q13C Given your current personal financial situation, what is the best financial
position you could realistically hope to have 5 years from now? Please use the
0 to 10 scale where 10 is the top of the scale and 0 is the bottom of the scale.BOOMERS
Total 18–37 38–56 57+
7.89 8.30 7.98 7.09 Mean1 0 * 2 0 – bottom of the scale* 0 * * 11 * * 2 21 * * 2 31 * 1 1 48 4 6 16 56 3 6 9 6
15 16 16 12 730 32 32 24 814 18 15 8 921 25 20 15 10 – top of the scale3 2 2 7 Don’t know1 0 1 2 Refused
Q13D How likely are you to achieve this goal—very likely, somewhat likely, not
too likely or not at all likely?
Based on those with hopes that were 1 or greaterBOOMERS
Total 18–37 38–56 57+
56 64 53 50 Very likely38 34 43 38 Somewhat likely3 2 3 5 Not too likely1 * 1 4 Not at all likely1 * 1 2 Don’t know* 0 * 1 Refused
N=3521 767 2081 673

Appendix B: Annotated Questionnaire
113
Q14 Still thinking about financial matters, are you now saving or investing any
money on a regular basis?BOOMERS
Total 18–37 38–56 57+
68 69 73 59 Yes30 30 26 37 No* 1 * 1 Don’t know1 * * 3 Refused
Q15A And now thinking about your personal relationships with family and
friends. Using a scale from 0 to 10, how would you rate your personal rela-
tionships with family and friends today. 10 is the top of the scale and 0 is
the bottom of the scale.BOOMERS
Total 18–37 38–56 57+
8.25 8.01 8.17 8.74 Mean* 1 * 1 0 – bottom of the scale* * * * 1* 1 * * 21 2 1 * 31 1 2 * 46 7 6 4 54 4 6 3 6
13 16 13 9 723 24 26 19 819 20 20 18 930 25 26 44 10 – top of the scale1 * * 2 Don’t know* * 1 * Refused
Q15B Would you say that personal relationships with family and friends are
currently better than you expected them to be at this point in your life, are
these relationships worse than you expected or are you about where you
expected to be at this point in your life?BOOMERS
Total 18–37 38–56 57+
27 33 26 19 Better12 15 12 7 Worse60 51 61 70 Where expected2 * 1 3 Don’t know* * 1 * Refused

Boomers at Midlife: The AARP Life Stage Study - Volume I Full Report
114 Prepared for AARP by Princeton Survey Research Associates
Q15C Given your current personal relationships with family and friends, what is
the best situation you could realistically hope to be in 5 years from now in
terms of your personal relationships with family and friends? Please use the
0 to 10 scale where 10 is the top of the scale and 0 is the bottom of the scale. BOOMERS
Total 18–37 38–56 57+
8.77 8.89 8.75 8.61 Mean* * * * 0 – bottom of the scale* 0 * * 1* * * 0 2* 0 * 0 3* * * 1 43 2 2 6 53 4 2 4 67 6 8 7 7
22 19 25 22 819 22 20 13 942 45 39 41 10 – top of the scale2 1 2 5 Don’t know1 * 1 1 Refused
Q15D How likely are you to achieve this goal—very likely, somewhat likely, not
too likely or not at all likely?
Based on those with hopes that were 1 or greaterBOOMERS
Total 18–37 38–56 57+
69 68 69 68 Very likely27 29 28 22 Somewhat likely2 1 1 4 Not too likely1 1 * 2 Not at all likely1 1 1 3 Don’t know* 0 0 * Refused
N=3552 765 2084 703

Appendix B: Annotated Questionnaire
115
Q16 Which of the following changes have you experienced? Have you ever (Insert)?
a gotten married for the first timeBOOMERS
Total 18–37 38–56 57+
78 57 88 95 Yes21 43 12 5 No* * * * Don’t know* * 0 0 Refused
b become a parent for the first timeBOOMERS
Total 18–37 38–56 57+
75 56 83 90 Yes25 44 17 10 No* * * * Don’t know0 0 0 0 Refused
Item c based on those who have married
c gotten a divorce BOOMERS
Total 18–37 38–56 57+
33 27 40 27 Yes67 73 60 72 No* * * 0 Don’t know* 0 0 * Refused
N=2860 421 1747 692
Item d based on those who have married
d gotten remarriedBOOMERS
Total 18–37 38–56 57+
23 12 29 23 Yes77 88 71 77 No0 0 0 0 Don’t know0 0 0 0 Refused
N=2860 421 1747 692

Boomers at Midlife: The AARP Life Stage Study - Volume I Full Report
116 Prepared for AARP by Princeton Survey Research Associates
Item e based on those who have become a parent
e had your last child move out of the houseBOOMERS
Total 18–37 38–56 57+
41 5 31 86 Yes59 95 69 14 No* 0 * * Don’t know* 0 0 * Refused
N=2871 453 1758 660
Item f based on those who have married
f had a spouse dieBOOMERS
Total 18–37 38–56 57+
11 2 5 29 Yes88 98 95 70 No* * 1 * Don’t know0 0 0 0 Refused
N=2860 421 1747 692
Item g based on those who have become a parent
g become a grandparentBOOMERS
Total 18–37 38–56 57+
43 3 35 91 Yes57 97 65 9 No* 0 * 0 Don’t know0 0 0 0 Refused
N=2871 453 1758 660
Item h based on those who have become a parent
h had an adult child move back homeBOOMERS
Total 18–37 38–56 57+
22 1 26 34 Yes78 99 74 66 No* 0 * * Don’t know* 0 * 0 Refused
N=2871 453 1758 660

Appendix B: Annotated Questionnaire
117
i moved back into your parents’ homeBOOMERS
Total 18–37 38–56 57+
20 27 21 9 Yes80 72 79 91 No* * * * Don’t know0 0 0 0 Refused
Item j based on those who have become a parent
j provided child care or daycare to a grandchild on a regular basisBOOMERS
Total 18–37 38–56 57+
15 3 14 26 Yes85 97 86 73 No* 0 * 1 Don’t know0 0 0 0 Refused
N=2871 453 1758 660
k had your father dieBOOMERS
Total 18–37 38–56 57+
48 16 49 93 Yes51 82 51 7 No1 1 * * Don’t know* * 0 0 Refused
l had your mother dieBOOMERS
Total 18–37 38–56 57+
36 7 30 86 Yes64 92 70 14 No* * * * Don’t know* * 0 0 Refused

Boomers at Midlife: The AARP Life Stage Study - Volume I Full Report
118 Prepared for AARP by Princeton Survey Research Associates
Q17A Turning to the subject of your religious or spiritual life. Using a scale from
0 to 10, how would you rate your religious or spiritual life today. 10 is the
top of the scale and 0 is the bottom of the scale.BOOMERS
Total 18–37 38–56 57+
6.64 6.00 6.79 7.34 Mean3 5 3 2 0 – bottom of the scale1 2 1 1 13 5 2 2 24 5 4 2 35 7 4 3 4
15 17 14 14 512 14 12 7 614 14 17 10 717 15 19 17 89 6 9 15 9
15 10 15 23 10 – top of the scale1 1 1 3 Don’t know* * * * Refused
Q17B Would you say your religious or spiritual life is better than you expected it
to be at this point in your life, worse than you expected or are you where
you expected to be at this point in your life?BOOMERS
Total 18–37 38–56 57+
24 21 26 26 Better18 26 17 8 Worse55 51 54 61 Where expected3 2 3 3 Don’t know1 1 * 1 Refused

Appendix B: Annotated Questionnaire
119
Q17C Given your current religious or spiritual life, what is the best religious or
spiritual condition you could realistically hope to be in 5 years from now?
Please use the 0 to 10 scale where 10 is the top of the scale and 0 is the bot-
tom of the scale. BOOMERS
Total 18–37 38–56 57+
8.10 8.01 8.16 8.16 Mean1 1 2 1 0 – bottom of the scale* * * 1 11 1 1 * 21 2 1 1 31 1 1 1 48 7 7 9 54 3 4 3 6
10 11 9 10 722 25 22 18 813 12 14 12 935 32 35 36 10 – top of the scale4 3 2 7 Don’t know* * 1 1 Refused
Q17D How likely are you to achieve this goal—very likely, somewhat likely, not
too likely or not at all likely?
Based on those with hopes that were 1 or greaterBOOMERS
Total 18–37 38–56 57+
59 53 60 66 Very likely36 40 37 28 Somewhat likely3 4 2 3 Not too likely2 2 1 2 Not at all likely1 * * 1 Don’t know* 0 * * Refused
N=3487 751 2044 692

Boomers at Midlife: The AARP Life Stage Study - Volume I Full Report
120 Prepared for AARP by Princeton Survey Research Associates
Q18A Turning to the subject of physical health. Using a scale from 0 to 10, how
would you rate your overall physical health today. 10 is the top of the scale
and 0 is the bottom of the scale.BOOMERS
Total 18–37 38–56 57+
7.05 7.13 6.94 7.08 Mean1 * 1 1 0 – bottom of the scale* * 1 1 11 1 1 1 22 2 3 1 34 2 5 5 4
13 12 13 15 511 14 10 9 622 23 24 17 724 23 24 25 811 13 10 11 910 9 9 12 10 – top of the scale1 * * 2 Don’t know* 0 * 0 Refused
Q18B Would you say you are in better physical health than you expected to be at
this point in your life, worse health than you expected or are you where you
expected to be at this point in your life?BOOMERS
Total 18–37 38–56 57+
24 20 21 33 Better29 32 33 20 Worse45 48 44 42 Where expected2 1 1 5 Don’t know* 0 * * Refused
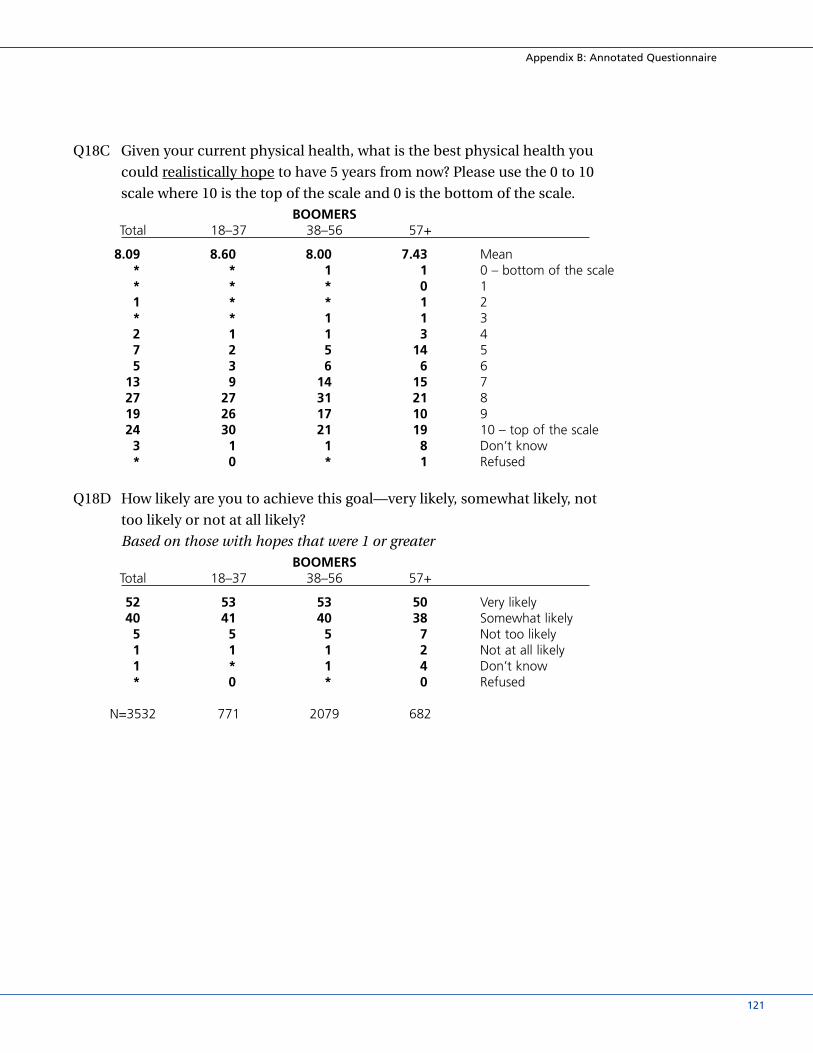
Appendix B: Annotated Questionnaire
121
Q18C Given your current physical health, what is the best physical health you
could realistically hope to have 5 years from now? Please use the 0 to 10
scale where 10 is the top of the scale and 0 is the bottom of the scale. BOOMERS
Total 18–37 38–56 57+
8.09 8.60 8.00 7.43 Mean* * 1 1 0 – bottom of the scale* * * 0 11 * * 1 2* * 1 1 32 1 1 3 47 2 5 14 55 3 6 6 6
13 9 14 15 727 27 31 21 819 26 17 10 924 30 21 19 10 – top of the scale3 1 1 8 Don’t know* 0 * 1 Refused
Q18D How likely are you to achieve this goal—very likely, somewhat likely, not
too likely or not at all likely?
Based on those with hopes that were 1 or greaterBOOMERS
Total 18–37 38–56 57+
52 53 53 50 Very likely40 41 40 38 Somewhat likely5 5 5 7 Not too likely1 1 1 2 Not at all likely1 * 1 4 Don’t know* 0 * 0 Refused
N=3532 771 2079 682

Boomers at Midlife: The AARP Life Stage Study - Volume I Full Report
122 Prepared for AARP by Princeton Survey Research Associates
Q19 Now I'm going to read a list of things some people do to stay healthy.
Do you (Insert), or not?
Items were rotated
a exercise to stay fitBOOMERS
Total 18–37 38–56 57+
71 74 66 73 Yes29 26 34 26 No1 * 1 1 Don’t know0 0 0 0 Refused
b eat a balanced dietBOOMERS
Total 18–37 38–56 57+
67 58 69 78 Yes32 41 30 21 No1 * 1 1 Don’t know* 0 0 * Refused
c get routine health careBOOMERS
Total 18–37 38–56 57+
74 66 76 83 Yes25 34 23 17 No* 1 * * Don’t know0 0 0 0 Refused
d take vitaminsBOOMERS
Total 18–37 38–56 57+
58 49 59 70 Yes42 51 40 30 No* * * * Don’t know0 0 0 0 Refused

Appendix B: Annotated Questionnaire
123
Q20 Which of the following changes have you experienced? Have you ever (Insert)?
Items were rotated
a experienced a mid-life crisisBOOMERS
Total 18–37 38–56 57+
20 10 24 27 Yes77 87 73 67 No4 3 3 5 Don’t know* 0 * * Refused
b survived a major illnessBOOMERS
Total 18–37 38–56 57+
29 19 29 46 Yes70 81 71 53 No1 1 * 1 Don’t know0 0 0 0 Refused
c made major changes in your diet due to a medical conditionBOOMERS
Total 18–37 38–56 57+
29 20 28 42 Yes71 80 71 58 No* 0 * * Don’t know* 0 * * Refused
Q21A Now thinking about the subject of mental health. Using a scale from 0 to
10, how would you rate your overall mental health today. 10 is the top of
the scale and 0 is the bottom of the scale.BOOMERS
Total 18–37 38–56 57+
8.31 8.25 8.25 8.48 Mean* * * 1 0 – bottom of the scale* 1 * * 1* * * * 21 1 1 * 32 2 1 1 45 5 5 5 55 5 4 4 6
10 10 12 7 727 25 29 26 819 20 20 18 931 31 27 36 10 – top of the scale* * * 1 Don’t know* 0 * * Refused

Boomers at Midlife: The AARP Life Stage Study - Volume I Full Report
124 Prepared for AARP by Princeton Survey Research Associates
Q21B Would you say your mental health is better than you expected it to be at
this point in your life, worse than you expected or is your mental health
what you expected it to be at this point in your life?BOOMERS
Total 18–37 38–56 57+
25 26 23 27 Better10 11 13 7 Worse62 61 62 62 Where expected3 2 2 4 Don’t know* * * * Refused
Q21C Given your current mental health, what is the best mental health you could
realistically hope to have 5 years from now? Please use the 0 to 10 scale
where 10 is the top of the scale and 0 is the bottom of the scale. BOOMERS
Total 18–37 38–56 57+
8.80 9.03 8.88 8.31 Mean* * * 1 0 – bottom of the scale* 1 * * 1* * * 0 2* * * * 3* * * * 43 1 2 8 52 1 2 5 66 5 6 8 7
22 20 22 25 821 22 24 14 942 49 42 32 10 – top of the scale2 1 1 6 Don’t know* 0 * * Refused
Q21D How likely are you to achieve this goal—very likely, somewhat likely, not
too likely or not at all likely?
Based on those with hopes that were 1 or greaterBOOMERS
Total 18–37 38–56 57+
69 72 69 62 Very likely27 25 28 31 Somewhat likely2 2 2 3 Not too likely1 * * 1 Not at all likely1 * 1 3 Don’t know* 0 0 * Refused
N=3551 768 2089 694

Appendix B: Annotated Questionnaire
125
Q22 How old would you say you feel? Do you feel younger than your age, older
than your age, or would you say you feel your age?BOOMERS
Total 18–37 38–56 57+
51 36 58 60 Feel younger15 26 12 4 Feel older33 36 30 32 Feel your age1 1 1 3 Don’t know* 0 * * Refused
Q23A Now turning to the subject of your work or career. Using a scale from 0 to
10, how would you rate your work or career today. 10 is the top of the scale
and 0 is the bottom of the scale.
Based on those who are employed or self employedBOOMERS
Total 18–37 38–56 57+
7.17 6.94 7.27 7.68 Mean1 2 1 1 0 – bottom of the scale* 1 * 0 11 2 1 0 22 2 2 * 33 3 3 4 4
12 14 10 15 511 11 12 5 620 22 20 13 722 19 26 19 810 9 10 11 915 13 15 27 10 – top of the scale1 1 * 4 Don’t know* * * 1 Refused
N=2420 572 1646 202
Q23B Would you say your work or career is better than you expected it to be at
this point in your life, worse than you expected or are you where you
expected to be at this point in your life?
Based on those who are employed or self employedBOOMERS
Total 18–37 38–56 57+
33 33 34 34 Better25 26 26 12 Worse40 40 39 46 Where expected2 1 1 6 Don’t know* 1 * 2 Refused
N=2420 572 1646 202

Boomers at Midlife: The AARP Life Stage Study - Volume I Full Report
126 Prepared for AARP by Princeton Survey Research Associates
Q23C Given your current work or career, what is the best work or career situation
you could realistically hope to have 5 years from now? Please use the 0 to
10 scale where 10 is the top of the scale and 0 is the bottom of the scale.
Based on those who are employed or self employedBOOMERS
Total 18–37 38–56 57+
8.51 8.71 8.44 7.88 Mean1 * * 4 0 – bottom of the scale* 0 * 0 1* 0 * 0 2* * * 0 31 1 1 2 44 3 4 12 52 2 3 2 69 8 11 8 7
26 25 29 13 819 21 18 11 934 38 32 34 10 – top of the scale3 1 2 11 Don’t know1 * * 3 Refused
N=2420 572 1646 202
Q23D How likely are you to achieve this goal—very likely, somewhat likely, not
too likely or not at all likely?
Based on those who are employed or self employed with hopes that were
1 or greaterBOOMERS
Total 18–37 38–56 57+
63 67 59 72 Very likely33 30 38 20 Somewhat likely2 2 2 6 Not too likely1 * 1 2 Not at all likely* * * 0 Don’t know* 0 0 * Refused
N=2324 562 1591 171
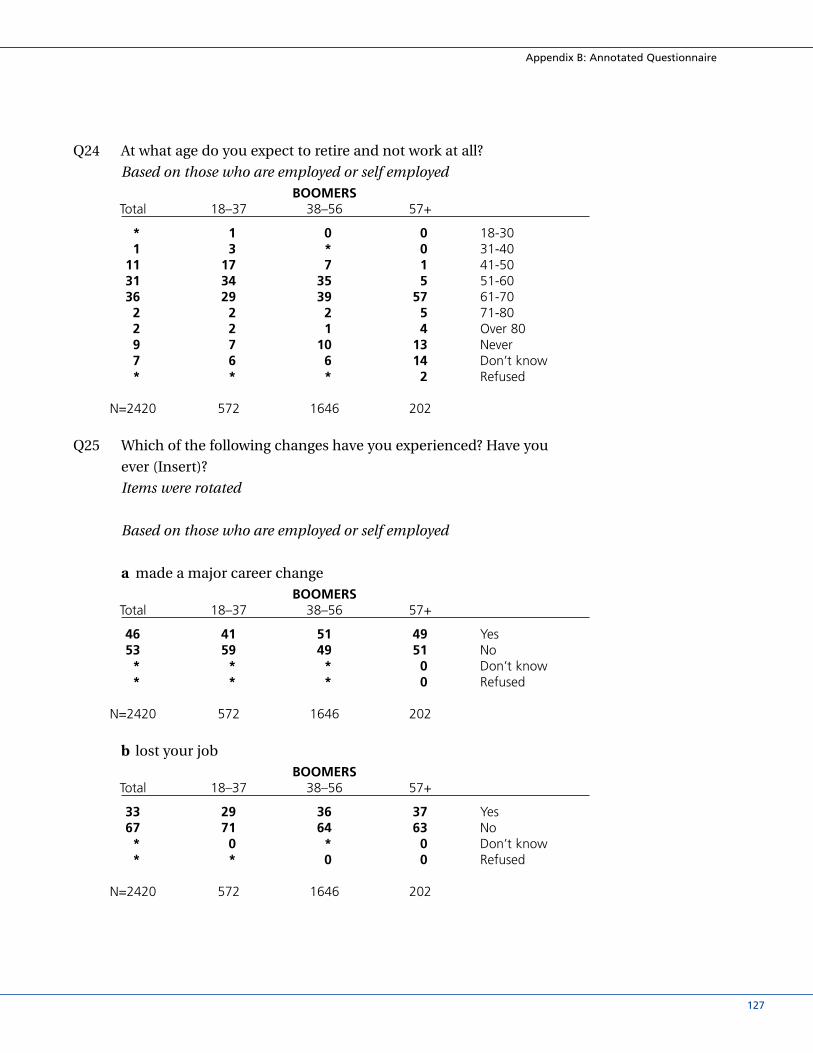
Appendix B: Annotated Questionnaire
127
Q24 At what age do you expect to retire and not work at all?
Based on those who are employed or self employedBOOMERS
Total 18–37 38–56 57+
* 1 0 0 18-301 3 * 0 31-40
11 17 7 1 41-5031 34 35 5 51-6036 29 39 57 61-702 2 2 5 71-802 2 1 4 Over 809 7 10 13 Never7 6 6 14 Don’t know* * * 2 Refused
N=2420 572 1646 202
Q25 Which of the following changes have you experienced? Have you
ever (Insert)?
Items were rotated
Based on those who are employed or self employed
a made a major career changeBOOMERS
Total 18–37 38–56 57+
46 41 51 49 Yes53 59 49 51 No* * * 0 Don’t know* * * 0 Refused
N=2420 572 1646 202
b lost your jobBOOMERS
Total 18–37 38–56 57+
33 29 36 37 Yes67 71 64 63 No* 0 * 0 Don’t know* * 0 0 Refused
N=2420 572 1646 202

Boomers at Midlife: The AARP Life Stage Study - Volume I Full Report
128 Prepared for AARP by Princeton Survey Research Associates
Q26 If you had your choice, how long would you like to live? That is until what age?BOOMERS
Total 18–37 38–56 57+
91.7 89.0 93.3 93.5 Mean* 1 * 0 30 and under* 1 * 0 31-401 2 * 0 41-502 3 1 1 51-605 7 5 2 61-70
20 19 23 18 71-8029 29 30 29 81-9018 18 20 16 91-1007 8 7 5 Over 1005 6 5 5 Forever
12 8 8 23 Don’t know1 1 1 3 Refused
Q27 If you had to guess, how long do you think you will live? That is until what age?BOOMERS
Total 18–37 38–56 57+
84.4 83.9 81.3 91.2 Mean* 1 0 0 30 and under* 1 * 0 31-402 3 1 0 41-504 5 5 * 51-60
12 15 14 5 61-7028 25 33 23 71-8029 29 26 33 81-9010 10 9 10 91-1002 3 2 2 Over 100
13 8 10 25 Don’t know1 * * 2 Refused
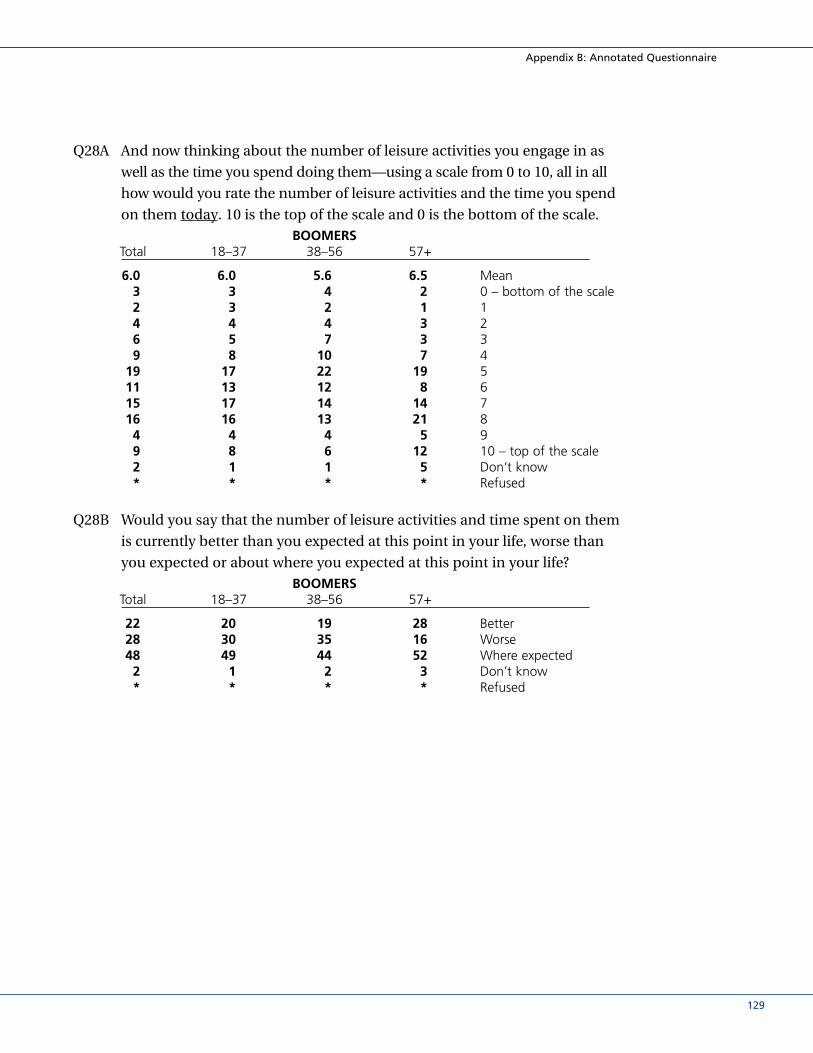
Appendix B: Annotated Questionnaire
129
Q28A And now thinking about the number of leisure activities you engage in as
well as the time you spend doing them—using a scale from 0 to 10, all in all
how would you rate the number of leisure activities and the time you spend
on them today. 10 is the top of the scale and 0 is the bottom of the scale.BOOMERS
Total 18–37 38–56 57+
6.0 6.0 5.6 6.5 Mean3 3 4 2 0 – bottom of the scale2 3 2 1 14 4 4 3 26 5 7 3 39 8 10 7 4
19 17 22 19 511 13 12 8 615 17 14 14 716 16 13 21 84 4 4 5 99 8 6 12 10 – top of the scale2 1 1 5 Don’t know* * * * Refused
Q28B Would you say that the number of leisure activities and time spent on them
is currently better than you expected at this point in your life, worse than
you expected or about where you expected at this point in your life?BOOMERS
Total 18–37 38–56 57+
22 20 19 28 Better28 30 35 16 Worse48 49 44 52 Where expected2 1 2 3 Don’t know* * * * Refused

Boomers at Midlife: The AARP Life Stage Study - Volume I Full Report
130 Prepared for AARP by Princeton Survey Research Associates
Q28C Given the number of leisure activities and the time you currently spend on
leisure activities, what is the best situation you could realistically hope to
be in 5 years from now? Please use the 0 to 10 scale where 10 is the top of
the scale and 0 is the bottom of the scale. BOOMERS
Total 18–37 38–56 57+
7.6 8.0 7.6 7.1 Mean1 * 1 1 0 – bottom of the scale* * * * 11 1 * 1 21 * 1 1 32 2 2 3 4
11 7 11 19 58 8 8 8 6
16 17 18 13 726 26 27 25 810 12 11 6 920 26 19 15 10 – top of the scale3 1 2 7 Don’t know* * * * Refused
Q28D How likely are you to achieve this goal—very likely, somewhat likely, not
too likely or not at all likely?
Based on those with hopes that were 1 or greaterBOOMERS
Total 18–37 38–56 57+
51 52 48 51 Very likely43 44 46 37 Somewhat likely4 3 4 6 Not too likely1 1 1 2 Not at all likely1 * 1 3 Don’t know* 0 * * Refused
N=3501 760 2057 684

Appendix B: Annotated Questionnaire
131
Q29 Now imagine you could be any age. What age would you like to be?BOOMERS
Total 18–37 38–56 57+
32.8 24.1 32.6 46.3 Mean8 13 5 5 Less than 18
23 40 17 6 18-2424 28 27 12 25-3021 14 27 21 31-409 1 14 14 41-505 1 5 12 51-603 * 1 9 61-703 * * 11 71-801 * * 2 81-96* * * 1 97 or older2 2 1 5 Don’t know1 * * 2 Refused
Q30 All in all, how much control do you feel you have over your (Insert)—
a great deal, a fair amount, not too much or no control at all?
List items were rotated
a personal financial situationBOOMERS
Total 18–37 38–56 57+
42 39 41 47 A great deal44 47 44 42 A fair amount9 10 10 5 Not too much4 3 4 5 No control at all1 1 * 1 Don’t know* * * * Refused
b physical healthBOOMERS
Total 18–37 38–56 57+
52 61 50 41 A great deal39 34 40 45 A fair amount6 4 7 8 Not too much3 2 3 4 No control at all1 * * 2 Don’t know* * * * Refused
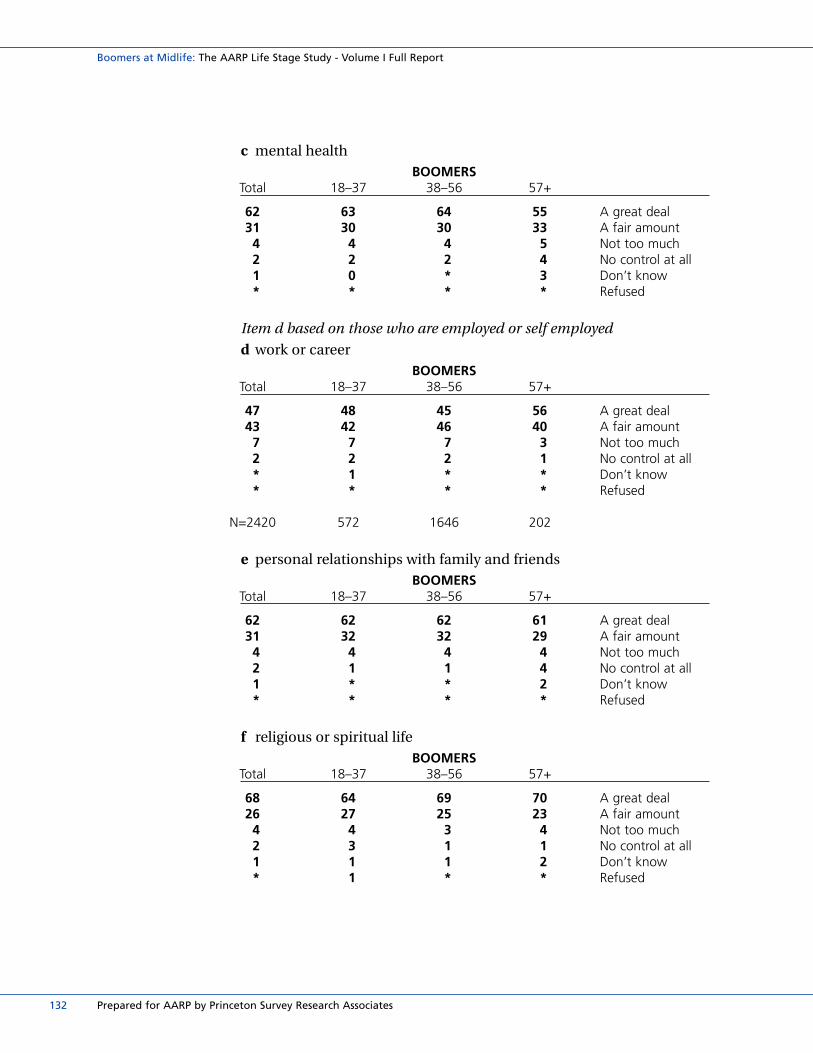
Boomers at Midlife: The AARP Life Stage Study - Volume I Full Report
132 Prepared for AARP by Princeton Survey Research Associates
c mental healthBOOMERS
Total 18–37 38–56 57+
62 63 64 55 A great deal31 30 30 33 A fair amount4 4 4 5 Not too much2 2 2 4 No control at all1 0 * 3 Don’t know* * * * Refused
Item d based on those who are employed or self employed
d work or careerBOOMERS
Total 18–37 38–56 57+
47 48 45 56 A great deal43 42 46 40 A fair amount7 7 7 3 Not too much2 2 2 1 No control at all* 1 * * Don’t know* * * * Refused
N=2420 572 1646 202
e personal relationships with family and friendsBOOMERS
Total 18–37 38–56 57+
62 62 62 61 A great deal31 32 32 29 A fair amount4 4 4 4 Not too much2 1 1 4 No control at all1 * * 2 Don’t know* * * * Refused
f religious or spiritual lifeBOOMERS
Total 18–37 38–56 57+
68 64 69 70 A great deal26 27 25 23 A fair amount4 4 3 4 Not too much2 3 1 1 No control at all1 1 1 2 Don’t know* 1 * * Refused
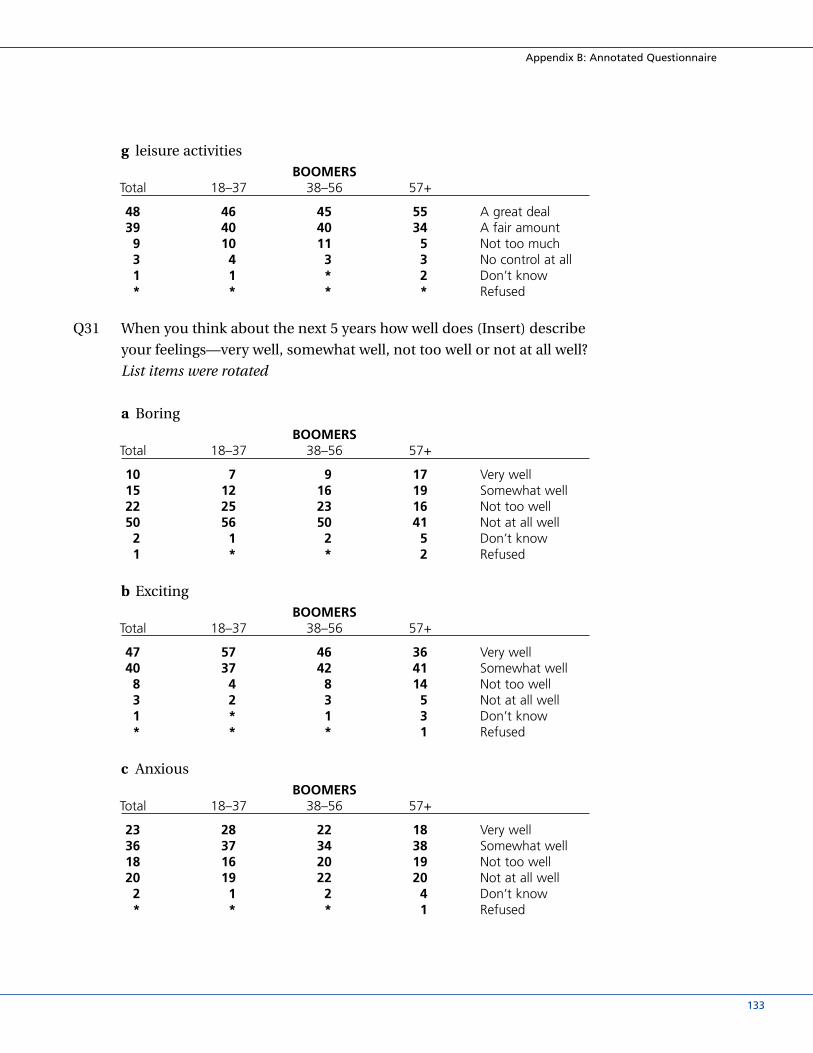
Appendix B: Annotated Questionnaire
133
g leisure activitiesBOOMERS
Total 18–37 38–56 57+
48 46 45 55 A great deal39 40 40 34 A fair amount9 10 11 5 Not too much3 4 3 3 No control at all1 1 * 2 Don’t know* * * * Refused
Q31 When you think about the next 5 years how well does (Insert) describe
your feelings—very well, somewhat well, not too well or not at all well?
List items were rotated
a BoringBOOMERS
Total 18–37 38–56 57+
10 7 9 17 Very well15 12 16 19 Somewhat well22 25 23 16 Not too well50 56 50 41 Not at all well2 1 2 5 Don’t know1 * * 2 Refused
b ExcitingBOOMERS
Total 18–37 38–56 57+
47 57 46 36 Very well40 37 42 41 Somewhat well8 4 8 14 Not too well3 2 3 5 Not at all well1 * 1 3 Don’t know* * * 1 Refused
c AnxiousBOOMERS
Total 18–37 38–56 57+
23 28 22 18 Very well36 37 34 38 Somewhat well18 16 20 19 Not too well20 19 22 20 Not at all well2 1 2 4 Don’t know* * * 1 Refused

Boomers at Midlife: The AARP Life Stage Study - Volume I Full Report
134 Prepared for AARP by Princeton Survey Research Associates
d Fulfilling BOOMERS
Total 18–37 38–56 57+
51 55 49 49 Very well39 37 42 36 Somewhat well5 4 4 6 Not too well3 3 3 3 Not at all well2 1 1 5 Don’t know* * * 1 Refused
e ConfidentBOOMERS
Total 18–37 38–56 57+
58 61 55 57 Very well35 34 39 31 Somewhat well4 3 4 4 Not too well2 1 2 3 Not at all well1 * 1 4 Don’t know* * * * Refused
f UncertainBOOMERS
Total 18–37 38–56 57+
12 11 12 14 Very well35 34 36 36 Somewhat well23 29 21 19 Not too well26 25 28 26 Not at all well3 1 2 5 Don’t know* * * 1 Refused
g HopefulBOOMERS
Total 18–37 38–56 57+
65 72 64 57 Very well30 24 32 34 Somewhat well2 3 2 3 Not too well2 1 2 2 Not at all well1 * 1 3 Don’t know* * * 1 Refused

Appendix B: Annotated Questionnaire
135
h StressfulBOOMERS
Total 18–37 38–56 57+
21 25 21 16 Very well41 42 45 34 Somewhat well18 17 18 20 Not too well17 15 15 25 Not at all well2 1 1 4 Don’t know* * * * Refused
Q32 What, if anything, is keeping you from achieving what you really want
out of life? BOOMERS
Total 18–37 38–56 57+
15 19 17 6 Unmotivated/Lazy/Self14 14 16 10 Finances8 3 7 16 Health6 7 7 3 Family and Friends4 6 4 2 Lack of time3 1 1 7 Age2 4 2 1 Education2 3 2 1 Work/Career7 9 6 5 Other
38 34 35 49 Nothing1 1 1 1 Don’t know* * * * Refused
D2 Record sexBOOMERS
Total 18–37 38–56 57+
47 48 49 43 Male53 52 51 57 Female
D3 In what year were you born?BOOMERS
Total 18–37 38–56 57+
25 0 0 100 1905-194512 0 31 0 1946-195213 0 33 0 1953-195814 0 36 0 1959-196437 100 0 0 1965-1984
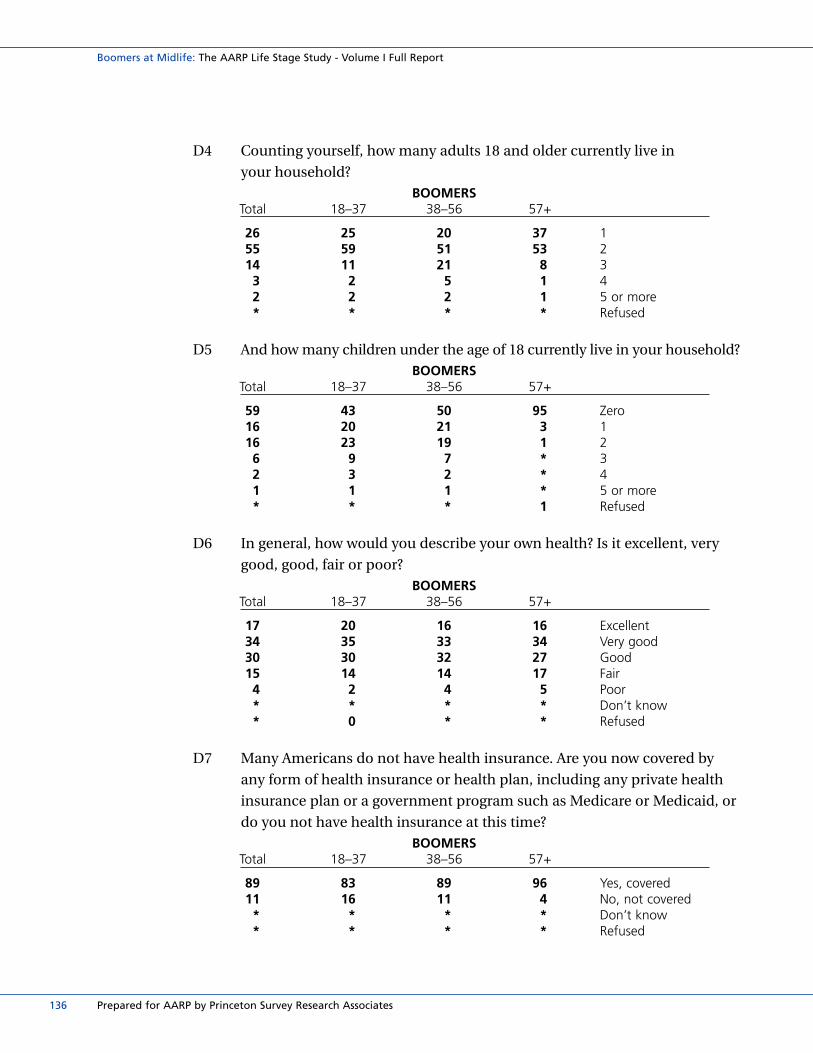
Boomers at Midlife: The AARP Life Stage Study - Volume I Full Report
136 Prepared for AARP by Princeton Survey Research Associates
D4 Counting yourself, how many adults 18 and older currently live in
your household?BOOMERS
Total 18–37 38–56 57+
26 25 20 37 155 59 51 53 214 11 21 8 33 2 5 1 42 2 2 1 5 or more* * * * Refused
D5 And how many children under the age of 18 currently live in your household?BOOMERS
Total 18–37 38–56 57+
59 43 50 95 Zero16 20 21 3 116 23 19 1 26 9 7 * 32 3 2 * 41 1 1 * 5 or more* * * 1 Refused
D6 In general, how would you describe your own health? Is it excellent, very
good, good, fair or poor?BOOMERS
Total 18–37 38–56 57+
17 20 16 16 Excellent34 35 33 34 Very good30 30 32 27 Good15 14 14 17 Fair4 2 4 5 Poor* * * * Don’t know* 0 * * Refused
D7 Many Americans do not have health insurance. Are you now covered by
any form of health insurance or health plan, including any private health
insurance plan or a government program such as Medicare or Medicaid, or
do you not have health insurance at this time? BOOMERS
Total 18–37 38–56 57+
89 83 89 96 Yes, covered11 16 11 4 No, not covered* * * * Don’t know* * * * Refused
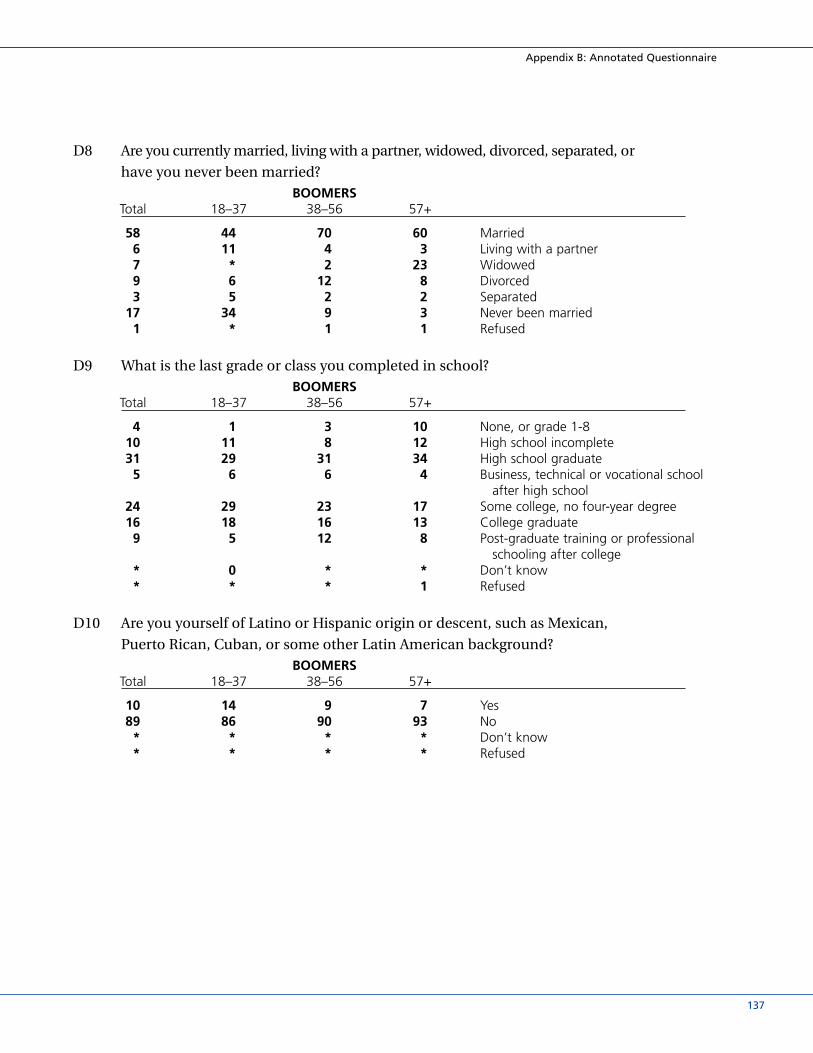
Appendix B: Annotated Questionnaire
137
D8 Are you currently married, living with a partner, widowed, divorced, separated, or
have you never been married?BOOMERS
Total 18–37 38–56 57+
58 44 70 60 Married6 11 4 3 Living with a partner7 * 2 23 Widowed9 6 12 8 Divorced3 5 2 2 Separated
17 34 9 3 Never been married1 * 1 1 Refused
D9 What is the last grade or class you completed in school?BOOMERS
Total 18–37 38–56 57+
4 1 3 10 None, or grade 1-810 11 8 12 High school incomplete31 29 31 34 High school graduate 5 6 6 4 Business, technical or vocational school
after high school24 29 23 17 Some college, no four-year degree16 18 16 13 College graduate9 5 12 8 Post-graduate training or professional
schooling after college* 0 * * Don’t know* * * 1 Refused
D10 Are you yourself of Latino or Hispanic origin or descent, such as Mexican,
Puerto Rican, Cuban, or some other Latin American background?BOOMERS
Total 18–37 38–56 57+
10 14 9 7 Yes89 86 90 93 No* * * * Don’t know* * * * Refused

Boomers at Midlife: The AARP Life Stage Study - Volume I Full Report
138 Prepared for AARP by Princeton Survey Research Associates
D11 What is your race? (If Latino ask:) Are you white Latino, black Latino or some
other race? (Else:) Are you white, African American or black, Asian
or some other race?BOOMERS
Total 18–37 38–56 57+
80 75 81 85 White/White Latino12 14 12 9 African American/Black/Black Latino2 3 1 * Asian6 7 5 5 Other* 1 * * Don’t know* * * * Refused
D12 Last year, that is in 2001, what was your total household income from all sources
before taxes? Was it over or under $25,000?BOOMERS
Total 18–37 38–56 57+
22 24 14 31 Under $25,00067 66 78 50 Over $25,0005 5 3 6 Don’t know7 5 5 13 Refused
D13 Now just stop me when I get to the right category. Was your income ...
Responses were read
Based on those with an income less than $25,000BOOMERS
Total 18–37 38–56 57+
25 29 25 22 Less than $10,00024 28 23 20 $10,000 to under $15,00020 23 25 13 $15,000 to under $20,00023 18 21 31 $20,000 to under $25,0006 2 4 12 Don’t know2 * 3 2 Refused
N=942 219 433 290

Appendix B: Annotated Questionnaire
139
D14 Now just stop me when I get to the right category. Was your income...
Responses were read
Based on those with an income more than $25,000BOOMERS
Total 18–37 38–56 57+
8 11 6 9 $25,000 to under $30,00012 17 8 11 $30,000 to under $35,00011 12 9 12 $35,000 to under $40,00013 12 13 14 $40,000 to under $50,00021 21 23 19 $50,000 to under $75,00028 22 34 24 $75,000 or more2 2 1 3 Don’t know5 3 5 8 Refused
N=2377 498 1541 338
D15 Finally, would you be willing to talk with a reporter about your opinions about
the issues in this survey?BOOMERS
Total 18–37 38–56 57+
30 32 35 19 Yes68 66 63 79 No2 2 2 2 Don’t know* * * * Refused

Boomers at Midlife: The AARP Life Stage Study - Volume I Full Report
140 Prepared for AARP by Princeton Survey Research Associates

141
Critical Life Events by Generation
Which of the following changes have you experienced?
Boomers% who have... 18–37 N 38–56 N 57+ N
Gotten married for the first time 57 781 88 2127 95 758Become a parent for the first time 56 781 83 2127 90 758Gotten a divorce 27 421 40 1747 27 692Gotten remarried 12 421 29 1747 23 692Had your last child move out of the house 5 453 31 1758 86 660Had a spouse die 2 421 5 1747 29 692Become a grandparent 3 453 35 1758 91 660Had an adult child move back home 1 453 26 1758 34 660Moved back into your parents’ home 27 781 21 2127 9 758Provided child care or daycare to a
grandchild on a regular basis 3 453 14 1758 26 660Had your father die 16 781 49 2127 93 758Had your mother die 7 781 30 2127 86 758Experienced a mid-life crisis 10 781 24 2127 27 758Survived a major illness 19 781 29 2127 46 758Made major changes in your diet
due to a medical condition 20 781 28 2127 42 758Made a major career change 41 572 51 1646 49 202Lost your job 29 572 36 1646 37 202
* Asked only of those employed either full or part-time
Appendix C: Table of Critical Life Events
Boomers at Midlife
Prepared by Princeton Survey Research Associates for AARP
November 2002
Appendix C: Table of Critical Life Events

Boomers at Midlife: The AARP Life Stage Study - Volume I Full Report
142 Prepared for AARP by Princeton Survey Research Associates

Appendix D: Methodological Report for Focus Groups
143
Appendix D: Methodological Report for Focus Groups
Boomers at Midlife
Prepared by Princeton Survey Research Associates for AARP
November 2002
AARP commissioned PSRA to conduct 12 focus group discussions to listen to how
boomers and older Americans talk about a number of life issues. These discus-
sions were designed to provide greater insights into several of the topics covered in
the national survey. We were particularly interested in hearing respondents talk
about how they interpreted the survey questions as well as the survey results.
The structure of the group discussion was straight-forward. Participants answered
several short survey questions and then discussed their interpretation of the ques-
tions and what they were thinking as they answered the questions. Participants
were then presented with the boomer and older adult national findings.
Participants were asked to comment on the national results and share their
thoughts about the answers given by people in their age group and those in the
other age group. This sequence of discussion revolved around four main topics:
• the importance of the seven life areas;
• satisfaction with the major life areas;
• control over the major life areas; and,
• near-term ambitions and barriers to achieving near-term goals.
The complete moderator’s guide to these discussions is located in Appendix C.
Focus group sessions were conducted in Baltimore, Maryland; Charlotte, North
Carolina; and Kansas City, Missouri. In each city, a total of four group discussions
were conducted over a span of two nights. Each night the first group discussion
took place at 6:00 p.m. with the older adults age 57 to 75, and the second group
usually started at 8:00 p.m. with the boomers. These groups of approximately 10
individuals comprised a mix of both male and female, and white, African
American, and Hispanic participants. All 12 sessions were conducted between July
17 and July 25, 2002 by Princeton Survey Research Associates. Exact dates and a
more complete demographic profile of the participants in each group follows.

Group 2
Respondents age 38–56July 17, 2002Baltimore, MD
Respondent Age Gender Employment Race/Ethnicity Income
Respondent #1 54 Female Employed black/African American 30–45k
Respondent #2 45 Female Employed black/African American 45–70k
Respondent #3 48 Female Employed black/African American 10–30k
Respondent #4 44 Female Employed black/African American 30–45k
Respondent #5 49 Female Employed white 45–70k
Respondent #6 50 Male Employed white 70k or more
Respondent #7 46 Male Employed black/African American 45–70k
Respondent #8 49 Male Employed white 45–70k
Respondent #9 56 Male Self-employed white 30–45k
Respondent #10 53 Male Self-employed black/African American 70k or more
Boomers at Midlife: The AARP Life Stage Study - Volume I Full Report
144 Prepared for AARP by Princeton Survey Research Associates
Group 1
Respondents age 57–75July 17, 2002Baltimore, MD
Respondent Age Gender Employment Race/Ethnicity Income
Respondent #1 59 Male Employed white 45–70k
Respondent #2 64 Female Employed black/African American 10–30k
Respondent #3 65 Female Retired and not working black/African American 10–30k
Respondent #4 69 Male Retired and not working white 30–45k
Respondent #5 74 Male Retired and not working white 30–45k
Respondent #6 69 Female Retired and not working white 10–30k
Respondent #7 62 Female Retired and not working black/African American 70k or more

Appendix D: Methodological Report for Focus Groups
145
Group 3
Respondents age 57–75July 18, 2002Baltimore, MD
Respondent Age Gender Employment Race/Ethnicity Income
Respondent #1 63 Female Retired and not working black/African American 10–30k
Respondent #2 63 Male Employed white 45–70k
Respondent #3 67 Female Retired and not working black/African American 10–30k
Respondent #4 64 Female Not in the labor force black/African American 10–30k
Respondent #5 57 Female Retired and not working white 70k or more
Respondent #6 62 Male Retired and not working black/African American 45–70k
Respondent #7 74 Male Retired and not working white 45–70k
Respondent #8 69 Female Retired and not working white 10–30k
Respondent #9 62 Male Employed white 70k or more
Respondent #10 72 Male Retired and not working white 45–70k
Respondent #11 69 Male Retired and not working black/African American 10–30k
Group 4
Respondents age 38–56July 18, 2002Baltimore, MD
Respondent Age Gender Employment Race/Ethnicity Income
Respondent #1 53 Female Employed black/African American 30–45k
Respondent #2 45 Male Employed black/African American 45–70k
Respondent #3 45 Female Employed black/African American 30–45k
Respondent #4 40 Male Employed black/African American 45–70k
Respondent #5 39 Male Employed white 70k or more
Respondent #6 44 Female Employed white 45–70k
Respondent #7 38 Female Not in the labor force white 45–70k
Respondent #8 48 Male Employed white 45–70k
Respondent #9 45 Female Employed black/African American 10–30k
Respondent #10 39 Female Employed black/African American 70k or more

Boomers at Midlife: The AARP Life Stage Study - Volume I Full Report
146 Prepared for AARP by Princeton Survey Research Associates
Group 5
Respondents age 57–75July 22, 2002Charlotte, NC
Respondent Age Gender Employment Race/Ethnicity Income
Respondent #1 73 Male Retired white 70k or more
Respondent #2 66 Male Retired white 70k or more
Respondent #3 67 Female Not in labor force white 70k or more
Respondent #4 74 Female Retired white Less than 10k
Respondent #5 58 Female Employed white 45–70k
Respondent #6 72 Female Retired white 45–70k
Respondent #7 63 Male Self-employed white 30–45k
Respondent #8 63 Male Self-employed white 30–45k
Respondent #9 66 Male Retired white 70k or more
Respondent #10 57 Female Employed black/African American 30–45k
Group 6
Respondents age 38–56July 22, 2002Charlotte, NC
Respondent Age Gender Employment Race/Ethnicity Income
Respondent #1 38 Female Employed white 45–70k
Respondent #2 52 Male Employed white 70k or more
Respondent #3 49 Female Not in labor force white 10–30k
Respondent #4 42 Female Not in labor force white 30–45k
Respondent #5 40 Female Employed white 45–70k
Respondent #6 52 Male Employed white 45–70k
Respondent #7 55 Female Employed black/African American 30–45k
Respondent #8 38 Male Employed white 70k or more
Respondent #9 41 Male Employed white 70k or more
Respondent #10 45 Male Retired black/African American 45–70k

Appendix D: Methodological Report for Focus Groups
147
Group 7
Respondents age 57–75July 23, 2002Charlotte, NC
Respondent Age Gender Employment Race/Ethnicity Income
Respondent #1 72 Female Retired black/African American Less than 10k
Respondent #2 64 Female Employed black/African American 10–30k
Respondent #3 63 Male Employed white 70k or more
Respondent #4 68 Male Retired white 70k or more
Respondent #5 69 Female Retired white 45–70k
Respondent #6 72 Male Retired white 30–45k
Respondent #7 70 Male Retired white 45–70k
Respondent #8 66 Female Retired white 10–30k
Respondent #9 57 Female Employed white 70k or more
Respondent #10 57 Male Employed black/African American 70k or more
Group 8
Respondents age 38–56July 23, 2002Charlotte, NC
Respondent Age Gender Employment Race/Ethnicity Income
Respondent #1 47 Male Employed white Less than 10k
Respondent #2 51 Female Employed black/African American 10–30k
Respondent #3 49 Male Employed white 70k or more
Respondent #4 42 Female Employed black/African American 70k or more
Respondent #5 45 Female Employed black/African American 45–70k
Respondent #6 52 Female Employed white 30–45k
Respondent #7 42 Male Employed white 45–70k
Respondent #8 48 Male Employed white 10–30k
Respondent #9 52 Female Not in the labor force white 70k or more
Respondent #10 45 Male Employed white 70k or more

Boomers at Midlife: The AARP Life Stage Study - Volume I Full Report
148 Prepared for AARP by Princeton Survey Research Associates
Group 9
Respondents age 57–75July 24, 2002Kansas City, MO
Respondent Age Gender Employment Race/Ethnicity Income
Respondent #1 58 Female Employed Hispanic 45–70k
Respondent #2 74 Male Self-employed white 45–70k
Respondent #3 60 Female Retired white 45–70k
Respondent #4 73 Female Retired white 10–30k
Respondent #5 72 Male Retired black/African American 10–30k
Respondent #6 60 Male Not in the labor force black/African American 70k or more
Respondent #7 66 Female Retired white 30–45k
Respondent #8 66 Female Retired white 70k or more
Respondent #9 58 Male Employed Hispanic 45–70k
Respondent #10 60 Female Employed Hispanic 70k or more
Group 10
Respondents age 38–56July 24, 2002Kansas City, MO
Respondent Age Gender Employment Race/Ethnicity Income
Respondent #1 49 Male Employed white 45–70k
Respondent #2 42 Female Employed black/African American 10–30k
Respondent #3 50 Female Employed black/African American 10–30k
Respondent #4 51 Male Employed Hispanic 45–70k
Respondent #5 53 Male Self-employed white 45–70k
Respondent #6 51 Female Employed white 70k or more
Respondent #7 44 Female Self-employed white 70k or more
Respondent #8 41 Male Employed Hispanic 70k or more
Respondent #9 45 Male Employed black/African American 45–70k
Respondent #10 44 Female Not in the labor force Hispanic 30–45k

Appendix D: Methodological Report for Focus Groups
149
Group 11
Respondents age 57–75July 25, 2002Kansas City, MO
Respondent Age Gender Employment Race/Ethnicity Income
Respondent #1 66 Male Retired Hispanic 30–45k
Respondent #2 65 Female Employed black/African American 30–45k
Respondent #3 67 Female Not in the labor force black/African American 45–70k
Respondent #4 68 Male Retired white 70k or more
Respondent #5 58 Male Self-employed black/African American 45–70k
Respondent #6 65 Female Employed white 30–45k
Respondent #7 67 Male Retired white 45–70k
Respondent #8 61 Female Employed black/African American 10–30k
Respondent #9 57 Female Not in the labor force Hispanic 10–30k
Respondent #10 61 Female Employed white 10–30k
Group 12
Respondents age 38–56July 25, 2002Kansas City, MO
Respondent Age Gender Employment Race/Ethnicity Income
Respondent #1 54 Female Employed white 45–70k
Respondent #2 50 Male Employed black/African American 10–30k
Respondent #3 42 Male Employed black/African American 10–30k
Respondent #4 43 Male Employed black/African American 70k or more
Respondent #5 49 Female Not in the labor force Hispanic 45–70k
Respondent #6 44 Male Self-employed white 10–30k
Respondent #7 42 Female Employed black/African American 70k or more
Respondent #8 44 Female Employed black/African American 10–30k
Respondent #9 44 Female Not in the labor force Hispanic 70k or more
Respondent #10 55 Male Employed Hispanic 45–70k

Boomers at Midlife: The AARP Life Stage Study - Volume I Full Report
150 Prepared for AARP by Princeton Survey Research Associates

Appendix E: Focus Group Moderator’s Guide
Boomers at Midlife
Prepared by Princeton Survey Research Associates for AARP
November 2002
Introduction
Hello my name is ___________ and I’ll be your moderator this evening. I work
with Princeton Survey Research Associates and we are an independent research
company based in New Jersey. We’re doing focus group interviews with people in
different parts of the country to help us better understand the answers 3,500 people
gave us in a national telephone survey we just completed about a month ago.
The survey was about people’s quality of life now and their expectations for the
future. Your job tonight is to help us analyze four questions that were asked in the
survey. We need you to help us interpret what the answers mean.
Here is how we’re going to do this. Over the next 1_ hours or so I’ll ask you to
answer four of the questions from the national survey. I will NOT collect your
answers or ask you to share them unless you want to do so. We’ll then discuss what
you think about the national results for the same questions you’ve answered.
Disclosures/Confidentiality: We’re audio-taping and videotaping our discussion
to help make sure we write an accurate report, and to share with the other
researchers involved with this project. Also, you may have noticed the one-way
mirror. A few people working with me on the project are observing from the
viewing room. Let me assure you that when we write our report, we do not
include your names: We report what was said, not who said it.
Guidelines: Because we’re taping, I may ask you to speak up occasionally or to
speak one person at a time, but otherwise we want plenty of discussion and
debate. We’re looking for different points of view. So even though I will be asking
questions, I encourage you to direct your comments to each other.
Permission/Thanks: If you need to use the bathroom just go, and help yourself to a
drink or snack. Thanks for being here!
Personal Instructions: Let’s start by you introducing yourselves. Please tell us your
first name and how long you have lived in the (Baltimore/Charlotte/Kansas City)
area. You might also want to tell us if you’re working, whether you’re married or
have any children. Who would like to start us off?
[Complete Personal Introductions]
Appendix E: Focus Group Moderator’s Guide
151

Transition: In addition to doing focus groups, my company uses surveys to learn
more about people’s opinions and experiences. As I mentioned, last month we
finished a national survey that asked questions about people’s satisfaction with
their lives now and their hopes, dreams and goals for the future. We want to make
sure we understand what people are trying to tell us with their answers to the
survey, so we’re going around the country to hear from people like you, in plain
English, what these answers might mean.
This evening we’re going to talk about your reactions to four of the questions we
asked on the survey so we can better understand the answers to the questions.
We want your help in understanding the results from the national survey—what
you think they mean, whether these results surprise you, and if they do, why.
All the work that you put into thinking about these questions will be invaluable
to me and other researchers who have to write the report I mentioned earlier.
We can’t give an accurate account of what people across the country think without
your input tonight. So, this is your group. Even though I’ll be guiding the discussion,
feel free to direct your comments to one another, to ask one another to explain
their comments if you’re not sure what they mean, and to pipe up when you see
things in a different way from others around the table.
Boomers at Midlife: The AARP Life Stage Study - Volume I Full Report
152 Prepared for AARP by Princeton Survey Research Associates
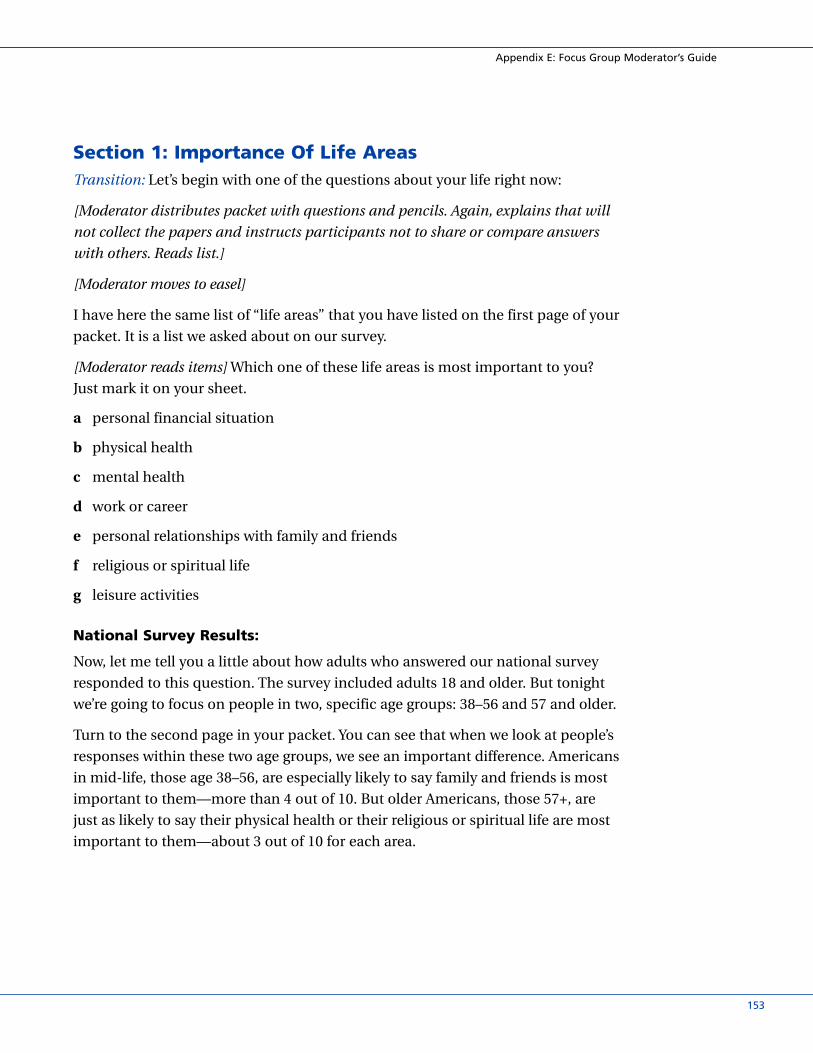
Section 1: Importance Of Life AreasTransition: Let’s begin with one of the questions about your life right now:
[Moderator distributes packet with questions and pencils. Again, explains that will
not collect the papers and instructs participants not to share or compare answers
with others. Reads list.]
[Moderator moves to easel]
I have here the same list of “life areas” that you have listed on the first page of your
packet. It is a list we asked about on our survey.
[Moderator reads items] Which one of these life areas is most important to you?
Just mark it on your sheet.
a personal financial situation
b physical health
c mental health
d work or career
e personal relationships with family and friends
f religious or spiritual life
g leisure activities
National Survey Results:
Now, let me tell you a little about how adults who answered our national survey
responded to this question. The survey included adults 18 and older. But tonight
we’re going to focus on people in two, specific age groups: 38–56 and 57 and older.
Turn to the second page in your packet. You can see that when we look at people’s
responses within these two age groups, we see an important difference. Americans
in mid-life, those age 38–56, are especially likely to say family and friends is most
important to them—more than 4 out of 10. But older Americans, those 57+, are
just as likely to say their physical health or their religious or spiritual life are most
important to them—about 3 out of 10 for each area.
Appendix E: Focus Group Moderator’s Guide
153

What are your overall reactions to these results? What do you make of them?
• Do these results surprise you? In what way?
• Do they make sense to you? How so?
• How do the answers compare with your own answer to the question?If Necessary: What do you think made you answer differently from people yourown age in the survey?
Ask Younger Group: Try to think about where you expect you will be whenyou’re say about 65 or older. Do you expect you will place more emphasis onphysical health and religious life as you get older? What makes you think that?
Ask Older Group: Think back to when you were in the middle age group—38–56 years old. Do you remember placing more importance on relationshipswith family and friends? What are some of the reasons this was important atthat point in your life?
• Do you think you placed less emphasis on your physical health and religious or spiritual life?
Boomers at Midlife: The AARP Life Stage Study - Volume I Full Report
154 Prepared for AARP by Princeton Survey Research Associates

*Section 2: Satisfaction With Life AreasTransition: Let’s move on to the next question. Again, I’m going to ask you to mark
your answers on the survey sheet as I read the question to you.
Please mark whether you are very satisfied, somewhat satisfied, not too satisfied or
not at all satisfied with each of these major life areas.
a personal financial situation
b physical health
c mental health
d work or career
e personal relationships with family and friends
f religious or spiritual life
g leisure activities
National Survey Results:
Now, let’s look at the results from our national survey.
Again, when we look at people’s responses within different age groups, we see con-
sistent differences between adults age 38–56 and those age 57+. Older adults are
more satisfied with practically every aspect of life we asked about in the survey.
(Mental health is the exception.)
What are your overall reactions to these results? What do you make of them?
• *Does it surprise you that older Americans are more satisfied than Americans inmid-life in nearly every area? Why/Why not?
Someone finish this sentence for me: That makes sense because __________.
• *What do you think are some of the reasons that so few people in mid-life arevery satisfied with their work, physical health or their finances?
• How do these results compare with your own answers?
If Necessary: What do you think made you answer differently from people yourown age in the survey?
Appendix E: Focus Group Moderator’s Guide
155

Ask Younger Group: Again, try to think about where you expect you will be whenyou’re in that older age group, say 65 or so. Do you think you will be more satisfiedthan you are now with these aspects of your life? What makes you say that?
Now, let me run three ideas by you about why older people might be more
satisfied than people in mid-life. The first one is…:
1) **Older people have accomplished a lot of their life goals, e.g., own theirhomes, retired, put children through college, etc. To what extent do youthink this explains why older people are more satisfied?
2) **It’s older people’s attitude towards life. They’ve survived a lot and they arewiser than people in mid-life. To what extent do you think this explainswhy older people are more satisfied?
3) **Older people expect less and therefore express more satisfaction in theselife areas. What do you think of this explanation?
• So which of these do you think is the best explanation?
Ask Older Group: Think back to when you were in the middle age group—
38–56 years old. Do you remember being any less satisfied with these aspects
of your life than you are now? All? Which ones?
Now, let me run three ideas by you about why older people might be more
satisfied than people in midlife. The first one is…:
1) **Older people have accomplished a lot of their life goals, e.g., own theirhomes, retired, put children through college, etc. To what extent do youthink this explains why older people are more satisfied?
2) **It’s older people’s attitude towards life. They’ve survived a lot and they arewiser than people in mid-life. To what extent do you think this explainswhy older people are more satisfied?
3) **Older people expect less and therefore express more satisfaction in theselife areas. What do you think of this explanation?
• So which of these do you think is the best explanation?
Boomers at Midlife: The AARP Life Stage Study - Volume I Full Report
156 Prepared for AARP by Princeton Survey Research Associates
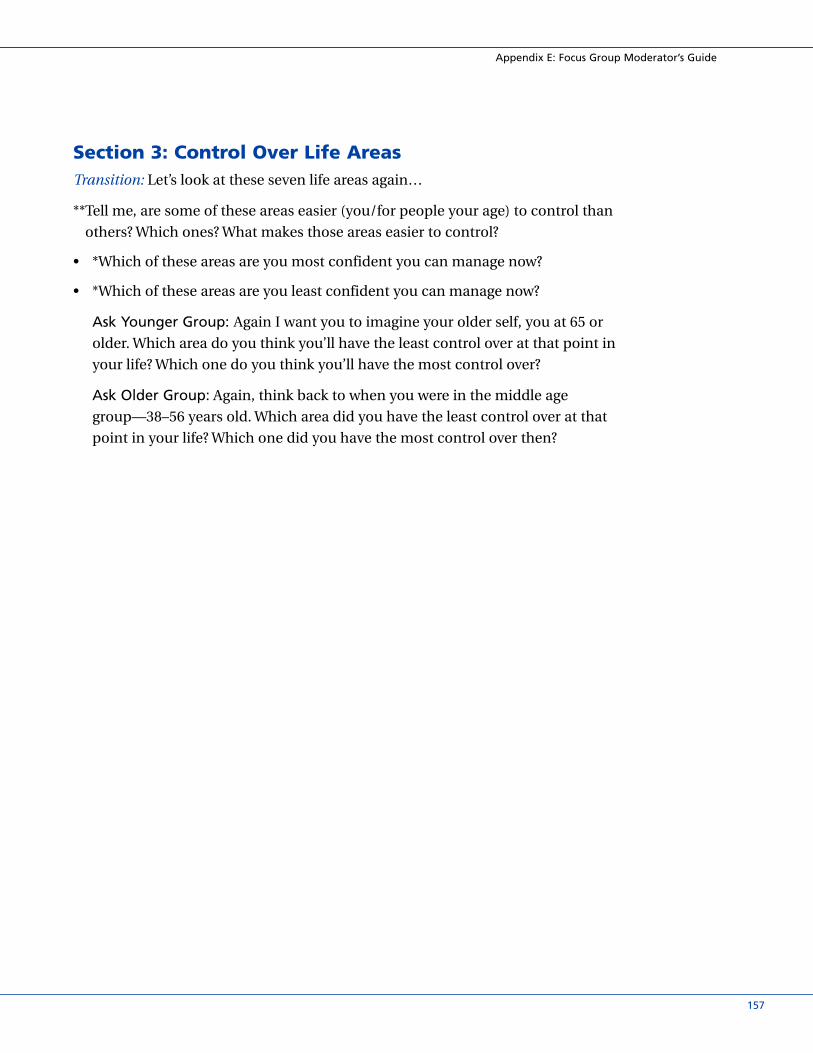
Section 3: Control Over Life AreasTransition: Let’s look at these seven life areas again…
**Tell me, are some of these areas easier (you/for people your age) to control than
others? Which ones? What makes those areas easier to control?
• *Which of these areas are you most confident you can manage now?
• *Which of these areas are you least confident you can manage now?
Ask Younger Group: Again I want you to imagine your older self, you at 65 or
older. Which area do you think you’ll have the least control over at that point in
your life? Which one do you think you’ll have the most control over?
Ask Older Group: Again, think back to when you were in the middle age
group—38–56 years old. Which area did you have the least control over at that
point in your life? Which one did you have the most control over then?
Appendix E: Focus Group Moderator’s Guide
157

Section 4: Discussion Of Ambitions And BarriersTransition: Okay, turn to the last set of questions in your packet. These two ques-
tions are a little different in that there aren’t any categories. I’ll read them and then
give you a few minutes to fill in your answers.
What one major ambition or dream would you like to accomplish over the next
five years?
What, if anything, is keeping you from achieving what you really want out of life?
Participant Responses:
Before we look at the national results, does anyone want to tell us how you
answered these two questions?
National Survey Results:
Now, let’s look at the results from our national survey.
[Moderator distributes results and reviews them by age group]
While the differences aren’t uniform, we see a few important differences by age
group—between adults age 38–56 and those age 57+. Many more younger adults
are have ambitions or dreams related to finances and work/career. Older adults,
on the other hand, are more likely to mention things related to health or to say
they have already accomplished their dreams. In terms of what stands in the way,
many adults in both age groups say “nothing.” But adults in the middle years are
much more likely to blame themselves, to say “me.”
What are your overall reactions to these results?
• **What do people mean when they say they are the biggest barrier to achievingwhat they want out of life? Probe: Does this mean people really think “myfuture is in my own hands” or “…under my control”?
• Why do you think people in mid-life have dreams in the areas of finances andwork whereas older people have ambitions about their health or say they havealready accomplished their dreams?
• How do these results compare to your own answers?
(If Appropriate) Ask Younger Group: How do you think people’s answers might
have been different if we hadn’t limited this to the next five years?
Boomers at Midlife: The AARP Life Stage Study - Volume I Full Report
158 Prepared for AARP by Princeton Survey Research Associates

Wrap-Up/ConclusionBoomer Question (if seems appropriate):
We’ve been focused on people age 38–56. As some of you might have guessed,
these people are in the generation commonly referred to as “baby boomers.”
• What does it mean to you to be a boomer?
• Boomers have done a lot of things differently and the country changed a lot as a result of that. How do you think the boomers might approach old age differently?
Appendix E: Focus Group Moderator’s Guide
159

Boomers at Midlife: The AARP Life Stage Study - Volume I Full Report
160 Prepared for AARP by Princeton Survey Research Associates

learn more...
Visit: www.aarp.org
Write: AARP, 601 E Street, NW, Washington, DC 20049
AARP is a nonprofit, nonpartisan membership organization for people 50 and
over. We provide information and resources; advocate on legislative, consumer,
and legal issues; assist members to serve their communities; and offer a wide
range of unique benefits, special products, and services for our members. These
benefits include AARP Webplace at www.aarp.org, lifestyle magazines, the monthly
AARP Bulletin, and a Spanish-language newspaper, Segunda Juventud. Active in
every state, the District of Columbia, Puerto Rico, and the U.S. Virgin Islands,
AARP celebrates the attitude that age is just a number and life is what you make it.
Appendix E: Focus Group Moderator’s Guide
161

601 E Street, NW
Washington, DC 20049
800-424-3410
www.aarp.org
© 2002 AARP D17781