Embed Size (px)
Citation preview

Booster RF Cavity Replacement
Thomas Kroc
PIP-II Collaboration Meeting
9-10 November 2015
Why?
• While the existing cavities have been refurbished, they are
still 40 years old.
• PIP II operations will leave no extra operating margin.
• Uncertain operational impact of needing to run all cavities at
maximum performance 24/7.
11/23/2015TK Kroc | Booster RF Cavity Replacement2
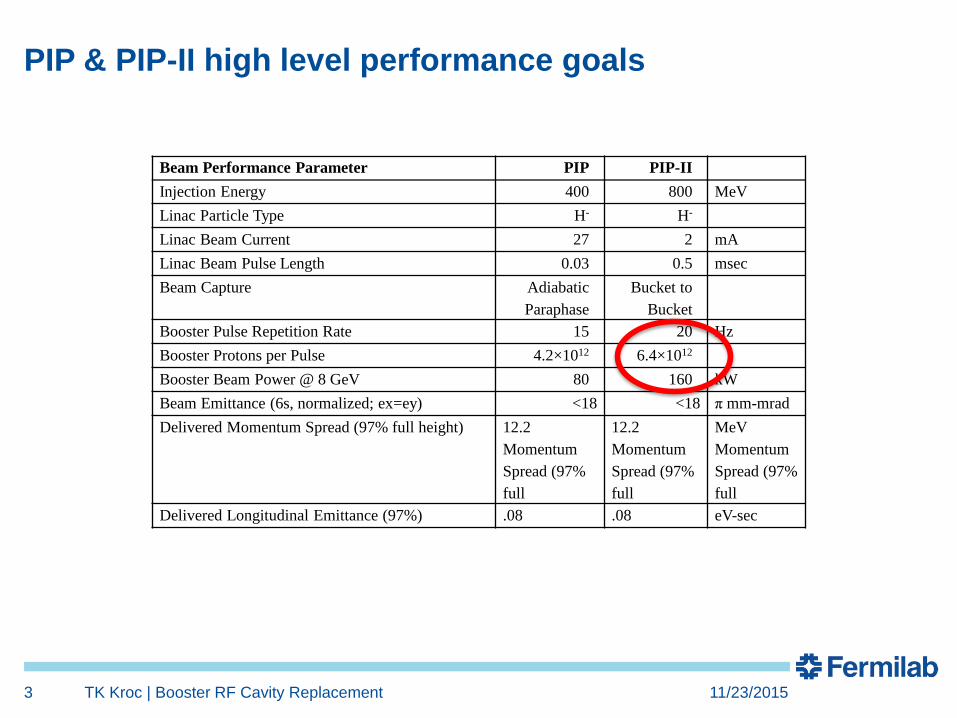
PIP & PIP-II high level performance goals
Beam Performance Parameter PIP PIP-II
Injection Energy 400 800 MeV
Linac Particle Type H- H-
Linac Beam Current 27 2 mA
Linac Beam Pulse Length 0.03 0.5 msec
Beam Capture Adiabatic
Paraphase
Bucket to
Bucket
Booster Pulse Repetition Rate 15 20 Hz
Booster Protons per Pulse 4.2×10¹² 6.4×10¹²
Booster Beam Power @ 8 GeV 80 160 kW
Beam Emittance (6s, normalized; ex=ey) <18 <18 π mm-mrad
Delivered Momentum Spread (97% full height) 12.2
Momentum
Spread (97%
full
12.2
Momentum
Spread (97%
full
MeV
Momentum
Spread (97%
full
Delivered Longitudinal Emittance (97%) .08 .08 eV-sec
11/23/2015TK Kroc | Booster RF Cavity Replacement3
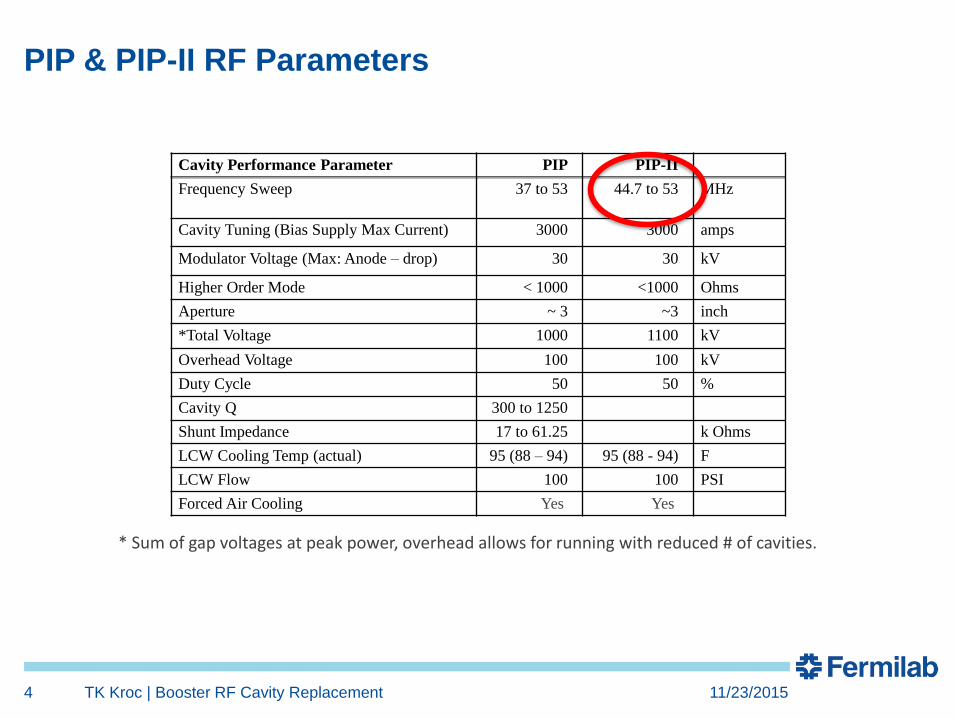
PIP & PIP-II RF Parameters
11/23/2015TK Kroc | Booster RF Cavity Replacement4
Cavity Performance Parameter PIP PIP-II
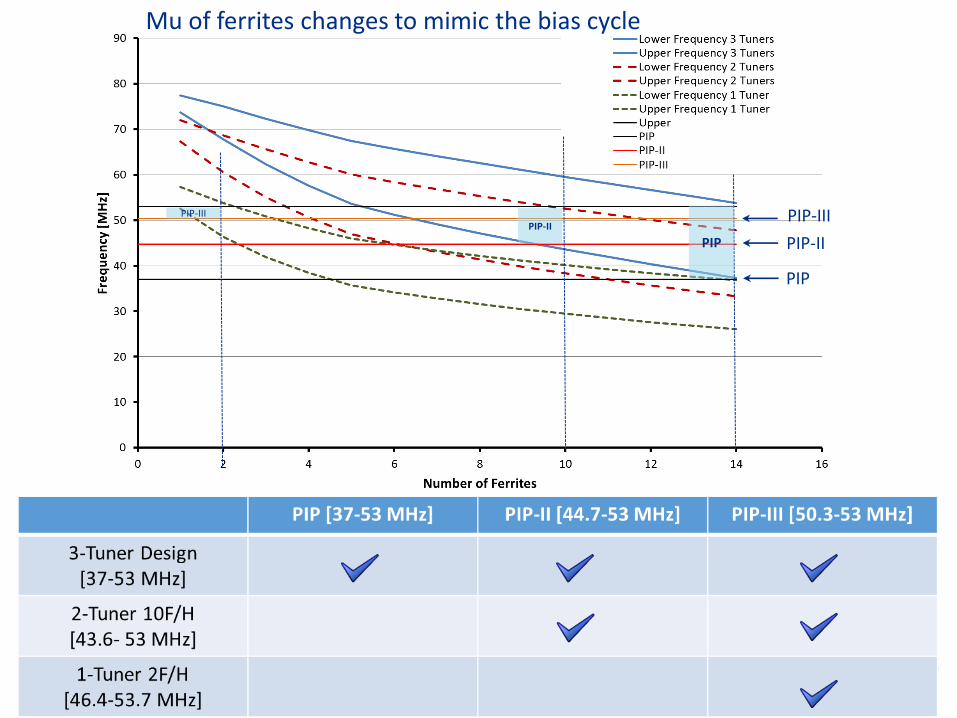
Frequency Sweep 37 to 53 44.7 to 53 MHz
Cavity Tuning (Bias Supply Max Current) 3000 3000 amps
Modulator Voltage (Max: Anode – drop) 30 30 kV
Higher Order Mode < 1000 <1000 Ohms
Aperture ~ 3 ~3 inch
*Total Voltage 1000 1100 kV
Overhead Voltage 100 100 kV
Duty Cycle 50 50 %
Cavity Q 300 to 1250
Shunt Impedance 17 to 61.25 k Ohms
LCW Cooling Temp (actual) 95 (88 – 94) 95 (88 - 94) F
LCW Flow 100 100 PSI
Forced Air Cooling Yes Yes
* Sum of gap voltages at peak power, overhead allows for running with reduced # of cavities.
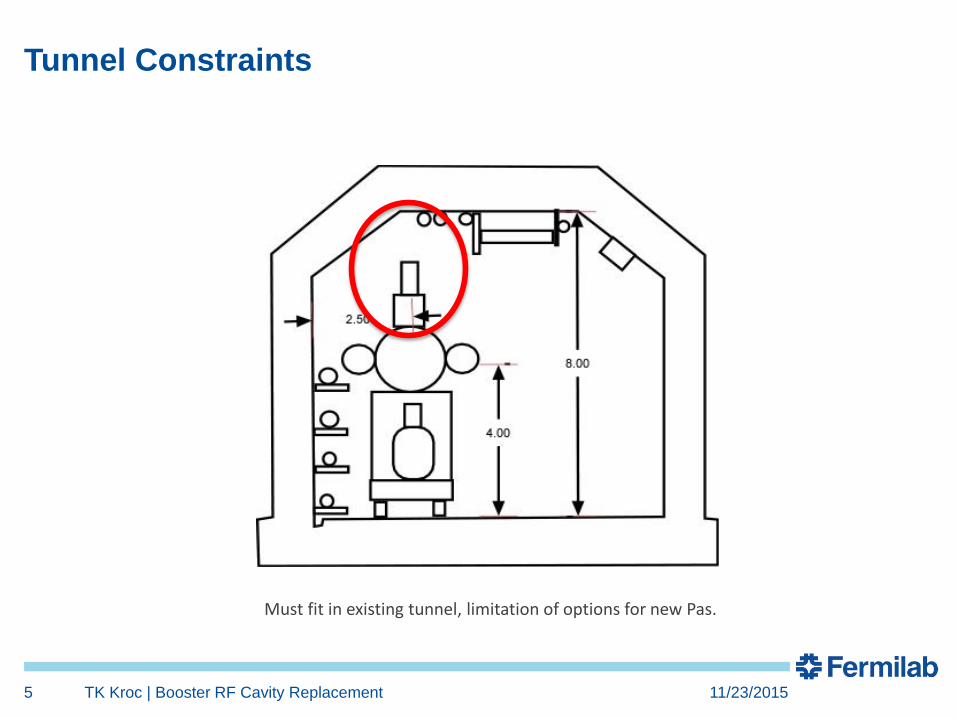
Tunnel Constraints
11/23/2015TK Kroc | Booster RF Cavity Replacement5
Must fit in existing tunnel, limitation of options for new Pas.
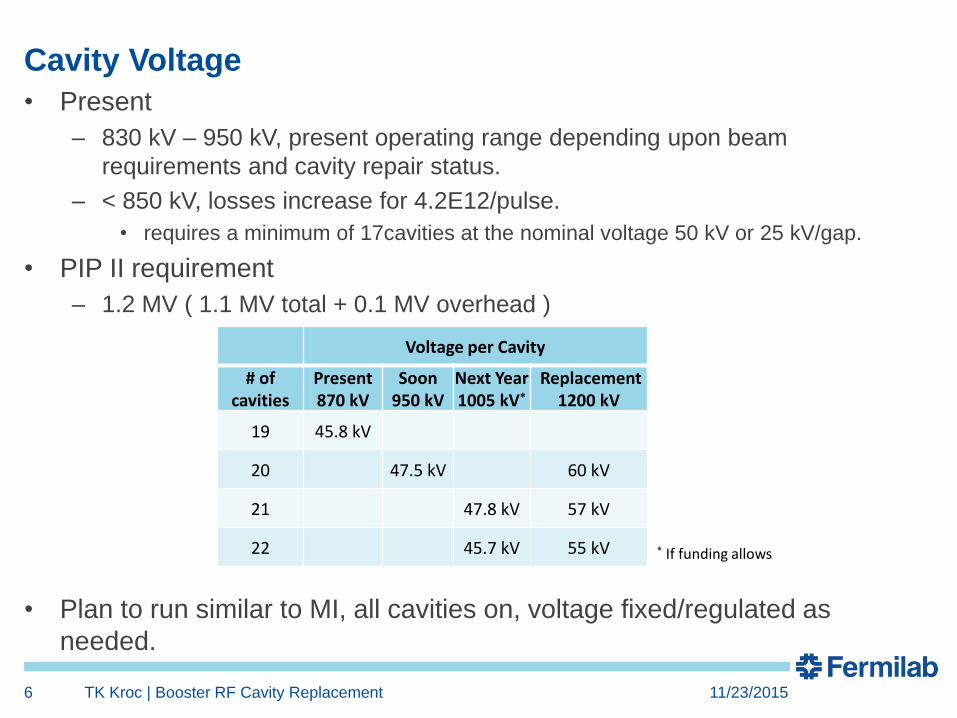
Cavity Voltage
• Present
– 830 kV – 950 kV, present operating range depending upon beam
requirements and cavity repair status.
– < 850 kV, losses increase for 4.2E12/pulse.
• requires a minimum of 17cavities at the nominal voltage 50 kV or 25 kV/gap.
• PIP II requirement
– 1.2 MV ( 1.1 MV total + 0.1 MV overhead )
• Plan to run similar to MI, all cavities on, voltage fixed/regulated as
needed.
11/23/2015TK Kroc | Booster RF Cavity Replacement6
Voltage per Cavity
# of cavities
Present 870 kV
Soon 950 kV
Next Year 1005 kV*
Replacement 1200 kV
19 45.8 kV
20 47.5 kV 60 kV
21 47.8 kV 57 kV
22 45.7 kV 55 kV * If funding allows
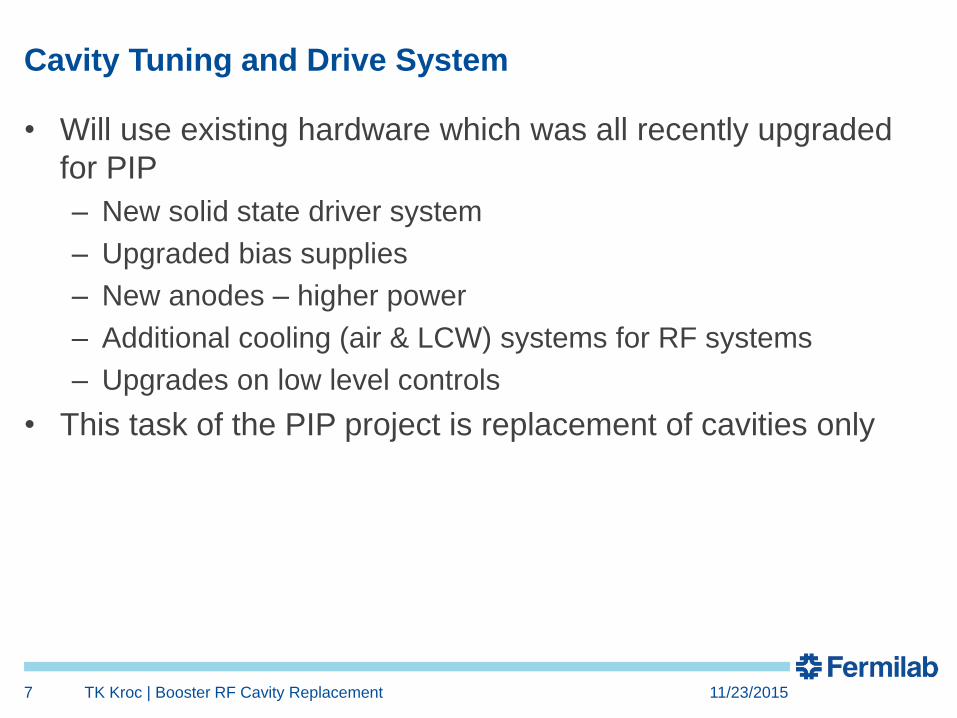
Cavity Tuning and Drive System
• Will use existing hardware which was all recently upgraded
for PIP
– New solid state driver system
– Upgraded bias supplies
– New anodes – higher power
– Additional cooling (air & LCW) systems for RF systems
– Upgrades on low level controls
• This task of the PIP project is replacement of cavities only
11/23/2015TK Kroc | Booster RF Cavity Replacement7
Other cavity performance factors
• Beam Loading and Power Requirements
– Each cavity must meet the specified voltage while accelerating up to 1000ma of beam
(at a synchronous phase of ~40 degrees (synchrotron definition, 90 degrees at crest))
with 2-3 of the 84 buckets empty.
– The loaded cavity shall be designed to operate with up to 150 kW RF power from a CPI
(EIMAC) Y-567B tetrode power tube. Although rated to operate at higher power up to
200 kW, for lifetime considerations operating at a lower power is preferable.
• Cavity Impedance and Spurious Modes
– The cavity shall be designed for R/Q = 50 ohms and the impedance of all higher order
and spurious modes shall be ≤ 1000 ohms.
• Multipacting
– The cavity must be able to turn on and run at any voltage between 25% and 100% of
the specified operating voltage over the full frequency range without operationally
significant multipacting at the nominal operating vacuum pressure.
11/23/2015TK Kroc | Booster RF Cavity Replacement8
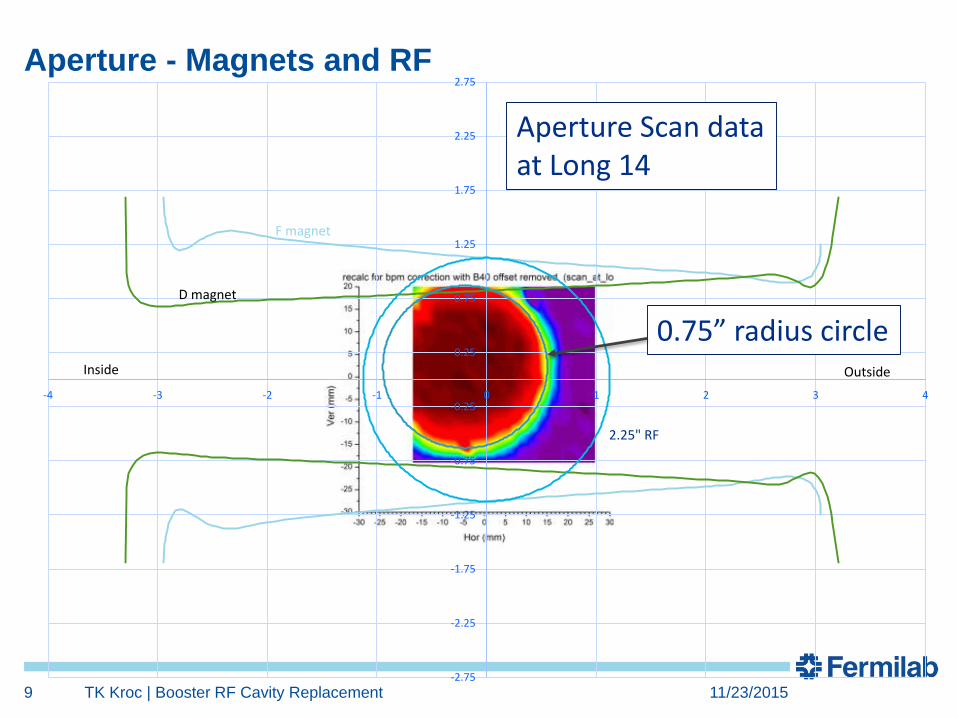
Aperture - Magnets and RF
11/23/2015TK Kroc | Booster RF Cavity Replacement9-2.75
-2.25
-1.75
-1.25
-0.75
-0.25
0.25
0.75
1.25
1.75
2.25
2.75
-4 -3 -2 -1 0 1 2 3 4
D magnet
OutsideInside
F magnet
0.75” radius circle
Aperture Scan dataat Long 14
2.25" RF
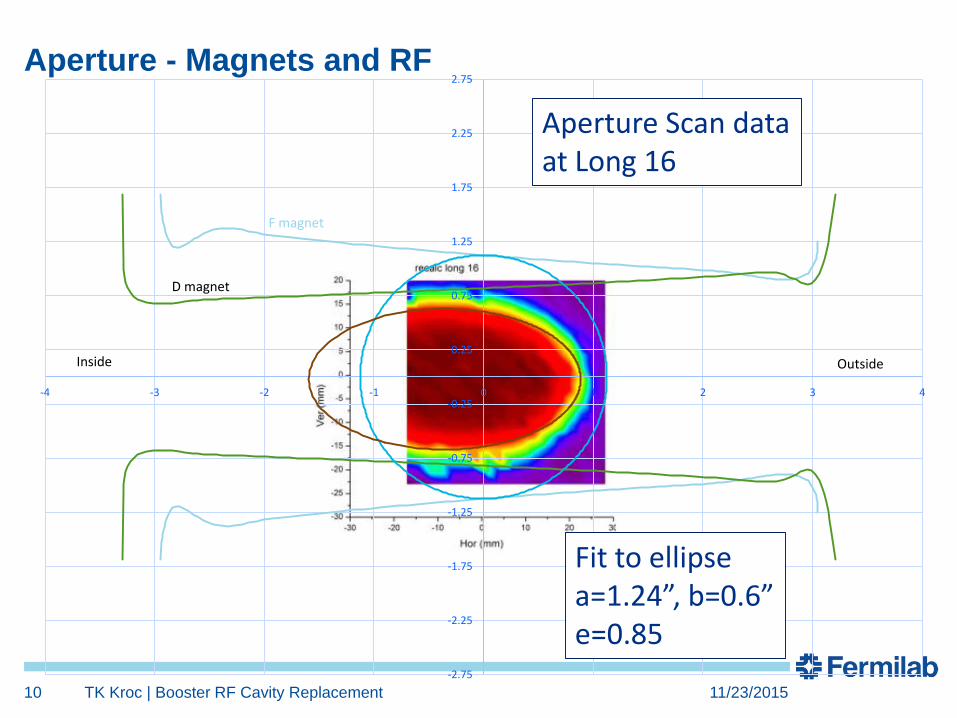
Aperture - Magnets and RF
11/23/2015TK Kroc | Booster RF Cavity Replacement10
-2.75
-2.25
-1.75
-1.25
-0.75
-0.25
0.25
0.75
1.25
1.75
2.25
2.75
-4 -3 -2 -1 0 1 2 3 4
D magnet
OutsideInside
F magnet
Aperture Scan dataat Long 16
Fit to ellipsea=1.24”, b=0.6”e=0.85
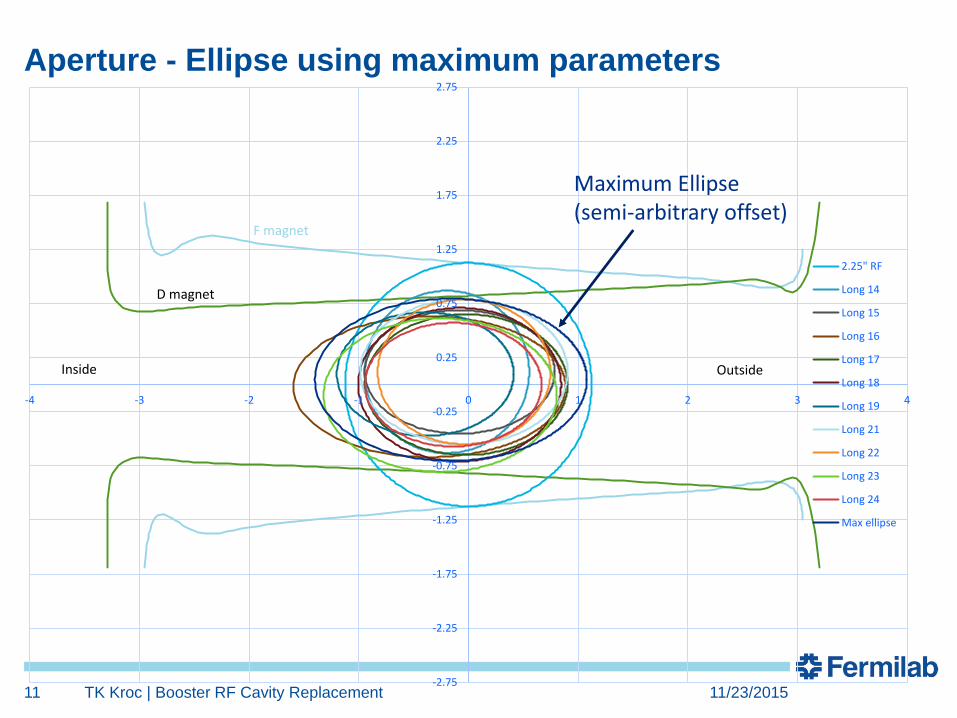
Aperture - Ellipse using maximum parameters
11/23/2015TK Kroc | Booster RF Cavity Replacement11-2.75
-2.25
-1.75
-1.25
-0.75
-0.25
0.25
0.75
1.25
1.75
2.25
2.75
-4 -3 -2 -1 0 1 2 3 4
2.25" RF
Long 14
Long 15
Long 16
Long 17
Long 18
Long 19
Long 21
Long 22
Long 23
Long 24
Max ellipse
D magnet
OutsideInside
F magnet
Maximum Ellipse(semi-arbitrary offset)
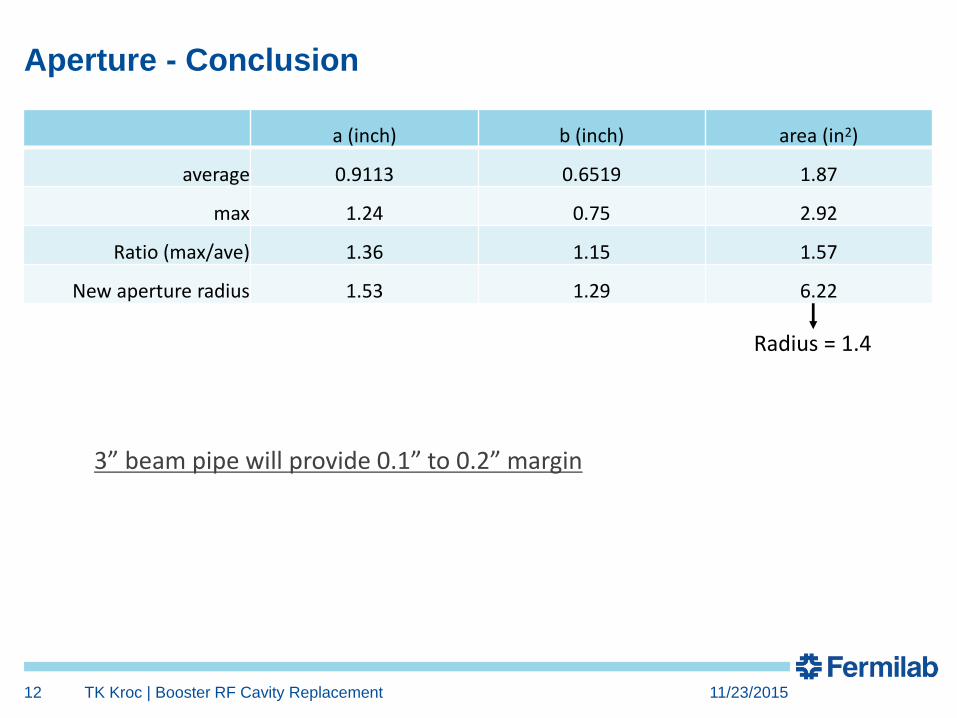
Aperture - Conclusion
a (inch) b (inch) area (in2)
average 0.9113 0.6519 1.87
max 1.24 0.75 2.92
Ratio (max/ave) 1.36 1.15 1.57
New aperture radius 1.53 1.29 6.22
11/23/2015TK Kroc | Booster RF Cavity Replacement12
Radius = 1.4
3” beam pipe will provide 0.1” to 0.2” margin
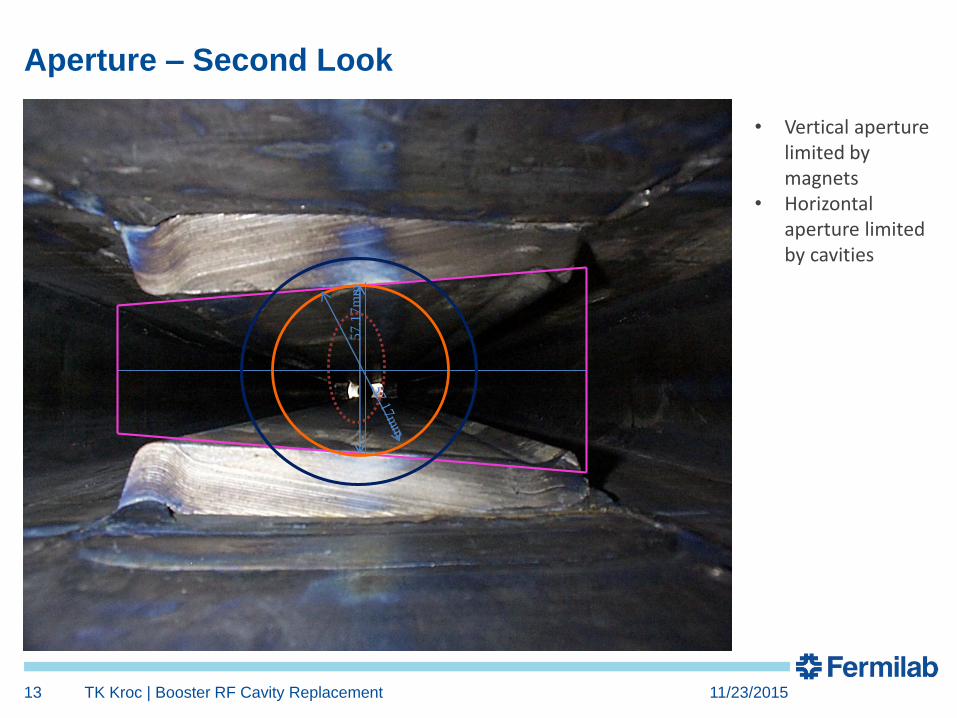
Aperture – Second Look
11/23/2015TK Kroc | Booster RF Cavity Replacement13
57.1
7m
m
• Vertical aperture limited by magnets
• Horizontal aperture limited by cavities
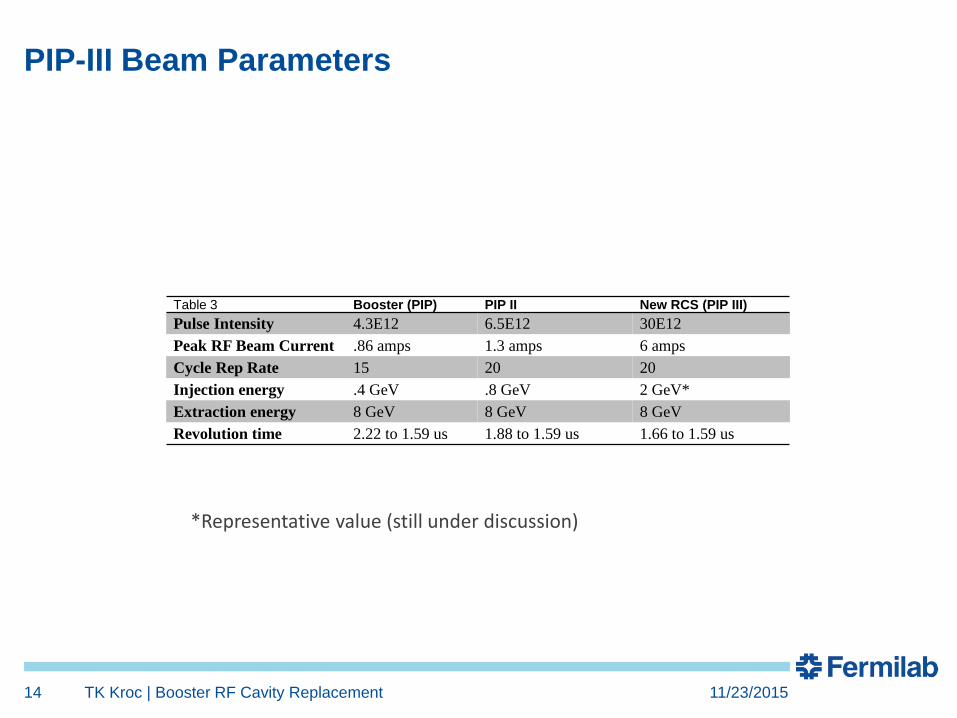
PIP-III Beam Parameters
Table 3 Booster (PIP) PIP II New RCS (PIP III)
Pulse Intensity 4.3E12 6.5E12 30E12
Peak RF Beam Current .86 amps 1.3 amps 6 amps
Cycle Rep Rate 15 20 20
Injection energy .4 GeV .8 GeV 2 GeV*
Extraction energy 8 GeV 8 GeV 8 GeV
Revolution time 2.22 to 1.59 us 1.88 to 1.59 us 1.66 to 1.59 us
11/23/2015TK Kroc | Booster RF Cavity Replacement14
*Representative value (still under discussion)
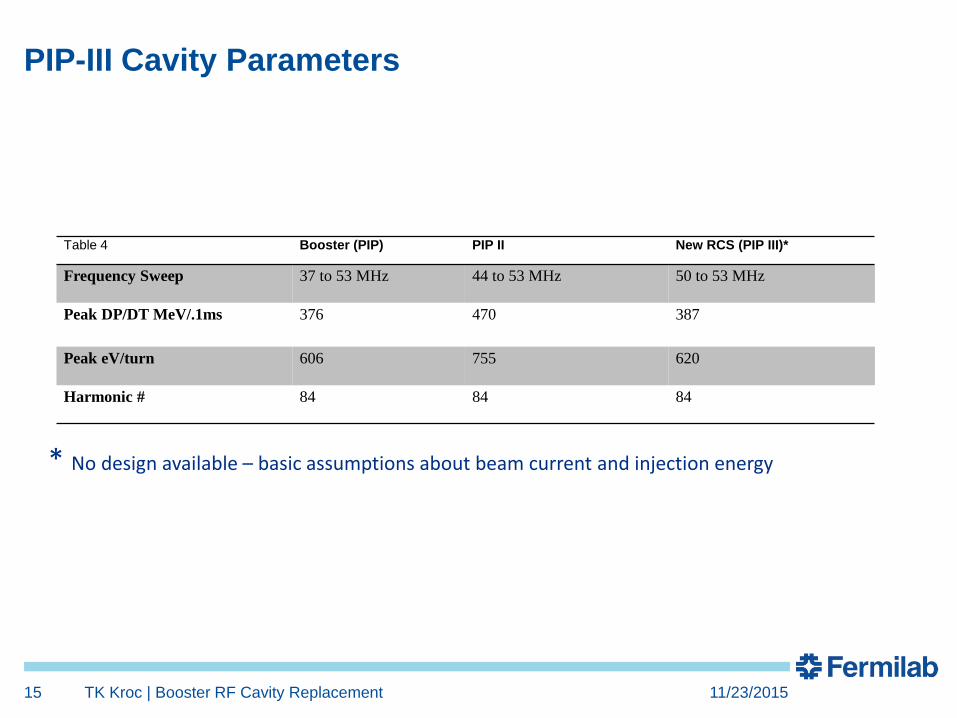
PIP-III Cavity Parameters
Table 4 Booster (PIP) PIP II New RCS (PIP III)*
Frequency Sweep 37 to 53 MHz 44 to 53 MHz 50 to 53 MHz
Peak DP/DT MeV/.1ms 376 470 387
Peak eV/turn 606 755 620
Harmonic # 84 84 84
11/23/2015TK Kroc | Booster RF Cavity Replacement15
* No design available – basic assumptions about beam current and injection energy
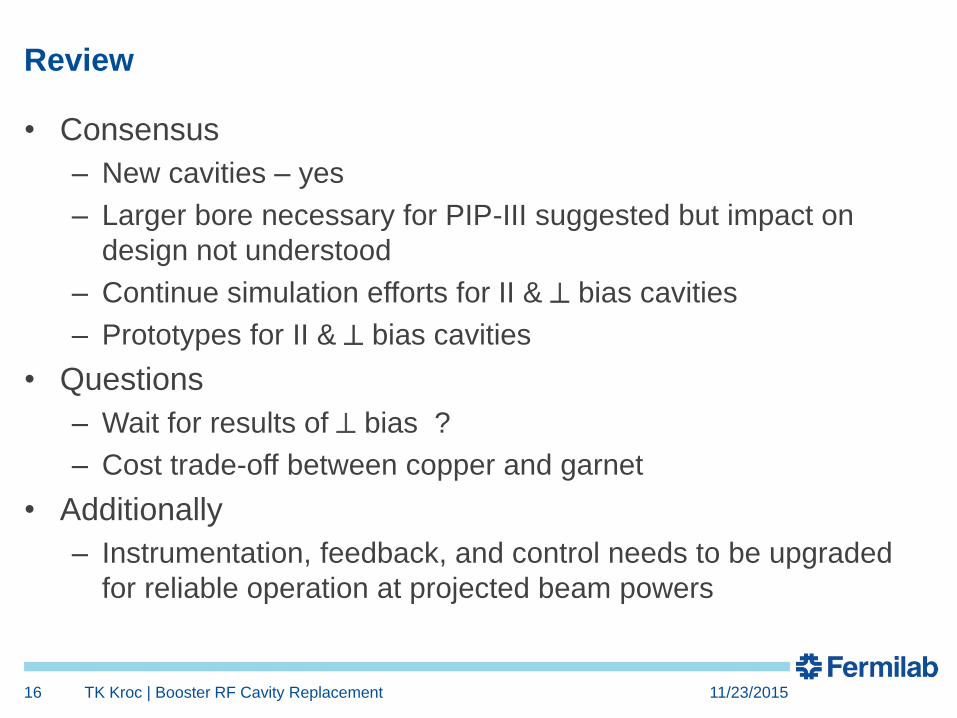
Review
• Consensus
– New cavities – yes
– Larger bore necessary for PIP-III suggested but impact on
design not understood
– Continue simulation efforts for II & bias cavities
– Prototypes for II & bias cavities
• Questions
– Wait for results of bias ?
– Cost trade-off between copper and garnet
• Additionally
– Instrumentation, feedback, and control needs to be upgraded
for reliable operation at projected beam powers
11/23/2015TK Kroc | Booster RF Cavity Replacement16
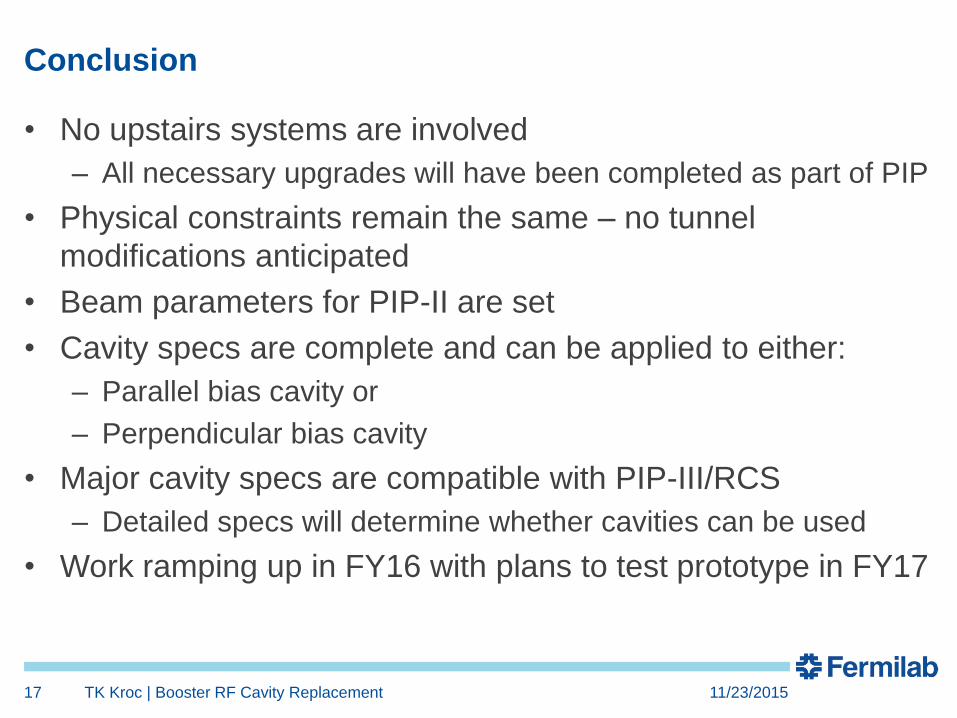
Conclusion
• No upstairs systems are involved
– All necessary upgrades will have been completed as part of PIP
• Physical constraints remain the same – no tunnel
modifications anticipated
• Beam parameters for PIP-II are set
• Cavity specs are complete and can be applied to either:
– Parallel bias cavity or
– Perpendicular bias cavity
• Major cavity specs are compatible with PIP-III/RCS
– Detailed specs will determine whether cavities can be used
• Work ramping up in FY16 with plans to test prototype in FY17
11/23/2015TK Kroc | Booster RF Cavity Replacement17
Electromagnetic Modeling of
Fermilab’s Booster Cavity
Mohamed Hassan
Workshop on Booster Performance and Enhancements
24th Nov 2015
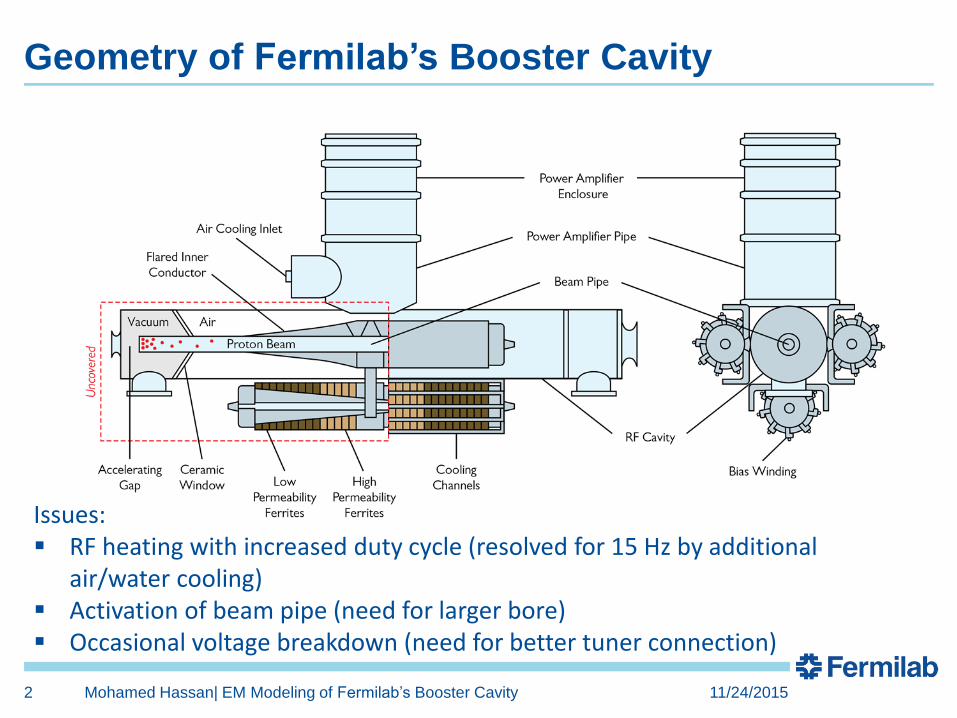
Geometry of Fermilab’s Booster Cavity
Issues: RF heating with increased duty cycle (resolved for 15 Hz by additional
air/water cooling) Activation of beam pipe (need for larger bore) Occasional voltage breakdown (need for better tuner connection)
11/24/2015Mohamed Hassan| EM Modeling of Fermilab’s Booster Cavity2
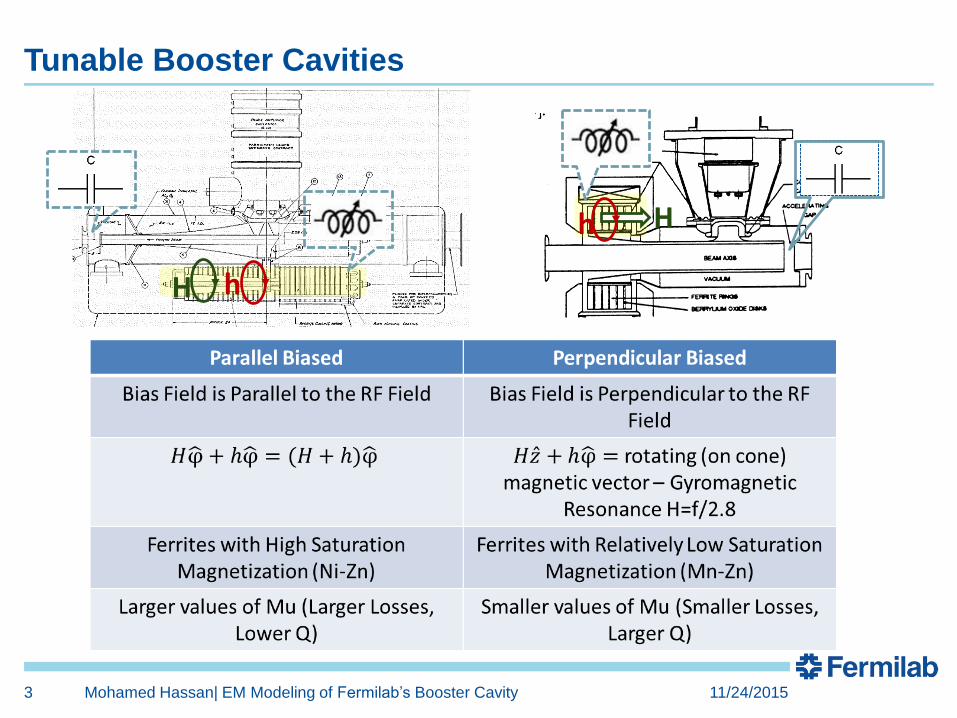
H h
Hh
Tunable Booster Cavities
11/24/2015Mohamed Hassan| EM Modeling of Fermilab’s Booster Cavity3
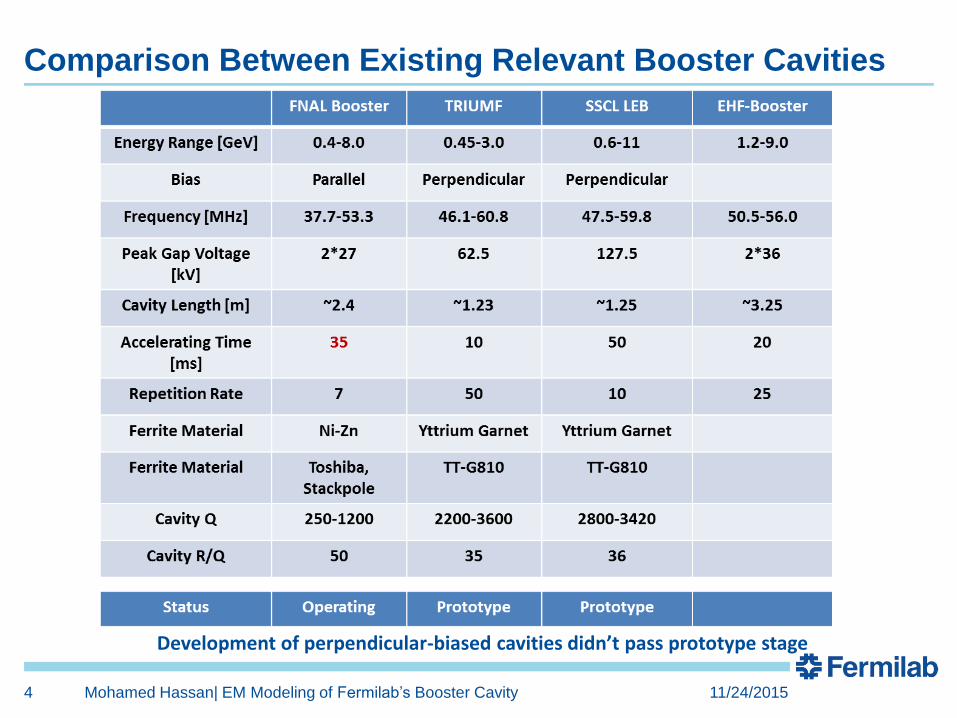
Comparison Between Existing Relevant Booster Cavities
Development of perpendicular-biased cavities didn’t pass prototype stage
11/24/2015Mohamed Hassan| EM Modeling of Fermilab’s Booster Cavity4
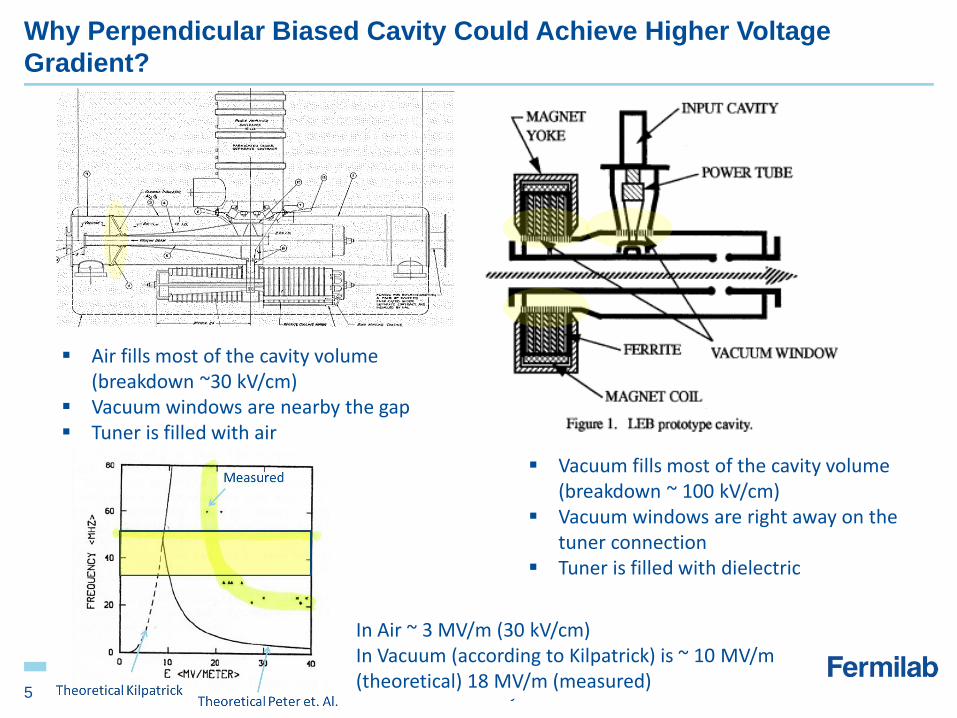
Why Perpendicular Biased Cavity Could Achieve Higher Voltage
Gradient?
Vacuum fills most of the cavity volume (breakdown ~ 100 kV/cm)
Vacuum windows are right away on the tuner connection
Tuner is filled with dielectric
Air fills most of the cavity volume (breakdown ~30 kV/cm)
Vacuum windows are nearby the gap Tuner is filled with air
11/24/2015Mohamed Hassan| EM Modeling of Fermilab’s Booster Cavity5
In Air ~ 3 MV/m (30 kV/cm)In Vacuum (according to Kilpatrick) is ~ 10 MV/m (theoretical) 18 MV/m (measured)
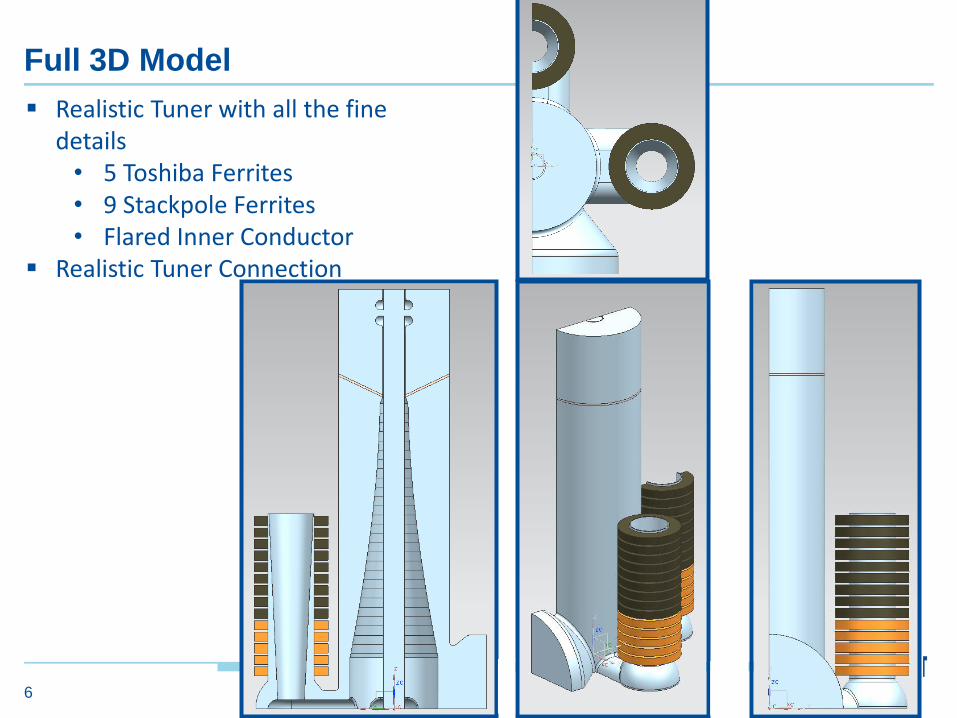
Realistic Tuner with all the fine details• 5 Toshiba Ferrites• 9 Stackpole Ferrites• Flared Inner Conductor
Realistic Tuner Connection
Full 3D Model
6
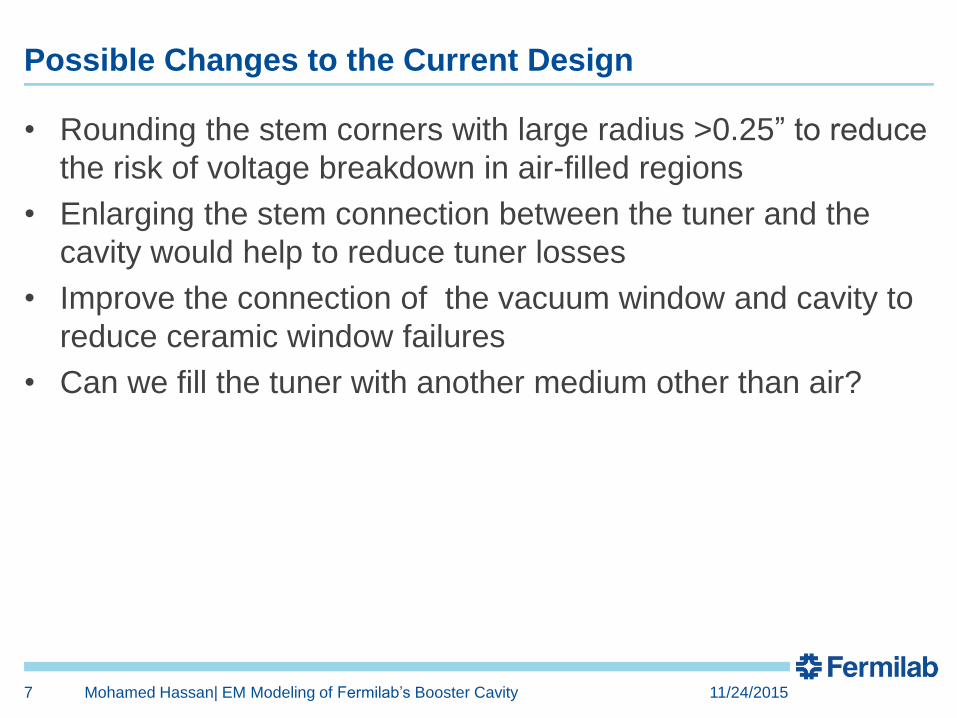
Possible Changes to the Current Design
• Rounding the stem corners with large radius >0.25” to reduce
the risk of voltage breakdown in air-filled regions
• Enlarging the stem connection between the tuner and the
cavity would help to reduce tuner losses
• Improve the connection of the vacuum window and cavity to
reduce ceramic window failures
• Can we fill the tuner with another medium other than air?
11/24/2015Mohamed Hassan| EM Modeling of Fermilab’s Booster Cavity7

Constant Temp Boundaries
55 kV, 15 Hz
Regular Cycle 7.5Hz vs 15Hz
Max T=47.2ᵒ C
Constant Temp Boundaries
55 kV, 7.5 Hz
• Simulated Q has been fitted to the measured
one by adjusting the magnetic loss tangent
with frequency
11/24/2015Mohamed Hassan| EM Modeling of Fermilab’s Booster Cavity8
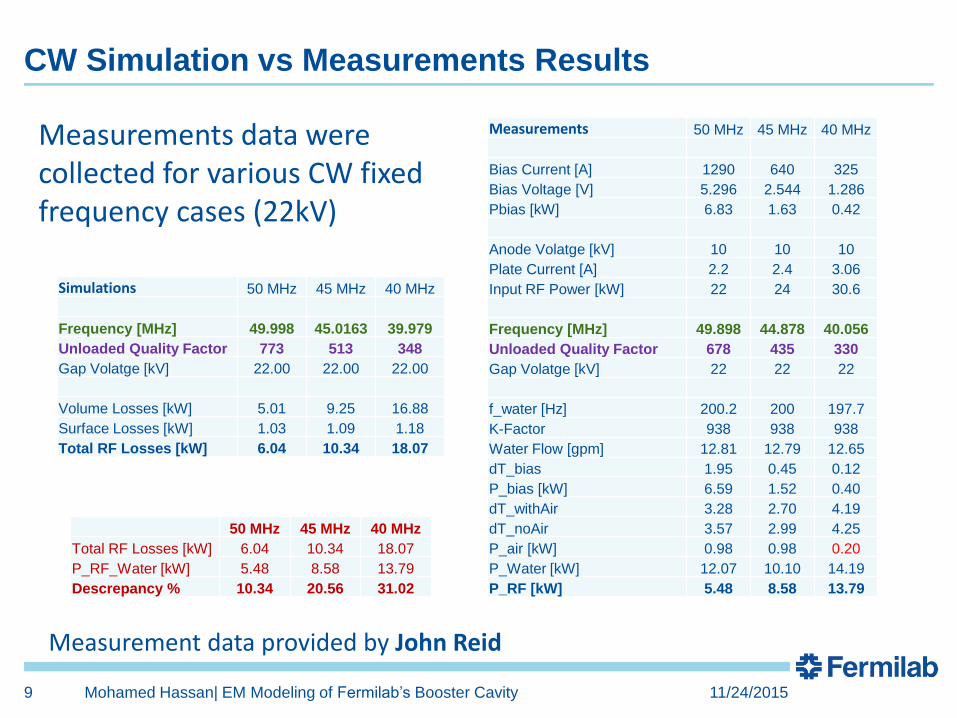
CW Simulation vs Measurements Results
Simulations 50 MHz 45 MHz 40 MHz
Frequency [MHz] 49.998 45.0163 39.979
Unloaded Quality Factor 773 513 348
Gap Volatge [kV] 22.00 22.00 22.00
Volume Losses [kW] 5.01 9.25 16.88
Surface Losses [kW] 1.03 1.09 1.18
Total RF Losses [kW] 6.04 10.34 18.07
Measurements 50 MHz 45 MHz 40 MHz
Bias Current [A] 1290 640 325
Bias Voltage [V] 5.296 2.544 1.286
Pbias [kW] 6.83 1.63 0.42
Anode Volatge [kV] 10 10 10
Plate Current [A] 2.2 2.4 3.06
Input RF Power [kW] 22 24 30.6
Frequency [MHz] 49.898 44.878 40.056
Unloaded Quality Factor 678 435 330
Gap Volatge [kV] 22 22 22
f_water [Hz] 200.2 200 197.7
K-Factor 938 938 938
Water Flow [gpm] 12.81 12.79 12.65
dT_bias 1.95 0.45 0.12
P_bias [kW] 6.59 1.52 0.40
dT_withAir 3.28 2.70 4.19
dT_noAir 3.57 2.99 4.25
P_air [kW] 0.98 0.98 0.20
P_Water [kW] 12.07 10.10 14.19
P_RF [kW] 5.48 8.58 13.79
50 MHz 45 MHz 40 MHz
Total RF Losses [kW] 6.04 10.34 18.07
P_RF_Water [kW] 5.48 8.58 13.79
Descrepancy % 10.34 20.56 31.02
Measurements data were collected for various CW fixed frequency cases (22kV)
11/24/2015Mohamed Hassan| EM Modeling of Fermilab’s Booster Cavity9
Measurement data provided by John Reid
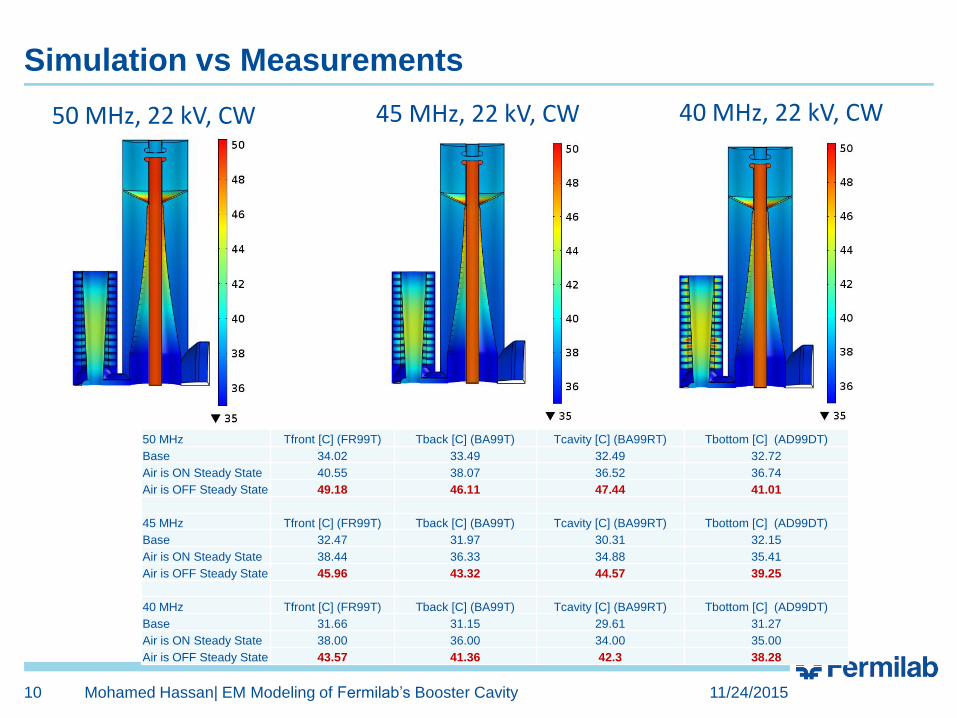
Simulation vs Measurements
11/24/2015Mohamed Hassan| EM Modeling of Fermilab’s Booster Cavity10
50 MHz Tfront [C] (FR99T) Tback [C] (BA99T) Tcavity [C] (BA99RT) Tbottom [C] (AD99DT)
Base 34.02 33.49 32.49 32.72
Air is ON Steady State 40.55 38.07 36.52 36.74
Air is OFF Steady State 49.18 46.11 47.44 41.01
45 MHz Tfront [C] (FR99T) Tback [C] (BA99T) Tcavity [C] (BA99RT) Tbottom [C] (AD99DT)
Base 32.47 31.97 30.31 32.15
Air is ON Steady State 38.44 36.33 34.88 35.41
Air is OFF Steady State 45.96 43.32 44.57 39.25
40 MHz Tfront [C] (FR99T) Tback [C] (BA99T) Tcavity [C] (BA99RT) Tbottom [C] (AD99DT)
Base 31.66 31.15 29.61 31.27
Air is ON Steady State 38.00 36.00 34.00 35.00
Air is OFF Steady State 43.57 41.36 42.3 38.28
40 MHz, 22 kV, CW45 MHz, 22 kV, CW50 MHz, 22 kV, CW
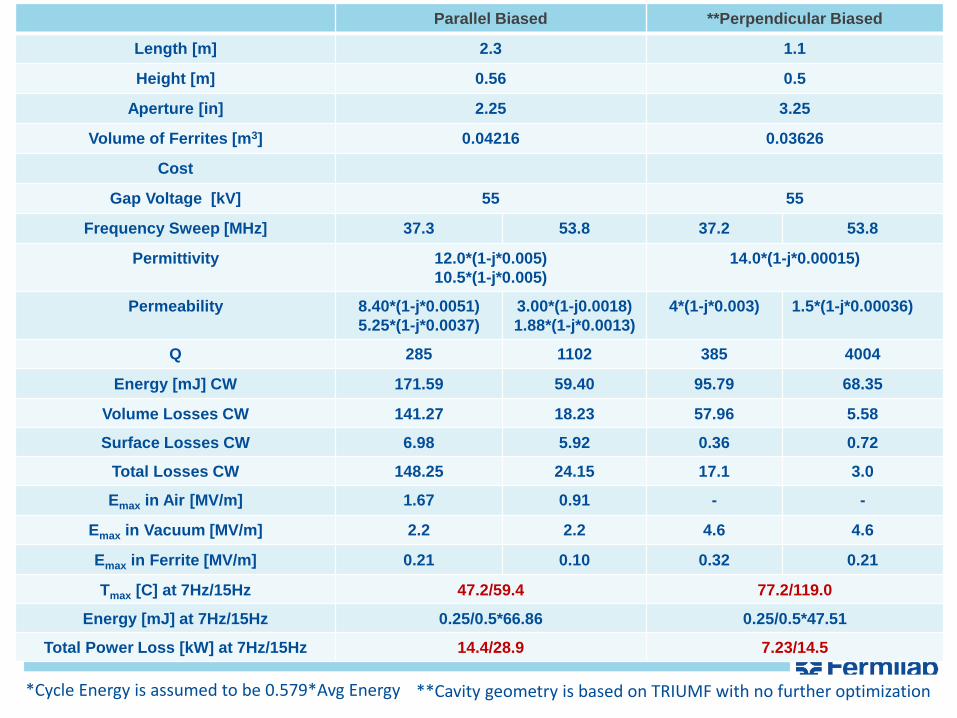
Parallel Biased **Perpendicular Biased
Length [m] 2.3 1.1
Height [m] 0.56 0.5
Aperture [in] 2.25 3.25
Volume of Ferrites [m3] 0.04216 0.03626
Cost
Gap Voltage [kV] 55 55
Frequency Sweep [MHz] 37.3 53.8 37.2 53.8
Permittivity 12.0*(1-j*0.005)
10.5*(1-j*0.005)
14.0*(1-j*0.00015)
Permeability 8.40*(1-j*0.0051)
5.25*(1-j*0.0037)
3.00*(1-j0.0018)
1.88*(1-j*0.0013)
4*(1-j*0.003) 1.5*(1-j*0.00036)
Q 285 1102 385 4004
Energy [mJ] CW 171.59 59.40 95.79 68.35
Volume Losses CW 141.27 18.23 57.96 5.58
Surface Losses CW 6.98 5.92 0.36 0.72
Total Losses CW 148.25 24.15 17.1 3.0
Emax in Air [MV/m] 1.67 0.91 - -
Emax in Vacuum [MV/m] 2.2 2.2 4.6 4.6
Emax in Ferrite [MV/m] 0.21 0.10 0.32 0.21
Tmax [C] at 7Hz/15Hz 47.2/59.4 77.2/119.0
Energy [mJ] at 7Hz/15Hz 0.25/0.5*66.86 0.25/0.5*47.51
Total Power Loss [kW] at 7Hz/15Hz 14.4/28.9 7.23/14.5
*Cycle Energy is assumed to be 0.579*Avg Energy **Cavity geometry is based on TRIUMF with no further optimization
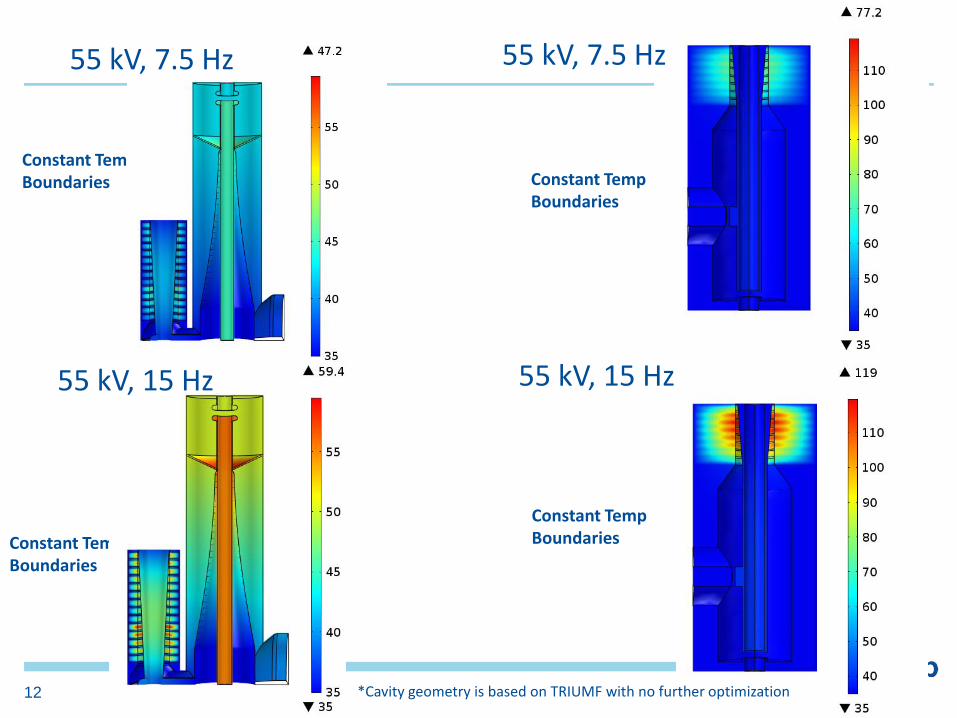
Constant Temp Boundaries Constant Temp
Boundaries
Constant Temp Boundaries
55 kV, 15 Hz
Constant Temp Boundaries
55 kV, 7.5 Hz 55 kV, 7.5 Hz
11/24/201512 *Cavity geometry is based on TRIUMF with no further optimization
55 kV, 15 Hz
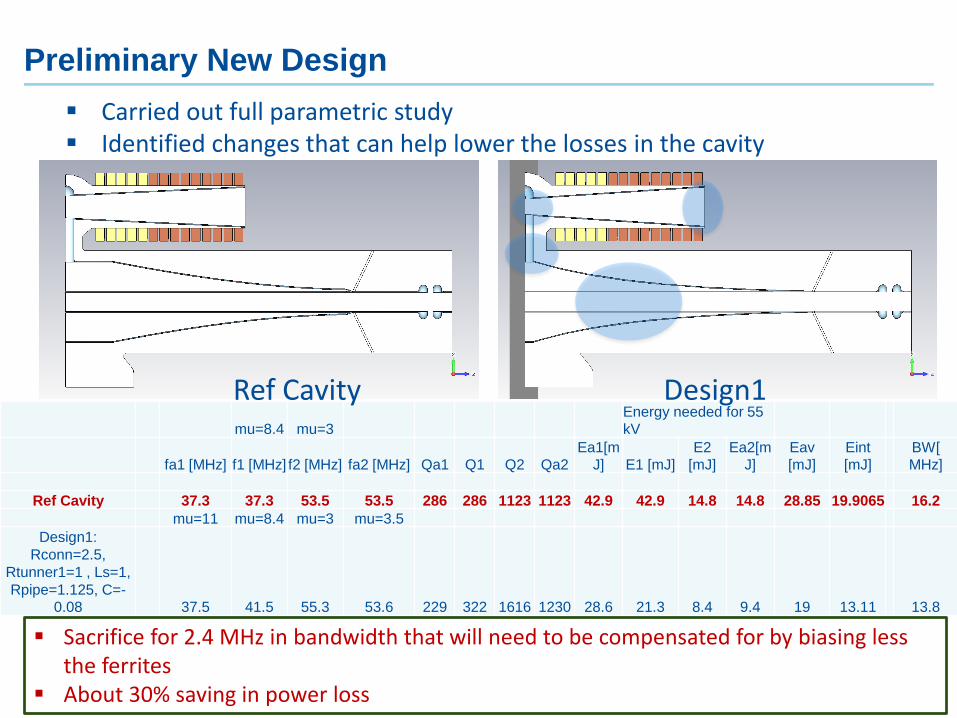
Preliminary New Design
mu=8.4 mu=3
Energy needed for 55
kV
fa1 [MHz] f1 [MHz] f2 [MHz] fa2 [MHz] Qa1 Q1 Q2 Qa2
Ea1[m
J] E1 [mJ]
E2
[mJ]
Ea2[m
J]
Eav
[mJ]
Eint
[mJ]
BW[
MHz]
Ref Cavity 37.3 37.3 53.5 53.5 286 286 1123 1123 42.9 42.9 14.8 14.8 28.85 19.9065 16.2
mu=11 mu=8.4 mu=3 mu=3.5
Design1:
Rconn=2.5,
Rtunner1=1 , Ls=1,
Rpipe=1.125, C=-
0.08 37.5 41.5 55.3 53.6 229 322 1616 1230 28.6 21.3 8.4 9.4 19 13.11 13.8
Sacrifice for 2.4 MHz in bandwidth that will need to be compensated for by biasing less the ferrites
About 30% saving in power loss
Ref Cavity Design1
Carried out full parametric study Identified changes that can help lower the losses in the cavity
PIPPIP-II
PIP-III
Mu of ferrites changes to mimic the bias cycle
PIP-III
PIP-II
PIP
Conclusion
A full detailed 3D model to the current cavity has been built
Current cavity has been subject to extensive electromagnetic
and thermal analysis
We were able to compare simulation and measurements for
CW operations with fairly good agreement
Further measurements are planned
We carried out a full parametric study to the current cavity
geometry
Modifications to the current cavity have been proposed
We have also explored the possibility of operating the cavity
under PIP-II and PIP-III frequency sweep scenarios
11/24/201532 Mohamed Hassan| EM Modeling of Fermilab’s Booster Cavity
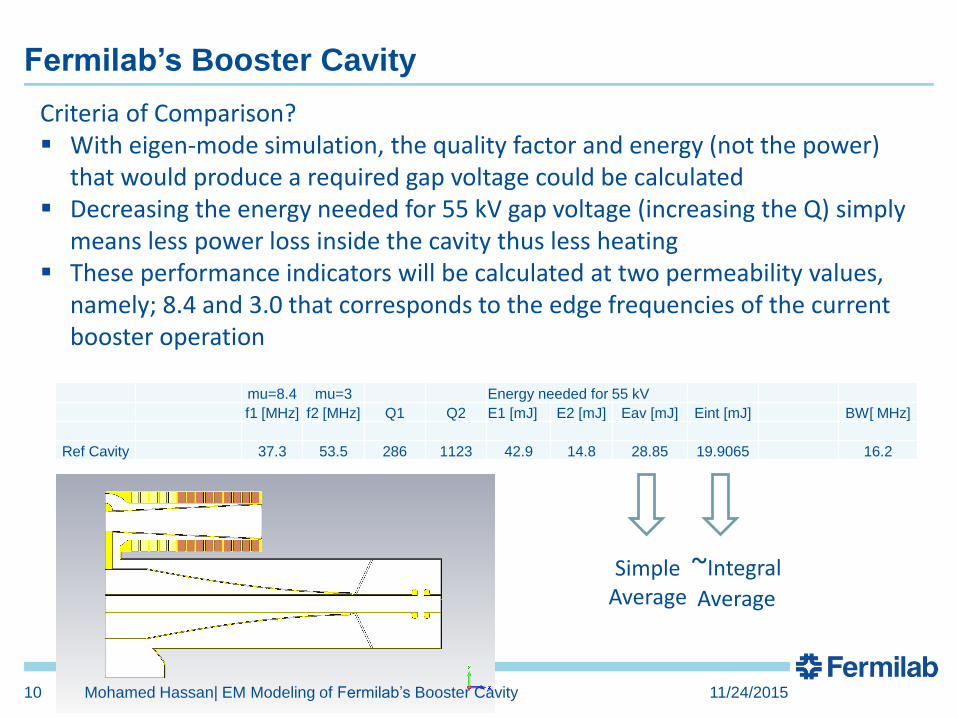
Fermilab’s Booster Cavity
mu=8.4 mu=3 Energy needed for 55 kV
f1 [MHz] f2 [MHz] Q1 Q2 E1 [mJ] E2 [mJ] Eav [mJ] Eint [mJ] BW[ MHz]
Ref Cavity 37.3 53.5 286 1123 42.9 14.8 28.85 19.9065 16.2
Criteria of Comparison? With eigen-mode simulation, the quality factor and energy (not the power)
that would produce a required gap voltage could be calculated Decreasing the energy needed for 55 kV gap voltage (increasing the Q) simply
means less power loss inside the cavity thus less heating These performance indicators will be calculated at two permeability values,
namely; 8.4 and 3.0 that corresponds to the edge frequencies of the current booster operation
Simple Average
~Integral
Average
11/24/2015Mohamed Hassan| EM Modeling of Fermilab’s Booster Cavity10
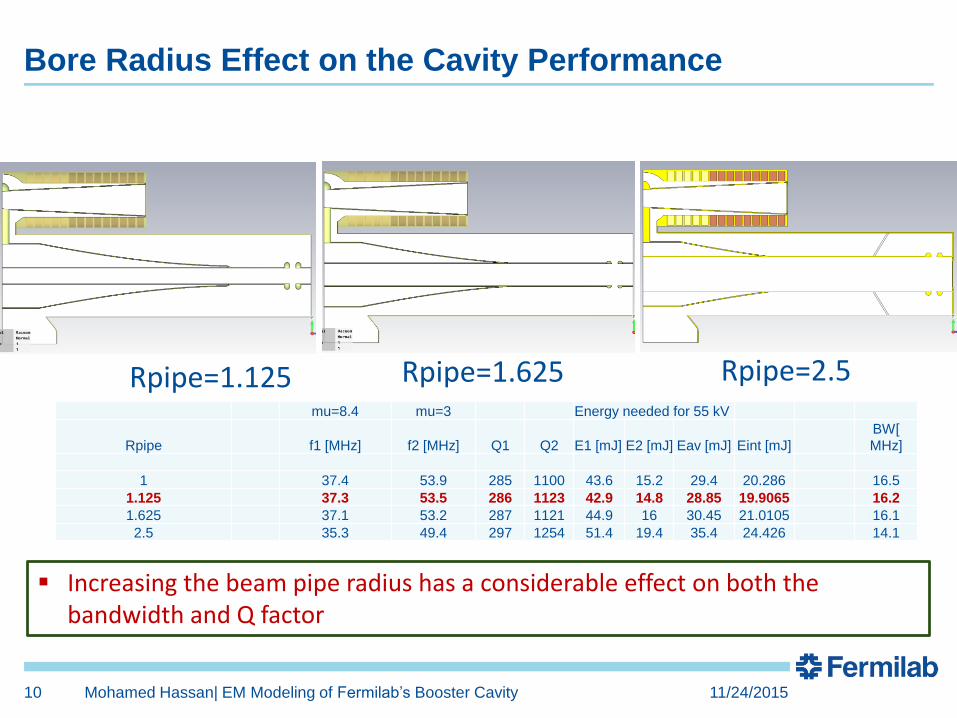
Bore Radius Effect on the Cavity Performance
mu=8.4 mu=3 Energy needed for 55 kV
Rpipe f1 [MHz] f2 [MHz] Q1 Q2 E1 [mJ] E2 [mJ] Eav [mJ] Eint [mJ]
BW[
MHz]
1 37.4 53.9 285 1100 43.6 15.2 29.4 20.286 16.5
1.125 37.3 53.5 286 1123 42.9 14.8 28.85 19.9065 16.2
1.625 37.1 53.2 287 1121 44.9 16 30.45 21.0105 16.1
2.5 35.3 49.4 297 1254 51.4 19.4 35.4 24.426 14.1
Increasing the beam pipe radius has a considerable effect on both the bandwidth and Q factor
Rpipe=1.125 Rpipe=1.625 Rpipe=2.5
Mohamed Hassan| EM Modeling of Fermilab’s Booster Cavity 11/24/201510