Embed Size (px)
Citation preview
1
Boosting visible light conversion in the confined pore space of nanoporous carbons
Alicia Gomis-Berenguer1, Jesus Iniesta2, Artur Moro3, Valter Maurino4, Joao C. Lima3, Conchi O. Ania 1*
1 Instituto Nacional del carbon (INCAR,CSIC), Apdo. 73, 33080 Oviedo, Spain 2 Institute of Electrochemistry, Faculty of Science, Univ. Alicante, 03080, Spain 3 Dpt. Chemistry, REQUIMTE/CQFB, Faculdade de Ciências e Tecnologia, Universidade
Nova de Lisboa, 2829-516 Lisboa, Portugal 4 Department of Chimica, Università di Torino, Via P. Giuria 5-7, 10125 Torino, Italy
Abstract
We showed the effect of commensurate confinement in the pores of nanoporous carbons in
the conversion of visible light into a chemical reaction. By using a series of nanoporous
carbons with a controlled distribution of pore sizes obtained from a gradual activation under
moderate conditions, we have demonstrated the superior conversion of light in the constrained
pore space of the carbons compared to values in solution. Besides a more efficient conversion
of light, nanopore confinement resulted in a 100-200 nm redshift in the wavelength onset of
the photochemical reaction. The visible light activity was boosted in pores which sizes match
the dimensions of the confined compound. We attribute this to the enhanced splitting and
charge separation of the photogenerated species in the nanopores, due to the proximity of the
charge carriers and the adsorbed molecules.
*Corresponding author. E-mail: [email protected] (CO Ania)
2
1. Introduction
Our recent research has put forward the intrinsic photochemical activity of nanoporous
carbons under adequate illumination conditions [1,2], demonstrating their ability to
photogenerate radical oxygen species (ROS) in aqueous environments [3,4]. This has opened
new perspectives in the field of applied photochemistry based on carbon materials covering
from photooxidation reactions for environmental remediation and photoassisted regeneration
of exhausted carbon adsorbents [5,6] to water splitting [7], enhanced adsorption/oxidation or
photoluminescence [8-11]. Despite the rising interest in the field, there is still a multitude of
fundamental questions that are worth investigating to exploit the potentialities of light-
responsive carbons for technological applications related to the conversion of light into
chemical reactions. In this regard, several authors have reported the possibility to modulate
the light absorption features of nanoporous carbons upon surface functionalization, favoring
the conversion of low energy photons from the visible light spectrum into chemical reactions
(i.e., photoelectrochemical water splitting) by introducing N and S-containing surface groups
on the carbon matrix [7, 11-14].
Aiming at throwing some light on the field, we herein show the dependence of the
photochemical response of carbons with the nanopore confinement and the wavelength of the
irradiation source, choosing the photooxidation of phenol as a model reaction. Conceptually,
the confinement of light in constrained pore spaces has been reported to enhance light-matter
interactions, allowing for instance measurements of low quantum yield photochemical
reactions [15,16]. Some studies have been performed on the accommodation of photoactive
guests inside the internal voids or nanocages of porous hosts (mostly for zeolites and MOFs),
but yet little is known about the effects of exciton confinement in the pore structure of light-
responsive carbons where the porous host exhibits strong absorption features. From a
technological viewpoint, only the understanding of the fundamentals of the photochemistry of
3
nanoporous carbons would allow a successful integration of these photoassisted reactions to a
wide panel of technological processes in the near future.
2. Experimental
2.1 Materials synthesis
A series of nanoporous carbons with progressively changing pore structures were obtained
from activation of coal under CO2 atmosphere (10ºC/min up to 850ºC in 100 mL/min N2, then
switch to CO2, 10 mL/min) for variable periods of time. The samples were labeled as F1 and
F4, where the number represents the increasing burn-off degree achieved in the activation.
Selected physicochemical characteristics along with the main textural parameters for porosity
characterization of the samples are compiled in Table 1.
Table 1. Main physicochemical characteristics of the studied nanoporous carbons obtained
from gas adsorption, chemical composition (wt.%), and surface pH.
F F1 F4 SBET[m2g-1] 799 1145 1800
VPORES [cm3 g-1] A 0.35 0.5 0.84
VMICROPORES [cm3 g-1] B 0.31 0.45 0.04 VMESOPORES [cm3 g-1] B 0.03 0.04 0.15 Wo N2 [cm3 g-1] C 0.34 0.55 0.80 Wo CO2 [cm3 g-1] C 0.25 0.33 0.36 L [nm] D 0.56 0.68 0.77 Porosity, ε[%] E 38 45 54 C (wt.%) 96.15 95.92 95.85 H (wt.%) 0.70 0.45 0.22 N (wt.%) 0.14 0.11 0.09 O (wt.%) 2.90 3.43 3.73 Surface pH 8.1 8.2 8.0 A Total pore volume evaluated from the N2 adsorption isotherms at -196 ºC at relative pressure of 0.99 B Pore volume evaluated from the N2 adsorption isotherms at -196 ºC using the 2D-NLDFT-HS method [17]
C Pore volume evaluated from the Dubinin-Radushkevich method applied to both CO2 and N2 adsorption isotherms
C Mean narrow micropore size evaluated from the Stoeckli-Ballerini equation applied to the CO2 adsorption isotherms
E Porosity (%) evaluated from the bulk and helium densities [18] ε (%) = [1- (ρapparent/ρHelium)] x 100
4
2.2 Irradiation set-up and phenol photooxidation.
A Xe lamp (300 W) coupled to a monochromator was used to irradiate the samples. The
photon flux arriving at each wavelength was measured by ferrioxalate actinometry [19], and
used to normalize the photochemical conversions (see Figure S1 in the Electronic
Supplementary Information File, ESI). Before irradiation, suspensions of the carbons in a
phenol solution are allowed to equilibrate until all phenol is completely adsorbed; then they
are irradiated for 30 min under stirring. The solution is filtered out and analyzed by reverse
phase HPLC and UV-visible spectrophotometry. The carbons are further extracted with
ethanol and the alcoholic solution is also analyzed to identify reaction intermediates.
Extraction yields are previously determined for each pure compound and carbon. The
corresponding blanks of direct degradation upon irradiation in the absence of catalyst were
carried out under similar conditions. All the measurements were done at least in duplicates;
average values and standard deviations are presented.
2.3 Characterization techniques.
The textural properties of the samples were determined by means of N2 and CO2 adsorption at
-196 and 0ºC, respectively, in volumetric analyzers. Before the experiments, the samples were
outgassed at 120 ºC overnight to constant vacuum (10-4 Torr). The specific surface area, SBET,
and pore volumes were evaluated from the gas adsorption isotherms. The pore size
distribution in the full micropore range was calculated using the 2D-NLDFT-HS model
assuming surface heterogeneity of carbon pores [17]. The mean narrow micropore size was
evaluated from the Stoeckli-Ballerini equation applied to the CO2 adsorption isotherms [18].
The carbon materials were further characterized by elemental analysis (LECO CHNS-932 and
VTF-900 automatic analyzers) and surface pH [20]. X-ray photoelectron spectra were
recorded on a SPECS spectrometer with a Phoibos 100 hemispherical analyzer with a
5
multichannel detector. The base pressure in the ultra high vacuum chamber was below 10-7
kPa. The X-ray radiation source was monochromatic AlKα (1486.74 eV) at 100W X-ray
power and anode voltage of 14 kV. The photo-excited electrons were analyzed in constant
pass energy mode, using pass energy of 50 eV for the Surrey spectra and 10 eV for the high
resolution core level spectra. During data processing of the XPS spectra, binding energy
values were referenced to the C 1s peak at 284.6 eV. The CasaXPS software package was
used for acquisition and data analysis. A Shirley-type background was subtracted from the
signals. Recorded spectra were always fitted using Gauss–Lorentz curves, in order to
determine the binding energy of the different element core levels more accurately. The error
in binding energy was estimated to be ca. 0.1 eV. Raman spectroscopy was performed by
excitation with green laser light (532 nm) in the range between 800-3550 cm-1. The spectra
were acquired in a Jobin-Yvon Horiba HR800 spectrometer equipped with a Leica
microscope. The acquisition time for each spectrum was 300 s; to guarantee a representative
sampling, spectra were recorded in 4 different spots for each sample.
2.4. Spin Trapping Electron Spin Resonance (ESR) Measurements.
The formation of paramagnetic species in solution during irradiation of the carbon
suspensions was detected by a nitrone spin trapping agent (5,5-dimethylpyrroline-N-oxide,
DMPO). This compound is capable of forming spin adducts with hydroxyl and superoxide
radicals, creating more stable nitrone radicals that are easily detected by ESR spectroscopy in
aqueous solution. About 0.5 g/L of the carbon samples were suspended in 5 ml of HClO4
buffer (pH 3), and the appropriate volume of DMPO was added to the suspension to reach a
final concentration of 18 mM. Samples were introduced in capillary quartz tubes and
irradiated for 5, 10, 20 and 60 minutes (Philips TL K40W/05 lamp, with a broad emission
peak centered at 365 nm). ESR spectra were immediately recorded from the solution (after
6
filtering out the solids) at room temperature on a Bruker ESP 300E X band spectrometer with
the following spectral parameters: receiver gain 105; modulation amplitude 0.52 G;
modulation frequency 100 KHz, microwave frequency 9.69 GHz; microwave power
5.024 mW; conversion time 40.96 ms; center field 3450 G, sweep width 120 G.
3. Results and discussion
To tackle the study of the carbon/light interactions occurring inside nanoconfined pore spaces
it becomes crucial to avoid other secondary reactions inherent to high energy irradiation
sources and porous materials (i.e. direct photolysis and adsorption). We have developed a
strategy to overcome this limitation based on evaluating the efficiency of a photochemical
reaction -for instance, the photooxidation of phenol in solution- occurring in the inner void
space of nanoporous materials (see scheme in ESI). The approach consists in introducing the
target compound inside the pore structure of the nanoporous carbon (adsorbed), and
illuminating the suspension in water for a predetermined time. After irradiation, both
components of the suspension (solution and carbon) are analyzed to determine if there has
been lixiviation to the solution (not being the case for any of the studied materials) and the
compounds still retained inside the porosity of the carbon after light exposure, using
extraction in ethanol. This allows to determine the extent of the photochemical reaction that
takes place inside the porosity of the material [1,2].
The starting carbon (sample F) of this study is a biomass-derived material, chosen for its
photochemical activity under UV light [2] and narrow distribution of pore sizes within the
micropore range as evidenced from gas adsorption data obtained from nitrogen and carbon
dioxide (Figure 1, Table 1). To gain additional insight on the effect of light conversion inside
nanoconfined pore spaces, sample F was activated under CO2 atmosphere for variable periods
of time to obtain samples F1 and F4 with increasing burn-off degrees. It is important to
7
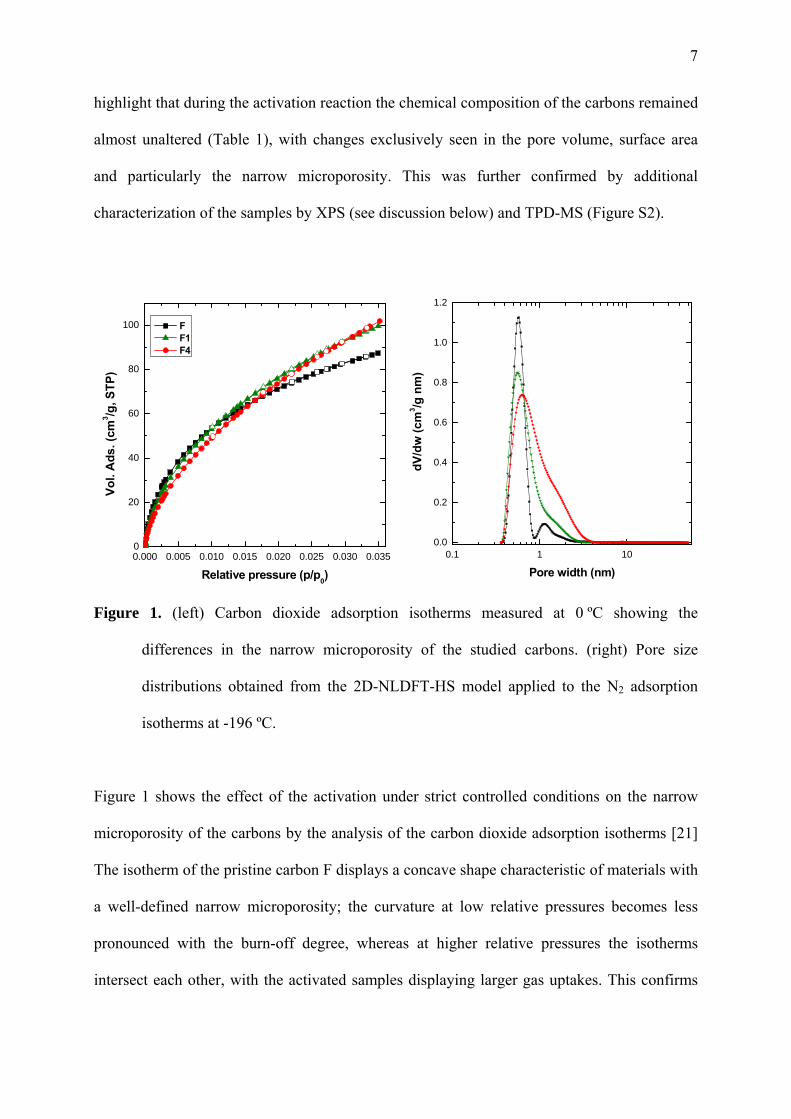
highlight that during the activation reaction the chemical composition of the carbons remained
almost unaltered (Table 1), with changes exclusively seen in the pore volume, surface area
and particularly the narrow microporosity. This was further confirmed by additional
characterization of the samples by XPS (see discussion below) and TPD-MS (Figure S2).
Figure 1. (left) Carbon dioxide adsorption isotherms measured at 0 ºC showing the
differences in the narrow microporosity of the studied carbons. (right) Pore size
distributions obtained from the 2D-NLDFT-HS model applied to the N2 adsorption
isotherms at -196 ºC.
Figure 1 shows the effect of the activation under strict controlled conditions on the narrow
microporosity of the carbons by the analysis of the carbon dioxide adsorption isotherms [21]
The isotherm of the pristine carbon F displays a concave shape characteristic of materials with
a well-defined narrow microporosity; the curvature at low relative pressures becomes less
pronounced with the burn-off degree, whereas at higher relative pressures the isotherms
intersect each other, with the activated samples displaying larger gas uptakes. This confirms
0.1 1 100.0
0.2
0.4
0.6
0.8
1.0
1.2
dV/d
w (c
m3 /g
nm
)
Pore width (nm)0.000 0.005 0.010 0.015 0.020 0.025 0.030 0.0350
20
40
60
80
100
Vol.
Ads
. (cm
3 /g, S
TP)
Relative pressure (p/p0)
F F1 F4
8
the enlargement of the micropores with the activation treatment, also evidenced by the L
parameter representing the mean pore size (Table 1) and the distribution of pore sizes in the
full micro- mesopore range (Figure 1).
For the photochemical experiments, the carbons were loaded with a fixed amount of phenol
per unit mass (ca. 0.09 mmol/g), chosen to keep the loading of phenol below the saturation
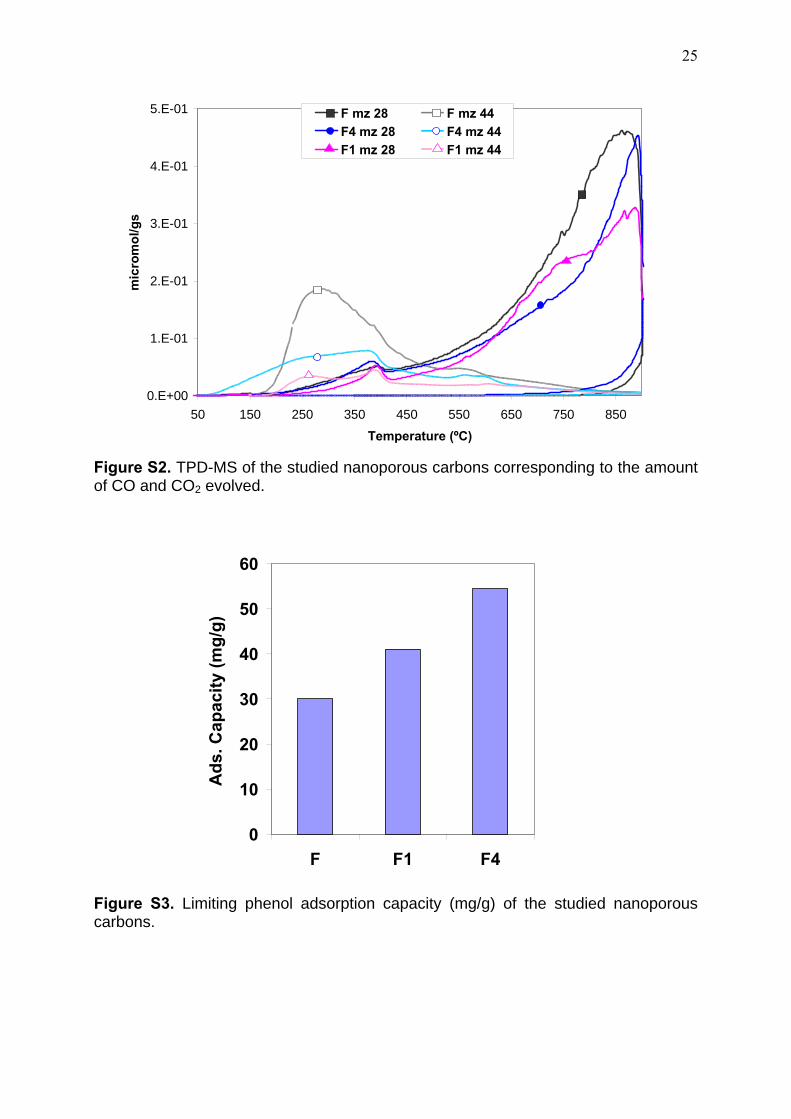
limit for all three studied carbons (Figure S3). This procedure allows confining the adsorbed
fraction of phenol into the narrow microporosity of the carbons [22,23]. This avoids
desorption in the course of the irradiation (thus contribution of photolytic breakdown is
discarded) [1,2]. It also leads to high photoconversion values, thereby minimizing any
experimental error associated to the quantification of the compounds in the extracts. The
wavelength dependence of the photochemical activity of the carbons was determined using
monochromatic light. Unlike most studies dealing with polychromatic light, this allows
discriminating between the contributions of the high/low energy photons, and hence isolating
any actual visible-light conversion without biased interpretations.
Figure 2 shows phenol conversion values (data from the extracts) upon irradiation of the pre-
loaded nanoporous carbons at selected wavelengths. As the incident photon flux is different
for each wavelength (Figure S1), conversion was normalized per photon flux to allow direct
comparison of all data. For clarity, the measured (non-corrected) values of phenol conversion
at each wavelength are also presented in Figure 2C.
The composition of the extracts after irradiation of the preloaded carbons confirmed the
photoinduced degradation of phenol in the constrained pore space for all the studied samples
and at all selected wavelengths. This is most remarkable considering that carbons are strong
light absorbers, and hence a large fraction of the light is not expected to reach the adsorbed
molecules retained in the inner porosity. Most importantly, phenol conversion in the confined
state is higher than that of direct photolysis from solution (ca. below 2%) as seen in Figure
9
2C, corroborating the outstanding role of nanoconfinement in enhancing the light conversion
into a chemical reaction. Also, whereas direct photochemical breakdown of phenol from
solution is negligible at wavelengths above 300 nm, high conversion values are obtained at
450 and 500 nm when the photochemical reaction was carried out inside the confined pore
space. This corresponds to over 100-200 nm redshift in the wavelength onset for the
photochemical reaction compared to photolysis in solution, and clearly demonstrates the
ability of nanoporous carbons to convert sunlight into a chemical reaction.
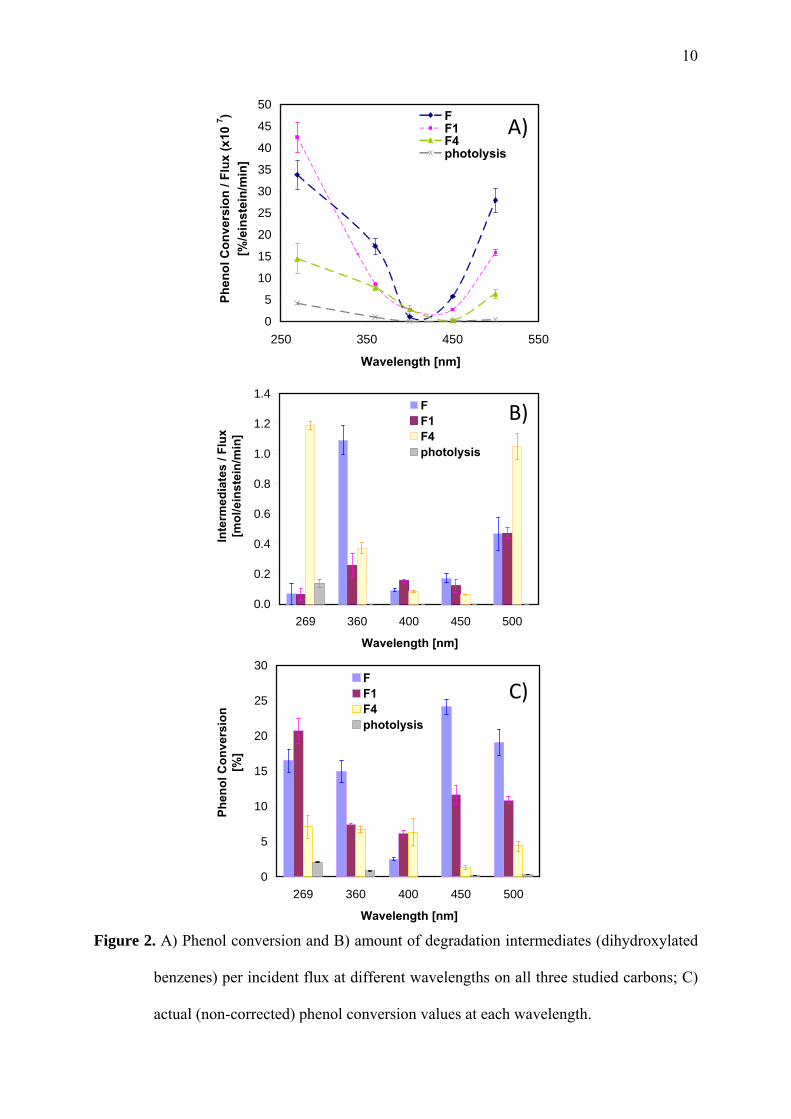
Interestingly, the photochemical performance followed a U-shaped pattern rather than a
decreasing trend with the wavelength (Figure 2A). All three carbons showed a minimum at
400 nm, derived from very low conversion values (Figure 2C), whereas at wavelengths
corresponding to visible light (i.e., 450 and 500 nm), the conversion rose again with values
very close to those obtained at 269 nm. In our previous studies we also observed low
conversion values at 400 nm using a different lamp set-up, and tentatively attributed this to
the low photon flux provided by the source at this wavelength, rather than to the inactivity of
the carbon materials [1]. This hypothesis however would not apply to these systems since the
incident photon flux at 400 nm is several times higher than those measured for the rest of the
wavelengths (Figure S1). Yet the conversion values at 400 nm are much lower than those of
the other wavelengths in the series.
10
Figure 2. A) Phenol conversion and B) amount of degradation intermediates (dihydroxylated
benzenes) per incident flux at different wavelengths on all three studied carbons; C)
actual (non-corrected) phenol conversion values at each wavelength.
0
5
10
15
20
25
30
35
40
45
50
250 350 450 550
Wavelength [nm]
Phen
ol C
onve
rsio
n / F
lux
(x10
7 ) [%
/ein
stei
n/m
in]
FF1F4photolysis
A)
0.0
0.2
0.4
0.6
0.8
1.0
1.2
1.4
269 360 400 450 500
Wavelength [nm]
Inte
rmed
iate
s / F
lux
[mol
/ein
stei
n/m
in]
FF1F4photolysis
B)
0
5
10
15
20
25
30
269 360 400 450 500
Wavelength [nm]
Phen
ol C
onve
rsio
n [%
]
FF1F4photolysis
C)
11
Interesting features are revealed for the wavelength dependence of the photooxidation yields
with the activation treatment. Despite all three carbons showed a similar wavelength onset of
the photochemical activity -in agreement with the performance described for other
nanoporous carbons in our earlier works- [1], we herein report the correlation of these
differences in conversion with the confinement state of the adsorbed molecules. Phenol
conversions (Figure 2) followed the general trend: F >F1>F4, with larger differences at higher
energy photons (lower wavelengths), demonstrating a more successful exploitation of light in
tight confinements. Only the performance at 269 nm slightly escapes from this trend, as the
photochemical conversion inside F and F1 is rather alike. The amount of degradation
intermediates (dihydroxylated benzenes) also varies with the confinement and the illumination
conditions (Figure 2B). At 269 nm both phenol and its aromatic intermediates are efficiently
decomposed, whereas as the irradiation becomes less energetic the amount of intermediates
gradually increases -conversion of phenol does not follow the same trend-; this points out that
the photooxidation reaction is hindered or delayed to some extent, likely due to the difficulty
in pursuing the oxidation of dihydroxylated compounds under visible light.
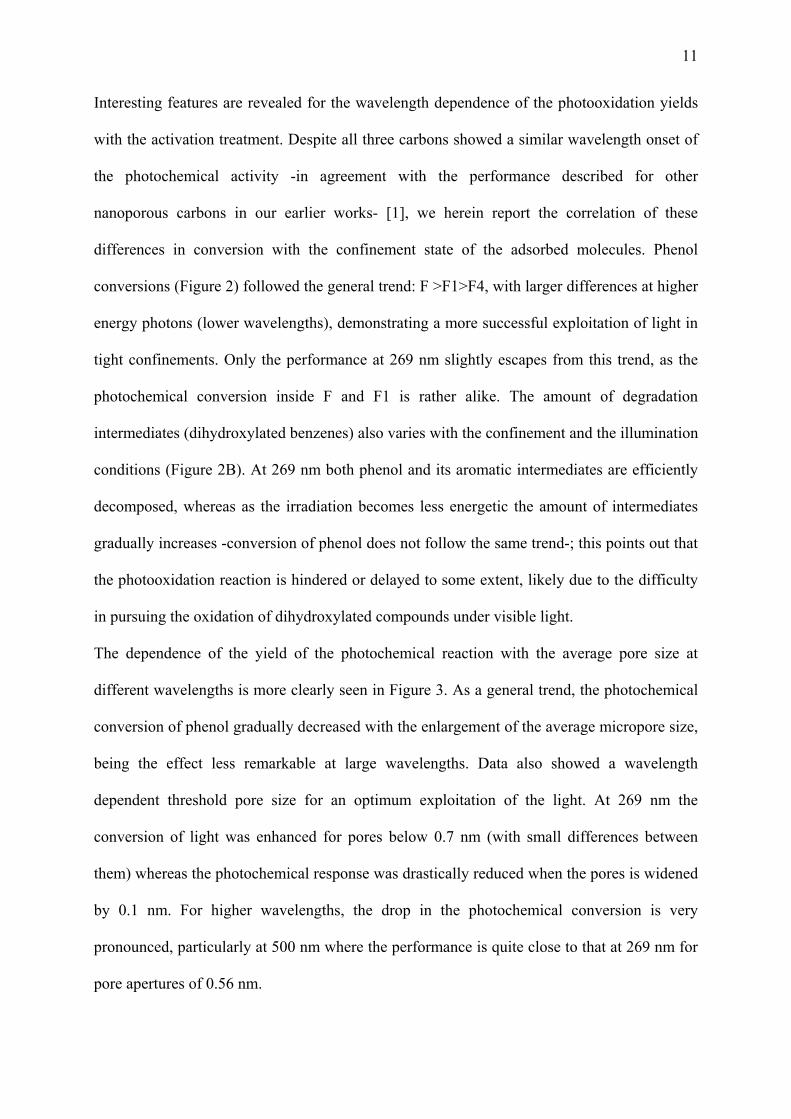
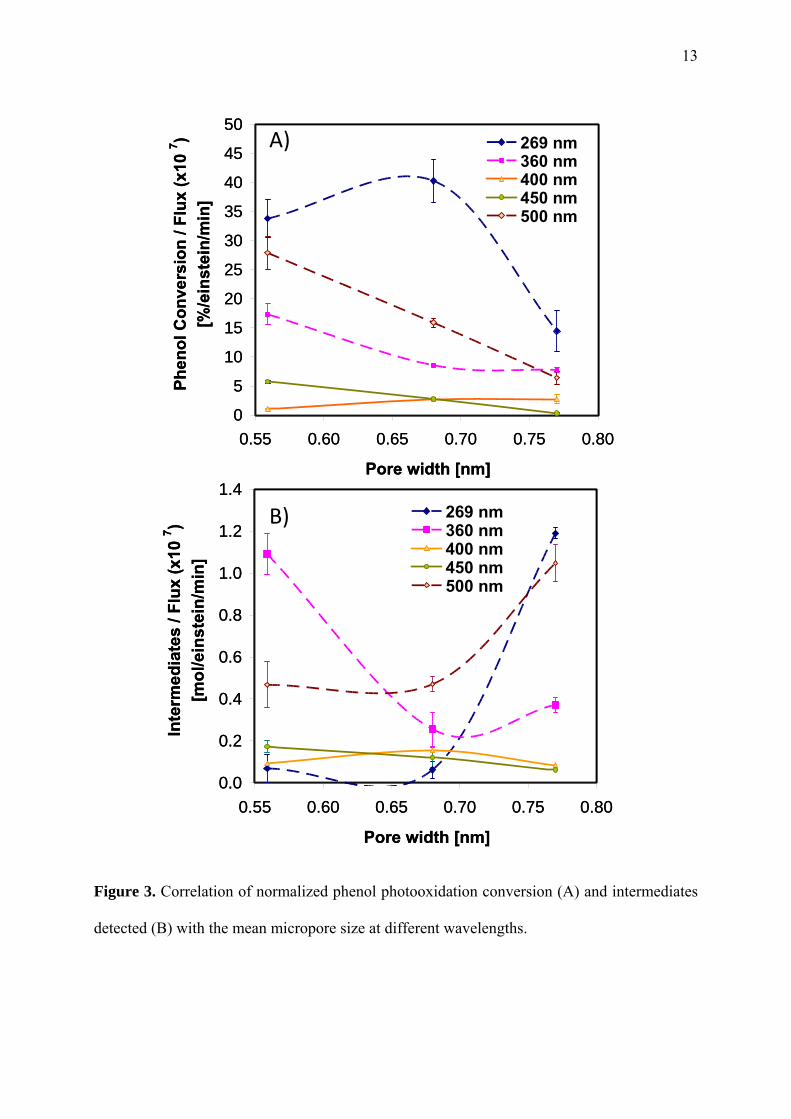
The dependence of the yield of the photochemical reaction with the average pore size at
different wavelengths is more clearly seen in Figure 3. As a general trend, the photochemical
conversion of phenol gradually decreased with the enlargement of the average micropore size,
being the effect less remarkable at large wavelengths. Data also showed a wavelength
dependent threshold pore size for an optimum exploitation of the light. At 269 nm the
conversion of light was enhanced for pores below 0.7 nm (with small differences between
them) whereas the photochemical response was drastically reduced when the pores is widened
by 0.1 nm. For higher wavelengths, the drop in the photochemical conversion is very
pronounced, particularly at 500 nm where the performance is quite close to that at 269 nm for
pore apertures of 0.56 nm.
12
To understand this behavior we must consider the confinement state of the adsorbed
molecules in the constrained pore space. As mentioned above, the amount of phenol
incorporated in the pores was below the saturation limit of the carbons to restrict the
confinement of the adsorbed molecules to the narrow microporosity (molecular dimensions of
phenol are 0.80 x 0.67 x 0.15 nm) [24] in single adsorption layers (maximizing host-guest
interactions). According to literature [22,23], adsorption of phenol and its derivatives on
hydrophobic carbons is governed by dispersive interactions with molecules predominantly
adsorbed in an edge-wide orientation, with the aromatic ring parallel to the pore walls (plane-
on) and the hydroxyl moiety projecting away from pore walls towards the aqueous phase [25].
On the other hand, the light absorption features of amorphous carbons depend on the Density
Of electronic States, DOS, (mainly sp2/sp3 hybridization ratio of the carbon atoms), and in the
UV range are dominated by π−π∗ and σ−π* transitions involving free zig-zag sites and
carbine-like sites [23-28]. Under sunlight irradiation, some other transitions involving the
activation of chromophoric groups on the carbon surface have been proposed [7-9, 29].
Considering the low and quite similar functionalization of these carbons (Table 1), we expect
the latter contribution to be small.
Hence, irradiation of the carbons gives rise to the formation of excitons (holes or electrons),
which when splitting is favored can participate in charge transfer reactions with electron
donors present in the reaction medium [30,31]. The superior conversion of the carbons
compared to the photolytic reaction confirms that the light conversion is boosted in the
constrained pore space, and the differences for the three materials point out the role of
confinement.
13
Figure 3. Correlation of normalized phenol photooxidation conversion (A) and intermediates
detected (B) with the mean micropore size at different wavelengths.
0
5
10
15
20
25
30
35
40
45
50
0.55 0.60 0.65 0.70 0.75 0.80
Pore width [nm]
Phen
ol C
onve
rsio
n / F
lux
(x10
7 ) [%
/ein
stei
n/m
in]
269 nm360 nm400 nm450 nm500 nm
0.0
0.2
0.4
0.6
0.8
1.0
1.2
1.4
0.55 0.60 0.65 0.70 0.75 0.80
Pore width [nm]
Inte
rmed
iate
s / F
lux
(x10
7 ) [m
ol/e
inst
ein/
min
]
269 nm360 nm400 nm450 nm500 nm
A)
B)
0
5
10
15
20
25
30
35
40
45
50
0.55 0.60 0.65 0.70 0.75 0.80
Pore width [nm]
Phen
ol C
onve
rsio
n / F
lux
(x10
7 ) [%
/ein
stei
n/m
in]
269 nm360 nm400 nm450 nm500 nm
0.0
0.2
0.4
0.6
0.8
1.0
1.2
1.4
0.55 0.60 0.65 0.70 0.75 0.80
Pore width [nm]
Inte
rmed
iate
s / F
lux
(x10
7 ) [m
ol/e
inst
ein/
min
]
269 nm360 nm400 nm450 nm500 nm
A)
B)
14
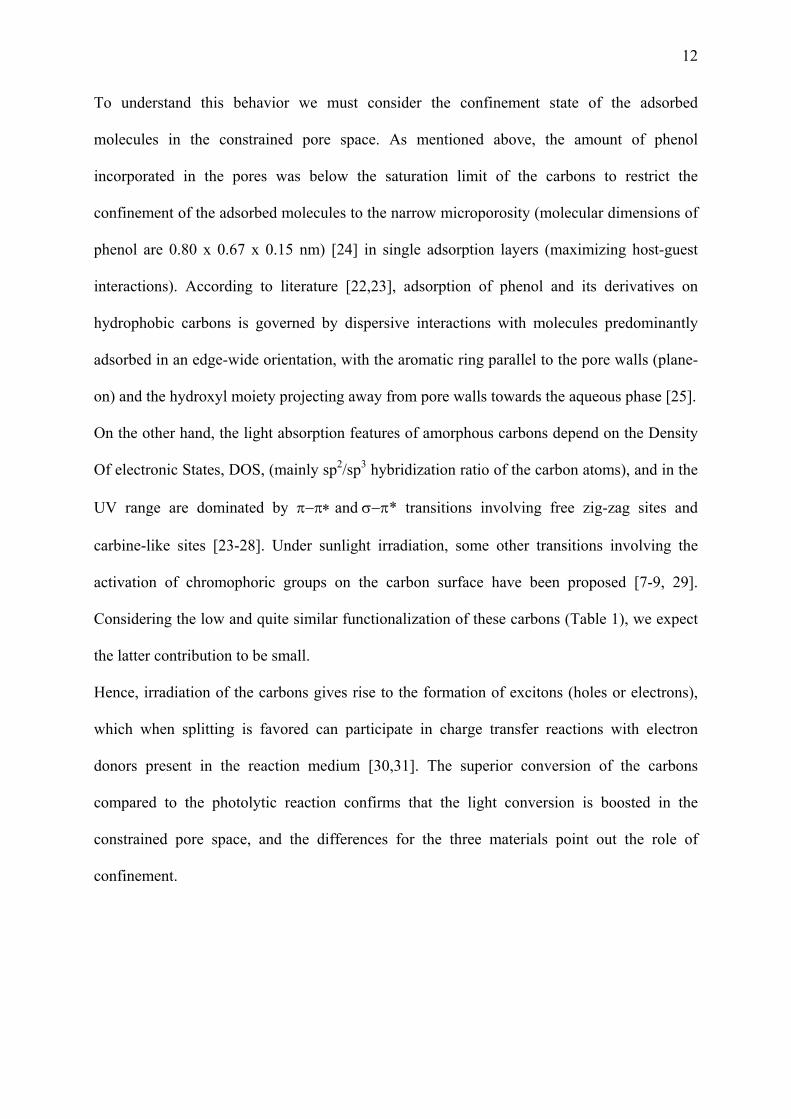
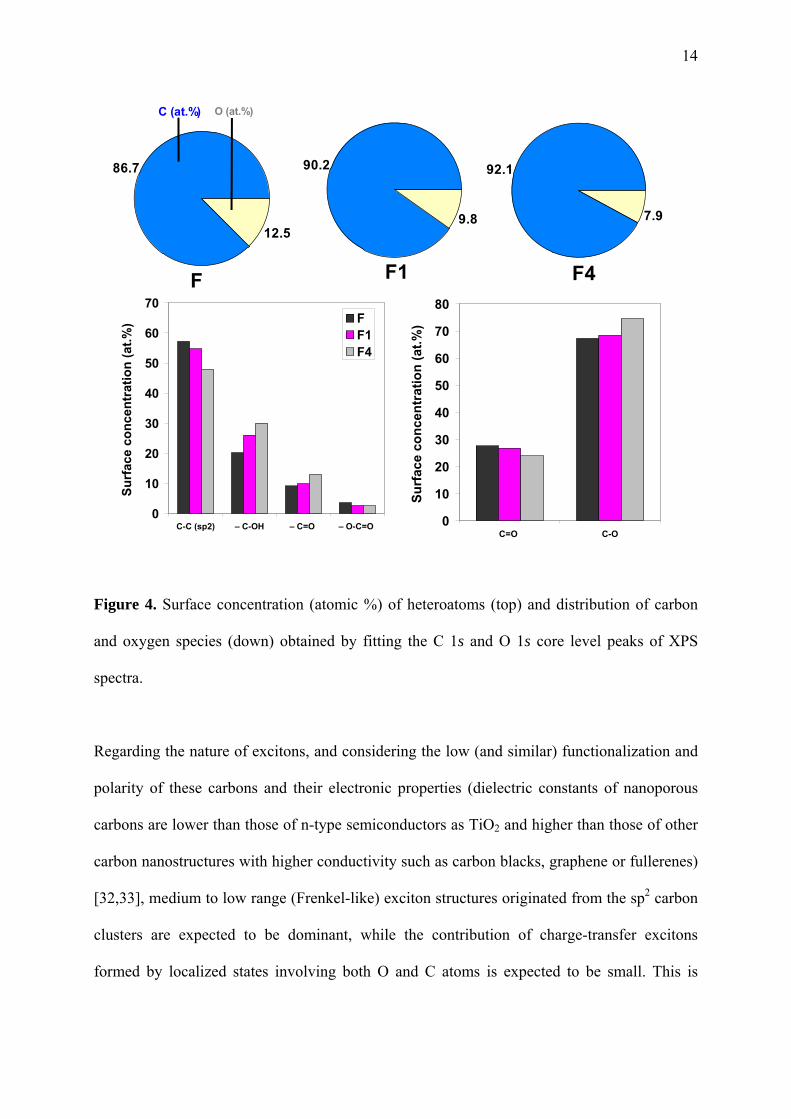
Figure 4. Surface concentration (atomic %) of heteroatoms (top) and distribution of carbon
and oxygen species (down) obtained by fitting the C 1s and O 1s core level peaks of XPS
spectra.
Regarding the nature of excitons, and considering the low (and similar) functionalization and
polarity of these carbons and their electronic properties (dielectric constants of nanoporous
carbons are lower than those of n-type semiconductors as TiO2 and higher than those of other
carbon nanostructures with higher conductivity such as carbon blacks, graphene or fullerenes)
[32,33], medium to low range (Frenkel-like) exciton structures originated from the sp2 carbon
clusters are expected to be dominant, while the contribution of charge-transfer excitons
formed by localized states involving both O and C atoms is expected to be small. This is
0
10
20
30
40
50
60
70
80
C=O C-O
Surf
ace
conc
entr
atio
n (a
t.%)
0
10
20
30
40
50
60
70
C-C (sp2) – C-OH – C=O – O-C=O
Surf
ace
conc
entr
atio
n (a
t.%) F
F1F4
86.7
12.5
C (at.%)
F
90.2
9.8
F1
92.1
7.9
F4
O (at.%)
15
consistent with the behavior reported for other carbons nanostructures based on experimental
observations and molecular simulations [34,35].
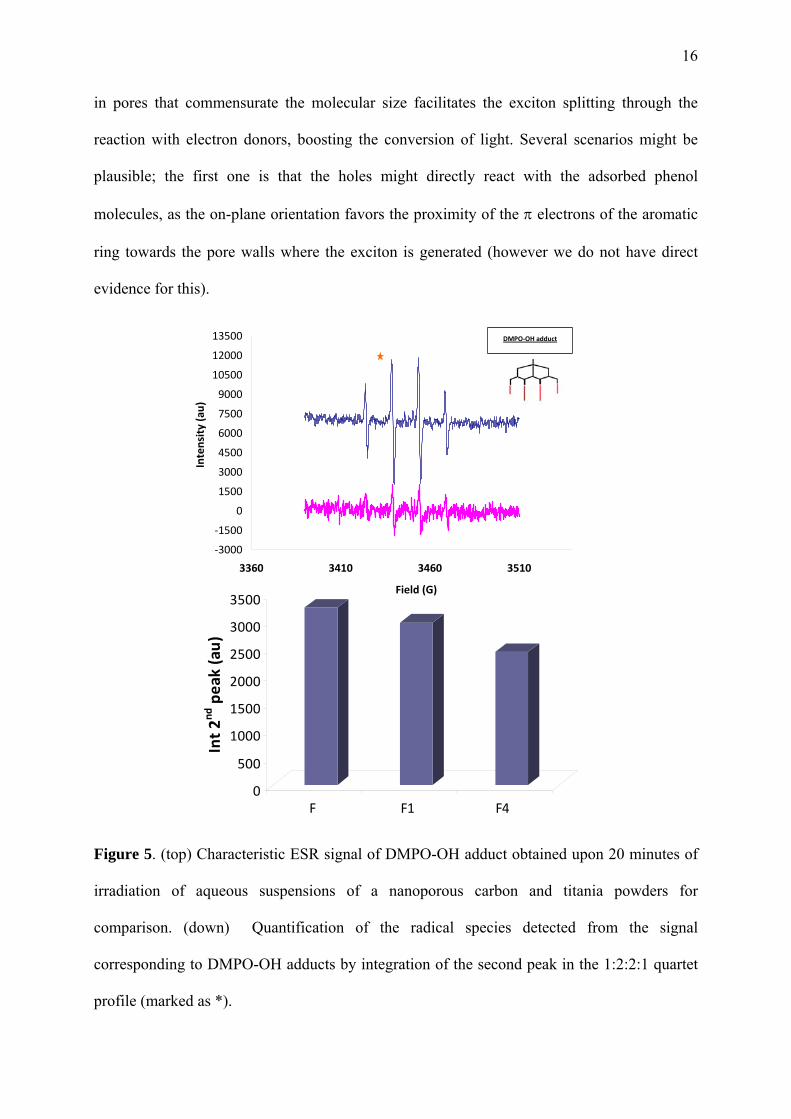
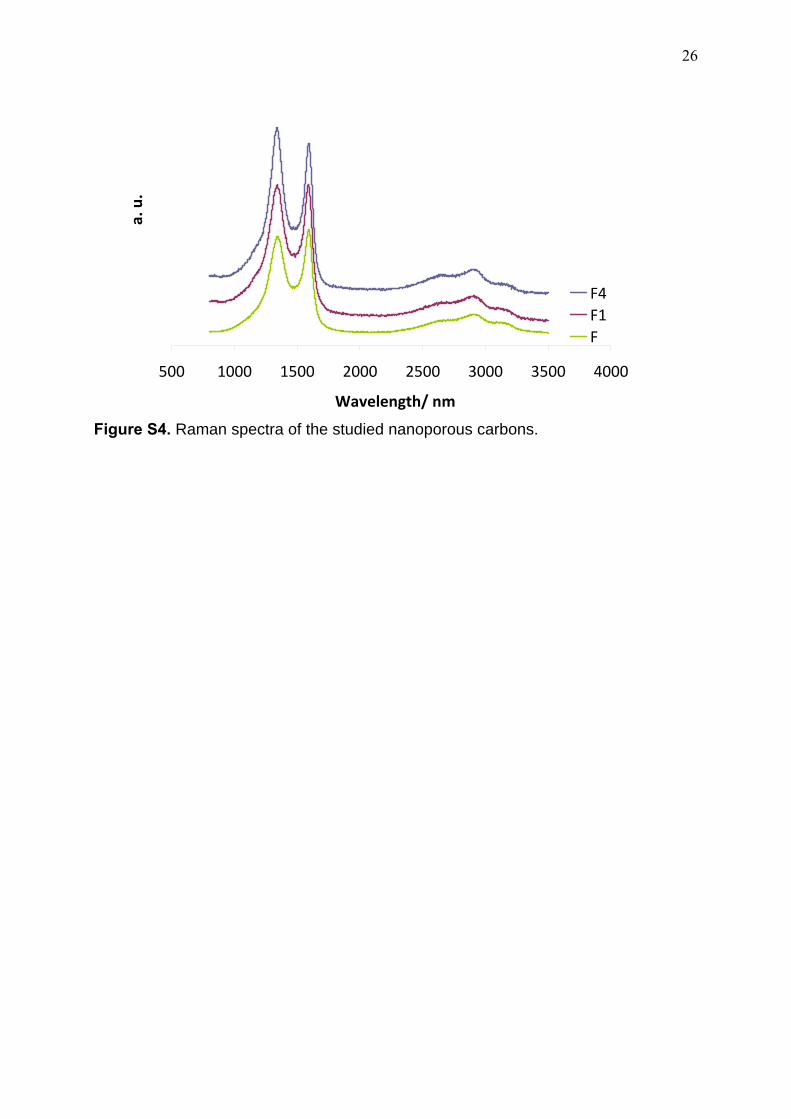
In this regard, Raman spectra of the three studied carbons show similar profiles for all of
them, with the characteristic D and G bands broad of disordered carbons in the region
between 1000-2000 cm-1 (Figure S4). The structural ordering of the carbon network was
evaluated by the IG/ID ratio upon deconvolution of the spectra (Table 2); increasing the
burn-off degree caused a slight increase in the IG/ID ratio, although changes are subtle. The
broadening of the D band is also similar -indicating similar sizes of graphitic crystallite
domains-, and overall the three carbons display similar structural disorder. Furthermore, the
three carbons also display similar electrical conductivity values (ca. 0.5-0.8 S/cm).
Table 2. Raman shift and width values for the D and G bands calculated from the
deconvoluted spectra.
D shift (cm-1)
G shift (cm-1)
D band FWHM
G band FWHM IG/ID
F 1343 1586 126 73 1.03 F1 1342 1593 122 64 0.96 F4 1338 1591 114 64 0.86
Considering all the above, the characterization of the carbons confirmed that the smooth CO2
activation treatment affected mostly the enlargement of the micropores (Figure 1). Indeed, no
significant changes were detected either on the surface functionalization of the activated
samples (Table 1), on the disorder degree derived from the removal of carbon atoms at the
edges (Table 2), or by inducing structural defects due to modifications in the sp2/sp3
hybridization of carbon atoms (Figure 4). All of these would eventually have a strong effect in
the optical characteristics (ca. creation of distorted sites in the DOS) of the carbons, and the
stabilization of the photogenerated carriers through the delocalization within the conjugated
sp2 network of the basal planes. On the contrary, differences must be attributed to the fate of
the charge carriers in the constrained pore space. The tight confinement of phenol molecules
16
in pores that commensurate the molecular size facilitates the exciton splitting through the
reaction with electron donors, boosting the conversion of light. Several scenarios might be
plausible; the first one is that the holes might directly react with the adsorbed phenol
molecules, as the on-plane orientation favors the proximity of the π electrons of the aromatic
ring towards the pore walls where the exciton is generated (however we do not have direct
evidence for this).
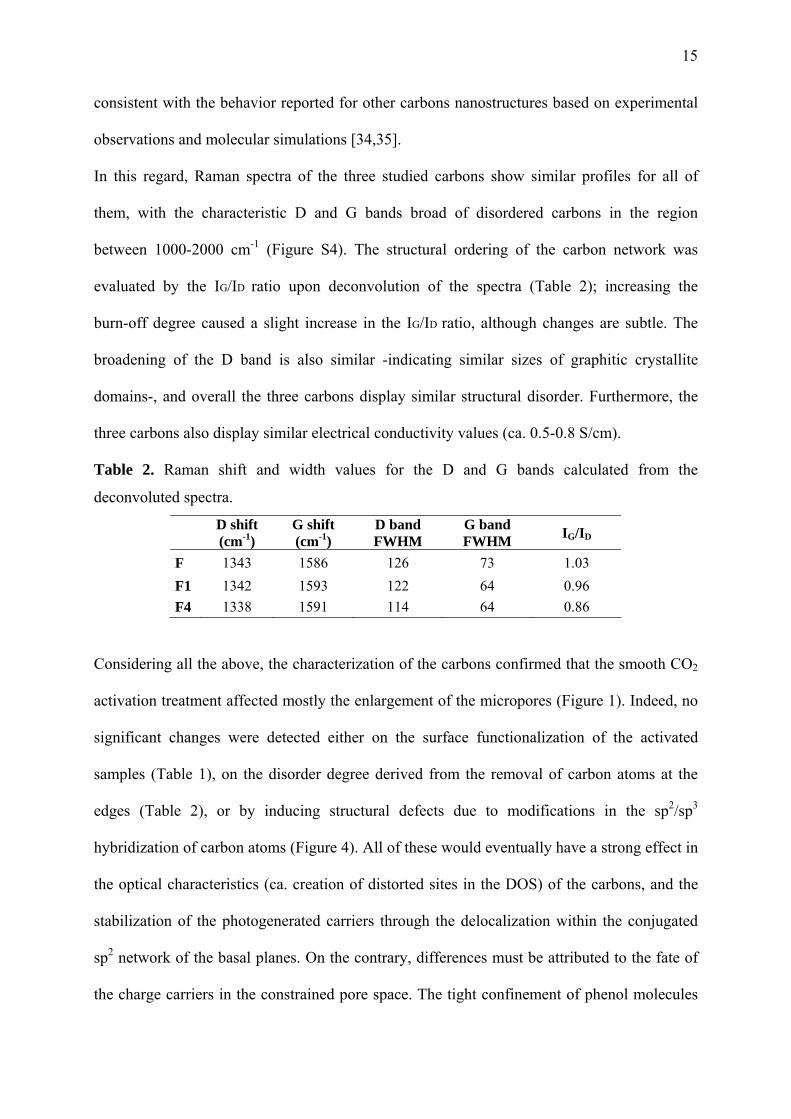
Figure 5. (top) Characteristic ESR signal of DMPO-OH adduct obtained upon 20 minutes of
irradiation of aqueous suspensions of a nanoporous carbon and titania powders for
comparison. (down) Quantification of the radical species detected from the signal
corresponding to DMPO-OH adducts by integration of the second peak in the 1:2:2:1 quartet
profile (marked as *).
0
500
1000
1500
2000
2500
3000
3500
Int 2n
d pe
ak (a
u)
F F1 F4
‐3000
‐1500
0
1500
3000
4500
6000
7500
9000
10500
12000
13500
3360 3410 3460 3510
Field (G)
Intensity (au)
DMPO‐OH adduct
17
Another possibility is the stabilization of the holes through the oxidation of water molecules
co-confined in the pores along with phenol to form hydroxyl radicals. This is supported by the
detection of ROS after irradiation of aqueous suspensions of the carbons using spin resonance
spectroscopy and nitrones as spin trapping chemicals (Figure 5). The photogeneration of
hydroxyl radicals for all the carbons corroborates the separation of the exciton and migration
to the aqueous solution. When phenol is introduced inside the nanopores, the radicals are
more efficiently used for the photooxidation of the adsorbed molecules, as corroborated by the
nature of the intermediates detected (namely dihydroxylated benzenes).
CONCLUSIONS
We report the superior conversion of light into a chemical reaction boosted in the constrained
pore space of nanoporous carbons. Matching of the molecular dimensions of the target
compound confined in the carbon pore network results in a 100 nm red-shift of light
conversion. As a result, the proximity between the photogenerated charge carriers and the
adsorbed molecule in the constrained pore space facilitates the exciton splitting and the charge
separation, enhancing the conversion of the photooxidation reaction under both UV and
sunlight.
We anticipate that tuning the porous network of nanoporous carbons with photochemical
activity opens up an interesting strategy to master the conversion of light in chemical
reactions, especially favoring the utilization of sunlight. The control of the pore structure of
nanoporous carbons is no longer a challenge, which offers an interesting opportunity to
improve light harvesting through the control of the physicochemical features of low cost
porous carbons to facilitate exciton splitting.
18
Owing to the recently gained interest on the use of carbon materials in photochemical
applications and their versatility of forms, structures and precursors, our findings demonstrate
that it is highly feasible to push the use of nanoporous carbons as sustainable metal-free and
low cost photoactive materials, particularly when much attention is lately being paid to the
investigation of more sophisticated forms of carbons (graphene, nanotubes, graphite oxide), so
far considered non photoactive under visible light.
The challenge still remains in the further enhancement of the photochemical activity by
balancing the surface composition, porosity, and change-carrier mobility. The dependence of
the photochemical activity of the studied carbons with the nanopore confinement described
here is expected to be valuable in general for targeting other applications in the fields of solar
energy conversion (e.g. water splitting, carbon photofixation reactions, photovoltaic devices)
on light responsive carbons.
ACKNOWLEDGMENTS
COA thanks the financial support of MINECO (CTM2014-56770-R). AGB thanks MINECO
for her PhD fellowship (BES-2012-060410).
REFERENCES
[1] Velasco LF, Lima JC, Ania CO. Visible-light photochemical activity of nanoporous
carbons under monochromatic light. Angew. Chem. Int. Ed. 2014; 53:4146-4148.
[2] Velasco LF, Parra JB, Fonseca IM, Lima JC, Ania CO. Photochemical behaviour of
activated carbons under UV irradiation. Carbon 2012; 50:249-258.
[3] Velasco LF, Maurino V, Laurenti E, Fonseca IM, Lima JC, Ania CO. Photoinduced
reactions occurring on activated carbons. A combined photooxidation and ESR study.
Appl. Catal. A General 2013; 452:1-8.
19
[4] Velasco LF, Maurino V, Laurenti E, Ania CO. Light-induced generation of radicals on
semiconductor-free carbon photocatalysts. Appl. Catal. A General 2013; 453:310-315.
[5] Velasco LF, Carmona RJ, Matos J, Ania CO. Performance of activated carbons in
consecutive phenol photooxidation cycles. Carbon 2014; 73:206-215.
[6] Velo-Gala I, Lopez-Peñalver JJ, Sanchez-Polo M, Ribera-Utrilla J. Activated carbon as
photocatalyst of reactions in aqueous phase. Appl. Catal. B 2013; 142: 694-704.
[7] Ania CO, Seredych M, Rodriguez-Castellon E, Bandosz TJ. Visible light drieven
photoelectrochemical wáter splitting on metal free nanoporous carbon promoted by
chromophoric functional groups. Carbon 2014; 79:432-441.
[8] Bao L, Zhang ZL, Tian ZQ, Zhang L, Liu C, Lin Y, Qi B, Pang DW. Electrochemical
tuning of luminescent carbon nanodots: From preparation to luminescence mechanism.
Adv. Mater. 2011; 23:5801-5806.
[9] Bao Q, Zhang J, Pan C, Li J, Li CM, Zang J, Tang DY. Recoverable photoluminescence
of flame-synthesized multiwalled carbon nanotubes and its intensity enhancement at
240K. J. Phys. Chem. C 2007; 111:10347-10352.
[10] Bandosz TJ, Rodriguez-Castellon E, Montenegro JM, Seredych M. Photoluminescence
of nanoporous carbons: Opening a new application route for old materials. Carbon 2014;
77:651-659.
[11] Seredych M, Messali L, Bandosz TJ. Analysis of factors affecting visible and UV
enhanced oxidation of dibenzothiophenes on sulphur-doped activated carbons. Carbon
2013; 62:356-364.
[12] Pan D, Zhang J, Li Z, Wu M. Hydrothermal route for cutting graphene sheets into blue-
luminescent graphene quantum dots. Adv. Mater. 2010; 22:734-738.
20
[13] Bandosz TJ, Matos J, Seredych M, Islam MSZ, Alfano R. Photoactivity of S-doped
nanoporous activated carbons: A new perspective for harvesting solar energy on carbon-
based semiconductors. Appl. Catal. A 2012; 445:159-165.
[14] Seredych M, Bandosz TJ. Effect of the graphene phase presence in nanoporous S-doped
carbon on photoactivity in UV and visible light. AppL. Catal. B 2014; 147:842-850.
[15] Li B, Li F, Bai S, Wang Z, Sun L, Yang Q, Li C. Oxygen evolution from water
oxidation on molecular catalysts confined in the nanocages of mesoporous silicas.
Energy Environ. Sci. 2012; 5:8229-8233.
[16] Corma A, Garcia H. Zeolite-based photocatalysts. Chem Comm. 2004:1443-1459.
[17] Jagiello J, Olivier JP, Carbon Slit Pore Model Incorporating Surface Energetical
Heterogeneity and Geometrical Corrugation, Adsorpt. 2013;19:777–783.
[18] Rouquerol F, Rouquerol J, Sing KSW, Llewellyn P, Maurin G. Adsorption by Powders,
Porous Solids Principles, Methodology, Applications. 2nd ed. Elsevier; 2014.
[19] Kuhn HJ, Braslavsky SE, Schmidt R. Chemical actinometry. Pure Appl. Chem. 2004;
76:2105-2146.
[20] Noh JS, Schwarz JA, Estimation of the point of zero charge of simple oxides by mass
titration, J. Colloid Interface Sci. 1989; 130: 157-164
[21] Lozano-Castelló D, Cazorla-Amorós D, Linares-Solano A. Usefulness of CO2
adsorption at 273K for the characterization of porous carbons. Carbon 2004; 42: 1233-
1442.
[22] Velasco LF, Ania CO. Understanding phenol adsorption mechanisms on activated
carbons. Adsorption 2011; 17:247-254.
[23] Radovic LR, Moreno-Castilla C, Rivera-Utrilla J. Chemistry, Physics of Carbon.
Radovic LR, New York: Marcel Dekker; 2000:227-405.
21
[24] Nakagawa K., Namba A., Mukai S.R., Tamon H., Ariyadejwanich P.,
Tanthapanichakoon W. Adsorption of phenol and reactive dye from aqueous solution on
activated carbons derived from solid wastes. Water Res. 2004; 38:1791-1798.
[25] Singh DD. Surface orientation of phenol molecules adsorbed from aqueous-solution by
carbon-blacks, Ind. J. Chem. 1971; 9:1369.
[26] Modestov AD, Gun J, Lev O. Graphite photelectrochemistry study of glassy carbon,
carbon-fiber and carbon-black electrodes in aqueous electrolytes by photocurrent
response. Surf. Sci. 1998; 417:311-322.
[27] Robertson J. Mechanical properties and coordinations of amorphous carbons. J. Phys.
Rev. Lett. 1992; 68:220-223.
[28] Radovic LR, Bockrath B. On the chemical nature of graphene edges: Origin of stability
and potential for magnetism in carbon materials. J. Am. Chem. Soc. 2005; 127:5917-
5927.
[29] Ocampo-Pérez R, Sánchez-Polo M, Rivera-Utrilla J, Leyva-Ramos R. Enhancement of
the catalytic activity of TiO2 by using activated carbon in the photocatalytic degradation
of cytarabine. Appl. Catal. B Envir. 2011; 104:177-184.
[30] Zhao Y, Nakamura R, Kamiya K, Nakanishi S, Hashimoto K. Nitrogen-doped carbon
nanomaterials as non-metal electrocatalysts for water oxidation. Nature Comm. 2013;
4:2390.
[31] Jana D, Sun CL, Chen LC, Chen KH. Effect of chemical doping of boron and nitrogen
on the electronic, optical, and electrochemical properties of carbon nanotubes. Prog.
Mater. Sci. 2013; 58:565-635.
[32] Wang A, Chung DDL, Dielectric and electrical conduction behavior of carbon paste
electrochemical electrodes, with decoupling of carbon, electrolyte and interface
contributions, Carbon 2014;72:135-151.
22
[33] Wypych A, Bobowska I, Tracz M, Opasinska A, Kadlubowski S, Krzywania-
Kaliszewska A, Grobelny, Wojciechowski P, Dielectric properties and characterisation
of titanium dioxide obtained by different chemistry methods, J. Nanomaterials,
2014;124814:1-10.
[34] Lee D, Seo J, Zhu X, Lee J, Shin H-J, Cole J.M. Shin T, Lee J, Lee H, Su H, Quantum
confinement-induced tunable exciton states in graphene oxide, Scientific Reports,
2013;3:2250-5.
[35] Zhu X, Su H., Exciton Characteristics in Graphene Epoxide, ACS Nano, 2014;8:1284-
1289.
23
Supplementary Information (ESI)
Boosting visible light conversion in the confined pore space of nanoporous carbons
Alicia Gomis-Berenguer1, Jesus Iniesta2, Artur Moro3, Valter Maurino4, Joao C. Lima3, Conchi O. Ania 1*
1 Instituto Nacional del carbon (INCAR,CSIC), Apdo. 73, 33080 Oviedo, Spain 2 Institute of Electrochemistry, Faculty of Science, Univ. Alicante, 03080, Spain 3 Dpt. Chemistry, REQUIMTE/CQFB, Faculdade de Ciências e Tecnologia, Universidade
Nova de Lisboa, 2829-516 Lisboa, Portugal 4 Department of Chimica, Università di Torino, Via P. Giuria 5-7, 10125 Torino, Italy
* Corresponding author: Dr. CO Ania, E mail: [email protected]
Fax: (+) 34 985297662; Tel.: +34 985 118846
Phenol Adsorption capacity. Phenol adsorption capacity of the nanoporous carbons was estimated from the equilibrium adsorption isotherms carried out at dark conditions in batch experiments. Briefly, various amounts of the nanoporous carbons (between 5-100 mg) were put in contact with different volumes of a phenol aqueous solution (typically 5-30 ml). The suspensions were allowed to equilibrate under stirring for 24 hours, then filtered and the adsorbate concentration in the supernatant liquid was measured. For comparison reasons, the saturation adsorption limit was estimated as the amount adsorbed when the solid/solution ratio was similar to the one used in the photooxidation assays. This is important so as to assure the same confinement of phenol adsorbed molecules in the narrow microporosity of the carbons, rather than the full surface coverage. Surface Characterization by Temperature Programmed Desorption coupled to mass spectrometry (TPD-MS). Temperature Programmed Desorption (TPD) profiles were obtained using a chemisorption analyzer (Autochem 292,) connected to a mass spectrometer for gas analysis. About 40 mg of carbon sample were heated up to 900ºC (10ºC/min) under a constant helium flow (50 mL/min).
24
Table S1. Surface concentration (at.%) of elements detected on the surface on the nanoporous carbons by XPS.
C (at.%) O (at.%) N (at.%) O/C F 86.7 12.5 n.d. 0.14
F1 90.2 9.8 n.d. 0.11
F4 92.1 7.9 n.d. 0.09
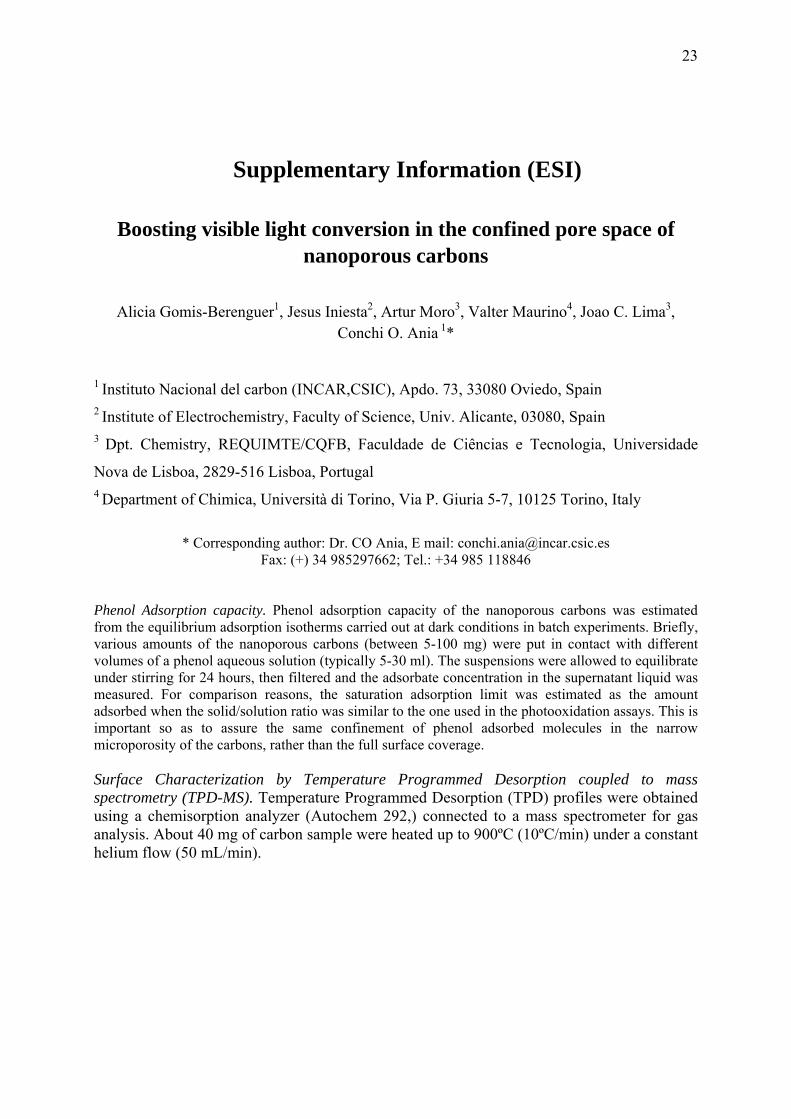
Scheme 1. Illustration of the experimental protocol designed to undertake the study of carbon/light interaction inside the nanoconfined pore spaces avoiding secondary reactions.
250 300 350 400 450 5000
10
20
30
40
Flux
x 1
08 (Ein
stei
n/m
in)
Wavelength (nm)
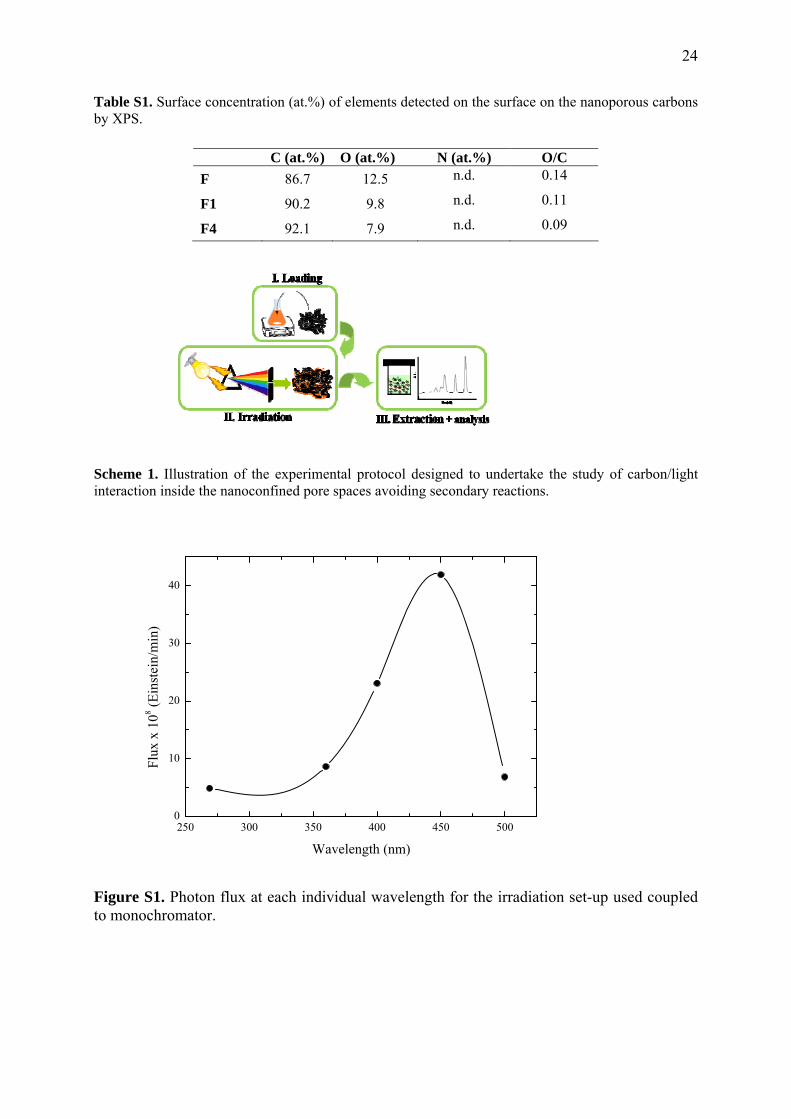
Figure S1. Photon flux at each individual wavelength for the irradiation set-up used coupled to monochromator.
25
Figure S2. TPD-MS of the studied nanoporous carbons corresponding to the amount of CO and CO2 evolved.
Figure S3. Limiting phenol adsorption capacity (mg/g) of the studied nanoporous carbons.
0
10
20
30
40
50
60
F F1 F4
Ads
. Cap
acity
(mg/
g)
0.E+00
1.E-01
2.E-01
3.E-01
4.E-01
5.E-01
50 150 250 350 450 550 650 750 850
Temperature (ºC)
mic
rom
ol/g
sF mz 28 F mz 44F4 mz 28 F4 mz 44F1 mz 28 F1 mz 44
26
Figure S4. Raman spectra of the studied nanoporous carbons.
500 1000 1500 2000 2500 3000 3500 4000
Wavelength/ nm
a. u.
F4F1F