Embed Size (px)
Citation preview
8/12/2019 BOP Statistics Are Regularly Compiled
http://slidepdf.com/reader/full/bop-statistics-are-regularly-compiled 1/17
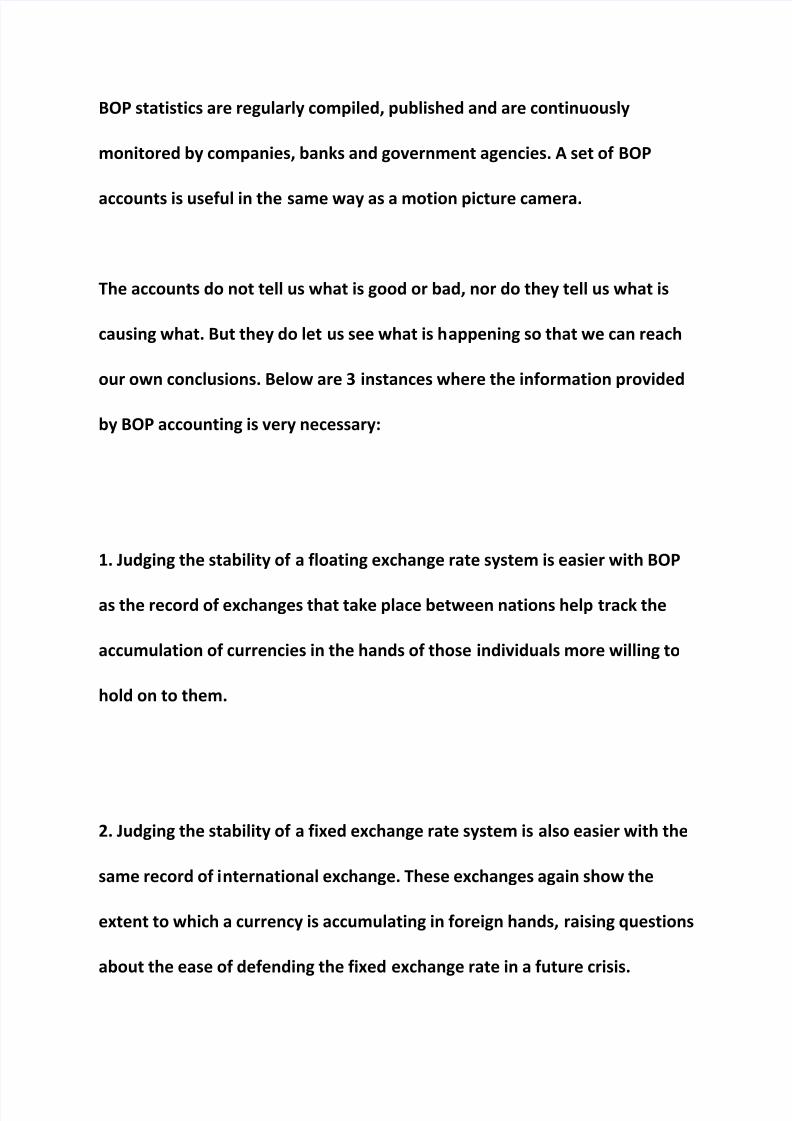
BOP statistics are regularly compiled, published and are continuously
monitored by companies, banks and government agencies. A set of BOP
accounts is useful in the same way as a motion picture camera.
The accounts do not tell us what is good or bad, nor do they tell us what is
causing what. But they do let us see what is happening so that we can reach
our own conclusions. Below are 3 instances where the information provided
by BOP accounting is very necessary:
1. Judging the stability of a floating exchange rate system is easier with BOP
as the record of exchanges that take place between nations help track the
accumulation of currencies in the hands of those individuals more willing to
hold on to them.
2. Judging the stability of a fixed exchange rate system is also easier with the
same record of international exchange. These exchanges again show the
extent to which a currency is accumulating in foreign hands, raising questions
about the ease of defending the fixed exchange rate in a future crisis.
8/12/2019 BOP Statistics Are Regularly Compiled
http://slidepdf.com/reader/full/bop-statistics-are-regularly-compiled 2/17
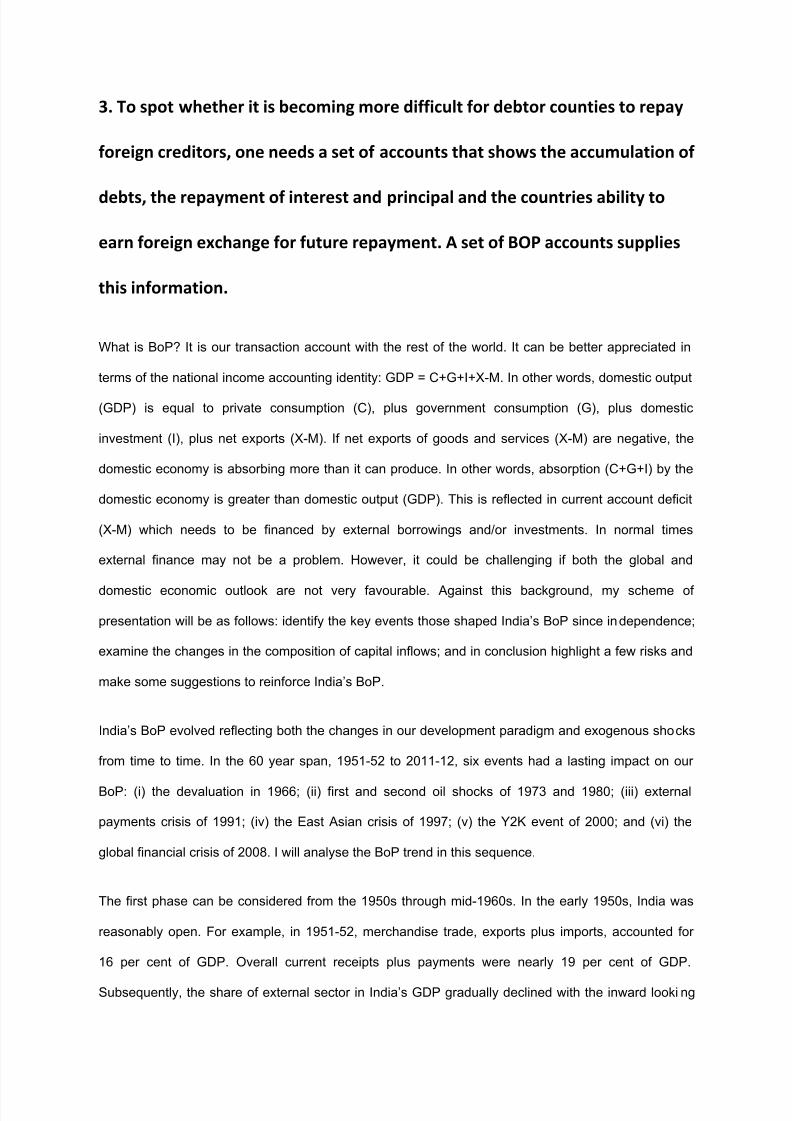
3. To spot whether it is becoming more difficult for debtor counties to repay
foreign creditors, one needs a set of accounts that shows the accumulation of
debts, the repayment of interest and principal and the countries ability to
earn foreign exchange for future repayment. A set of BOP accounts supplies
this information.
What is BoP? It is our transaction account with the rest of the world. It can be better appreciated in
terms of the national income accounting identity: GDP = C+G+I+X-M. In other words, domestic output
(GDP) is equal to private consumption (C), plus government consumption (G), plus domestic
investment (I), plus net exports (X-M). If net exports of goods and services (X-M) are negative, the
domestic economy is absorbing more than it can produce. In other words, absorption (C+G+I) by the
domestic economy is greater than domestic output (GDP). This is reflected in current account deficit
(X-M) which needs to be financed by external borrowings and/or investments. In normal times
external finance may not be a problem. However, it could be challenging if both the global and
domestic economic outlook are not very favourable. Against this background, my scheme of
presentation will be as follows: identify the key events those shaped India’s BoP since independence;
examine the changes in the composition of capital inflows; and in conclusion highlight a few risks and
make some suggestions to reinforce India’s BoP.
India’s BoP evolved reflecting both the changes in our development paradigm and exogenous shocks
from time to time. In the 60 year span, 1951-52 to 2011-12, six events had a lasting impact on our
BoP: (i) the devaluation in 1966; (ii) first and second oil shocks of 1973 and 1980; (iii) external
payments crisis of 1991; (iv) the East Asian crisis of 1997; (v) the Y2K event of 2000; and (vi) the
global financial crisis of 2008. I will analyse the BoP trend in this sequence.
The first phase can be considered from the 1950s through mid-1960s. In the early 1950s, India was
reasonably open. For example, in 1951-52, merchandise trade, exports plus imports, accounted for
16 per cent of GDP. Overall current receipts plus payments were nearly 19 per cent of GDP.
Subsequently, the share of external sector in India’s GDP gradually declined with the inward looking
8/12/2019 BOP Statistics Are Regularly Compiled
http://slidepdf.com/reader/full/bop-statistics-are-regularly-compiled 3/17
policy of import substitution. Moreover, Indian export basket comprised mainly traditional items like
tea, cotton textile and jute manufactures. Not only the scope of world trade expansion in these
commodities was less but additionally India had to face competition from new emerging suppliers,
such as Pakistan in jute manufactures and Ceylon and East Africa in tea.
During this period, policy emphasis was on import saving rather than export promotion, and priority
was given to basic goods and capital goods sector. It was argued that investment in heavy industries
would bring in saving in foreign exchange, as output from such industries would replace their imports
in the long-run. Import-substituting strategies were expected to gradually increase export
competitiveness through efficiency-gains achieved in the domestic economy. But this did not happen.
Hence, exports remained modest. In fact our external sector contracted in relation to GDP from the
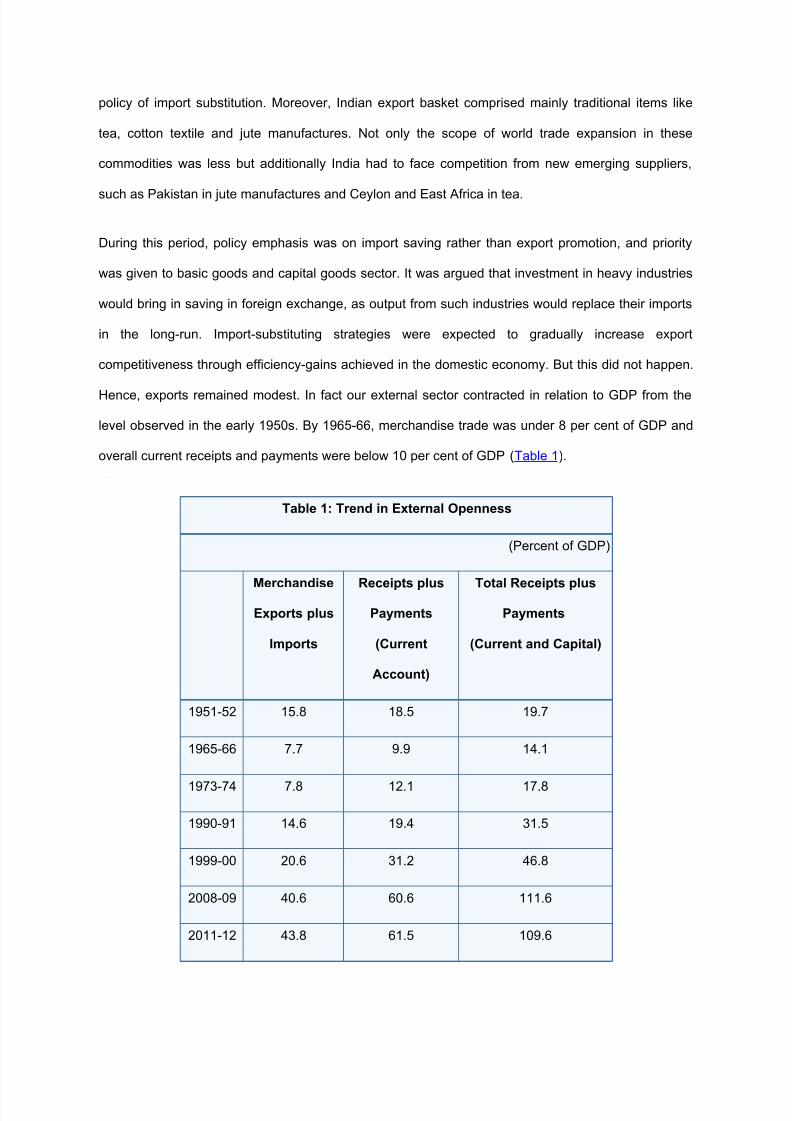
level observed in the early 1950s. By 1965-66, merchandise trade was under 8 per cent of GDP and
overall current receipts and payments were below 10 per cent of GDP (Table 1).
Table 1: Trend in External Openness
(Percent of GDP)
Merchandise
Exports plus
Imports
Receipts plus
Payments
(Current
Account)
Total Receipts plus
Payments
(Current and Capital)
1951-52 15.8 18.5 19.7
1965-66 7.7 9.9 14.1
1973-74 7.8 12.1 17.8
1990-91 14.6 19.4 31.5
1999-00 20.6 31.2 46.8
2008-09 40.6 60.6 111.6
2011-12 43.8 61.5 109.6
8/12/2019 BOP Statistics Are Regularly Compiled
http://slidepdf.com/reader/full/bop-statistics-are-regularly-compiled 4/17
Notwithstanding the contracting size of the external sector, as imports growth outstripped exports
growth, there was persistent current account deficit (CAD). Emphasis on heavy industrialisation in the
second five year Plan led to a sharp increase in imports. On top of this, the strains of Indo-China
conflict of 1962, Indo-Pakistan war of 1965 and severe drought of 1965-66 triggered a major BoP
crisis. India’s international economic relations with advanced countries came under stress during the
Indo-Pak conflict. Withdrawal of foreign aid by countries like the US and conditional resumption of aid
by the Aid India Consortium led to contraction in capital inflows. Given the low level of foreign
exchange reserves and burgeoning trade deficit, India had no option other than to devalue. Rupee
was devalued by 36.5 per cent in June 1966.1
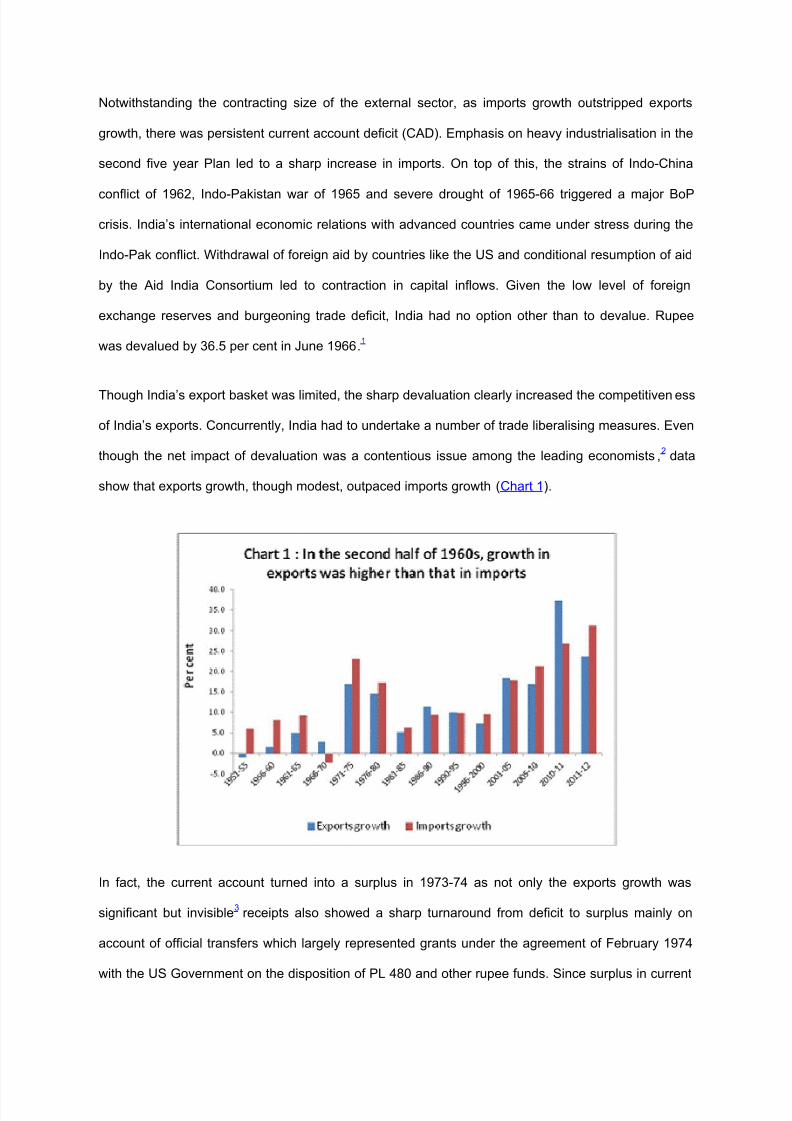
Though India’s export basket was limited, the sharp devaluation clearly increased the competitiveness
of India’s exports. Concurrently, India had to undertake a number of trade liberalising measures. Even
though the net impact of devaluation was a contentious issue among the leading economists,2 data
show that exports growth, though modest, outpaced imports growth (Chart 1).
In fact, the current account turned into a surplus in 1973-74 as not only the exports growth was
significant but invisible3 receipts also showed a sharp turnaround from deficit to surplus mainly on
account of official transfers which largely represented grants under the agreement of February 1974
with the US Government on the disposition of PL 480 and other rupee funds. Since surplus in current
8/12/2019 BOP Statistics Are Regularly Compiled
http://slidepdf.com/reader/full/bop-statistics-are-regularly-compiled 5/17
account balance (CAB) was used for repaying rupee loans under the same agreement with the US,
accretion to reserves was only marginal.
Surplus in India’s CAB was, however, short-lived as the first oil shock occurred by October 1973.
Sharp rise in international oil prices was evident in higher imports growth in 1973-74 and 1974-75.
The share of crude oil in India's import bill rose from 11 per cent in 1972-73 to 26 per cent by 1974-
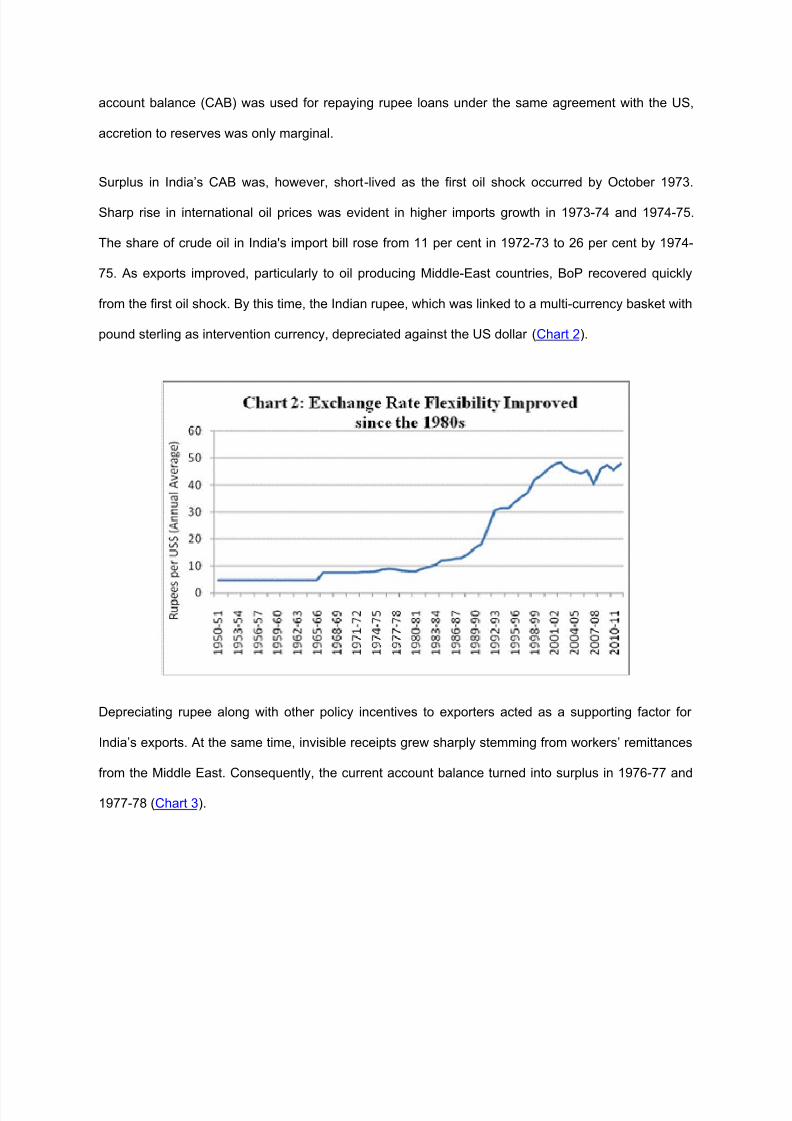
75. As exports improved, particularly to oil producing Middle-East countries, BoP recovered quickly
from the first oil shock. By this time, the Indian rupee, which was linked to a multi-currency basket with
pound sterling as intervention currency, depreciated against the US dollar (Chart 2).
Depreciating rupee along with other policy incentives to exporters acted as a supporting factor for
India’s exports. At the same time, invisible receipts grew sharply stemming from workers’ remittances
from the Middle East. Consequently, the current account balance turned into surplus in 1976-77 and
1977-78 (Chart 3).
8/12/2019 BOP Statistics Are Regularly Compiled
http://slidepdf.com/reader/full/bop-statistics-are-regularly-compiled 6/17
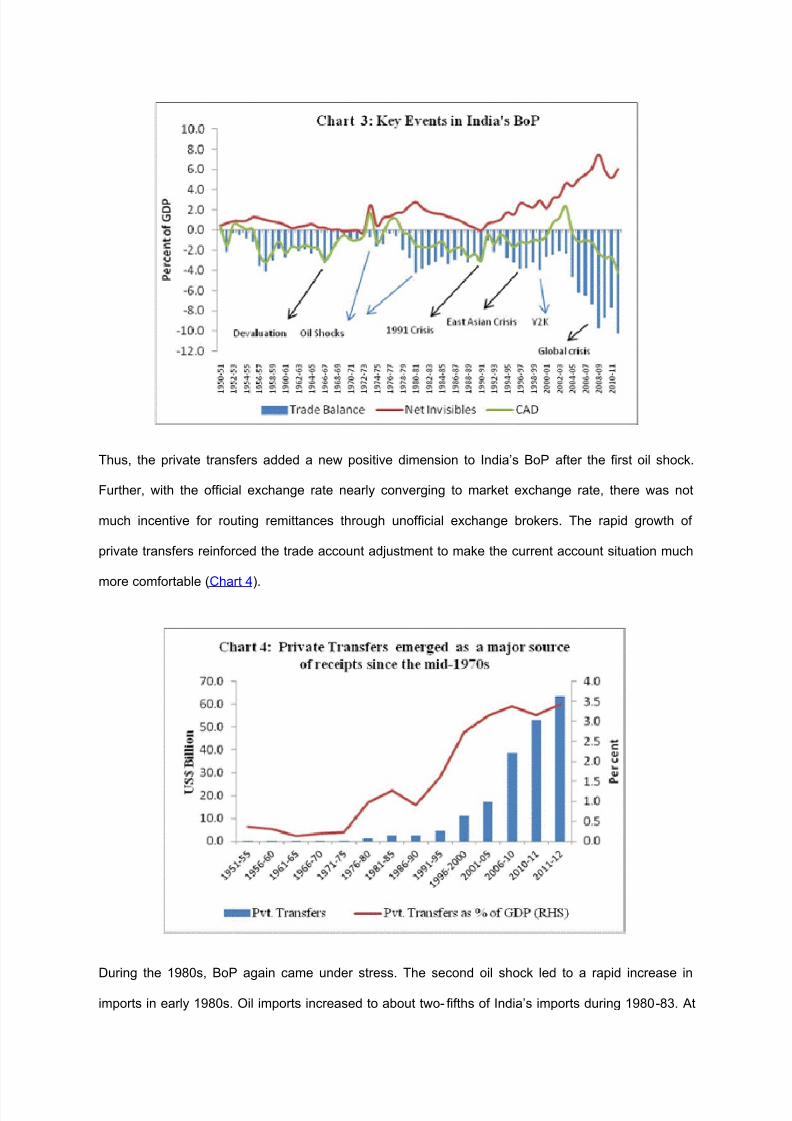
Thus, the private transfers added a new positive dimension to India’s BoP after the first oil shock.
Further, with the official exchange rate nearly converging to market exchange rate, there was not
much incentive for routing remittances through unofficial exchange brokers. The rapid growth of
private transfers reinforced the trade account adjustment to make the current account situation much
more comfortable (Chart 4).
During the 1980s, BoP again came under stress. The second oil shock led to a rapid increase in
imports in early 1980s. Oil imports increased to about two- fifths of India’s imports during 1980-83. At
8/12/2019 BOP Statistics Are Regularly Compiled
http://slidepdf.com/reader/full/bop-statistics-are-regularly-compiled 7/17
the same time, India’s external sector policy was changing towards greater openness. Various
measures were undertaken to promote exports and liberalise imports for exporters during this period.
However, several factors weighed against external stability. First, despite a number of export
promotion measures, the subdued growth conditions in the world economy constrained exports
growth. Second, the surplus on account of invisibles also deteriorated due to moderation in private
transfers. Third, the debt servicing had increased with greater recourse to debt creating flows such as
external commercial borrowings (ECBs) and non-resident Indian (NRI) deposits. Fourth, deterioration
is the fiscal position stemming from rising expenditures accentuated the twin deficit risks.
Given the already emerging vulnerabilities in India’s BoP during the 1980s, the incipient signs of
stress were discernible which culminated in the BoP crisis in 1991 when the Gulf War led to a sharp
increase in the oil prices. On top of that, a slowdown in the world trade following the recessionary
conditions in industrialised countries and the economic disruption in Eastern Europe including the
erstwhile USSR had begun to affect India's exports. A large number of Indian workers employed in
Kuwait had to be airlifted to India and their remittances stopped. Foreign exchange reserves had
already dwindled due to significant drawdown for financing of CAD in earlier years. During 1990-91, at
one point of time, the foreign currency assets had dipped below US$ 1.0 billion, covering barely two
weeks of imports. With increasing recourse to the borrowings on commercial terms in the previous
years, financing of CAD had also become more sensitive to creditors’ confidence in the Indian
economy.
Short-term credits began to dry up and the outflow of NRI deposits was also very substantial.
Downgrading of India’s credit rating below the investment grade also constrained India’s access in the
international markets for funds, especially ECBs and trade credit. Even though the stress in India’s
BoP was unprecedented, the Government decided to honour all debt obligations without seeking any
rescheduling (Reddy, 2006).4
In response to the BoP crisis, a combination of standard and unorthodox policies for stabilisation and
structural change was undertaken to ensure that the crisis did not translate into generalised financial
instability. Such steps included pledging gold reserves, discouraging of non-essential imports,
accessing credit from the IMF and other multilateral and bilateral donors. While dealing with the crisis
8/12/2019 BOP Statistics Are Regularly Compiled
http://slidepdf.com/reader/full/bop-statistics-are-regularly-compiled 8/17
through an IMF programme, a comprehensive programme of structural reforms was undertaken
simultaneously with special emphasis on the external sector.
The broad approach to reform in the external sector was laid out in the Report of the High Level
Committee on Balance of Payments (Chairman: C. Rangarajan, 1993). Trade policies, exchange rate
policies and industrial policies were recognised as part of an integrated policy framework so as to
boost the overall productivity, competitiveness and efficiency of the economy. In addition, to contain
the trade and current account deficits and enhance export competitiveness, the exchange rate of
rupee was adjusted downwards in two stages on July 1 and July 3, 1991 by 9 per cent and 11 per
cent, respectively. A dual exchange rate system was introduced in March 1992 which was unified in
March 1993. Subsequently, India moved to current account convertibility in August 1994 by
liberalising various transactions relating to merchandise trade and invisibles.
The impact of policy changes was reflected in lower CAD and its comfortable financing in subsequent
years. India could manage the external shocks that emanated from the East Asian crisis in 1997 and
subsequently, the rise in international oil prices and bursting of dotcom bubble in 1999-2000. Indeed,
the Indian economy remained relatively insulated from the East Asian crisis owing to the reforms
undertaken in previous years and proactive and timely policy measures initiated by the Reserve Bank
to minimise the contagion effect. Monetary tightening coupled with flexible exchange rate and steps to
bolster reserves through issuance of Resurgent India Bonds (RIBs) helped in stabilizing the BoP.
The BoP came under some stress again in the first half of 2000-01 due to a sharp rise in oil prices
and increase in interest rates in advanced countries. At the same time, India’s software exports got a
boost following the demands to address the Y2K challenges. This also encouraged migration of
Indian software engineers to the advanced countries. As a result, the surplus in the services exports
and remittance account of the BoP increased sharply which more than offset the deficit in the trade
account. Software exports rose from 0.9 per cent of GDP in 1999-2000 to a peak of 3.8 per cent of
GDP by 2008-09. Private remittances also rose from 2.7 per cent of GDP to 3.8 per cent during this
period. Thus, in the 2000s software exports and private remittances emerged as two main financing
items for the current account mitigating to a large extent the merchandise trade deficit (Tables 2& 3).
Owing to a combination of factors, in fact, the current account recorded a surplus during 2001-04.
8/12/2019 BOP Statistics Are Regularly Compiled
http://slidepdf.com/reader/full/bop-statistics-are-regularly-compiled 9/17
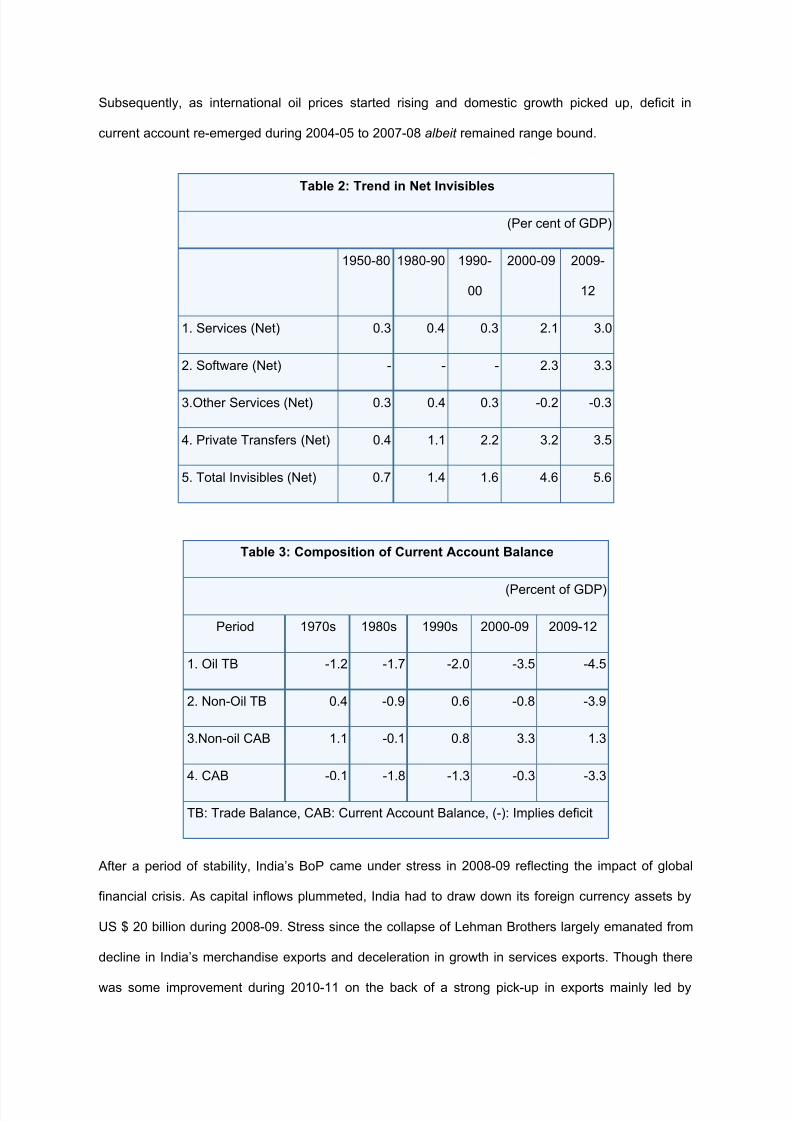
Subsequently, as international oil prices started rising and domestic growth picked up, deficit in
current account re-emerged during 2004-05 to 2007-08 albeit remained range bound.
Table 2: Trend in Net Invisibles
(Per cent of GDP)
1950-80 1980-90 1990-
00
2000-09 2009-
12
1. Services (Net) 0.3 0.4 0.3 2.1 3.0
2. Software (Net) - - - 2.3 3.3
3.Other Services (Net) 0.3 0.4 0.3 -0.2 -0.3
4. Private Transfers (Net) 0.4 1.1 2.2 3.2 3.5
5. Total Invisibles (Net) 0.7 1.4 1.6 4.6 5.6
Table 3: Composition of Current Account Balance
(Percent of GDP)
Period 1970s 1980s 1990s 2000-09 2009-12
1. Oil TB -1.2 -1.7 -2.0 -3.5 -4.5
2. Non-Oil TB 0.4 -0.9 0.6 -0.8 -3.9
3.Non-oil CAB 1.1 -0.1 0.8 3.3 1.3
4. CAB -0.1 -1.8 -1.3 -0.3 -3.3
TB: Trade Balance, CAB: Current Account Balance, (-): Implies deficit
After a period of stability, India’s BoP came under stress in 2008-09 reflecting the impact of global
financial crisis. As capital inflows plummeted, India had to draw down its foreign currency assets by
US $ 20 billion during 2008-09. Stress since the collapse of Lehman Brothers largely emanated from
decline in India’s merchandise exports and deceleration in growth in services exports. Though there
was some improvement during 2010-11 on the back of a strong pick-up in exports mainly led by
8/12/2019 BOP Statistics Are Regularly Compiled
http://slidepdf.com/reader/full/bop-statistics-are-regularly-compiled 10/17
diversification of trade in terms of composition as well as direction, it proved to be short-lived. BoP
again came under stress during 2011-12 as slowdown in advanced economies spilled over to
emerging and developing economies (EDEs), and there was sharp increase in oil and gold imports.
Let me now turn to the financing aspects of the current account.
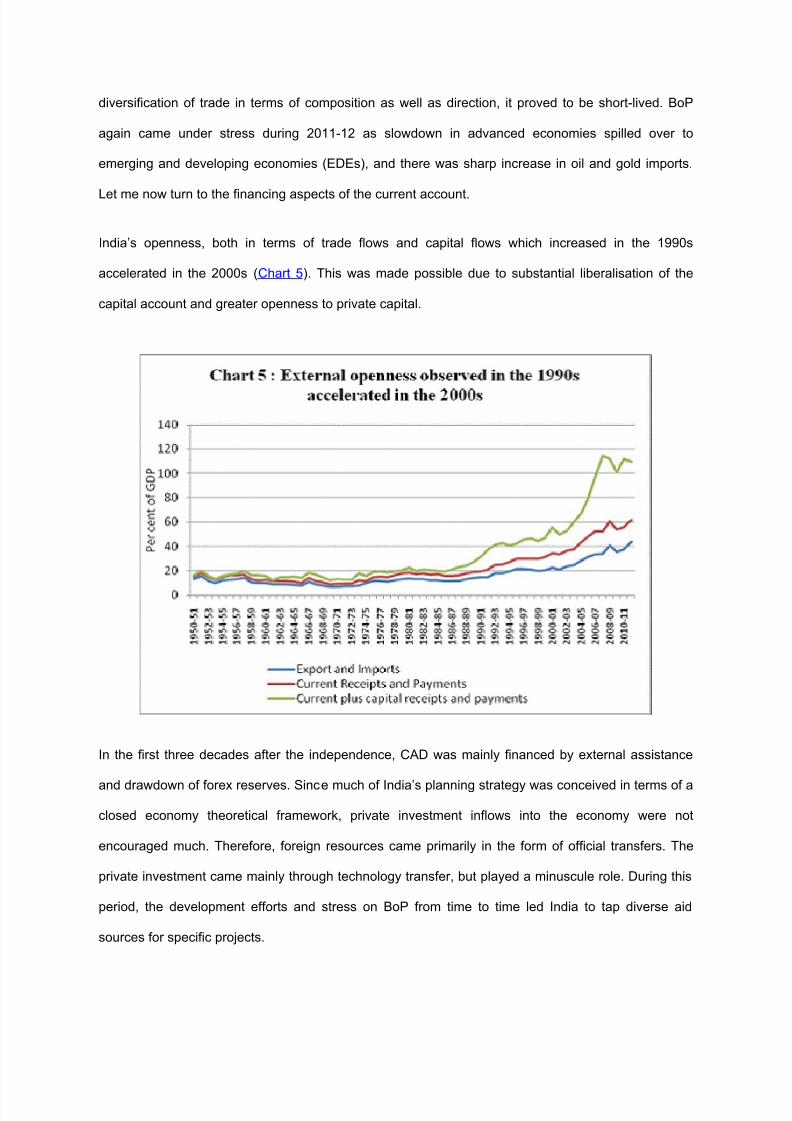
India’s openness, both in terms of trade flows and capital flows which increased in the 1990s
accelerated in the 2000s (Chart 5). This was made possible due to substantial liberalisation of the
capital account and greater openness to private capital.
In the first three decades after the independence, CAD was mainly financed by external assistance
and drawdown of forex reserves. Since much of India’s planning strategy was conceived in terms of a
closed economy theoretical framework, private investment inflows into the economy were not
encouraged much. Therefore, foreign resources came primarily in the form of official transfers. The
private investment came mainly through technology transfer, but played a minuscule role. During this
period, the development efforts and stress on BoP from time to time led India to tap diverse aid
sources for specific projects.
8/12/2019 BOP Statistics Are Regularly Compiled
http://slidepdf.com/reader/full/bop-statistics-are-regularly-compiled 11/17
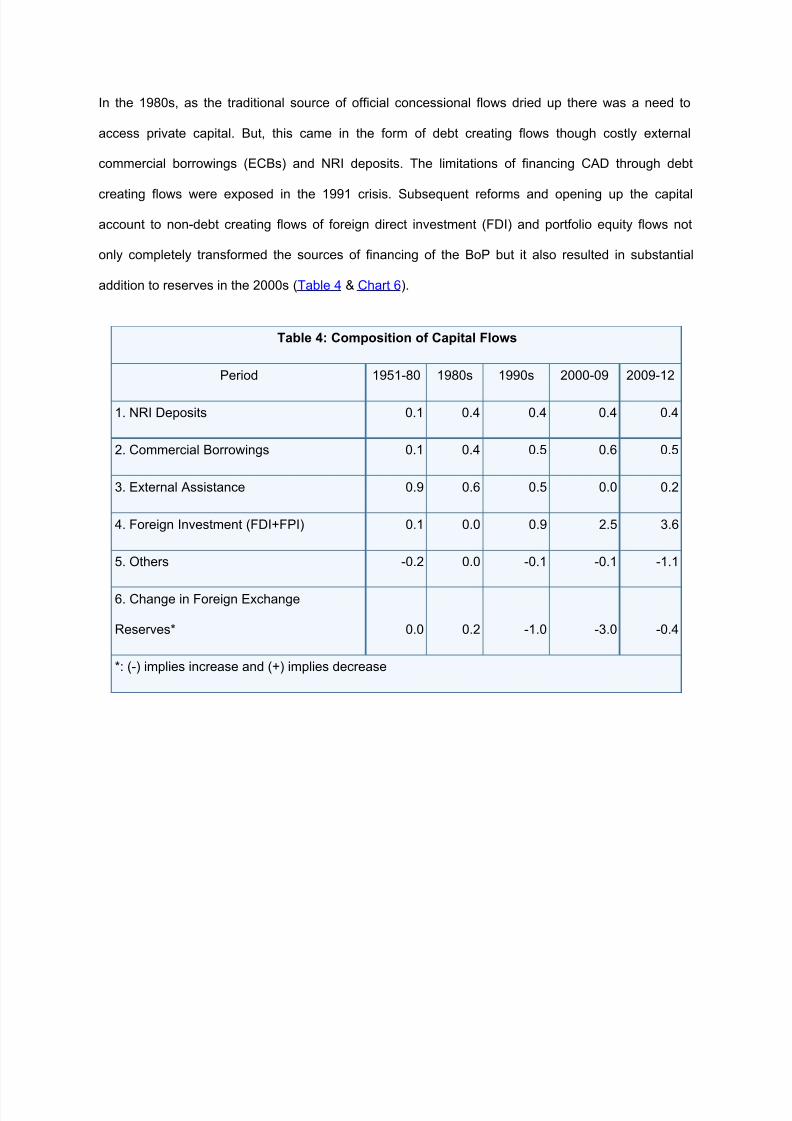
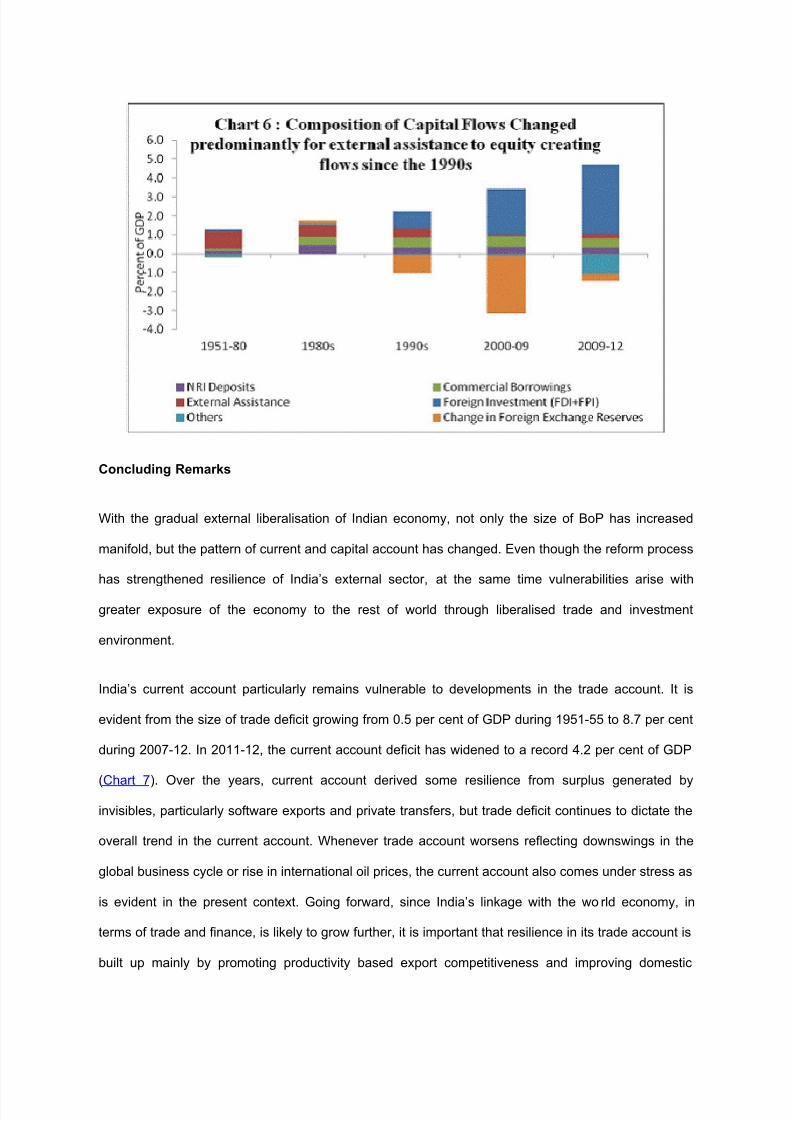
In the 1980s, as the traditional source of official concessional flows dried up there was a need to
access private capital. But, this came in the form of debt creating flows though costly external
commercial borrowings (ECBs) and NRI deposits. The limitations of financing CAD through debt
creating flows were exposed in the 1991 crisis. Subsequent reforms and opening up the capital
account to non-debt creating flows of foreign direct investment (FDI) and portfolio equity flows not
only completely transformed the sources of financing of the BoP but it also resulted in substantial
addition to reserves in the 2000s (Table 4 & Chart 6).
Table 4: Composition of Capital Flows
Period 1951-80 1980s 1990s 2000-09 2009-12
1. NRI Deposits 0.1 0.4 0.4 0.4 0.4
2. Commercial Borrowings 0.1 0.4 0.5 0.6 0.5
3. External Assistance 0.9 0.6 0.5 0.0 0.2
4. Foreign Investment (FDI+FPI) 0.1 0.0 0.9 2.5 3.6
5. Others -0.2 0.0 -0.1 -0.1 -1.1
6. Change in Foreign Exchange
Reserves* 0.0 0.2 -1.0 -3.0 -0.4
*: (-) implies increase and (+) implies decrease
8/12/2019 BOP Statistics Are Regularly Compiled
http://slidepdf.com/reader/full/bop-statistics-are-regularly-compiled 12/17
Concluding Remarks
With the gradual external liberalisation of Indian economy, not only the size of BoP has increased
manifold, but the pattern of current and capital account has changed. Even though the reform process
has strengthened resilience of India’s external sector, at the same time vulnerabilities arise with
greater exposure of the economy to the rest of world through liberalised trade and investment
environment.
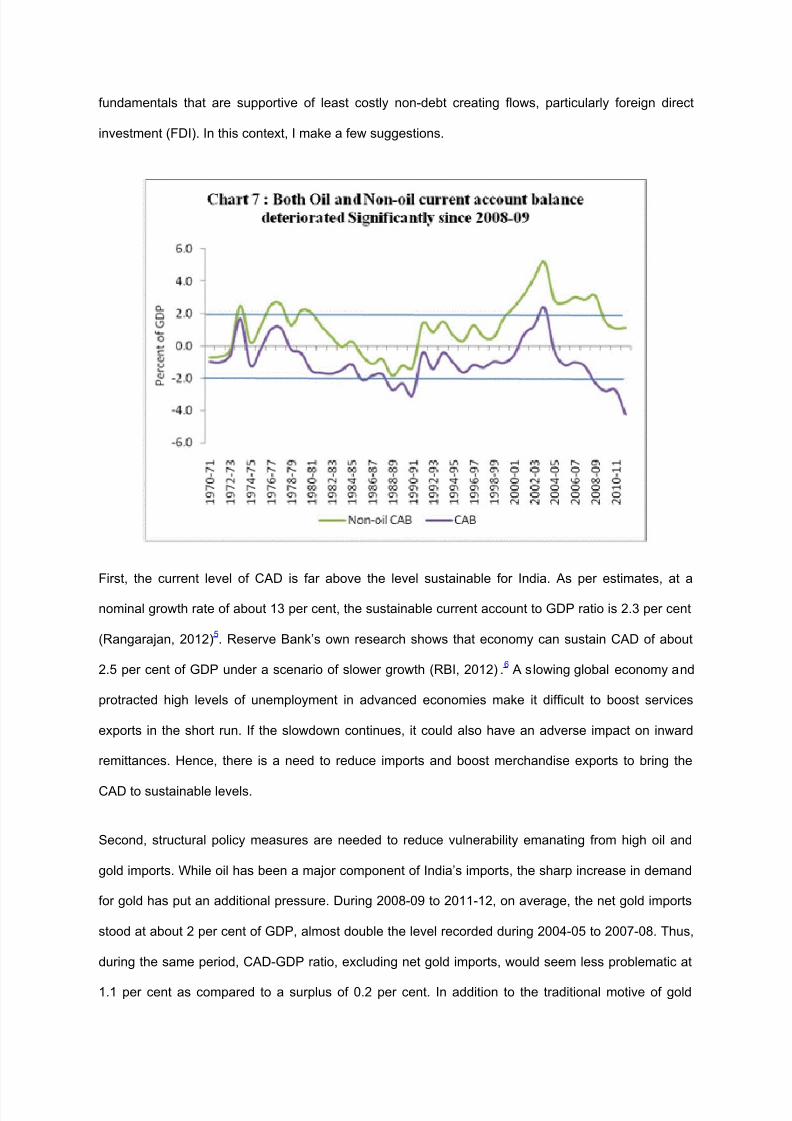
India’s current account particularly remains vulnerable to developments in the trade account. It is
evident from the size of trade deficit growing from 0.5 per cent of GDP during 1951-55 to 8.7 per cent
during 2007-12. In 2011-12, the current account deficit has widened to a record 4.2 per cent of GDP
(Chart 7). Over the years, current account derived some resilience from surplus generated by
invisibles, particularly software exports and private transfers, but trade deficit continues to dictate the
overall trend in the current account. Whenever trade account worsens reflecting downswings in the
global business cycle or rise in international oil prices, the current account also comes under stress as
is evident in the present context. Going forward, since India’s linkage with the wo rld economy, in
terms of trade and finance, is likely to grow further, it is important that resilience in its trade account is
built up mainly by promoting productivity based export competitiveness and improving domestic
8/12/2019 BOP Statistics Are Regularly Compiled
http://slidepdf.com/reader/full/bop-statistics-are-regularly-compiled 13/17
fundamentals that are supportive of least costly non-debt creating flows, particularly foreign direct
investment (FDI). In this context, I make a few suggestions.
First, the current level of CAD is far above the level sustainable for India. As per estimates, at a
nominal growth rate of about 13 per cent, the sustainable current account to GDP ratio is 2.3 per cent
(Rangarajan, 2012)5. Reserve Bank’s own research shows that economy can sustain CAD of about
2.5 per cent of GDP under a scenario of slower growth (RBI, 2012) .6 A slowing global economy and
protracted high levels of unemployment in advanced economies make it difficult to boost services
exports in the short run. If the slowdown continues, it could also have an adverse impact on inward
remittances. Hence, there is a need to reduce imports and boost merchandise exports to bring the
CAD to sustainable levels.
Second, structural policy measures are needed to reduce vulnerability emanating from high oil and
gold imports. While oil has been a major component of India’s imports, the sharp increase in demand
for gold has put an additional pressure. During 2008-09 to 2011-12, on average, the net gold imports
stood at about 2 per cent of GDP, almost double the level recorded during 2004-05 to 2007-08. Thus,
during the same period, CAD-GDP ratio, excluding net gold imports, would seem less problematic at
1.1 per cent as compared to a surplus of 0.2 per cent. In addition to the traditional motive of gold
8/12/2019 BOP Statistics Are Regularly Compiled
http://slidepdf.com/reader/full/bop-statistics-are-regularly-compiled 14/17
demand for jewellery, gold seems to have become a safe investment asset and a hedge against
inflation as is observed in other advanced economies. Its dematerialisation like any other financial
product can reduce its physical imports (Gokarn, 2012).7 Furthermore, inflation indexed bonds could
also be another option to offer investors the inflation linked returns and detract them from gold
investments. In the case of oil, we need to become more energy efficient to reduce our dependence
on oil imports. Stepping up of production of electricity could reduce oil demand from backup
generation systems. Moreover, the domestic pricing of oil should be aligned further to the international
prices to rationalise oil consumption.
Third, current policies towards further diversification of India’s export basket, both destination and
products, needs to be stepped up. Indian exporters need to accelerate efforts to move up in the value
chain at the global level.
Fourth, given the global uncertainties and volatility in capital flows, the resilience of capital account
needs to be further enhanced by encouraging FDI inflows.
To conclude, the Indian economy is much more open and globalised now than ever before. The
periodic pressures on BoP have been addressed through policy changes. While the BoP has again
come under stress since 2011-12 as emphasised by Governor Dr Subbarao,the situation is not as
serious as it was in 1991.8 This is because the structure of the economy has changed in a
fundamental way with flexible exchange rate and greater depth in financial markets, besides much
larger foreign exchange reserves than those in 1991. However, there is a need to bring the CAD to
sustainable levels in the short run and over the medium-term to accelerate efforts towards structural
reforms that help boosting our competitiveness, raise growth potential and bring in more stable flows
into the economy.
Characteristics of human resource planning
1. Future Oriented
Human resource planning is prepared to assess the future requirement of manpower in the
organization. It helps identify the size and composition of resources for future purpose.
8/12/2019 BOP Statistics Are Regularly Compiled
http://slidepdf.com/reader/full/bop-statistics-are-regularly-compiled 15/17
2. Continuous Process
Human resource planning is a continuous process. The human resource planning prepared
today may not be applicable for future due to ever changing external forces of the environment.
Hence, to address such changing factors, the human resource planning needs to be revised and
updated continuously.
3. Optimum Utilization Of Human Resources
:Human resource planning focuses on optimum utilization of resources in the organization. It
checks how the employees are utilized in a productive manner. It also identifies employees'
existing capabilities and future potentialities to perform the work.
4. Right Kinds And Numbers
Human resource planning determines the right number and kind of people at the right time and
right place who are capable of performing the required jobs. It also assesses the future
requirement of manpower for organizational objective.
5. Determination Of Demand And Supply
Human resource planning is a process of determining demand for and supply of human
resources in the organization. Then a match between demand and supply estimates the
optimum level of manpower.
6. Environmental Influence
Human resource planning is influenced by environmental changes, hence, it is to be updated as
per the change occupied in the external environment.
7. Related To Corporate Plan
Human resource planning is an integral part of overall corporate plan of the organization. It can
be formulated at strategic, tactical and operational levels.
8/12/2019 BOP Statistics Are Regularly Compiled
http://slidepdf.com/reader/full/bop-statistics-are-regularly-compiled 16/17
8. A Part Of Human Resource Management System
As a part of total human resource management system, human resource planning is regarded as
a component or element of HRM which is concerned with acquisition ans assessment of
manpower. It serves as a foundation for the management of human resource in an effective and
efficient manner.
Limitations of the human resource planning: • It is very difficult to ascertain the future manpower requirements of an organization, the
future is always uncertain. As such the predictions are bound to go wrong.
• Human resource planning is more relevant in countries that face scarcity of human
resources. In a country like India, human resource planning is of little assistance since
manpower is available in abundance. Also the legal compulsions render human resource
planning redundant.
• Human resource planning is a time consuming and a very costly process. The recruitment
and selection process is time consuming and requires the services of experts to conduct.
This can all add to the cost.
• Human resource planning is beneficial where adequate skilled resources are available. In
cases where skilled manpower is not easily available, human resource planning serves no
purpose.
Purpose and importance of recruitment
8/12/2019 BOP Statistics Are Regularly Compiled
http://slidepdf.com/reader/full/bop-statistics-are-regularly-compiled 17/17
organisation.
Determine present and future requirements of the organization in conjunction with
its personnel planning and job analysis activities.
mum cost.
under qualified or overqualified job applicants.
the organization only after a short period of time.
workforce.
candidates.
and individual effectiveness of various recruiting techniques and
sources for all types of job applicants