Embed Size (px)
Citation preview

BORDER FLUX BALLANCE APPROACH TOWARDS MODELLING ACID-BASE CHEMISTRY
AND BLOOD GASES TRANSPORT Jiří Kofránek, Stanislav Matoušek, Michal Andrlík
Charles University in Prague, First Faculty of Medicine, Institute of Pathological Physiology, U Nemocnice 5, Praha, Czech Republic
[email protected] (Jiří Kofránek)
Abstract
Two widely discussed approaches to acid-base chemistry (classical vs. modern one) are not in contradiction with one another. Most of the misunderstanding originates when people don’t realize they are defined for different conditions – classical theory is valid for blood of various hemoglobin content but with normal plasma only while the modern theory describes plasma under general conditions, but not full blood. The two theories are complementary when both limiting conditions are met. Our border flux approach to acid-base and blood gases chemistry, together with the newly defined set of state variables form a logically consistent general theory. We are able to describe, identify and simulate blood gases transport as well as a wide array of acid-base disorders, e.g. respiratory alkaloses and acidoses, metabolic acidoses and alkaloses, hypo- and hyperalbuminemias (phosphatemias), hemodilution/ hyperhydration, hemoconcentration/dehydration, situations of abnormal body temperature etc. Complex simulation model based on our approach (Golem) is for several years successfully used in medical student education. Underlying mathematical relationships are as a part of a MATLAB/Simulink library “Physiolibrary” at your free disposition on site http://patf-biokyb.lf1.cuni.cz/wiki/projekty/physiolibrary . Lately, we have completed on-line version of simple plasma buffering system simulation model, which is available at http://www.physiome.cz/atlas/acidobaze/02/ABR_v_plazme1_2.swf .
Keywords: Acid-base chemistry of blood, Modeling, SID, BB, BE
Presenting Author’s biography Stanislav Matoušek, M.D. Author is a Ph.D. student of Jiří Kofránek, main focus of his work being modeling of ventilation, blood gases transport and acid-base chemistry in humans. He studied Medicine at Charles University in Prague. He combined his studies with several years of mathematics and physics at Charles University and with some subjects regarding control theory at Czech Technical University. Stanislav Matoušek is a member of multidisciplinary team of laboratory of biocybernetics lead by Jiří Kofránek. He also teaches Pathological Physiology to medical students.
Proc. EUROSIM 2007 (B. Zupančič, R. Karba, S. Blažič) 9-13 Sept. 2007, Ljubljana, Slovenia
ISBN 978-3-901608-32-2 1 Copyright © 2007 EUROSIM / SLOSIM
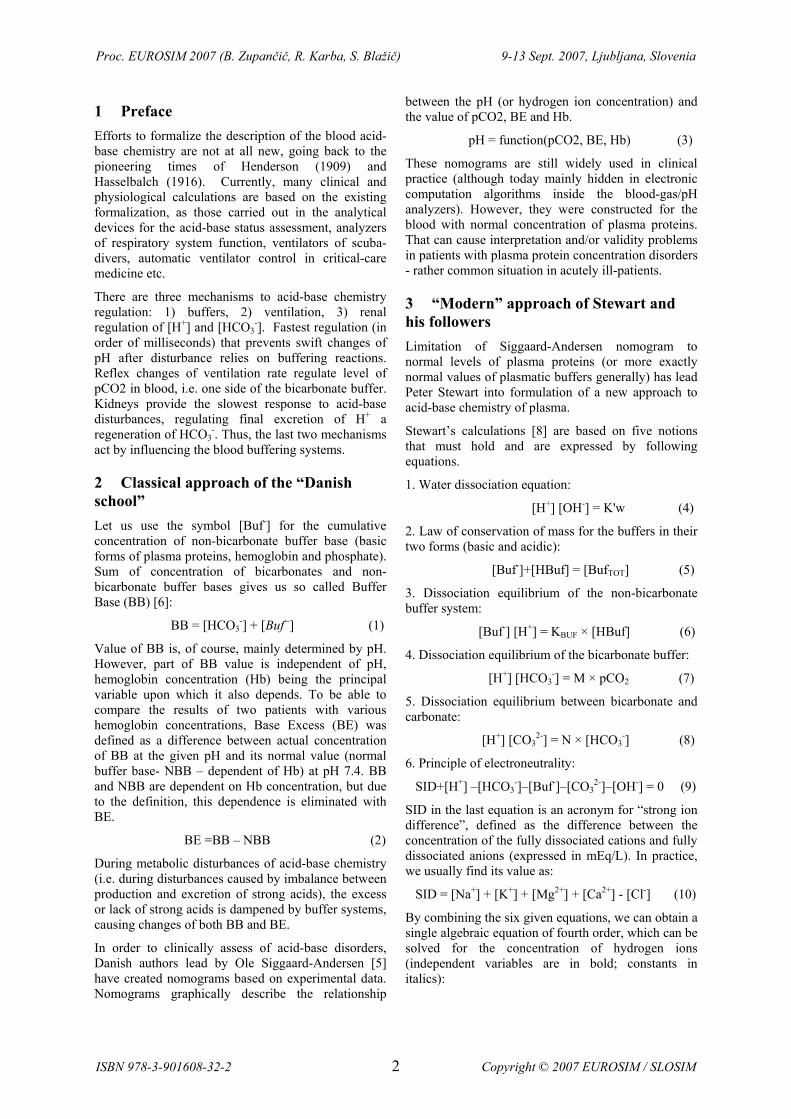
1 Preface Efforts to formalize the description of the blood acid-base chemistry are not at all new, going back to the pioneering times of Henderson (1909) and Hasselbalch (1916). Currently, many clinical and physiological calculations are based on the existing formalization, as those carried out in the analytical devices for the acid-base status assessment, analyzers of respiratory system function, ventilators of scuba-divers, automatic ventilator control in critical-care medicine etc.
There are three mechanisms to acid-base chemistry regulation: 1) buffers, 2) ventilation, 3) renal regulation of [H+] and [HCO3
-]. Fastest regulation (in order of milliseconds) that prevents swift changes of pH after disturbance relies on buffering reactions. Reflex changes of ventilation rate regulate level of pCO2 in blood, i.e. one side of the bicarbonate buffer. Kidneys provide the slowest response to acid-base disturbances, regulating final excretion of H+ a regeneration of HCO3
-. Thus, the last two mechanisms act by influencing the blood buffering systems.
2 Classical approach of the “Danish school” Let us use the symbol [Buf-] for the cumulative concentration of non-bicarbonate buffer base (basic forms of plasma proteins, hemoglobin and phosphate). Sum of concentration of bicarbonates and non-bicarbonate buffer bases gives us so called Buffer Base (BB) [6]:
BB = [HCO3-] + [Buf--] (1)
Value of BB is, of course, mainly determined by pH. However, part of BB value is independent of pH, hemoglobin concentration (Hb) being the principal variable upon which it also depends. To be able to compare the results of two patients with various hemoglobin concentrations, Base Excess (BE) was defined as a difference between actual concentration of BB at the given pH and its normal value (normal buffer base- NBB – dependent of Hb) at pH 7.4. BB and NBB are dependent on Hb concentration, but due to the definition, this dependence is eliminated with BE.
BE =BB – NBB (2)
During metabolic disturbances of acid-base chemistry (i.e. during disturbances caused by imbalance between production and excretion of strong acids), the excess or lack of strong acids is dampened by buffer systems, causing changes of both BB and BE.
In order to clinically assess of acid-base disorders, Danish authors lead by Ole Siggaard-Andersen [5] have created nomograms based on experimental data. Nomograms graphically describe the relationship
between the pH (or hydrogen ion concentration) and the value of pCO2, BE and Hb.
pH = function(pCO2, BE, Hb) (3)
These nomograms are still widely used in clinical practice (although today mainly hidden in electronic computation algorithms inside the blood-gas/pH analyzers). However, they were constructed for the blood with normal concentration of plasma proteins. That can cause interpretation and/or validity problems in patients with plasma protein concentration disorders - rather common situation in acutely ill-patients.
3 “Modern” approach of Stewart and his followers Limitation of Siggaard-Andersen nomogram to normal levels of plasma proteins (or more exactly normal values of plasmatic buffers generally) has lead Peter Stewart into formulation of a new approach to acid-base chemistry of plasma.
Stewart’s calculations [8] are based on five notions that must hold and are expressed by following equations.
1. Water dissociation equation:
[H+] [OH-] = K'w (4)
2. Law of conservation of mass for the buffers in their two forms (basic and acidic):
[Buf-]+[HBuf] = [BufTOT] (5)
3. Dissociation equilibrium of the non-bicarbonate buffer system:
[Buf-] [H+] = KBUF × [HBuf] (6)
4. Dissociation equilibrium of the bicarbonate buffer:
[H+] [HCO3-] = M × pCO2 (7)
5. Dissociation equilibrium between bicarbonate and carbonate:
[H+] [CO32-] = N × [HCO3
-] (8)
6. Principle of electroneutrality:
SID+[H+] –[HCO3-]–[Buf-]–[CO3
2-]–[OH-] = 0 (9)
SID in the last equation is an acronym for “strong ion difference”, defined as the difference between the concentration of the fully dissociated cations and fully dissociated anions (expressed in mEq/L). In practice, we usually find its value as:
SID = [Na+] + [K+] + [Mg2+] + [Ca2+] - [Cl-] (10)
By combining the six given equations, we can obtain a single algebraic equation of fourth order, which can be solved for the concentration of hydrogen ions (independent variables are in bold; constants in italics):
Proc. EUROSIM 2007 (B. Zupančič, R. Karba, S. Blažič) 9-13 Sept. 2007, Ljubljana, Slovenia
ISBN 978-3-901608-32-2 2 Copyright © 2007 EUROSIM / SLOSIM
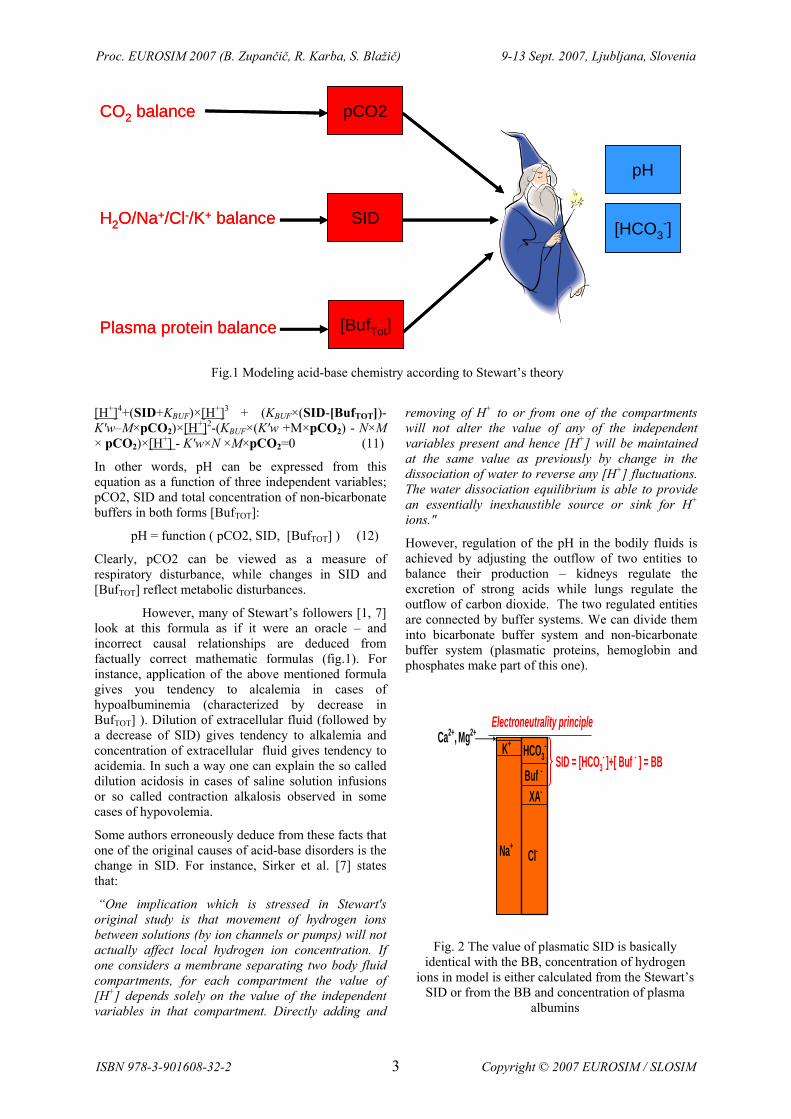
[H+]4+(SID+KBUF)×[H+]3 + (KBUF×(SID-[BufTOT])- K'w–M×pCO2)×[H+]2-(KBUF×(K'w +M×pCO2) - N×M × pCO2)×[H+] - K'w×N ×M×pCO2=0 (11)
In other words, pH can be expressed from this equation as a function of three independent variables; pCO2, SID and total concentration of non-bicarbonate buffers in both forms [BufTOT]:
pH = function ( pCO2, SID, [BufTOT] ) (12)
Clearly, pCO2 can be viewed as a measure of respiratory disturbance, while changes in SID and [BufTOT] reflect metabolic disturbances.
However, many of Stewart’s followers [1, 7] look at this formula as if it were an oracle – and incorrect causal relationships are deduced from factually correct mathematic formulas (fig.1). For instance, application of the above mentioned formula gives you tendency to alcalemia in cases of hypoalbuminemia (characterized by decrease in BufTOT] ). Dilution of extracellular fluid (followed by a decrease of SID) gives tendency to alkalemia and concentration of extracellular fluid gives tendency to acidemia. In such a way one can explain the so called dilution acidosis in cases of saline solution infusions or so called contraction alkalosis observed in some cases of hypovolemia.
Some authors erroneously deduce from these facts that one of the original causes of acid-base disorders is the change in SID. For instance, Sirker et al. [7] states that:
“One implication which is stressed in Stewart's original study is that movement of hydrogen ions between solutions (by ion channels or pumps) will not actually affect local hydrogen ion concentration. If one considers a membrane separating two body fluid compartments, for each compartment the value of [H+] depends solely on the value of the independent variables in that compartment. Directly adding and
removing of H+ to or from one of the compartments will not alter the value of any of the independent variables present and hence [H+] will be maintained at the same value as previously by change in the dissociation of water to reverse any [H+] fluctuations. The water dissociation equilibrium is able to provide an essentially inexhaustible source or sink for H+ ions."
However, regulation of the pH in the bodily fluids is achieved by adjusting the outflow of two entities to balance their production – kidneys regulate the excretion of strong acids while lungs regulate the outflow of carbon dioxide. The two regulated entities are connected by buffer systems. We can divide them into bicarbonate buffer system and non-bicarbonate buffer system (plasmatic proteins, hemoglobin and phosphates make part of this one).
H2O/Na+/Cl-/K+ balance
CO2 balance
Plasma protein balance
pCO2
SID
[BufTot]
pH
[HCO3-]H2O/Na+/Cl-/K+ balance
CO2 balance
Plasma protein balance
pCO2
SID
[BufTot]
pH
[HCO3-]
Fig.1 Modeling acid-base chemistry according to Stewart’s theory
K+ HCO3-
Buf -
XA-
Cl-Na+
Ca2+, Mg2+
SID = [HCO3- ]+[ Buf - ] = BB
Electroneutrality principle
Fig. 2 The value of plasmatic SID is basically
identical with the BB, concentration of hydrogen ions in model is either calculated from the Stewart’s
SID or from the BB and concentration of plasma albumins
Proc. EUROSIM 2007 (B. Zupančič, R. Karba, S. Blažič) 9-13 Sept. 2007, Ljubljana, Slovenia
ISBN 978-3-901608-32-2 3 Copyright © 2007 EUROSIM / SLOSIM

4 Border flux balance approach to acid-base chemistry In order to understand well the causal relationships in acid-base disorders, it is crucial to realize that values of SID and BB are basically identical (fig. 2).
Thus, pH can be calculated using the SID as well as the BB. Changes of SID and changes of BB (or BE) are identical, because the movements of ions across plasmatic membranes are electroneutral. Hydrogen ions or bicarbonates are always accompanied by other ions when they move from one compartment to another.
For instance, during metabolic production of strong acids, the amount of hydrogen ions that leaves intracellular fluid is accompanied by equivalent amount of the strong acid anions. Analogically, influx or loss or bicarbonates is always accompanied by equimolar transfers of other ions. Loss of bicarbonates by gastrointestinal tract is matched by retention of chloride ions in extracellular fluid, leading to hyperchloremic metabolic acidosis. Buffering reaction do not change elektroneutrality, however, they can change the value of SID and BB. Transferred hydrogen ions or bicarbonates instantly react with buffering systems and cause an identical change in BB
as was the change of SID caused by transport. Changes of the concentrations of ions comprising the SID and changes of the entities describing buffering capacity (BB or BE) are dual representations of one single phenomenon.
Our experience with the modeling of acid-base chemistry has helped us to formulate a theory that we have named border flux balance approach.
Our models are based on several principles:
Nor the buffering reactions nor the transfer of ions between various compartments of bodily fluids do change elektroneutrality. Fluxes of hydrogen ions or bicarbonates are always accompanied by the fluxes of complementary ions. That is why the changes of the concentrations of ions that influence the SID and changes of the entities describing the buffering capacity (BB or BE) are dual representations of one single acid base status.
It is beneficial to work with the total content of the given substance rather than the measures of the various forms in which the substance is present in the sample (e.g. O2 in blood exists in the free form and in the form that is bound to hemoglobin, CO2 is in the free dissolved form, bound to hemoglobin and in the form of bicarbonate). The transitions between various
K+
H+XA-
Cl-Na+
H2CO3-
H2O
CO2 HCO3-
Buf -
Metabolic productionof CO2
Metabolic productionof strong acids
HBuf
H+XA-
CO2 excretionby lung
Strong acidsexcretionby kidney
XA-
CO2+H2O
HPO42-
H2PO4- NH4
+
NH3
H+HCO3-
Fig. 3 Acid-base status in the extracellular fluid is a result of two regulated flows of substances connected by
the buffering system: The flow of carbon dioxide, whose output is regulated by the lungs and the flow of strong acids.
Proc. EUROSIM 2007 (B. Zupančič, R. Karba, S. Blažič) 9-13 Sept. 2007, Ljubljana, Slovenia
ISBN 978-3-901608-32-2 4 Copyright © 2007 EUROSIM / SLOSIM

forms do not change the total amount of the given substance in the sample; the total content can change only by a flux of the substance across the imaginary borders of the sample. Commonly used variables are obtained by backward conversion.
Although its use in clinical practice can without doubt be of advantage, Stewart’s theory is not suitable for mathematical modeling. In order to use it, we would have to model homeostasis of all the ions contained in the definition of SID. That is why, where possible, we rather use the terms coined by Siggaard-Andersen. In the cases where the older definition is rather blurred, we precise it in such a way that ensures logical consistency. For instance, we precise the term BE of Siggaard-Andersen under the name of standard base excess (StBE) as follows: StBE is the amount of hydrogen ions that has to be added to 1liter of the sample during the titration with a strong acid to reach pH of 7.4, all that with the given hemoglobin concentration and plasmatic buffer concentration (albumins and phosphates mainly) of the sample; during titration pCO2 is set to be 40 mmHg, temperature to be 37°C and hemoglobin saturation to be 100%. To summarize it, the difference between the BE and StBE is that BE is a function of pH and hemoglobin concentration only, while StBE is a
function of pH, hemoglobin concentration and plasmatic buffer concentration. This definition is logically consistent.
The behaviour of blood under general conditions (abnormal temperature, low hemoglobin saturation, anemia, hypo- or hyperalbuminémie) can be formally described by a set of equations. In case of modeling blood gases and acid-base chemistry, seven degrees of freedom are enough to achieve a sufficient accuracy. We chose seven mutually independent state variables as follows:
cO2Tot – total concentration of O2 in all its forms;
cCO2Tot – total concentration of CO2 in all its forms;
StBE – standard BE – generalized BE, as defined above;
BufTot = cProtTot + cPhosp – total concentration of plasmatic buffers, that is total concentration of plasmatic proteins (or to be more precise concentration of their buffering aminoacids; these are found mostly on albumin molecules) added with the concentration of plasma phosphates;
cHb – hemoglobin concentration;
temperature – actual temperature (norm 37°C);
K+
H+XA-
Cl-Na+
H2CO3-
H2O
CO2 HCO3-
Buf -
HBuf
HCO3- Na+HCO3
-Cl-Cl-Na+Cl- HCO3
-
BB and SID increases
BB and SID stays
constantBB and SIDdecreases
BB and SID increases
H+XA-
BB and SID decreases
Fig. 4 Buffering reactions per se do not change elektroneutrality. The transfer of ions in between the compartments of bodily fluids is always electroneutral: Fluxes of hydrogen ions or bicarbonates are always
accompanied by the fluxes of complementary ions.
Proc. EUROSIM 2007 (B. Zupančič, R. Karba, S. Blažič) 9-13 Sept. 2007, Ljubljana, Slovenia
ISBN 978-3-901608-32-2 5 Copyright © 2007 EUROSIM / SLOSIM
total volume of blood or alternatively dilution factor. It is not needed to describe uniquely a blood sample. However, if we want to simulate dilution acidosis and/or contraction alcalosis in conditions of whole organism, we need it.
Inflow/outflow of a blood gas leads to change in total concentrations of a blood gas, inflow/outflow of hydrogen ions (or alternatively hydroxyl ions) and bicarbonates lead to a change in StBE (adding 1 mmol of hydrogen ions to 1 liter of blood reduces the StBE by 1 mmol/L, adding 1 mmol of bicarbonates will lead to increase of StBE by 1 mmol/L.
This is why we are able to model the (respiratory) balance between the inflow/outflow of CO2 and the (metabolic) balance between the production and
kidney excretion of strong acids. We are also able to calculate the changes of the state variables during hemoconcentration and hemodilution (thus, we obtain the pH at dilution acidosis and contraction alcalosis), as well as the changes of acid-base parameters at hypoalbuminemia or hypothermia.
The border flux balance approach to acid-base chemistry unifies the classical approach of the “Danish school” with the quantitative approach of Stewart and his followers. The causal chain in our approach goes from two regulated balances (that of influx/outflux of CO2 and that of influx/outflux of strong acids (fig. 3) to the buffer systems that connect them and onto the pH which is the result of these processes (fig. 4). Quantitative representation of our
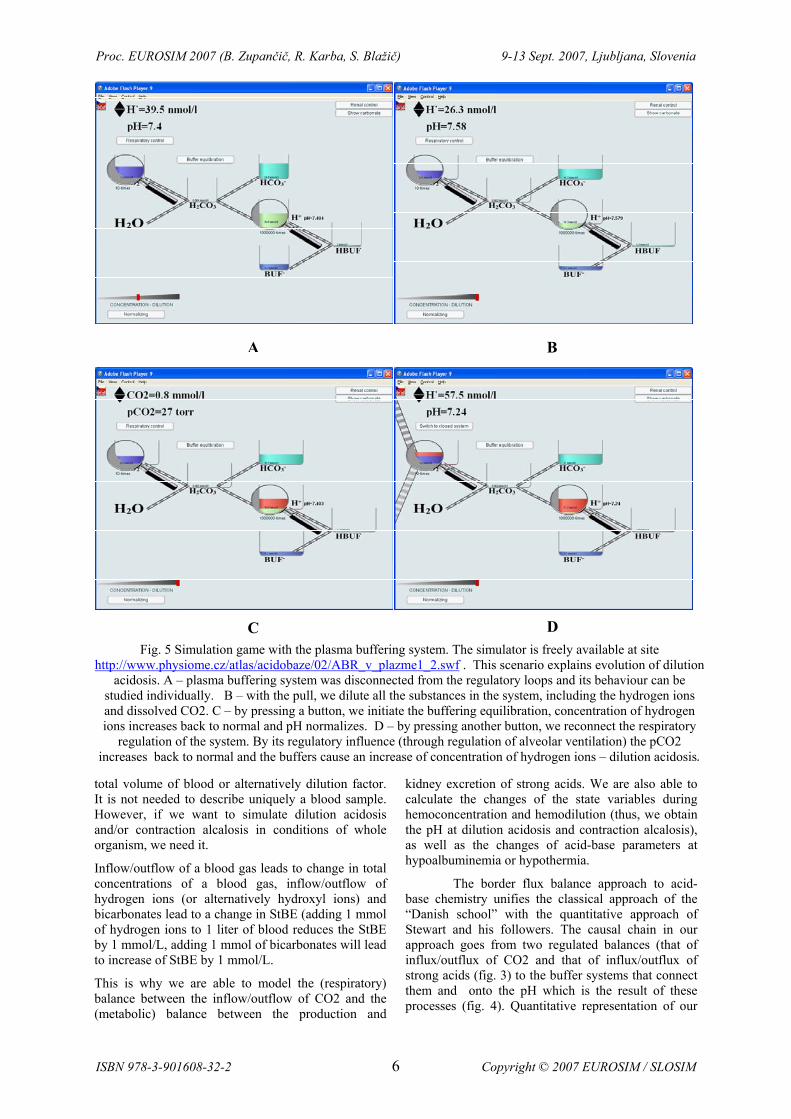
Fig. 5 Simulation game with the plasma buffering system. The simulator is freely available at site http://www.physiome.cz/atlas/acidobaze/02/ABR_v_plazme1_2.swf . This scenario explains evolution of dilution
acidosis. A – plasma buffering system was disconnected from the regulatory loops and its behaviour can be studied individually. B – with the pull, we dilute all the substances in the system, including the hydrogen ions and dissolved CO2. C – by pressing a button, we initiate the buffering equilibration, concentration of hydrogen ions increases back to normal and pH normalizes. D – by pressing another button, we reconnect the respiratory
regulation of the system. By its regulatory influence (through regulation of alveolar ventilation) the pCO2 increases back to normal and the buffers cause an increase of concentration of hydrogen ions – dilution acidosis.
A B
C D
Proc. EUROSIM 2007 (B. Zupančič, R. Karba, S. Blažič) 9-13 Sept. 2007, Ljubljana, Slovenia
ISBN 978-3-901608-32-2 6 Copyright © 2007 EUROSIM / SLOSIM

approach is embedded in our simulation models; it explains the relationships between acid-base, volume and ion disturbances.
5 Learning while playing – an acid-base chemistry simulation model as an e-learning application The combination of multimedia interactive environment with simulation games is a very effective pedagogic tool, making it easier for a student to understand the complex dynamics of physiological regulation and pathophysiological disorders of it. It is possible to play with the system while the regulatory feedback loops are disconnected. Hence, students come to understand better the difference between the behaviour of the system itself and the influence of the feedback regulation.
The simulation model based on the border flux balance approach makes a base for our teaching multimedia application that includes buffering systems, regulatory influence of respiration and kidneys and influence of ionic and volume homeostasis on acid-base status. For instance, student can try to simulate the evolution (causal chain of events) of dilution acidosis in subsystem of plasma
Fig. 6 Turning the knob we can increase the metabolic production rate of non-volatile acids. By
increasing the strong acid production, we cause metabolic acidosis
Fig. 7 Ratio of metabolic production and renal excretion of strong acids is highly increased. H+/Na+
and H+/K+ exchange on the cell membrane is activated. Intracellular and extracellular buffers
buffer H+ ions,
Fig. 8 Blood buffer system - the blood has been acidified, Base Excess and actual bicarbonate
concentration are decreasing, and pCO2 is also slowly decreasing.
Fig. 9 Acid-base values on this compensatory diagram are in the acute metabolic acidosis range.
This is the beginning of a progressive reaction by the ventilation center to counteract metabolic acidosis.
Fig. 10 Respiratory compensation is at a maximum in about 12 hours. Decreasing pCO2 is leading to a rise
of arterial blood pH. Acid-base parameters are approaching a compensated metabolic acidosis range.
Proc. EUROSIM 2007 (B. Zupančič, R. Karba, S. Blažič) 9-13 Sept. 2007, Ljubljana, Slovenia
ISBN 978-3-901608-32-2 7 Copyright © 2007 EUROSIM / SLOSIM
buffers (fig.5); he/she starts with normal plasma (A), first he/she dilutes the plasma (B),then finds out what happens after buffering equilibration (C) and finally applies the respiratory regulation (D).
A complex model of acid-base chemistry is embedded into our educational simulator named Golem [8]. The underlying mathematical model with all the equations is as a part of a MATLAB/Simulink library “Physiolibrary” freely available at internet site http://patf-biokyb.lf1.cuni.cz/wiki/projekty/physiolibrary .
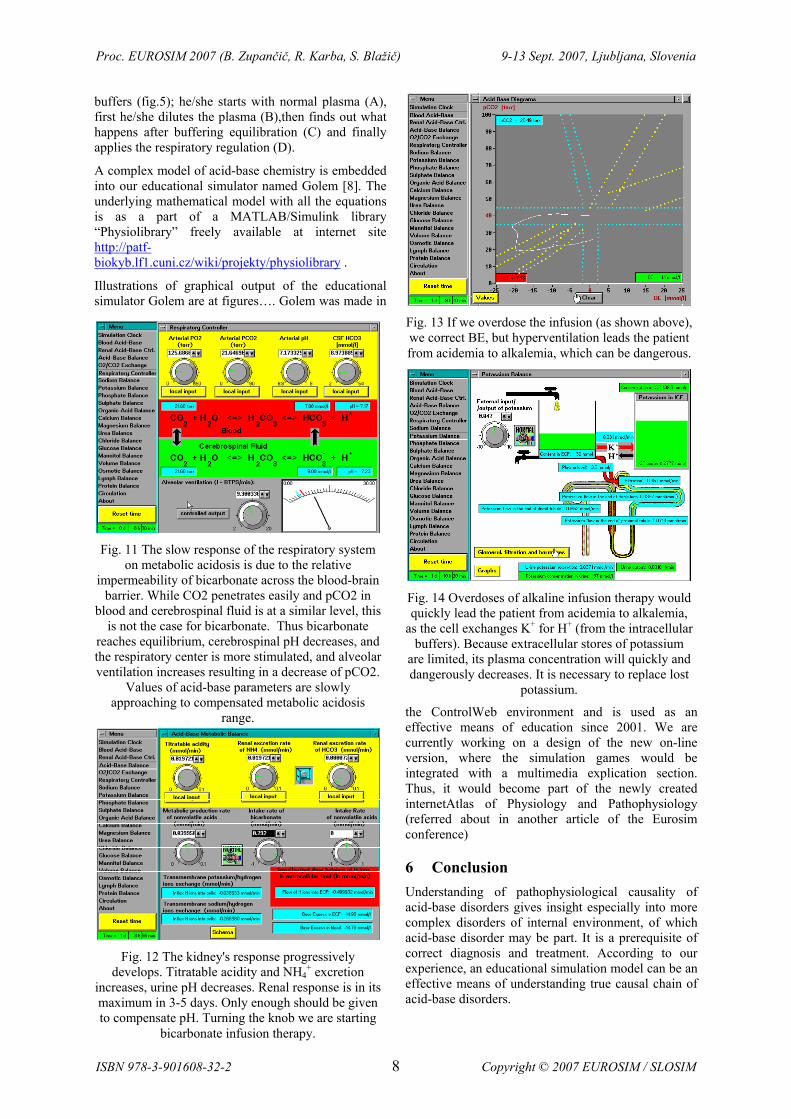
Illustrations of graphical output of the educational simulator Golem are at figures…. Golem was made in
the ControlWeb environment and is used as an effective means of education since 2001. We are currently working on a design of the new on-line version, where the simulation games would be integrated with a multimedia explication section. Thus, it would become part of the newly created internetAtlas of Physiology and Pathophysiology (referred about in another article of the Eurosim conference)
6 Conclusion Understanding of pathophysiological causality of acid-base disorders gives insight especially into more complex disorders of internal environment, of which acid-base disorder may be part. It is a prerequisite of correct diagnosis and treatment. According to our experience, an educational simulation model can be an effective means of understanding true causal chain of acid-base disorders.
Fig. 11 The slow response of the respiratory system on metabolic acidosis is due to the relative
impermeability of bicarbonate across the blood-brain barrier. While CO2 penetrates easily and pCO2 in
blood and cerebrospinal fluid is at a similar level, this is not the case for bicarbonate. Thus bicarbonate
reaches equilibrium, cerebrospinal pH decreases, and the respiratory center is more stimulated, and alveolar ventilation increases resulting in a decrease of pCO2.
Values of acid-base parameters are slowly approaching to compensated metabolic acidosis
range.
Fig. 12 The kidney's response progressively develops. Titratable acidity and NH4
+ excretion increases, urine pH decreases. Renal response is in its maximum in 3-5 days. Only enough should be given to compensate pH. Turning the knob we are starting
bicarbonate infusion therapy.
Fig. 13 If we overdose the infusion (as shown above), we correct BE, but hyperventilation leads the patient from acidemia to alkalemia, which can be dangerous.
Fig. 14 Overdoses of alkaline infusion therapy would quickly lead the patient from acidemia to alkalemia,
as the cell exchanges K+ for H+ (from the intracellular buffers). Because extracellular stores of potassium
are limited, its plasma concentration will quickly and dangerously decreases. It is necessary to replace lost
potassium.
Proc. EUROSIM 2007 (B. Zupančič, R. Karba, S. Blažič) 9-13 Sept. 2007, Ljubljana, Slovenia
ISBN 978-3-901608-32-2 8 Copyright © 2007 EUROSIM / SLOSIM

7 References [1] Fencl J., Jabor A., Kazda A., Figge, J.: Diagnosis
of metabolic acid-base disturbances in critically ill patients. Am. J. Respir. Crit. Care 162:2246-2251, 2000.
[2] Hasselbach K.A.: Die Berechnung der Wasserstoffzahl des Blutes aus der freiten und gebundenen Kohlensaure desselben und die Sauerstoffbindung des Blutes als Funktion der Wasserstoffzahl. Biochemische Zeitschrift, 78:112-144, 1916.
[3] Henderson L.J.: Das Gleichgewicht zwischen Sauren und Basen im teirischen Organismus. Ergebnisse der Physiologie Biologischen Chemie und Experimentellen Pharmakologie. 8:254-325.1909.
[4] Kofránek J, Andrlík M, Matoušek S. Simulation Model of O2 and CO2 Content and Blood Acid-Base Chemistry. Proceedings of ESTAIC conference, AAlborg 2005, 15-16.,2005
[5] Siggaard-Andersen, O.: The pH, log pCO2 blood acid-base nomogram revised. Scand. J. clin. Lab. Invest., 14: pp. 598-604. 1962.
[6] Singer R.B. and Hastings A.B. An umproved clinical method for the estimation of disturbances of the acid-base balance of human blood. Medicine (Baltimore) 27: 223-242. 1948.
[7] Sirker, A. A., Rhodes, A., and Grounds, R. M.. Acid-base physiology: the 'traditional' and 'modern' approaches. Anesthesia 57: 348-356. 2001.
[8] Stewart P.A. Modern quantitative acid-base chemistry. Can. J. Physiol. Pharmacol. 61: 1444-1461. 1983.
[9] Kofránek, J., Anh Vu, L. D., Snášelová, H., Kerekeš, R. Velan, T. (2001): “GOLEM – Multimedia simulator for medical education.” In: Studies in Health Technology and Informatics., vol. 84. MEDINFO 2001, Proceedings of the 10th World Congress on Medical Informatics. (V.L. Patel, R. Rogers, R. Haux (Eds.)), IOS Press, Amsterdam, Berlin, Oxford, Washington DC, 2001, pp. 1042-1046.
Acknowledgement This research was supported by aid grant MŠMT č.2C06031 and BAJT servis s.r.o company.
Fig. 15 To correct the K+ depletion, we must use a potassium infusion in glucose and insulin - insulin
takes glucose into cells…
.
Fig. 16 ...but also increases the entry of potassium into cells resulting in a faster correction of K+
depletion. The infusion must not contain too large concentrations of potassium (as this would increase
K+ to dangerous level).
Proc. EUROSIM 2007 (B. Zupančič, R. Karba, S. Blažič) 9-13 Sept. 2007, Ljubljana, Slovenia
ISBN 978-3-901608-32-2 9 Copyright © 2007 EUROSIM / SLOSIM


![Unbenannt-1detailforschung.info/Texte/quick.pdf · Konstruktive Umsetzung der Solarwand Messergebnisse Name Tmax [°C] Heat Flux y1 Heat Flux y2 Heat Flux aussen Heat Flux innen Georg](https://img.pdfslide.net/doc/110x75/5fe58fbd5e888a7169649e0d/unbenannt-konstruktive-umsetzung-der-solarwand-messergebnisse-name-tmax-c-heat.jpg)