Embed Size (px)
Citation preview
ECN260 Landbrukspolitikk
Agricultural Policy
10 October 2017
Border Protection under Pressure - WTO
Grensevern under press II - WTO
2
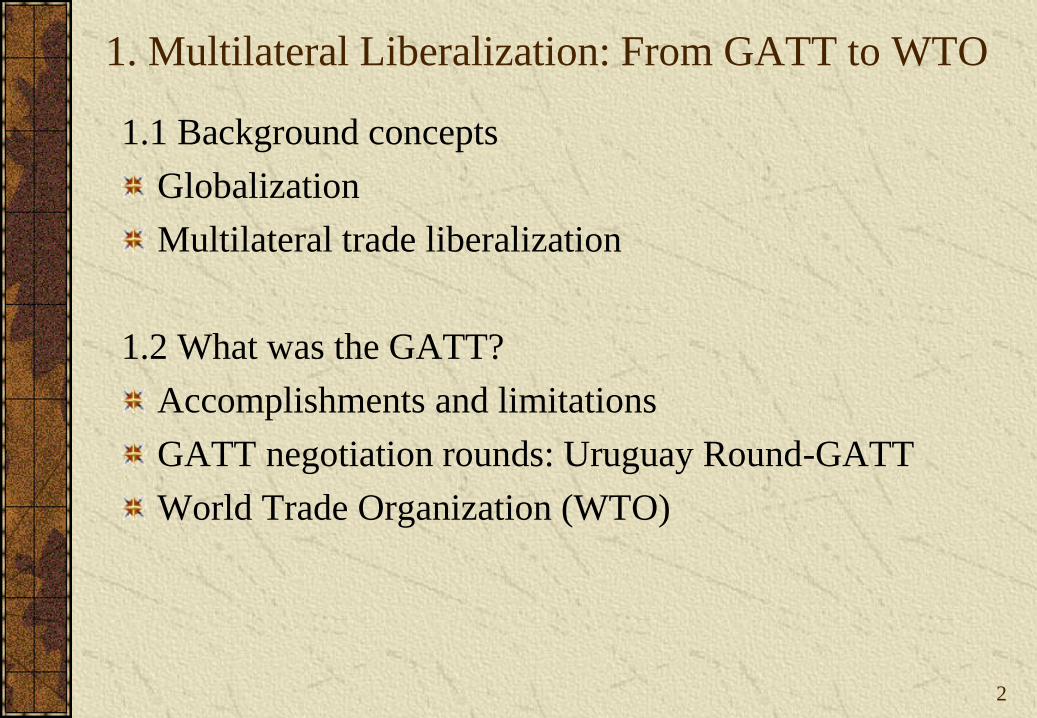
1. Multilateral Liberalization: From GATT to WTO
1.1 Background concepts
Globalization
Multilateral trade liberalization
1.2 What was the GATT?
Accomplishments and limitations
GATT negotiation rounds: Uruguay Round-GATT
World Trade Organization (WTO)
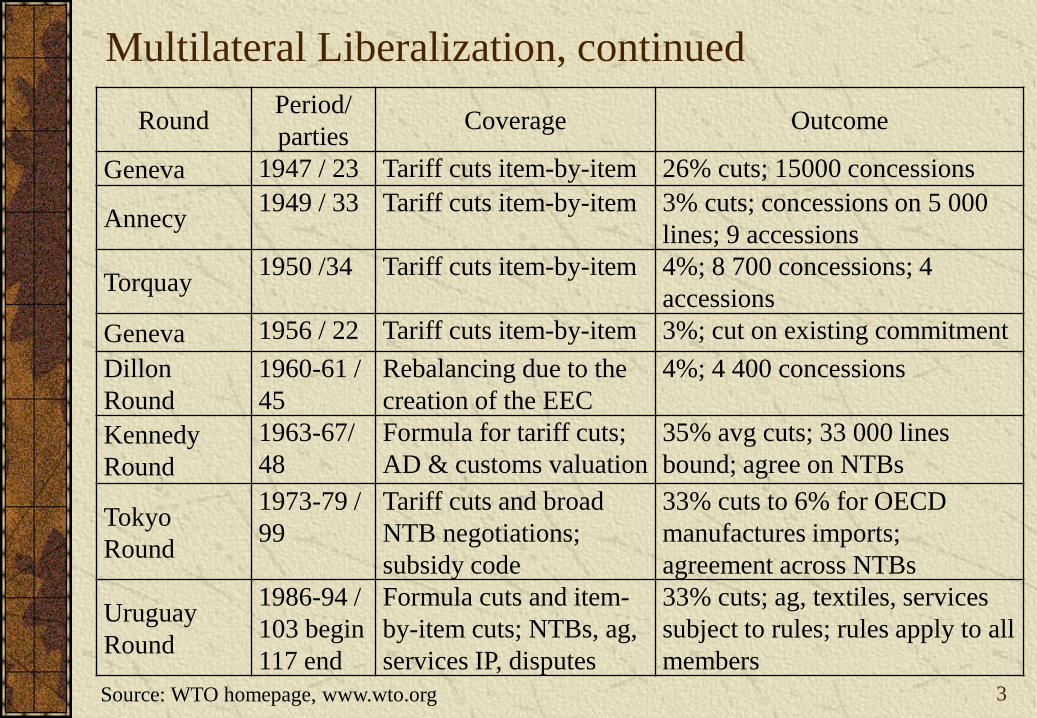
Multilateral Liberalization, continued
3
RoundPeriod/
partiesCoverage Outcome
Geneva 1947 / 23 Tariff cuts item-by-item 26% cuts; 15000 concessions
Annecy1949 / 33 Tariff cuts item-by-item 3% cuts; concessions on 5 000
lines; 9 accessions
Torquay1950 /34 Tariff cuts item-by-item 4%; 8 700 concessions; 4
accessions
Geneva 1956 / 22 Tariff cuts item-by-item 3%; cut on existing commitment
Dillon
Round
1960-61 /
45
Rebalancing due to the
creation of the EEC
4%; 4 400 concessions
Kennedy
Round
1963-67/
48
Formula for tariff cuts;
AD & customs valuation
35% avg cuts; 33 000 lines
bound; agree on NTBs
Tokyo
Round
1973-79 /
99
Tariff cuts and broad
NTB negotiations;
subsidy code
33% cuts to 6% for OECD
manufactures imports;
agreement across NTBs
Uruguay
Round
1986-94 /
103 begin
117 end
Formula cuts and item-
by-item cuts; NTBs, ag,
services IP, disputes
33% cuts; ag, textiles, services
subject to rules; rules apply to all
members
Source: WTO homepage, www.wto.org
4
Multilateral Liberalization, continued . . .
1.3 What is the WTO?
Multilateral organization
Government-to-government
Body dealing with trade rules
Forum for holding trade negotiations
Settle trade disputes

5
1.4 Perceptions of the WTO process
Multilateral Liberalization, continued
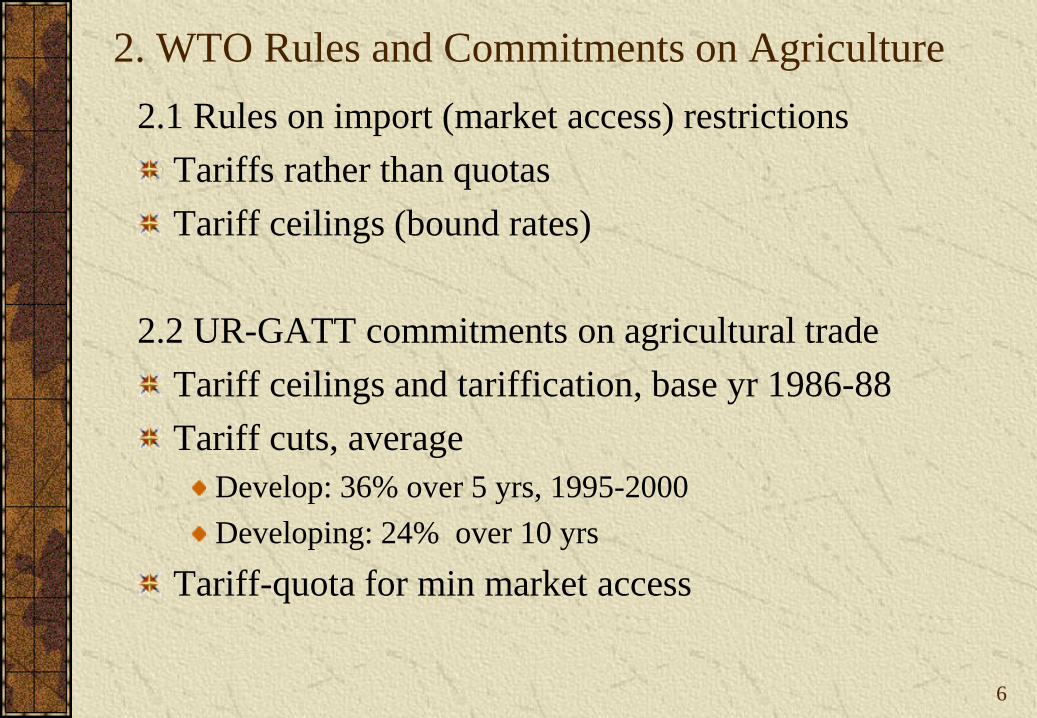
2. WTO Rules and Commitments on Agriculture
2.1 Rules on import (market access) restrictions
Tariffs rather than quotas
Tariff ceilings (bound rates)
2.2 UR-GATT commitments on agricultural trade
Tariff ceilings and tariffication, base yr 1986-88
Tariff cuts, average
Develop: 36% over 5 yrs, 1995-2000
Developing: 24% over 10 yrs
Tariff-quota for min market access
6
WTO Rules and Commitments on Imports
7
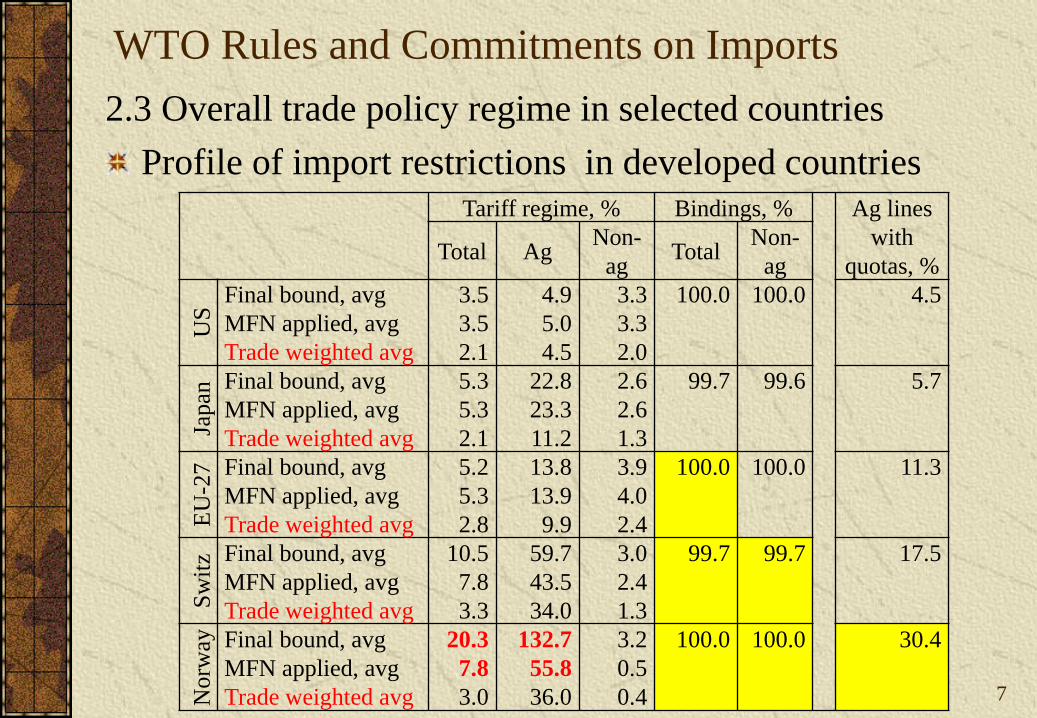
Tariff regime, % Bindings, % Ag lines
with
quotas, %Total Ag
Non-
agTotal
Non-
ag
US
Final bound, avg
MFN applied, avg
Trade weighted avg
3.5
3.5
2.1
4.9
5.0
4.5
3.3
3.3
2.0
100.0 100.0 4.5
Japan
Final bound, avg
MFN applied, avg
Trade weighted avg
5.3
5.3
2.1
22.8
23.3
11.2
2.6
2.6
1.3
99.7 99.6 5.7
EU
-27 Final bound, avg
MFN applied, avg
Trade weighted avg
5.2
5.3
2.8
13.8
13.9
9.9
3.9
4.0
2.4
100.0 100.0 11.3
Sw
itz Final bound, avg
MFN applied, avg
Trade weighted avg
10.5
7.8
3.3
59.7
43.5
34.0
3.0
2.4
1.3
99.7 99.7 17.5
Norw
ay Final bound, avg
MFN applied, avg
Trade weighted avg
20.3
7.8
3.0
132.7
55.8
36.0
3.2
0.5
0.4
100.0 100.0 30.4
2.3 Overall trade policy regime in selected countries
Profile of import restrictions in developed countries
WTO Rules and Commitments on Imports
8
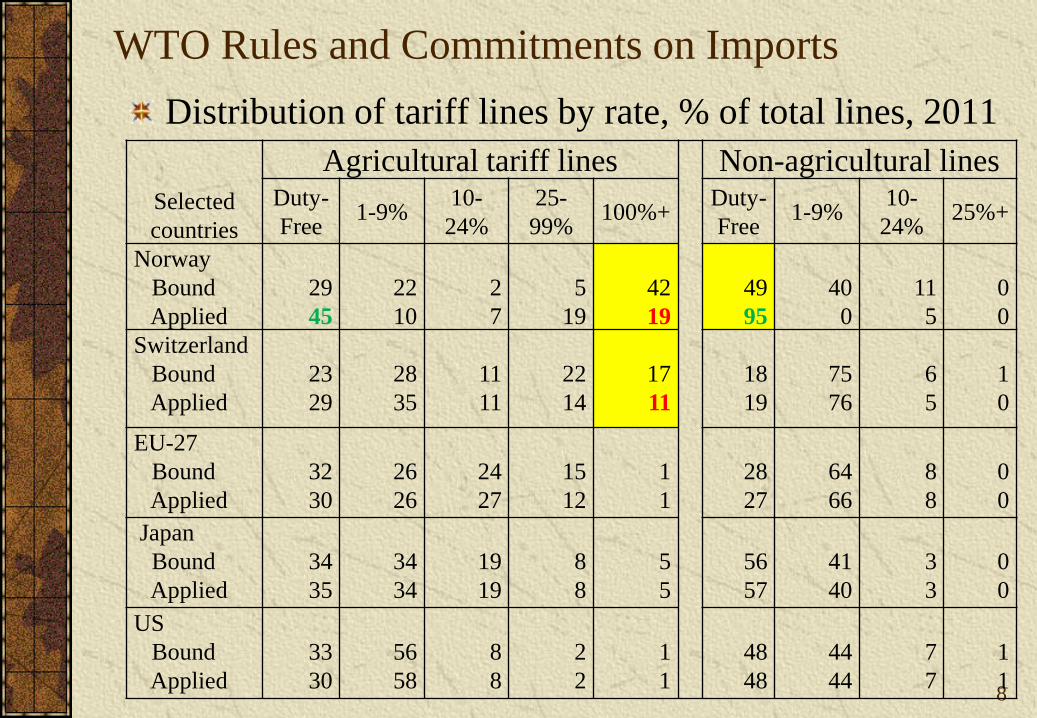
Selected
countries
Agricultural tariff lines Non-agricultural linesDuty-
Free1-9%
10-
24%
25-
99%100%+
Duty-
Free1-9%
10-
24%25%+
Norway
Bound
Applied
29
45
22
10
2
7
5
19
42
19
49
95
40
0
11
5
0
0
Switzerland
Bound
Applied
23
29
28
35
11
11
22
14
17
11
18
19
75
76
6
5
1
0
EU-27
Bound
Applied
32
30
26
26
24
27
15
12
1
1
28
27
64
66
8
8
0
0
Japan
Bound
Applied
34
35
34
34
19
19
8
8
5
5
56
57
41
40
3
3
0
0
US
Bound
Applied
33
30
56
58
8
8
2
2
1
1
48
48
44
44
7
7
1
1
Distribution of tariff lines by rate, % of total lines, 2011
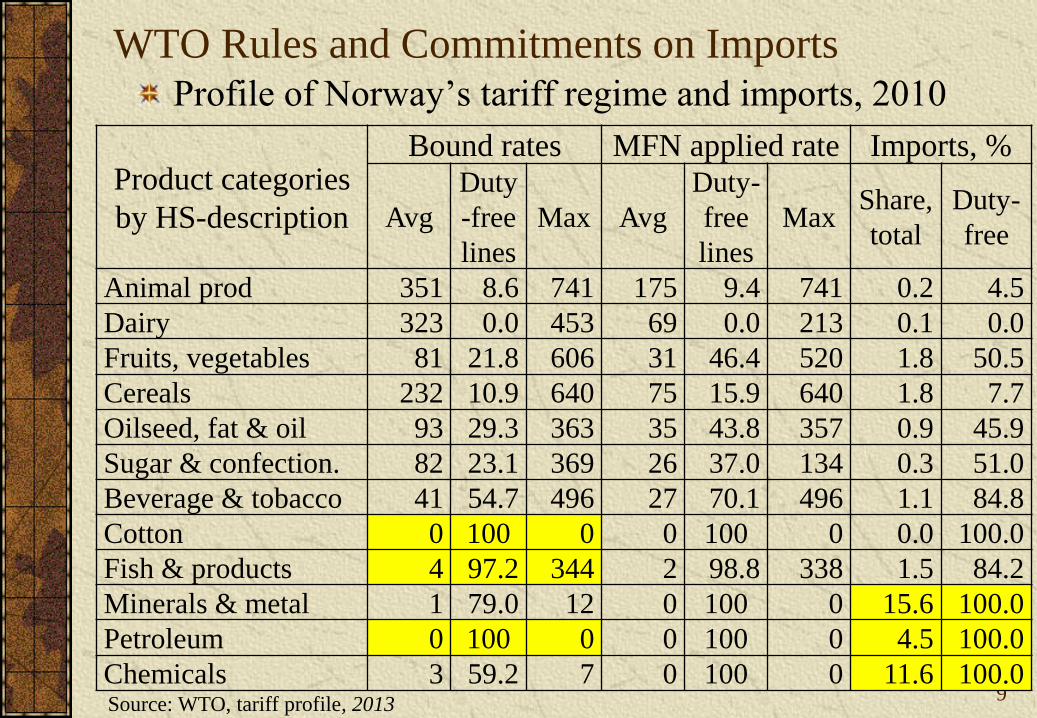
WTO Rules and Commitments on ImportsProfile of Norway’s tariff regime and imports, 2010
9
Product categories
by HS-description
Bound rates MFN applied rate Imports, %
Avg
Duty
-free
lines
Max Avg
Duty-
free
lines
MaxShare,
total
Duty-
free
Animal prod 351 8.6 741 175 9.4 741 0.2 4.5
Dairy 323 0.0 453 69 0.0 213 0.1 0.0
Fruits, vegetables 81 21.8 606 31 46.4 520 1.8 50.5
Cereals 232 10.9 640 75 15.9 640 1.8 7.7
Oilseed, fat & oil 93 29.3 363 35 43.8 357 0.9 45.9
Sugar & confection. 82 23.1 369 26 37.0 134 0.3 51.0
Beverage & tobacco 41 54.7 496 27 70.1 496 1.1 84.8
Cotton 0 100 0 0 100 0 0.0 100.0
Fish & products 4 97.2 344 2 98.8 338 1.5 84.2
Minerals & metal 1 79.0 12 0 100 0 15.6 100.0
Petroleum 0 100 0 0 100 0 4.5 100.0
Chemicals 3 59.2 7 0 100 0 11.6 100.0Source: WTO, tariff profile, 2013
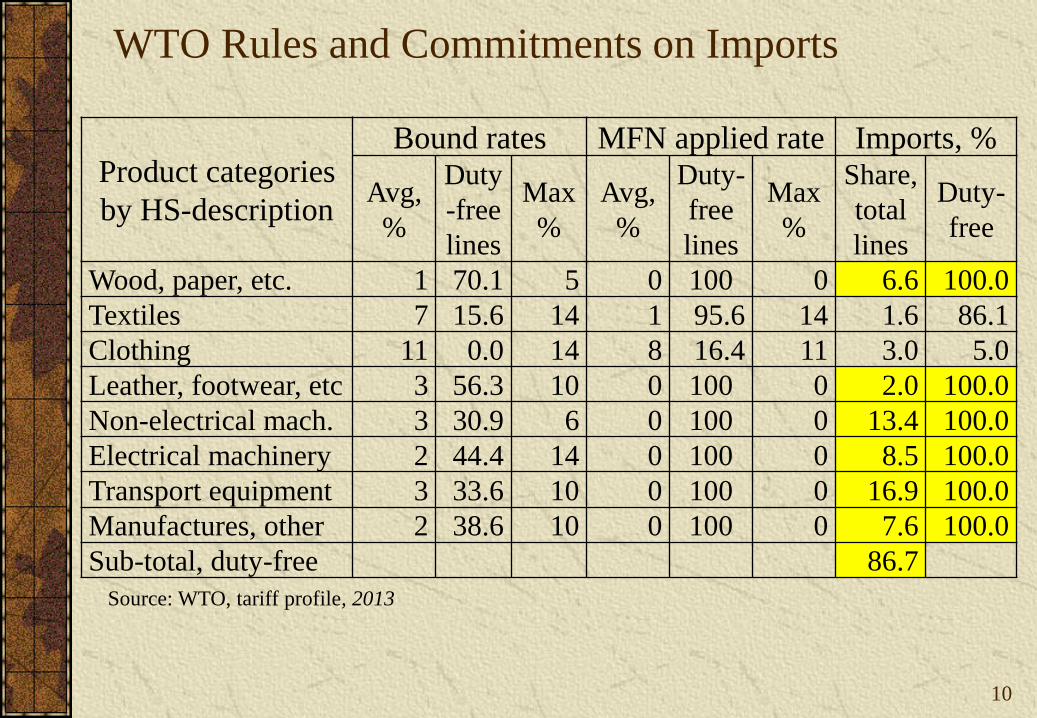
WTO Rules and Commitments on Imports
10
Product categories
by HS-description
Bound rates MFN applied rate Imports, %
Avg,
%
Duty
-free
lines
Max
%
Avg,
%
Duty-
free
lines
Max
%
Share,
total
lines
Duty-
free
Wood, paper, etc. 1 70.1 5 0 100 0 6.6 100.0
Textiles 7 15.6 14 1 95.6 14 1.6 86.1
Clothing 11 0.0 14 8 16.4 11 3.0 5.0
Leather, footwear, etc 3 56.3 10 0 100 0 2.0 100.0
Non-electrical mach. 3 30.9 6 0 100 0 13.4 100.0
Electrical machinery 2 44.4 14 0 100 0 8.5 100.0
Transport equipment 3 33.6 10 0 100 0 16.9 100.0
Manufactures, other 2 38.6 10 0 100 0 7.6 100.0
Sub-total, duty-free 86.7
Source: WTO, tariff profile, 2013
11
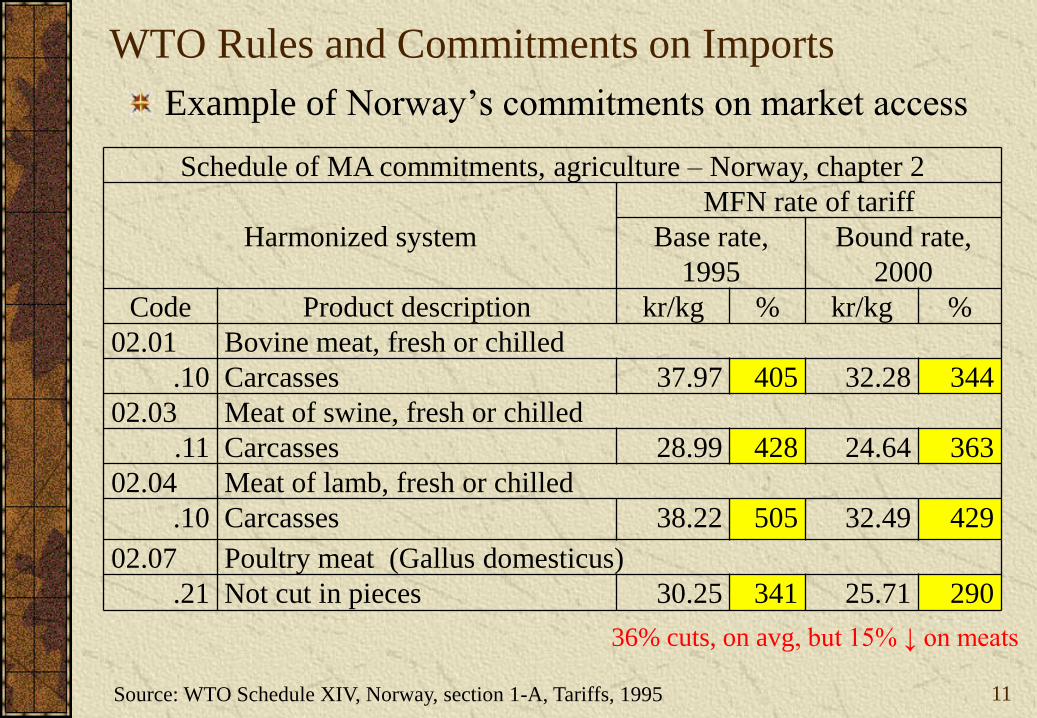
WTO Rules and Commitments on Imports
Example of Norway’s commitments on market access
Schedule of MA commitments, agriculture – Norway, chapter 2
Harmonized system
MFN rate of tariff
Base rate,
1995
Bound rate,
2000
Code Product description kr/kg % kr/kg %
02.01 Bovine meat, fresh or chilled
.10 Carcasses 37.97 405 32.28 344
02.03 Meat of swine, fresh or chilled
.11 Carcasses 28.99 428 24.64 363
02.04 Meat of lamb, fresh or chilled
.10 Carcasses 38.22 505 32.49 429
02.07 Poultry meat (Gallus domesticus)
.21 Not cut in pieces 30.25 341 25.71 290
Source: WTO Schedule XIV, Norway, section 1-A, Tariffs, 1995
36% cuts, on avg, but 15% ↓ on meats
12
3. Agricultural Subsidies and DS Commitments
3.1 Rules and disciplines on agricultural support
Categories of support
Logic of the categories
Ceiling on value of support
Reduction commitments on total support
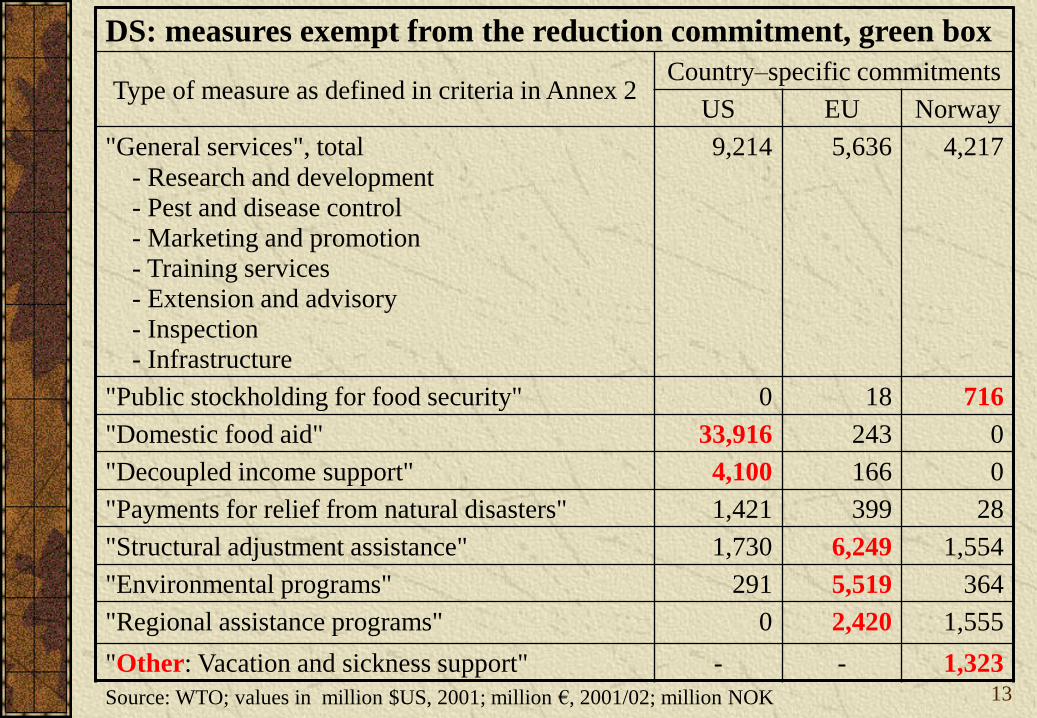
3.2 DS rules and commitments: green box
Green box defined and economic rationale
Examples of green box in schedules, table DS:1
13
DS: measures exempt from the reduction commitment, green box
Type of measure as defined in criteria in Annex 2Country–specific commitments
US EU Norway
"General services", total
- Research and development
- Pest and disease control
- Marketing and promotion
- Training services
- Extension and advisory
- Inspection
- Infrastructure
9,214 5,636 4,217
"Public stockholding for food security" 0 18 716
"Domestic food aid" 33,916 243 0
"Decoupled income support" 4,100 166 0
"Payments for relief from natural disasters" 1,421 399 28
"Structural adjustment assistance" 1,730 6,249 1,554
"Environmental programs" 291 5,519 364
"Regional assistance programs" 0 2,420 1,555
"Other: Vacation and sickness support" - - 1,323
Source: WTO; values in million $US, 2001; million €, 2001/02; million NOK
14
Ag Subsidies and DS Commitments, continued . . .
3.3 DS rules and commitments: blue box measures
Blue box subsidies defined and economic rationale
Types of blue box measures
Direct payments based on:
Fixed area and yields
85% or less of the base level of production
Fixed number of head of livestock
Commitments specified in Supplementary table DS:3
(country-specific comparisons of blue box use)

15
Ag Subsidies and DS Commitments, continued . . .
Supporting Table DS:3, Direct payments – exempt direct payments
Measure typeName and description of measure with
reference to criteria in Article 6:5Value of measure
US, 2001-02 None. Program eliminated after 1995 $ 0.0
EU, 2001-02 € mln
Payments based on fixed area and yields
Per ha compensatory payments, maize
Per ha compensatory payments, cereals
Set-aside compensation, cereals
Per ha compensatory payments, oilseeds
1,613.6
10,717.9
1,893.3
1,846.2
Payments based on 85% or less of the base level of production
None. 0.0
Livestock payments made on a fixed number of head
Payments to producers of suckler cows
Special premium, beef and veal
1,959.2
1,748.4
Total blue box exempt payments, all products €23,725.9Source: www.wto.org; notification docs, country specific, G/AG/N/USA/51 and G/AG/N/EEC/51
Ag Subsidies and DS Commitments, continued . . .
16
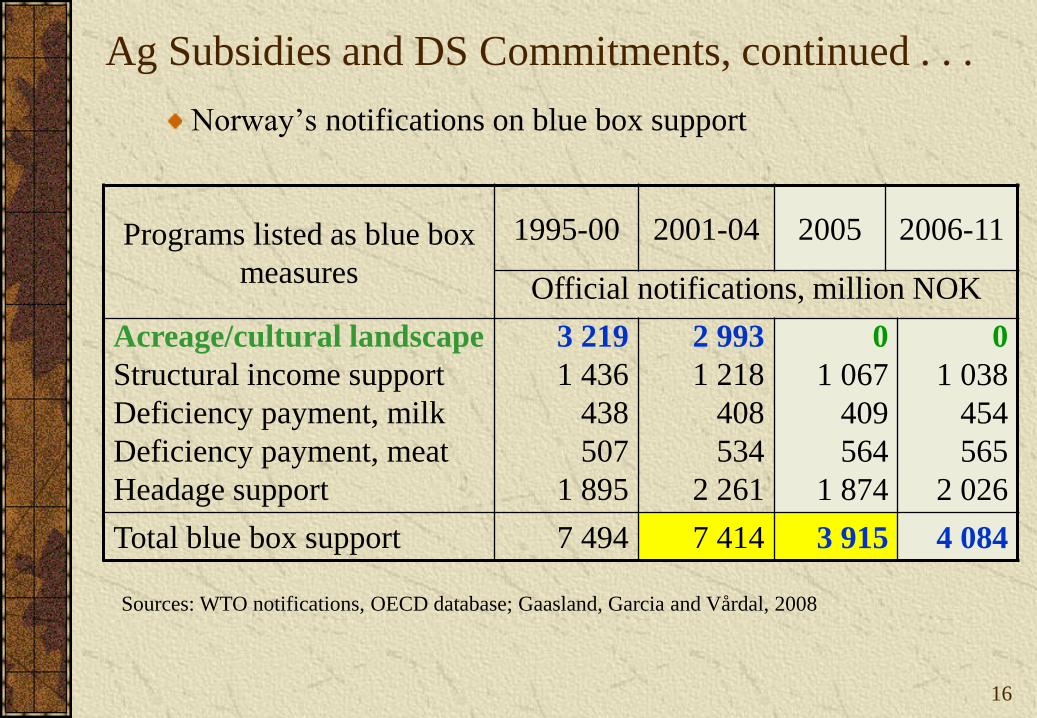
Norway’s notifications on blue box support
Programs listed as blue box
measures
1995-00 2001-04 2005 2006-11
Official notifications, million NOK
Acreage/cultural landscape
Structural income support
Deficiency payment, milk
Deficiency payment, meat
Headage support
3 219
1 436
438
507
1 895
2 993
1 218
408
534
2 261
0
1 067
409
564
1 874
0
1 038
454
565
2 026
Total blue box support 7 494 7 414 3 915 4 084
Sources: WTO notifications, OECD database; Gaasland, Garcia and Vårdal, 2008
17
Ag Subsidies and DS Commitments, continued . . .
3.4 DS rules and commitments: amber box measures
Amber box subsidies defined and economic rationale
Product-specific support
• Market price support – WTO vs theory
• Input price support
• Coupled income support
• Product-specific equivalent support
Non-product-specific support
Measures subject to reduction commitments
Commitments specified in Supporting tables DS:5-9
18
Ag Subsidies and DS Commitments, continued . . .
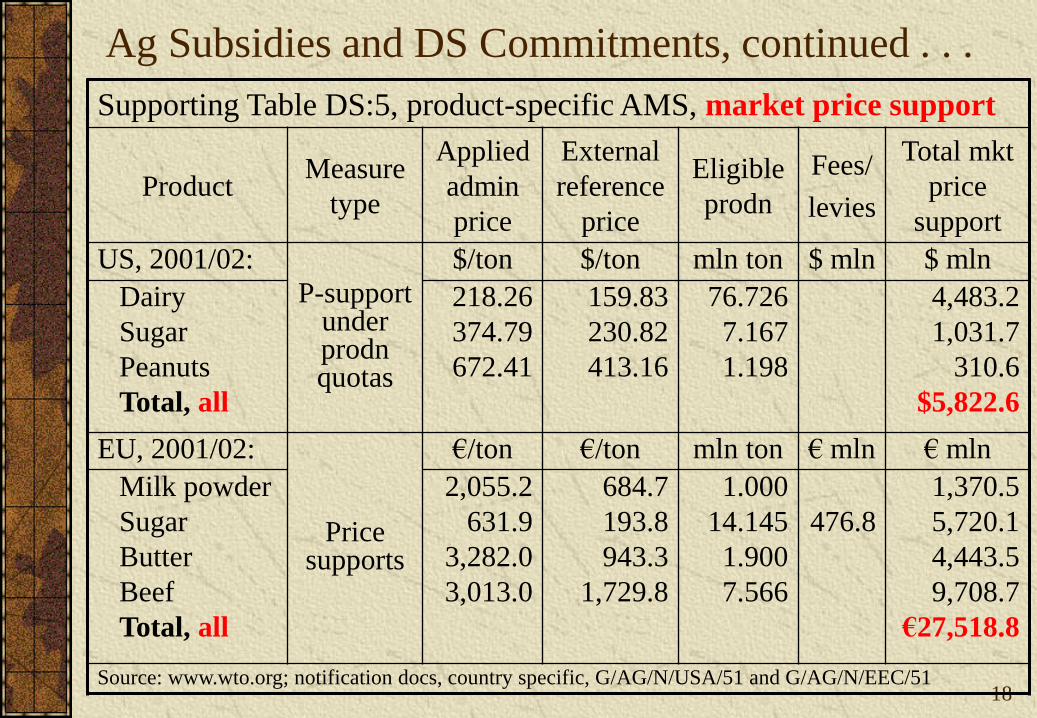
Supporting Table DS:5, product-specific AMS, market price support
ProductMeasure
type
Applied
admin
price
External
reference
price
Eligible
prodn
Fees/
levies
Total mkt
price
support
US, 2001/02:
P-support under prodnquotas
$/ton $/ton mln ton $ mln $ mln
Dairy
Sugar
Peanuts
Total, all
218.26
374.79
672.41
159.83
230.82
413.16
76.726
7.167
1.198
4,483.2
1,031.7
310.6
$5,822.6
EU, 2001/02:
Price supports
€/ton €/ton mln ton € mln € mln
Milk powder
Sugar
Butter
Beef
Total, all
2,055.2
631.9
3,282.0
3,013.0
684.7
193.8
943.3
1,729.8
1.000
14.145
1.900
7.566
476.8
1,370.5
5,720.1
4,443.5
9,708.7
€27,518.8
Source: www.wto.org; notification docs, country specific, G/AG/N/USA/51 and G/AG/N/EEC/51
19
Ag Subsidies and DS Commitments, continued . . .
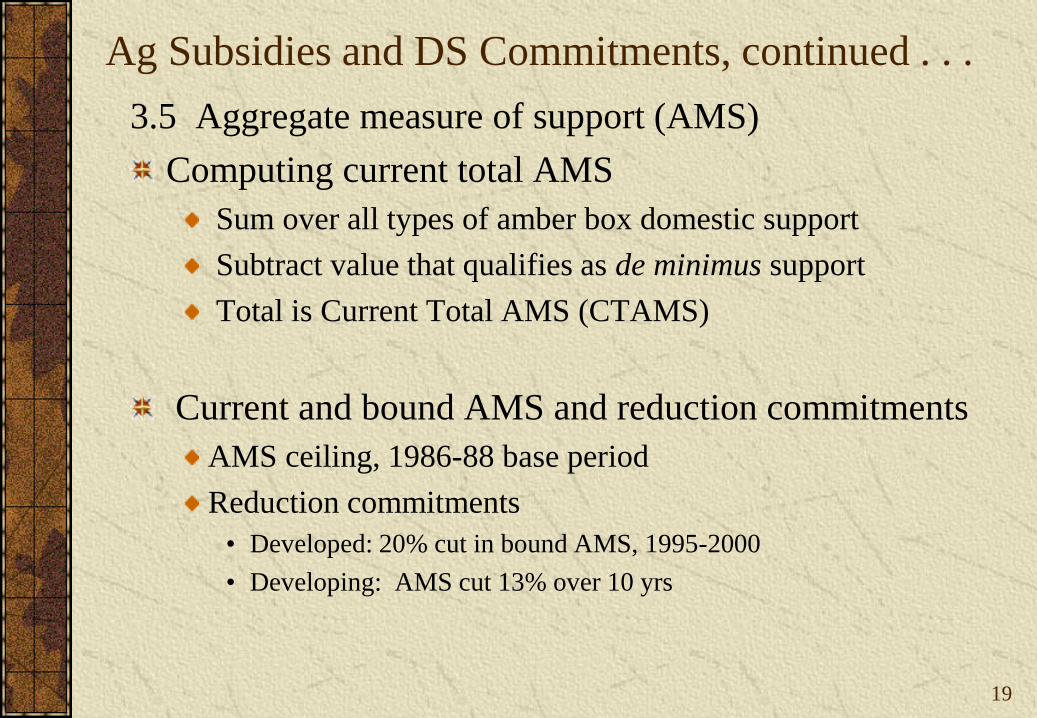
3.5 Aggregate measure of support (AMS)
Computing current total AMS
Sum over all types of amber box domestic support
Subtract value that qualifies as de minimus support
Total is Current Total AMS (CTAMS)
Current and bound AMS and reduction commitments
AMS ceiling, 1986-88 base period
Reduction commitments
• Developed: 20% cut in bound AMS, 1995-2000
• Developing: AMS cut 13% over 10 yrs

20
Ag Subsidies and DS Commitments, continued . . .
Table DS:1, Total AMS commitments (excludes green and blue boxes)
Base
86-881995-
002000
2001-05
20062007-
102008 2011 Comply
US AMS commitments, $ million
23 879 21 093 19 103 19 103 19 103 19 103 19 103 Bound
- 10 401 16 843 11 121 7 742 5 225 4 654 Applied
EU-15 and EU-27 AMS commitments, € million
83 949 72 916 67 159 67 159 72 244 72 244 72 244 Bound
- 48 242 43 654 31 704 26 632 11 678 - Applied
Norway, AMS commitments, million kr
14 311 12 641 11 449 11 449 11 449 11 449 11 449 11 449 Bound
- 10 468 10 293 10 704 10 766 10 470 11 555 9 843 Applied
Source: www.wto.org; entire DS document series of G/AG/N/USA/; G/AG/N/EEC; and G/AG/N/NOR
Bound ceiling and ↓ AMS by 20% over 6 yrs
21
Ag Subsidies and DS Commitments, continued . . .
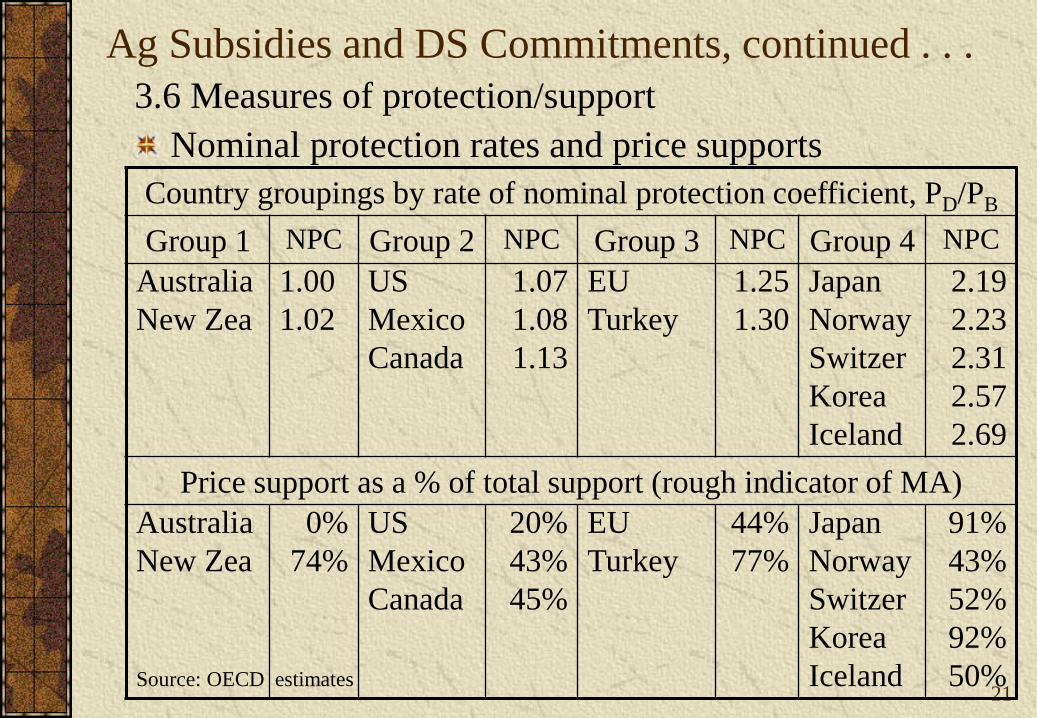
Country groupings by rate of nominal protection coefficient, PD/PB
Group 1 NPC Group 2 NPC Group 3 NPC Group 4 NPC
Australia
New Zea
1.00
1.02
US
Mexico
Canada
1.07
1.08
1.13
EU
Turkey
1.25
1.30
Japan
Norway
Switzer
Korea
Iceland
2.19
2.23
2.31
2.57
2.69
Price support as a % of total support (rough indicator of MA)
Australia
New Zea
0%
74%
US
Mexico
Canada
20%
43%
45%
EU
Turkey
44%
77%
Japan
Norway
Switzer
Korea
Iceland
91%
43%
52%
92%
50%
3.6 Measures of protection/support
Nominal protection rates and price supports
Source: OECD estimates
22
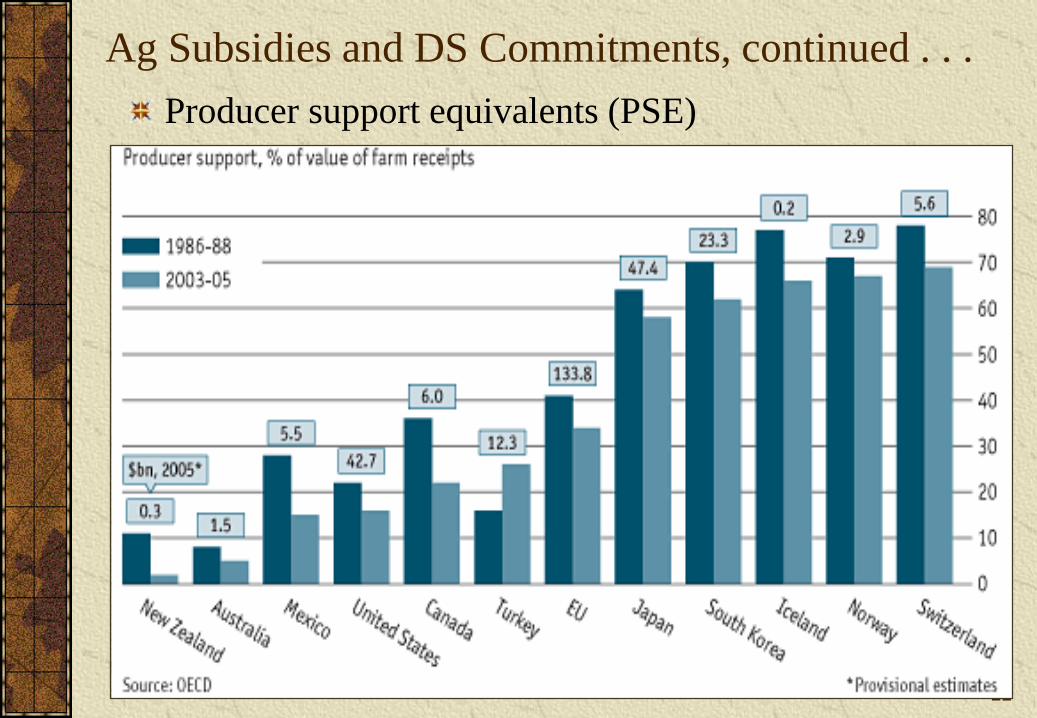
Ag Subsidies and DS Commitments, continued . . .
Producer support equivalents (PSE)
23
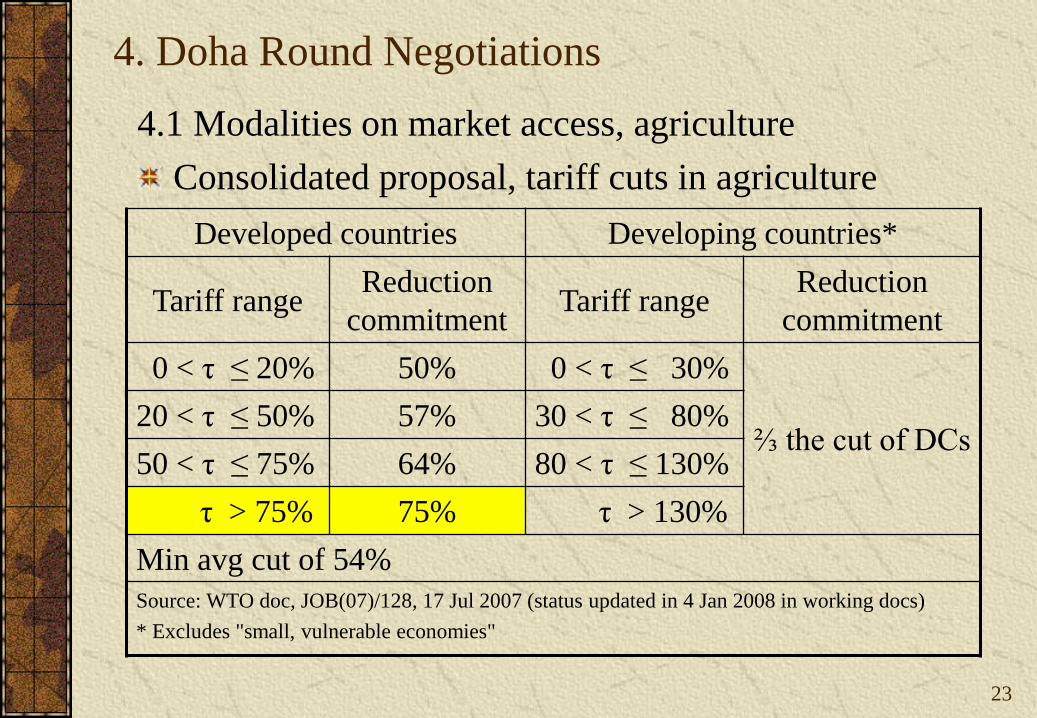
4. Doha Round Negotiations
Developed countries Developing countries*
Tariff rangeReduction
commitmentTariff range
Reduction
commitment
0 < τ ≤ 20% 50% 0 < τ ≤ 30%
⅔ the cut of DCs20 < τ ≤ 50% 57% 30 < τ ≤ 80%
50 < τ ≤ 75% 64% 80 < τ ≤ 130%
τ > 75% 75% τ > 130%
Min avg cut of 54%
Source: WTO doc, JOB(07)/128, 17 Jul 2007 (status updated in 4 Jan 2008 in working docs)
* Excludes "small, vulnerable economies"
4.1 Modalities on market access, agriculture
Consolidated proposal, tariff cuts in agriculture
24
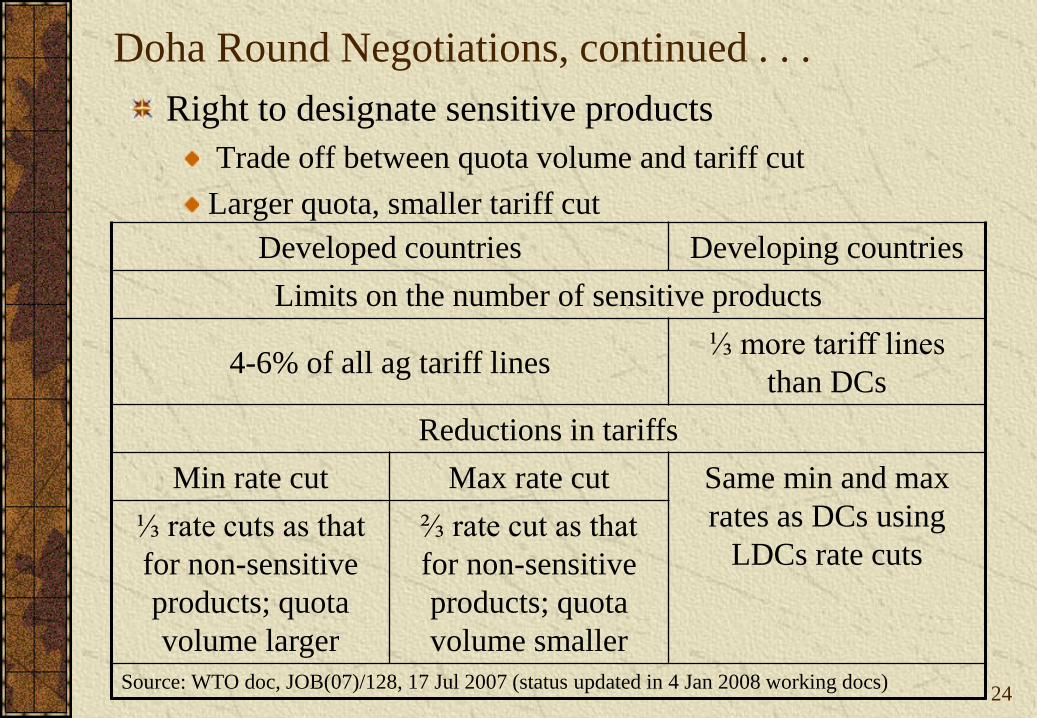
Doha Round Negotiations, continued . . .
Developed countries Developing countries
Limits on the number of sensitive products
4-6% of all ag tariff lines⅓ more tariff lines
than DCs
Reductions in tariffs
Min rate cut Max rate cut Same min and max
rates as DCs using
LDCs rate cuts⅓ rate cuts as that
for non-sensitive
products; quota
volume larger
⅔ rate cut as that
for non-sensitive
products; quota
volume smaller
Source: WTO doc, JOB(07)/128, 17 Jul 2007 (status updated in 4 Jan 2008 working docs)
Right to designate sensitive products
Trade off between quota volume and tariff cut
Larger quota, smaller tariff cut
25
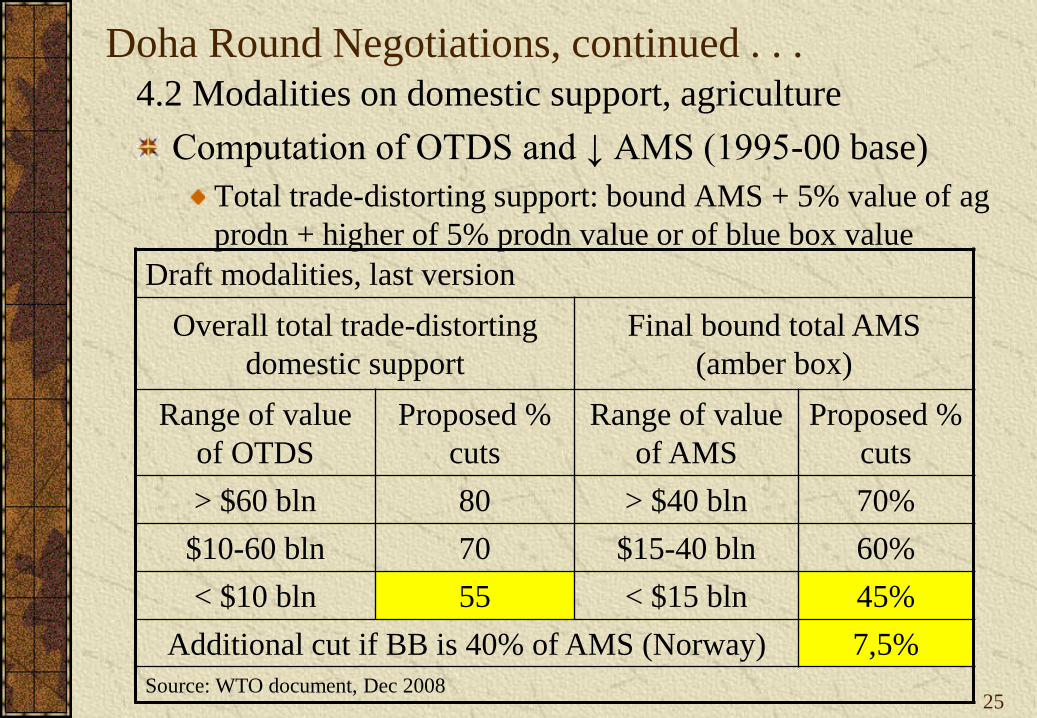
Doha Round Negotiations, continued . . .
4.2 Modalities on domestic support, agriculture
Computation of OTDS and ↓ AMS (1995-00 base)
Total trade-distorting support: bound AMS + 5% value of ag
prodn + higher of 5% prodn value or of blue box value
Draft modalities, last version
Overall total trade-distorting
domestic support
Final bound total AMS
(amber box)
Range of value
of OTDS
Proposed %
cuts
Range of value
of AMS
Proposed %
cuts
> $60 bln 80 > $40 bln 70%
$10-60 bln 70 $15-40 bln 60%
< $10 bln 55 < $15 bln 45%
Additional cut if BB is 40% of AMS (Norway) 7,5%
Source: WTO document, Dec 2008

Doha Round Negotiations, continued . . .
26
Current status: Blue box (BB)
Total BB shall not exceed 2,5% of avg total value of ag
prodn, 1995-2000 base year.
Where BB was 40% of total value of trade-distorting support,
1995-2000, (i.e., Norway), the limit is equal to the reduction
in AMS or 52,5%

Doha Round Negotiations, continued . . .
27
0
2
4
6
8
10
12
14
2001 02 03 04 05 06 07 08 09 10 11
NO
K b
illi
on
Blue box values CT-AMS Doha-AMS ceiling
Doha-Blue box ceiling UR-AMS ceiling
Sources: WTO modalities, 2008; WTO notification docs; Gaasland, Garcia and Vårdal, 2008
Current support relative to new BB and AMS ceilings
Box shifting programs: blue to green box

Doha Round Negotiations, continued . . .
28
Notified
market price
support
2006 2007 2008 2009 2010-11
Official notifications, mill NOK
1st
half
2nd
half
Beef 2 136.7 2 120.2 2 598.2 1 276.9 14.7 0.0
Poultry 1 023.7 0.0 0.0 2.7 0.0
Lamb/sheep 822.0 881.0 1 033.0 830.0 858.0
Pork 1 989.0 2 018.0 2 320.0 2 268.0 2 580.0
Note: 2009 values are reported as equivalent support (beef from July)
Source: WTO DS notification documents
Complying with AMS – reducing market price support (MPS)
2007: MPS on poultry cut to 0.0 NOK from 1.0 bn
2010: MPS on beef cut to 0.0 NOK from 2.6 bn NOK

Doha Round Negotiations, continued . . .
29
US AMS commitments under Doha (mill USD)
Current total AMS, UR and Doha final bound rates$ m
illi
on
0
5,000
10,000
15,000
20,000
25,000
CTAMS
UR-AMS
Doha-AMS
Source: WTO DS notification documents

Doha Round Negotiations, continued . . .
30
€m
illi
on
EU AMS commitments under under Doha (mill €)
Current total AMS, UR and Doha final bound rates
0
10,000
20,000
30,000
40,000
50,000
60,000
70,000
80,000
19
97/9
8
19
98/9
9
19
99/0
0
20
00/0
1
20
01/0
2
20
02/0
3
20
03/0
4
20
04/0
5
20
05/0
6
20
06/0
7
20
07/0
8
20
08/0
9
20
09/1
0
20
10/1
1
CTAMS
UR-AMS
Doha-AMS
Source: WTO DS notification documents

5. Concluding comments
5.1 Questioning the WTO commitments
Negotiated base rates of protection / support were high
Protection has limited market access and competition
Support has not resulted in much liberalization
UR-GATT disciplines on agriculture allowed countries
with no interest in liberalizing or reforming to avoid
doing so
Reform-avoidance strategies limited the Doha Round
Removal of reduction levels of protection
Strategies such as box shifting and reform avoidance to not
require / result in any real change
5.2 Despite avoidance strategies, the Doha Round died
31
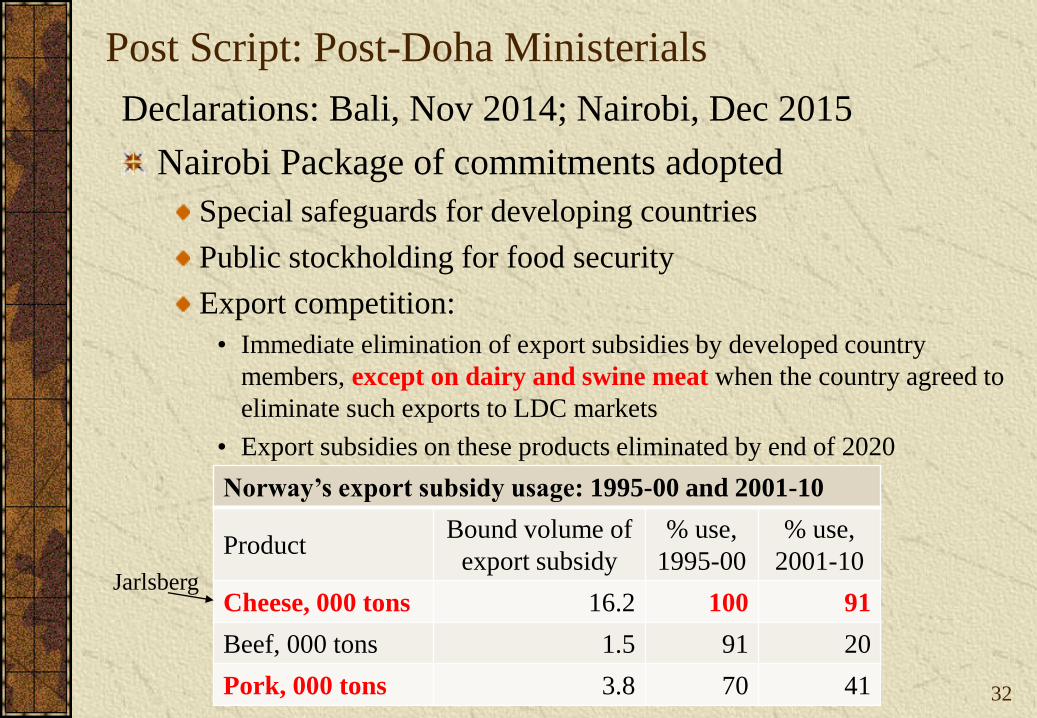
Post Script: Post-Doha Ministerials
Declarations: Bali, Nov 2014; Nairobi, Dec 2015
Nairobi Package of commitments adopted
Special safeguards for developing countries
Public stockholding for food security
Export competition:
• Immediate elimination of export subsidies by developed country
members, except on dairy and swine meat when the country agreed to
eliminate such exports to LDC markets
• Export subsidies on these products eliminated by end of 2020
32
Norway’s export subsidy usage: 1995-00 and 2001-10
ProductBound volume of
export subsidy
% use,
1995-00
% use,
2001-10
Cheese, 000 tons 16.2 100 91
Beef, 000 tons 1.5 91 20
Pork, 000 tons 3.8 70 41
Jarlsberg


![Introduction to R and LRmix [Kompatibilitetsmodus]arken.nmbu.no/~theg/Copenhagen2013/Introduction_to_R_and_LRmi… · Advanced DNA Interpretation workshop ISFG 2013, Melbourne) For](https://img.pdfslide.net/doc/110x75/5f338726c78d0a7b4367d627/introduction-to-r-and-lrmix-kompatibilitetsmodusarkennmbunothegcopenhagen2013introductiontorandlrmi.jpg)