Embed Size (px)
Citation preview
BOSTON FOUNDATION, INC.
Consolidated Financial Statements
June 30, 2017 and 2016
(With Independent Auditors’ Report Thereon)

Independent Auditors’ Report
The Board of Directors
Boston Foundation, Inc.:
We have audited the accompanying consolidated financial statements of Boston Foundation, Inc. and its
affiliates, which comprise the consolidated statements of financial position as of June 30, 2017 and 2016, the
related consolidated statements of activities and cash flows for the years then ended, and the related notes to
the consolidated financial statements.
Management’s Responsibility for the Consolidated Financial Statements
Management is responsible for the preparation and fair presentation of these consolidated financial statements
in accordance with U.S. generally accepted accounting principles; this includes the design, implementation, and
maintenance of internal control relevant to the preparation and fair presentation of consolidated financial
statements that are free from material misstatement, whether due to fraud or error.
Auditors’ Responsibility
Our responsibility is to express an opinion on these consolidated financial statements based on our audit. We
conducted our audit in accordance with auditing standards generally accepted in the United States of America.
Those standards require that we plan and perform the audit to obtain reasonable assurance about whether the
consolidated financial statements are free from material misstatement.
An audit involves performing procedures to obtain audit evidence about the amounts and disclosures in the
consolidated financial statements. The procedures selected depend on the auditors’ judgment, including the
assessment of the risks of material misstatement of the consolidated financial statements, whether due to fraud
or error. In making those risk assessments, the auditor considers internal control relevant to the entity’s
preparation and fair presentation of the consolidated financial statements in order to design audit procedures
that are appropriate in the circumstances, but not for the purpose of expressing an opinion on the effectiveness
of the entity’s internal control. Accordingly, we express no such opinion. An audit also includes evaluating the
appropriateness of accounting policies used and the reasonableness of significant accounting estimates made
by management, as well as evaluating the overall presentation of the consolidated financial statements.
We believe that the audit evidence we have obtained is sufficient and appropriate to provide a basis for our
audit opinion.
Opinion
In our opinion, the consolidated financial statements referred to above present fairly, in all material respects,
the financial position of Boston Foundation, Inc. and its affiliates as of June 30, 2017 and 2016, and the
changes in their net assets and their cash flows for the years then ended in accordance with U.S. generally
accepted accounting principles.
December 14, 2017
KPMG LLP is a Delaware limited liability partnership and the U.S. member firm of the KPMG network of independent member firms affiliated with KPMG International Cooperative (“KPMG International”), a Swiss entity.
KPMG LLPTwo Financial Center60 South StreetBoston, MA 02111
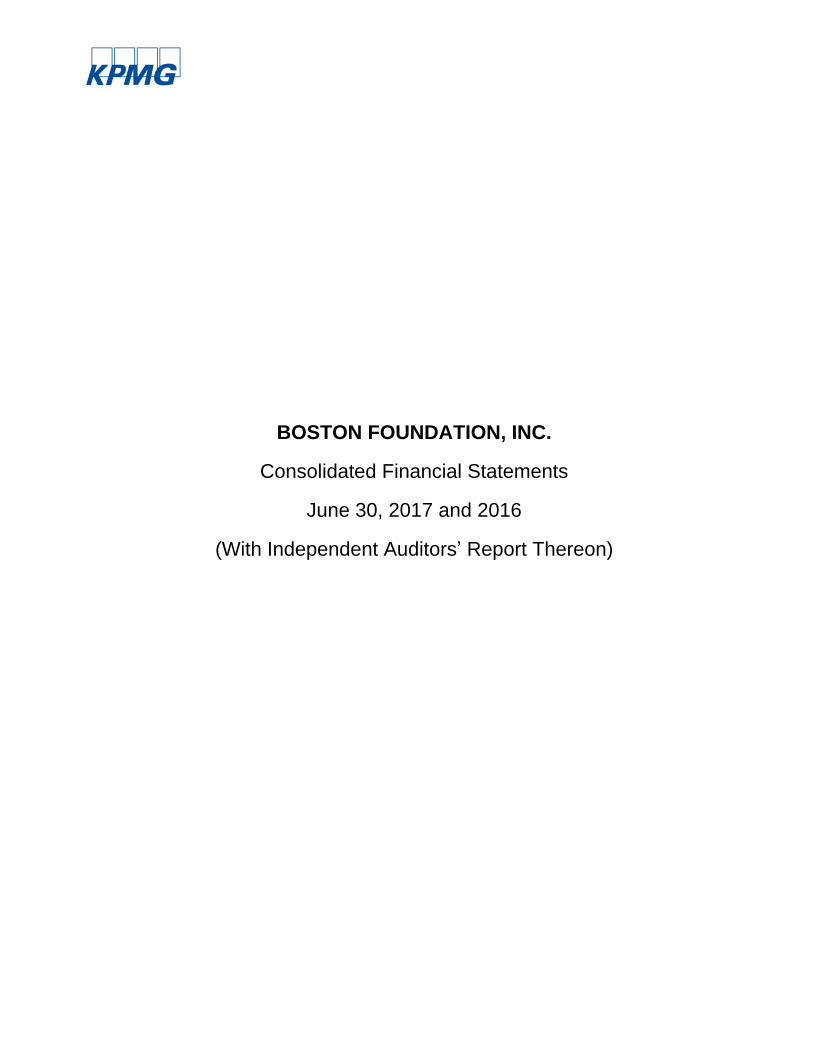
BOSTON FOUNDATION, INC.
Consolidated Statements of Financial Position
June 30, 2017 and 2016
(Dollars in thousands)
Assets 2017 2016
Cash and cash equivalents $ 5,499 5,500 U.S. Treasuries 20,891 23,132 Program-related receivables and other assets 10,374 8,823 Contributions receivable, net 1,546 2,136 Investments, at fair value 1,072,981 927,453 Noncash donations held for sale 314 397 Fixed assets, net 3,681 297
Total assets $ 1,115,286 967,738
Liabilities and Net Assets
Liabilities:Accounts payable and accrued liabilities $ 7,210 5,876 Grants payable 2,167 1,220
Total liabilities 9,377 7,096
Net assets:Unrestricted 649,338 530,956 Temporarily restricted 219,531 196,418 Permanently restricted 237,040 233,268
Total net assets 1,105,909 960,642
Total liabilities and net assets $ 1,115,286 967,738
See accompanying notes to consolidated financial statements.
2

BOSTON FOUNDATION, INC.
Consolidated Statement of Activities
Year ended June 30, 2017
(Dollars in thousands)
Temporarily PermanentlyUnrestricted restricted restricted Total
Revenues and investment activity:Contributions $ 189,985 8 3,772 193,765 Service fees 2,043 — — 2,043 Interest and dividends, net of fees 4,949 3,236 — 8,185 Unrealized and realized net gains
on investments and trusts 52,942 47,419 — 100,361 Net assets released from restrictions 27,550 (27,550) — —
Total revenues andinvestment activity 277,469 23,113 3,772 304,354
Expenses:Grants 137,247 — — 137,247 Change in split-interest trusts (134) — — (134) Program support 5,461 — — 5,461
Operating expenses:Grantmaking and civic leadership 3,005 — — 3,005 Development and donor services 4,181 — — 4,181 Finance and administration 9,327 — — 9,327
Total operating expenses 16,513 — — 16,513
Total expenses 159,087 — — 159,087
Change in net assets 118,382 23,113 3,772 145,267
Net assets, beginning of year 530,956 196,418 233,268 960,642
Net assets, end of year $ 649,338 219,531 237,040 1,105,909
See accompanying notes to consolidated financial statements.
3
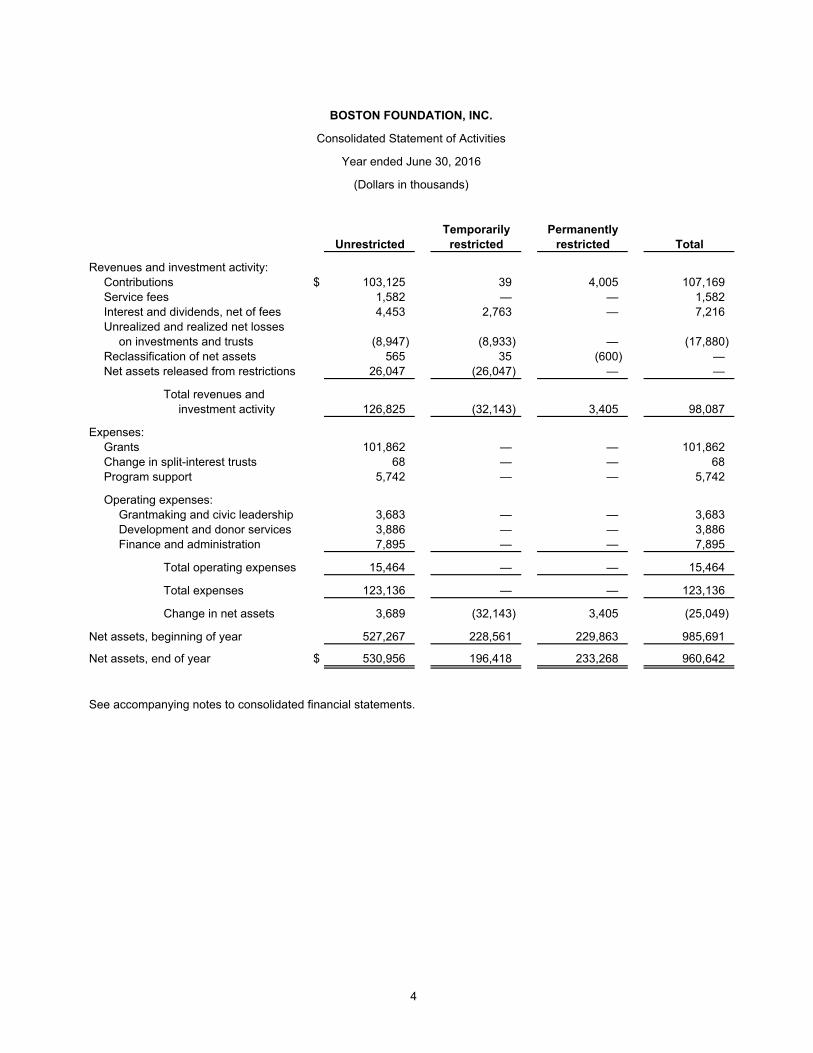
BOSTON FOUNDATION, INC.
Consolidated Statement of Activities
Year ended June 30, 2016
(Dollars in thousands)
Temporarily PermanentlyUnrestricted restricted restricted Total
Revenues and investment activity:Contributions $ 103,125 39 4,005 107,169 Service fees 1,582 — — 1,582 Interest and dividends, net of fees 4,453 2,763 — 7,216 Unrealized and realized net losses
on investments and trusts (8,947) (8,933) — (17,880) Reclassification of net assets 565 35 (600) — Net assets released from restrictions 26,047 (26,047) — —
Total revenues andinvestment activity 126,825 (32,143) 3,405 98,087
Expenses:Grants 101,862 — — 101,862 Change in split-interest trusts 68 — — 68 Program support 5,742 — — 5,742
Operating expenses:Grantmaking and civic leadership 3,683 — — 3,683 Development and donor services 3,886 — — 3,886 Finance and administration 7,895 — — 7,895
Total operating expenses 15,464 — — 15,464
Total expenses 123,136 — — 123,136
Change in net assets 3,689 (32,143) 3,405 (25,049)
Net assets, beginning of year 527,267 228,561 229,863 985,691
Net assets, end of year $ 530,956 196,418 233,268 960,642
See accompanying notes to consolidated financial statements.
4

BOSTON FOUNDATION, INC.
Consolidated Statements of Cash Flows
Years ended June 30, 2017 and 2016
(Dollars in thousands)
2017 2016
Cash flows from operating activities:Cash received from contributions and service fees $ 179,597 104,217 Interest and dividends received, net of fees 7,894 6,763 Annuity and beneficiary payments (246) (244) Grants paid (136,038) (101,004) Cash paid:
For program expenses (5,461) (5,742) To employees and suppliers (15,884) (15,046)
Net cash provided by (used in) operating activities 29,862 (11,056)
Cash flows from investing activities:Proceeds from sales of investments 256,666 271,600 Purchases of investments (287,834) (283,726) Purchases of fixed assets (2,467) (88)
Net cash used in investing activities (33,635) (12,214)
Cash flows from financing activities:Contributions to permanently restricted funds 3,772 4,005
Net cash provided by financing activities 3,772 4,005
Net change in cash and cash equivalents (1) (19,265)
Cash and cash equivalents, beginning of year 5,500 24,765
Cash and cash equivalents, end of year $ 5,499 5,500
Reconciliation of change in net assets to net cash used in operatingactivities:
Change in net assets $ 145,267 (25,049) Adjustments to reconcile change in net assets to net cash
used in operating activities:Depreciation 269 225 Change in annuity and beneficiary payables (298) (323) Change in grants payable 947 552 Change in contributions receivable, net 590 (528) Contributions of investments (13,110) — Changes in other assets and liabilities, net 330 192 Contributions restricted for long-term investment (3,772) (4,005) Unrealized and realized net (gain) loss on investments
and trusts (100,361) 17,880
Net cash provided by (used in) operating activities $ 29,862 (11,056)
Supplemental disclosure of noncash investing activity:Change in accounts payable from fixed asset additions $ 1,186 —
See accompanying notes to consolidated financial statements.
5
BOSTON FOUNDATION, INC.
Notes to Consolidated Financial Statements
June 30, 2017 and 2016
(Dollars in thousands)
6 (Continued)
(1) Description of the Boston Foundation
(a) Organization
Founded in 1915, the Boston Foundation, Inc. (the Foundation) is one of the nation’s oldest and largest
community foundations – a major grantmaker, partner in philanthropy, provider of information, and civic
leader addressing Greater Boston’s most pressing challenges.
The Foundation is a tax-exempt organization as described in Section 501(c)(3) of the Internal Revenue
Code (the Code) and is generally exempt from income taxes pursuant to Section 501(a) of the Code
and qualifies as a public charity under Section 170(b)(1)(A)(vi) of the Code.
The Foundation has not taken any tax positions which would have a material effect, individually or in
the aggregate, upon the Foundation’s financial statements. The Foundation believes it has not taken
any significant uncertain tax positions or any tax positions that would jeopardize the Foundation’s
tax-exempt status.
The Philanthropic Initiative, Inc. (TPI), an internationally recognized provider of customized
philanthropic consulting, operates as a distinct unit of the Boston Foundation.
(b) Activity
As Greater Boston’s community foundation, the Foundation devotes its resources to building and
sustaining a vital and prosperous city and region, where justice and opportunity are extended to
everyone. The Foundation’s primary purposes are threefold: to make charitable grants to qualified
recipients; to assist donors with their philanthropic goals; and to be a civic leader, convener, and
information provider in the Boston community. The Foundation receives support directly from the
public. Due to the generosity of donors, the Foundation is able to serve as a major grantmaker in
Greater Boston, supporting hundreds of not-for-profit organizations that are helping to build a strong
and healthy community.
(2) Summary of Significant Accounting Policies
(a) Basis of Presentation
The accompanying consolidated financial statements, which are presented on the accrual basis of
accounting in accordance with U.S. generally accepted accounting principles (GAAP), have been
prepared to focus on the Foundation as a whole and to present balances and transactions according to
the existence or absence of donor-imposed restrictions. The consolidated financial statements include
the accounts of the Foundation and those of its affiliated supporting organizations, which are also
501(c)(3) exempt organizations. The total net assets of the supporting organizations were $22,456 and
$19,897 as of June 30, 2017 and 2016, respectively. Inter-organizational transactions and balances
have been eliminated in consolidation.
BOSTON FOUNDATION, INC.
Notes to Consolidated Financial Statements
June 30, 2017 and 2016
(Dollars in thousands)
7 (Continued)
(b) Use of Estimates
The preparation of consolidated financial statements in conformity with GAAP requires management to
make estimates and assumptions that affect the reported amounts of assets and liabilities, and
disclosure of contingent assets and liabilities, as of the dates of the consolidated financial statements
and the reported amounts of revenue and expenses during the reporting periods. Actual results could
differ from those estimates.
(c) Classification of Net Assets
The Foundation reports information regarding its financial position and activities in three classes of net
assets based upon the existence or absence of donor-imposed restrictions, as follows:
Unrestricted net assets have no donor-imposed or legal stipulations as to their use. Unrestricted
net assets include donor-advised funds.
Temporarily restricted net assets contain donor-imposed stipulations as to the timing of their
availability or use for a particular purpose. These net assets are released from restrictions when
the specified time elapses or actions have been taken to meet the restrictions.
Permanently restricted net assets have donor-imposed stipulations that neither expire with the
passage of time nor can be removed by actions of the Foundation and consist primarily of the
historic dollar value of gifts to establish or add to the Foundation’s donor-restricted endowment
funds. Net assets of such funds in excess of their historic dollar value are classified as temporarily
restricted net assets until appropriated by the Board of Directors (the Board) and spent in
accordance with the standard of prudence imposed by state law.
The Articles of Organization of the Foundation include a variance power provision, which gives the
Board the power to modify any purpose-related restriction or condition placed on gifts, if in its sole
judgment the Board determines that the restriction becomes, in effect, incapable of fulfillment due to
the changing needs of the community. During 2017, the Board did not utilize variance power. During
2016, the Board utilized variance power to 1) grant out the $12 balance of a scholarship fund to a
not-for-profit organization’s scholarship program, 2) extend the terms of a designated fund to include
conservation of any public art, 3) to grant out a $12 fund balance to a not-for-profit, and 4) to grant out
a $3 fund balance to a not-for-profit.
BOSTON FOUNDATION, INC.
Notes to Consolidated Financial Statements
June 30, 2017 and 2016
(Dollars in thousands)
8 (Continued)
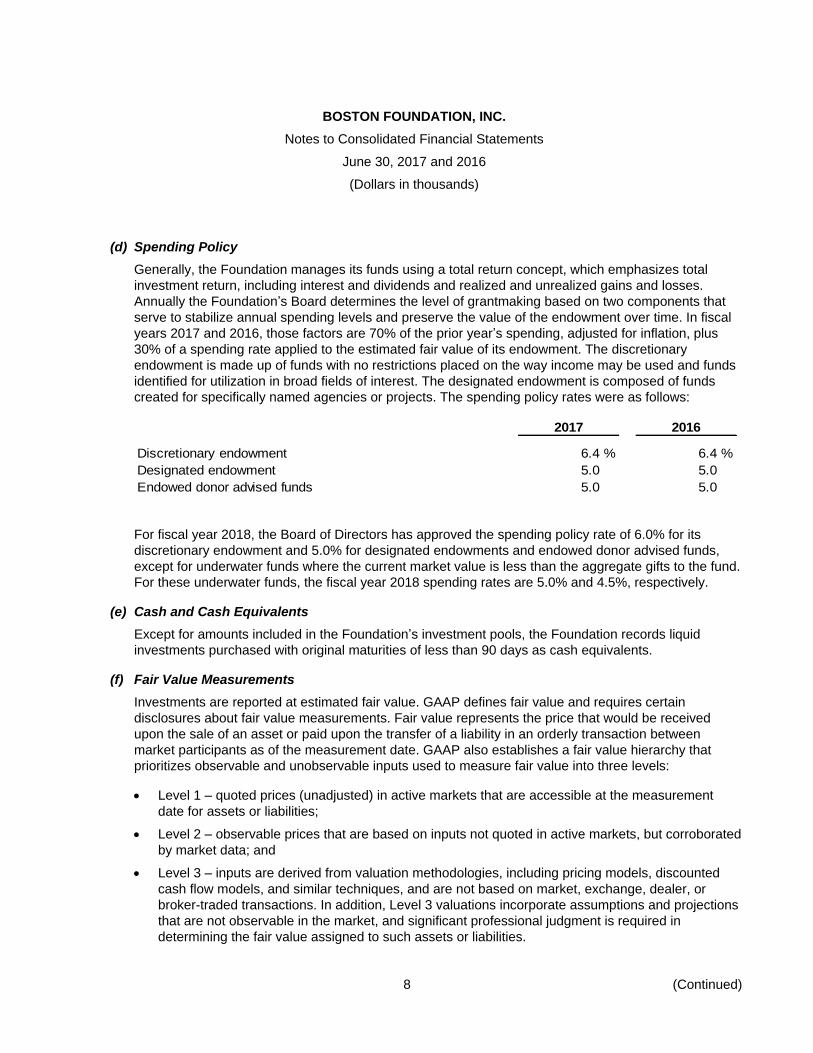
(d) Spending Policy
Generally, the Foundation manages its funds using a total return concept, which emphasizes total
investment return, including interest and dividends and realized and unrealized gains and losses.
Annually the Foundation’s Board determines the level of grantmaking based on two components that
serve to stabilize annual spending levels and preserve the value of the endowment over time. In fiscal
years 2017 and 2016, those factors are 70% of the prior year’s spending, adjusted for inflation, plus
30% of a spending rate applied to the estimated fair value of its endowment. The discretionary
endowment is made up of funds with no restrictions placed on the way income may be used and funds
identified for utilization in broad fields of interest. The designated endowment is composed of funds
created for specifically named agencies or projects. The spending policy rates were as follows:
2017 2016
Discretionary endowment 6.4 % 6.4 %
Designated endowment 5.0 5.0
Endowed donor advised funds 5.0 5.0
For fiscal year 2018, the Board of Directors has approved the spending policy rate of 6.0% for its
discretionary endowment and 5.0% for designated endowments and endowed donor advised funds,
except for underwater funds where the current market value is less than the aggregate gifts to the fund.
For these underwater funds, the fiscal year 2018 spending rates are 5.0% and 4.5%, respectively.
(e) Cash and Cash Equivalents
Except for amounts included in the Foundation’s investment pools, the Foundation records liquid
investments purchased with original maturities of less than 90 days as cash equivalents.
(f) Fair Value Measurements
Investments are reported at estimated fair value. GAAP defines fair value and requires certain
disclosures about fair value measurements. Fair value represents the price that would be received
upon the sale of an asset or paid upon the transfer of a liability in an orderly transaction between
market participants as of the measurement date. GAAP also establishes a fair value hierarchy that
prioritizes observable and unobservable inputs used to measure fair value into three levels:
Level 1 – quoted prices (unadjusted) in active markets that are accessible at the measurement
date for assets or liabilities;
Level 2 – observable prices that are based on inputs not quoted in active markets, but corroborated
by market data; and
Level 3 – inputs are derived from valuation methodologies, including pricing models, discounted
cash flow models, and similar techniques, and are not based on market, exchange, dealer, or
broker-traded transactions. In addition, Level 3 valuations incorporate assumptions and projections
that are not observable in the market, and significant professional judgment is required in
determining the fair value assigned to such assets or liabilities.
BOSTON FOUNDATION, INC.
Notes to Consolidated Financial Statements
June 30, 2017 and 2016
(Dollars in thousands)
9 (Continued)
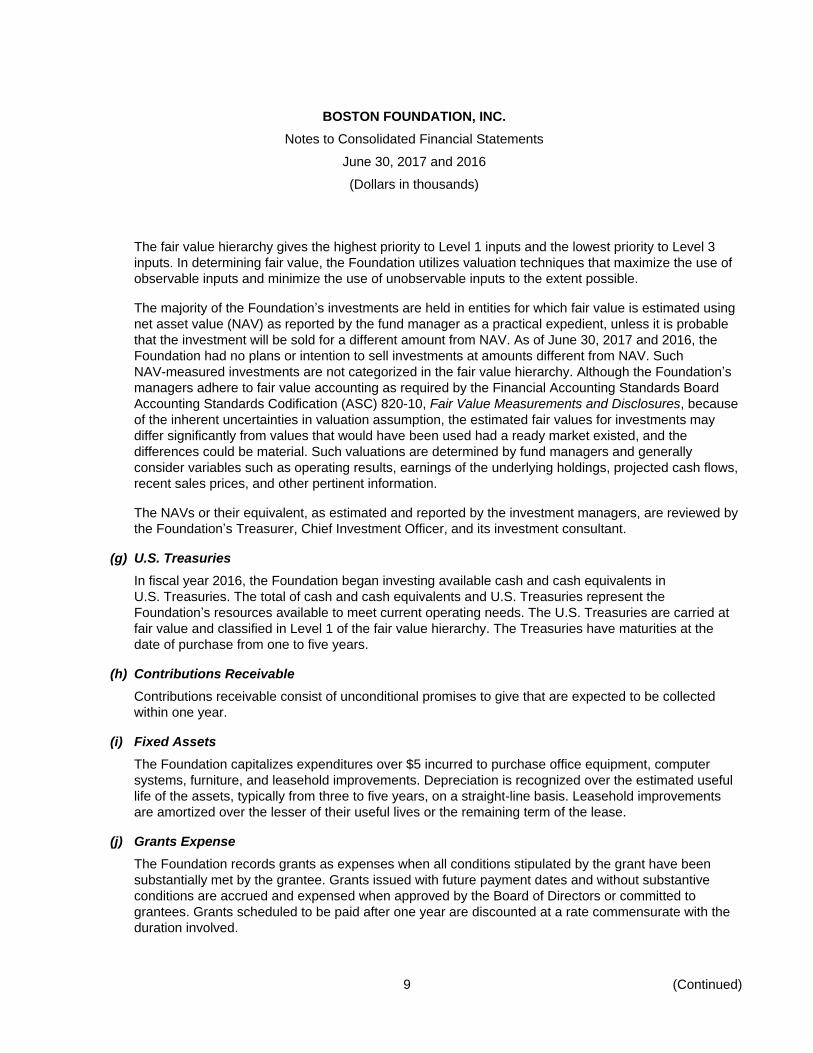
The fair value hierarchy gives the highest priority to Level 1 inputs and the lowest priority to Level 3
inputs. In determining fair value, the Foundation utilizes valuation techniques that maximize the use of
observable inputs and minimize the use of unobservable inputs to the extent possible.
The majority of the Foundation’s investments are held in entities for which fair value is estimated using
net asset value (NAV) as reported by the fund manager as a practical expedient, unless it is probable
that the investment will be sold for a different amount from NAV. As of June 30, 2017 and 2016, the
Foundation had no plans or intention to sell investments at amounts different from NAV. Such
NAV-measured investments are not categorized in the fair value hierarchy. Although the Foundation’s
managers adhere to fair value accounting as required by the Financial Accounting Standards Board
Accounting Standards Codification (ASC) 820-10, Fair Value Measurements and Disclosures, because
of the inherent uncertainties in valuation assumption, the estimated fair values for investments may
differ significantly from values that would have been used had a ready market existed, and the
differences could be material. Such valuations are determined by fund managers and generally
consider variables such as operating results, earnings of the underlying holdings, projected cash flows,
recent sales prices, and other pertinent information.
The NAVs or their equivalent, as estimated and reported by the investment managers, are reviewed by
the Foundation’s Treasurer, Chief Investment Officer, and its investment consultant.
(g) U.S. Treasuries
In fiscal year 2016, the Foundation began investing available cash and cash equivalents in
U.S. Treasuries. The total of cash and cash equivalents and U.S. Treasuries represent the
Foundation’s resources available to meet current operating needs. The U.S. Treasuries are carried at
fair value and classified in Level 1 of the fair value hierarchy. The Treasuries have maturities at the
date of purchase from one to five years.
(h) Contributions Receivable
Contributions receivable consist of unconditional promises to give that are expected to be collected
within one year.
(i) Fixed Assets
The Foundation capitalizes expenditures over $5 incurred to purchase office equipment, computer
systems, furniture, and leasehold improvements. Depreciation is recognized over the estimated useful
life of the assets, typically from three to five years, on a straight-line basis. Leasehold improvements
are amortized over the lesser of their useful lives or the remaining term of the lease.
(j) Grants Expense
The Foundation records grants as expenses when all conditions stipulated by the grant have been
substantially met by the grantee. Grants issued with future payment dates and without substantive
conditions are accrued and expensed when approved by the Board of Directors or committed to
grantees. Grants scheduled to be paid after one year are discounted at a rate commensurate with the
duration involved.
BOSTON FOUNDATION, INC.
Notes to Consolidated Financial Statements
June 30, 2017 and 2016
(Dollars in thousands)
10 (Continued)
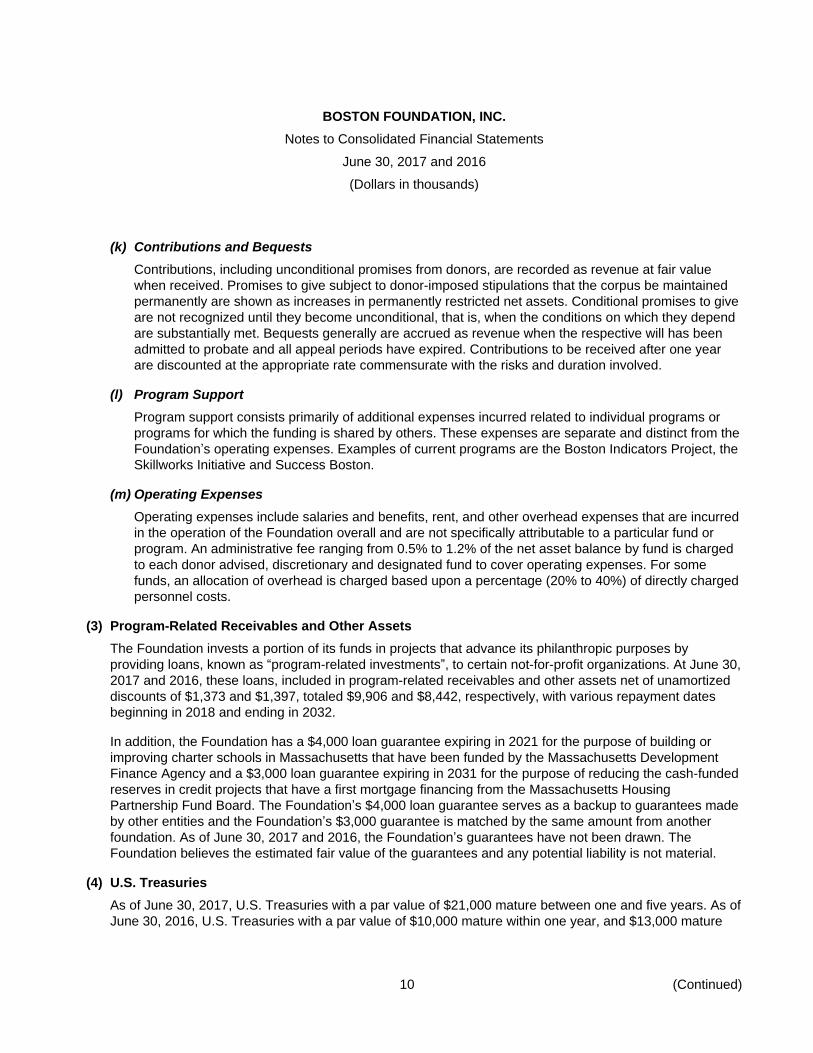
(k) Contributions and Bequests
Contributions, including unconditional promises from donors, are recorded as revenue at fair value
when received. Promises to give subject to donor-imposed stipulations that the corpus be maintained
permanently are shown as increases in permanently restricted net assets. Conditional promises to give
are not recognized until they become unconditional, that is, when the conditions on which they depend
are substantially met. Bequests generally are accrued as revenue when the respective will has been
admitted to probate and all appeal periods have expired. Contributions to be received after one year
are discounted at the appropriate rate commensurate with the risks and duration involved.
(l) Program Support
Program support consists primarily of additional expenses incurred related to individual programs or
programs for which the funding is shared by others. These expenses are separate and distinct from the
Foundation’s operating expenses. Examples of current programs are the Boston Indicators Project, the
Skillworks Initiative and Success Boston.
(m) Operating Expenses
Operating expenses include salaries and benefits, rent, and other overhead expenses that are incurred
in the operation of the Foundation overall and are not specifically attributable to a particular fund or
program. An administrative fee ranging from 0.5% to 1.2% of the net asset balance by fund is charged
to each donor advised, discretionary and designated fund to cover operating expenses. For some
funds, an allocation of overhead is charged based upon a percentage (20% to 40%) of directly charged
personnel costs.
(3) Program-Related Receivables and Other Assets
The Foundation invests a portion of its funds in projects that advance its philanthropic purposes by
providing loans, known as “program-related investments”, to certain not-for-profit organizations. At June 30,
2017 and 2016, these loans, included in program-related receivables and other assets net of unamortized
discounts of $1,373 and $1,397, totaled $9,906 and $8,442, respectively, with various repayment dates
beginning in 2018 and ending in 2032.
In addition, the Foundation has a $4,000 loan guarantee expiring in 2021 for the purpose of building or
improving charter schools in Massachusetts that have been funded by the Massachusetts Development
Finance Agency and a $3,000 loan guarantee expiring in 2031 for the purpose of reducing the cash-funded
reserves in credit projects that have a first mortgage financing from the Massachusetts Housing
Partnership Fund Board. The Foundation’s $4,000 loan guarantee serves as a backup to guarantees made
by other entities and the Foundation’s $3,000 guarantee is matched by the same amount from another
foundation. As of June 30, 2017 and 2016, the Foundation’s guarantees have not been drawn. The
Foundation believes the estimated fair value of the guarantees and any potential liability is not material.
(4) U.S. Treasuries
As of June 30, 2017, U.S. Treasuries with a par value of $21,000 mature between one and five years. As of
June 30, 2016, U.S. Treasuries with a par value of $10,000 mature within one year, and $13,000 mature
BOSTON FOUNDATION, INC.
Notes to Consolidated Financial Statements
June 30, 2017 and 2016
(Dollars in thousands)
11 (Continued)
between one and five years. The net premium and unrealized gain on the notes was $120 as of June 30,
2017 and $165 as of June 30, 2016.
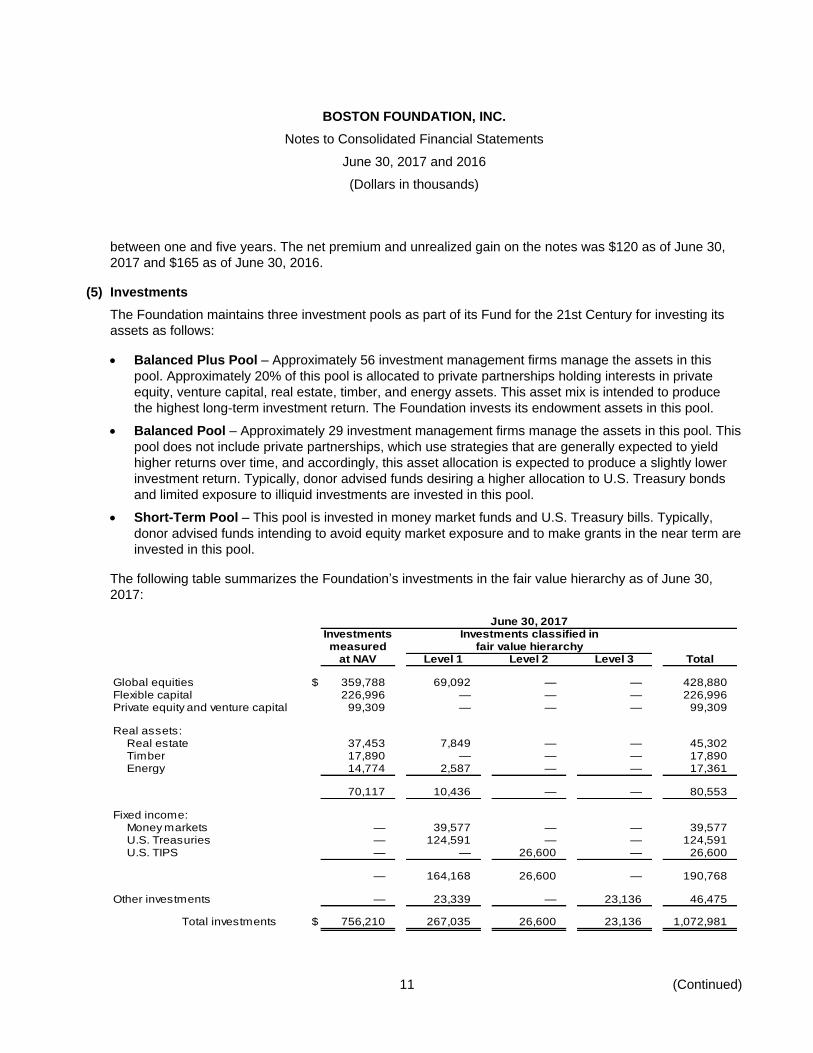
(5) Investments
The Foundation maintains three investment pools as part of its Fund for the 21st Century for investing its
assets as follows:
Balanced Plus Pool – Approximately 56 investment management firms manage the assets in this
pool. Approximately 20% of this pool is allocated to private partnerships holding interests in private
equity, venture capital, real estate, timber, and energy assets. This asset mix is intended to produce
the highest long-term investment return. The Foundation invests its endowment assets in this pool.
Balanced Pool – Approximately 29 investment management firms manage the assets in this pool. This
pool does not include private partnerships, which use strategies that are generally expected to yield
higher returns over time, and accordingly, this asset allocation is expected to produce a slightly lower
investment return. Typically, donor advised funds desiring a higher allocation to U.S. Treasury bonds
and limited exposure to illiquid investments are invested in this pool.
Short-Term Pool – This pool is invested in money market funds and U.S. Treasury bills. Typically,
donor advised funds intending to avoid equity market exposure and to make grants in the near term are
invested in this pool.
The following table summarizes the Foundation’s investments in the fair value hierarchy as of June 30,
2017:
June 30, 2017Investments Investments classified inmeasured fair value hierarchy
at NAV Level 1 Level 2 Level 3 Total
Global equities $ 359,788 69,092 — — 428,880 Flexible capital 226,996 — — — 226,996 Private equity and venture capital 99,309 — — — 99,309
Real assets:Real estate 37,453 7,849 — — 45,302 Timber 17,890 — — — 17,890 Energy 14,774 2,587 — — 17,361
70,117 10,436 — — 80,553
Fixed income:Money markets — 39,577 — — 39,577 U.S. Treasuries — 124,591 — — 124,591 U.S. TIPS — — 26,600 — 26,600
— 164,168 26,600 — 190,768
Other investments — 23,339 — 23,136 46,475
Total investments $ 756,210 267,035 26,600 23,136 1,072,981
BOSTON FOUNDATION, INC.
Notes to Consolidated Financial Statements
June 30, 2017 and 2016
(Dollars in thousands)
12 (Continued)
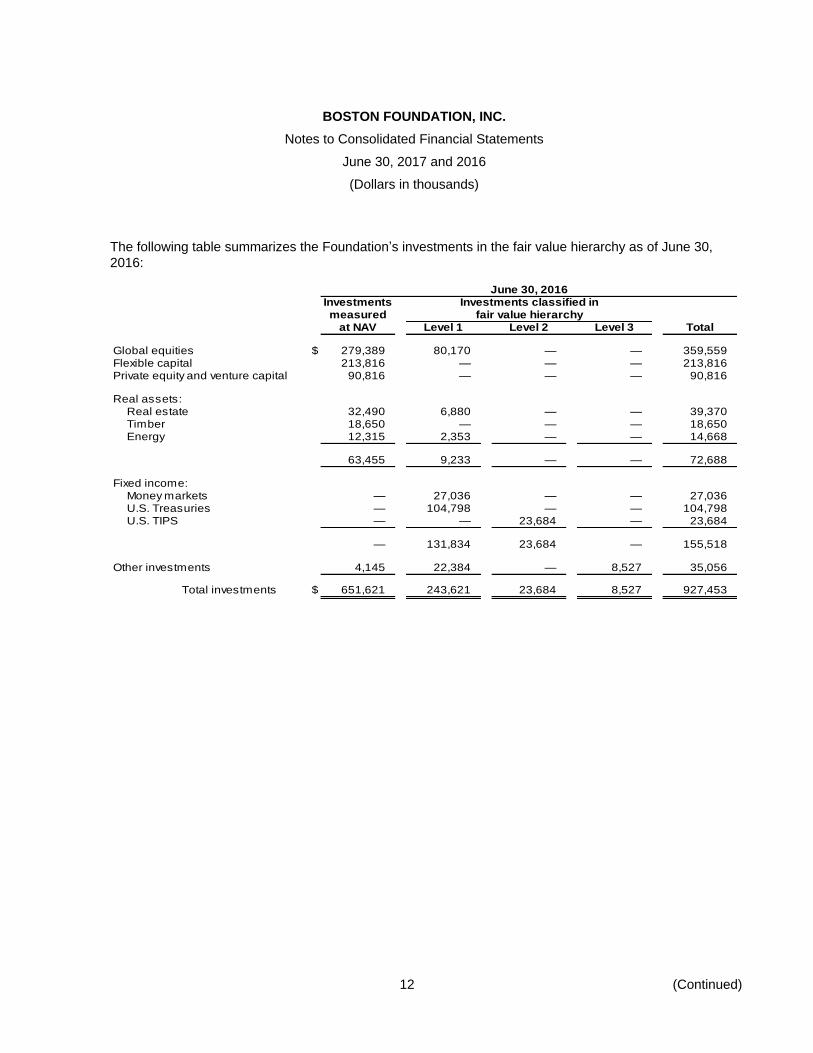
The following table summarizes the Foundation’s investments in the fair value hierarchy as of June 30,
2016:
June 30, 2016Investments Investments classified inmeasured fair value hierarchy
at NAV Level 1 Level 2 Level 3 Total
Global equities $ 279,389 80,170 — — 359,559 Flexible capital 213,816 — — — 213,816 Private equity and venture capital 90,816 — — — 90,816
Real assets:Real estate 32,490 6,880 — — 39,370 Timber 18,650 — — — 18,650 Energy 12,315 2,353 — — 14,668
63,455 9,233 — — 72,688
Fixed income:Money markets — 27,036 — — 27,036 U.S. Treasuries — 104,798 — — 104,798 U.S. TIPS — — 23,684 — 23,684
— 131,834 23,684 — 155,518
Other investments 4,145 22,384 — 8,527 35,056
Total investments $ 651,621 243,621 23,684 8,527 927,453

BOSTON FOUNDATION, INC.
Notes to Consolidated Financial Statements
June 30, 2017 and 2016
(Dollars in thousands)
13 (Continued)
(a) Level 3 Investment Activity
The following table presents the Foundation’s activity for the fiscal years ended June 30, 2017 and
2016 for investments classified in Level 3:
Other
investments
Fair value as of July 1, 2015 $ 8,307
Purchases 510
Sales and distributions (747)
Net realized and unrealized gains 457
Fair value as of June 30, 2016 $ 8,527
Fair value as of July 1, 2016 $ 8,527
Purchases 250
Sales and distributions (4,033)
Transfer from NAV of contributed
investments 4,145
New contributed investments 13,110
Net realized and unrealized gains 1,137
Fair value as of June 30, 2017 $ 23,136
There were no transfers between levels in 2016.
BOSTON FOUNDATION, INC.
Notes to Consolidated Financial Statements
June 30, 2017 and 2016
(Dollars in thousands)
14 (Continued)
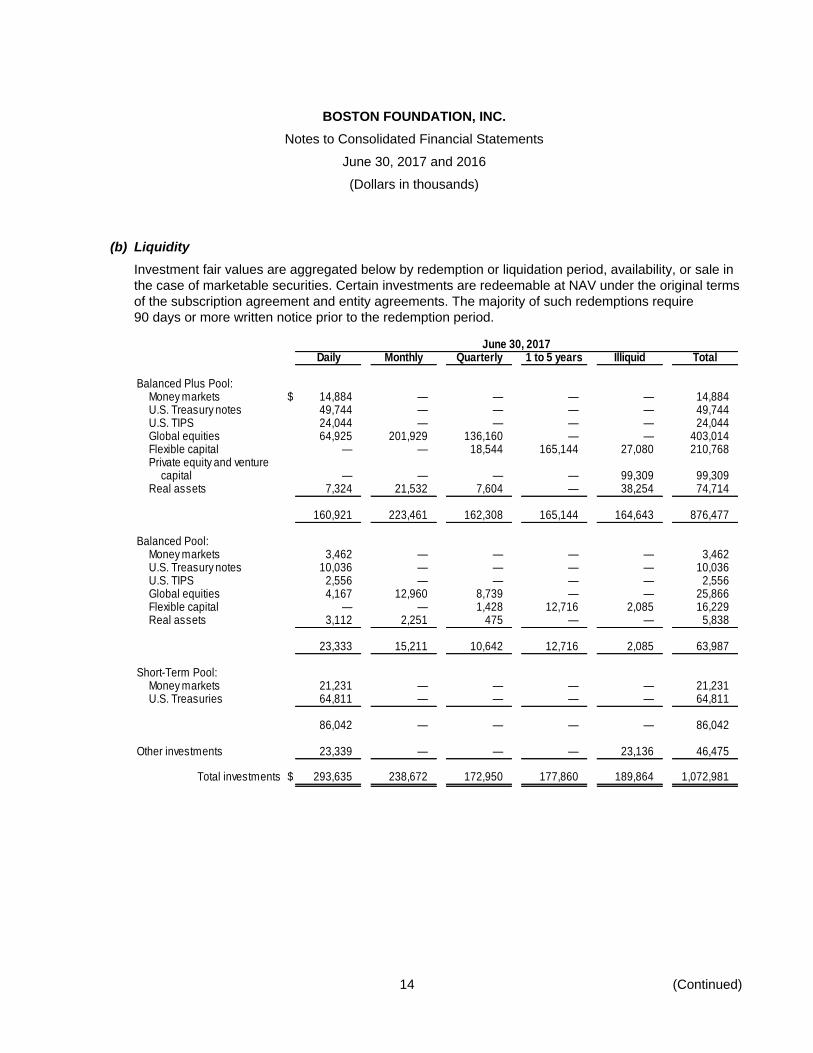
(b) Liquidity
Investment fair values are aggregated below by redemption or liquidation period, availability, or sale in
the case of marketable securities. Certain investments are redeemable at NAV under the original terms
of the subscription agreement and entity agreements. The majority of such redemptions require
90 days or more written notice prior to the redemption period.
June 30, 2017Daily Monthly Quarterly 1 to 5 years Illiquid Total
Balanced Plus Pool:Money markets $ 14,884 — — — — 14,884 U.S. Treasury notes 49,744 — — — — 49,744 U.S. TIPS 24,044 — — — — 24,044 Global equities 64,925 201,929 136,160 — — 403,014 Flexible capital — — 18,544 165,144 27,080 210,768 Private equity and venture
capital — — — — 99,309 99,309 Real assets 7,324 21,532 7,604 — 38,254 74,714
160,921 223,461 162,308 165,144 164,643 876,477
Balanced Pool:Money markets 3,462 — — — — 3,462 U.S. Treasury notes 10,036 — — — — 10,036 U.S. TIPS 2,556 — — — — 2,556 Global equities 4,167 12,960 8,739 — — 25,866 Flexible capital — — 1,428 12,716 2,085 16,229 Real assets 3,112 2,251 475 — — 5,838
23,333 15,211 10,642 12,716 2,085 63,987
Short-Term Pool:Money markets 21,231 — — — — 21,231 U.S. Treasuries 64,811 — — — — 64,811
86,042 — — — — 86,042
Other investments 23,339 — — — 23,136 46,475
Total investments $ 293,635 238,672 172,950 177,860 189,864 1,072,981

BOSTON FOUNDATION, INC.
Notes to Consolidated Financial Statements
June 30, 2017 and 2016
(Dollars in thousands)
15 (Continued)
(c) Investment Returns
Investment returns for the years ended June 30 were as follows:
2017 2016
Interest and dividends, net of fees $ 8,185 7,216
Unrealized and realized net gains (losses) on investments
and trusts 100,361 (17,880)
Total return $ 108,546 (10,664)
Interest and dividends are shown net of third-party investment management and custody fees.
Investment management and custody fees paid directly to the managers for the years ended June 30,
2017 and 2016 were $4,627 and $4,354, respectively. Additional investment fees that were not paid
directly to the managers have been netted against the return on certain investments. It is not practical
to determine the amounts of such fees.
Investment returns for the years ended June 30 were as follows:
2017 2016
Balanced Plus Pool $ 98,213 (11,592)
Balanced Pool 5,529 (558)
Short-Term Pool 389 162
Other investments 4,064 1,148
U.S. Treasuries 351 176
Total return $ 108,546 (10,664)
(d) Commitments
Private equity, venture capital, and real asset investments are generally made through limited
partnerships. Under the terms of these agreements, the Foundation is obligated to remit additional
funding periodically as capital calls are exercised by the manager. These partnerships have a limited
existence, generally around 10 years, and such agreements may provide for annual extensions for the
purpose of disposing of portfolio positions and returning capital to investors. However, depending on
market conditions, the inability to execute the fund’s strategy, and other factors, a manager may extend
the term of a fund beyond its originally anticipated existence or may wind down the fund prematurely.
The Foundation cannot anticipate such changes because they are based on unforeseen events, but
should they occur they may result in less liquidity or return from the investment than originally
anticipated. As a result, the timing and amount of future capital calls expected to be exercised in any
particular year is uncertain.
BOSTON FOUNDATION, INC.
Notes to Consolidated Financial Statements
June 30, 2017 and 2016
(Dollars in thousands)
16 (Continued)
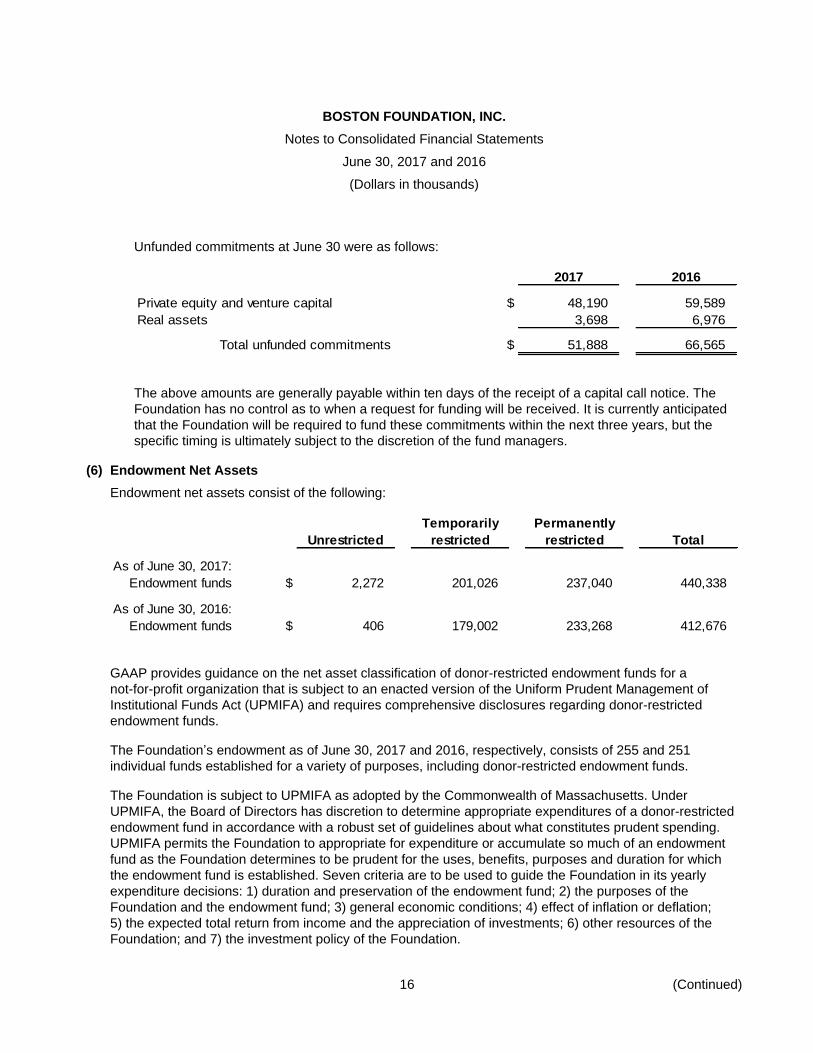
Unfunded commitments at June 30 were as follows:
2017 2016
Private equity and venture capital $ 48,190 59,589
Real assets 3,698 6,976
Total unfunded commitments $ 51,888 66,565
The above amounts are generally payable within ten days of the receipt of a capital call notice. The
Foundation has no control as to when a request for funding will be received. It is currently anticipated
that the Foundation will be required to fund these commitments within the next three years, but the
specific timing is ultimately subject to the discretion of the fund managers.
(6) Endowment Net Assets
Endowment net assets consist of the following:
Temporarily Permanently
Unrestricted restricted restricted Total
As of June 30, 2017:
Endowment funds $ 2,272 201,026 237,040 440,338
As of June 30, 2016:
Endowment funds $ 406 179,002 233,268 412,676
GAAP provides guidance on the net asset classification of donor-restricted endowment funds for a
not-for-profit organization that is subject to an enacted version of the Uniform Prudent Management of
Institutional Funds Act (UPMIFA) and requires comprehensive disclosures regarding donor-restricted
endowment funds.
The Foundation’s endowment as of June 30, 2017 and 2016, respectively, consists of 255 and 251
individual funds established for a variety of purposes, including donor-restricted endowment funds.
The Foundation is subject to UPMIFA as adopted by the Commonwealth of Massachusetts. Under
UPMIFA, the Board of Directors has discretion to determine appropriate expenditures of a donor-restricted
endowment fund in accordance with a robust set of guidelines about what constitutes prudent spending.
UPMIFA permits the Foundation to appropriate for expenditure or accumulate so much of an endowment
fund as the Foundation determines to be prudent for the uses, benefits, purposes and duration for which
the endowment fund is established. Seven criteria are to be used to guide the Foundation in its yearly
expenditure decisions: 1) duration and preservation of the endowment fund; 2) the purposes of the
Foundation and the endowment fund; 3) general economic conditions; 4) effect of inflation or deflation;
5) the expected total return from income and the appreciation of investments; 6) other resources of the
Foundation; and 7) the investment policy of the Foundation.
BOSTON FOUNDATION, INC.
Notes to Consolidated Financial Statements
June 30, 2017 and 2016
(Dollars in thousands)
17 (Continued)
Although UPMIFA offers short-term spending flexibility, the explicit consideration of the preservation of
funds among factors for prudent spending suggests that a donor-restricted endowment fund is still
perpetual in nature. Under UPMIFA, the Board is permitted to determine and continue a prudent payout
amount, even if the market value of the fund is below historic gift value. There is an expectation that, over
time, the permanently restricted amount will remain intact. This perspective is aligned with the accounting
standards definition that permanently restricted funds are those that must be held in perpetuity even though
the historic-gift-value may be expended on a temporary basis. At June 30, 2017 and 2016, the fair value of
certain of these individual funds was less than their historic gift value (underwater funds) by $3,687 and
$4,736, respectively, due to investment losses. Unrestricted net assets have been charged for the
deficiency caused by these losses.
The Foundation classifies as permanently restricted net assets (a) the original value of gifts donated to the
permanent endowment, (b) the original value of subsequent gifts to the permanent endowment, and
(c) accumulations to the permanent endowment made in accordance with the direction of the applicable
donor gift instrument at the time the accumulation is added to the fund. The remaining portion of the
donor-restricted endowment fund that is not classified as permanently restricted net assets is classified as
temporarily restricted net assets until appropriated for spending by the Board of Directors.
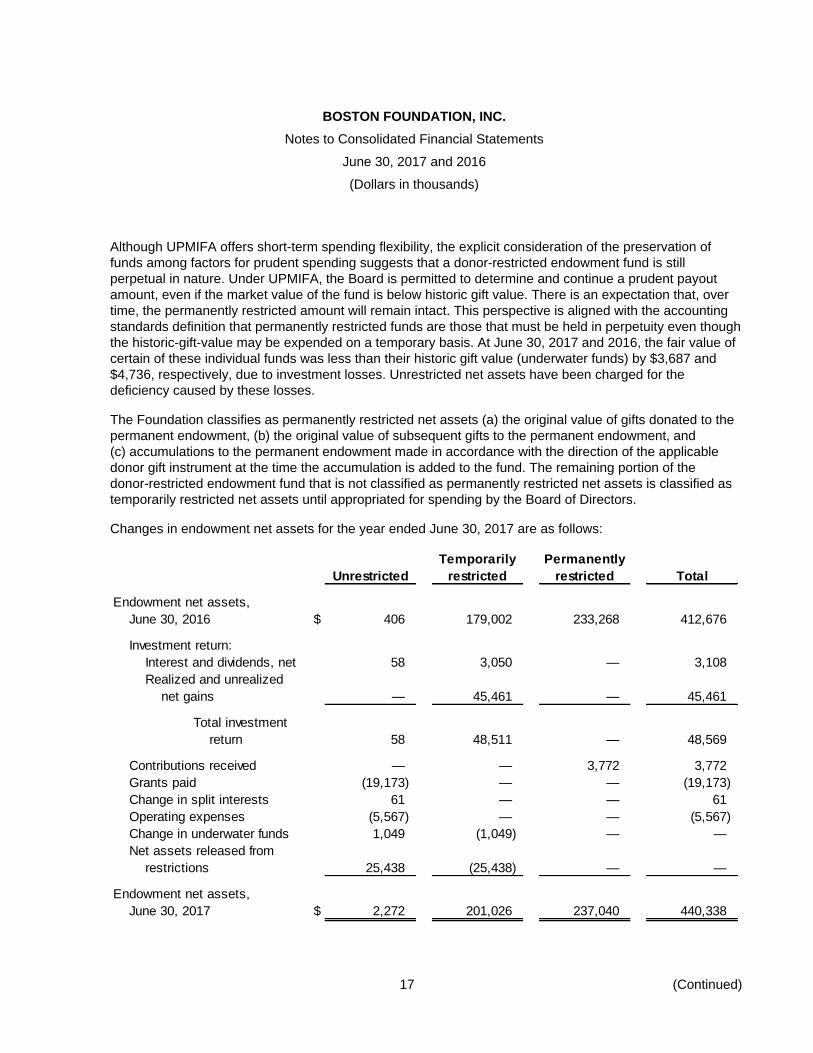
Changes in endowment net assets for the year ended June 30, 2017 are as follows:
Temporarily Permanently
Unrestricted restricted restricted Total
Endowment net assets,
June 30, 2016 $ 406 179,002 233,268 412,676
Investment return:
Interest and dividends, net 58 3,050 — 3,108
Realized and unrealized
net gains — 45,461 — 45,461
Total investment
return 58 48,511 — 48,569
Contributions received — — 3,772 3,772
Grants paid (19,173) — — (19,173)
Change in split interests 61 — — 61
Operating expenses (5,567) — — (5,567)
Change in underwater funds 1,049 (1,049) — —
Net assets released from
restrictions 25,438 (25,438) — —
Endowment net assets,
June 30, 2017 $ 2,272 201,026 237,040 440,338
BOSTON FOUNDATION, INC.
Notes to Consolidated Financial Statements
June 30, 2017 and 2016
(Dollars in thousands)
18 (Continued)
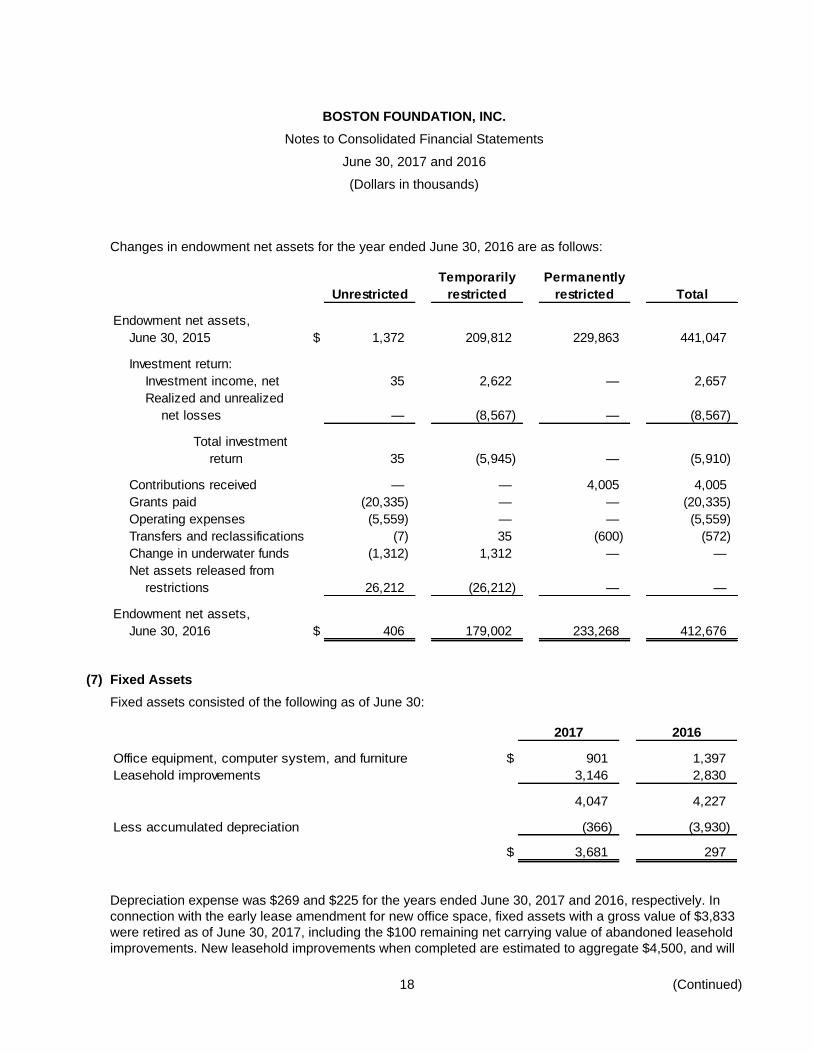
Changes in endowment net assets for the year ended June 30, 2016 are as follows:
Temporarily Permanently
Unrestricted restricted restricted Total
Endowment net assets,
June 30, 2015 $ 1,372 209,812 229,863 441,047
Investment return:
Investment income, net 35 2,622 — 2,657
Realized and unrealized
net losses — (8,567) — (8,567)
Total investment
return 35 (5,945) — (5,910)
Contributions received — — 4,005 4,005
Grants paid (20,335) — — (20,335)
Operating expenses (5,559) — — (5,559)
Transfers and reclassifications (7) 35 (600) (572)
Change in underwater funds (1,312) 1,312 — —
Net assets released from
restrictions 26,212 (26,212) — —
Endowment net assets,
June 30, 2016 $ 406 179,002 233,268 412,676
(7) Fixed Assets
Fixed assets consisted of the following as of June 30:
2017 2016
Office equipment, computer system, and furniture $ 901 1,397
Leasehold improvements 3,146 2,830
4,047 4,227
Less accumulated depreciation (366) (3,930)
$ 3,681 297
Depreciation expense was $269 and $225 for the years ended June 30, 2017 and 2016, respectively. In
connection with the early lease amendment for new office space, fixed assets with a gross value of $3,833
were retired as of June 30, 2017, including the $100 remaining net carrying value of abandoned leasehold
improvements. New leasehold improvements when completed are estimated to aggregate $4,500, and will
BOSTON FOUNDATION, INC.
Notes to Consolidated Financial Statements
June 30, 2017 and 2016
(Dollars in thousands)
19 (Continued)
be amortized over the remaining amended lease term. Please refer to note 9 for more detail on the lease
amendment.
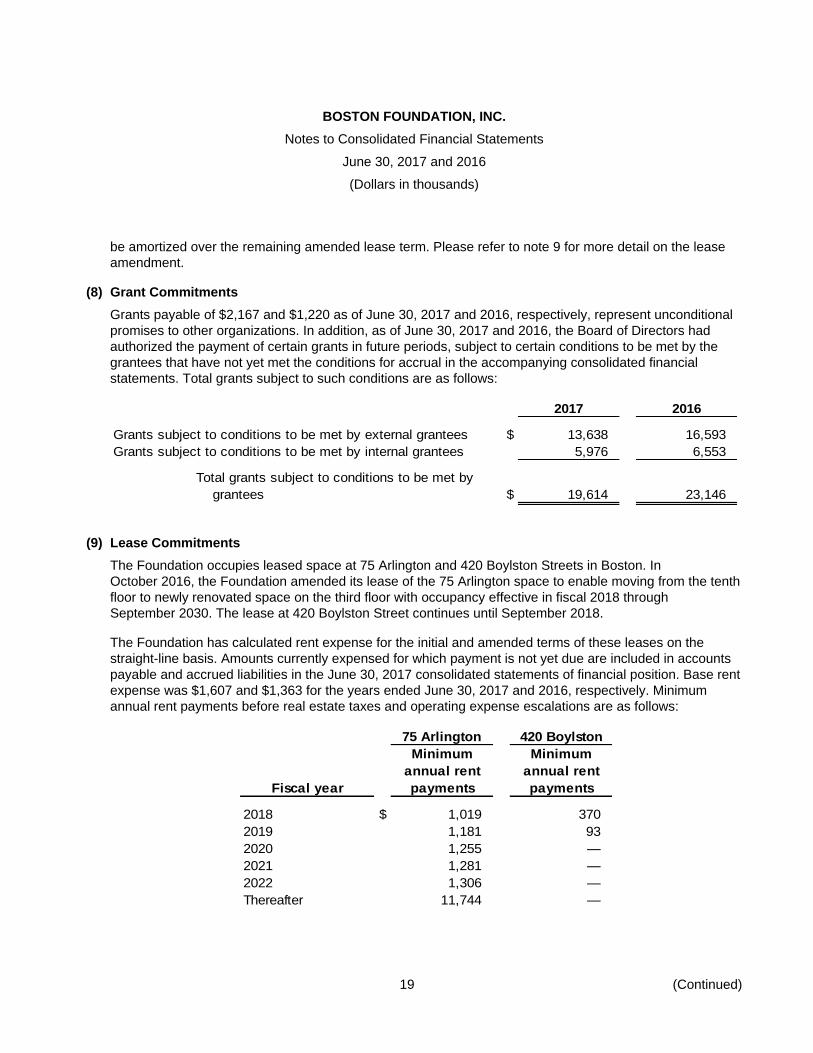
(8) Grant Commitments
Grants payable of $2,167 and $1,220 as of June 30, 2017 and 2016, respectively, represent unconditional
promises to other organizations. In addition, as of June 30, 2017 and 2016, the Board of Directors had
authorized the payment of certain grants in future periods, subject to certain conditions to be met by the
grantees that have not yet met the conditions for accrual in the accompanying consolidated financial
statements. Total grants subject to such conditions are as follows:
2017 2016
Grants subject to conditions to be met by external grantees $ 13,638 16,593
Grants subject to conditions to be met by internal grantees 5,976 6,553
Total grants subject to conditions to be met by
grantees $ 19,614 23,146
(9) Lease Commitments
The Foundation occupies leased space at 75 Arlington and 420 Boylston Streets in Boston. In
October 2016, the Foundation amended its lease of the 75 Arlington space to enable moving from the tenth
floor to newly renovated space on the third floor with occupancy effective in fiscal 2018 through
September 2030. The lease at 420 Boylston Street continues until September 2018.
The Foundation has calculated rent expense for the initial and amended terms of these leases on the
straight-line basis. Amounts currently expensed for which payment is not yet due are included in accounts
payable and accrued liabilities in the June 30, 2017 consolidated statements of financial position. Base rent
expense was $1,607 and $1,363 for the years ended June 30, 2017 and 2016, respectively. Minimum
annual rent payments before real estate taxes and operating expense escalations are as follows:
75 Arlington 420 Boylston
Minimum Minimum
annual rent annual rent
Fiscal year payments payments
2018 $ 1,019 370
2019 1,181 93
2020 1,255 —
2021 1,281 —
2022 1,306 —
Thereafter 11,744 —
BOSTON FOUNDATION, INC.
Notes to Consolidated Financial Statements
June 30, 2017 and 2016
(Dollars in thousands)
20 (Continued)
(10) Employee Benefit Plans
The Foundation sponsors a 403(b) defined contribution plan. The current amount contributed by the
Foundation for eligible employees is 6% of annual gross salary up to the IRS allowed maximum. All
employees are eligible to participate after one year of service. The total cost of the plan charged to the
Foundation’s operations amounted to $491 and $428 for the years ended June 30, 2017 and 2016,
respectively.
The Foundation provides deferred compensation plans for its executives as approved by the Compensation
Committee of the Board of Directors. The amount contributed was $211 and $226 for the years ended
June 30, 2017 and 2016, respectively.
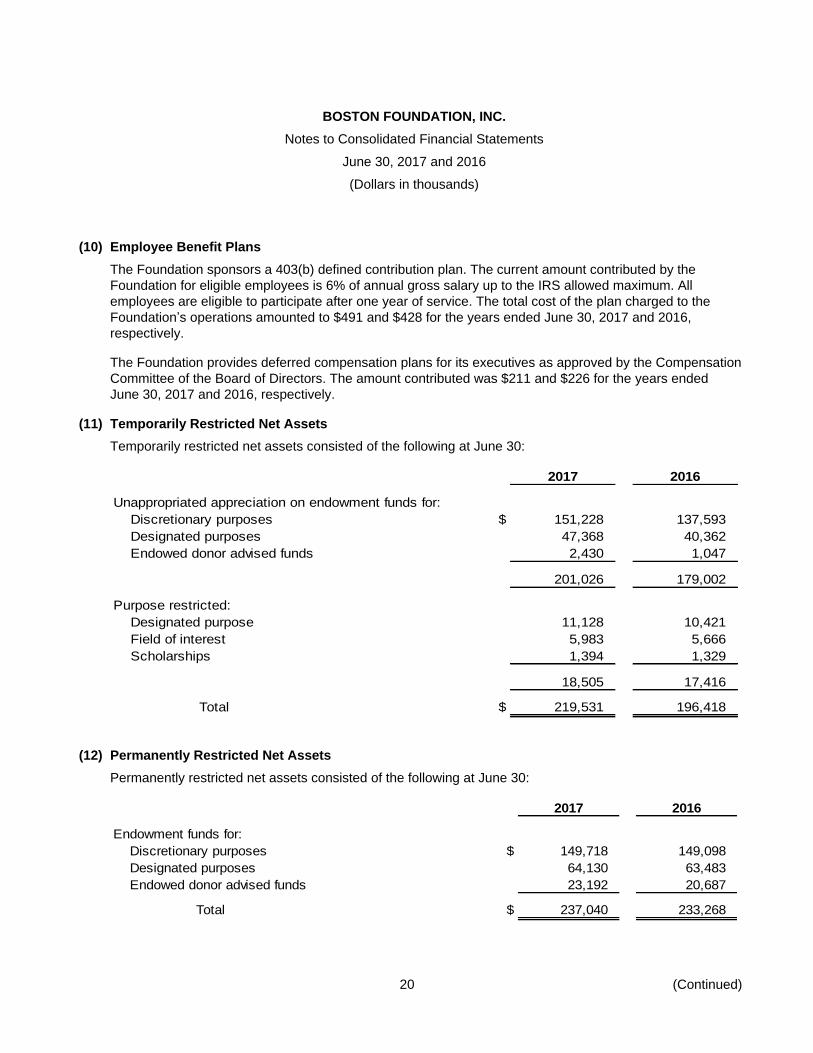
(11) Temporarily Restricted Net Assets
Temporarily restricted net assets consisted of the following at June 30:
2017 2016
Unappropriated appreciation on endowment funds for:
Discretionary purposes $ 151,228 137,593
Designated purposes 47,368 40,362
Endowed donor advised funds 2,430 1,047
201,026 179,002
Purpose restricted:
Designated purpose 11,128 10,421
Field of interest 5,983 5,666
Scholarships 1,394 1,329
18,505 17,416
Total $ 219,531 196,418
(12) Permanently Restricted Net Assets
Permanently restricted net assets consisted of the following at June 30:
2017 2016
Endowment funds for:
Discretionary purposes $ 149,718 149,098
Designated purposes 64,130 63,483
Endowed donor advised funds 23,192 20,687
Total $ 237,040 233,268
BOSTON FOUNDATION, INC.
Notes to Consolidated Financial Statements
June 30, 2017 and 2016
(Dollars in thousands)
21
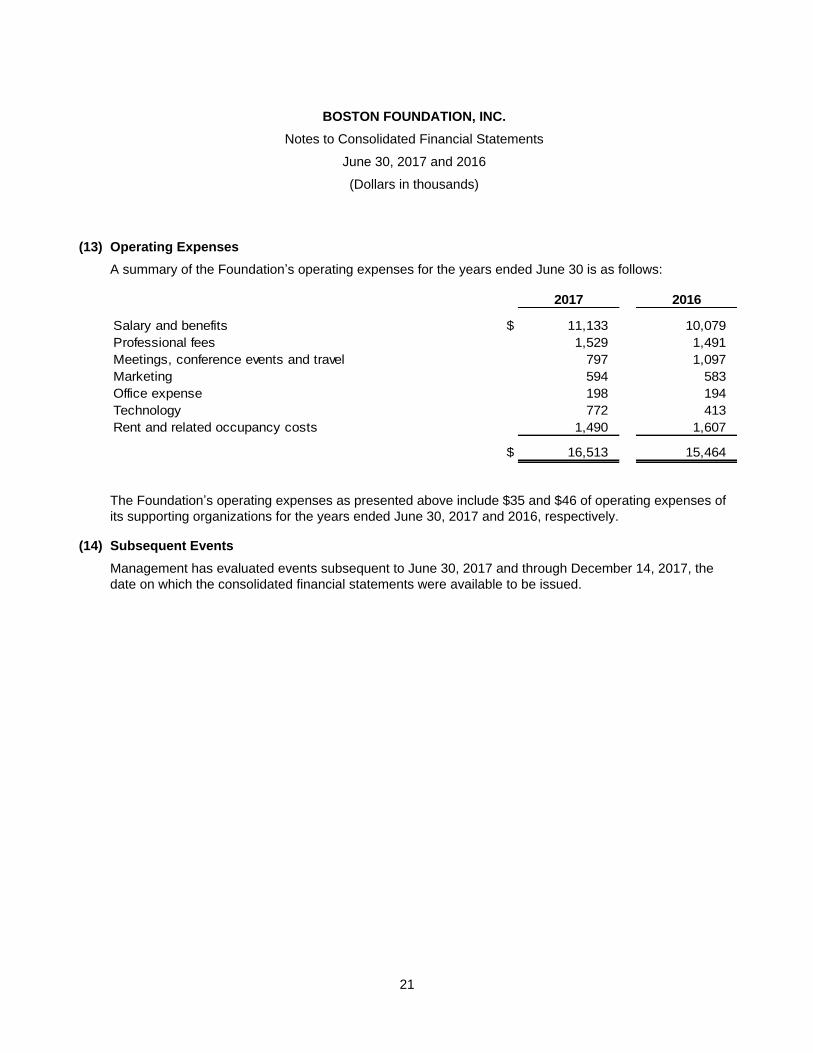
(13) Operating Expenses
A summary of the Foundation’s operating expenses for the years ended June 30 is as follows:
2017 2016
Salary and benefits $ 11,133 10,079
Professional fees 1,529 1,491
Meetings, conference events and travel 797 1,097
Marketing 594 583
Office expense 198 194
Technology 772 413
Rent and related occupancy costs 1,490 1,607
$ 16,513 15,464
The Foundation’s operating expenses as presented above include $35 and $46 of operating expenses of
its supporting organizations for the years ended June 30, 2017 and 2016, respectively.
(14) Subsequent Events
Management has evaluated events subsequent to June 30, 2017 and through December 14, 2017, the
date on which the consolidated financial statements were available to be issued.