Embed Size (px)
Citation preview
Bottom-Up Local Input and Envisioning Process for Connect SoCal and RHNA
Kimberly Clark
Regional Planner Specialist
March 7, 2019
Community, Economic, and Human Development Committee
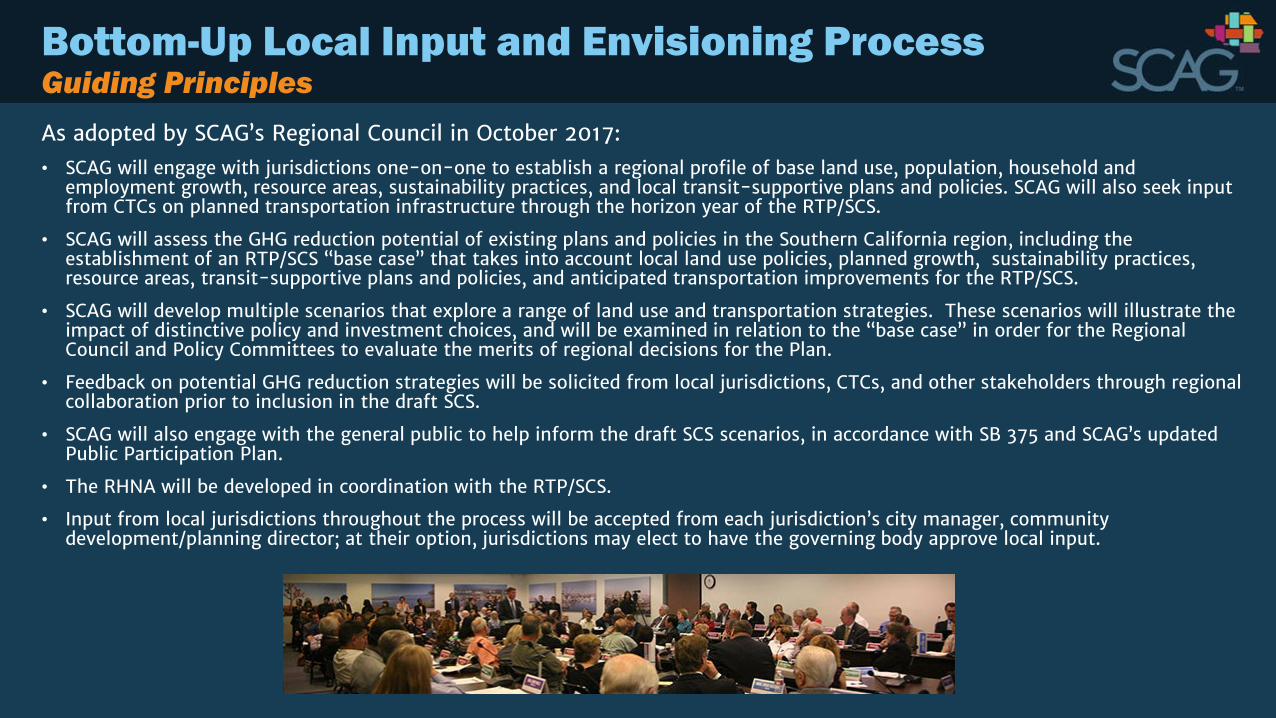
Bottom-Up Local Input and Envisioning Process
As adopted by SCAG’s Regional Council in October 2017:
• SCAG will engage with jurisdictions one-on-one to establish a regional profile of base land use, population, household and employment growth, resource areas, sustainability practices, and local transit-supportive plans and policies. SCAG will also seek input from CTCs on planned transportation infrastructure through the horizon year of the RTP/SCS.
• SCAG will assess the GHG reduction potential of existing plans and policies in the Southern California region, including the establishment of an RTP/SCS “base case” that takes into account local land use policies, planned growth, sustainability practices, resource areas, transit-supportive plans and policies, and anticipated transportation improvements for the RTP/SCS.
• SCAG will develop multiple scenarios that explore a range of land use and transportation strategies. These scenarios will illustrate the impact of distinctive policy and investment choices, and will be examined in relation to the “base case” in order for the Regional Council and Policy Committees to evaluate the merits of regional decisions for the Plan.
• Feedback on potential GHG reduction strategies will be solicited from local jurisdictions, CTCs, and other stakeholders through regional collaboration prior to inclusion in the draft SCS.
• SCAG will also engage with the general public to help inform the draft SCS scenarios, in accordance with SB 375 and SCAG’s updated Public Participation Plan.
• The RHNA will be developed in coordination with the RTP/SCS.
• Input from local jurisdictions throughout the process will be accepted from each jurisdiction’s city manager, community development/planning director; at their option, jurisdictions may elect to have the governing body approve local input.
Guiding Principles
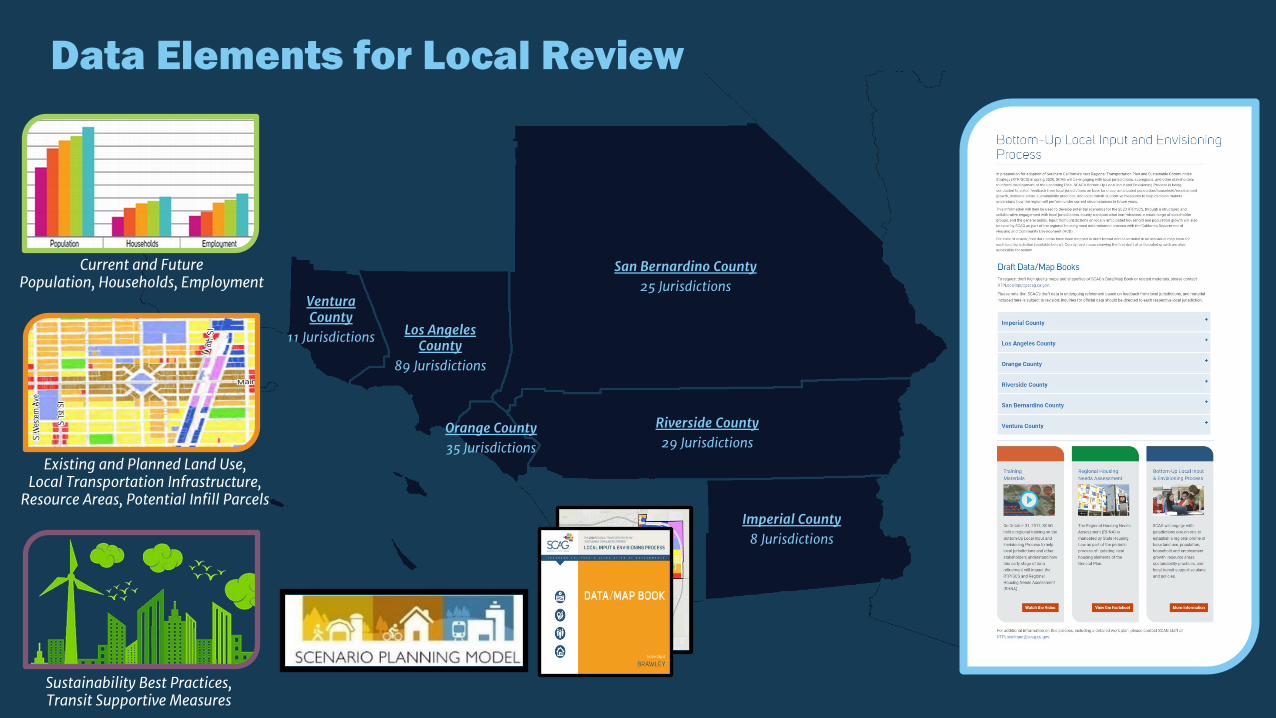
Data Elements for Local Review
San Bernardino County25 Jurisdictions
Riverside County29 Jurisdictions
Imperial County8 Jurisdictions
Orange County35 Jurisdictions
Los AngelesCounty
89 Jurisdictions
VenturaCounty
11 Jurisdictions
Current and Future Population, Households, Employment
Existing and Planned Land Use,Local Transportation Infrastructure,
Resource Areas, Potential Infill Parcels
Sustainability Best Practices, Transit Supportive Measures
= Updates on the Bottom-Up Local Input and Envisioning Process
included in SCAG’s Executive Director’s Report
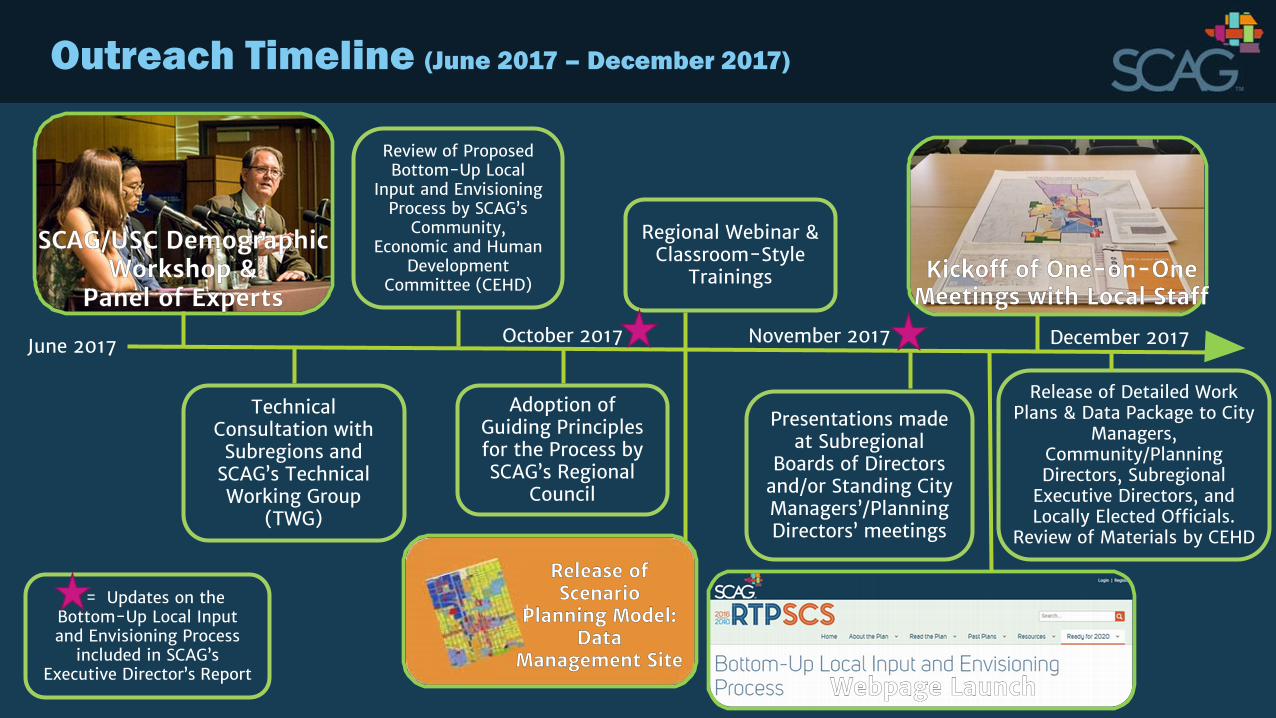
Outreach Timeline (June 2017 – December 2017)
June 2017
Technical Consultation with Subregions and
SCAG’s Technical Working Group
(TWG)
Review of Proposed Bottom-Up Local
Input and Envisioning Process by SCAG’s
Community, Economic and Human
Development Committee (CEHD)
Adoption of Guiding Principles for the Process by SCAG’s Regional
Council
November 2017
Regional Webinar & Classroom-Style
Trainings
Release of Detailed Work Plans & Data Package to City
Managers, Community/Planning Directors, Subregional
Executive Directors, and Locally Elected Officials.
Review of Materials by CEHD
Presentations made at Subregional
Boards of Directors and/or Standing City Managers’/Planning Directors’ meetings
October 2017 December 2017

Outreach Timeline (January 2018 – 2018)
March 2018
Progress Report on Bottom-Up Local
Input and Envisioning Process Delivered to CEHD
Continuing Consultation with SCAG’s TWG and
Subregions
January 2018April 2018February 2018
May 2018 June 2018
= Updates on the Bottom-Up Local Input and Envisioning Process
included in SCAG’s Executive Director’s Report
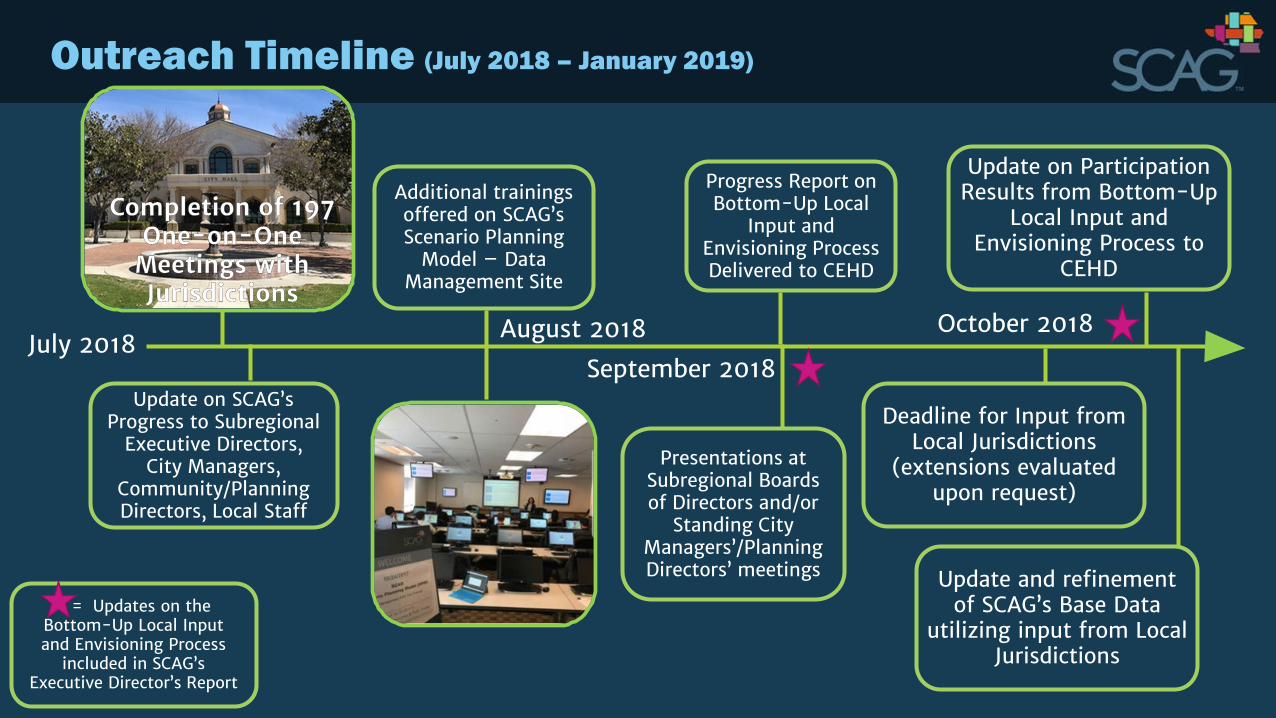
Outreach Timeline (July 2018 – January 2019)
July 2018
Update on SCAG’s Progress to Subregional
Executive Directors, City Managers,
Community/Planning Directors, Local Staff
= Updates on the Bottom-Up Local Input and Envisioning Process
included in SCAG’s Executive Director’s Report
August 2018
Additional trainings offered on SCAG’s Scenario Planning
Model – Data Management Site
October 2018
Presentations at Subregional Boards of Directors and/or
Standing City Managers’/Planning Directors’ meetings
Progress Report on Bottom-Up Local
Input and Envisioning Process Delivered to CEHD
September 2018
Deadline for Input from Local Jurisdictions
(extensions evaluated upon request)
Update on Participation Results from Bottom-Up
Local Input and Envisioning Process to
CEHD
Update and refinement of SCAG’s Base Data
utilizing input from Local Jurisdictions
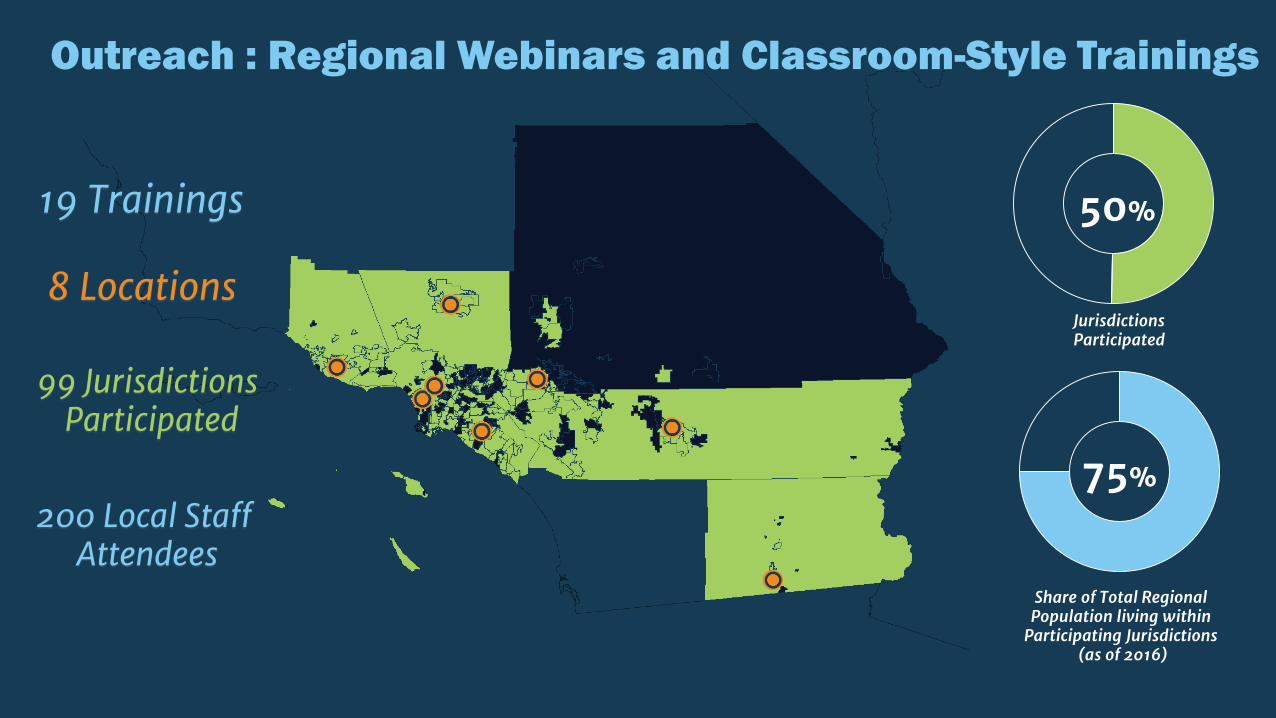
Outreach : Regional Webinars and Classroom-Style Trainings
19 Trainings
8 Locations
99 Jurisdictions Participated
200 Local Staff Attendees
JurisdictionsParticipated
50%
Share of Total Regional Population living within
Participating Jurisdictions (as of 2016)
75%
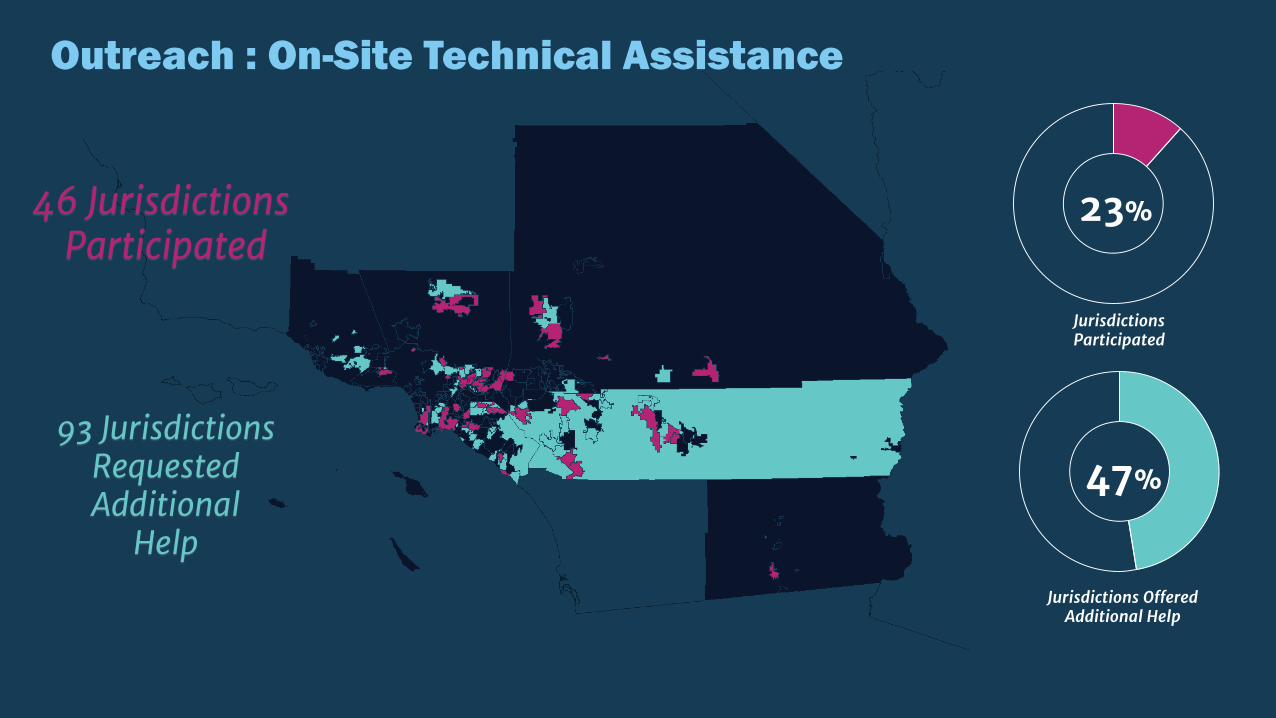
Outreach : On-Site Technical Assistance
93 JurisdictionsRequestedAdditional
Help
46 Jurisdictions Participated
JurisdictionsParticipated
23%
Jurisdictions OfferedAdditional Help
47%
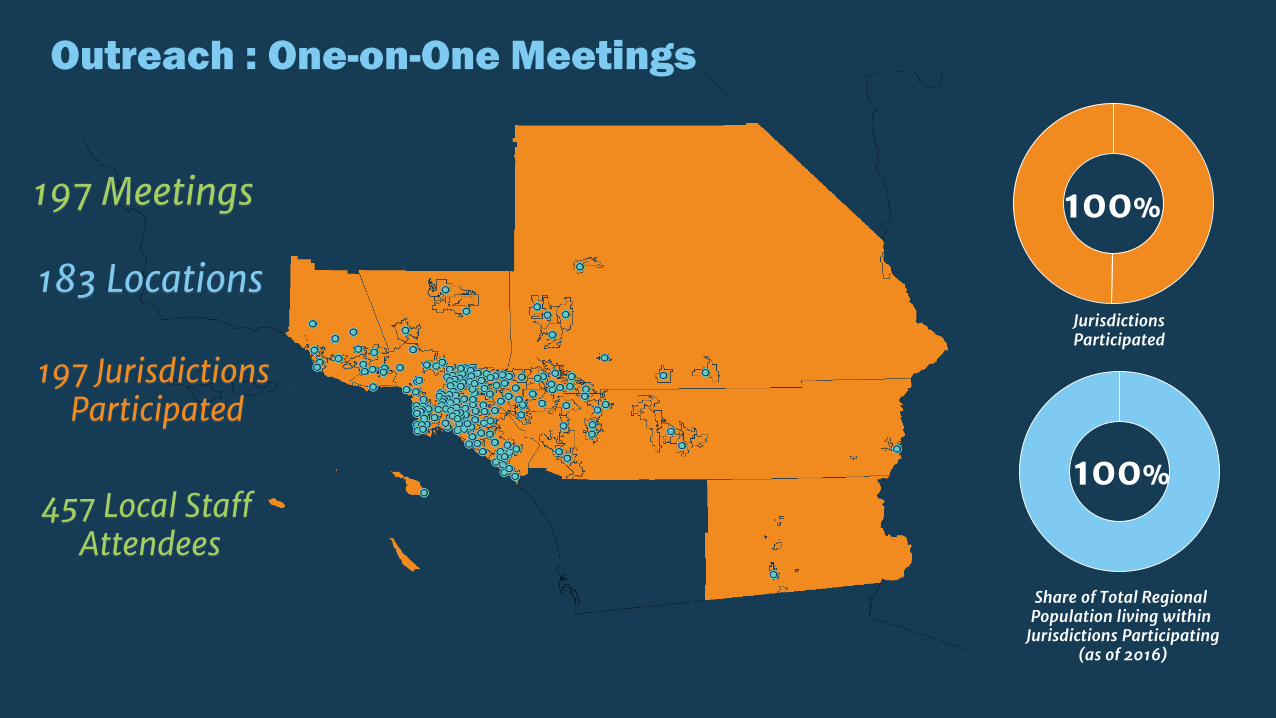
Outreach : One-on-One Meetings
197 Meetings
183 Locations
197 Jurisdictions Participated
457 Local Staff Attendees
JurisdictionsParticipated
100%
100%
Share of Total Regional Population living within
Jurisdictions Participating(as of 2016)
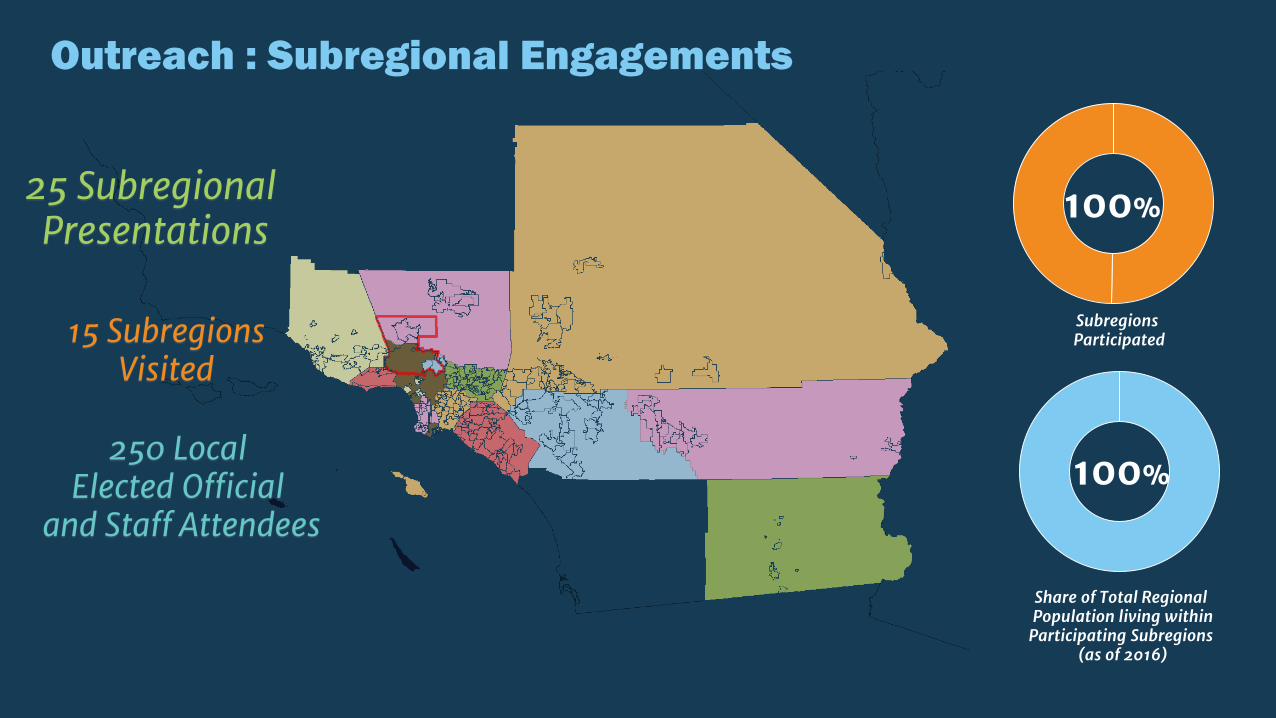
Outreach : Subregional Engagements
25 Subregional Presentations
15 SubregionsVisited
250 Local Elected Official
and Staff Attendees
SubregionsParticipated
100%
100%
Share of Total Regional Population living within
Participating Subregions(as of 2016)
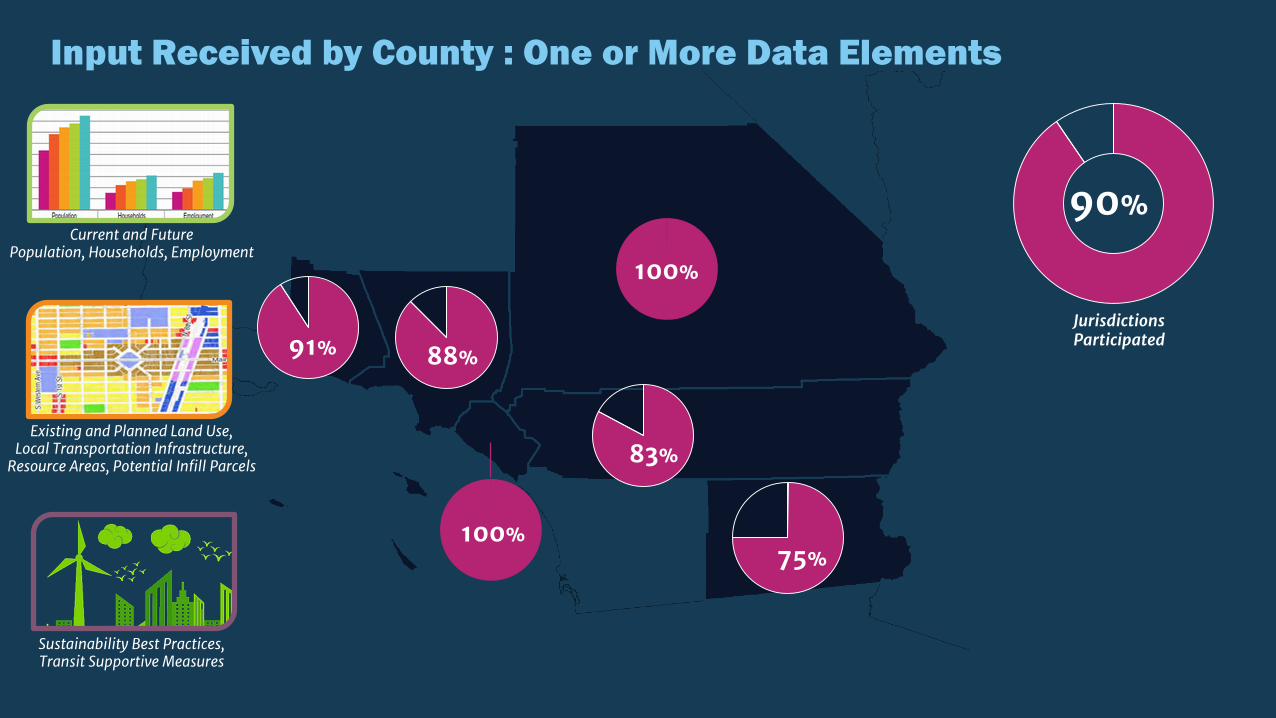
75%
83%
100%
100%
88%91%
Input Received by County : One or More Data Elements
JurisdictionsParticipated
90%Current and Future
Population, Households, Employment
Existing and Planned Land Use,Local Transportation Infrastructure,
Resource Areas, Potential Infill Parcels
Sustainability Best Practices, Transit Supportive Measures
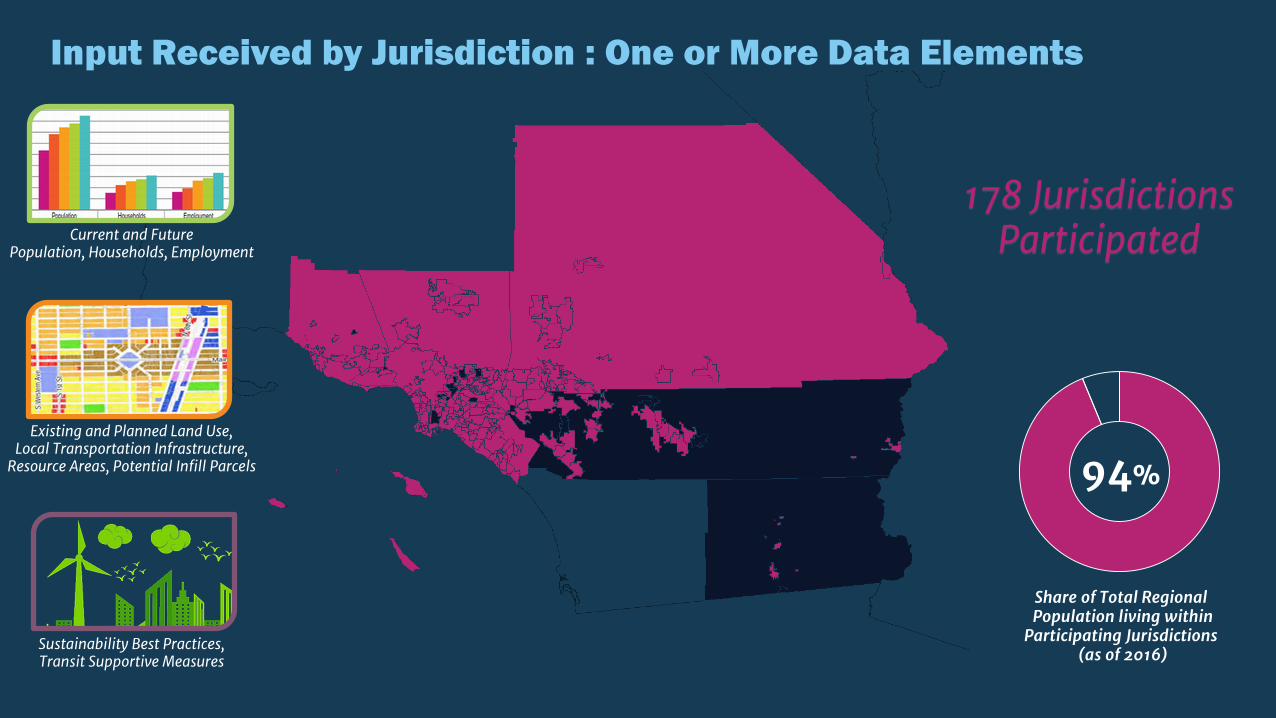
Input Received by Jurisdiction : One or More Data Elements
Share of Total Regional Population living within
Participating Jurisdictions (as of 2016)
94%
178 JurisdictionsParticipatedCurrent and Future
Population, Households, Employment
Existing and Planned Land Use,Local Transportation Infrastructure,
Resource Areas, Potential Infill Parcels
Sustainability Best Practices, Transit Supportive Measures
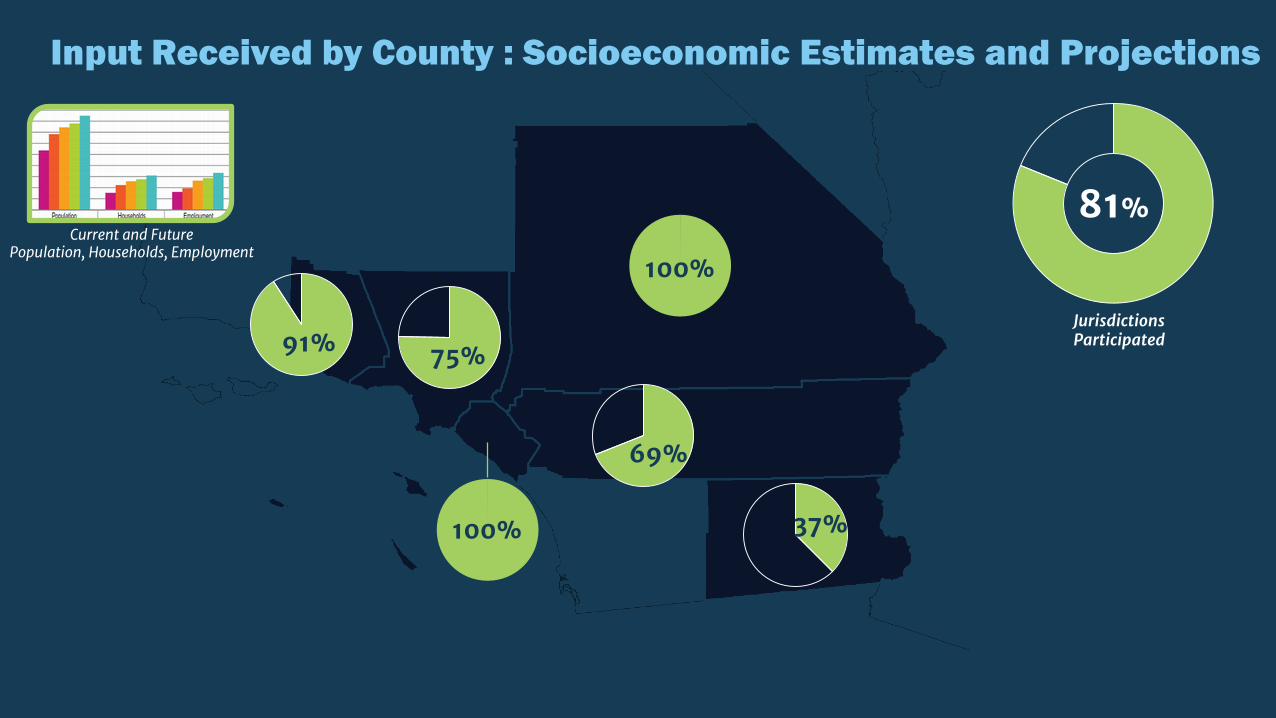
Input Received by County : Socioeconomic Estimates and Projections
37%
69%
100%
100%
75%91%
81%of 197
Jurisdictionsprovided
input
Current and Future Population, Households, Employment
JurisdictionsParticipated
81%
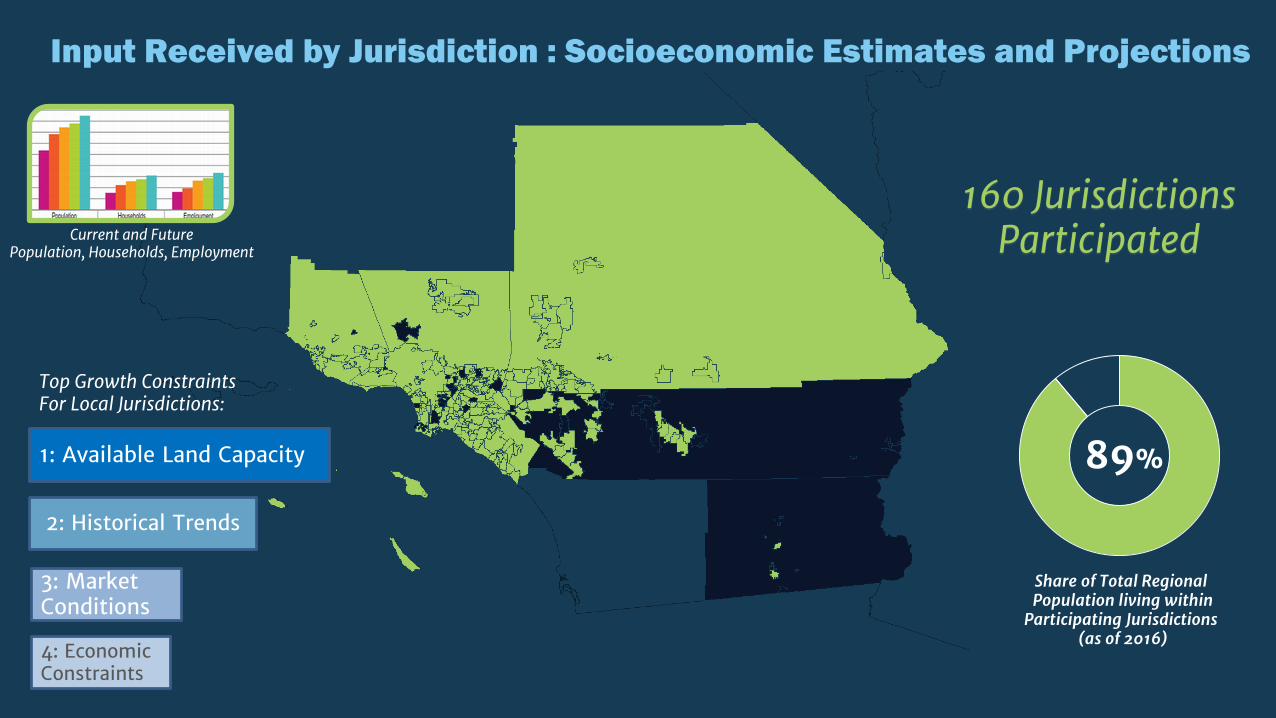
Input Received by Jurisdiction : Socioeconomic Estimates and Projections
Current and Future Population, Households, Employment
89%
Share of Total Regional Population living within
Participating Jurisdictions (as of 2016)
160 JurisdictionsParticipated
1: Available Land Capacity
2: Historical Trends
3: Market Conditions
4: Economic Constraints
Top Growth ConstraintsFor Local Jurisdictions:
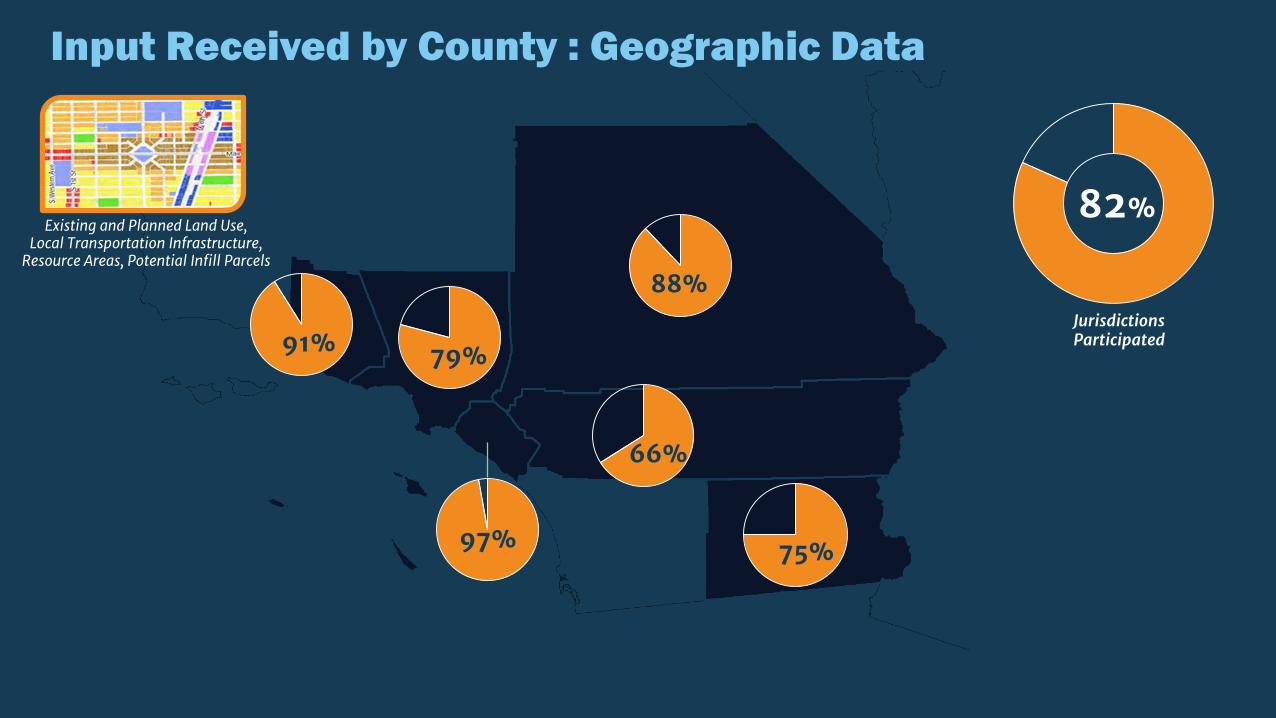
Input Received by County : Geographic Data
75%
66%
88%
97%
79%91%
81%of 197
Jurisdictionsprovided
input
JurisdictionsParticipated
82%Existing and Planned Land Use,
Local Transportation Infrastructure,Resource Areas, Potential Infill Parcels
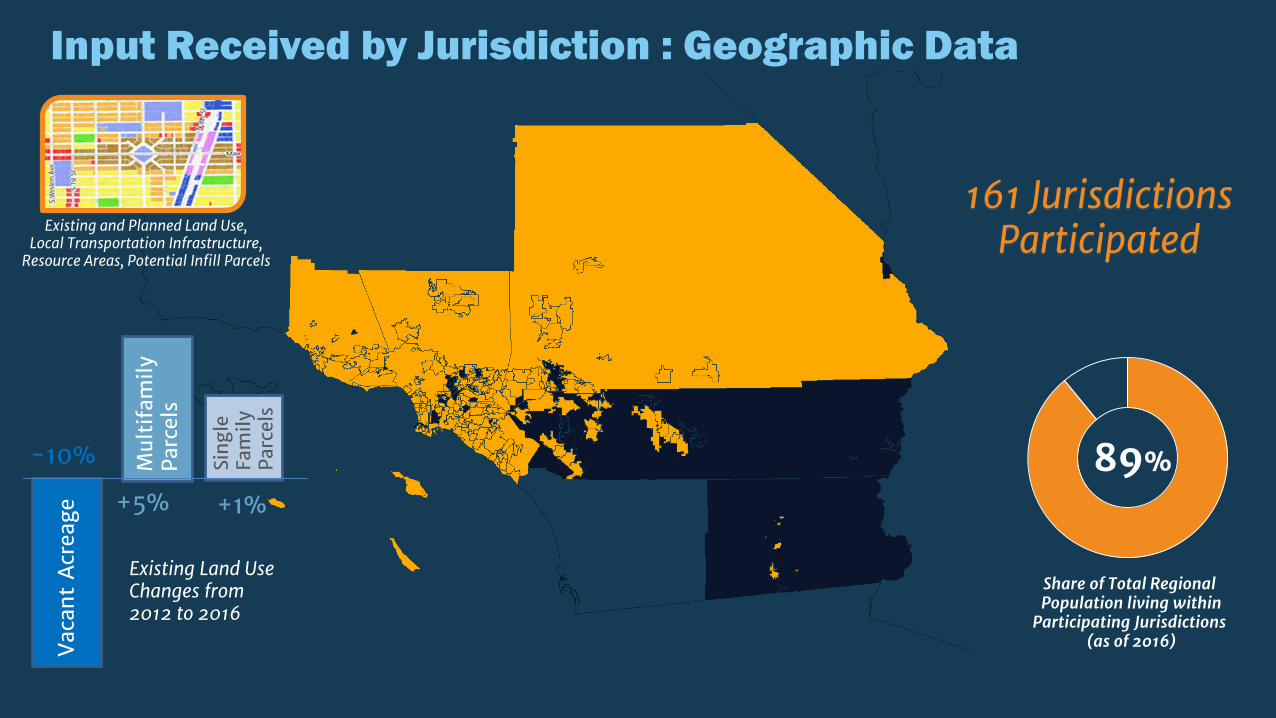
Input Received by Jurisdiction : Geographic Data
89%
Share of Total Regional Population living within
Participating Jurisdictions (as of 2016)
Existing and Planned Land Use,Local Transportation Infrastructure,
Resource Areas, Potential Infill Parcels
161 JurisdictionsParticipated
Vac
ant
Acr
eage
Mul
tifa
mily
Pa
rcel
s
Sing
le
Fam
ily
Parc
els
Existing Land Use Changes from 2012 to 2016
-10%
+5% +1%
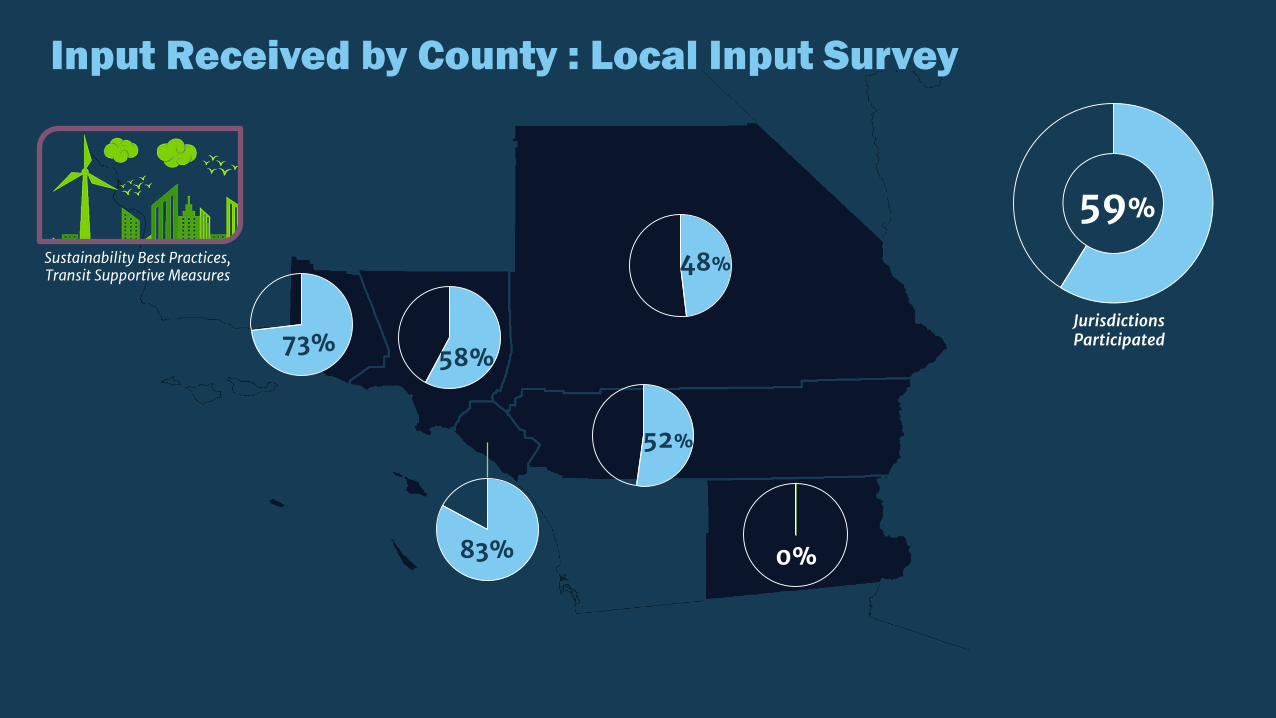
Input Received by County : Local Input Survey
0%
52%
48%
83%
58%73%
81%of 197
Jurisdictionsprovided
input
JurisdictionsParticipated
59%Sustainability Best Practices, Transit Supportive Measures

Input Received by Jurisdiction : Local Input Survey
Share of Total Regional Population living within
Participating Jurisdictions (as of 2016)
75%
Sustainability Best Practices, Transit Supportive Measures
116 JurisdictionsParticipated
26%
Share of Respondent JurisdictionsIn the process of updating
their General Plans
• SCAG is updating “Base Case” datasets for use in the development of Connect SoCal and RHNA
• Additional findings will be presented at subsequent meetings of the CEHD and RHNA Subcommittee
• The “Base Case” will be modeled and utilized as a point of comparison for plan development
• Geographic data elements will be populated to SCAG’s Scenario Planning Model – Data Management Site for use by local jurisdictions in early spring
• SCAG will be utilizing “Base Case” datasets in the development of the Regional Data Platform
Next Steps