Embed Size (px)
Citation preview
Keywords: Football, bounce, spin, coefficient of restitution
Bounce of an oval shaped football
Rod Cross∗
Physics Department, University of Sydney, Australia
Abstract
Oval shape footballs used in American and Canadian football are similar in size, shape and weight
to those used in Rugby League, Rugby Union and Australian Rules, all being about 28 cm long,
60 cm in circumference and weighing about 410 g. A generic football fitting that description was
filmed with a video camera at 100 fps to determine its bounce properties. Compared with a spherical
ball, the bounce of an oval shaped football is less predictable since the normal reaction force can act
ahead of or behind the centre of the ball, depending on its alignment on impact with the ground.
Projected at an oblique angle without spin or with backspin, a football usually bounces backward if
the top end points backward on impact. Projected with topspin, a football usually bounces forward,
but it can sometimes bounce to a much larger height than usual, or roll for a short distance before
it bounces. The coefficient of restitution was found to be greater than unity in some cases. Another
surprise was that the horizontal speed after the bounce was sometimes larger than that before the
bounce. The latter effect was due to a reversal in the direction of the friction force during the
bounce, resulting in acceleration of the ball in the horizontal direction. These effects were found to
be consistent with a simple theoretical bounce model. The forward bounce speed is maximised when
the ball is inclined forward at 45◦ on impact, and the backward bounce speed is maximised when the
ball is inclined backward at 45◦ on impact. Force plate measurements of the normal reaction and
horizontal friction forces acting on the ball are also presented. In some cases, the friction force
reversed several times during the bounce.
1

1. INTRODUCTION
Unusual bounce effects are observed if an oval shaped football is projected obliquely onto
a horizontal surface. The ball will sometimes bounce backward without significant rotation.
Other times it will bounce forward or backward spinning rapidly in either a clockwise or
a counter–clockwise direction. These effects are unusual in the sense that they differ from
the familiar bounce of a spherical ball. A football is not alone in this respect. Unusual
bounce effects are also observed when other elongated or non–spherical objects are dropped
or thrown to the ground (Cross, 2006). The bounce behaviour of an elongated object differs
from that of a spherical ball since the normal reaction force does not usually act along a line
through the center of mass. Consequently the torque applied to an elongated object when
it bounces depends on its orientation at impact and can be significantly larger than that on
a spherical ball. An elongated object can also bounce without a significant change in spin if
the torque due to the friction force is approximately equal and opposite the torque due to
the normal reaction force.
Football players in Australia are required to throw the ball forward onto the ground if
they wish to run more than 15 m with the ball, but can catch it on the run as it bounces
back toward them, provided it is thrown at an appropriate projection angle and lands at an
appropriate angle of inclination. This version of football is known as Australian Rules, it
is played at a very fast pace, and it regularly attracts crowds of 80,000 people. A football
kicked along the ground exhibits another curious effect. That is, it can bounce several times
to a height of around 0.5 m and then suddenly bounce to a height of 2 m or more, as if
its coefficient of restitution (COR) suddenly increased well above unity. Alternatively the
ball might bounce to a height of less than 0.1 m after several previous 0.5 m bounces. This
behaviour is quite unlike that of a spherical ball. A spherical ball projected downward at an
oblique angle onto a horizontal surface normally bounces forward with an angle of reflection
approximately equal to the angle of incidence, and it bounces with a COR that is less than
unity. A spherical ball does not normally bounce backward, although it can do so if the ball
is projected near normal incidence with backspin (Cross, 2005; Garwin, 1969).
Measurements and calculations are presented below to describe the bounce of a football
under several different initial conditions where the ball was allowed to spin about a trans-
verse, horizontal axis. Video film was used to measure the incident and rebound speeds,
spins and angles, and the data were used to examine the roles of the friction and normal reac-
2

tion forces in determining the bounce behaviour. Direct time–resolved measurements of the
friction and normal reaction forces were also made using a force plate designed specifically
to measure the bounce of a ball.
2. BOUNCE GEOMETRY
A football has an approximately elliptical cross section defined by the relation
(x/a)2 + (y/b)2 = 1 where a and b are the major and minor radii respectively and
(x, y) is the coordinate of a point on the ellipse. If the ball makes contact at a coordinate
(x, y) with a horizontal surface then the long axis is inclined at an angle φ to the horizontal
given by tanφ = dy/dx = −(b2x)/(a2y). The radial distance from the contact point to the
center of the ball is R = (x2 + y2)1/2, the horizontal distance is given by X = R sin β, and
the vertical distance is given by Y = R cos β, where the angle β is defined in Figure 1.
X can be positive or negative depending on the angle of inclination, φ, but Y remains
positive regardless of the angle of inclination. X is taken to be negative if the ball is inclined
with 0 < φ < 90◦ as depicted in Figure 1. As φ is varied, the magnitude of X passes through
a maximum value of a− b at φ typically about 38◦ for a football, depending on the ratio of
a to b. Consequently, the torque on the ball due to the normal reaction force is a maximum
when φ is about 38◦ (or 180− 38 = 142◦).
ω
CM•R
Rω
ββ
v
X
Y
v
φ
Impact surface
Longaxis
Horizontal
Incidentball
Contact point
FIG. 1: A football incident at angular velocity ω impacts a horizontal surface at an angle of
inclination φ. In the diagram, the ball is incident from the left, φ is about +30◦ and the ball is
pointing or leaning forward. Experimental results are presented over the range 0 < φ < 180◦. The
point on the ball in contact with the surface rotates at speed Rω relative to the centre of mass
(CM), with velocity components v‖ = Y ω and v⊥ = Xω relative to the CM.
If the ball is rotating at angular velocity ω just before or after the impact then the contact
3

point has a velocity component v⊥ = Rω sin β = Xω, relative to the center of the ball, in
a direction perpendicular to the surface. It also has a velocity component v‖ = Y ω in a
direction parallel to the surface, relative to the center of the ball. The contact point of a
spinning spherical ball also has a velocity component parallel to the surface but it has no
perpendicular component relative to the center of the ball immediately before impact.
The geometry chosen to describe the bounce of the ball is shown in Figure 2. The center
of mass (CM) of the ball is incident from left to right with velocity components vx1 and vy1
and rebounds with velocity components vx2 and vy2. vx1 and vx2 are taken to be positive
if the ball travels left to right, vy1 is taken to be positive if the ball is travelling downward
toward the surface, and vy2 is taken to be positive if the ball is travelling upward away from
the surface. Conventionally, vy1 is negative in the chosen (x, y) coordinate system, but it is
more convenient in the following discussion to let vy1 represent the speed of the incident ball
in a direction perpendicular to the surface. The ball is incident at angular velocity ω1 and
rebounds at angular velocity ω2, both assumed to be positive if the ball rotates in a clockwise
direction as indicated in Figure 2. The ball is incident at angle θ1 = tan−1 (vx1/vy1) and
rebounds at angle θ2 = tan−1 (vx2/vy2).
F
N
X
Yω
CM•
Longaxisvy1
vx1Incidentvelocity
θ1
vx2Reboundvelocity
vy2θ2
φ
x
y
Impact surface
Contact point
FIG. 2: A football incident at angle θ1 to the vertical bounces at angle θ2. The horizontal friction
force, F , and the normal reaction force, N , act through the contact point. CM is the centre of
mass of the ball.
Just prior to impact, the vertical speed, vpy1, of the contact point on the ball is given by
vpy1 = vy1 +Xω1 and the horizontal speed of the contact point is given by vpx1 = vx1−Y ω1.
4

Immediately after the impact, the vertical speed, vpy2, of the contact point on the ball is
given by vpy2 = vy2 −Xω2 and the horizontal speed is given by vpx2 = vx2 − Y ω2. X and Y
are not the same immediately before and after the impact since the ball rotates during the
impact. In the experiments described below, the angular velocity of the ball was typically
about 10 or 20 rad.s−1 and the impact duration was 15 ms. Consequently, the ball rotated
by about 10◦ or 20◦ during the impact depending on the initial and final rotation speeds.
3. DIFFERENCES BETWEEN SPHERICAL AND OVAL BALLS
The vertical bounce speed of a football depends on the coefficient of restitution (COR),
defined by the ratio vpy2/vpy1. For a spherical ball, the COR is usually defined by the ratio
vy2/vy1. However, the COR is defined more generally in terms of the speed of the contact
point rather than the speed of the center of mass. For a spherical ball the two definitions
are equivalent. In other situations, such as the bounce of a football or the impact of a bat
and a ball, the COR is defined in terms of the normal velocity components at the point of
contact (Brody et al, 2002; Nathan, 2003). As a consequence, the simple relation between
COR and bounce height that exists for a spherical ball does not usually apply to an oval
shaped football.
The COR of a football is typically about 0.8. If a spherical ball with a COR of 0.8 is
dropped from a height of 1.0 m, it will bounce to a height of 0.82 = 0.64 m, even if it spins
about an axis when it is dropped. A football dropped from a height of 1.0 m may also
bounce to a height of 0.64 m but only if it impacts the ground with its long axis parallel
to the ground. More generally, the bounce height of a football will depend on whether v⊥
is positive, negative or zero. For example, the bounce height will be zero if vpy1 = 0 or if
Xω1 = −vy1, a situation that can arise if X or ω1 is negative and if ω1 is large enough.
For an oblique impact the contact point on a ball will generally strike the surface at finite
horizontal speed and hence the ball will initially slide along the surface. The sliding motion
will be opposed by a horizontal friction force F acting at the contact point. The direction
of F shown in Figure 2 is the usual direction when a spherical ball is incident from left
to right, in which case the result is a decrease in horizontal ball speed and an increase in
angular velocity in a clockwise direction. The initial horizontal speed of the contact point
for a football is given by vpx1 = vx1−Y ω1 which can be positive, negative or zero depending
on the magnitude and sign of ω1. A similar situation can arise with a spherical ball, but
5

a football is different in that the normal reaction force, N , also has a strong influence on
the torque exerted on the ball. As a result, the magnitude, direction and duration of the
friction force acting on the ball depends not only on the magnitude and sign of ω1 but also
on the magnitude of N and the line of action of N .
Consider the situation shown in Figure 2 where the ball is incident left to right and
rotating clockwise before impact. If ω1 is relatively small so that vpx1 > 0, then F will
act as shown to oppose sliding motion to the right. For a spherical ball, the effect of the
friction force is to reduce the horizontal speed of the ball and to increase its rotation speed
in a clockwise direction. If a spherical ball is incident within about 60◦ of the normal,
the bottom of the ball will come to rest during the bounce and grip the surface, since the
increase in rotation speed and the decrease in horizontal sliding speed is sufficient to reduce
the sliding speed to zero. For the situation shown in Figure 2, F and N both exert clockwise
torques on the ball with the result that the net torque acting on the ball is larger than it
would be on a spherical ball under the same conditions. The angular acceleration is therefore
larger so the contact point will come to rest sooner. Since the backward directed friction
force acts for a shorter time, the ball will bounce with a larger horizontal speed. Conversely,
if the ball is leaning backward when it impacts the surface, then N will act ahead of the
CM and reduce the angular acceleration of the ball. The sliding phase will then persist for
a longer period of time and the ball will bounce with a smaller horizontal speed than would
a spherical ball.
Sliding friction acting on the bottom of a ball can reduce the horizontal speed of the
ball to zero but it cannot reverse the direction of motion of the ball. The backward bounce
of a football arises from a backward directed static friction force that persists after the
bottom of the ball grips the surface. If the ball was perfectly rigid then the whole ball
would come to rest when the contact region of the ball comes to rest. However, a football
is relatively flexible and will stretch horizontally when the contact region comes to rest,
due to forward motion of the upper part of the ball. The upper part of the ball therefore
exerts a forward force on the contact region while the ground exerts an equal and opposite
backward force. An impulsive tangential force applied in this manner results not only in
the storage of elastic energy in the ball associated with tangential deformation but can also
excite tangential oscillations in the ball. As a result, the friction force on a ball can reverse
direction during the bounce and may reverse direction several times (Cross, 2002).
6

4. SIMPLE BOUNCE MODEL
The bounce shown in Figure 2 is governed by the relations F = −Mdvx/dt, N = Mdvy/dt
and FY +NX = Icmdω/dt where M is the ball mass and Icm is the moment of inertia of the
ball about a transverse axis through the CM. For the conditions of the present experiment,
the gravitational force was much smaller than N . Integrating over the whole time period of
the bounce and assuming that X and Y remain essentially constant in time, we find that
∫ F dt = M(vx1 − vx2), (1)
∫ N dt = M(vy1 + vy2), (2)
and
Icm(ω2 − ω1) = Y ∫ F dt+X ∫ N dt = MY (vx1 − vx2) +MX(vy1 + vy2) (3)
A simple solution of Eqs. (1)–(3) can be found if the ball slides throughout the bounce period
since then F = µN where µ is the coefficient of sliding friction [6, 7]. Sliding behaviour
persists throughout the bounce when a ball is incident at a grazing angle on a surface, but
not when the ball is incident at angles near the normal or even at angles up to about 60◦
away from the normal. In the present experiment the ball always gripped the surface during
the bounce, and a simple relation between F and N did not exist.
An alternative solution of Equations (1)–(3) can be found in terms of the spin parameter
S2 = Y ω2/vx2 which represents the ratio of the tangential speed of the ball at the contact
surface to the horizontal speed of the CM immediately after the bounce. If S2 = 1 then
the ball exits the surface in a rolling mode with vx2 = Y ω2 and with vpx2 = 0. In other
words, if S2 = 1 then the contact point on the ball comes to rest on the surface during the
bounce and remains at rest on the surface as the ball bounces off the surface. If the ball
slides throughout the entire bounce then the contact point is still sliding by the end of the
bounce with vpx2 > 0 or with vx2 > Y ω2 and then S2 < 1. If the ball bounces with S2 > 1
then vpx2 < 0, meaning that the contact point is sliding backwards on the surface as the ball
bounces off the surface. The latter condition can be described as an overspinning mode. If
the ball is overspinning then sliding friction acts to accelerate (rather than decelerate) the
ball in the horizontal direction. Overspinning can arise if the ball grips the surface during
the bounce, then loses its grip and starts sliding backwards on the surface due to the release
of elastic energy stored as a result of tangential distortion of the ball or the surface (Cross,
2002; 2010).
7

Substituting ω2 = S2vx2/Y in Equation (3) yields the solution
Io vx2 = Icm Y ω1 +MY 2 vx1 +MXY (vy1 + vy2) (4)
where Io = S2Icm +MY 2. As with the case of a spherical ball, there is no simple analytical
relation that can be used to determine vy2 from the parameters describing the incident ball,
but the ratio vy2/vy1 can be measured experimentally and is typically about 0.6 to 0.8 for a
football, as described in more detail below. Similarly, there is no simple analytical relation
that can be used to determine S2, but S2 can be measured experimentally and varies typically
from about 0.8 to 1.2, depending on factors that are described in more detail below.
Equation (4) shows that the horizontal ball speed and direction after the bounce has
three separate and independent components depending on the magnitude and direction of
(a) the incident ball spin, ω1, (b) the initial horizontal speed, vx1 and (c) the inclination of
the ball on impact. For the conditions of the present experiment, all three components were
of similar magnitude. Any two of the three components can be zero and the ball will still
bounce forward or backward depending on the sign of the third component. For example,
Equation (4) with S2 = 1 provides a good description of the bounce of a football dropped
vertically without spin so that vx1 = 0 and ω1 = 0.
Occasionally, a football incident at an oblique angle will bounce vertically or almost
vertically, with vx2 ≈ 0. Under these conditions, the parameter S2 approaches infinity,
unless ω2 is also very small. Equation (4) remains valid regardless of the value of S2 but it
emphasised that not all bounces are characterised by a value of S2 close to 1.0, even though
the majority are. The exceptional case is one where the signs of ω1, vx1 and X all conspire
to produce a nearly vertical bounce, in which case it is found experimentally that ω2 and
vx2 are both very small.
The main difference between the bounce of a football and a spherical ball is described by
the third term in Equation (4) containing the XY product. This term is zero for a spherical
ball, but it introduces a bias into the bounce of a football in the sense that there is an
additional forward or backward component to the horizontal bounce speed that depends on
the angle of inclination of the ball on impact. For the oval football described in Section 2,
XY has a maximum value of (a2− b2)/2 at φ = 45◦ (regardless of the values of a and b). As
a result, vx2 was found to be a maximum near φ = 45◦ for all bounce conditions studied in
this paper. Furthermore, if vx2 is approximately equal to Y ω2, so that S2 is close to unity,
8

then the rebound spin is also a maximum near φ = 45◦, as observed experimentally for all
bounce conditions.
Another useful parameter describing the bounce of a ball is the ratio of the horizontal
impulse to the vertical impulse, given from Equations (1) and (2) by
COF =∫ F dt∫ N dt
=(vx1 − vx2)
(vy1 + vy2). (5)
The ratio is denoted here by COF to indicate that it is a measure of the average or effective
coefficient of friction during the bounce. If the ball slides throughout the bounce then
F = µN while the ball is in contact with the surface, where µ is the coefficient of sliding
friction, so COF = µ. However, if the contact region of the ball comes to rest during the
bounce period then the ball grips the surface and the subsequent behaviour of the friction
force is determined by the dynamic effects of static friction. Measurements show that the
friction force drops to zero and then reverses direction during the grip phase, in which case
the average friction force during the whole bounce period is less than µN and COF < µ.
Measurements of the COF are shown in Figures 3 and 5–7, indicating that the COF can
even be negative. A negative effective value of COF occurs if the ball bounces forward
with vx2 > vx1. The latter situation can arise if a large reverse static friction force develops
during the bounce. A negative COF can also arise if the incident ball is overspinning,
with Y ω1 > vx1, so that the bottom of the ball slides backward when it first contacts the
ground, even though the ball as a whole is moving forward. Even in the latter situation, the
magnitude of COF is typically less than µ since the contact region of the ball will usually
slide to a stop and then grip the surface.
5. BOUNCE MEASUREMENTS
The football chosen for the present study had a major diameter of 28.6 cm, a minor
diameter of 18.0 cm and a mass of 433 g, slightly fatter (by 1.0 cm) and slightly heavier
(by 10 g) than an American NCAA ball. It was bought as an inexpensive, generic football,
similar in size and weight to balls used in rugby league, rugby union and Australian rules.
The ball had a dimpled surface so that it would be easy to handle, although the actual
surface texture or frictional properties were not regarded as especially significant in this
experiment. A ball with a low coefficient of sliding friction will slide for a longer period of
time than a high friction ball before it grips, but the effective coefficient of friction of the
ball, as defined by Equation 5, was found to be much lower than µ in all cases studied.
9

The ball was filled with air to the recommended pressure of about 32 kPa so that it was
firm and bounced well. The moment of inertia was measured after gluing a light metal tube
to a pointy end so that it could be mounted as a pendulum with an axis coincident with the
pointy end. The period of oscillation was 0.909± 0.002 s, giving a moment of inertia about
a transverse axis through the center of mass, Icm = 0.00385± 0.5% kg.m2.
The ball was projected by hand, from a height of about 1 m, at speeds between 4 and
6 ms−1 onto a concrete floor covered with low pile carpet. Each bounce was filmed at
100 frames/s using a JVC9600 digital video camera with an exposure time of 2 ms. A
standard 25 or 30 frames/s camera would also have been suitable for this experiment but it
would then be more difficult to determine from a given frame whether the ball was about to
bounce or had just bounced. Video clips were transferred to a computer for analysis using
Videopoint software to manually digitise the coordinates of the ball center of mass. The
horizontal speed of the center of mass was determined to within 2% using a linear fit to the
horizontal coordinates, and the vertical speed was determined to within 2% using a parabolic
fit to the vertical coordinates, assuming a vertical acceleration of 9.8 ms−2. The angular
velocity of the ball was also determined to within 2% using a linear fit to the measured
angular displacements of the ball. Bounces were analysed only if the long axis remained
perpendicular to the field of view before and after each bounce, as it did in most cases.
The bounce speed, spin and angle of a football depends on at least four initial parameters.
It depends on the incident speed, spin and angle, and it also depends on the orientation of
the ball at impact. A football has two main axes that can define its orientation with respect
to the incident plane, and it can also spin about three separate axes. However, for the
purposes of the present experiment, the ball was projected so that its long axis remained in
a vertical plane, and it was allowed to spin only about a transverse, horizontal axis. As a
result, the ball remained in the same vertical plane before and after each bounce and the only
relevant spin was either topspin or backspin. A large number of possible combinations of
the four incident parameters was possible, but the present study was restricted to examining
only a small subset of these combinations. The procedure adopted in each case was to vary
the orientation of the ball while keeping the incident speed, spin and angle as constant as
possible, subject to small variations due to the fact that the ball was projected by hand.
Results were obtained for three different angles of incidence (θ1 = 0◦, 20◦, and 50◦) and for
three different values of initial spin (ω1 = 0, +17 rad.s−1 and −17.5 rad.s−1). All bounce
10

results are presented below as functions of the initial angle of inclination, φ, immediately
prior to impact.
As a separate experiment, additional measurements were made to determine F and N
simultaneously using a force plate. Results were obtained for a small number of bounces
of the ball incident on the force plate without spin. The force plate was used previously
to measure F and N for other ball types (Cross, 2002). It consisted of a 340 g wood
block mounted on rollers so that the block could translate freely in the horizontal direction.
A 19 mm diameter piezo disk attached to one end of the block was used an inexpensive
accelerometer to record a voltage signal proportional to the horizontal force on the block.
Two 51 mm square, 4 mm thick piezo elements connected in parallel were attached to the
top of the block to record a voltage signal proportional to the vertical force on the wood
block. The ball was incident directly on the piezo elements. The separate piezo devices were
calibrated in a relative but not absolute sense by dropping a tennis ball onto the top surface
and onto one end surface of the wood block. Results of that calibration procedure were
consistent with an independent calibration obtained by comparing the change in horizontal
and vertical speeds of a tennis ball incident obliquely on the block.
6. VERTICAL DROP RESULTS (θ1 = 0, ω1 = 0)
When a spherical ball is dropped vertically without spin onto a horizontal surface, it
bounces vertically without spin. The only parameter of interest is the coefficient of restitu-
tion (COR), defined as the ratio of the vertical rebound speed to the incident vertical speed.
When an oval football is dropped vertically onto a horizontal surface it can also bounce
vertically without spin, but only if one of the two axes of symmetry is aligned perpendicular
to the surface. Dropped from a height of 1.0 m, the ball landed at a speed of 4.43 ms−1. The
COR for a bounce on the side of the ball (the long axis being horizontal) was found to be
0.82± 0.01. The COR for a bounce on the end of the ball (the long axis being vertical) was
0.75± 0.01. When the long axis was inclined at an angle other than horizontal or vertical,
the ball was observed to bounce sideways with topspin, toward the side to which it was
leaning. Results of such measurements are shown in Figure 3 as a function of the angle of
inclination, φ.
11

0
0.2
0.4
0.6
0.8
1
0 20 40 60 80 100
Velo
city
ratio
s
vv
x2y1
φ (degrees)
COR
(a) Vertical drop θ1 = 0 ω
1 = 0
vv
y2y1
0
10
20
30
40
50
0 20 40 60 80 100
θ2(d
eg)
θ2
ω2
ω2
(rad
/s)
(normalised to vy1 = 4.5 m/s)
ω1 = 0(b) Vertical drop θ
1 = 0
φ (degrees)
0.0
0.2
0.4
0.6
0.8
1.0
1.2
0 20 40 60 80 100
COF
(c) Vertical drop
COF = (Mean F)/(Mean N)
S2
S 2Yω2vx2
=
ω1 = 0θ
1 = 0
φ (degrees)
FIG. 3: Results for a football dropped vertically from a height of 1.0±0.05 m without spin. The ball
bounced to the right, with vx2 > 0, when the ball was inclined to the right (with 0 < φ < 90◦). The
friction force therefore acted to the right, indicating that the contact area commenced sliding to
the left before it gripped the floor. The solid curves are polynomial fits to the data, not theoretical
curves.
Figure 3a shows the three ratios vy2/vy1, COR = vpy2/vpy1, and vx2/vy1 as a function of
the initial impact angle φ. The COR varied smoothly from 0.82 to 0.75 as the impact angle
φ was varied from 0 to 90◦, while the vy2/vy1 ratio dropped to a minimum of 0.6 at about
φ = 50◦. The ratio vx2/vy1 is a measure of the horizontal bounce speed normalised to the
vertical drop speed. Since this ratio had a maximum value of 0.46 at φ = 50◦ and since
12

vy2/vy1 had a minimum value of 0.6 at the same inclination, it is easy to calculate that the
ball bounced at a maximum angle of 37◦ away from the vertical, as indicated in Figure 3b.
The ratio vx2/vy1 is consistent with Equation (4) if allowance is made for the fact that φ
decreased by about 10◦ during each bounce. At high values of φ, excellent agreement is
obtained using S2 = 1 and the value of φ immediately after rather than immediately before
the bounce.
The bounce angle θ2 = tan−1 (vx2/vy2) and the normalised angular velocity ω2 are shown
in Figure 3b as functions of φ. Since ω2 is directly proportional to vy1 at any given φ, and
since vy1 varied slightly from one bounce to the next, the values of ω2 in Figure 3b were
normalised to a common bounce speed vy1 = 4.5 ms−1.
The angular velocity results in Figure 3b appear to be inconsistent with Equations (1)–
(3), being lower than expected at low values of φ and higher than expected at large values
of φ. X and Y are easily calculated from the ball geometry, at least when the assumption
is made that the ball contacts at a single point rather than over an extended region. For
example, when φ = 60◦, X = 4.1 cm and Y = 13.2 cm. Using those values of X and Y ,
together with the measured v components at φ = 60◦, we find from Equation (3) that ω2
should be 6 rad.s−1. The measured value of ω2 was 14 rad.s−1. The discrepancy in this
case can be resolved by assuming that Equations (1)–(3) are indeed valid and that X was
underestimated by 1.0 cm. At other angles of inclination, similar discrepancies between
measured and calculated values of ω2 could also be resolved by a similar or smaller change
in X. A change in Y of about 0.5 cm, due to compression of the ball, has a much smaller
effect on the theoretically expected rotation speed. The sensitivity of ω2 to small changes in
X arises because X is smaller than Y and because the torque due to N in Figure 3 is only
slightly larger than the oppositely directed torque due to F .
Part of the explanation for the increase in the expected value of X can be attributed to
rotation of the ball during the bounce. Rotation from φ = 60◦ to 50◦ during the bounce
would have the effect of increasing X by 0.85 cm. However, the length of the contact
region observed on the video film was typically about 5 or 6 cm. The normal reaction force
was therefore distributed over this length and was not applied at a single contact point.
Furthermore, φ was measured from the video film with a possible error of ±5◦, giving a
measurement error in X of about 0.5 cm. Consequently, the relatively large discrepancies
between the measured and calculated values of ω2 in Figure 3, and also in Figures 5–7, can
13

be attributed to the fact that X could not be measured reliably to an accuracy better than
about ±1 cm.
Figure 3c shows the spin parameter S2 and the effective coefficient of friction, COF,
between the ball and the carpeted floor, defined by the ratio vx2/(vy1 + vy2). There is no
preferred positive x direction when vx1 = 0 so the effective COF can be defined as a positive
number in this special case, unlike the more general definition given by Equation (5). S2
is approximately 1.0 for most angles of inclination, indicating that the ball grips or rolls
during the bounce. The COF is an effective coefficient of friction averaged over the whole
bounce period, rather than the actual coefficient of sliding friction, µ. When S2 = 1, ω1 = 0
and vx1 = 0, it can be shown from Equations (1)-(5) that COF = MXY/Io which has a
maximum value of 0.27 at φ = 45◦, essentially as observed.
The fact that the maximum value of the observed COF was only about 0.3 provides one
indication that the ball did not slide throughout the impact period. A value of µ ≈ 0.3
would indicate a relatively slippery surface, whereas the ball was dimpled to provide a
good frictional grip for the player, and the carpet itself was not slippery. Furthermore, the
observed COF was even lower than 0.3 at other angles of inclination of the ball. One possible
explanation is that the friction force may have dropped to zero during the bounce if the ball
commenced to roll on the carpet at some point in time. However, direct observation of the
friction force (shown in Figure 4a) revealed that F did not drop to zero until the end of the
bounce period, at least for a vertical drop without spin.
7. DIRECT MEASUREMENTS OF F AND N
Figure 4a shows a measurement of F and N vs time for a vertical drop onto the force
plate when φ = 50◦. The force plate was linear but uncalibrated, so the N and F values
are given in arbitrary units. However, the relative amplitudes of the waveforms are scaled
in proportion to the measured change in speed of the ball in the vertical and horizontal
directions. Figures 4b–d show corresponding measurements of N and F for a ball incident
at θ1 = 22◦ without spin at three different angles of inclination, φ. The results show that
the impact duration was 15.0±0.5 ms for all conditions of interest in this experiment, apart
from one interesting exception shown in Figure 7f where the impact duration was about
65 ms. The results in Figure 4 show also that the variation of N with time is similar for all
bounces but the variation of F with time depends strongly on the angle of incidence and
14

orientation of the ball.
0
20
40
60
80
100
0 5 10 15
N an
d F
(arb
itrar
y un
its)
t (ms)
N
F
Verticaldrop
Ball bouncedto the RIGHT
(a)
-40
-20
0
20
40
60
80
100
0 5 10 15t (ms)
N &
F (a
rbitr
ary
units
)
N
FBall bouncedto the RIGHT
(b)
-20
0
20
40
60
80
100
0 5 10 15
N &
F (a
rbitr
ary
units
)
t (ms)
N
FBall bouncedto the RIGHT
(c)
0
20
40
60
80
100
0 5 10 15
N &
F (a
rbitr
ary
units
)
t (ms)
N
F
Ball bounced to the LEFT
(d)
FIG. 4: Measured waveforms of N and F for (a) a vertical drop without initial spin and (b)–(d) a
ball incident at θ1 = 22◦ without spin at three different angles of inclination, φ. The inset in each
graph shows the positive directions of F and N acting on the ball. During the first 4 ms, F acted
to the right in (a) and to the left in (b)–(d). The defined positive direction of F was reversed in
(b)–(d) to show more clearly that F/N is approximately 1.0 at the start of the bounce, indicating
that µ = 1.0± 0.05. The point at which F/N drops below 1.0 marks the start of the grip phase.
Figure 4a indicates that F is directly proportional to N throughout the bounce, although
the F/N ratio is lower than one would expect for pure sliding. Given that the ball was
incident vertically without any horizontal velocity component at the point of contact, a
sliding phase is not expected in this situation. A similar situation arises if a long, slender
object rests on a table and is allowed to fall from a near vertical position. The bottom end
will slide backward if the coefficient of sliding friction is low, but if the coefficient of friction
is larger than about 0.4 then the bottom end grips the table and the object pivots without
15

sliding (Cross, 2006).
By contrast, Figures 4b–d all show an initial sliding phase, with F/N = 1.0 ± 0.05,
when the ball is projected at finite horizontal speed. After the ball grips the surface, F
decreases to zero and then reverses direction in (b) and (c). In Figure 4b, the reversal in
F was sufficiently large that the ball bounced forward with a greater horizontal speed after
the bounce than it had before the bounce, ie with vx2 > vx1. In Figure 4c, the time average
value of F remained positive so the ball bounced forward with vx2 < vx1. In Figure 4d,
F remained relatively large and positive throughout the bounce, with the result that ball
bounced backward.
The reversal in the direction of F indicates that the contact region of the ball is subject
to a backward directed force from the rest of the ball and that the contact surface reacts by
pushing the ball forward. Given that (a) the contact region remains at rest while the ball
grips the contact surface and (b) the rest of the ball rotates throughout the bounce, the origin
of the backward directed force can be attributed to the combined effects of compression and
rotation of the ball. A ball that is simply rolling at constant speed is not subject to a
significant friction force, even though the contact region is at rest. In the case of a bouncing
ball, material rotating into the surface at the leading edge of the contact region encounters
other material that is at rest and therefore exerts a backward force on the material that is at
rest. Furthermore, new material coming to rest at the leading edge of the ball is compressed
by the increasing normal reaction force and expands against material already at rest. Since
the ball rotates into the surface at the leading edge, and out of the surface at the trailing
edge, the normal reaction force at the leading edge is greater than that at the trailing edge.
Multiple reversals in the direction of F indicate that the ball undergoes vibrations in
a direction parallel to the impact surface at a frequency that is higher than the vibration
frequency in a direction perpendicular to the surface. The period of vibration in the per-
pendicular direction is about 30 ms, given that the impact duration or half period is 15 ms,
and is determined by the mass of the whole ball and the stiffness of the ball in a direction
perpendicular to the ball surface. The result in Figure 4c suggests that the pointed tip of
the ball is relatively light and/or stiff and that it vibrates locally at a higher frequency than
the contact region of the ball in Figure 4b or 4d.
16

8. OBLIQUE BOUNCE WITHOUT INITIAL SPIN
Figure 5 shows results obtained when the ball was projected without spin at an angle
θ1 = 22◦±3◦. The ball bounced forward with topspin for inclination angles−15◦ < φ < 100◦,
and it bounced backward at inclination angles 110◦ < φ < 165◦. Backward bounces occured
at relatively low horizontal speed and low rotation speed but the ball bounced 2 or 3 times
higher than it did when it bounced forward. The high, backward bounce is the one used by
players when running with the ball in Australian rules football. The actual direction of spin
reversed when the ball bounced backward so the ball bounced backward with topspin.
-1.0
-0.5
0.0
0.5
1.0
1.5
2.0
0 50 100 150 200
vx2vx1
vy2vy1
COR
Velo
city
ratio
s
Ball bouncesbackward
vy2vy1
vx1 vx2
(a) Throw w/out spin ω 1 = 0θ1 = 220
φ (degrees)
-40
-20
0
20
40
60
0 50 100 150 200
θ2
(deg
rees
)θ1 θ 2
φ (degrees)
(b) Throw w/out spin ω 1 = 0θ1 = 220
Ball bouncesforward withtopspin
Ball bouncesbackward withtopspin
-10
-5
0
5
10
15
20
25
30
0 50 100 150 200
ω2
(rad
/s)
(normalised to vy1 = 4.5 m/s)
(c) Throw w/out spin ω 1 = 0θ1 = 220
φ (degrees)
Ball bouncesforward withtopspin
-0.5
0.0
0.5
1.0
1.5
2.0
0 50 100 150 200
COF COF = Mean F
Mean N
S 2
(d) Throw w/out spin ω 1 = 0θ1 = 220
φ (degrees)
S 2
FIG. 5: Bounce results for a football thrown obliquely at θ1 = 22◦ without spin. Each data point
represents a single bounce. The solid curves are polynomial fits to the data.
When the ball bounced forward, the horizontal speed after the bounce was generally
higher than the incident horizontal speed and the vertical bounce height was relatively low.
The negative COF shown in Figure 4d when 15◦ < φ < 95◦ arises because vx2 > vx1,
17

consistent with the measured F result shown in Figure 4b. Sliding friction slows the ball for
the first few ms of the bounce, but the reversal in direction of the static friction force acts
to accelerate the ball during the remainder of the bounce.
At φ ≈ 110◦ the ball bounced vertically upward with zero spin. S2 is undefined in this case
and is subject to large measurement errors when vx2 is very small. The large spread in S2
data values around φ ∼ 110◦ in Figure 5d is probably a reflection of the large measurement
errors rather a real effect where S2 approaches infinity. All other bounce parameters were
well behaved as vx2 approached zero.
The results in Figure 5 can be interpreted in simplified terms as being the same as those
for a spherical ball of the same mass and COR, but with the additional strong bias in all
bounce parameters given by the results in Figure 3. For example, a spherical ball incident
without spin in a direction from left to right will bounce to the right with topspin. An oval
football incident in this manner bounces at a greater horizontal speed and at a higher spin
rate than a spherical ball if it is inclined forward, and with a smaller horizontal speed and
smaller rate of spin if it is inclined backward. If one assumes that a football loses the same
or a similar amount of kinetic energy when it bounces, regardless of its angle of inclination,
then a consequence of the increased forward horizontal bounce speed and rate of spin will be
a reduction in bounce height, as observed. Conversely, the ball bounces to a greater height
when it bounces backward due to the reduced horizontal bounce speed and spin rate. In
fact, the ratio of total kinetic after the bounce to that before the bounce varied from 0.57
(at φ = 100◦) to 0.74 (at φ = 50◦), the lowest energy losses occuring when the ball bounced
forward.
9. OBLIQUE BOUNCE WITH INITIAL BACKSPIN
Figure 6 shows results obtained when the ball was projected with backspin at an angle
θ1 = 20◦ ± 3◦ and with ω1 = −17.5 ± 2.0 rad.s−1. In this case the ball bounced forward
with topspin when it was leaning forward on impact (ie 0 < φ < 90◦) and it bounced
backward with topspin when it was leaning backward (ie 90◦ < φ < 180◦). Compared with
the results in Figure 5, the ball bounced further back toward the thrower, at smaller θ2 when
0 < φ < 90◦ and at larger θ2 when 90◦ < φ < 180◦, and it bounced at smaller ω2 when it
bounced forward and at larger ω2 when it bounced backward. As a result, the maximum
bounce speed, spin and height was approximately the same for both forward and backward
18

directed bounces.
Backward bounces had the unexpected property that the COR was close to or greater
than 1.0. A slightly lower COR is calculated if one corrects for the small reduction in φ
during the bounce, but the COR still remains close to or greater than 1.0. A possible
explanation is that a backward bounce results in a significant horizontal stretch of the ball
after it grips the surface, and that the ball receives an additional vertical impulse toward
the end of the impact as the ball springs back to its normal shape. In that manner, kinetic
energy associated with horizontal motion of the ball could be channeled into vertical motion.
-1.5
-1.0
-0.5
0.0
0.5
1.0
1.5
2.0
0 50 100 150 200
Velo
city
ratio
s
COR
vy2vy1
vx2vx1
(a) θ1 = 20o ω1 = -17.5 rad/s
Backwardbounce
φ (degrees)
-50
0
50
0 50 100 150 200
(deg
rees
)θ
2
φ (degrees)
(b) θ1 = 20o ω1 = -17.5 rad/s
Forwardbounce
Backward bounce
-15
-10
-5
0
5
10
15
20
0 50 100 150 200
(rad
/s)
ω2
(c) θ1 = 20o ω1 = -17.5 rad/s
Forwardbounce
withtopspin
Backward bounce
withtopspin
φ (degrees)
-0.5
0.0
0.5
1.0
1.5
0 50 100 150 200
COF
S2
S2
S2
(d) θ1= 20o ω1 = -17.5 rad/s
φ (degrees)
COF
FIG. 6: Bounce results for a football thrown obliquely at θ1 = 20◦ with backspin. The ball bounced
with topspin in all cases, as shown by the insert in (c). The solid curves are polynomial fits to the
data.
10. OBLIQUE BOUNCE WITH INITIAL TOPSPIN
Figure 7 shows results when the ball was projected with topspin at an angle θ1 = 50◦±3◦
and with ω1 = 17.0 ± 2.0 rad.s−1. In this case the ball bounced forward with topspin
19

regardless of the angle of inclination at impact, φ, but the bounce height varied strongly
with φ. As shown in Figure 7a, vy2 varied from zero when 20◦ < φ < 60◦ to about 1.4vy1
when 120◦ < φ < 170◦.
-0.5
0.0
0.5
1.0
1.5
-50 0 50 100 150 200
&
COR
COR
y2v
vy1
y2v
vy1
φ (degrees)
ω1 = 17 rad/sθ = 50o1(a)
0.0
0.2
0.4
0.6
0.8
1.0
1.2
-50 0 50 100 150 200
x2v
vx1
ω1 = 17 rad/sθ = 50o1(b)
φ (degrees)
0
20
40
60
80
100
-50 0 50 100 150 200
(deg
rees
)θ
2
φ (degrees)
ω1 = 17 rad/sθ = 50o1(c)
0.5
1.0
1.5
2.0
2.5
3.0
3.5
-50 0 50 100 150 200
ω1 = 17 rad/sθ = 50o1(d)
ω2ω
1
φ (degrees)
-0.2
0.0
0.2
0.4
0.6
0.8
1.0
1.2
1.4
-50 0 50 100 150 200
COF
S2
ω1 = 17 rad/sθ = 50o1(e)
COF
φ (degrees)
S2
(f) ω1 = 17 rad/sθ = 50o1
FIG. 7: Bounce results for a football thrown obliquely at θ1 = 50◦ with topspin. When 20◦ < φ <
60◦ the ball rolled forward for about 50 ms before bouncing off the floor, as indicated in (f). The
solid curves are polynomial fits to the data.
20

When the ball landed with a forward tilt it rolled forward onto its top end before bouncing
upward, as indicated in Figure 7f. Despite the fact that the impact duration was 15 ms for
all other bounces, the ball rolled along the floor for an additional 50 ms before it bounced
upwards so the total impact duration was about 65 ms. However, the ball sometimes bounced
forward through the air at essentially zero vertical speed and then bounced upward as the
top end spun around to impact the floor. The results shown in Figure 7a with vy2/vy1 = 0
are those pertaining to the initial low roll or bounce, not the subsequent high bounce that
followed 50 ms after the initial bounce.
When the ball landed with a forward tilt, the ball bounced or rolled forward with only
a small loss (and sometimes a small gain) in horizontal speed, a large increase in rate of
spin, a low COR, and zero or very small bounce height. The ratio of total kinetic after the
bounce to that before the bounce was typically about 0.85 to 0.90. When the ball landed
with a backward tilt, the ball bounced forward to a relative large height, with a large loss
in horizontal speed, and a relatively small positive or negative change in rate of topspin.
The ratio of total kinetic after the bounce to that before the bounce was typically about
0.7. These effects are qualitatively consistent with expectations. When the ball lands with
a forward tilt, the normal reaction force acts behind the ball CM and combines with the
backward directed friction force to generate a large torque on the ball. The top end swings
downward rapidly resulting in the ball entering a rolling mode. When the ball lands with a
backward tilt the normal reaction force acts ahead of the CM and generates a torque that
opposes the torque due to the backward directed friction force. Depending on the angle of
inclination when the ball impacts the floor, the ball can therefore bounce with either no
change in spin or with only a small change in spin.
11. CONCLUSIONS
Anyone who has watched or played a game of football will have noticed that the bounce
of the ball tends to be erratic. The bounce is governed by the same laws of mechanics
that determine the bounce of a spherical ball, but the orientation of a spherical ball is
normally irrelevant. The unpredictable bounce of a football is due to random variations in
its orientation on impact. The angle of inclination introduces a strong bias in all bounce
parameters for a football since the line of action of the normal reaction force, and hence
the torque on the ball, depends on the ball inclination at impact. The additional bias can
21
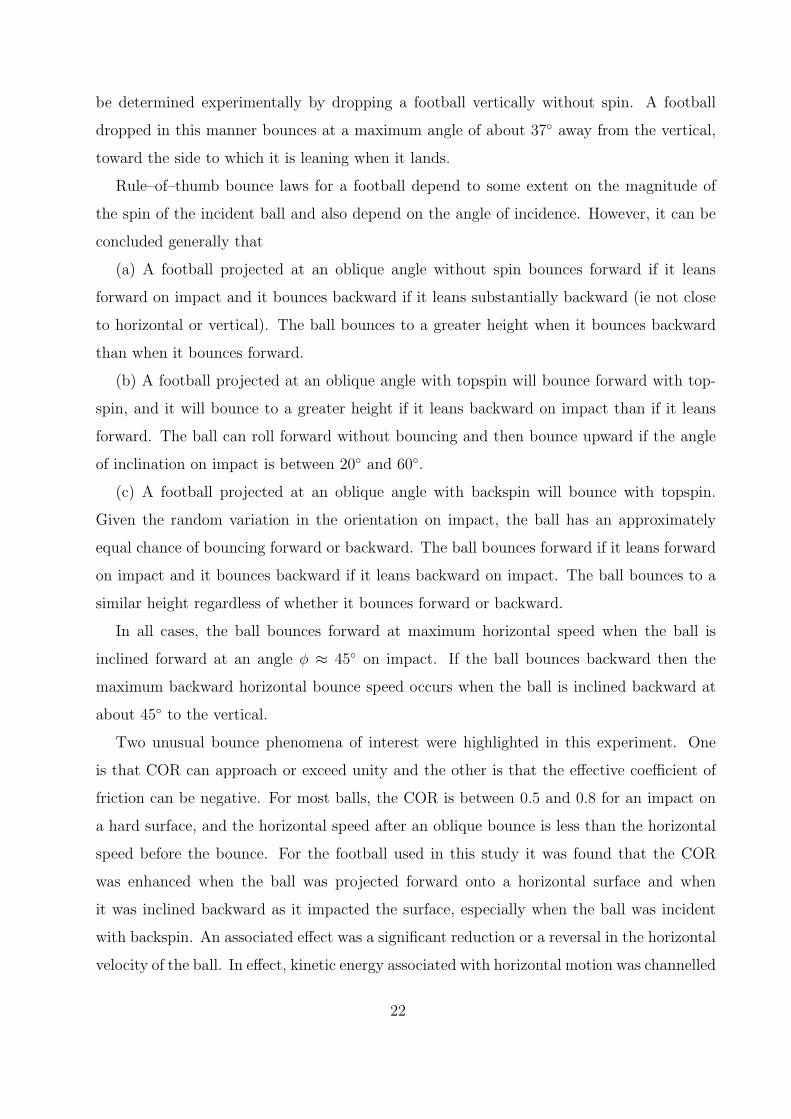
be determined experimentally by dropping a football vertically without spin. A football
dropped in this manner bounces at a maximum angle of about 37◦ away from the vertical,
toward the side to which it is leaning when it lands.
Rule–of–thumb bounce laws for a football depend to some extent on the magnitude of
the spin of the incident ball and also depend on the angle of incidence. However, it can be
concluded generally that
(a) A football projected at an oblique angle without spin bounces forward if it leans
forward on impact and it bounces backward if it leans substantially backward (ie not close
to horizontal or vertical). The ball bounces to a greater height when it bounces backward
than when it bounces forward.
(b) A football projected at an oblique angle with topspin will bounce forward with top-
spin, and it will bounce to a greater height if it leans backward on impact than if it leans
forward. The ball can roll forward without bouncing and then bounce upward if the angle
of inclination on impact is between 20◦ and 60◦.
(c) A football projected at an oblique angle with backspin will bounce with topspin.
Given the random variation in the orientation on impact, the ball has an approximately
equal chance of bouncing forward or backward. The ball bounces forward if it leans forward
on impact and it bounces backward if it leans backward on impact. The ball bounces to a
similar height regardless of whether it bounces forward or backward.
In all cases, the ball bounces forward at maximum horizontal speed when the ball is
inclined forward at an angle φ ≈ 45◦ on impact. If the ball bounces backward then the
maximum backward horizontal bounce speed occurs when the ball is inclined backward at
about 45◦ to the vertical.
Two unusual bounce phenomena of interest were highlighted in this experiment. One
is that COR can approach or exceed unity and the other is that the effective coefficient of
friction can be negative. For most balls, the COR is between 0.5 and 0.8 for an impact on
a hard surface, and the horizontal speed after an oblique bounce is less than the horizontal
speed before the bounce. For the football used in this study it was found that the COR
was enhanced when the ball was projected forward onto a horizontal surface and when
it was inclined backward as it impacted the surface, especially when the ball was incident
with backspin. An associated effect was a significant reduction or a reversal in the horizontal
velocity of the ball. In effect, kinetic energy associated with horizontal motion was channelled
22

into vertical motion. The origin of this effect was not determined but is possibly associated
with a change in shape of the ball during the bounce. If a ball stretches in a horizontal
direction and then regains its shape, it can exert a vertical force on the impact surface by
elongating in the vertical direction.
Negative effective COF values were observed when the ball was incident obliquely without
spin or with backspin and when it was inclined forward on impact. Under these conditions,
the horizontal speed after the bounce was greater than the horizontal speed before the
bounce. It was established that this result was due to a reversal in the direction of the
friction force acting on the ball, associated with the fact that the ball gripped the impact
surface after an initial sliding phase.
REFERENCES
Brody H. (1984). That’s how the ball bounces. The Physics Teacher, 22, 494–497.
Brody H,, Cross R., & Lindsey C. (2002). The Physics and Technology of Tennis. Solana
Beach, CA: Racquet Tech Publishing.
Cross R. (2002). Grip–slip behaviour of a bouncing ball. American Journal of Physics,
70, 1093-1102.
Cross R. (2005). Bounce of a spinning ball near normal incidence. American Journal of
Physics, 73, 914–920.
Cross R. (2006). The fall and bounce of pencils and other elongated objects. American
Journal of Physics, 74, 26–30.
Cross, R. (2010). Impact of a ball on a surface with tangential compliance. American
Journal of Physics, 78, 716-720.
Garwin R. (1969). Kinematics of an ultraelastic rough ball. American Journal of Physics,
37, 88–92.
Nathan A. (2003). Characterising the performance of baseball bats. American Journal
of Physics, 71, 134–143.
23

Figure captions
Figure 1. A football incident at angular velocity ω impacts a horizontal surface at an
angle of inclination φ. In the diagram, the ball is incident from the left, φ is about +30◦ and
the ball is pointing or leaning forward. Experimental results are presented over the range
0 < φ < 180◦. The point on the ball in contact with the surface rotates at speed Rω relative
to the centre of mass (CM), with velocity components v‖ = Y ω and v⊥ = Xω relative to
the CM.
Figure 2. A football incident at angle θ1 to the vertical bounces at angle θ2. The horizontal
friction force, F , and the normal reaction force, N , act through the contact point. CM is
the centre of mass of the ball.
Figure 3. Results for a football dropped vertically from a height of 1.0± 0.05 m without
spin. The ball bounced to the right, with vx2 > 0, when the ball was inclined to the right
(with 0 < φ < 90◦). The friction force therefore acted to the right, indicating that the
contact area commenced sliding to the left before it gripped the floor. The solid curves are
polynomial fits to the data, not theoretical curves.
Figure 4. Measured waveforms of N and F for (a) a vertical drop without initial spin and
(b)–(d) a ball incident at θ1 = 22◦ without spin at three different angles of inclination, φ.
The inset in each graph shows the positive directions of F and N acting on the ball. During
the first 4 ms, F acted to the right in (a) and to the left in (b)–(d). The defined positive
direction of F was reversed in (b)–(d) to show more clearly that F/N is approximately 1.0
at the start of the bounce, indicating that µ = 1.0 ± 0.05. The point at which F/N drops
below 1.0 marks the start of the grip phase.
Figure 5. Bounce results for a football thrown obliquely at θ1 = 22◦ without spin. Each
data point represents a single bounce. The solid curves are polynomial fits to the data.
Figure 6. Bounce results for a football thrown obliquely at θ1 = 20◦ with backspin. The
ball bounced with topspin in all cases, as shown by the insert in (c). The solid curves are
polynomial fits to the data.
Figure 7. Bounce results for a football thrown obliquely at θ1 = 50◦ with topspin. When
20◦ < φ < 60◦ the ball rolled forward for about 50 ms before bouncing off the floor, as
24

indicated in (f). The solid curves are polynomial fits to the data.
∗ Electronic address: [email protected]
25