Embed Size (px)
Citation preview
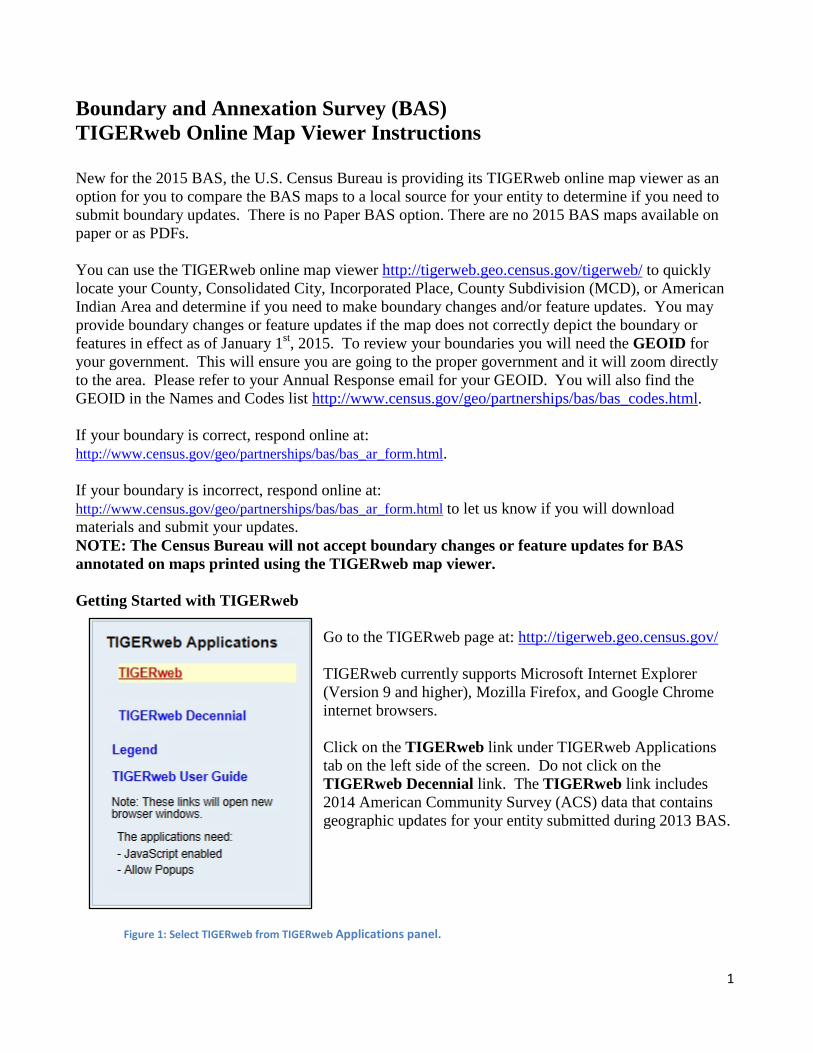
Boundary and Annexation Survey (BAS) TIGERweb Online Map Viewer Instructions New for the 2015 BAS, the U.S. Census Bureau is providing its TIGERweb online map viewer as an option for you to compare the BAS maps to a local source for your entity to determine if you need to submit boundary updates. There is no Paper BAS option. There are no 2015 BAS maps available on paper or as PDFs. You can use the TIGERweb online map viewer http://tigerweb.geo.census.gov/tigerweb/ to quickly locate your County, Consolidated City, Incorporated Place, County Subdivision (MCD), or American Indian Area and determine if you need to make boundary changes and/or feature updates. You may provide boundary changes or feature updates if the map does not correctly depict the boundary or features in effect as of January 1st, 2015. To review your boundaries you will need the GEOID for your government. This will ensure you are going to the proper government and it will zoom directly to the area. Please refer to your Annual Response email for your GEOID. You will also find the GEOID in the Names and Codes list http://www.census.gov/geo/partnerships/bas/bas_codes.html. If your boundary is correct, respond online at: http://www.census.gov/geo/partnerships/bas/bas_ar_form.html. If your boundary is incorrect, respond online at: http://www.census.gov/geo/partnerships/bas/bas_ar_form.html to let us know if you will download materials and submit your updates. NOTE: The Census Bureau will not accept boundary changes or feature updates for BAS annotated on maps printed using the TIGERweb map viewer. Getting Started with TIGERweb
Go to the TIGERweb page at: http://tigerweb.geo.census.gov/ TIGERweb currently supports Microsoft Internet Explorer (Version 9 and higher), Mozilla Firefox, and Google Chrome internet browsers. Click on the TIGERweb link under TIGERweb Applications tab on the left side of the screen. Do not click on the TIGERweb Decennial link. The TIGERweb link includes 2014 American Community Survey (ACS) data that contains geographic updates for your entity submitted during 2013 BAS.
Figure 1: Select TIGERweb from TIGERweb Applications panel.
1

The TIGERweb application offers the ability to view: Roads, highways, and railroads Rivers, lakes, streams and other “single-line” drainage Boundaries for legal and statistical geographic entities Selected special land use areas such as military reservations and national parks Satellite imagery
After opening TIGERweb, you will see the map display and navigation tools, layers panel, and map vintage.
Figure 2: TIGERweb opening screen showing Map Display, Layers panel, Vintage, and Navigation tools.
2
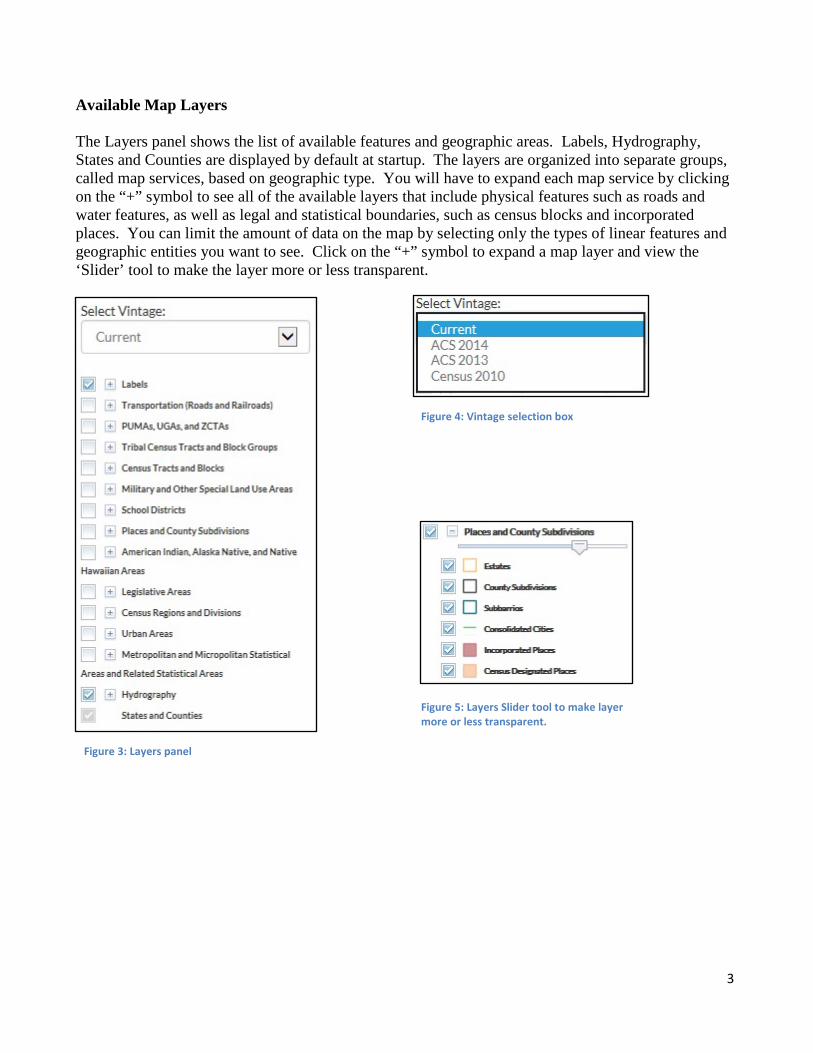
Available Map Layers The Layers panel shows the list of available features and geographic areas. Labels, Hydrography, States and Counties are displayed by default at startup. The layers are organized into separate groups, called map services, based on geographic type. You will have to expand each map service by clicking on the “+” symbol to see all of the available layers that include physical features such as roads and water features, as well as legal and statistical boundaries, such as census blocks and incorporated places. You can limit the amount of data on the map by selecting only the types of linear features and geographic entities you want to see. Click on the “+” symbol to expand a map layer and view the ‘Slider’ tool to make the layer more or less transparent.
Figure 3: Layers panel
Figure 4: Vintage selection box
Figure 5: Layers Slider tool to make layer more or less transparent.
3

Selecting a Map Layer The ‘Select Vintage’ dropdown in the Layers panel shows the vintages of 2014 ACS TIGERweb geography that are available for display in the application. Select Current, if not already selected, to view the geographic updates for your entity submitted during BAS 2013. Click on the ‘+’ symbol next to each map service in the Layers panel to expand the map service and view the layers within it. Click on the small boxes (check/uncheck) to select the Transportation, Places and County Subdivisions, and American Indian map layers. Move Around/Zoom In/Zoom Out of Map Display
You will notice the features and geographic areas contained in the map services do not immediately appear. This is because each layer has a range of zoom levels at which it will display. In other words, visibility is scale dependent. As you zoom in on the map, more details will appear. You can use the ‘Zoom In’ scrollbar tool located on the vertical Scale Bar to zoom in to see more detail on the map or zoom out to see less detail. Click on the “+” to zoom in for more detail or click on the “-“ to zoom out for less detail. You can also zoom in or out using by rolling the wheel on your computer mouse. At Zoom level 5, American Indian Areas begin to appear; at Zoom level 9, Places appear; and at Zoom level 10, Roads and Railroads appear. The current Zoom level is shown on the scale
bar in the lower left of the Map display. TIGERweb Symbology Click on the ‘Legend’ tool at the top of the screen to view the symbology used for each layer.
Figure 6: Transportation, Places, and American Indian Areas layers are selected.
4
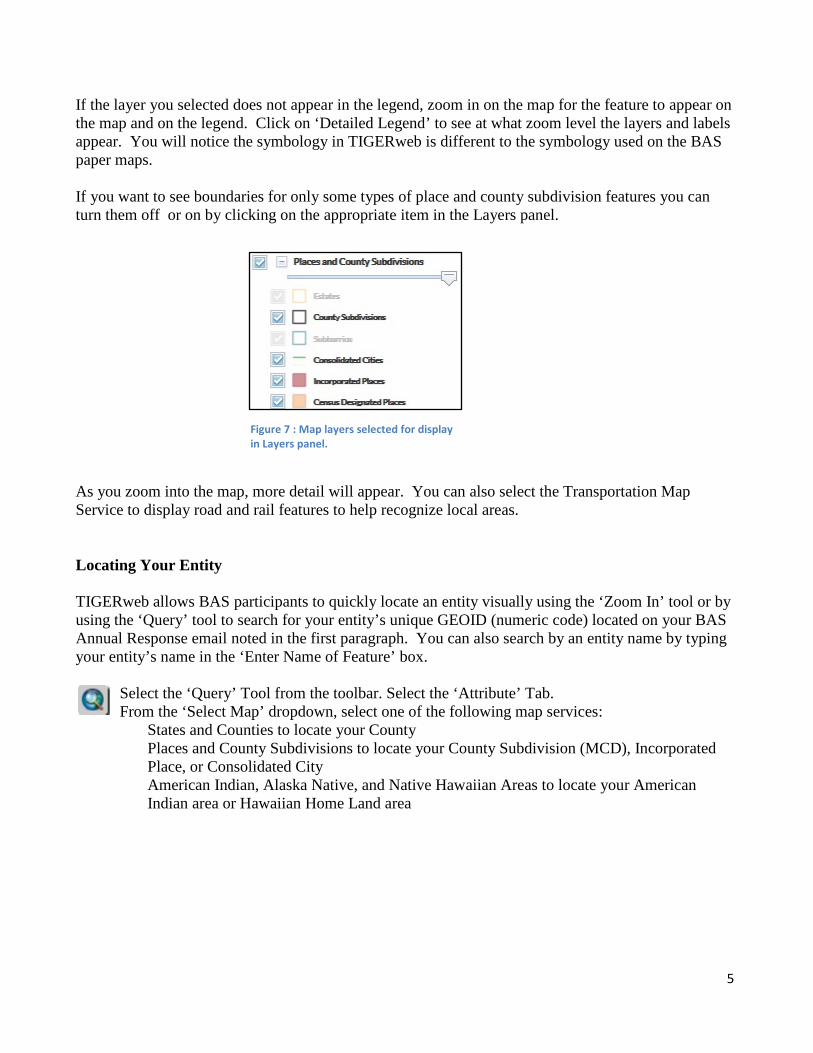
If the layer you selected does not appear in the legend, zoom in on the map for the feature to appear on the map and on the legend. Click on ‘Detailed Legend’ to see at what zoom level the layers and labels appear. You will notice the symbology in TIGERweb is different to the symbology used on the BAS paper maps. If you want to see boundaries for only some types of place and county subdivision features you can turn them off or on by clicking on the appropriate item in the Layers panel.
As you zoom into the map, more detail will appear. You can also select the Transportation Map Service to display road and rail features to help recognize local areas. Locating Your Entity TIGERweb allows BAS participants to quickly locate an entity visually using the ‘Zoom In’ tool or by using the ‘Query’ tool to search for your entity’s unique GEOID (numeric code) located on your BAS Annual Response email noted in the first paragraph. You can also search by an entity name by typing your entity’s name in the ‘Enter Name of Feature’ box.
Select the ‘Query’ Tool from the toolbar. Select the ‘Attribute’ Tab. From the ‘Select Map’ dropdown, select one of the following map services:
States and Counties to locate your County Places and County Subdivisions to locate your County Subdivision (MCD), Incorporated Place, or Consolidated City American Indian, Alaska Native, and Native Hawaiian Areas to locate your American Indian area or Hawaiian Home Land area
Figure 7 : Map layers selected for display in Layers panel.
5

Use the Query examples shown below to locate your own entity. Searching by unique GEOID will take you directly to your entity.
Example for locating a County, using Cullman County, Alabama - GEOID 01043.
1. Select the ‘Query’ tool. 2. From the ‘Select Map’ dropdown, select States and Counties. 3. From the ‘Select Layer(s)’ dropdown, select Counties. 4. Enter the GEOID for your County in the ‘GEOID’ field. 5. Click ‘SUBMIT’ to search for your County.
Figure 8: Query tool.
Figure 9: Using Query tool to locate a County by its unique GEOID.
6

TIGERweb displays the result(s) of the query under the ‘Task Results’ tab to the left of the map. Click on the name of the entity listed under the ‘Counties’ heading of Query Results and TIGERweb will display the entity highlighted in the center of the map display. TIGERweb also displays the ‘Info’ window containing attribute data for the entity. Minimize or close the ‘Info’ window by clicking on the ‘-‘ or ‘x’ symbols in the top right of the ‘Info’ window.
Figure 10: Query found Cullman County, Alabama, using its unique GEOID.
Figure 11: Info window with attribute data.
7
To start a new Query, click ‘Clear Map’ on the navigation toolbar above the ‘Zoom-In’ scrollbar. The located entity is no longer highlighted.
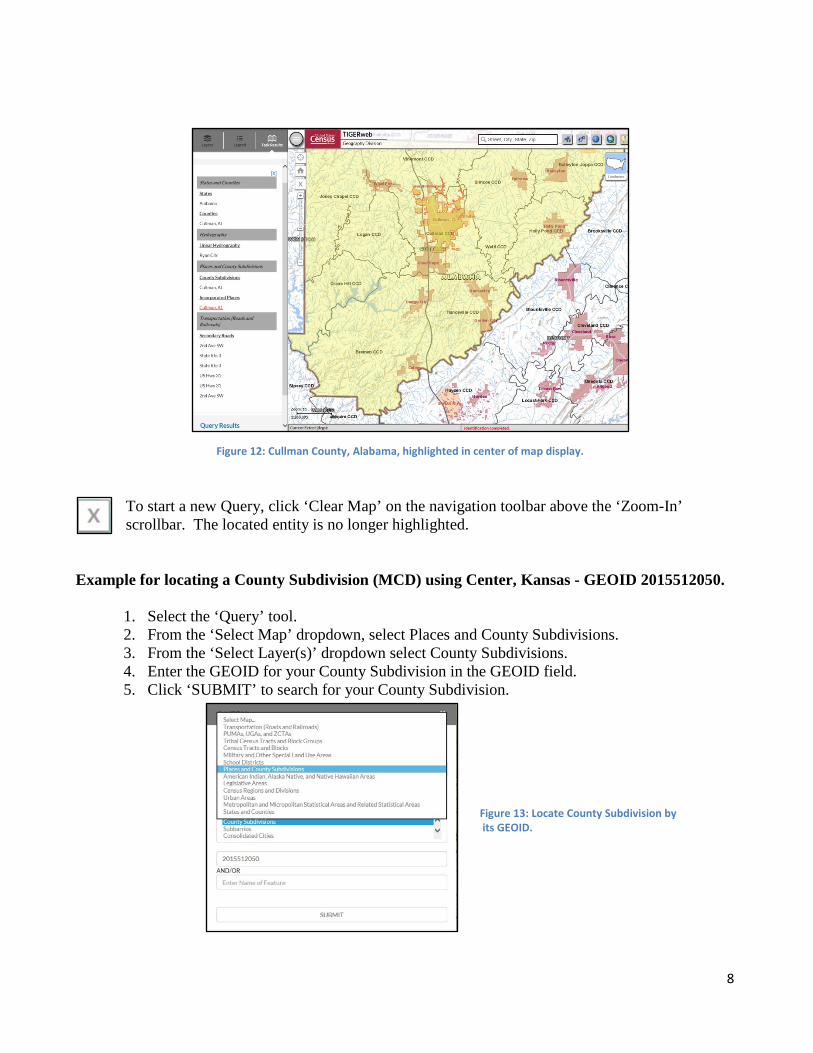
Example for locating a County Subdivision (MCD) using Center, Kansas - GEOID 2015512050.
1. Select the ‘Query’ tool. 2. From the ‘Select Map’ dropdown, select Places and County Subdivisions. 3. From the ‘Select Layer(s)’ dropdown select County Subdivisions. 4. Enter the GEOID for your County Subdivision in the GEOID field. 5. Click ‘SUBMIT’ to search for your County Subdivision.
Figure 12: Cullman County, Alabama, highlighted in center of map display.
Figure 13: Locate County Subdivision by its GEOID.
8

After clicking on the name under ‘Query Results’, TIGERweb displays the located entity highlighted in the center of the map display, along with the ‘Info’ window containing attribute data for the entity. Minimize or close the ‘Info’ window to view the entire map and Query Results box. Example for locating a Consolidated City using Milford, Connecticut - GEOID 0947500.
1. Select the ‘Query’ tool. 2. From the ‘Select Map’ dropdown, select Places and County Subdivisions. 3. From the ‘Select Layer(s) dropdown, select Consolidated Cities. 4. Enter the GEOID for your Consolidated City in the GEOID field. 5. Click ‘SUBMIT’ to search for your Consolidated City.
Figure 14: County Subdivision located using its GEOID.
Figure 15: Locate Consolidated City by its GEOID.
9

After clicking on the name under ‘Query Results’, TIGERweb displays the located entity highlighted in the center of the map display, along with the ‘Info’ window containing attribute data for the entity. Minimize or close the ‘Info’ window to view the entire map and Query Results box.
The highlighted map of Milford appears cluttered because other layers such as Transportation, Incorporated Places and Census Designated Places are also displayed. You can de-select layers you do not need to view by clicking the small box next to the map service in the Layers panel.
Figure 16: Consolidated City located using its GEOID.
Figure 17: Milford area more clearly depicted with Transportation, Incorporated Places and CDPs de-selected.
10
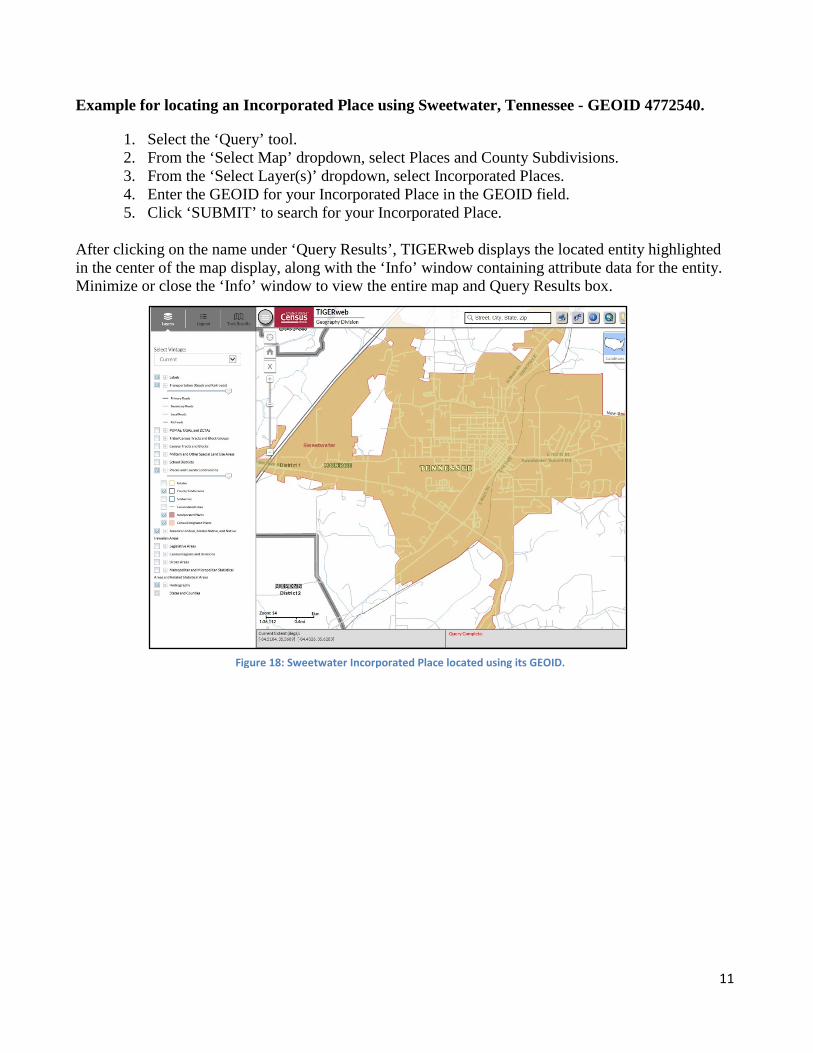
Example for locating an Incorporated Place using Sweetwater, Tennessee - GEOID 4772540.
1. Select the ‘Query’ tool. 2. From the ‘Select Map’ dropdown, select Places and County Subdivisions. 3. From the ‘Select Layer(s)’ dropdown, select Incorporated Places. 4. Enter the GEOID for your Incorporated Place in the GEOID field. 5. Click ‘SUBMIT’ to search for your Incorporated Place.
After clicking on the name under ‘Query Results’, TIGERweb displays the located entity highlighted in the center of the map display, along with the ‘Info’ window containing attribute data for the entity. Minimize or close the ‘Info’ window to view the entire map and Query Results box.
Figure 18: Sweetwater Incorporated Place located using its GEOID.
11
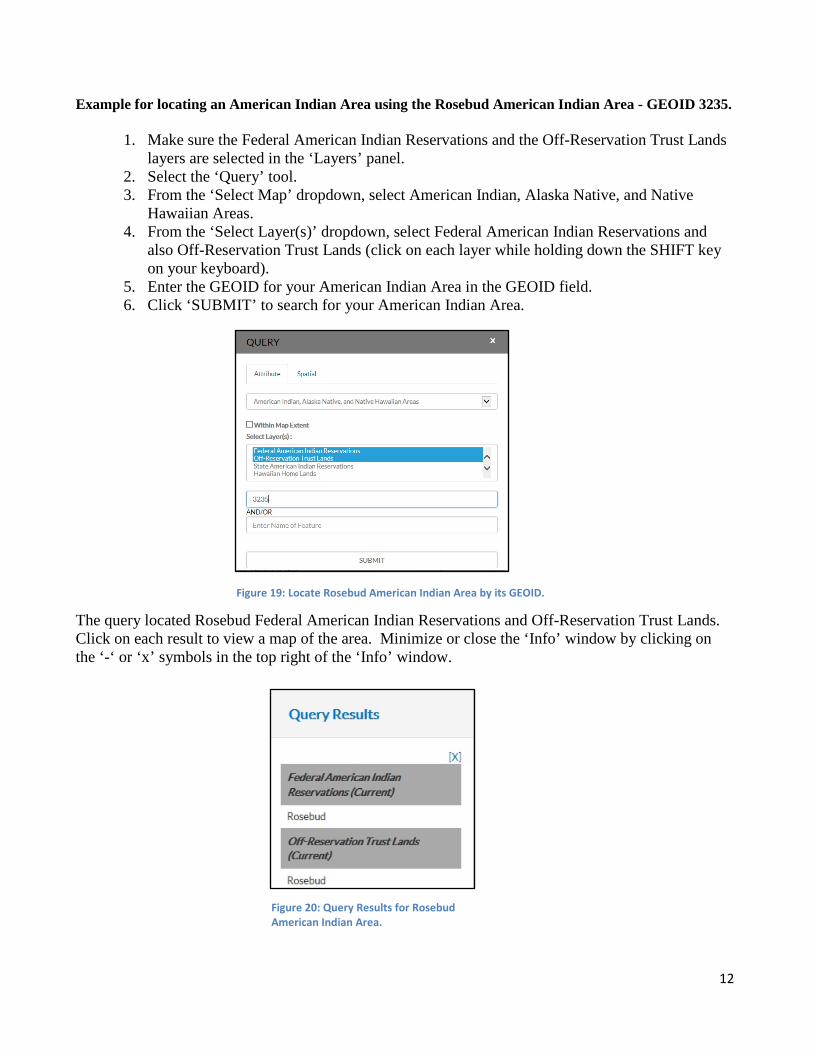
Example for locating an American Indian Area using the Rosebud American Indian Area - GEOID 3235.
1. Make sure the Federal American Indian Reservations and the Off-Reservation Trust Lands layers are selected in the ‘Layers’ panel.
2. Select the ‘Query’ tool. 3. From the ‘Select Map’ dropdown, select American Indian, Alaska Native, and Native
Hawaiian Areas. 4. From the ‘Select Layer(s)’ dropdown, select Federal American Indian Reservations and
also Off-Reservation Trust Lands (click on each layer while holding down the SHIFT key on your keyboard).
5. Enter the GEOID for your American Indian Area in the GEOID field. 6. Click ‘SUBMIT’ to search for your American Indian Area.
The query located Rosebud Federal American Indian Reservations and Off-Reservation Trust Lands. Click on each result to view a map of the area. Minimize or close the ‘Info’ window by clicking on the ‘-‘ or ‘x’ symbols in the top right of the ‘Info’ window.
Figure 19: Locate Rosebud American Indian Area by its GEOID.
Figure 20: Query Results for Rosebud American Indian Area.
12
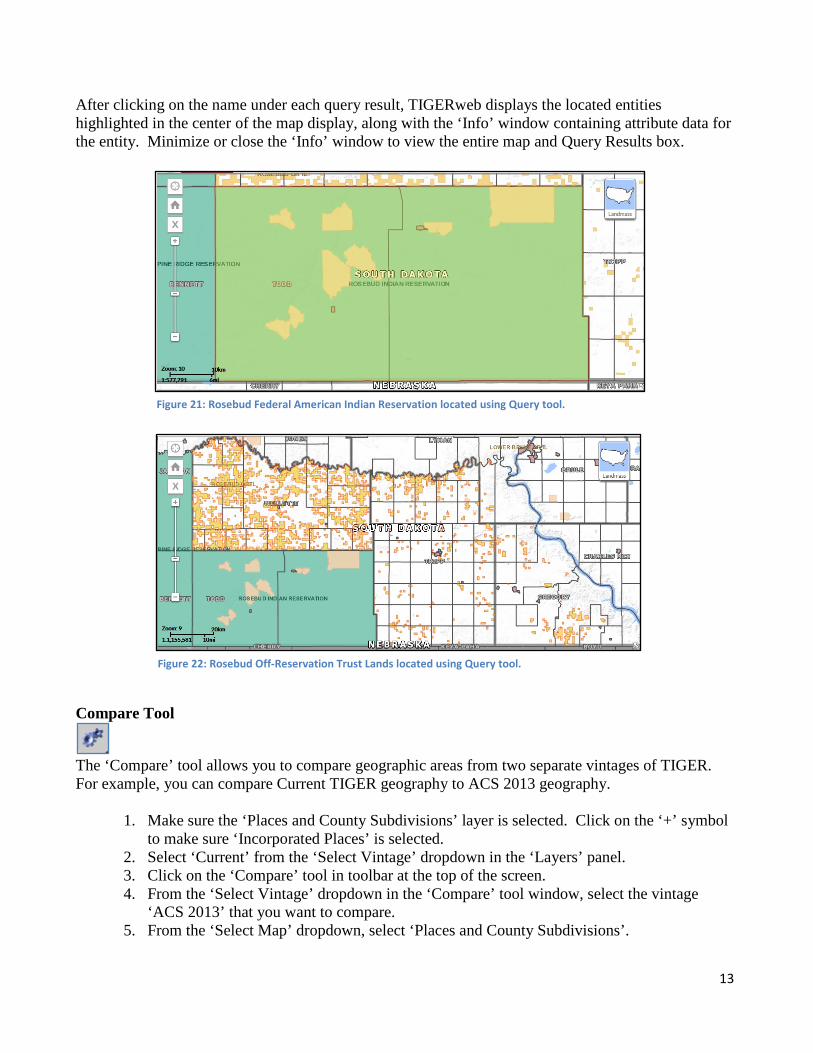
After clicking on the name under each query result, TIGERweb displays the located entities highlighted in the center of the map display, along with the ‘Info’ window containing attribute data for the entity. Minimize or close the ‘Info’ window to view the entire map and Query Results box. Compare Tool
The ‘Compare’ tool allows you to compare geographic areas from two separate vintages of TIGER. For example, you can compare Current TIGER geography to ACS 2013 geography.
1. Make sure the ‘Places and County Subdivisions’ layer is selected. Click on the ‘+’ symbol to make sure ‘Incorporated Places’ is selected.
2. Select ‘Current’ from the ‘Select Vintage’ dropdown in the ‘Layers’ panel. 3. Click on the ‘Compare’ tool in toolbar at the top of the screen. 4. From the ‘Select Vintage’ dropdown in the ‘Compare’ tool window, select the vintage
‘ACS 2013’ that you want to compare. 5. From the ‘Select Map’ dropdown, select ‘Places and County Subdivisions’.
Figure 21: Rosebud Federal American Indian Reservation located using Query tool.
Figure 22: Rosebud Off-Reservation Trust Lands located using Query tool.
13
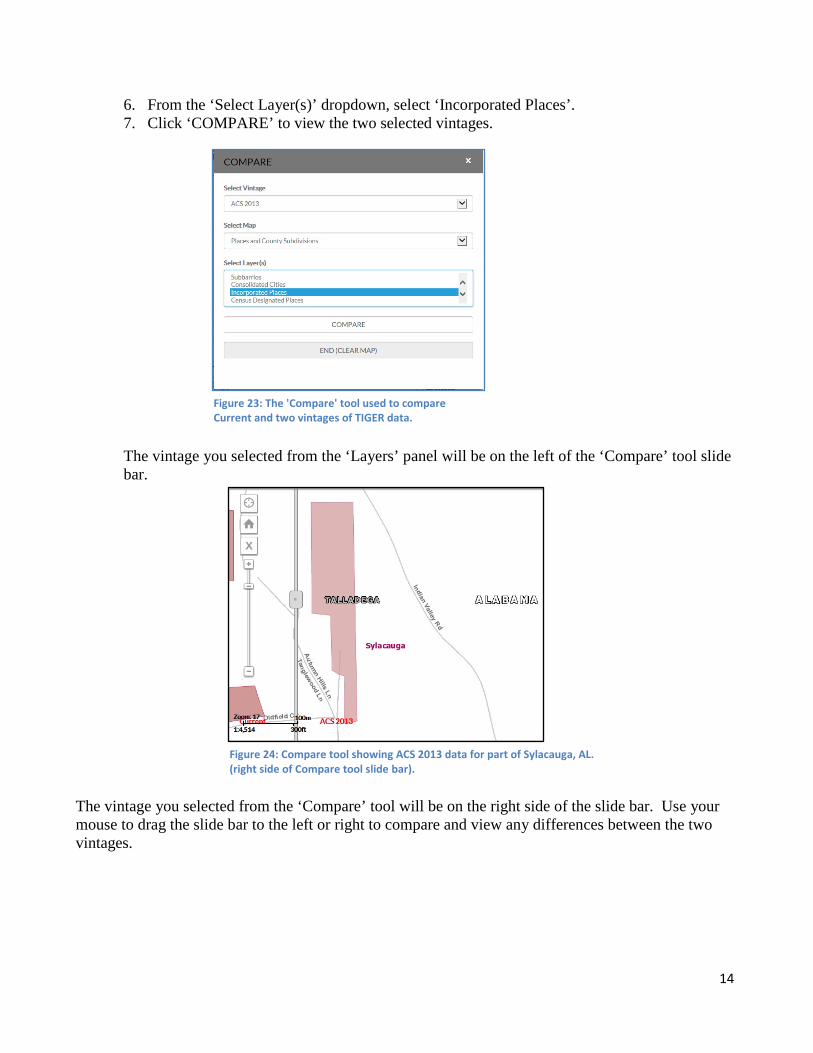
6. From the ‘Select Layer(s)’ dropdown, select ‘Incorporated Places’. 7. Click ‘COMPARE’ to view the two selected vintages.
The vintage you selected from the ‘Layers’ panel will be on the left of the ‘Compare’ tool slide bar.
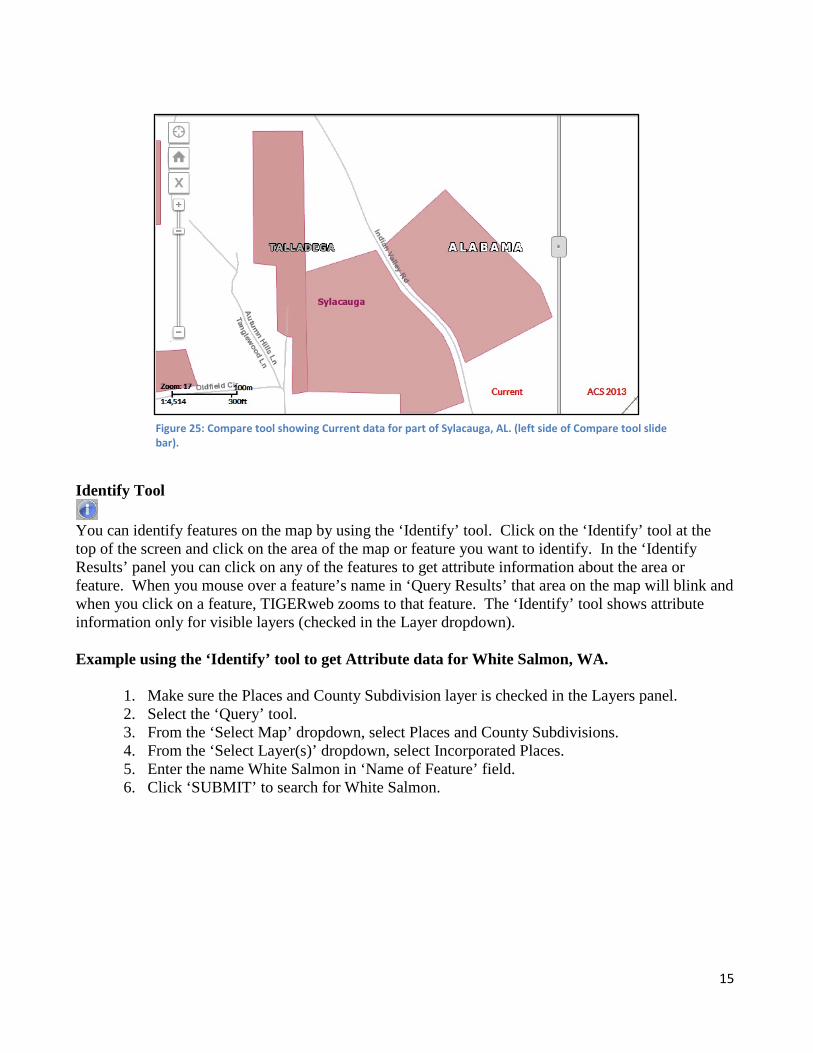
The vintage you selected from the ‘Compare’ tool will be on the right side of the slide bar. Use your mouse to drag the slide bar to the left or right to compare and view any differences between the two vintages.
Figure 23: The 'Compare' tool used to compare Current and two vintages of TIGER data.
Figure 24: Compare tool showing ACS 2013 data for part of Sylacauga, AL. (right side of Compare tool slide bar).
14
Identify Tool
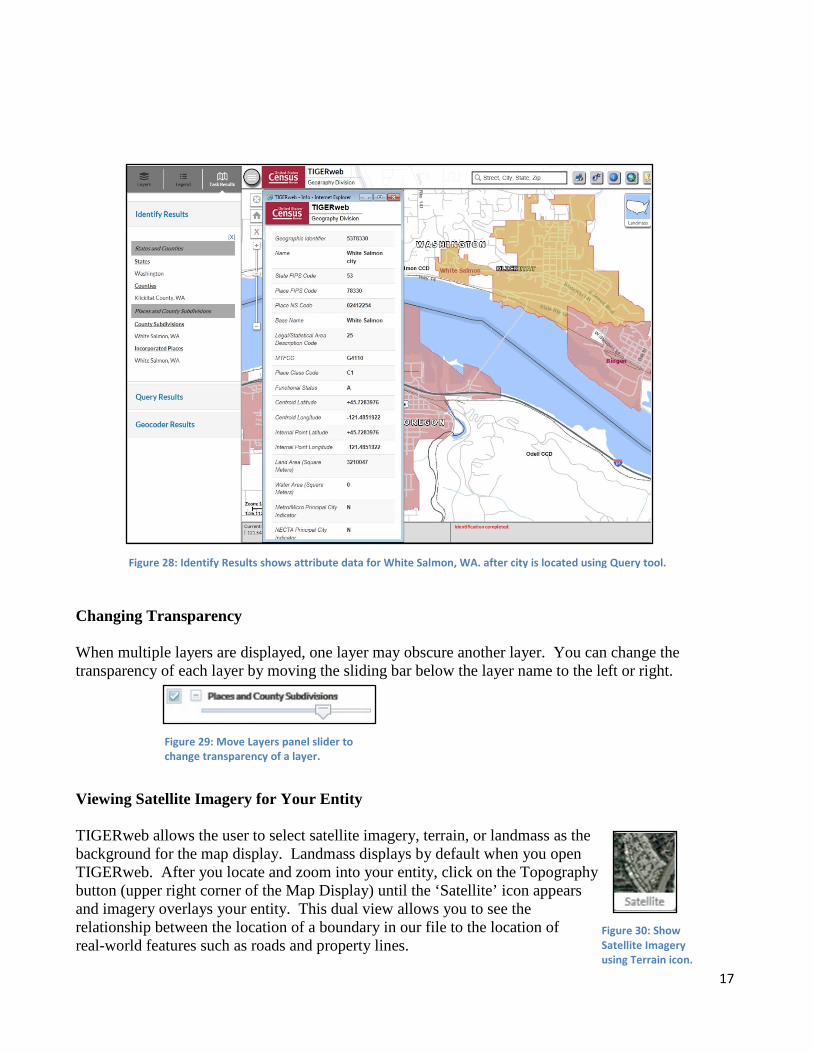
You can identify features on the map by using the ‘Identify’ tool. Click on the ‘Identify’ tool at the top of the screen and click on the area of the map or feature you want to identify. In the ‘Identify Results’ panel you can click on any of the features to get attribute information about the area or feature. When you mouse over a feature’s name in ‘Query Results’ that area on the map will blink and when you click on a feature, TIGERweb zooms to that feature. The ‘Identify’ tool shows attribute information only for visible layers (checked in the Layer dropdown). Example using the ‘Identify’ tool to get Attribute data for White Salmon, WA.
1. Make sure the Places and County Subdivision layer is checked in the Layers panel. 2. Select the ‘Query’ tool. 3. From the ‘Select Map’ dropdown, select Places and County Subdivisions. 4. From the ‘Select Layer(s)’ dropdown, select Incorporated Places. 5. Enter the name White Salmon in ‘Name of Feature’ field. 6. Click ‘SUBMIT’ to search for White Salmon.
Figure 25: Compare tool showing Current data for part of Sylacauga, AL. (left side of Compare tool slide bar).
15
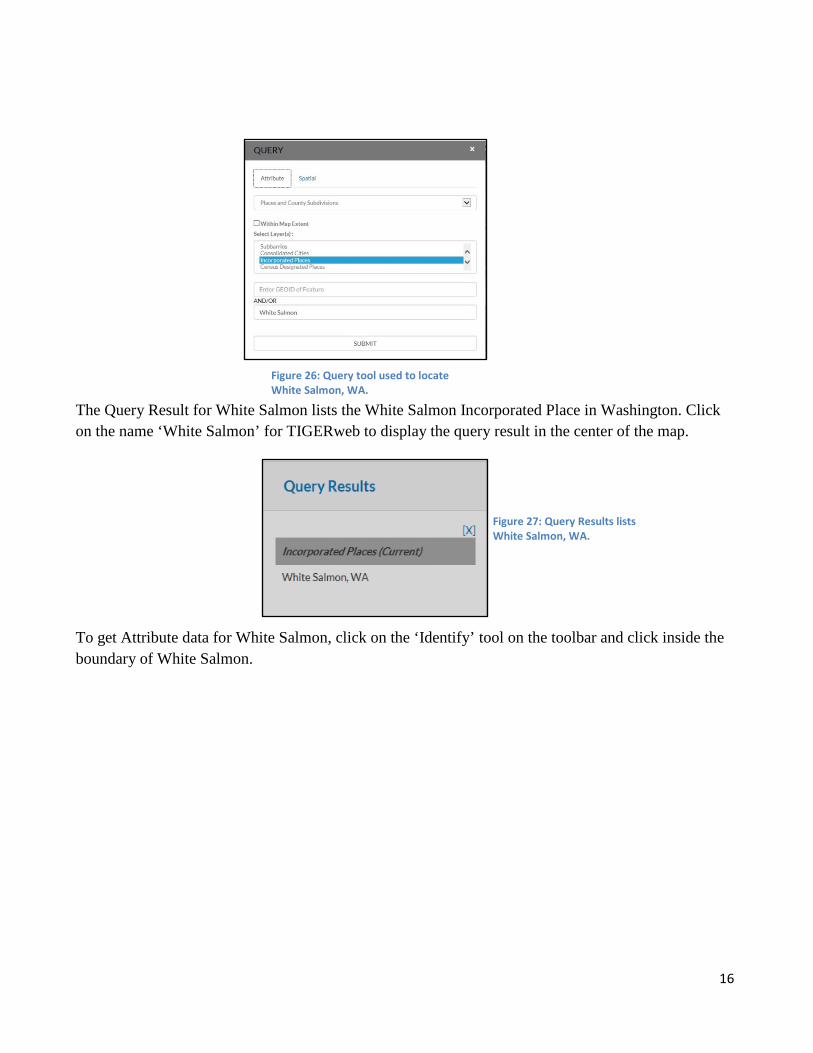
The Query Result for White Salmon lists the White Salmon Incorporated Place in Washington. Click on the name ‘White Salmon’ for TIGERweb to display the query result in the center of the map.
To get Attribute data for White Salmon, click on the ‘Identify’ tool on the toolbar and click inside the boundary of White Salmon.
Figure 26: Query tool used to locate White Salmon, WA.
Figure 27: Query Results lists White Salmon, WA.
16
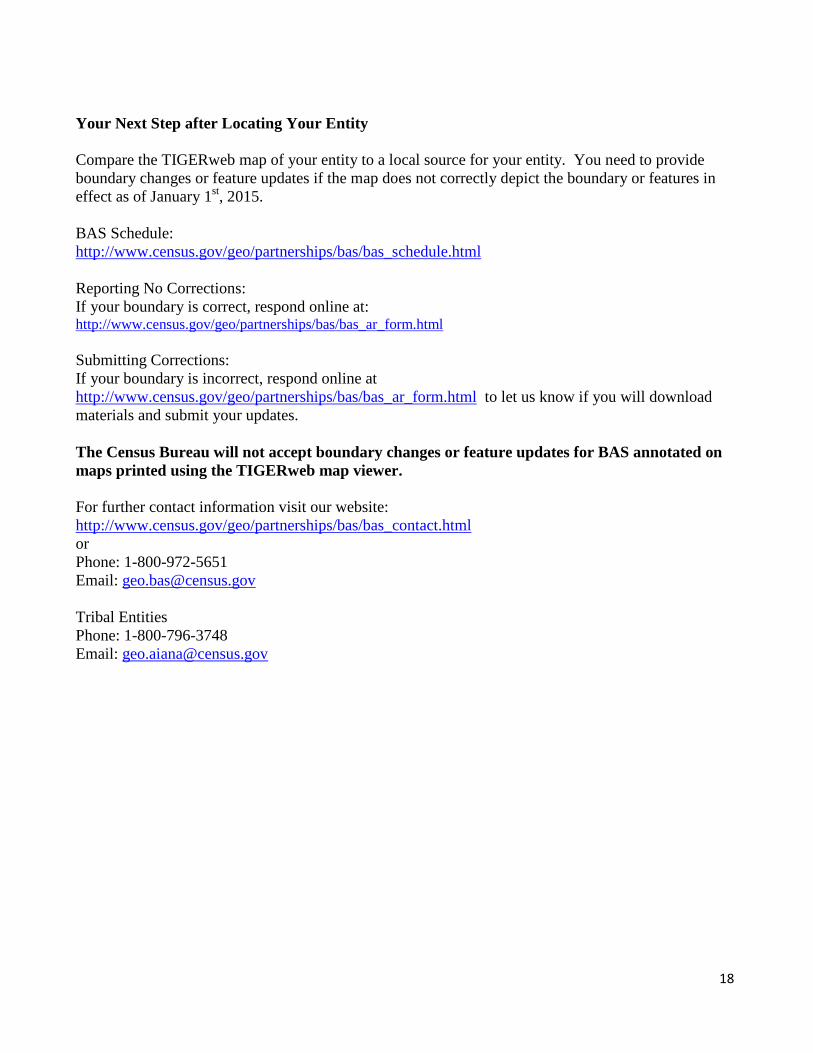
Changing Transparency When multiple layers are displayed, one layer may obscure another layer. You can change the transparency of each layer by moving the sliding bar below the layer name to the left or right. Viewing Satellite Imagery for Your Entity TIGERweb allows the user to select satellite imagery, terrain, or landmass as the background for the map display. Landmass displays by default when you open TIGERweb. After you locate and zoom into your entity, click on the Topography button (upper right corner of the Map Display) until the ‘Satellite’ icon appears and imagery overlays your entity. This dual view allows you to see the relationship between the location of a boundary in our file to the location of real-world features such as roads and property lines.
Figure 30: Show Satellite Imagery using Terrain icon.
Figure 28: Identify Results shows attribute data for White Salmon, WA. after city is located using Query tool.
Figure 29: Move Layers panel slider to change transparency of a layer.
17
Your Next Step after Locating Your Entity Compare the TIGERweb map of your entity to a local source for your entity. You need to provide boundary changes or feature updates if the map does not correctly depict the boundary or features in effect as of January 1st, 2015. BAS Schedule: http://www.census.gov/geo/partnerships/bas/bas_schedule.html Reporting No Corrections: If your boundary is correct, respond online at: http://www.census.gov/geo/partnerships/bas/bas_ar_form.html Submitting Corrections: If your boundary is incorrect, respond online at http://www.census.gov/geo/partnerships/bas/bas_ar_form.html to let us know if you will download materials and submit your updates. The Census Bureau will not accept boundary changes or feature updates for BAS annotated on maps printed using the TIGERweb map viewer. For further contact information visit our website: http://www.census.gov/geo/partnerships/bas/bas_contact.html or Phone: 1-800-972-5651 Email: [email protected] Tribal Entities Phone: 1-800-796-3748 Email: [email protected]
18