Embed Size (px)
Citation preview
SECTOR REPORT
FOURTH QUARTER 2016

2
Disclaimer
All information set forth in this report (the “Overview”) has been synthesized by Bourne Capital Partners, L.L.C.(“BP”) or was obtained from publicly available sources. BP makes no express or implied representation or warrantyas to the accuracy or completeness of the information contained herein. BP expressly disclaims any and all liabilitythat may be based on all information set forth in the Overview, errors therein, or omissions therefrom.
This Overview includes certain statements, estimates and projections provided by BP with respect to anticipatedfuture performance. Such statements, estimates and projections reflect various assumptions made by BP concerninganticipated results, which reflect significant subjective judgments made by BP and as a result, may or may not proveto be correct. There can be no assurance that such projected results are attainable or will be realized. No expressor implied representations or warranties are made as to the accuracy of such statements, estimates or projections.
In furnishing the Overview, BP does not undertake any obligation to provide the recipient with access to anyadditional information, to correct any inaccuracies that may become apparent or to update or otherwise revise thisOverview.
This Overview is not an offer to sell or a solicitation of an offer to purchase securities or to engage in any othertransaction.
BP is a North Carolina (USA) limited liability company doing business as Bourne Partners with divisions in HealthcareMerchant Banking, Alternative Assets, Management Consulting and Investment Banking. Investment Banking servicesare offered by Bourne Partners Securities, LLC, a registered broker dealer, Member FINRA and SIPC. Investments arenot guaranteed or underwritten and may lose value. Investing in securities products involves risk, including possibleloss of principal.

3
Report Contents
Industry Overview and Highlights 4
Industry Trading Comparables 13
Industry Transaction Comparables 30
Transaction Profiles 49
Bourne Partners Overview 69

Industry Overview & Highlights

5
-4%-2%0%2%4%6%8%10%12%
$0 bn
$200 bn
$400 bn
$600 bn
$800 bn
$1,000 bn
$1,200 bn
Sale
s G
row
th
Spec Pharma Tearsheet
Trading & Transaction Comps(2)
Market Dynamics & Industry Outlook(1)
Worldwide Spec Pharma sales reached $655 billion in 2015.
Worldwide prescription drug sales are expected to reach almost one trillion dollars by 2020 (CAGR: 4.8% between 2014 and 2020).
After trading at record highs through the first half of 2015, Branded and Generic Spec Pharma have seen a recent normalization of equity performance.
Unless otherwise indicated, all data contained in this report is through September 30, 2016.
Transaction Comp Enterprise Value Multiples— Average EBITDA Multiple: 12.7x in YTD 2016— Average Revenue Multiple: 2.6x in YTD 2016— Total number of deals: 90 in YTD 2016— Most active regions:
US (32), Asia (31) and Europe (24) Branded Performance relative to 2016 YTD benchmarks
— Performance relative to S&P 500: -31.6%
— Performance relative to Healthcare Sector: -25.9%
Generic Performance relative to 2016 YTD benchmarks— Performance relative to S&P 500:
-34.8%— Performance relative to Healthcare Sector:
-29.1%
Sources: (1) EvaluatePharma World Preview 2015, Outlook to 2020.(2) Bourne Partners Internal Research; CapitalIQ
Spec Pharma M&A Deal Volume By Region(2)
Worldwide Prescription Drug Sales (2006-2020)(1)
US & Canada Latin AmericaAsia/Pacific Europe MENA Africa
Rx excl. Generics Generics Growth per Year
42% 46%32% 25%
32%
24% 23%37% 43%
35%
24% 23% 18%
25%
28%
0
20
40
60
80
100
120
140
160
180
200
2012 2013 2014 2015 2016 YTD
6
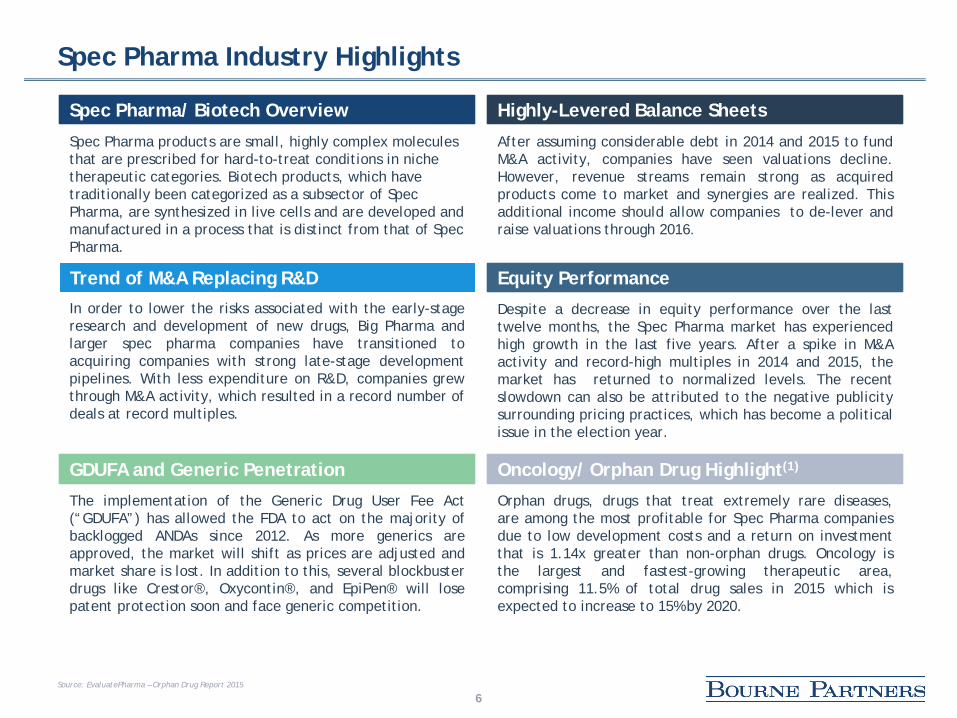
In order to lower the risks associated with the early-stageresearch and development of new drugs, Big Pharma andlarger spec pharma companies have transitioned toacquiring companies with strong late-stage developmentpipelines. With less expenditure on R&D, companies grewthrough M&A activity, which resulted in a record number ofdeals at record multiples.
Trend of M&A Replacing R&D
Oncology/ Orphan Drug Highlight(1)
Orphan drugs, drugs that treat extremely rare diseases,are among the most profitable for Spec Pharma companiesdue to low development costs and a return on investmentthat is 1.14x greater than non-orphan drugs. Oncology isthe largest and fastest-growing therapeutic area,comprising 11.5% of total drug sales in 2015 which isexpected to increase to 15% by 2020.
Spec Pharma Industry Highlights
Highly-Levered Balance Sheets
After assuming considerable debt in 2014 and 2015 to fundM&A activity, companies have seen valuations decline.However, revenue streams remain strong as acquiredproducts come to market and synergies are realized. Thisadditional income should allow companies to de-lever andraise valuations through 2016.
Equity Performance
Despite a decrease in equity performance over the lasttwelve months, the Spec Pharma market has experiencedhigh growth in the last five years. After a spike in M&Aactivity and record-high multiples in 2014 and 2015, themarket has returned to normalized levels. The recentslowdown can also be attributed to the negative publicitysurrounding pricing practices, which has become a politicalissue in the election year.
GDUFA and Generic Penetration
The implementation of the Generic Drug User Fee Act(“GDUFA”) has allowed the FDA to act on the majority ofbacklogged ANDAs since 2012. As more generics areapproved, the market will shift as prices are adjusted andmarket share is lost. In addition to this, several blockbusterdrugs like Crestor®, Oxycontin®, and EpiPen® will losepatent protection soon and face generic competition.
Spec Pharma/ Biotech Overview
Spec Pharma products are small, highly complex molecules that are prescribed for hard-to-treat conditions in niche therapeutic categories. Biotech products, which have traditionally been categorized as a subsector of Spec Pharma, are synthesized in live cells and are developed and manufactured in a process that is distinct from that of Spec Pharma.
Source: EvaluatePharma – Orphan Drug Report 2015
7
Highly-Levered Balance Sheets and R&D Shift
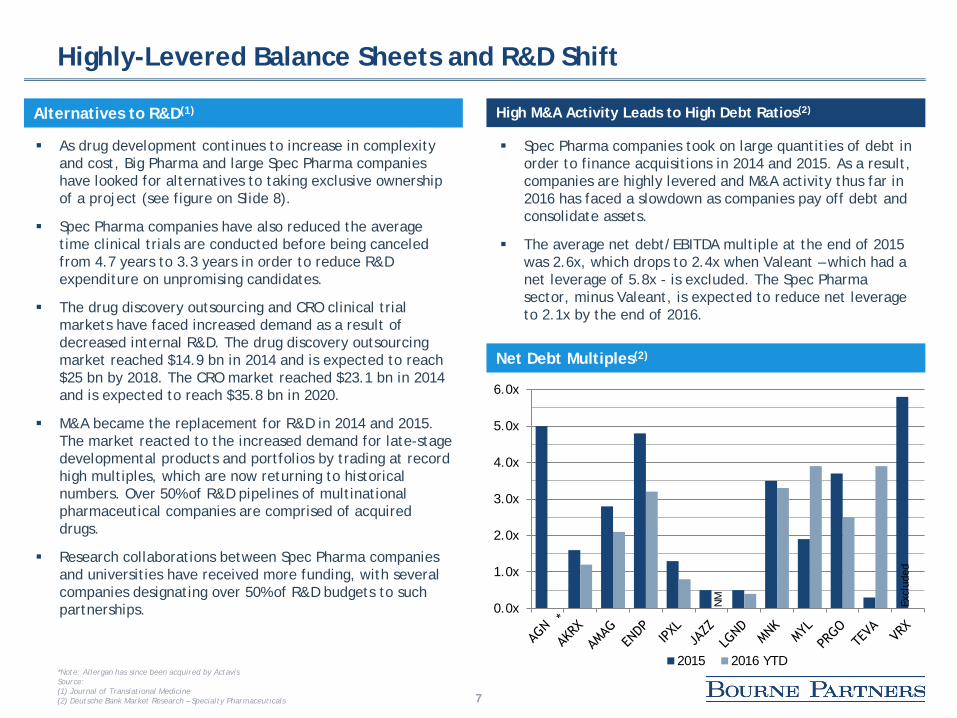
*Note: Allergan has since been acquired by Actavis Source: (1) Journal of Translational Medicine(2) Deutsche Bank Market Research – Specialty Pharmaceuticals
Spec Pharma companies took on large quantities of debt in order to finance acquisitions in 2014 and 2015. As a result, companies are highly levered and M&A activity thus far in 2016 has faced a slowdown as companies pay off debt and consolidate assets.
The average net debt/EBITDA multiple at the end of 2015 was 2.6x, which drops to 2.4x when Valeant – which had a net leverage of 5.8x - is excluded. The Spec Pharma sector, minus Valeant, is expected to reduce net leverage to 2.1x by the end of 2016.
High M&A Activity Leads to High Debt Ratios(2)
As drug development continues to increase in complexity and cost, Big Pharma and large Spec Pharma companies have looked for alternatives to taking exclusive ownership of a project (see figure on Slide 8).
Spec Pharma companies have also reduced the average time clinical trials are conducted before being canceled from 4.7 years to 3.3 years in order to reduce R&D expenditure on unpromising candidates.
The drug discovery outsourcing and CRO clinical trial markets have faced increased demand as a result of decreased internal R&D. The drug discovery outsourcing market reached $14.9 bn in 2014 and is expected to reach $25 bn by 2018. The CRO market reached $23.1 bn in 2014 and is expected to reach $35.8 bn in 2020.
M&A became the replacement for R&D in 2014 and 2015. The market reacted to the increased demand for late-stage developmental products and portfolios by trading at record high multiples, which are now returning to historical numbers. Over 50% of R&D pipelines of multinational pharmaceutical companies are comprised of acquired drugs.
Research collaborations between Spec Pharma companies and universities have received more funding, with several companies designating over 50% of R&D budgets to such partnerships.
Alternatives to R&D(1)
Net Debt Multiples(2)
0.0x
1.0x
2.0x
3.0x
4.0x
5.0x
6.0x
2015 2016 YTD
NM
Excl
uded

8
Challenges Facing R&D Companies(1)
High burden for approval and reimbursement of NME’s
Complex research for new drug targets
Poorly predictive animal models
Complexity of clinical trials
Lower risk tolerance of regulators and society
Licensing, co-development, or joint venture negotiations
Strategic changes
Commercial Demands
Decreasing number of research-based pharmaceutical companies
Challenges: Results: Consequences:
High capitalized costs for R&D
Low New Molecular Entity (“NME”) output
Reduced R&D efficiency of research-based pharmaceutical companies
Widen the competence field by collaborating with universities
and biotechnology/ pharmaceutical companies
Increase the technology base by licensing drug candidates in all
phases of R&D
Reduce R&D costs by cost-efficient outsourcing
Create growth opportunities by M&As
Strengthen the innovation potential by venture capital
investments
Broaden the knowledge base by using the crowd
Source: (1) Journal of Translational Medicine

9
$0.00
$50.00
$100.00
$150.00
$200.00
$250.00
$300.00 Valeant Equity Performance
Equity Performance
Spec Pharma M&A activity peaked in 2014 and H1 2015, pushing revenue and EBITDA multiples to record highs. As companies have transitioned into a period of post-merger integration in 2016, multiples have returned to normal levels.
Debt multiples have also increased as a result of the high market activity, which has caused highly-levered companies like Valeant and Endo to trade at near-record lows.
Valeant Pharmaceuticals (NYSE: VRX) Timeline(3)
Industry High Multiples(1)
The political world responded with much scrutiny to the aggressive pricing practices of several firms. In the fallout, pharmaceutical pricing became a key plank in several candidates’ platforms, which created uncertainty within the sector as a whole and decreased equity value.
Price gouging by Martin Shkreli’s Turing Pharmaceuticals and Valeant drove this scrutiny, causing Spec Pharma companies to reduce price growth to an average of 5.7% in H1 2016 versus 12.8% in H1 2015. Margins and multiples have suffered as a result, which has led to the downturn seen in the last twelve months.
Negative Publicity Surrounding the Industry(1)(2)
September 21, 2015 – Hillary Clinton tweets about price gouging, resulting in a 20% decrease in share price over the next week
September 28, 2015 – House oversight committee request subpoena for Valeant to explain price increases, causing a 17% overnight drop in share price
October 15, 2015 – Valeant receives two subpoenas, dropping share prices by 5%
October 21, 2015 – Citron accuses Valeant of fraud and collusion with Philidor to increase prices, leading to a two-day 26% drop in equity performance
March 1, 2016 - Bill Ackman gives a statement on the outlook for Valeant on CNBC
March 15, 2016 – Valeant cuts 2016 revenue forecasts 12% and announces a delay in filing its 10-K
Sources: (1) Deutsche Bank Market Research – Specialty Pharmaceuticals(2) Bloomberg(3) The Wall Street Journal

10
Pricing
Pricing Practices
Percent Drug Price Increases from Q4 2009 to Q4 2015(2)
0%
50%
100%
150%
200%
250%
300%
350%
-15% -1%
Source: (1) Deutsche Bank Market Research – Specialty Pharmaceuticals(2) Bloomberg
Specialty pharmaceutical companies have used price increases as a strategy to offset decreasing sales volume. Increases range depending on the amount of new competition a drug faces, but averaged a 21.3% annual increase from 2012 to 2015.(1)
Branded Spec Pharma companies are able to take price at higher percentages while there is no competition on the market, whereas Generics companies must keep price growth low to remain competitive.(1)
The negative publicity surrounding aggressive price practicing has resulted in mispricing of newly-marketed assets by Big Pharma for fear of negative press.(1)
Below is a chart of 39 branded drugs with over $1 bn in sales and their price adjustments from Q4 2009 to Q4 2015. (2)
Of the drugs listed, 30 increased price by more than double the rate of inflation. The median change in drug pricing was 37%, well above the 9.5% inflation rate. (2)
Price increases are measured in percentages, which are not contextualized. For example, the 140% increase seen in Premarin over the last six years represents a price increase of $1.99, whereas the 14% price increase of Alimta was $321. These changes reflect increases in the discounted price insurers and PBMs pay, not the list price.(2)
11
GDUFA’s Affect on Generic Approval Rates
0
10
20
30
40
50
60
70
80
90
Jan-13 Apr-13 Jul-13 Oct-13 Jan-14 Apr-14 Jul-14 Oct-14 Jan-15 Apr-15 Jul-15 Oct-15
Mon
thly
AN
DA
App
rova
ls
ANDA Approvals First-time Generic Approvals
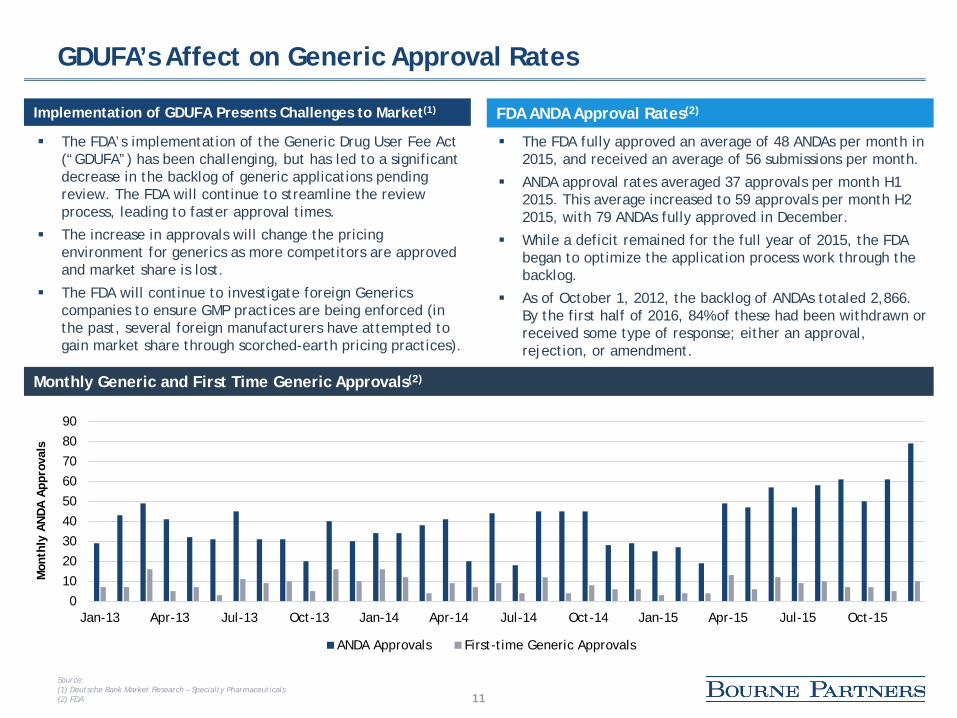
The FDA’s implementation of the Generic Drug User Fee Act (“GDUFA”) has been challenging, but has led to a significant decrease in the backlog of generic applications pending review. The FDA will continue to streamline the review process, leading to faster approval times.
The increase in approvals will change the pricing environment for generics as more competitors are approved and market share is lost.
The FDA will continue to investigate foreign Generics companies to ensure GMP practices are being enforced (in the past, several foreign manufacturers have attempted to gain market share through scorched-earth pricing practices).
Source: (1) Deutsche Bank Market Research – Specialty Pharmaceuticals(2) FDA
Monthly Generic and First Time Generic Approvals(2)
Implementation of GDUFA Presents Challenges to Market(1)
The FDA fully approved an average of 48 ANDAs per month in 2015, and received an average of 56 submissions per month.
ANDA approval rates averaged 37 approvals per month H1 2015. This average increased to 59 approvals per month H2 2015, with 79 ANDAs fully approved in December.
While a deficit remained for the full year of 2015, the FDA began to optimize the application process work through the backlog.
As of October 1, 2012, the backlog of ANDAs totaled 2,866. By the first half of 2016, 84% of these had been withdrawn or received some type of response; either an approval, rejection, or amendment.
FDA ANDA Approval Rates(2)
12
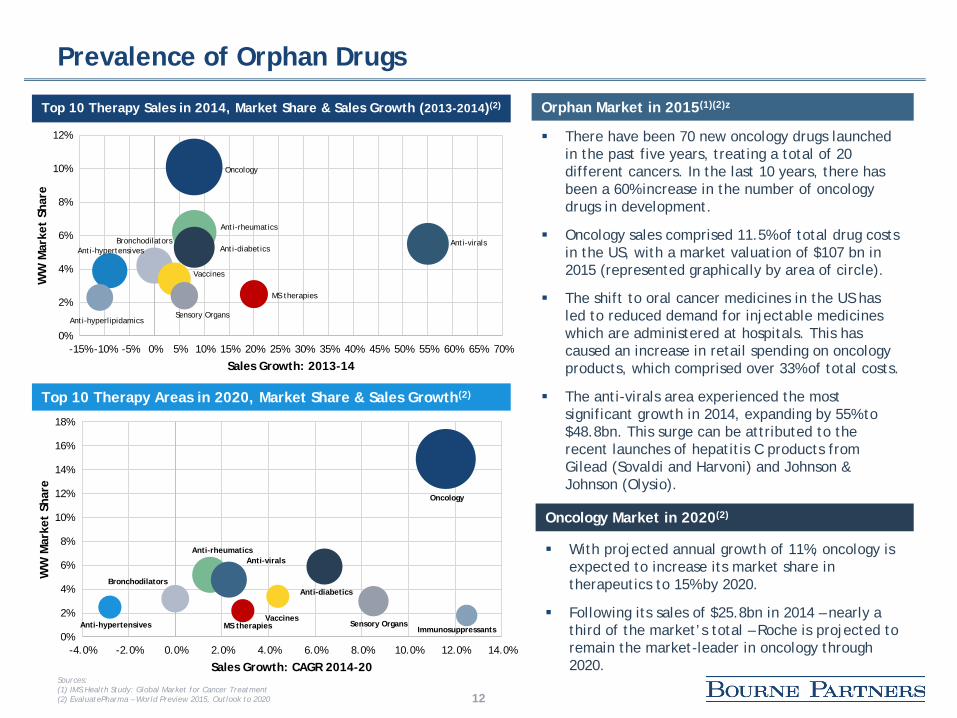
There have been 70 new oncology drugs launched in the past five years, treating a total of 20 different cancers. In the last 10 years, there has been a 60% increase in the number of oncology drugs in development.
Oncology sales comprised 11.5% of total drug costs in the US, with a market valuation of $107 bn in 2015 (represented graphically by area of circle).
The shift to oral cancer medicines in the US has led to reduced demand for injectable medicines which are administered at hospitals. This has caused an increase in retail spending on oncology products, which comprised over 33% of total costs.
The anti-virals area experienced the most significant growth in 2014, expanding by 55% to $48.8bn. This surge can be attributed to the recent launches of hepatitis C products from Gilead (Sovaldi and Harvoni) and Johnson & Johnson (Olysio).
Prevalence of Orphan Drugs
With projected annual growth of 11%, oncology is expected to increase its market share in therapeutics to 15% by 2020.
Following its sales of $25.8bn in 2014 – nearly a third of the market’s total – Roche is projected to remain the market-leader in oncology through 2020.
Oncology Market in 2020(2)
Orphan Market in 2015(1)(2)z
Oncology
Anti-diabetics
Anti-rheumaticsAnti-virals
Vaccines
Bronchodilators
Sensory OrgansAnti-hypertensives MS therapies Immunosuppressants0%
2%
4%
6%
8%
10%
12%
14%
16%
18%
-4.0% -2.0% 0.0% 2.0% 4.0% 6.0% 8.0% 10.0% 12.0% 14.0%
WW
Mar
ket
Shar
e
Sales Growth: CAGR 2014-20
Top 10 Therapy Areas in 2020, Market Share & Sales Growth(2)
Oncology
Anti-rheumatics
Anti-viralsAnti-diabetics
BronchodilatorsAnti-hypertensives
Vaccines
MS therapies
Sensory OrgansAnti-hyperlipidamics
0%
2%
4%
6%
8%
10%
12%
-15% -10% -5% 0% 5% 10% 15% 20% 25% 30% 35% 40% 45% 50% 55% 60% 65% 70%
WW
Mar
ket
Shar
e
Sales Growth: 2013-14
Top 10 Therapy Sales in 2014, Market Share & Sales Growth (2013-2014)(2)
Sources: (1) IMS Health Study: Global Market for Cancer Treatment(2) EvaluatePharma – World Preview 2015, Outlook to 2020

Industry Trading Comparables
14
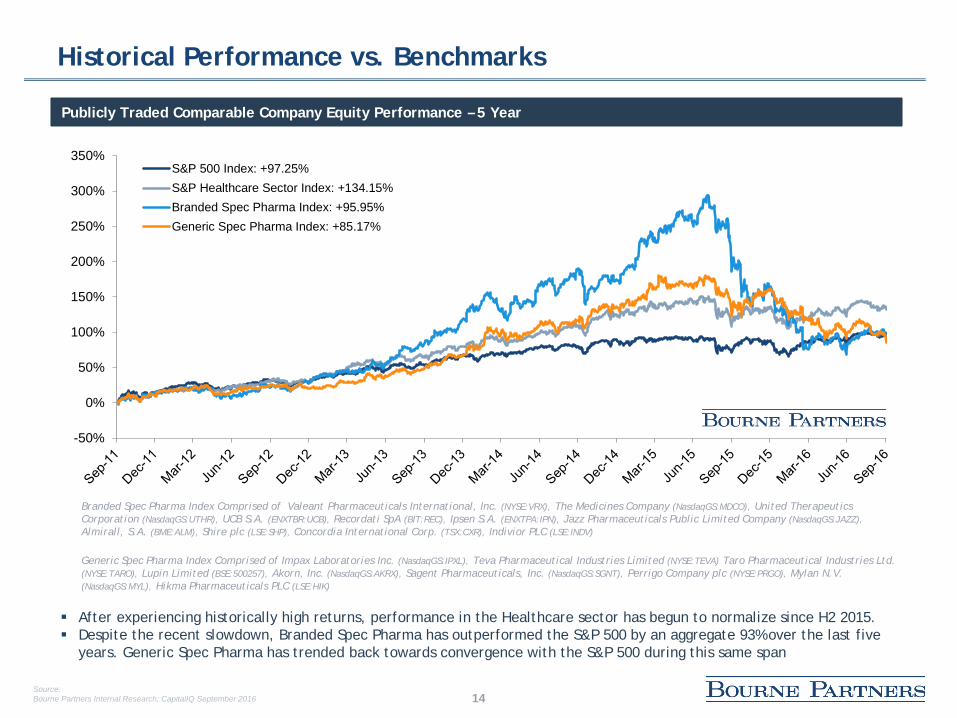
Historical Performance vs. Benchmarks
Publicly Traded Comparable Company Equity Performance – 5 Year
After experiencing historically high returns, performance in the Healthcare sector has begun to normalize since H2 2015. Despite the recent slowdown, Branded Spec Pharma has outperformed the S&P 500 by an aggregate 93% over the last five
years. Generic Spec Pharma has trended back towards convergence with the S&P 500 during this same span
Source:Bourne Partners Internal Research; CapitalIQ September 2016
Branded Spec Pharma Index Comprised of Valeant Pharmaceuticals International, Inc. (NYSE:VRX), The Medicines Company (NasdaqGS:MDCO), United Therapeutics Corporation (NasdaqGS:UTHR), UCB S.A. (ENXTBR:UCB), Recordati SpA (BIT:REC), Ipsen S.A. (ENXTPA:IPN), Jazz Pharmaceuticals Public Limited Company (NasdaqGS:JAZZ), Almirall, S.A. (BME:ALM), Shire plc (LSE:SHP), Concordia International Corp. (TSX:CXR), Indivior PLC (LSE:INDV)
Generic Spec Pharma Index Comprised of Impax Laboratories Inc. (NasdaqGS:IPXL), Teva Pharmaceutical Industries Limited (NYSE:TEVA) Taro Pharmaceutical Industries Ltd. (NYSE:TARO), Lupin Limited (BSE:500257), Akorn, Inc. (NasdaqGS:AKRX), Sagent Pharmaceuticals, Inc. (NasdaqGS:SGNT), Perrigo Company plc (NYSE:PRGO), Mylan N.V. (NasdaqGS:MYL), Hikma Pharmaceuticals PLC (LSE:HIK)
-50%
0%
50%
100%
150%
200%
250%
300%
350%S&P 500 Index: +97.25%S&P Healthcare Sector Index: +134.15%Branded Spec Pharma Index: +95.95%Generic Spec Pharma Index: +85.17%

15
Historical Performance vs. Benchmarks
Publicly Traded Comparable Company Equity Performance – Last Twelve Months
Given increased market uncertainty and high volatility, Healthcare equity performance weakened over the last twelve months.
Branded Spec Pharma Index Comprised of Valeant Pharmaceuticals International, Inc. (NYSE:VRX), The Medicines Company (NasdaqGS:MDCO), United Therapeutics Corporation (NasdaqGS:UTHR), UCB S.A. (ENXTBR:UCB), Recordati SpA (BIT:REC), Ipsen S.A. (ENXTPA:IPN), Jazz Pharmaceuticals Public Limited Company (NasdaqGS:JAZZ), Almirall, S.A. (BME:ALM), Shire plc (LSE:SHP), Concordia International Corp. (TSX:CXR), Indivior PLC (LSE:INDV)
Generic Spec Pharma Index Comprised of Impax Laboratories Inc. (NasdaqGS:IPXL), Teva Pharmaceutical Industries Limited (NYSE:TEVA) Taro Pharmaceutical Industries Ltd. (NYSE:TARO), Lupin Limited (BSE:500257), Akorn, Inc. (NasdaqGS:AKRX), Sagent Pharmaceuticals, Inc. (NasdaqGS:SGNT), Perrigo Company plc (NYSE:PRGO), Mylan N.V. (NasdaqGS:MYL), Hikma Pharmaceuticals PLC (LSE:HIK)
-50%
-40%
-30%
-20%
-10%
0%
10%
20%
S&P 500 Index: +9.12%S&P Healthcare Sector Index: +5.33%Branded Spec Pharma Index: -35.31%Generic Spec Pharma Index: -21.69%
Source:Bourne Partners Internal Research; CapitalIQ September 2016

16
Historical Performance vs. Benchmarks
Publicly Traded Comparable Company Equity Performance – Year to Date of Q3 2016
Branded Spec Pharma has been under increased media and political scrutiny following investigations of several companies’ pricing practices. This spotlight has led to negative, reactionary movements in the market.
Concerns surrounding generic price deflation have lead to decreased equity performance in the Generic Pharma Index as well.
Branded Spec Pharma Index Comprised of Valeant Pharmaceuticals International, Inc. (NYSE:VRX), The Medicines Company (NasdaqGS:MDCO), United Therapeutics Corporation (NasdaqGS:UTHR), UCB S.A. (ENXTBR:UCB), Recordati SpA (BIT:REC), Ipsen S.A. (ENXTPA:IPN), Jazz Pharmaceuticals Public Limited Company (NasdaqGS:JAZZ), Almirall, S.A. (BME:ALM), Shire plc (LSE:SHP), Concordia International Corp. (TSX:CXR), Indivior PLC (LSE:INDV)
Generic Spec Pharma Index Comprised of Impax Laboratories Inc. (NasdaqGS:IPXL), Teva Pharmaceutical Industries Limited (NYSE:TEVA) Taro Pharmaceutical Industries Ltd. (NYSE:TARO), Lupin Limited (BSE:500257), Akorn, Inc. (NasdaqGS:AKRX), Sagent Pharmaceuticals, Inc. (NasdaqGS:SGNT), Perrigo Company plc (NYSE:PRGO), Mylan N.V. (NasdaqGS:MYL), Hikma Pharmaceuticals PLC (LSE:HIK)
-40%
-30%
-20%
-10%
0%
10%
20%S&P 500 Index: +7.73% S&P Healthcare Sector Index: +2.02%Branded Spec Pharma Index: -23.90% Generic Spec Pharma Index: -27.04%
Source:Bourne Partners Internal Research; CapitalIQ September 2016
17
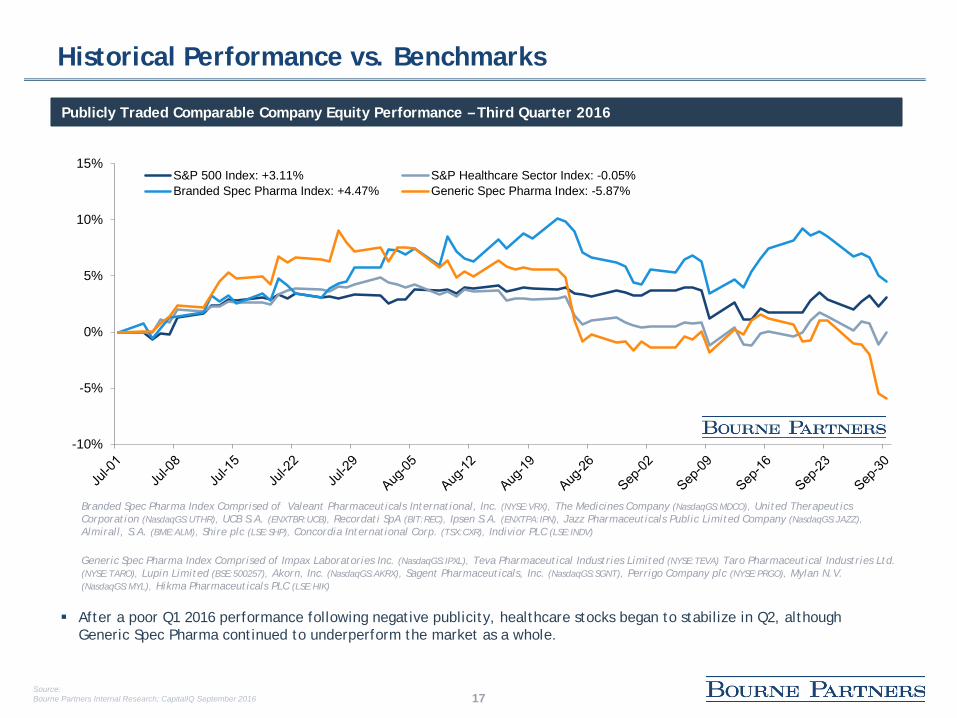
Historical Performance vs. Benchmarks
Publicly Traded Comparable Company Equity Performance – Third Quarter 2016
After a poor Q1 2016 performance following negative publicity, healthcare stocks began to stabilize in Q2, although Generic Spec Pharma continued to underperform the market as a whole.
Branded Spec Pharma Index Comprised of Valeant Pharmaceuticals International, Inc. (NYSE:VRX), The Medicines Company (NasdaqGS:MDCO), United Therapeutics Corporation (NasdaqGS:UTHR), UCB S.A. (ENXTBR:UCB), Recordati SpA (BIT:REC), Ipsen S.A. (ENXTPA:IPN), Jazz Pharmaceuticals Public Limited Company (NasdaqGS:JAZZ), Almirall, S.A. (BME:ALM), Shire plc (LSE:SHP), Concordia International Corp. (TSX:CXR), Indivior PLC (LSE:INDV)
Generic Spec Pharma Index Comprised of Impax Laboratories Inc. (NasdaqGS:IPXL), Teva Pharmaceutical Industries Limited (NYSE:TEVA) Taro Pharmaceutical Industries Ltd. (NYSE:TARO), Lupin Limited (BSE:500257), Akorn, Inc. (NasdaqGS:AKRX), Sagent Pharmaceuticals, Inc. (NasdaqGS:SGNT), Perrigo Company plc (NYSE:PRGO), Mylan N.V. (NasdaqGS:MYL), Hikma Pharmaceuticals PLC (LSE:HIK)
-10%
-5%
0%
5%
10%
15%S&P 500 Index: +3.11% S&P Healthcare Sector Index: -0.05%Branded Spec Pharma Index: +4.47% Generic Spec Pharma Index: -5.87%
Source:Bourne Partners Internal Research; CapitalIQ September 2016

18
Historical Performance vs. Benchmarks
Publicly Traded Comparable Company Equity Performance – September 2016
After the UK’s decision to leave the EU, markets sharply declined in reaction to the uncertainty surrounding the Brexit fallout and its potential impact on various industries and economic systems.
Following the massive selloff, investors re-entered markets as buyers, causing stocks to rebound.
Branded Spec Pharma Index Comprised of Valeant Pharmaceuticals International, Inc. (NYSE:VRX), The Medicines Company (NasdaqGS:MDCO), United Therapeutics Corporation (NasdaqGS:UTHR), UCB S.A. (ENXTBR:UCB), Recordati SpA (BIT:REC), Ipsen S.A. (ENXTPA:IPN), Jazz Pharmaceuticals Public Limited Company (NasdaqGS:JAZZ), Almirall, S.A. (BME:ALM), Shire plc (LSE:SHP), Concordia International Corp. (TSX:CXR), Indivior PLC (LSE:INDV)
Generic Spec Pharma Index Comprised of Impax Laboratories Inc. (NasdaqGS:IPXL), Teva Pharmaceutical Industries Limited (NYSE:TEVA) Taro Pharmaceutical Industries Ltd. (NYSE:TARO), Lupin Limited (BSE:500257), Akorn, Inc. (NasdaqGS:AKRX), Sagent Pharmaceuticals, Inc. (NasdaqGS:SGNT), Perrigo Company plc (NYSE:PRGO), Mylan N.V. (NasdaqGS:MYL), Hikma Pharmaceuticals PLC (LSE:HIK)
-10%
-8%
-6%
-4%
-2%
0%
2%
4%
6%
8%
10%S&P 500 Index: -0.12% S&P Healthcare Sector Index: -0.45%
Branded Spec Pharma Index: +0.19% Generic Spec Pharma Index: -5.06%
Source:Bourne Partners Internal Research; CapitalIQ September 2016

19
Historical Performance vs. Benchmarks
Publicly Traded Comparable Company Enterprise Value to LTM EBITDA Multiples
Up until H2 2015, healthcare M&A activity, in both Branded and Generic Spec Pharma, was red-hot. This activity translated to high EBITDA multiples and a seller’s market.
Given Branded and Generic Spec Pharma performances in the last twelve months, EBITDA multiples have decreased significantly. H2 2016 is expected to be defined by as a favorable period to make purchases.
Branded Spec Pharma Index Comprised of Valeant Pharmaceuticals International, Inc. (NYSE:VRX), The Medicines Company (NasdaqGS:MDCO), United Therapeutics Corporation (NasdaqGS:UTHR), UCB S.A. (ENXTBR:UCB), Recordati SpA (BIT:REC), Ipsen S.A. (ENXTPA:IPN), Jazz Pharmaceuticals Public Limited Company (NasdaqGS:JAZZ), Almirall, S.A. (BME:ALM), Shire plc (LSE:SHP), Concordia International Corp. (TSX:CXR), Indivior PLC (LSE:INDV)
Generic Spec Pharma Index Comprised of Impax Laboratories Inc. (NasdaqGS:IPXL), Teva Pharmaceutical Industries Limited (NYSE:TEVA) Taro Pharmaceutical Industries Ltd. (NYSE:TARO), Lupin Limited (BSE:500257), Akorn, Inc. (NasdaqGS:AKRX), Sagent Pharmaceuticals, Inc. (NasdaqGS:SGNT), Perrigo Company plc (NYSE:PRGO), Mylan N.V. (NasdaqGS:MYL), Hikma Pharmaceuticals PLC (LSE:HIK)
5x
7x
9x
11x
13x
15x
17x
19x
21x
23x
25xS&P 500 Index: 11.60xS&P Healthcare Sector Index: 12.89xBranded Spec Pharma Index: 13.78xGeneric Spec Pharma Index: 13.53x
Source:Bourne Partners Internal Research; CapitalIQ September 2016

20
Historical Performance vs. Benchmarks
Publicly Traded Comparable Company Enterprise Value to LTM Revenue Multiples
Revenue multiples over the last five years generally reflect the trends seen in equity performance and EBITDA valuations for Branded and Generic Spec Pharma.
Branded Spec Pharma Index Comprised of Valeant Pharmaceuticals International, Inc. (NYSE:VRX), The Medicines Company (NasdaqGS:MDCO), United Therapeutics Corporation (NasdaqGS:UTHR), UCB S.A. (ENXTBR:UCB), Recordati SpA (BIT:REC), Ipsen S.A. (ENXTPA:IPN), Jazz Pharmaceuticals Public Limited Company (NasdaqGS:JAZZ), Almirall, S.A. (BME:ALM), Shire plc (LSE:SHP), Concordia International Corp. (TSX:CXR), Indivior PLC (LSE:INDV)
Generic Spec Pharma Index Comprised of Impax Laboratories Inc. (NasdaqGS:IPXL), Teva Pharmaceutical Industries Limited (NYSE:TEVA) Taro Pharmaceutical Industries Ltd. (NYSE:TARO), Lupin Limited (BSE:500257), Akorn, Inc. (NasdaqGS:AKRX), Sagent Pharmaceuticals, Inc. (NasdaqGS:SGNT), Perrigo Company plc (NYSE:PRGO), Mylan N.V. (NasdaqGS:MYL), Hikma Pharmaceuticals PLC (LSE:HIK)
0x
1x
2x
3x
4x
5x
6x
7x
8x
9x
10xS&P 500 Index: 2.22xS&P Healthcare Sector Index: 1.98xBranded Spec Pharma Index: 5.53xGeneric Spec Pharma Index: 4.44x
Source:Bourne Partners Internal Research; CapitalIQ September 2016

21
Trading Comparables Multiple Summary
Generic Spec Pharma Historical MultiplesBranded Spec Pharma Historical Multiples
EV/ LTM Rev EV/ LTM EBITDA EV/LTM Rev EV/LTM EBITDADecember 31, 2015
Median 4.5x 14.0xMean 5.6x 13.8x
March 31, 2016
Median 3.9x 12.2xMean 4.6x 11.4x
June 30, 2016
Median 3.8x 12.9xMean 5.0x 12.3x
December 31, 2015
Median 4.8x 14.9xMean 4.3x 15.5x
March 31, 2016
Median 3.3x 11.1xMean 3.6x 13.4x
June 30, 2016
Median 3.2x 11.4xMean 3.6x 11.6x
Median LTM Revenue Multiple Chart Median LTM EBITDA Multiple Chart
Generic Spec PharmaBranded Spec Pharma
Dec 31, 2015 Mar 31, 2016 Jun 30, 2016 Sep 30, 2016
Median 3.8x 14.0xMean 5.2x 13.0x
September 30, 2016
Median 3.3x 8.9xMean 3.1x 10.6x
September 30, 2016
0x
1x
2x
3x
4x
5x
6x
0x
4x
8x
12x
16x
Dec 31, 2015 Mar 31, 2016 Jun 30, 2016 Sep 30, 2016
Source:Bourne Partners Internal Research; CapitalIQ September 2016
22
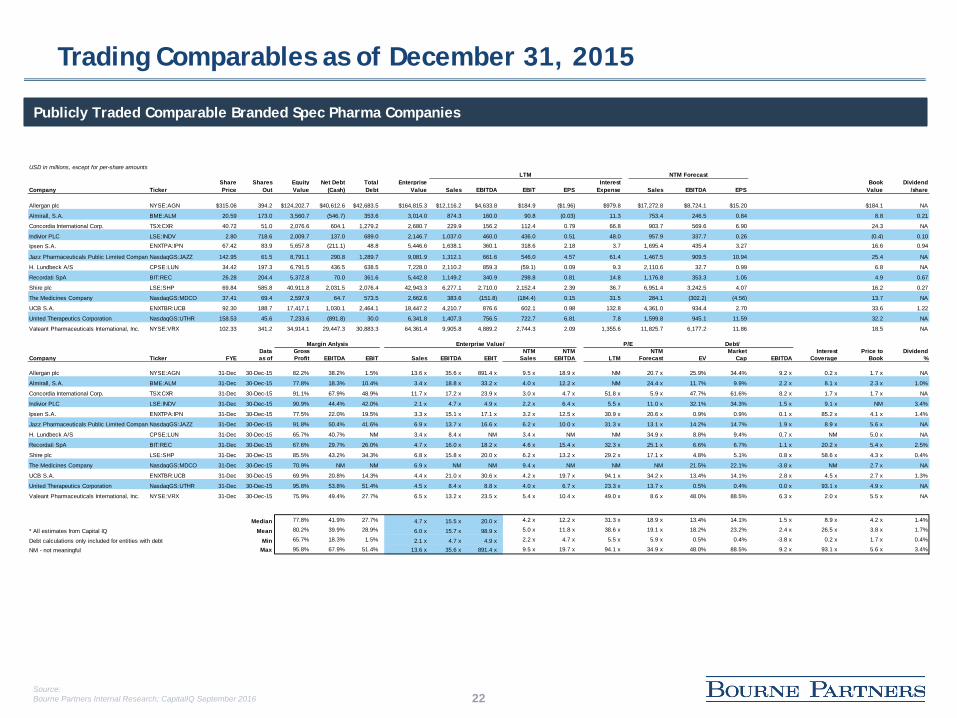
Trading Comparables as of December 31, 2015
Publicly Traded Comparable Branded Spec Pharma Companies
USD in millions, except for per-share amounts42368 LTM NTM Forecast
Share Shares Equity Net Debt Total Enterprise Interest Book DividendCompany Ticker Price Out Value (Cash) Debt Value Sales EBITDA EBIT EPS Expense Sales EBITDA EPS Value /share
Allergan plc NYSE:AGN $315.06 394.2 $124,202.7 $40,612.6 $42,683.5 $164,815.3 $12,116.2 $4,633.8 $184.9 ($1.96) $979.8 $17,272.8 $8,724.1 $15.20 $184.1 NA
Almirall, S.A. BME:ALM 20.59 173.0 3,560.7 (546.7) 353.6 3,014.0 874.3 160.0 90.8 (0.03) 11.3 753.4 246.5 0.84 8.8 0.21
Concordia International Corp. TSX:CXR 40.72 51.0 2,076.6 604.1 1,279.2 2,680.7 229.9 156.2 112.4 0.79 66.8 903.7 569.6 6.90 24.3 NA
Indivior PLC LSE:INDV 2.80 718.6 2,009.7 137.0 689.0 2,146.7 1,037.0 460.0 436.0 0.51 48.0 957.9 337.7 0.26 (0.4) 0.10
Ipsen S.A. ENXTPA:IPN 67.42 83.9 5,657.8 (211.1) 48.8 5,446.6 1,638.1 360.1 318.6 2.18 3.7 1,695.4 435.4 3.27 16.6 0.94
Jazz Pharmaceuticals Public Limited CompanyNasdaqGS:JAZZ 142.95 61.5 8,791.1 290.8 1,289.7 9,081.9 1,312.1 661.6 546.0 4.57 61.4 1,467.5 909.5 10.94 25.4 NA
H. Lundbeck A/S CPSE:LUN 34.42 197.3 6,791.5 436.5 638.5 7,228.0 2,110.2 859.3 (59.1) 0.09 9.3 2,110.6 32.7 0.99 6.8 NA
Recordati SpA BIT:REC 26.28 204.4 5,372.8 70.0 361.6 5,442.8 1,149.2 340.9 298.8 0.81 14.8 1,176.8 353.3 1.05 4.9 0.67
Shire plc LSE:SHP 69.84 585.8 40,911.8 2,031.5 2,076.4 42,943.3 6,277.1 2,710.0 2,152.4 2.39 36.7 6,951.4 3,242.5 4.07 16.2 0.27
The Medicines Company NasdaqGS:MDCO 37.41 69.4 2,597.9 64.7 573.5 2,662.6 383.6 (151.8) (184.4) 0.15 31.5 284.1 (302.2) (4.56) 13.7 NA
UCB S.A. ENXTBR:UCB 92.30 188.7 17,417.1 1,030.1 2,464.1 18,447.2 4,210.7 876.6 602.1 0.98 132.8 4,361.0 934.4 2.70 33.6 1.22
United Therapeutics Corporation NasdaqGS:UTHR 158.53 45.6 7,233.6 (891.8) 30.0 6,341.8 1,407.3 756.5 722.7 6.81 7.8 1,599.8 945.1 11.59 32.2 NA
Valeant Pharmaceuticals International, Inc. NYSE:VRX 102.33 341.2 34,914.1 29,447.3 30,883.3 64,361.4 9,905.8 4,889.2 2,744.3 2.09 1,355.6 11,825.7 6,177.2 11.86 18.5 NA
Margin Anlysis Enterprise Value/ P/E Debt/Data Gross NTM NTM NTM Market Interest Price to Dividend
Company Ticker FYE as of Profit EBITDA EBIT Sales EBITDA EBIT Sales EBITDA LTM Forecast EV Cap EBITDA Coverage Book %
Allergan plc NYSE:AGN 31-Dec 30-Dec-15 82.2% 38.2% 1.5% 13.6 x 35.6 x 891.4 x 9.5 x 18.9 x NM 20.7 x 25.9% 34.4% 9.2 x 0.2 x 1.7 x NA
Almirall, S.A. BME:ALM 31-Dec 30-Dec-15 77.8% 18.3% 10.4% 3.4 x 18.8 x 33.2 x 4.0 x 12.2 x NM 24.4 x 11.7% 9.9% 2.2 x 8.1 x 2.3 x 1.0%
Concordia International Corp. TSX:CXR 31-Dec 30-Dec-15 91.1% 67.9% 48.9% 11.7 x 17.2 x 23.9 x 3.0 x 4.7 x 51.8 x 5.9 x 47.7% 61.6% 8.2 x 1.7 x 1.7 x NA
Indivior PLC LSE:INDV 31-Dec 30-Dec-15 90.9% 44.4% 42.0% 2.1 x 4.7 x 4.9 x 2.2 x 6.4 x 5.5 x 11.0 x 32.1% 34.3% 1.5 x 9.1 x NM 3.4%
Ipsen S.A. ENXTPA:IPN 31-Dec 30-Dec-15 77.5% 22.0% 19.5% 3.3 x 15.1 x 17.1 x 3.2 x 12.5 x 30.9 x 20.6 x 0.9% 0.9% 0.1 x 85.2 x 4.1 x 1.4%
Jazz Pharmaceuticals Public Limited CompanyNasdaqGS:JAZZ 31-Dec 30-Dec-15 91.8% 50.4% 41.6% 6.9 x 13.7 x 16.6 x 6.2 x 10.0 x 31.3 x 13.1 x 14.2% 14.7% 1.9 x 8.9 x 5.6 x NA
H. Lundbeck A/S CPSE:LUN 31-Dec 30-Dec-15 65.7% 40.7% NM 3.4 x 8.4 x NM 3.4 x NM NM 34.9 x 8.8% 9.4% 0.7 x NM 5.0 x NA
Recordati SpA BIT:REC 31-Dec 30-Dec-15 67.6% 29.7% 26.0% 4.7 x 16.0 x 18.2 x 4.6 x 15.4 x 32.3 x 25.1 x 6.6% 6.7% 1.1 x 20.2 x 5.4 x 2.5%
Shire plc LSE:SHP 31-Dec 30-Dec-15 85.5% 43.2% 34.3% 6.8 x 15.8 x 20.0 x 6.2 x 13.2 x 29.2 x 17.1 x 4.8% 5.1% 0.8 x 58.6 x 4.3 x 0.4%
The Medicines Company NasdaqGS:MDCO 31-Dec 30-Dec-15 70.9% NM NM 6.9 x NM NM 9.4 x NM NM NM 21.5% 22.1% -3.8 x NM 2.7 x NA
UCB S.A. ENXTBR:UCB 31-Dec 30-Dec-15 69.9% 20.8% 14.3% 4.4 x 21.0 x 30.6 x 4.2 x 19.7 x 94.1 x 34.2 x 13.4% 14.1% 2.8 x 4.5 x 2.7 x 1.3%
United Therapeutics Corporation NasdaqGS:UTHR 31-Dec 30-Dec-15 95.8% 53.8% 51.4% 4.5 x 8.4 x 8.8 x 4.0 x 6.7 x 23.3 x 13.7 x 0.5% 0.4% 0.0 x 93.1 x 4.9 x NA
Valeant Pharmaceuticals International, Inc. NYSE:VRX 31-Dec 30-Dec-15 75.9% 49.4% 27.7% 6.5 x 13.2 x 23.5 x 5.4 x 10.4 x 49.0 x 8.6 x 48.0% 88.5% 6.3 x 2.0 x 5.5 x NA
Median 77.8% 41.9% 27.7% 4.7 x 15.5 x 20.0 x 4.2 x 12.2 x 31.3 x 18.9 x 13.4% 14.1% 1.5 x 8.9 x 4.2 x 1.4%
* All estimates from Capital IQ Mean 80.2% 39.9% 28.9% 6.0 x 15.7 x 98.9 x 5.0 x 11.8 x 38.6 x 19.1 x 18.2% 23.2% 2.4 x 26.5 x 3.8 x 1.7%
Debt calculations only included for entities with debt Min 65.7% 18.3% 1.5% 2.1 x 4.7 x 4.9 x 2.2 x 4.7 x 5.5 x 5.9 x 0.5% 0.4% -3.8 x 0.2 x 1.7 x 0.4%
NM - not meaningful Max 95.8% 67.9% 51.4% 13.6 x 35.6 x 891.4 x 9.5 x 19.7 x 94.1 x 34.9 x 48.0% 88.5% 9.2 x 93.1 x 5.6 x 3.4%
Source:Bourne Partners Internal Research; CapitalIQ September 2016

23
Trading Comparables as of March 31, 2016
Publicly Traded Comparable Branded Spec Pharma Companies
USD in millions, except for per-share amounts42459 LTM NTM Forecast
Share Shares Equity Net Debt Total Enterprise Interest Book DividendCompany Ticker Price Out Value (Cash) Debt Value Sales EBITDA EBIT EPS Expense Sales EBITDA EPS Value /share
Allergan plc NYSE:AGN $274.94 395.1 $108,635.7 $41,620.9 $42,726.2 $150,256.6 $15,071.0 $5,932.9 $350.9 ($1.41) $1,193.3 $17,024.0 $8,263.3 $14.08 $181.7 NA
Almirall, S.A. BME:ALM 16.87 173.0 2,917.0 (561.9) 380.8 2,355.1 801.0 173.0 100.8 0.44 0.0 848.6 253.3 0.59 9.2 0.21
Concordia International Corp. TSX:CXR 24.32 51.0 1,240.7 3,165.9 3,321.3 4,406.6 394.2 249.4 173.2 0.71 127.8 976.0 607.0 6.37 22.7 NA
Indivior PLC LSE:INDV 2.37 718.6 1,701.2 138.0 605.0 1,839.2 1,014.0 409.0 377.0 0.27 61.0 954.0 303.4 0.24 (0.4) 0.10
Ipsen S.A. ENXTPA:IPN 55.66 83.9 4,672.8 (205.5) 47.5 4,467.3 1,651.0 381.6 340.6 2.56 1.3 1,845.0 444.9 3.26 16.2 0.94
Jazz Pharmaceuticals Public Limited CompanyNasdaqGS:JAZZ 124.03 61.2 7,588.7 215.7 1,204.5 7,804.4 1,324.8 667.6 559.5 5.15 56.9 1,525.8 912.6 11.16 26.1 NA
H. Lundbeck A/S CPSE:LUN 33.66 197.3 6,642.7 327.3 548.7 6,970.0 2,123.9 30.6 (168.2) (0.61) 15.7 2,151.2 392.3 0.63 6.5 NA
Recordati SpA BIT:REC 24.94 205.4 5,122.9 114.8 359.7 5,237.7 1,137.9 349.5 307.7 0.89 13.3 1,239.7 380.8 1.14 4.6 0.67
Shire plc LSE:SHP 56.41 578.1 32,610.1 1,445.9 1,581.4 34,056.0 6,416.7 2,854.5 2,217.3 2.31 41.6 7,173.0 3,276.0 4.22 16.6 0.27
The Medicines Company NasdaqGS:MDCO 30.99 69.9 2,166.3 205.8 579.0 2,372.1 309.0 (222.5) (257.3) (2.65) 37.1 200.9 (295.0) (2.53) 10.6 NA
UCB S.A. ENXTBR:UCB 76.79 188.3 14,456.6 1,002.4 2,398.0 15,459.0 4,209.6 900.4 626.7 1.41 93.4 4,662.6 1,122.5 3.36 32.7 1.22
United Therapeutics Corporation NasdaqGS:UTHR 109.94 45.4 4,986.1 (948.4) 5.4 4,037.7 1,465.8 731.9 699.0 9.44 4.7 1,658.8 993.8 14.48 34.7 NA
Valeant Pharmaceuticals International, Inc. NYSE:VRX 27.07 341.2 9,236.0 30,490.6 31,103.9 39,726.6 10,441.5 5,124.0 2,628.5 1.75 1,563.2 11,017.8 5,604.0 8.92 17.2 NA
Margin Anlysis Enterprise Value/ P/E Debt/Data Gross NTM NTM NTM Market Interest Price to Dividend
Company Ticker FYE as of Profit EBITDA EBIT Sales EBITDA EBIT Sales EBITDA LTM Forecast EV Cap EBITDA Coverage Book %
Allergan plc NYSE:AGN 31-Dec 30-Mar-16 76.6% 39.4% 2.3% 10.0 x 25.3 x 428.2 x 8.8 x 18.2 x NM 19.5 x 28.4% 39.3% 7.2 x 0.3 x 1.5 x NA
Almirall, S.A. BME:ALM 31-Dec 30-Mar-16 75.8% 21.6% 12.6% 2.9 x 13.6 x 23.4 x 2.8 x 9.3 x 38.3 x 28.6 x 16.2% 13.1% 2.2 x NM 1.8 x 1.3%
Concordia International Corp. TSX:CXR 31-Dec 30-Mar-16 84.7% 63.3% 43.9% 11.2 x 17.7 x 25.4 x 4.5 x 7.3 x 34.1 x 3.8 x 75.4% 267.7% NM 1.4 x 1.1 x NA
Indivior PLC LSE:INDV 31-Dec 30-Mar-16 90.4% 40.3% 37.2% 1.8 x 4.5 x 4.9 x 1.9 x 6.1 x 8.6 x 10.1 x 32.9% 35.6% 1.5 x 6.2 x NM 4.0%
Ipsen S.A. ENXTPA:IPN 31-Dec 30-Mar-16 77.8% 23.1% 20.6% 2.7 x 11.7 x 13.1 x 2.4 x 10.0 x 21.8 x 17.1 x 1.1% 1.0% 0.1 x NM 3.4 x 1.7%
Jazz Pharmaceuticals Public Limited CompanyNasdaqGS:JAZZ 31-Dec 30-Mar-16 92.3% 50.4% 42.2% 5.9 x 11.7 x 13.9 x 5.1 x 8.6 x 24.1 x 11.1 x 15.4% 15.9% 1.8 x 9.8 x 4.8 x NA
H. Lundbeck A/S CPSE:LUN 31-Dec 30-Mar-16 65.6% 1.4% NM 3.3 x NM NM 3.2 x 17.8 x NM 53.8 x 7.9% 8.3% NM NM 5.2 x NA
Recordati SpA BIT:REC 31-Dec 30-Mar-16 68.0% 30.7% 27.0% 4.6 x 15.0 x 17.0 x 4.2 x 13.8 x 27.9 x 21.8 x 6.9% 7.0% 1.0 x 23.2 x 5.4 x 2.7%
Shire plc LSE:SHP 31-Dec 30-Mar-16 85.4% 44.5% 34.6% 5.3 x 11.9 x 15.4 x 4.7 x 10.4 x 24.4 x 13.4 x 4.6% 4.8% 0.6 x 53.3 x 3.4 x 0.5%
The Medicines Company NasdaqGS:MDCO 31-Dec 30-Mar-16 62.4% NM NM 7.7 x NM NM 11.8 x NM NM NM 24.4% 26.7% -2.6 x NM 2.9 x NA
UCB S.A. ENXTBR:UCB 31-Dec 30-Mar-16 70.1% 21.4% 14.9% 3.7 x 17.2 x 24.7 x 3.3 x 13.8 x 54.4 x 22.9 x 15.5% 16.6% 2.7 x 6.7 x 2.3 x 1.6%
United Therapeutics Corporation NasdaqGS:UTHR 31-Dec 30-Mar-16 95.3% 49.9% 47.7% 2.8 x 5.5 x 5.8 x 2.4 x 4.1 x 11.7 x 7.6 x 0.1% 0.1% 0.0 x 147.6 x 3.2 x NA
Valeant Pharmaceuticals International, Inc. NYSE:VRX 31-Dec 30-Mar-16 76.6% 49.1% 25.2% 3.8 x 7.8 x 15.1 x 3.6 x 7.1 x 15.5 x 3.0 x 78.3% 336.8% 6.1 x 1.7 x 1.6 x NA
Median 76.6% 39.9% 27.0% 3.8 x 11.9 x 15.4 x 3.6 x 9.7 x 24.3 x 15.2 x 15.5% 15.9% 1.5 x 6.7 x 3.0 x 1.6%
* All estimates from Capital IQ Mean 78.5% 36.3% 28.0% 5.0 x 12.9 x 53.4 x 4.5 x 10.5 x 26.1 x 17.7 x 23.6% 59.5% 1.9 x 27.8 x 3.1 x 1.9%
Debt calculations only included for entities with debt Min 62.4% 1.4% 2.3% 1.8 x 4.5 x 4.9 x 1.9 x 4.1 x 8.6 x 3.0 x 0.1% 0.1% -2.6 x 0.3 x 1.1 x 0.5%
NM - not meaningful Max 95.3% 63.3% 47.7% 11.2 x 25.3 x 428.2 x 11.8 x 18.2 x 54.4 x 53.8 x 78.3% 336.8% 7.2 x 147.6 x 5.4 x 4.0%
Source:Bourne Partners Internal Research; CapitalIQ September 2016

24
Trading Comparables as of June 30, 2016
Publicly Traded Comparable Branded Spec Pharma Companies
USD in millions, except for per-share amounts42551 LTM NTM Forecast
Share Shares Equity Net Debt Total Enterprise Interest Book DividendCompany Ticker Price Out Value (Cash) Debt Value Sales EBITDA EBIT EPS Expense Sales EBITDA EPS Value /share
Allergan plc NYSE:AGN $231.09 395.6 $91,409.2 $39,075.1 $39,581.7 $130,484.3 $16,543.4 $6,381.1 ($67.0) ($1.41) $1,360.1 $17,117.0 $8,237.9 $15.07 $181.2 NA
Almirall, S.A. BME:ALM 14.89 173.0 2,575.7 (143.8) 373.9 2,431.9 841.5 177.1 91.4 0.44 0.5 840.9 259.0 0.67 9.7 0.21
Concordia International Corp. TSX:CXR 21.44 51.0 1,093.9 3,114.1 3,259.5 4,208.0 745.2 446.1 290.1 0.71 237.1 987.5 623.7 6.65 7.2 NA
Indivior PLC LSE:INDV 3.34 720.6 2,405.5 (26.0) 551.0 2,379.5 1,028.0 391.0 359.0 0.27 56.0 951.0 303.5 0.24 (0.2) 0.10
Ipsen S.A. ENXTPA:IPN 61.56 84.0 5,168.4 (4.8) 414.6 5,163.6 1,749.0 420.3 379.0 2.56 0.2 1,851.1 462.3 3.33 17.0 0.94
Jazz Pharmaceuticals Public Limited CompanyNasdaqGS:JAZZ 141.31 60.5 8,547.3 262.8 1,179.2 8,810.1 1,398.9 697.7 588.1 5.15 49.2 1,567.4 884.8 11.73 28.0 NA
H. Lundbeck A/S CPSE:LUN 37.29 197.5 7,364.5 265.4 482.3 7,629.9 2,227.4 (523.9) (20.7) (0.61) 6.1 2,187.5 436.3 0.67 6.7 NA
Recordati SpA BIT:REC 29.99 205.4 6,160.1 200.8 357.2 6,361.0 1,217.7 391.9 350.1 0.89 12.5 1,281.3 403.5 1.24 5.0 0.67
Shire plc LSE:SHP 61.70 891.9 55,031.9 23,338.5 24,031.9 78,370.4 7,509.1 3,361.7 2,586.5 2.31 152.6 11,993.8 5,020.4 4.46 43.6 0.27
The Medicines Company NasdaqGS:MDCO 33.63 69.6 2,339.6 19.7 663.9 2,359.3 229.4 (303.9) (338.4) (2.65) 39.2 177.6 (292.5) (4.00) 11.9 NA
UCB S.A. ENXTBR:UCB 74.63 188.3 14,049.4 1,381.5 2,399.9 15,430.9 4,417.8 1,021.7 760.7 1.41 112.2 4,643.6 1,152.7 3.55 30.5 1.22
United Therapeutics Corporation NasdaqGS:UTHR 105.92 44.5 4,718.6 (943.8) 0.9 3,774.8 1,572.7 1,222.7 1,190.9 9.44 2.5 1,647.1 966.6 14.96 41.3 NA
Valeant Pharmaceuticals International, Inc. NYSE:VRX 20.14 343.0 6,908.6 30,213.9 31,067.3 37,122.5 10,330.8 4,628.7 1,724.3 1.75 1,751.8 10,211.0 4,915.6 7.08 15.4 NA
Margin Anlysis Enterprise Value/ P/E Debt/Data Gross NTM NTM NTM Market Interest Price to Dividend
Company Ticker FYE as of Profit EBITDA EBIT Sales EBITDA EBIT Sales EBITDA LTM Forecast EV Cap EBITDA Coverage Book %
Allergan plc NYSE:AGN 31-Dec 30-Jun-16 78.8% 38.6% NM 7.9 x 20.4 x NM 7.6 x 15.8 x NM 15.3 x 30.3% 43.3% 6.2 x NM 1.3 x NA
Almirall, S.A. BME:ALM 31-Dec 30-Jun-16 75.8% 21.0% 10.9% 2.9 x 13.7 x 26.6 x 2.9 x 9.4 x 33.9 x 22.2 x 15.4% 14.5% 2.1 x NM 1.5 x 1.4%
Concordia International Corp. TSX:CXR 31-Dec 30-Jun-16 79.4% 59.9% 38.9% 5.6 x 9.4 x 14.5 x 4.3 x 6.7 x 30.0 x 3.2 x 77.5% 298.0% 7.3 x 1.2 x 3.0 x NA
Indivior PLC LSE:INDV 31-Dec 30-Jun-16 91.1% 38.0% 34.9% 2.3 x 6.1 x 6.6 x 2.5 x 7.8 x 12.1 x 14.1 x 23.2% 22.9% 1.4 x 6.4 x NM 2.8%
Ipsen S.A. ENXTPA:IPN 31-Dec 30-Jun-16 78.4% 24.0% 21.7% 3.0 x 12.3 x 13.6 x 2.8 x 11.2 x 24.1 x 18.5 x 8.0% 8.0% 1.0 x NM 3.6 x 1.5%
Jazz Pharmaceuticals Public Limited CompanyNasdaqGS:JAZZ 31-Dec 30-Jun-16 92.9% 49.9% 42.0% 6.3 x 12.6 x 15.0 x 5.6 x 10.0 x 27.5 x 12.1 x 13.4% 13.8% 1.7 x 12.0 x 5.1 x NA
H. Lundbeck A/S CPSE:LUN 31-Dec 30-Jun-16 68.6% NM NM 3.4 x NM NM 3.5 x 17.5 x NM 55.9 x 6.3% 6.5% -0.9 x NM 5.6 x NA
Recordati SpA BIT:REC 31-Dec 30-Jun-16 68.7% 32.2% 28.8% 5.2 x 16.2 x 18.2 x 5.0 x 15.8 x 33.5 x 24.2 x 5.6% 5.8% 0.9 x 28.1 x 6.0 x 2.2%
Shire plc LSE:SHP 31-Dec 30-Jun-16 83.6% 44.8% 34.4% 10.4 x 23.3 x 30.3 x 6.5 x 15.6 x 26.7 x 13.8 x 30.7% 43.7% 7.1 x 16.9 x 1.4 x 0.4%
The Medicines Company NasdaqGS:MDCO 31-Dec 30-Jun-16 54.2% NM NM 10.3 x NM NM 13.3 x NM NM NM 28.1% 28.4% -2.2 x NM 2.8 x NA
UCB S.A. ENXTBR:UCB 31-Dec 30-Jun-16 70.3% 23.1% 17.2% 3.5 x 15.1 x 20.3 x 3.3 x 13.4 x 52.9 x 21.0 x 15.6% 17.1% 2.3 x 6.8 x 2.4 x 1.6%
United Therapeutics Corporation NasdaqGS:UTHR 31-Dec 30-Jun-16 96.6% 77.7% 75.7% 2.4 x 3.1 x 3.2 x 2.3 x 3.9 x 11.2 x 7.1 x 0.0% 0.0% 0.0 x NM 2.6 x NA
Valeant Pharmaceuticals International, Inc. NYSE:VRX 31-Dec 30-Jun-16 75.5% 44.8% 16.7% 3.6 x 8.0 x 21.5 x 3.6 x 7.6 x 11.5 x 2.8 x 83.7% 449.7% 6.7 x 1.0 x 1.3 x NA
Median 78.4% 38.6% 31.6% 3.6 x 12.6 x 16.6 x 3.6 x 10.6 x 27.1 x 14.7 x 15.6% 17.1% 1.7 x 6.8 x 2.7 x 1.6%
* All estimates from Capital IQ Mean 78.0% 41.3% 32.1% 5.1 x 12.8 x 17.0 x 4.9 x 11.2 x 26.3 x 17.5 x 26.0% 73.2% 2.6 x 10.3 x 3.0 x 1.7%
Debt calculations only included for entities with debt Min 54.2% 21.0% 10.9% 2.3 x 3.1 x 3.2 x 2.3 x 3.9 x 11.2 x 2.8 x 0.0% 0.0% -2.2 x 1.0 x 1.3 x 0.4%
NM - not meaningful Max 96.6% 77.7% 75.7% 10.4 x 23.3 x 30.3 x 13.3 x 17.5 x 52.9 x 55.9 x 83.7% 449.7% 7.3 x 28.1 x 6.0 x 2.8%
Source:Bourne Partners Internal Research; CapitalIQ September 2016
25
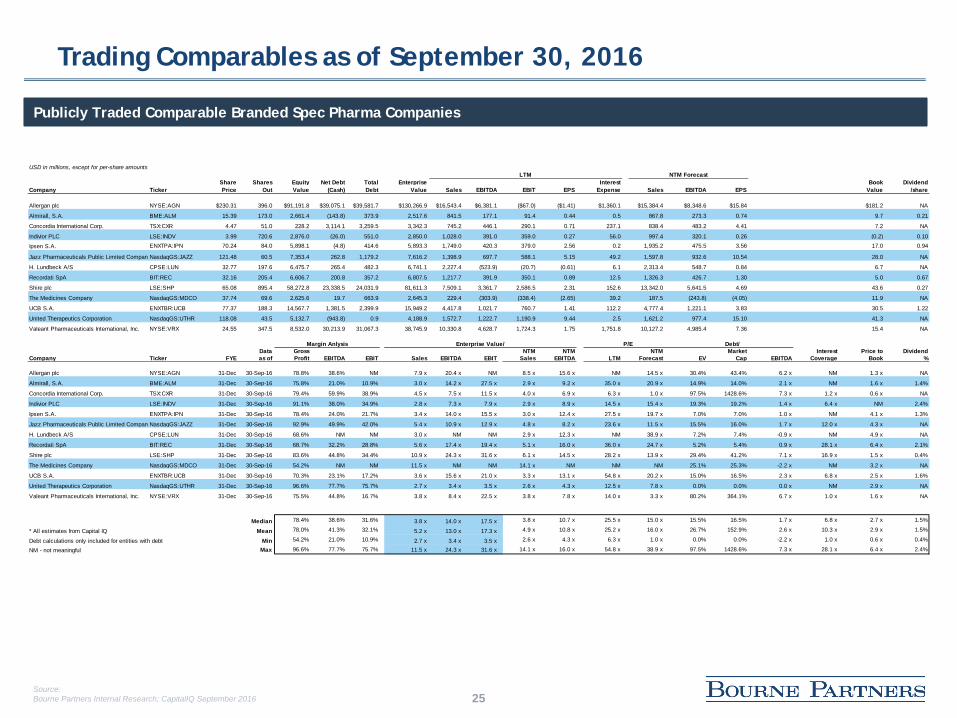
Trading Comparables as of September 30, 2016
Publicly Traded Comparable Branded Spec Pharma Companies
USD in millions, except for per-share amounts42643 LTM NTM Forecast
Share Shares Equity Net Debt Total Enterprise Interest Book DividendCompany Ticker Price Out Value (Cash) Debt Value Sales EBITDA EBIT EPS Expense Sales EBITDA EPS Value /share
Allergan plc NYSE:AGN $230.31 396.0 $91,191.8 $39,075.1 $39,581.7 $130,266.9 $16,543.4 $6,381.1 ($67.0) ($1.41) $1,360.1 $15,384.4 $8,348.6 $15.84 $181.2 NA
Almirall, S.A. BME:ALM 15.39 173.0 2,661.4 (143.8) 373.9 2,517.6 841.5 177.1 91.4 0.44 0.5 867.8 273.3 0.74 9.7 0.21
Concordia International Corp. TSX:CXR 4.47 51.0 228.2 3,114.1 3,259.5 3,342.3 745.2 446.1 290.1 0.71 237.1 838.4 483.2 4.41 7.2 NA
Indivior PLC LSE:INDV 3.99 720.6 2,876.0 (26.0) 551.0 2,850.0 1,028.0 391.0 359.0 0.27 56.0 997.4 320.1 0.26 (0.2) 0.10
Ipsen S.A. ENXTPA:IPN 70.24 84.0 5,898.1 (4.8) 414.6 5,893.3 1,749.0 420.3 379.0 2.56 0.2 1,935.2 475.5 3.56 17.0 0.94
Jazz Pharmaceuticals Public Limited CompanyNasdaqGS:JAZZ 121.48 60.5 7,353.4 262.8 1,179.2 7,616.2 1,398.9 697.7 588.1 5.15 49.2 1,597.8 932.6 10.54 28.0 NA
H. Lundbeck A/S CPSE:LUN 32.77 197.6 6,475.7 265.4 482.3 6,741.1 2,227.4 (523.9) (20.7) (0.61) 6.1 2,313.4 548.7 0.84 6.7 NA
Recordati SpA BIT:REC 32.16 205.4 6,606.7 200.8 357.2 6,807.5 1,217.7 391.9 350.1 0.89 12.5 1,326.3 426.7 1.30 5.0 0.67
Shire plc LSE:SHP 65.08 895.4 58,272.8 23,338.5 24,031.9 81,611.3 7,509.1 3,361.7 2,586.5 2.31 152.6 13,342.0 5,641.5 4.69 43.6 0.27
The Medicines Company NasdaqGS:MDCO 37.74 69.6 2,625.6 19.7 663.9 2,645.3 229.4 (303.9) (338.4) (2.65) 39.2 187.5 (243.8) (4.05) 11.9 NA
UCB S.A. ENXTBR:UCB 77.37 188.3 14,567.7 1,381.5 2,399.9 15,949.2 4,417.8 1,021.7 760.7 1.41 112.2 4,777.4 1,221.1 3.83 30.5 1.22
United Therapeutics Corporation NasdaqGS:UTHR 118.08 43.5 5,132.7 (943.8) 0.9 4,188.9 1,572.7 1,222.7 1,190.9 9.44 2.5 1,621.2 977.4 15.10 41.3 NA
Valeant Pharmaceuticals International, Inc. NYSE:VRX 24.55 347.5 8,532.0 30,213.9 31,067.3 38,745.9 10,330.8 4,628.7 1,724.3 1.75 1,751.8 10,127.2 4,985.4 7.36 15.4 NA
Margin Anlysis Enterprise Value/ P/E Debt/Data Gross NTM NTM NTM Market Interest Price to Dividend
Company Ticker FYE as of Profit EBITDA EBIT Sales EBITDA EBIT Sales EBITDA LTM Forecast EV Cap EBITDA Coverage Book %
Allergan plc NYSE:AGN 31-Dec 30-Sep-16 78.8% 38.6% NM 7.9 x 20.4 x NM 8.5 x 15.6 x NM 14.5 x 30.4% 43.4% 6.2 x NM 1.3 x NA
Almirall, S.A. BME:ALM 31-Dec 30-Sep-16 75.8% 21.0% 10.9% 3.0 x 14.2 x 27.5 x 2.9 x 9.2 x 35.0 x 20.9 x 14.9% 14.0% 2.1 x NM 1.6 x 1.4%
Concordia International Corp. TSX:CXR 31-Dec 30-Sep-16 79.4% 59.9% 38.9% 4.5 x 7.5 x 11.5 x 4.0 x 6.9 x 6.3 x 1.0 x 97.5% 1428.6% 7.3 x 1.2 x 0.6 x NA
Indivior PLC LSE:INDV 31-Dec 30-Sep-16 91.1% 38.0% 34.9% 2.8 x 7.3 x 7.9 x 2.9 x 8.9 x 14.5 x 15.4 x 19.3% 19.2% 1.4 x 6.4 x NM 2.4%
Ipsen S.A. ENXTPA:IPN 31-Dec 30-Sep-16 78.4% 24.0% 21.7% 3.4 x 14.0 x 15.5 x 3.0 x 12.4 x 27.5 x 19.7 x 7.0% 7.0% 1.0 x NM 4.1 x 1.3%
Jazz Pharmaceuticals Public Limited CompanyNasdaqGS:JAZZ 31-Dec 30-Sep-16 92.9% 49.9% 42.0% 5.4 x 10.9 x 12.9 x 4.8 x 8.2 x 23.6 x 11.5 x 15.5% 16.0% 1.7 x 12.0 x 4.3 x NA
H. Lundbeck A/S CPSE:LUN 31-Dec 30-Sep-16 68.6% NM NM 3.0 x NM NM 2.9 x 12.3 x NM 38.9 x 7.2% 7.4% -0.9 x NM 4.9 x NA
Recordati SpA BIT:REC 31-Dec 30-Sep-16 68.7% 32.2% 28.8% 5.6 x 17.4 x 19.4 x 5.1 x 16.0 x 36.0 x 24.7 x 5.2% 5.4% 0.9 x 28.1 x 6.4 x 2.1%
Shire plc LSE:SHP 31-Dec 30-Sep-16 83.6% 44.8% 34.4% 10.9 x 24.3 x 31.6 x 6.1 x 14.5 x 28.2 x 13.9 x 29.4% 41.2% 7.1 x 16.9 x 1.5 x 0.4%
The Medicines Company NasdaqGS:MDCO 31-Dec 30-Sep-16 54.2% NM NM 11.5 x NM NM 14.1 x NM NM NM 25.1% 25.3% -2.2 x NM 3.2 x NA
UCB S.A. ENXTBR:UCB 31-Dec 30-Sep-16 70.3% 23.1% 17.2% 3.6 x 15.6 x 21.0 x 3.3 x 13.1 x 54.8 x 20.2 x 15.0% 16.5% 2.3 x 6.8 x 2.5 x 1.6%
United Therapeutics Corporation NasdaqGS:UTHR 31-Dec 30-Sep-16 96.6% 77.7% 75.7% 2.7 x 3.4 x 3.5 x 2.6 x 4.3 x 12.5 x 7.8 x 0.0% 0.0% 0.0 x NM 2.9 x NA
Valeant Pharmaceuticals International, Inc. NYSE:VRX 31-Dec 30-Sep-16 75.5% 44.8% 16.7% 3.8 x 8.4 x 22.5 x 3.8 x 7.8 x 14.0 x 3.3 x 80.2% 364.1% 6.7 x 1.0 x 1.6 x NA
Median 78.4% 38.6% 31.6% 3.8 x 14.0 x 17.5 x 3.8 x 10.7 x 25.5 x 15.0 x 15.5% 16.5% 1.7 x 6.8 x 2.7 x 1.5%
* All estimates from Capital IQ Mean 78.0% 41.3% 32.1% 5.2 x 13.0 x 17.3 x 4.9 x 10.8 x 25.2 x 16.0 x 26.7% 152.9% 2.6 x 10.3 x 2.9 x 1.5%
Debt calculations only included for entities with debt Min 54.2% 21.0% 10.9% 2.7 x 3.4 x 3.5 x 2.6 x 4.3 x 6.3 x 1.0 x 0.0% 0.0% -2.2 x 1.0 x 0.6 x 0.4%
NM - not meaningful Max 96.6% 77.7% 75.7% 11.5 x 24.3 x 31.6 x 14.1 x 16.0 x 54.8 x 38.9 x 97.5% 1428.6% 7.3 x 28.1 x 6.4 x 2.4%
Source:Bourne Partners Internal Research; CapitalIQ September 2016

26
Trading Comparables as of December 31, 2015
Publicly Traded Comparable Generic Spec Pharma Companies
USD in millions, except for per-share amounts0 LTM NTM Forecast
Share Shares Equity Net Debt Total Enterprise Interest Book DividendCompany Ticker Price Out Value (Cash) Debt Value Sales EBITDA EBIT EPS Expense Sales EBITDA EPS Value /share
Akorn, Inc. NasdaqGS:AKRX $37.22 114.4 $4,259.2 $757.4 $1,077.6 $5,016.6 $908.0 $391.7 $307.2 $0.42 $57.4 $969.0 $454.0 $1.95 $4.9 NA
Hikma Pharmaceuticals PLC LSE:HIK 34.02 199.3 6,782.3 175.0 728.0 6,957.3 1,450.0 452.5 388.5 1.18 33.5 0.0 575.4 0.00 6.7 0.32
Impax Laboratories Inc. NasdaqGS:IPXL 43.60 68.2 2,972.6 101.0 419.4 3,073.6 709.6 119.5 65.1 0.93 19.2 938.5 277.2 2.05 14.7 NA
Lupin Limited BSE:500257 27.63 450.5 12,448.1 1.5 284.5 12,449.6 1,924.8 521.8 443.9 0.75 2.1 2,402.6 656.6 1.03 3.3 0.11
Mylan N.V. NasdaqGS:MYL 54.62 491.8 26,863.7 5,796.5 6,434.2 32,660.2 9,021.3 2,601.6 1,769.4 2.07 350.5 10,671.1 3,752.2 4.87 20.0 NA
Nichi-Iko Pharmaceutical Co., Ltd. TSE:4541 24.11 59.7 1,440.2 101.6 182.8 1,541.8 1,128.0 134.3 92.1 0.84 0.9 1,288.7 173.6 1.38 11.0 0.26
Perrigo Company plc NYSE:PRGO 145.24 146.4 21,263.4 4,852.0 5,375.0 26,115.4 4,997.1 1,447.7 850.1 2.83 167.0 6,144.9 1,856.2 9.04 73.3 0.54
Taro Pharmaceutical Industries Ltd. NYSE:TARO 154.63 42.8 6,623.3 (1,056.9) 5.4 5,566.4 909.2 590.8 575.2 8.41 0.9 0.0 0.0 0.00 37.6 NA
Teva Pharmaceutical Industries Limited NYSE:TEVA 66.08 852.0 56,300.2 10,736.0 11,664.0 67,036.2 19,939.0 6,436.0 5,106.0 3.07 264.0 19,956.2 8,513.0 5.49 26.7 1.36
Margin Anlysis Enterprise Value/ P/E Debt/Data Gross NTM NTM NTM Market Interest Price to Dividend
Company Ticker FYE as of Profit EBITDA EBIT Sales EBITDA EBIT Sales EBITDA LTM Forecast EV Cap EBITDA Coverage Book %
Akorn, Inc. NasdaqGS:AKRX 31-Dec 30-Dec-15 60.3% 43.1% 33.8% 5.5 x 12.8 x 16.3 x 5.2 x 11.1 x 89.5 x 19.1 x 21.5% 25.3% 2.8 x 5.4 x 7.6 x NA
Hikma Pharmaceuticals PLC LSE:HIK 31-Dec 30-Dec-15 54.0% 31.2% 26.8% 4.8 x 15.4 x 17.9 x NM 12.1 x 28.9 x NM 10.5% 10.7% 1.6 x 11.6 x 5.1 x 0.9%
Impax Laboratories Inc. NasdaqGS:IPXL 31-Dec 30-Dec-15 43.4% 16.8% 9.2% 4.3 x 25.7 x 47.2 x 3.3 x 11.1 x 46.9 x 21.3 x 13.6% 14.1% 3.5 x 3.4 x 3.0 x NA
Lupin Limited BSE:500257 31-Mar 30-Dec-15 59.2% 27.1% 23.1% 6.5 x 23.9 x 28.0 x 5.2 x 19.0 x 37.0 x 26.8 x 2.3% 2.3% 0.5 x NM 8.3 x 0.4%
Mylan N.V. NasdaqGS:MYL 31-Dec 30-Dec-15 47.3% 28.8% 19.6% 3.6 x 12.6 x 18.5 x 3.1 x 8.7 x 26.4 x 11.2 x 19.7% 24.0% 2.5 x 5.0 x 2.7 x NA
Nichi-Iko Pharmaceutical Co., Ltd. TSE:4541 31-Mar 30-Dec-15 37.3% 11.9% 8.2% 1.4 x 11.5 x 16.7 x 1.2 x 8.9 x 28.8 x 17.4 x 11.9% 12.7% 1.4 x 97.6 x 2.2 x 1.1%
Perrigo Company plc NYSE:PRGO 31-Dec 30-Dec-15 39.1% 29.0% 17.0% 5.2 x 18.0 x 30.7 x 4.2 x 14.1 x 51.4 x 16.1 x 20.6% 25.3% 3.7 x 5.1 x 2.0 x 0.4%
Taro Pharmaceutical Industries Ltd. NYSE:TARO 31-Mar 30-Dec-15 80.9% 65.0% 63.3% 6.1 x 9.4 x 9.7 x NM NM 18.4 x NM 0.1% 0.1% 0.0 x NM 4.1 x NA
Teva Pharmaceutical Industries Limited NYSE:TEVA 31-Dec 30-Dec-15 57.2% 32.3% 25.6% 3.4 x 10.4 x 13.1 x 3.4 x 7.9 x 21.5 x 12.0 x 17.4% 20.7% 1.8 x 19.3 x 2.5 x 2.1%
Median 54.0% 29.0% 23.1% 4.8 x 12.8 x 17.9 x 3.4 x 11.1 x 28.9 x 17.4 x 13.6% 14.1% 1.8 x 5.4 x 3.0 x 0.9%
* All estimates from Capital IQ Mean 53.2% 31.7% 25.2% 4.5 x 15.5 x 22.0 x 3.6 x 11.6 x 38.8 x 17.7 x 13.1% 15.0% 2.0 x 21.1 x 4.2 x 1.0%
Debt calculations only included for entities with debt Min 37.3% 11.9% 8.2% 1.4 x 9.4 x 9.7 x 1.2 x 7.9 x 18.4 x 11.2 x 0.1% 0.1% 0.0 x 3.4 x 2.0 x 0.4%
NM - not meaningful Max 80.9% 65.0% 63.3% 6.5 x 25.7 x 47.2 x 5.2 x 19.0 x 89.5 x 26.8 x 21.5% 25.3% 3.7 x 97.6 x 8.3 x 2.1%
Source:Bourne Partners Internal Research; CapitalIQ September 2016

27
Trading Comparables as of March 31, 2016
Publicly Traded Comparable Generic Spec Pharma Companies
USD in millions, except for per-share amounts0 LTM NTM Forecast
Share Shares Equity Net Debt Total Enterprise Interest Book DividendCompany Ticker Price Out Value (Cash) Debt Value Sales EBITDA EBIT EPS Expense Sales EBITDA EPS Value /share
Akorn, Inc. NasdaqGS:AKRX $22.71 114.4 $2,598.8 $722.2 $1,074.4 $3,321.0 $985.1 $421.1 $334.1 $1.45 $56.3 $975.8 $449.2 $1.93 $5.2 NA
Hikma Pharmaceuticals PLC LSE:HIK 28.33 239.3 6,779.8 175.0 728.0 6,954.8 1,440.0 465.0 399.0 1.06 40.0 2,078.6 510.0 1.21 6.7 0.32
Impax Laboratories Inc. NasdaqGS:IPXL 32.32 72.6 2,346.4 84.2 424.6 2,430.7 860.5 165.8 97.1 0.51 27.3 1,008.6 245.7 1.70 15.1 NA
Lupin Limited BSE:500257 22.21 450.6 10,006.5 1.5 281.7 10,008.0 1,938.2 523.1 439.4 0.75 3.0 2,497.1 975.6 1.11 3.3 0.11
Mylan N.V. NasdaqGS:MYL 46.40 490.7 22,767.9 5,979.8 7,306.1 28,747.7 9,429.3 2,826.4 1,825.6 1.91 339.4 10,905.0 3,513.1 4.93 19.9 NA
Nichi-Iko Pharmaceutical Co., Ltd. TSE:4541 23.87 59.7 1,425.7 66.1 216.5 1,491.8 1,160.4 145.2 110.1 0.84 1.0 1,410.5 191.2 1.61 11.4 0.26
Perrigo Company plc NYSE:PRGO 129.62 143.2 18,561.9 5,557.5 5,990.2 24,119.4 5,539.0 1,331.2 675.2 2.03 177.6 6,061.7 1,918.0 9.51 70.1 0.54
Taro Pharmaceutical Industries Ltd. NYSE:TARO 141.94 42.8 6,079.8 (1,182.7) 0.0 4,897.1 929.9 604.4 589.2 8.41 0.9 0.0 0.0 0.00 41.3 NA
Teva Pharmaceutical Industries Limited NYSE:TEVA 54.40 907.7 49,376.9 2,995.0 9,978.0 52,371.9 19,652.0 6,445.0 5,139.0 3.41 270.0 24,425.0 8,806.3 5.64 29.2 1.36
Margin Anlysis Enterprise Value/ P/E Debt/Data Gross NTM NTM NTM Market Interest Price to Dividend
Company Ticker FYE as of Profit EBITDA EBIT Sales EBITDA EBIT Sales EBITDA LTM Forecast EV Cap EBITDA Coverage Book %
Akorn, Inc. NasdaqGS:AKRX 31-Dec 30-Mar-16 61.0% 42.8% 33.9% 3.4 x 7.9 x 9.9 x 3.4 x 7.4 x 15.7 x 11.8 x 32.4% 41.3% 2.6 x 5.9 x 4.4 x NA
Hikma Pharmaceuticals PLC LSE:HIK 31-Dec 30-Mar-16 54.8% 32.3% 27.7% 4.8 x 15.0 x 17.4 x 3.3 x 13.6 x 26.7 x 23.3 x 10.5% 10.7% 1.6 x 10.0 x 4.2 x 1.1%
Impax Laboratories Inc. NasdaqGS:IPXL 31-Dec 30-Mar-16 42.1% 19.3% 11.3% 2.8 x 14.7 x 25.0 x 2.4 x 9.9 x 62.9 x 19.0 x 17.5% 18.1% 2.6 x 3.6 x 2.1 x NA
Lupin Limited BSE:500257 31-Mar 30-Mar-16 59.1% 27.0% 22.7% 5.2 x 19.1 x 22.8 x 4.0 x 10.3 x 29.7 x 19.9 x 2.8% 2.8% 0.5 x 145.6 x 6.7 x 0.5%
Mylan N.V. NasdaqGS:MYL 31-Dec 30-Mar-16 46.5% 30.0% 19.4% 3.0 x 10.2 x 15.7 x 2.6 x 8.2 x 24.3 x 9.4 x 25.4% 32.1% 2.6 x 5.4 x 2.3 x NA
Nichi-Iko Pharmaceutical Co., Ltd. TSE:4541 31-Mar 30-Mar-16 37.9% 12.5% 9.5% 1.3 x 10.3 x 13.5 x 1.1 x 7.8 x 28.5 x 14.8 x 14.5% 15.2% 1.5 x 111.2 x 2.1 x 1.1%
Perrigo Company plc NYSE:PRGO 31-Dec 30-Mar-16 40.0% 24.0% 12.2% 4.4 x 18.1 x 35.7 x 4.0 x 12.6 x 63.9 x 13.6 x 24.8% 32.3% 4.5 x 3.8 x 1.8 x 0.4%
Taro Pharmaceutical Industries Ltd. NYSE:TARO 31-Mar 30-Mar-16 81.3% 65.0% 63.4% 5.3 x 8.1 x 8.3 x NM NM 16.9 x NM 0.0% 0.0% 0.0 x NM 3.4 x NA
Teva Pharmaceutical Industries Limited NYSE:TEVA 31-Dec 30-Mar-16 57.8% 32.8% 26.2% 2.7 x 8.1 x 10.2 x 2.1 x 5.9 x 15.9 x 9.6 x 19.1% 20.2% 1.5 x 19.0 x 1.9 x 2.5%
Median 54.8% 30.0% 22.7% 3.4 x 10.3 x 15.7 x 3.0 x 9.0 x 26.7 x 14.2 x 17.5% 18.1% 1.6 x 8.0 x 2.3 x 1.1%
* All estimates from Capital IQ Mean 53.4% 31.7% 25.1% 3.6 x 12.4 x 17.6 x 2.9 x 9.5 x 31.6 x 15.2 x 16.3% 19.2% 1.9 x 38.1 x 3.2 x 1.1%
Debt calculations only included for entities with debt Min 37.9% 12.5% 9.5% 1.3 x 7.9 x 8.3 x 1.1 x 5.9 x 15.7 x 9.4 x 0.0% 0.0% 0.0 x 3.6 x 1.8 x 0.4%
NM - not meaningful Max 81.3% 65.0% 63.4% 5.3 x 19.1 x 35.7 x 4.0 x 13.6 x 63.9 x 23.3 x 32.4% 41.3% 4.5 x 145.6 x 6.7 x 2.5%
Source:Bourne Partners Internal Research; CapitalIQ September 2016

28
Trading Comparables as of June 30, 2016
Publicly Traded Comparable Generic Spec Pharma Companies
USD in millions, except for per-share amounts0 LTM NTM Forecast
Share Shares Equity Net Debt Total Enterprise Interest Book DividendCompany Ticker Price Out Value (Cash) Debt Value Sales EBITDA EBIT EPS Expense Sales EBITDA EPS Value /share
Akorn, Inc. NasdaqGS:AKRX $28.49 119.4 $3,401.9 $649.6 $807.4 $4,051.5 $1,085.9 $457.4 $371.1 $1.45 $58.0 $1,093.1 $497.6 $2.21 $6.2 NA
Hikma Pharmaceuticals PLC LSE:HIK 32.77 239.9 7,861.2 804.0 1,072.0 8,665.2 1,613.0 444.0 359.0 1.06 48.0 2,169.1 551.9 1.29 10.6 0.32
Impax Laboratories Inc. NasdaqGS:IPXL 28.82 73.8 2,127.2 68.4 435.3 2,195.6 901.3 193.0 117.8 0.51 33.1 1,043.6 259.1 1.86 15.1 NA
Lupin Limited BSE:500257 22.76 450.8 10,261.3 938.3 1,062.6 11,199.6 2,286.1 619.1 551.3 0.71 8.2 2,605.3 726.9 0.97 3.6 0.11
Mylan N.V. NasdaqGS:MYL 43.24 508.4 21,982.7 6,891.9 13,330.0 28,874.6 9,937.9 3,111.8 1,944.2 1.91 326.6 11,583.7 3,783.8 5.15 20.3 NA
Nichi-Iko Pharmaceutical Co., Ltd. TSE:4541 20.21 59.8 1,207.9 101.2 281.0 1,309.2 1,426.5 177.5 124.4 1.14 1.3 1,562.9 201.6 1.48 12.9 0.26
Perrigo Company plc NYSE:PRGO 90.67 143.2 12,986.0 5,894.4 6,521.9 18,880.4 5,873.1 1,352.3 641.5 2.03 206.5 5,731.2 1,742.6 8.58 68.8 0.54
Taro Pharmaceutical Industries Ltd. NYSE:TARO 145.60 42.8 6,226.7 (974.9) 0.0 5,251.8 969.3 640.5 625.8 9.33 0.5 1,000.0 651.8 12.90 45.2 NA
Teva Pharmaceutical Industries Limited NYSE:TEVA 50.23 914.0 45,910.2 4,041.0 11,025.0 49,951.2 19,552.0 6,320.0 5,057.0 3.41 57.0 24,319.5 8,334.4 5.54 29.0 1.36
Margin Anlysis Enterprise Value/ P/E Debt/Data Gross NTM NTM NTM Market Interest Price to Dividend
Company Ticker FYE as of Profit EBITDA EBIT Sales EBITDA EBIT Sales EBITDA LTM Forecast EV Cap EBITDA Coverage Book %
Akorn, Inc. NasdaqGS:AKRX 31-Dec 30-Jun-16 62.3% 42.1% 34.2% 3.7 x 8.9 x 10.9 x 3.7 x 8.1 x 19.7 x 12.9 x 19.9% 23.7% 1.8 x 6.4 x 4.6 x NA
Hikma Pharmaceuticals PLC LSE:HIK 31-Dec 30-Jun-16 52.0% 27.5% 22.3% 5.4 x 19.5 x 24.1 x 4.0 x 15.7 x 30.9 x 25.3 x 12.4% 13.6% 2.4 x 7.5 x 3.1 x 1.0%
Impax Laboratories Inc. NasdaqGS:IPXL 31-Dec 30-Jun-16 43.5% 21.4% 13.1% 2.4 x 11.4 x 18.6 x 2.1 x 8.5 x 56.1 x 15.5 x 19.8% 20.5% 2.3 x 3.6 x 1.9 x NA
Lupin Limited BSE:500257 31-Mar 30-Jun-16 68.7% 27.1% 24.1% 4.9 x 18.1 x 20.3 x 4.3 x 15.4 x 31.9 x 23.4 x 9.5% 10.4% 1.7 x 67.1 x 6.3 x 0.5%
Mylan N.V. NasdaqGS:MYL 31-Dec 30-Jun-16 46.6% 31.3% 19.6% 2.9 x 9.3 x 14.9 x 2.5 x 7.6 x 22.6 x 8.4 x 46.2% 60.6% 4.3 x 6.0 x 2.1 x NA
Nichi-Iko Pharmaceutical Co., Ltd. TSE:4541 31-Mar 30-Jun-16 37.2% 12.4% 8.7% 0.9 x 7.4 x 10.5 x 0.8 x 6.5 x 17.7 x 13.7 x 21.5% 23.3% 1.6 x 96.8 x 1.6 x 1.3%
Perrigo Company plc NYSE:PRGO 31-Dec 30-Jun-16 40.2% 23.0% 10.9% 3.2 x 14.0 x 29.4 x 3.3 x 10.8 x 44.7 x 10.6 x 34.5% 50.2% 4.8 x 3.1 x 1.3 x 0.6%
Taro Pharmaceutical Industries Ltd. NYSE:TARO 31-Mar 30-Jun-16 81.7% 66.1% 64.6% 5.4 x 8.2 x 8.4 x 5.3 x 8.1 x 15.6 x 11.3 x 0.0% 0.0% 0.0 x NM 3.2 x NA
Teva Pharmaceutical Industries Limited NYSE:TEVA 31-Dec 30-Jun-16 58.2% 32.3% 25.9% 2.6 x 7.9 x 9.9 x 2.1 x 6.0 x 14.7 x 9.1 x 22.1% 24.0% 1.7 x 88.7 x 1.7 x 2.7%
Median 52.0% 27.5% 22.3% 3.2 x 9.3 x 14.9 x 3.3 x 8.1 x 22.6 x 12.9 x 19.9% 23.3% 1.8 x 6.9 x 2.1 x 1.0%
* All estimates from Capital IQ Mean 54.5% 31.5% 24.8% 3.5 x 11.6 x 16.3 x 3.1 x 9.6 x 28.2 x 14.5 x 20.7% 25.1% 2.3 x 34.9 x 2.9 x 1.2%
Debt calculations only included for entities with debt Min 37.2% 12.4% 8.7% 0.9 x 7.4 x 8.4 x 0.8 x 6.0 x 14.7 x 8.4 x 0.0% 0.0% 0.0 x 3.1 x 1.3 x 0.5%
NM - not meaningful Max 81.7% 66.1% 64.6% 5.4 x 19.5 x 29.4 x 5.3 x 15.7 x 56.1 x 25.3 x 46.2% 60.6% 4.8 x 96.8 x 6.3 x 2.7%
Source:Bourne Partners Internal Research; CapitalIQ September 2016
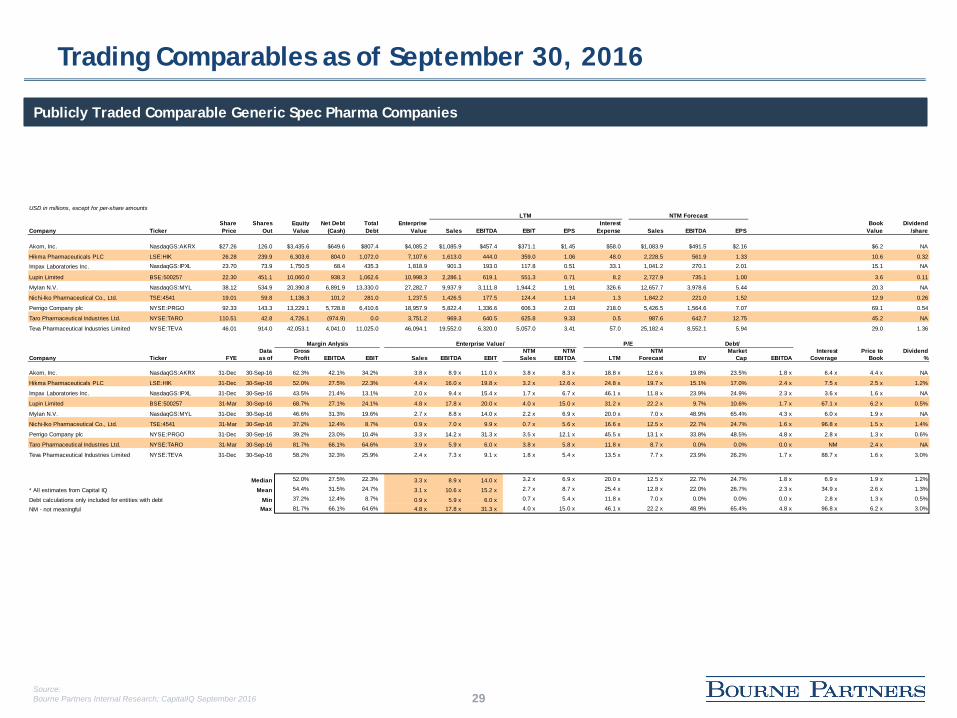
29
Trading Comparables as of September 30, 2016
Publicly Traded Comparable Generic Spec Pharma Companies
USD in millions, except for per-share amounts0 LTM NTM Forecast
Share Shares Equity Net Debt Total Enterprise Interest Book DividendCompany Ticker Price Out Value (Cash) Debt Value Sales EBITDA EBIT EPS Expense Sales EBITDA EPS Value /share
Akorn, Inc. NasdaqGS:AKRX $27.26 126.0 $3,435.6 $649.6 $807.4 $4,085.2 $1,085.9 $457.4 $371.1 $1.45 $58.0 $1,083.9 $491.5 $2.16 $6.2 NA
Hikma Pharmaceuticals PLC LSE:HIK 26.28 239.9 6,303.6 804.0 1,072.0 7,107.6 1,613.0 444.0 359.0 1.06 48.0 2,228.5 561.9 1.33 10.6 0.32
Impax Laboratories Inc. NasdaqGS:IPXL 23.70 73.9 1,750.5 68.4 435.3 1,818.9 901.3 193.0 117.8 0.51 33.1 1,041.2 270.1 2.01 15.1 NA
Lupin Limited BSE:500257 22.30 451.1 10,060.0 938.3 1,062.6 10,998.3 2,286.1 619.1 551.3 0.71 8.2 2,727.9 735.1 1.00 3.6 0.11
Mylan N.V. NasdaqGS:MYL 38.12 534.9 20,390.8 6,891.9 13,330.0 27,282.7 9,937.9 3,111.8 1,944.2 1.91 326.6 12,657.7 3,978.6 5.44 20.3 NA
Nichi-Iko Pharmaceutical Co., Ltd. TSE:4541 19.01 59.8 1,136.3 101.2 281.0 1,237.5 1,426.5 177.5 124.4 1.14 1.3 1,842.2 221.0 1.52 12.9 0.26
Perrigo Company plc NYSE:PRGO 92.33 143.3 13,229.1 5,728.8 6,410.6 18,957.9 5,822.4 1,336.6 606.3 2.03 218.0 5,426.5 1,564.6 7.07 69.1 0.54
Taro Pharmaceutical Industries Ltd. NYSE:TARO 110.51 42.8 4,726.1 (974.9) 0.0 3,751.2 969.3 640.5 625.8 9.33 0.5 987.6 642.7 12.75 45.2 NA
Teva Pharmaceutical Industries Limited NYSE:TEVA 46.01 914.0 42,053.1 4,041.0 11,025.0 46,094.1 19,552.0 6,320.0 5,057.0 3.41 57.0 25,182.4 8,552.1 5.94 29.0 1.36
Margin Anlysis Enterprise Value/ P/E Debt/Data Gross NTM NTM NTM Market Interest Price to Dividend
Company Ticker FYE as of Profit EBITDA EBIT Sales EBITDA EBIT Sales EBITDA LTM Forecast EV Cap EBITDA Coverage Book %
Akorn, Inc. NasdaqGS:AKRX 31-Dec 30-Sep-16 62.3% 42.1% 34.2% 3.8 x 8.9 x 11.0 x 3.8 x 8.3 x 18.8 x 12.6 x 19.8% 23.5% 1.8 x 6.4 x 4.4 x NA
Hikma Pharmaceuticals PLC LSE:HIK 31-Dec 30-Sep-16 52.0% 27.5% 22.3% 4.4 x 16.0 x 19.8 x 3.2 x 12.6 x 24.8 x 19.7 x 15.1% 17.0% 2.4 x 7.5 x 2.5 x 1.2%
Impax Laboratories Inc. NasdaqGS:IPXL 31-Dec 30-Sep-16 43.5% 21.4% 13.1% 2.0 x 9.4 x 15.4 x 1.7 x 6.7 x 46.1 x 11.8 x 23.9% 24.9% 2.3 x 3.6 x 1.6 x NA
Lupin Limited BSE:500257 31-Mar 30-Sep-16 68.7% 27.1% 24.1% 4.8 x 17.8 x 20.0 x 4.0 x 15.0 x 31.2 x 22.2 x 9.7% 10.6% 1.7 x 67.1 x 6.2 x 0.5%
Mylan N.V. NasdaqGS:MYL 31-Dec 30-Sep-16 46.6% 31.3% 19.6% 2.7 x 8.8 x 14.0 x 2.2 x 6.9 x 20.0 x 7.0 x 48.9% 65.4% 4.3 x 6.0 x 1.9 x NA
Nichi-Iko Pharmaceutical Co., Ltd. TSE:4541 31-Mar 30-Sep-16 37.2% 12.4% 8.7% 0.9 x 7.0 x 9.9 x 0.7 x 5.6 x 16.6 x 12.5 x 22.7% 24.7% 1.6 x 96.8 x 1.5 x 1.4%
Perrigo Company plc NYSE:PRGO 31-Dec 30-Sep-16 39.2% 23.0% 10.4% 3.3 x 14.2 x 31.3 x 3.5 x 12.1 x 45.5 x 13.1 x 33.8% 48.5% 4.8 x 2.8 x 1.3 x 0.6%
Taro Pharmaceutical Industries Ltd. NYSE:TARO 31-Mar 30-Sep-16 81.7% 66.1% 64.6% 3.9 x 5.9 x 6.0 x 3.8 x 5.8 x 11.8 x 8.7 x 0.0% 0.0% 0.0 x NM 2.4 x NA
Teva Pharmaceutical Industries Limited NYSE:TEVA 31-Dec 30-Sep-16 58.2% 32.3% 25.9% 2.4 x 7.3 x 9.1 x 1.8 x 5.4 x 13.5 x 7.7 x 23.9% 26.2% 1.7 x 88.7 x 1.6 x 3.0%
Median 52.0% 27.5% 22.3% 3.3 x 8.9 x 14.0 x 3.2 x 6.9 x 20.0 x 12.5 x 22.7% 24.7% 1.8 x 6.9 x 1.9 x 1.2%
* All estimates from Capital IQ Mean 54.4% 31.5% 24.7% 3.1 x 10.6 x 15.2 x 2.7 x 8.7 x 25.4 x 12.8 x 22.0% 26.7% 2.3 x 34.9 x 2.6 x 1.3%
Debt calculations only included for entities with debt Min 37.2% 12.4% 8.7% 0.9 x 5.9 x 6.0 x 0.7 x 5.4 x 11.8 x 7.0 x 0.0% 0.0% 0.0 x 2.8 x 1.3 x 0.5%
NM - not meaningful Max 81.7% 66.1% 64.6% 4.8 x 17.8 x 31.3 x 4.0 x 15.0 x 46.1 x 22.2 x 48.9% 65.4% 4.8 x 96.8 x 6.2 x 3.0%
Source:Bourne Partners Internal Research; CapitalIQ September 2016

Industry Transaction Comparables

31
Spec Pharma Transaction Comparables Overview
Spec Pharma Deal Volume and Value Totals
Spec Pharma Deal Type and Breakdown
Total Deals 2016 YTD:90 worth $22.1 billion.
Growth Rate in total reported deal value:37.7% CAGR from 2011 to 2015.
After heavy spending in the last four years, M&A activity has slowed down in 2016 as companies develop and incorporate their recent acquisitions into their portfolio.
Deal volume and value are off the pace of prior years in 2016 YTD by over 50%.
By midyear of 2016, the ratio of product versus corporate deals completed reflects slightly higher breakdowns seen in the last two years.
Generally, Spec Pharma transactions have trended towards more corporate- focused transactions.
2012 2013 2014 2015 2016 YTDTotal Volume 169 164 167 186 90Total Value $28.2 bn $55.5 bn $163.0 bn $73.6 bn $22.1 bn
$0 bn
$20 bn
$40 bn
$60 bn
$80 bn
$100 bn
$120 bn
$140 bn
$160 bn
$180 bn
020406080
100120140160180200
2012 2013 2014 2015 2016 YTDProduct 52 44 31 15 5Corporate 117 120 135 171 85
69% 73%81%
92%
94%
020406080
100120140160180200
Tota
l Dea
l Vol
ume
Source:Bourne Partners Internal Research; CapitalIQ September 2016

32
Spec Pharma Transaction Comparables Overview
Median Reported Spec Pharma Deal Values
Spec Pharma Mega Deal Value and Volume Comparison
Median reported deal values are down 55.2% since 2013.
A small amount of Mega Deals (transaction values in excess of $2 bn) can skew averages, so median numbers are particularly valuable.
After a high median deal value in 2013, values have decreased beyond historical norms through 2016.
Spec Pharma Mega Deals represent an average 5.7% of deals by volume over the last five years.
Spec Pharma Mega Deals represent, on average, 61% of reported transaction values during the same period.
It should be noted that only 1 Mega Deal has been completed in 2016, representing 2% of deal volume but 45% of deal value.
$66
$116
$68
$51 $52
$0 mm
$20 mm
$40 mm
$60 mm
$80 mm
$100 mm
$120 mm
$140 mm
2012 2013 2014 2015 2016 YTD
2012 2013 2014 2015 2016 YTDMega Deal $11.4 $31.1 $147.6 $54.3 $10.1
Remainder Deal $16.8 $24.4 $15.4 $19.3 $12.1
Mega Deal Volume 3 6 11 8 1
Mega Deal Volume % 2.9% 5.8% 10.8% 7.2% 1.9%
40% 56%
91%
74%45%
$0 bn
$20 bn
$40 bn
$60 bn
$80 bn
$100 bn
$120 bn
$140 bn
$160 bn
$180 bn
Source:Bourne Partners Internal Research; CapitalIQ September 2016
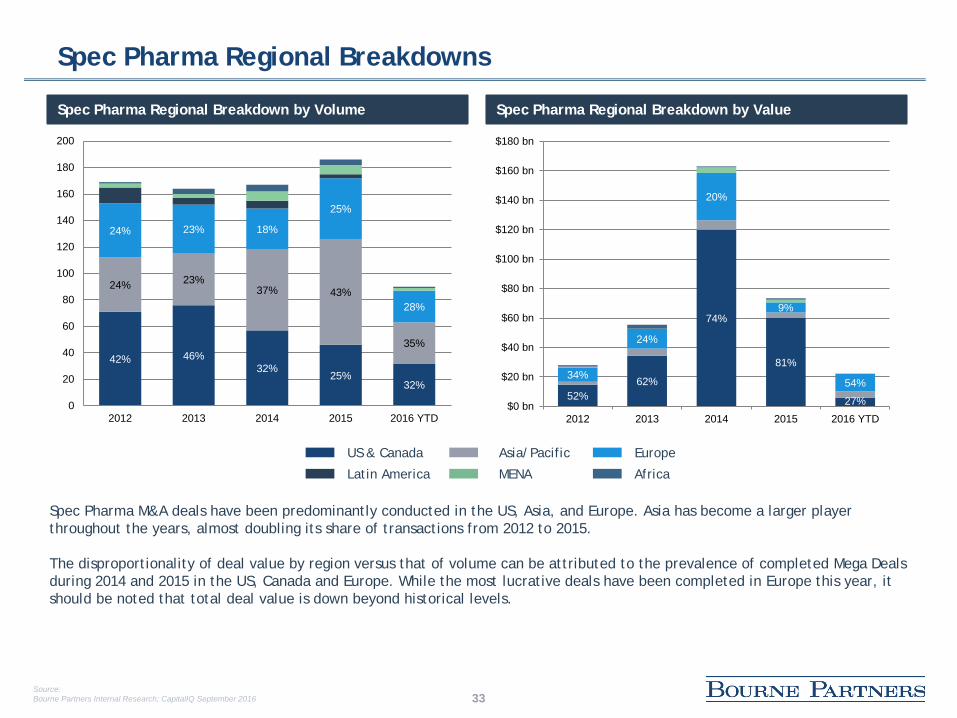
33
Spec Pharma Regional Breakdowns
Latin America
US & Canada Asia/Pacific
MENA
Europe
Africa
Spec Pharma M&A deals have been predominantly conducted in the US, Asia, and Europe. Asia has become a larger player throughout the years, almost doubling its share of transactions from 2012 to 2015.
The disproportionality of deal value by region versus that of volume can be attributed to the prevalence of completed Mega Dealsduring 2014 and 2015 in the US, Canada and Europe. While the most lucrative deals have been completed in Europe this year, itshould be noted that total deal value is down beyond historical levels.
Spec Pharma Regional Breakdown by Volume Spec Pharma Regional Breakdown by Value
52%62%
74%
81%
27%
34%
24%
20%
9%
54%
$0 bn
$20 bn
$40 bn
$60 bn
$80 bn
$100 bn
$120 bn
$140 bn
$160 bn
$180 bn
2012 2013 2014 2015 2016 YTD
42% 46%32%
25%32%
24% 23%37% 43%
35%
24% 23% 18%
25%
28%
0
20
40
60
80
100
120
140
160
180
200
2012 2013 2014 2015 2016 YTD
Source:Bourne Partners Internal Research; CapitalIQ September 2016
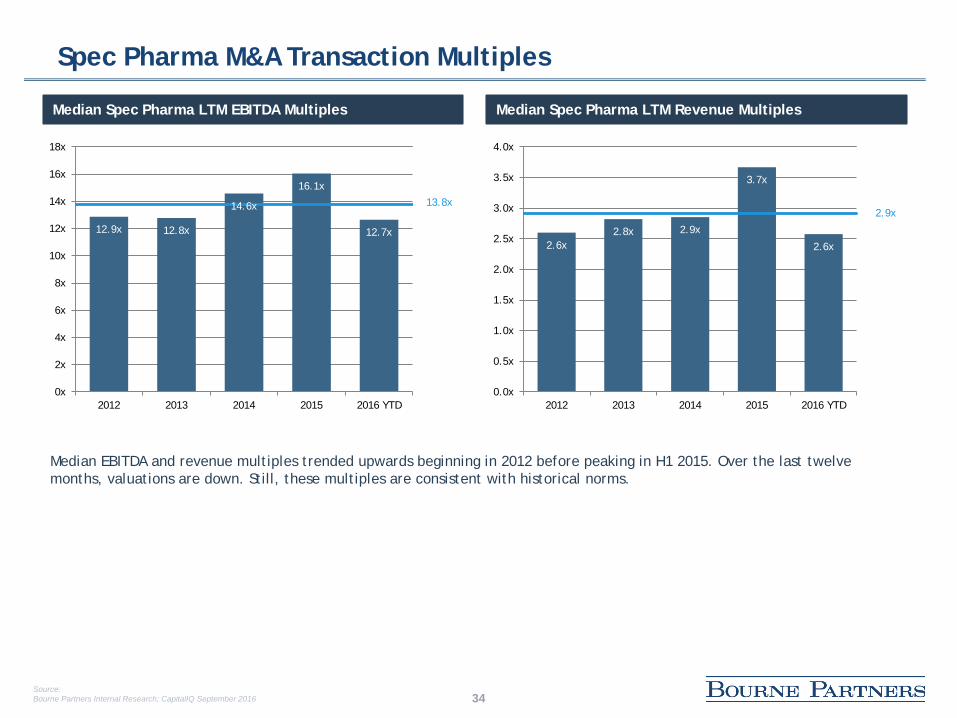
34
Spec Pharma M&A Transaction Multiples
Median Spec Pharma LTM EBITDA Multiples Median Spec Pharma LTM Revenue Multiples
Median EBITDA and revenue multiples trended upwards beginning in 2012 before peaking in H1 2015. Over the last twelve months, valuations are down. Still, these multiples are consistent with historical norms.
13.8x2.9x
12.9x 12.8x
14.6x
16.1x
12.7x
0x
2x
4x
6x
8x
10x
12x
14x
16x
18x
2012 2013 2014 2015 2016 YTD
2.6x2.8x 2.9x
3.7x
2.6x
0.0x
0.5x
1.0x
1.5x
2.0x
2.5x
3.0x
3.5x
4.0x
2012 2013 2014 2015 2016 YTD
Source:Bourne Partners Internal Research; CapitalIQ September 2016
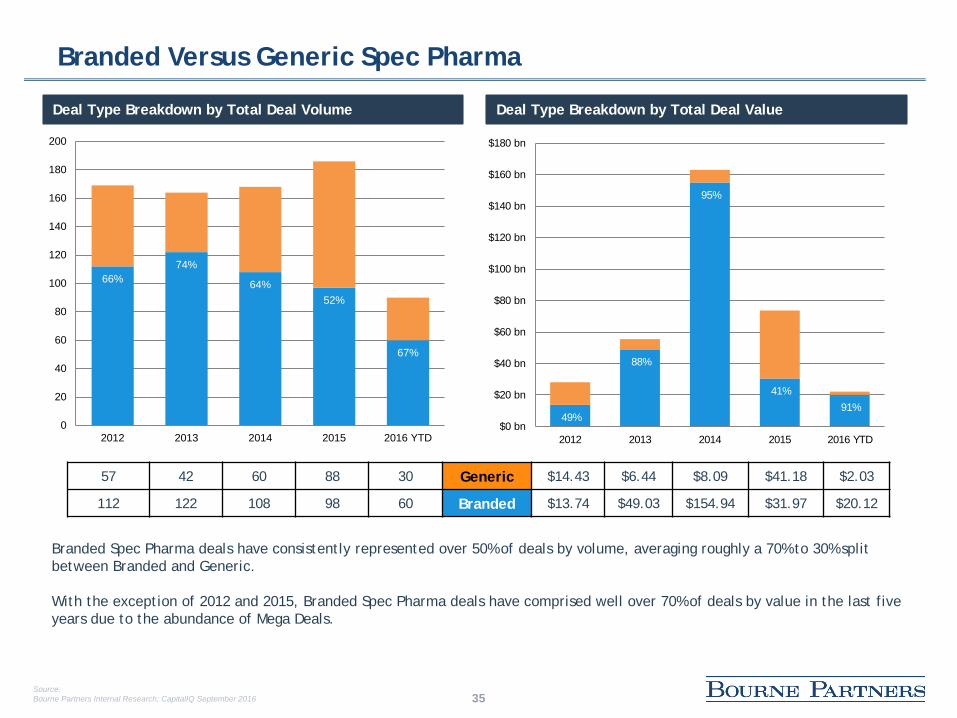
35
Branded Versus Generic Spec Pharma
Deal Type Breakdown by Total Deal Volume Deal Type Breakdown by Total Deal Value
57 42 60 88 30 Generic $14.43 $6.44 $8.09 $41.18 $2.03
112 122 108 98 60 Branded $13.74 $49.03 $154.94 $31.97 $20.12
Branded Spec Pharma deals have consistently represented over 50% of deals by volume, averaging roughly a 70% to 30% split between Branded and Generic.
With the exception of 2012 and 2015, Branded Spec Pharma deals have comprised well over 70% of deals by value in the last five years due to the abundance of Mega Deals.
49%
88%
95%
41%
91%
$0 bn
$20 bn
$40 bn
$60 bn
$80 bn
$100 bn
$120 bn
$140 bn
$160 bn
$180 bn
2012 2013 2014 2015 2016 YTD
66%74%
64%52%
67%
0
20
40
60
80
100
120
140
160
180
200
2012 2013 2014 2015 2016 YTD
Source:Bourne Partners Internal Research; CapitalIQ September 2016
36
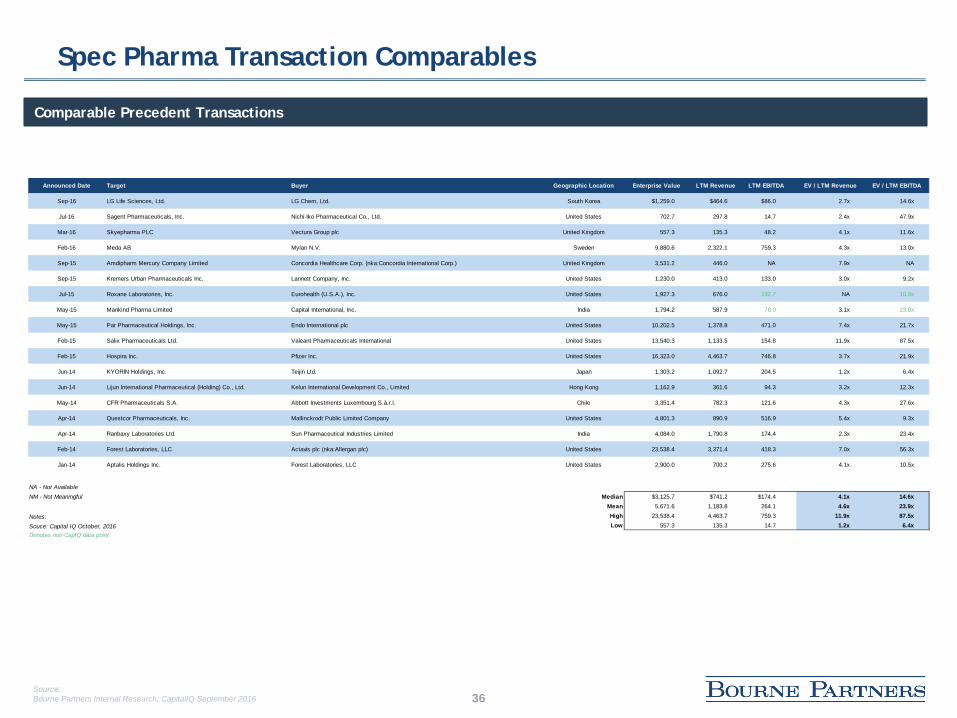
Spec Pharma Transaction Comparables
Comparable Precedent Transactions
Announced Date Target Buyer Geographic Location Enterprise Value LTM Revenue LTM EBITDA EV / LTM Revenue EV / LTM EBITDA
Sep-16 LG Life Sciences, Ltd. LG Chem, Ltd. South Korea $1,259.0 $464.6 $86.0 2.7x 14.6x
Jul-16 Sagent Pharmaceuticals, Inc. Nichi-Iko Pharmaceutical Co., Ltd. United States 702.7 297.8 14.7 2.4x 47.9x
Mar-16 Skyepharma PLC Vectura Group plc United Kingdom 557.3 135.3 48.2 4.1x 11.6x
Feb-16 Meda AB Mylan N.V. Sweden 9,880.6 2,322.1 759.3 4.3x 13.0x
Sep-15 Amdipharm Mercury Company Limited Concordia Healthcare Corp. (nka:Concordia International Corp.) United Kingdom 3,531.2 446.0 NA 7.9x NA
Sep-15 Kremers Urban Pharmaceuticals Inc. Lannett Company, Inc. United States 1,230.0 413.0 133.0 3.0x 9.2x
Jul-15 Roxane Laboratories, Inc. Eurohealth (U.S.A.), Inc. United States 1,927.3 676.0 192.7 NA 10.0x
May-15 Mankind Pharma Limited Capital International, Inc. India 1,794.2 587.9 78.0 3.1x 23.0x
May-15 Par Pharmaceutical Holdings, Inc. Endo International plc United States 10,202.5 1,378.8 471.0 7.4x 21.7x
Feb-15 Salix Pharmaceuticals Ltd. Valeant Pharmaceuticals International United States 13,540.3 1,133.5 154.8 11.9x 87.5x
Feb-15 Hospira Inc. Pfizer Inc. United States 16,323.0 4,463.7 746.8 3.7x 21.9x
Jun-14 KYORIN Holdings, Inc. Teijin Ltd. Japan 1,303.2 1,092.7 204.5 1.2x 6.4x
Jun-14 Lijun International Pharmaceutical (Holding) Co., Ltd. Kelun International Development Co., Limited Hong Kong 1,162.9 361.6 94.3 3.2x 12.3x
May-14 CFR Pharmaceuticals S.A. Abbott Investments Luxembourg S.à.r.l. Chile 3,351.4 782.3 121.6 4.3x 27.6x
Apr-14 Questcor Pharmaceuticals, Inc. Mallinckrodt Public Limited Company United States 4,801.3 890.9 516.9 5.4x 9.3x
Apr-14 Ranbaxy Laboratories Ltd. Sun Pharmaceutical Industries Limited India 4,084.0 1,790.8 174.4 2.3x 23.4x
Feb-14 Forest Laboratories, LLC Actavis plc (nka:Allergan plc) United States 23,538.4 3,371.4 418.3 7.0x 56.3x
Jan-14 Aptalis Holdings Inc. Forest Laboratories, LLC United States 2,900.0 700.2 275.6 4.1x 10.5x
NA - Not AvailableNM - Not Meaningful Median $3,125.7 $741.2 $174.4 4.1x 14.6x
Mean 5,671.6 1,183.8 264.1 4.6x 23.9x
Notes: High 23,538.4 4,463.7 759.3 11.9x 87.5x
Souce: Capital IQ October, 2016 Low 557.3 135.3 14.7 1.2x 6.4xDenotes non-CapIQ data point
Source:Bourne Partners Internal Research; CapitalIQ September 2016
Branded Spec Pharma Transaction Comparables
38
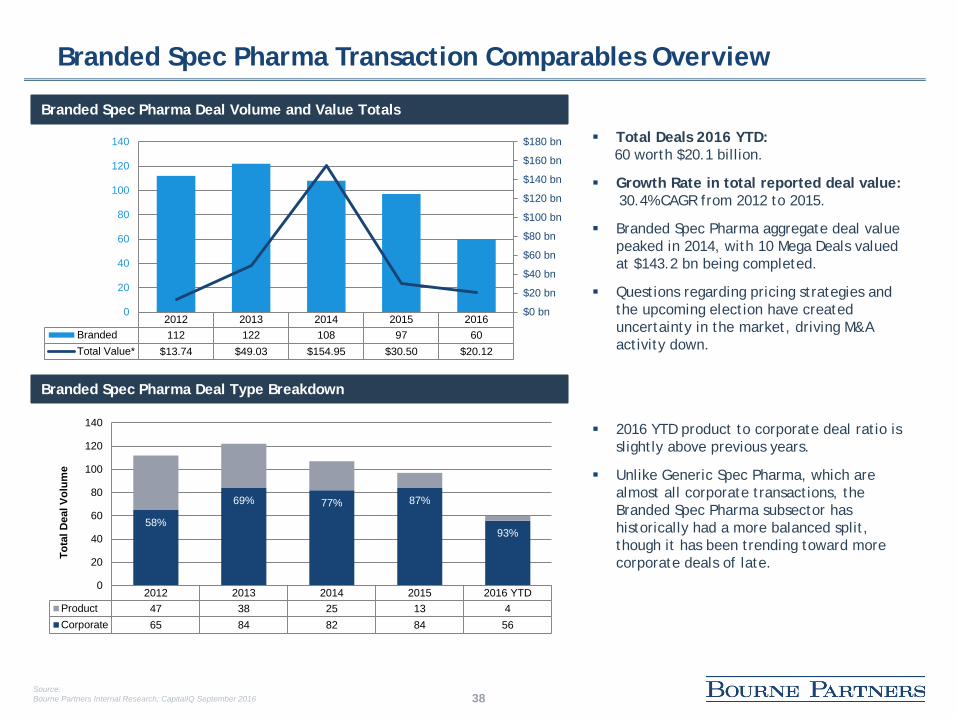
Branded Spec Pharma Transaction Comparables Overview
Branded Spec Pharma Deal Volume and Value Totals
Branded Spec Pharma Deal Type Breakdown
Total Deals 2016 YTD:60 worth $20.1 billion.
Growth Rate in total reported deal value:30.4% CAGR from 2012 to 2015.
Branded Spec Pharma aggregate deal value peaked in 2014, with 10 Mega Deals valued at $143.2 bn being completed.
Questions regarding pricing strategies and the upcoming election have created uncertainty in the market, driving M&A activity down.
2016 YTD product to corporate deal ratio is slightly above previous years.
Unlike Generic Spec Pharma, which are almost all corporate transactions, the Branded Spec Pharma subsector has historically had a more balanced split, though it has been trending toward more corporate deals of late.
2012 2013 2014 2015 2016Branded 112 122 108 97 60Total Value* $13.74 $49.03 $154.95 $30.50 $20.12
$0 bn
$20 bn
$40 bn
$60 bn
$80 bn
$100 bn
$120 bn
$140 bn
$160 bn
$180 bn
0
20
40
60
80
100
120
140
2012 2013 2014 2015 2016 YTDProduct 47 38 25 13 4Corporate 65 84 82 84 56
58%
69% 77% 87%
93%
0
20
40
60
80
100
120
140
Tota
l Dea
l Vol
ume
Source:Bourne Partners Internal Research; CapitalIQ September 2016

39
Branded Spec Pharma Transaction Comparables Overview
Median Reported Branded Spec Pharma Deal Values
Branded Spec Pharma Mega Deal Value and Volume Comparison
Median reported deal values have decreased 30.6% sine 2012.
Following the high values in 2013 and 2014, median deal values have fallen below historical norms thus far in 2016.
Aggregate reported deal value has suffered in 2016 YTD as a result of the low volume of Mega Deals.
Branded Spec Pharma Mega Deals represent an average 6.7% of deals by volume over the last five years.
However, Branded Spec Pharma Mega Deals represent, on average, 59.5% of reported transaction values during the same period.
$73
$120
$95
$54 $51
$0 mm
$20 mm
$40 mm
$60 mm
$80 mm
$100 mm
$120 mm
$140 mm
2012 2013 2014 2015 2016 YTD
2012 2013 2014 2015 2016 YTDMega Deal $3.2 $31.1 $143.2 $21.0 $10.1Remainder Deal $10.6 $18.0 $11.7 $9.5 $10.0Mega Deal Volume 1 6 10 4 1Mega Deal Volume % 1.4% 7.9% 14.5% 7.0% 2.6%
23%63%
92%
69% 50%$0 bn
$20 bn
$40 bn
$60 bn
$80 bn
$100 bn
$120 bn
$140 bn
$160 bn
$180 bn
Source:Bourne Partners Internal Research; CapitalIQ September 2016

40
Branded Spec Pharma Regional Breakdown
Branded Spec Pharma Regional Breakdown by Volume Branded Spec Pharma Regional Breakdown by Value
Branded Spec Pharma M&A activity by region follows similar ratios to that of general Spec Pharma, with the majority of deals by volume being closed in the US, Europe, and Asia. Additionally, the spikes in activity by value found in the general Spec Pharma breakdown are mirrored in the chart above.
Latin America
US & Canada Asia/Pacific
MENA
Europe
Africa
55%58%
50% 53%55%
12%14%
13%15%
13%
29%22%
30% 26%
25%
0
20
40
60
80
100
120
140
2012 2013 2014 2015 2016 YTD75%
68%
76%
87%23%
15%
24%
20%
9%
58%
$0 bn
$20 bn
$40 bn
$60 bn
$80 bn
$100 bn
$120 bn
$140 bn
$160 bn
$180 bn
2012 2013 2014 2015 2016 YTD
Source:Bourne Partners Internal Research; CapitalIQ September 2016

41
Branded Spec Pharma M&A Transaction Multiples
Branded Spec Pharma LTM EBITDA Multiples Branded Spec Pharma LTM Revenue Multiples
Branded Spec Pharma median LTM EBITDA multiples have increased since 2012. After a large spike in 2015, multiples are back down to historical numbers, while still being well above 10x.
Branded Spec Pharma revenue multiples trended upwards to a high of 4.40x in 2015, but have begun to decrease to levels that are still above historic norms.
13.9x3.7x
11.9x
13.6x13.0x
16.0x
12.7x
0x
2x
4x
6x
8x
10x
12x
14x
16x
18x
2012 2013 2014 2015 2016 YTD
2.8x 2.9x
4.1x
4.8x
2.9x
0.0x
1.0x
2.0x
3.0x
4.0x
5.0x
6.0x
2012 2013 2014 2015 2016 YTD
Source:Bourne Partners Internal Research; CapitalIQ September 2016
42
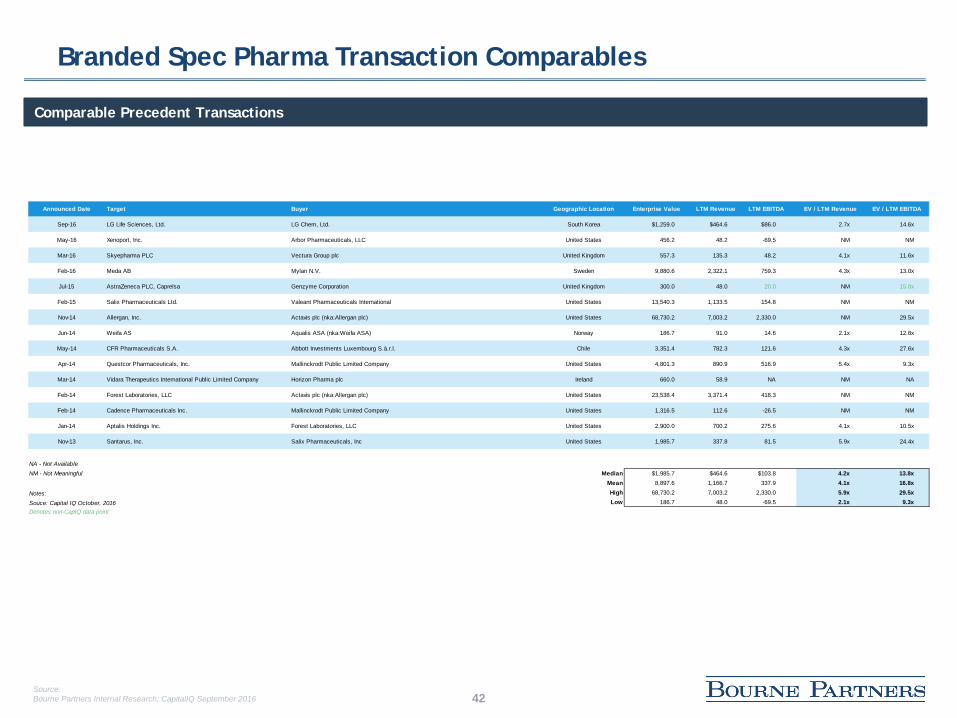
Branded Spec Pharma Transaction Comparables
Comparable Precedent Transactions
Announced Date Target Buyer Geographic Location Enterprise Value LTM Revenue LTM EBITDA EV / LTM Revenue EV / LTM EBITDA
Sep-16 LG Life Sciences, Ltd. LG Chem, Ltd. South Korea $1,259.0 $464.6 $86.0 2.7x 14.6x
May-16 Xenoport, Inc. Arbor Pharmaceuticals, LLC United States 456.2 48.2 -69.5 NM NM
Mar-16 Skyepharma PLC Vectura Group plc United Kingdom 557.3 135.3 48.2 4.1x 11.6x
Feb-16 Meda AB Mylan N.V. Sweden 9,880.6 2,322.1 759.3 4.3x 13.0x
Jul-15 AstraZeneca PLC, Caprelsa Genzyme Corporation United Kingdom 300.0 48.0 20.0 NM 15.0x
Feb-15 Salix Pharmaceuticals Ltd. Valeant Pharmaceuticals International United States 13,540.3 1,133.5 154.8 NM NM
Nov-14 Allergan, Inc. Actavis plc (nka:Allergan plc) United States 68,730.2 7,003.2 2,330.0 NM 29.5x
Jun-14 Weifa AS Aqualis ASA (nka:Weifa ASA) Norway 186.7 91.0 14.6 2.1x 12.8x
May-14 CFR Pharmaceuticals S.A. Abbott Investments Luxembourg S.à.r.l. Chile 3,351.4 782.3 121.6 4.3x 27.6x
Apr-14 Questcor Pharmaceuticals, Inc. Mallinckrodt Public Limited Company United States 4,801.3 890.9 516.9 5.4x 9.3x
Mar-14 Vidara Therapeutics International Public Limited Company Horizon Pharma plc Ireland 660.0 58.9 NA NM NA
Feb-14 Forest Laboratories, LLC Actavis plc (nka:Allergan plc) United States 23,538.4 3,371.4 418.3 NM NM
Feb-14 Cadence Pharmaceuticals Inc. Mallinckrodt Public Limited Company United States 1,316.5 112.6 -26.5 NM NM
Jan-14 Aptalis Holdings Inc. Forest Laboratories, LLC United States 2,900.0 700.2 275.6 4.1x 10.5x
Nov-13 Santarus, Inc. Salix Pharmaceuticals, Inc United States 1,985.7 337.8 81.5 5.9x 24.4x
NA - Not AvailableNM - Not Meaningful Median $1,985.7 $464.6 $103.8 4.2x 13.8x
Mean 8,897.6 1,166.7 337.9 4.1x 16.8x
Notes: High 68,730.2 7,003.2 2,330.0 5.9x 29.5x
Souce: Capital IQ October, 2016 Low 186.7 48.0 -69.5 2.1x 9.3xDenotes non-CapIQ data point
Source:Bourne Partners Internal Research; CapitalIQ September 2016

Generic Spec Pharma Transaction Comparables

44
Generic Spec Pharma Transaction Comparables Overview
Generic Spec Pharma Deal Volume and Value Totals
Generic Spec Pharma Deal Type Breakdown
Total Deals 2016 YTD:30 worth almost $2.0 billion.
Growth Rate in total reported deal value:44.0% CAGR from 2012 to 2015.
Generic Spec Pharma deal volume in 2016 has been low after a large spike in 2015 as companies shift their focus to de-lever and consolidate assets.
The breakdown of corporate transaction volume versus product transaction volume has remained significantly in favor of corporate transactions, with the past two years comprised of nearly all corporate deals.
2012 2013 2014 2015 2016 YTDVolume 57 42 60 89 30Total Value $14.4 $6.4 $8.1 $43.1 $2.0
$0 bn$5 bn$10 bn$15 bn$20 bn$25 bn$30 bn$35 bn$40 bn$45 bn$50 bn
0102030405060708090
100
2012 2013 2014 2015 2016 YTDProduct 5 6 6 2 1Corporate 52 36 53 87 29
91%
86%
90%
98%
97%
0102030405060708090
100
Tota
l Dea
l Vol
ume
Source:Bourne Partners Internal Research; CapitalIQ September 2016
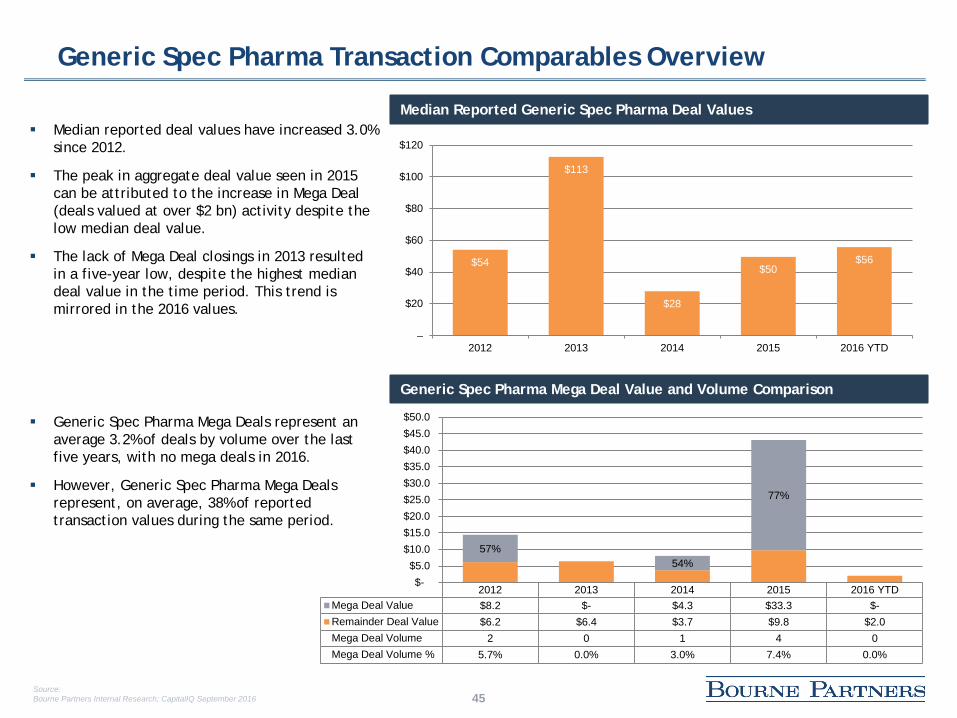
45
Generic Spec Pharma Transaction Comparables Overview
Median Reported Generic Spec Pharma Deal Values
Generic Spec Pharma Mega Deal Value and Volume Comparison
Median reported deal values have increased 3.0% since 2012.
The peak in aggregate deal value seen in 2015 can be attributed to the increase in Mega Deal (deals valued at over $2 bn) activity despite the low median deal value.
The lack of Mega Deal closings in 2013 resulted in a five-year low, despite the highest median deal value in the time period. This trend is mirrored in the 2016 values.
Generic Spec Pharma Mega Deals represent an average 3.2% of deals by volume over the last five years, with no mega deals in 2016.
However, Generic Spec Pharma Mega Deals represent, on average, 38% of reported transaction values during the same period.
$54
$113
$28
$50$56
–
$20
$40
$60
$80
$100
$120
2012 2013 2014 2015 2016 YTD
2012 2013 2014 2015 2016 YTDMega Deal Value $8.2 $- $4.3 $33.3 $-Remainder Deal Value $6.2 $6.4 $3.7 $9.8 $2.0Mega Deal Volume 2 0 1 4 0Mega Deal Volume % 5.7% 0.0% 3.0% 7.4% 0.0%
57%54%
77%
$- $5.0
$10.0 $15.0 $20.0 $25.0 $30.0 $35.0 $40.0 $45.0 $50.0
Source:Bourne Partners Internal Research; CapitalIQ September 2016

46
Generic Spec Pharma Regional Breakdown
Generic Spec Pharma Regional Breakdown by Volume Generic Spec Pharma Regional Breakdown by Value
Asia has maintained dominance in Generic Spec Pharma deal volume over the last five years. However, due to the amount of Mega Deals closed in 2013 and 2015, over 80% of deals by value were closed in the US and Europe.
Latin America
US & Canada Asia/Pacific
MENA
Europe
Africa
31% 25%
78%
59%67%
6%
53%
24%
10%
$0 bn
$5 bn
$10 bn
$15 bn
$20 bn
$25 bn
$30 bn
$35 bn
$40 bn
$45 bn
$50 bn
2012 2013 2014 2015 2016 YTD
7% 32% 11% 21% 21%
43%26%
55%42%
55%
38%21%
11%
21%
17%
0
10
20
30
40
50
60
70
80
90
100
2012 2013 2014 2015 2016 YTD
Source:Bourne Partners Internal Research; CapitalIQ September 2016

47
Generic Spec Pharma M&A Transaction Multiples*
Generic Spec Pharma LTM EBITDA Multiples Generic Spec Pharma LTM Revenue Multiples
Due to low deal volume in 2016 thus far, no LTM EBITDA multiples are available. Considering the high multiples at which companies were trading, Generic Spec Pharma multiples will likely decrease to historical levels, similar to the trend seen inBranded Spec Pharma.
After experiencing steady growth since 2012, Generic Spec Pharma revenue multiples have dropped considerably in 2016, far beyond historical norms.
*Due to the lack of Mega Deals thus far in 2016, multiples are not displayed.
2.4x
14.3x14.5x
11.4x
15.2x
16.1x
0x
2x
4x
6x
8x
10x
12x
14x
16x
18x
2012 2013 2014 2015
2.2x2.4x 2.5x
3.1x
1.7x
0.0x
0.5x
1.0x
1.5x
2.0x
2.5x
3.0x
3.5x
4.0x
2012 2013 2014 2015 2016 YTD
Source:Bourne Partners Internal Research; CapitalIQ September 2016
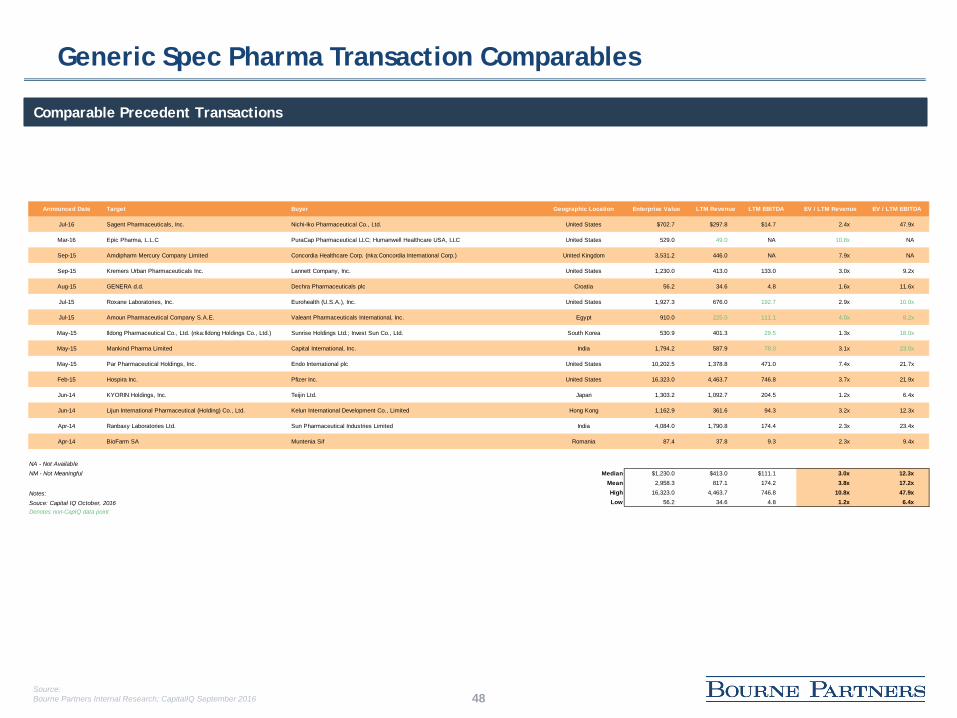
48
Generic Spec Pharma Transaction Comparables
Comparable Precedent Transactions
Announced Date Target Buyer Geographic Location Enterprise Value LTM Revenue LTM EBITDA EV / LTM Revenue EV / LTM EBITDA
Jul-16 Sagent Pharmaceuticals, Inc. Nichi-Iko Pharmaceutical Co., Ltd. United States $702.7 $297.8 $14.7 2.4x 47.9x
Mar-16 Epic Pharma, L.L.C PuraCap Pharmaceutical LLC; Humanwell Healthcare USA, LLC United States 529.0 49.0 NA 10.8x NA
Sep-15 Amdipharm Mercury Company Limited Concordia Healthcare Corp. (nka:Concordia International Corp.) United Kingdom 3,531.2 446.0 NA 7.9x NA
Sep-15 Kremers Urban Pharmaceuticals Inc. Lannett Company, Inc. United States 1,230.0 413.0 133.0 3.0x 9.2x
Aug-15 GENERA d.d. Dechra Pharmaceuticals plc Croatia 56.2 34.6 4.8 1.6x 11.6x
Jul-15 Roxane Laboratories, Inc. Eurohealth (U.S.A.), Inc. United States 1,927.3 676.0 192.7 2.9x 10.0x
Jul-15 Amoun Pharmaceutical Company S.A.E. Valeant Pharmaceuticals International, Inc. Egypt 910.0 225.0 111.1 4.0x 8.2x
May-15 Ildong Pharmaceutical Co., Ltd. (nka:Ildong Holdings Co., Ltd.) Sunrise Holdings Ltd.; Invest Sun Co., Ltd. South Korea 530.9 401.3 29.5 1.3x 18.0x
May-15 Mankind Pharma Limited Capital International, Inc. India 1,794.2 587.9 78.0 3.1x 23.0x
May-15 Par Pharmaceutical Holdings, Inc. Endo International plc United States 10,202.5 1,378.8 471.0 7.4x 21.7x
Feb-15 Hospira Inc. Pfizer Inc. United States 16,323.0 4,463.7 746.8 3.7x 21.9x
Jun-14 KYORIN Holdings, Inc. Teijin Ltd. Japan 1,303.2 1,092.7 204.5 1.2x 6.4x
Jun-14 Lijun International Pharmaceutical (Holding) Co., Ltd. Kelun International Development Co., Limited Hong Kong 1,162.9 361.6 94.3 3.2x 12.3x
Apr-14 Ranbaxy Laboratories Ltd. Sun Pharmaceutical Industries Limited India 4,084.0 1,790.8 174.4 2.3x 23.4x
Apr-14 BioFarm SA Muntenia Sif Romania 87.4 37.8 9.3 2.3x 9.4x
NA - Not AvailableNM - Not Meaningful Median $1,230.0 $413.0 $111.1 3.0x 12.3x
Mean 2,958.3 817.1 174.2 3.8x 17.2x
Notes: High 16,323.0 4,463.7 746.8 10.8x 47.9x
Souce: Capital IQ October, 2016 Low 56.2 34.6 4.8 1.2x 6.4xDenotes non-CapIQ data point
Source:Bourne Partners Internal Research; CapitalIQ September 2016
Transaction Profiles

50
Sagent-Nichi-iko Transaction Overview
Sagent Pharmaceuticals, Inc.A specialty generic pharmaceutical company focused on developing, manufacturing, and marketing injectable products in North America. The company offers anti-infective products, such as Cefepime as well as oncology products and critical care products. As of December 31, 2015, its product portfolio included 55 marketed products in an aggregate of 181 presentations. The company was founded in 2006 and headquartered in Illinois.
Financial Highlights: Total Revenue: $297.8 mm EBITDA: $14.7 mm Cash & ST Investments: $35.7 mm Total Debt: $6.0 mm
Deal Highlights
Transaction Value: $738.4 mm LTM Revenue Multiple: 2.4x Premium to preannouncement equity
value: 40%
Transaction Overview:
Nichi-Iko placed a tender offer to acquire Sagent for approximately $21.75 per share in cash. The deal will be financed through a combination of bank loans and available cash. The offer represented a 40% premium to the previous day’s close.
Strategic Rationale:
The acquisition will enhance Nichi-Iko’splatform in the U.S. to commercialize its biosimilar product pipeline and grow its presence in the injectables space. Through the acquisition, Nichi-Iko will raise its profile in the domestic and international generics market and advance the company’s goal of becoming a Top 10 global leader in generics.
Nichi-Iko Pharmaceutical Co. agreed to acquire Sagent Pharmaceuticals for approximately $730 million, or $21.75 or share, on July 10, 2016. Sagent’scurrent management team will continue to lead Sagent from its headquarters in Schaumburg, Illinois. The transaction is expected to close no later than January of 2017.
Nichi-Iko Pharmaceutical Co. (TSE:4541)The company is a global pharmaceutical manufacturer focused in the generic space. The company was incorporated in 1965 and is headquartered in Japan
Source:Bourne Partners Internal Research; CapitalIQ September 2016

51
Arbor Pharmaceuticals-XenoPort Transaction Overview
XenoPort, Inc. (NasdaqGS: XNPT)A biopharmaceutical company focused on developing and commercializing products primarily for the treatment of neurological disorders. Its primary drug is HORIZANT, for the treatment of restless leg syndrome and postherpetic neuralgia. The National Institute on Alcohol Abuse and Alcoholism has initiated a clinical trial evaluating HORIZANT as a treatment for alcoholism. XenoPort also has multiple development-stage products.
Financial Highlights: Total Revenue: $48.2 mm EBITDA: ($69.50 mm) Cash & ST Investments: 120.2 mm Total Debt: $111.9 mm
Deal Highlights
Transaction Value: $576.4 mm LTM Revenue Multiple: 9.5x Premium to preannouncement equity
value: 60%
Transaction Overview:
The original offer extended by Arbor on April 13, 2016 was for $6.20 per share, totaling $400 mm. This was revised twice before being accepted by XenoPort.
Deutsche Bank provided debt financing in support of the transaction.
Strategic Rationale:
Arbor will provide the proper resources for a more robust sales effort of XenoPort’s lead asset, HORIZANT.
The acquisition provides Arbor with a platform and pipeline in the neurologic drugs space.
Arbor Pharmaceuticals, LLC acquired XenoPort, Inc. for $7.03 per share totaling $467 million. This price per share represents a 60 percent premium on the May 20, 2016 closing price of XenoPort. Following the closing of the tender offer, the agreement provides a merger that would result in all shares not tendered in the tender offer being converted into the right to receive $7.03 per share in cash. The transaction has been approved by the Boards of Directors of both companies, and is expected to be immediately accretive to Arbor’s earnings per share.
Arbor Pharmaceuticals, LLC A specialty pharmaceutical company focused on the cardiovascular, hospital and pediatric markets. Arbor currently has 20 marketed ANDA or NDA products with over 35 more in various stages of development. Arbor Pharmaceuticals is headquartered in Atlanta, Georgia.
Source:Bourne Partners Internal Research; CapitalIQ September 2016

52
Abbot Laboratories-St. Jude Medical Transaction Overview
St. Jude Medical Inc. (NYSE: STJ)A medical device company focused on developing, manufacturing, and distributing cardiovascular devices in two categories: Implantable Electronic Systems and Cardiovascular and Ablation Technologies. Its products include MultiPoint, a first to market pacer; Proclaim Elite, a recharge-free spinal cord stimulation system; and EnSite Precision, a cardiac mapping system among others.
Financial Highlights: Total Revenue: $5.6 bn EBITDA: $1.6 bn Cash & ST Investments: $334.0 mm Total Debt: $6.1 bn
Deal Highlights
Transaction Value: $30.2 bn LTM EBITDA Multiple: 18.7x LTM Revenue Multiple: 5.3x Premium to preannouncement equity
value: 37%
Transaction Overview:
Abbot Laboratories is buying St. Jude Medical for $24.1 bn in cash and stock and will assume or refinance St. Jude’s $5.7 bn in debt. Abbot will finance the deal with a loan of up to $17.2 bn from Bank of America.
The acquisition is expected to add $0.21 to Abbot’s adjusted earnings per share in 2017 and $0.29 in 2018. The annual sales of the combined companies will total about $8.7 bn.
Strategic Rationale:
The acquisition gave Abbot access to top products in high-growth markets with more in the pipeline.
Abbot will expand its production capabilities and global scale, allowing the company to have a greater presence in foreign markets.
Abbot Laboratories announced that it has entered into a definitive agreement to acquire St. Jude Medical Inc. on April 28,2016. Under the agreement, St Jude shareholders will receive $46.75 in cash and 0.8708 shares of Abbot common stock. St. Jude’s top position as a heart failure device producer will round out Abbot’s Vascular Products segment to compete in every area of the cardiovascular market as either the Number 1 or 2 product. The deal is expected to create annual pre-tax synergies of $500 mm by 2020. The transaction has yet to close.
Abbott Laboratories (NYSE: ABT)Abbott Laboratories is a global pharmaceutical company that manufactures and sells health care products. Abbott currently focuses on four main segments: Established Pharmaceuticals, Diagnostics Products, Nutritional Products, and Vascular Products.
Source:Bourne Partners Internal Research; CapitalIQ September 2016
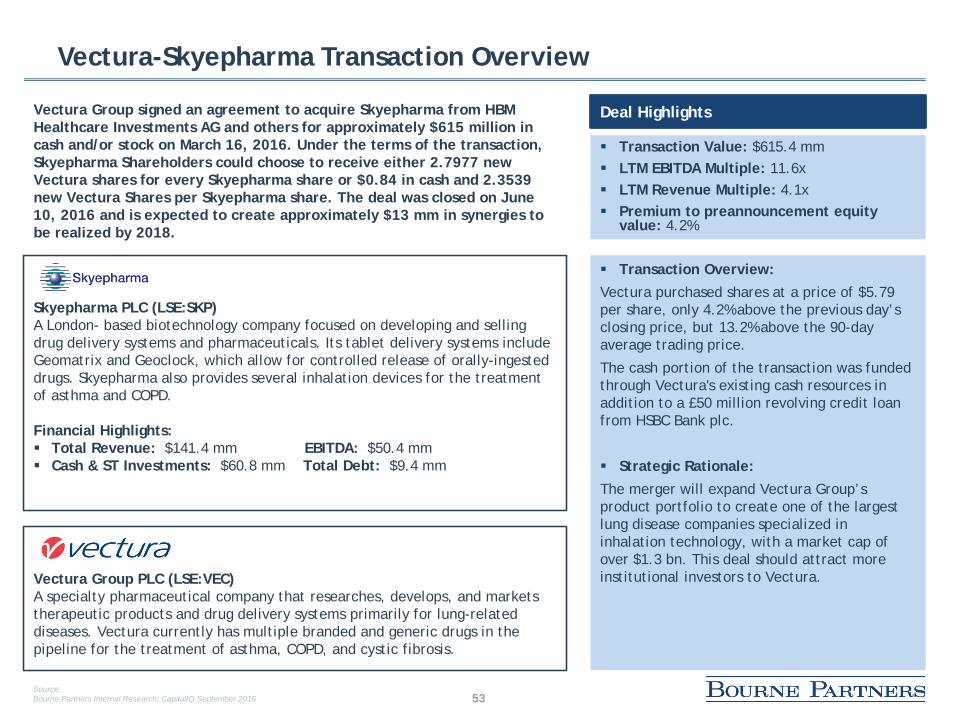
53
Vectura-Skyepharma Transaction Overview
Skyepharma PLC (LSE:SKP)A London- based biotechnology company focused on developing and selling drug delivery systems and pharmaceuticals. Its tablet delivery systems include Geomatrix and Geoclock, which allow for controlled release of orally-ingested drugs. Skyepharma also provides several inhalation devices for the treatment of asthma and COPD.
Financial Highlights: Total Revenue: $141.4 mm EBITDA: $50.4 mm Cash & ST Investments: $60.8 mm Total Debt: $9.4 mm
Deal Highlights
Transaction Value: $615.4 mm LTM EBITDA Multiple: 11.6x LTM Revenue Multiple: 4.1x Premium to preannouncement equity
value: 4.2%
Transaction Overview:Vectura purchased shares at a price of $5.79 per share, only 4.2% above the previous day’s closing price, but 13.2% above the 90-day average trading price.
The cash portion of the transaction was funded through Vectura's existing cash resources in addition to a £50 million revolving credit loan from HSBC Bank plc.
Strategic Rationale:
The merger will expand Vectura Group’s product portfolio to create one of the largest lung disease companies specialized in inhalation technology, with a market cap of over $1.3 bn. This deal should attract more institutional investors to Vectura.Vectura Group PLC (LSE:VEC)
A specialty pharmaceutical company that researches, develops, and markets therapeutic products and drug delivery systems primarily for lung-related diseases. Vectura currently has multiple branded and generic drugs in the pipeline for the treatment of asthma, COPD, and cystic fibrosis.
Vectura Group signed an agreement to acquire Skyepharma from HBM Healthcare Investments AG and others for approximately $615 million in cash and/or stock on March 16, 2016. Under the terms of the transaction, Skyepharma Shareholders could choose to receive either 2.7977 new Vectura shares for every Skyepharma share or $0.84 in cash and 2.3539 new Vectura Shares per Skyepharma share. The deal was closed on June 10, 2016 and is expected to create approximately $13 mm in synergies to be realized by 2018.
Source:Bourne Partners Internal Research; CapitalIQ September 2016

54
Mylan-Meda Transaction Overview
Meda AB (OM: MEDA A)A Swedish specialty pharma company focusing on various therapeutic areas in a 60/40 split between prescription and OTC medicines. 50% of company sales come from the Respiratory, Dermatology, and Pain and Inflammation areas. The company does not have an R&D pipeline – new products are obtained through acquisitions.
Financial Highlights: Total Revenue: $2.3 bn EBITDA: $761.1 mm Cash & ST Investments: $191.0 mm Total Debt: $2.9 bn
Deal Highlights
Transaction Value: 10.1 bn LTM EBITDA Multiple: 13.0x LTM Revenue Multiple: 4.3x Premium to preannouncement equity
value: 98.8%
Mylan, Inc. (NASDAQ: MYL)A pharmaceutical company that develops, licenses, manufactures, markets, and distributes generic, branded generic, and specialty pharmaceuticals worldwide. Mylan operates in two segments, Generics and Specialty. Mylan was founded in 1961 and is headquartered in Canonsburg, Pennsylvania.
Transaction Overview:
Mylan’s offer ran from May 20, 2016 – July 29, 2016. If Mylan owns 90% of Meda’s stock by this date, the Swedish Companies Act allows for a compulsory acquisition procedure to be implemented.
Strategic Rationale:The acquisition of Meda will add 2,000 new products to Mylan’s portfolio, strengthening the company’s product diversity and broadening its sales force in Europe.
Mylan made a tender offer to acquire Meda AB for $10.1 bn in cash and stock on February 10, 2016 – its third attempt at an acquisition. Under the terms of the transaction, Mylan will acquire 80% stake of Meda in cash at $19.52 per share and balance 20% stake in stock. Mylan will finance the cash portion of the offer consideration through a new bridge credit facility arranged by Deutsche Bank Securities Inc. and Goldman Sachs Bank USA. Mylan will fund the deal by placing senior note at $6.5 billion. The acquisition is expected to be immediately accretive to Mylan’s earnings.
Source:Bourne Partners Internal Research; CapitalIQ September 2016

55
Amerisource-PharMEDium Transaction Overview
PharMEDium Healthcare Holdings, Inc.The leading provider of compounded sterile preparations in the US, PharMEDium services over 3,000 hospitals through four distribution centers throughout the United States. The company utilizes cutting edge technology to minimize errors in addition to top labeling and packaging processes. The company only utilizes FDA approved or FDA allowed sterile drugs and containers in its preparations to ensure the highest quality of its products.
Financial Highlights: Total Revenue: $405.7 mm EBITDA: $96.0 mm Cash & ST Investments: $21.5 mm Total Debt: $507.2 mm
Deal Highlights
Transaction Value: $3.1 bn LTM EBITDA Multiple: 31.9x LTM Revenue Multiple: 7.5x
AmerisourceBergen Drug CorporationAmerisourceBergen is one of the largest global pharmaceutical sourcing and distribution services companies, with services ranging from drug distribution to pharmaceutical consulting services. AmerisourceBergen is headquartered in Valley Forge, PA.
Transaction Overview:The acquisition is expected to be $0.22 to $0.26 accretive to the Company’s adjusted earnings per share in 2016, and is expected to create $30 million in synergies by 2018.
Strategic Rationale:With increasing regulation surrounding sterile compounding, many hospitals have opted to outsource compounding production. To capture the growing demand for this service, and complement its existing business lines, AmerisourceBergen acquired PharMEDium.
The acquisition of PharMEDium complement’s AmerisourceBergen’s core business, and will expand and diversify the company’s already robust line of service offerings for healthcare systems.
AmerisourceBergen Drug Corporation signed a definitive agreement to acquire PharMEDium Healthcare Holdings, Inc. for $2.6 billion in cash, subject to certain adjustments and on a cash-free, debt-free basis on October 5, 2015. In November 2015, AmerisourceBergen entered into a $1 billion term loan credit agreement and used the proceeds from the agreement to repay funding sources used to finance a portion of the cash consideration paid in connection with the acquisition of PharMEDium. The deal was closed on November 6, 2015.
Source:Bourne Partners Internal Research; CapitalIQ September 2016
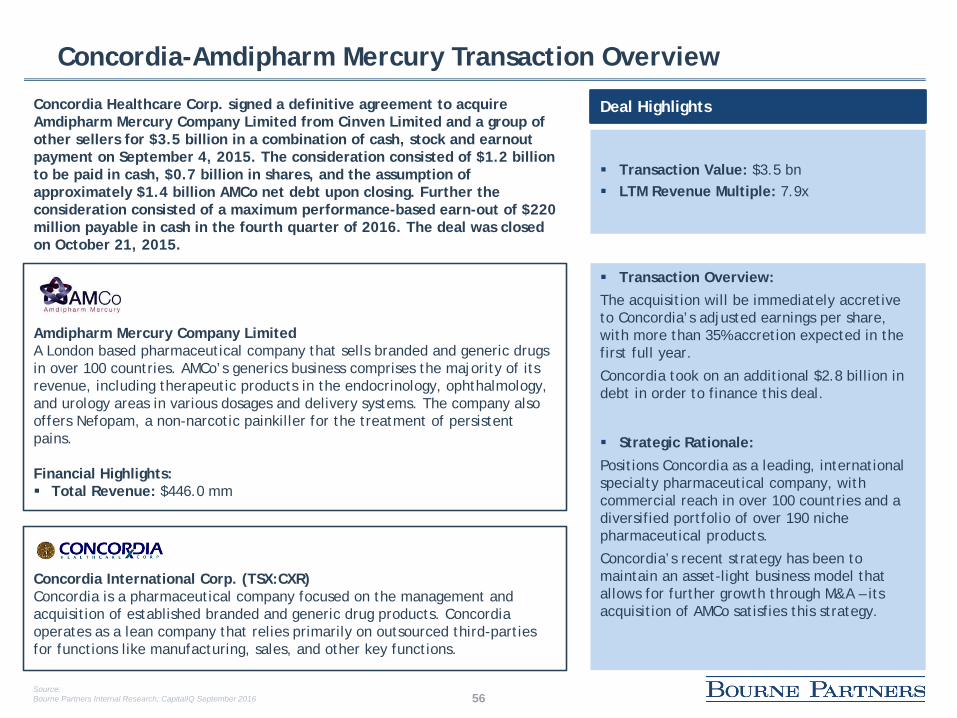
56
Concordia-Amdipharm Mercury Transaction Overview
Amdipharm Mercury Company LimitedA London based pharmaceutical company that sells branded and generic drugs in over 100 countries. AMCo’s generics business comprises the majority of its revenue, including therapeutic products in the endocrinology, ophthalmology, and urology areas in various dosages and delivery systems. The company also offers Nefopam, a non-narcotic painkiller for the treatment of persistent pains.
Financial Highlights: Total Revenue: $446.0 mm
Deal Highlights
Transaction Value: $3.5 bn LTM Revenue Multiple: 7.9x
Concordia International Corp. (TSX:CXR)Concordia is a pharmaceutical company focused on the management and acquisition of established branded and generic drug products. Concordia operates as a lean company that relies primarily on outsourced third-parties for functions like manufacturing, sales, and other key functions.
Transaction Overview:The acquisition will be immediately accretive to Concordia’s adjusted earnings per share, with more than 35% accretion expected in the first full year.
Concordia took on an additional $2.8 billion in debt in order to finance this deal.
Strategic Rationale:
Positions Concordia as a leading, international specialty pharmaceutical company, with commercial reach in over 100 countries and a diversified portfolio of over 190 niche pharmaceutical products.
Concordia’s recent strategy has been to maintain an asset-light business model that allows for further growth through M&A – its acquisition of AMCo satisfies this strategy.
Concordia Healthcare Corp. signed a definitive agreement to acquire Amdipharm Mercury Company Limited from Cinven Limited and a group of other sellers for $3.5 billion in a combination of cash, stock and earnout payment on September 4, 2015. The consideration consisted of $1.2 billion to be paid in cash, $0.7 billion in shares, and the assumption of approximately $1.4 billion AMCo net debt upon closing. Further the consideration consisted of a maximum performance-based earn-out of $220 million payable in cash in the fourth quarter of 2016. The deal was closed on October 21, 2015.
Source:Bourne Partners Internal Research; CapitalIQ September 2016
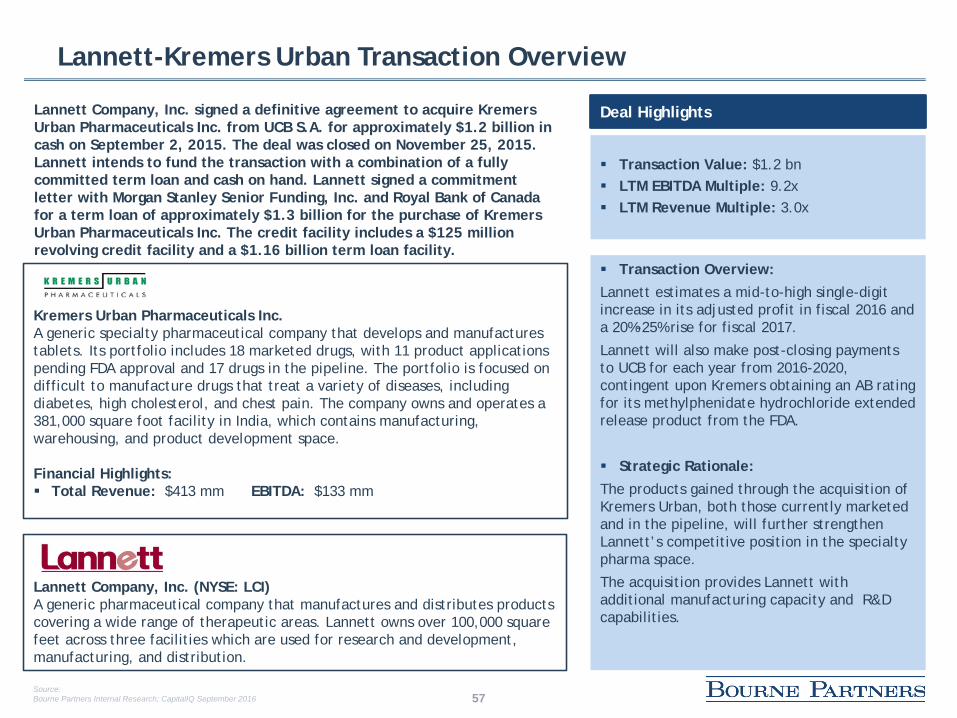
57
Lannett-Kremers Urban Transaction Overview
Kremers Urban Pharmaceuticals Inc.A generic specialty pharmaceutical company that develops and manufactures tablets. Its portfolio includes 18 marketed drugs, with 11 product applications pending FDA approval and 17 drugs in the pipeline. The portfolio is focused on difficult to manufacture drugs that treat a variety of diseases, including diabetes, high cholesterol, and chest pain. The company owns and operates a 381,000 square foot facility in India, which contains manufacturing, warehousing, and product development space.
Financial Highlights: Total Revenue: $413 mm EBITDA: $133 mm
Deal Highlights
Transaction Value: $1.2 bn LTM EBITDA Multiple: 9.2x LTM Revenue Multiple: 3.0x
Lannett Company, Inc. (NYSE: LCI)A generic pharmaceutical company that manufactures and distributes products covering a wide range of therapeutic areas. Lannett owns over 100,000 square feet across three facilities which are used for research and development, manufacturing, and distribution.
Transaction Overview:Lannett estimates a mid-to-high single-digit increase in its adjusted profit in fiscal 2016 and a 20%-25% rise for fiscal 2017.
Lannett will also make post-closing payments to UCB for each year from 2016-2020, contingent upon Kremers obtaining an AB rating for its methylphenidate hydrochloride extended release product from the FDA.
Strategic Rationale:
The products gained through the acquisition of Kremers Urban, both those currently marketed and in the pipeline, will further strengthen Lannett’s competitive position in the specialty pharma space.
The acquisition provides Lannett with additional manufacturing capacity and R&D capabilities.
Lannett Company, Inc. signed a definitive agreement to acquire KremersUrban Pharmaceuticals Inc. from UCB S.A. for approximately $1.2 billion in cash on September 2, 2015. The deal was closed on November 25, 2015. Lannett intends to fund the transaction with a combination of a fully committed term loan and cash on hand. Lannett signed a commitment letter with Morgan Stanley Senior Funding, Inc. and Royal Bank of Canada for a term loan of approximately $1.3 billion for the purchase of KremersUrban Pharmaceuticals Inc. The credit facility includes a $125 million revolving credit facility and a $1.16 billion term loan facility.
Source:Bourne Partners Internal Research; CapitalIQ September 2016

58
Eurohealth-Roxane Laboratories Transaction Overview
Roxane Laboratories, Inc.A specialty generic pharmaceutical company that researches, develops, manufactures, markets, and distributes drugs in specialized and niche markets of the market. Roxane Laboratories has 88 marketed products in the oncology, respiratory, extended release, and controlled substances with another 89 projects in the pipeline, of which 13 are first-to-file. Additionally, Roxane owns and operates an 875,000 square foot manufacturing facility which can produce solids, liquids, nasal sprays, and dry powder inhalers.
Financial Highlights: Total Revenue: $676.0 mm Total Assets: $802.22 mm
Deal Highlights
Transaction Value: $1.9 bn LTM EBITDA Multiple: 10.0x LTM Revenue Multiple: 2.9x
Eurohealth (U.S.A.), Inc. (Hikma Pharmaceuticals PLC)A generic and branded generic pharmaceutical company that develops, manufactures, and markets drugs across a broad range of therapeutic categories. It operates in the Branded, Injectables, and Generics segments, and has a portfolio of several hundred products with a strong pipeline.
Transaction Overview:Eurohealth financed the acquisition through a combination of cash, utilization of existing and new bank facilities.
Under the terms of the agreement, BoehringerIngelheim will not be permitted to dispose of any Hikma Shares at any time from Closing until January 1, 2017.
Strategic Rationale:
Establishes Hikma as the sixth largest player in the US generics market by revenue. The acquisition adds 88 differentiated products to Hikma’s US portfolio and 89 R&D advances to the company’s pipeline.
Eurohealth (U.S.A.), Inc. entered into an agreement to acquire Roxane Laboratories, Inc. from Boehringer Ingelheim for $2.6 billion in cash and stock on July 28, 2015. The deal was closed on February 29, 2016. At closing of the acquisition, Eurohealth paid Boehringer gross consideration of $647 million in cash and issued 40 million new Hikma shares to Boehringer. Eurohealth agreed to make contingent cash payments of up to $125 million, subject to the achievement of certain performance milestones.
Source:Bourne Partners Internal Research; CapitalIQ September 2016
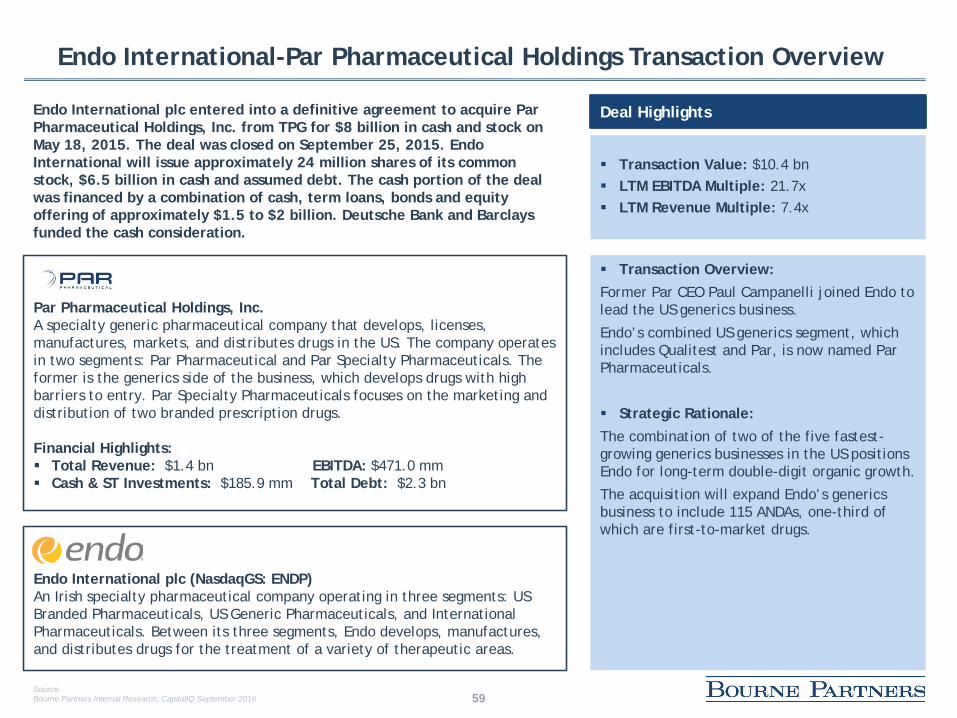
59
Endo International-Par Pharmaceutical Holdings Transaction Overview
Par Pharmaceutical Holdings, Inc.A specialty generic pharmaceutical company that develops, licenses, manufactures, markets, and distributes drugs in the US. The company operates in two segments: Par Pharmaceutical and Par Specialty Pharmaceuticals. The former is the generics side of the business, which develops drugs with high barriers to entry. Par Specialty Pharmaceuticals focuses on the marketing and distribution of two branded prescription drugs.
Financial Highlights: Total Revenue: $1.4 bn EBITDA: $471.0 mm Cash & ST Investments: $185.9 mm Total Debt: $2.3 bn
Deal Highlights
Transaction Value: $10.4 bn LTM EBITDA Multiple: 21.7x LTM Revenue Multiple: 7.4x
Endo International plc (NasdaqGS: ENDP)An Irish specialty pharmaceutical company operating in three segments: US Branded Pharmaceuticals, US Generic Pharmaceuticals, and International Pharmaceuticals. Between its three segments, Endo develops, manufactures, and distributes drugs for the treatment of a variety of therapeutic areas.
Transaction Overview:Former Par CEO Paul Campanelli joined Endo to lead the US generics business.
Endo’s combined US generics segment, which includes Qualitest and Par, is now named Par Pharmaceuticals.
Strategic Rationale:
The combination of two of the five fastest-growing generics businesses in the US positions Endo for long-term double-digit organic growth.
The acquisition will expand Endo’s generics business to include 115 ANDAs, one-third of which are first-to-market drugs.
Endo International plc entered into a definitive agreement to acquire Par Pharmaceutical Holdings, Inc. from TPG for $8 billion in cash and stock on May 18, 2015. The deal was closed on September 25, 2015. Endo International will issue approximately 24 million shares of its common stock, $6.5 billion in cash and assumed debt. The cash portion of the deal was financed by a combination of cash, term loans, bonds and equity offering of approximately $1.5 to $2 billion. Deutsche Bank and Barclays funded the cash consideration.
Source:Bourne Partners Internal Research; CapitalIQ September 2016
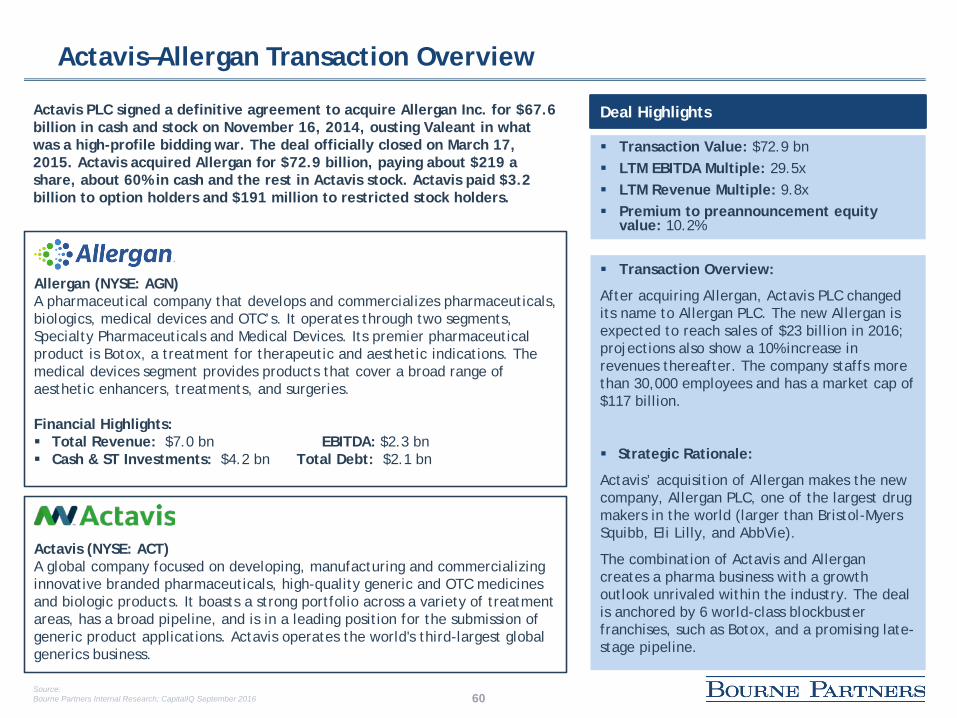
60
Allergan (NYSE: AGN)A pharmaceutical company that develops and commercializes pharmaceuticals, biologics, medical devices and OTC’s. It operates through two segments, Specialty Pharmaceuticals and Medical Devices. Its premier pharmaceutical product is Botox, a treatment for therapeutic and aesthetic indications. The medical devices segment provides products that cover a broad range of aesthetic enhancers, treatments, and surgeries.
Financial Highlights: Total Revenue: $7.0 bn EBITDA: $2.3 bn Cash & ST Investments: $4.2 bn Total Debt: $2.1 bn
Deal Highlights
Transaction Overview:
After acquiring Allergan, Actavis PLC changed its name to Allergan PLC. The new Allergan is expected to reach sales of $23 billion in 2016; projections also show a 10% increase in revenues thereafter. The company staffs more than 30,000 employees and has a market cap of $117 billion.
Strategic Rationale:
Actavis’ acquisition of Allergan makes the new company, Allergan PLC, one of the largest drug makers in the world (larger than Bristol-Myers Squibb, Eli Lilly, and AbbVie).
The combination of Actavis and Allergan creates a pharma business with a growth outlook unrivaled within the industry. The deal is anchored by 6 world-class blockbuster franchises, such as Botox, and a promising late-stage pipeline.
Transaction Value: $72.9 bn LTM EBITDA Multiple: 29.5x LTM Revenue Multiple: 9.8x Premium to preannouncement equity
value: 10.2%
Actavis PLC signed a definitive agreement to acquire Allergan Inc. for $67.6 billion in cash and stock on November 16, 2014, ousting Valeant in what was a high-profile bidding war. The deal officially closed on March 17, 2015. Actavis acquired Allergan for $72.9 billion, paying about $219 a share, about 60% in cash and the rest in Actavis stock. Actavis paid $3.2 billion to option holders and $191 million to restricted stock holders.
Actavis (NYSE: ACT)A global company focused on developing, manufacturing and commercializing innovative branded pharmaceuticals, high-quality generic and OTC medicines and biologic products. It boasts a strong portfolio across a variety of treatment areas, has a broad pipeline, and is in a leading position for the submission of generic product applications. Actavis operates the world's third-largest global generics business.
Source:Bourne Partners Internal Research; CapitalIQ September 2016
Actavis–Allergan Transaction Overview

61
Valeant-Salix Transaction Overview
Salix Pharmaceuticals, Ltd. A branded specialty pharmaceutical company that develops and markets prescription pharmaceuticals and medical devices for the prevention and treatment of gastrointestinal diseases. Salix’s primary strategy is to in-licenses late-stage or marketed proprietary therapeutic products. Its products include Xifaxan tablets for the treatment of hepatic encephalopathy and Pepcid for short- term treatment of GERD.
Financial Highlights: Total Revenue: $1.1 bn EBITDA: $154.8 mm Cash & ST Investments: $499.3 mm Total Debt: $2.9 bn
Deal Highlights
Transaction Value: $14.0 bn LTM EBITDA Multiple: 87.5x LTM Revenue Multiple: 11.9x
Transaction Overview:As a result of the merger, Salix became a wholly owned subsidiary of Valeant Pharmaceuticals and the common stock of Salix is no longer listed for trading on the NASDAQ Global Select Market.
Deutsche Bank Securities Inc., HSBC, Mitsubishi UFJ Securities, Inc., DNB Bank ASA and SunTrust Robinson Humphrey, Inc. provided fully committed debt financing including $15 billion for financing the acquisition.
Strategic Rationale:
The gastrointestinal disease therapeutic area is one of the fastest growing areas in the specialty pharmaceutical market. Through this acquisition, Valeant will become a leading player in this market.
Valeant Pharmaceuticals International (NYSE: VRX)A multinational specialty pharmaceutical company producing branded, branded generic, and over the counter products. Valeant focuses on cutting costs by acquiring companies rather than spend on R&D. This approach allows the company to expand into high- growth markets with minimal risk of being beaten to market.
Valeant Pharmaceuticals International entered into a definitive agreement to acquire Salix Pharmaceuticals Ltd. for $10.4 billion in cash on February 20, 2015. The transaction was structured as a tender offer and Valeant will pay $173 per share as purchase consideration for each common stock and restricted common stock of Salix. Valeant Pharmaceuticals also acquired the remaining untendered shares of Salix for $173 per share. The deal closed on April 1, 2015.
Source:Bourne Partners Internal Research; CapitalIQ September 2016
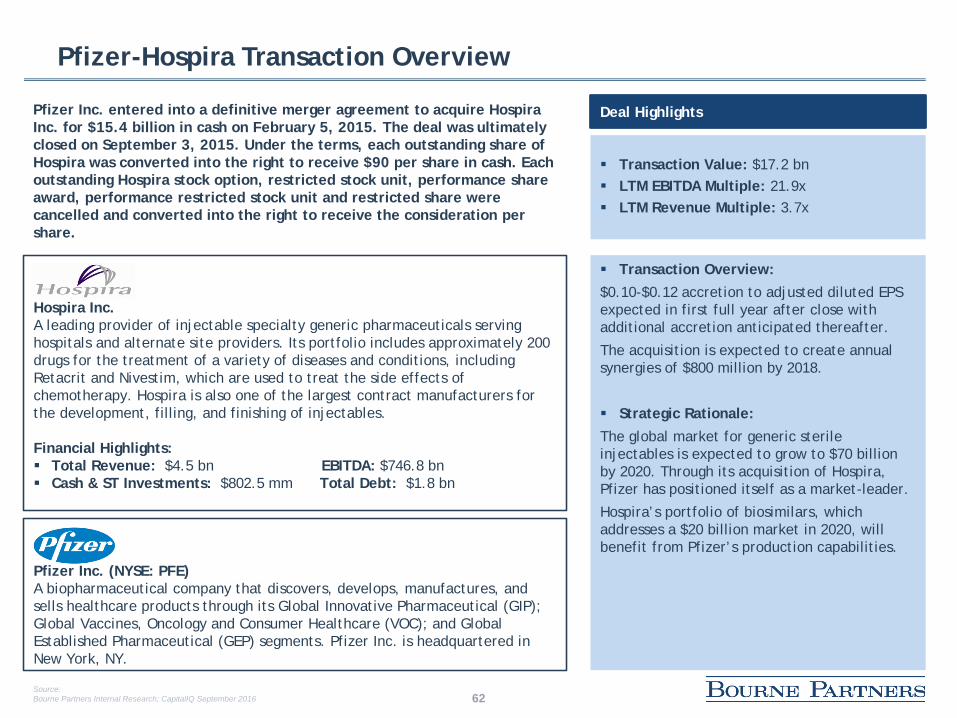
62
Pfizer-Hospira Transaction Overview
Hospira Inc.A leading provider of injectable specialty generic pharmaceuticals serving hospitals and alternate site providers. Its portfolio includes approximately 200 drugs for the treatment of a variety of diseases and conditions, including Retacrit and Nivestim, which are used to treat the side effects of chemotherapy. Hospira is also one of the largest contract manufacturers for the development, filling, and finishing of injectables.
Financial Highlights: Total Revenue: $4.5 bn EBITDA: $746.8 bn Cash & ST Investments: $802.5 mm Total Debt: $1.8 bn
Deal Highlights
Transaction Value: $17.2 bn LTM EBITDA Multiple: 21.9x LTM Revenue Multiple: 3.7x
Pfizer Inc. (NYSE: PFE)A biopharmaceutical company that discovers, develops, manufactures, and sells healthcare products through its Global Innovative Pharmaceutical (GIP); Global Vaccines, Oncology and Consumer Healthcare (VOC); and Global Established Pharmaceutical (GEP) segments. Pfizer Inc. is headquartered in New York, NY.
Transaction Overview:$0.10-$0.12 accretion to adjusted diluted EPS expected in first full year after close with additional accretion anticipated thereafter.
The acquisition is expected to create annual synergies of $800 million by 2018.
Strategic Rationale:
The global market for generic sterile injectables is expected to grow to $70 billion by 2020. Through its acquisition of Hospira, Pfizer has positioned itself as a market-leader.
Hospira’s portfolio of biosimilars, which addresses a $20 billion market in 2020, will benefit from Pfizer’s production capabilities.
Pfizer Inc. entered into a definitive merger agreement to acquire HospiraInc. for $15.4 billion in cash on February 5, 2015. The deal was ultimately closed on September 3, 2015. Under the terms, each outstanding share of Hospira was converted into the right to receive $90 per share in cash. Each outstanding Hospira stock option, restricted stock unit, performance share award, performance restricted stock unit and restricted share were cancelled and converted into the right to receive the consideration per share.
Source:Bourne Partners Internal Research; CapitalIQ September 2016

63
Abbott-CFR Transaction Overview
CFR Pharmaceuticals S.A. (BCS: CFR)A Latin American specialty pharmaceutical company engaged in the research, development, production, and sale of specialty generic medicines and injectables. It offers products comprising women’s health, neurology, psychiatry, pneumology, otorhinolaryngology, allergies, cardiology, dermatology, and ophthalmology. The company also provides therapeutic drugs for the treatment of hard-to treat illnesses.
Financial Highlights: Total Revenue : $782.3 mm EBITDA: $117.1 mm Cash & ST Investments : $106.4 mm Total Debt: $ 535.6 mm
Abbott Laboratories signed a definitive agreement to acquire a 72.62% stake in CFR Pharmaceuticals S.A. from the Weinstein family for $2.1 billion on May 15, 2014. In a related transaction, Abbott made an offer to acquire the remaining 27.38% stake in CFR for approximately $780 million. Abbott Laboratories assumed approximately $430 million of CFR’s net debt. All deals closed on September 23, 2014. The equity value of the transaction was about 53% more than CFR’s value of $1.89 billion.
Deal Highlights
Transaction Value: $2.9 bn LTM EBITDA Multiple: 24.8x LTM Revenue Multiple: 3.7x
Transaction Overview: The deal added $900 million to Abbott’s sales in 2015, and Abbott expects double digit sales growth in the next several years.
The company will finance the transaction with a cash tender of all the outstanding shares and will inherit $430 million of CFR’s net debt.
Strategic Rationale:
The Latin American pharmaceutical market is expected to grow from $73 billion in 2014 to $124 billion by 2018.
This acquisition will double Abbott’s branded generic pharmaceutical sales in the region and place them in the top 10 pharmaceutical companies in Latin America.
Abbott Laboratories (NYSE: ABT)Abbott Laboratories is a global pharmaceutical company that manufactures and sells health care products. Abbott currently focuses on four main segments: Established Pharmaceuticals, Diagnostics Products, Nutritional Products, and Vascular Products.
Source:Bourne Partners Internal Research; CapitalIQ September 2016
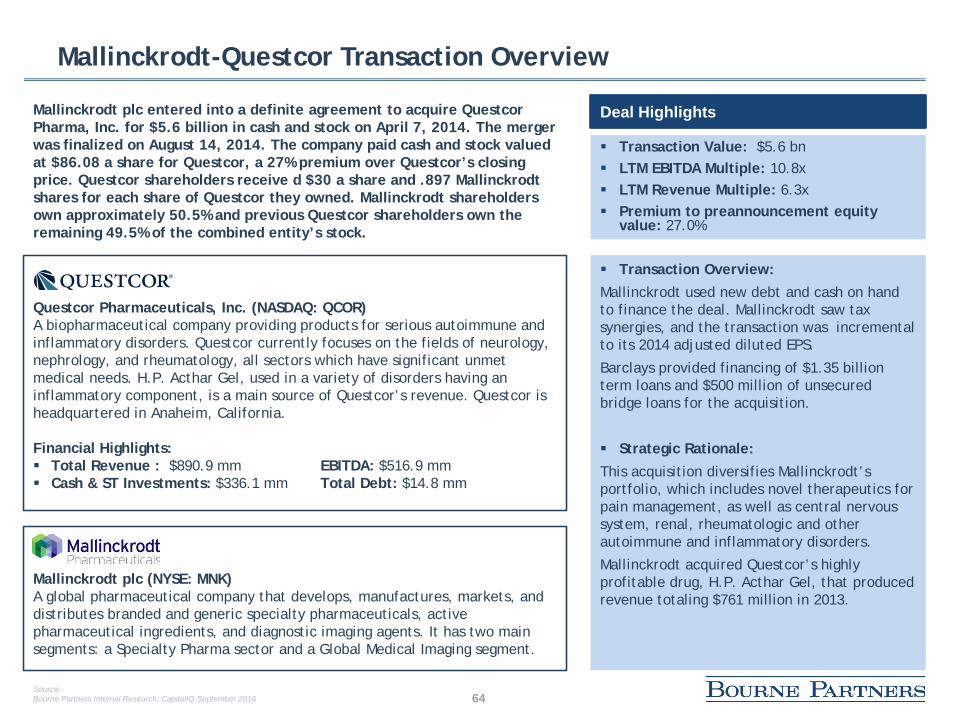
64
Mallinckrodt-Questcor Transaction Overview
Questcor Pharmaceuticals, Inc. (NASDAQ: QCOR)A biopharmaceutical company providing products for serious autoimmune and inflammatory disorders. Questcor currently focuses on the fields of neurology, nephrology, and rheumatology, all sectors which have significant unmet medical needs. H.P. Acthar Gel, used in a variety of disorders having an inflammatory component, is a main source of Questcor’s revenue. Questcor is headquartered in Anaheim, California.
Financial Highlights: Total Revenue : $890.9 mm EBITDA: $516.9 mm Cash & ST Investments: $336.1 mm Total Debt: $14.8 mm
Mallinckrodt plc entered into a definite agreement to acquire Questcor Pharma, Inc. for $5.6 billion in cash and stock on April 7, 2014. The merger was finalized on August 14, 2014. The company paid cash and stock valued at $86.08 a share for Questcor, a 27% premium over Questcor’s closing price. Questcor shareholders receive d $30 a share and .897 Mallinckrodt shares for each share of Questcor they owned. Mallinckrodt shareholders own approximately 50.5% and previous Questcor shareholders own the remaining 49.5% of the combined entity’s stock.
Deal Highlights
Transaction Value: $5.6 bn LTM EBITDA Multiple: 10.8x LTM Revenue Multiple: 6.3x Premium to preannouncement equity
value: 27.0%
Transaction Overview: Mallinckrodt used new debt and cash on hand to finance the deal. Mallinckrodt saw tax synergies, and the transaction was incremental to its 2014 adjusted diluted EPS.
Barclays provided financing of $1.35 billion term loans and $500 million of unsecured bridge loans for the acquisition.
Strategic Rationale:
This acquisition diversifies Mallinckrodt’s portfolio, which includes novel therapeutics for pain management, as well as central nervous system, renal, rheumatologic and other autoimmune and inflammatory disorders.
Mallinckrodt acquired Questcor’s highly profitable drug, H.P. Acthar Gel, that produced revenue totaling $761 million in 2013.
Mallinckrodt plc (NYSE: MNK)A global pharmaceutical company that develops, manufactures, markets, and distributes branded and generic specialty pharmaceuticals, active pharmaceutical ingredients, and diagnostic imaging agents. It has two main segments: a Specialty Pharma sector and a Global Medical Imaging segment.
Source:Bourne Partners Internal Research; CapitalIQ September 2016
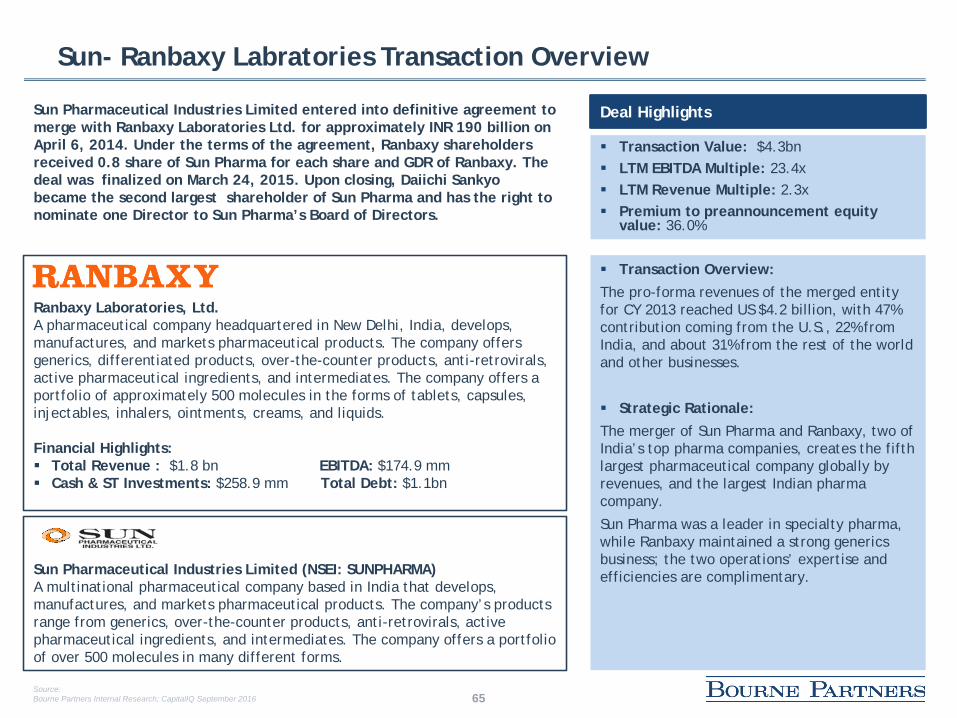
65
Sun- Ranbaxy Labratories Transaction Overview
Ranbaxy Laboratories, Ltd.A pharmaceutical company headquartered in New Delhi, India, develops, manufactures, and markets pharmaceutical products. The company offers generics, differentiated products, over-the-counter products, anti-retrovirals, active pharmaceutical ingredients, and intermediates. The company offers a portfolio of approximately 500 molecules in the forms of tablets, capsules, injectables, inhalers, ointments, creams, and liquids.
Financial Highlights: Total Revenue : $1.8 bn EBITDA: $174.9 mm Cash & ST Investments: $258.9 mm Total Debt: $1.1bn
Sun Pharmaceutical Industries Limited entered into definitive agreement to merge with Ranbaxy Laboratories Ltd. for approximately INR 190 billion on April 6, 2014. Under the terms of the agreement, Ranbaxy shareholders received 0.8 share of Sun Pharma for each share and GDR of Ranbaxy. The deal was finalized on March 24, 2015. Upon closing, Daiichi Sankyo became the second largest shareholder of Sun Pharma and has the right to nominate one Director to Sun Pharma’s Board of Directors.
Deal Highlights
Transaction Value: $4.3bn LTM EBITDA Multiple: 23.4x LTM Revenue Multiple: 2.3x Premium to preannouncement equity
value: 36.0%
Transaction Overview: The pro-forma revenues of the merged entity for CY 2013 reached US $4.2 billion, with 47% contribution coming from the U.S., 22% from India, and about 31% from the rest of the world and other businesses.
Strategic Rationale:The merger of Sun Pharma and Ranbaxy, two of India’s top pharma companies, creates the fifth largest pharmaceutical company globally by revenues, and the largest Indian pharma company.
Sun Pharma was a leader in specialty pharma, while Ranbaxy maintained a strong generics business; the two operations’ expertise and efficiencies are complimentary. Sun Pharmaceutical Industries Limited (NSEI: SUNPHARMA)
A multinational pharmaceutical company based in India that develops, manufactures, and markets pharmaceutical products. The company’s products range from generics, over-the-counter products, anti-retrovirals, active pharmaceutical ingredients, and intermediates. The company offers a portfolio of over 500 molecules in many different forms.
Source:Bourne Partners Internal Research; CapitalIQ September 2016

66
Actavis-Forest Laboratories Transaction Overview
Forest Laboratories, Inc.A branded specialty pharmaceutical company that develops, manufactures, and sells branded forms of ethical drug products in the US and Europe. Forest Laboratories’ 14 main drugs treat diseases and ailments ranging from depressive disorders to Irritable Bowel Syndrome, sever dementia, fibromyalgia, schizophrenia, and urinary tract infections to name a few. The company was founded in 1954 and is based in New York, New York.
Financial Highlights: Total Revenue : $3.4 bn EBITDA: $418.3 mm Cash & ST Investments: $3.0 bn Total Debt: $1.2 bn
Actavis entered into a definitive agreement to acquire Forest Laboratories, Inc. for $24.5 billion on February 18, 2014. Shareholders of Forest received 0.3306 shares of Actavis common stock and $26.04 in cash for each share of Forest including an option for Forest shareholders to elect an all-stock or all-cash consideration. The ratio was a 70/30 equity and cash split, the cash portion was funded through existing cash and new debt. The transaction closed on July 1, 2014.
Deal Highlights
Transaction Value: $26.6 bn LTM EBITDA Multiple: 56.3x LTM Revenue Multiple: 7.0x Increase to Forest preannouncement
equity value: 25.3%
Transaction Overview: Forest investors received cash and stock valued at $86.81 per share or 0.4723 Actavis shares of Forest Labs.
The deal was financed through $7 billion in loans.
Actavis and Forest divested products to ImpaxLaboratories and Catalent Pharma Solutions in order to receive FTC approval for the transaction.
Strategic Rationale:The acquisition of Forest Laboratories strengthens Actavis’ position in the branded market and further solidifies its position at the top of generics.
Forest’s Alzheimer’s drug Namenda and the blood-pressure pill Bystolic, among others, were accretive to Actavis’ earnings.
Actavis plc (NYSE: ACT)An primarily generic specialty pharmaceutical company engaged in the global development, manufacture, sale and distribution of pharmaceutical products. It operates in three segments: the Actavis Pharma segment, the Actavis Specialty Brands segment, and the ANDA Distribution segment.
Source:Bourne Partners Internal Research; CapitalIQ September 2016

67
Forest Laboratories-Aptalis Transaction Overview
Aptalis Holdings Inc. A pharmaceutical company that develops, manufactures, licenses and markets a range of therapies for cystic fibrosis and gastrointestinal disorders. The company’s principal products include ZENPEP, ULTRESA, VIOKACE, PANZYTRAT, RECTIV, and SALOFALK. The company sells its products to individual patients, pharmaceutical wholesale distributors, and pharmacy chains primarily in the United States, the European Union and Canada.
Financial Highlights: Total Revenue : $700.2 mm EBITDA: $275.6 mm Cash & ST Investments: $104.2 mm Total Debt: $1.2 bn
Forest Laboratories Inc. entered into a definitive agreement to acquire Aptalis Holdings Inc. for $2.9 billion in cash on January 7, 2014. As part of the acquisition, Forest Laboratories paid off all debt held by Aptalis. Forest used a combination of cash on hand and debt to fund the transaction. Forest secured a commitment from Morgan Stanley Senior Funding, Inc. for a $1.9 billion bridge facility. The transaction closed on January 31, 2014.
Deal Highlights
Transaction Value: $2.9 bn LTM EBITDA Multiple: 10.5x LTM Revenue Multiple: 4.1x
Transaction Overview: The transaction added $0.78 to Forest's adjusted earnings per share in 2015, along with nearly $700 million in revenue.
Brent Saunders, the company's new chief executive, outlined plans to cut $500 million in costs by 2016 while using Forest's cash to buy drugs it can fold into its portfolio.
Strategic Rationale:The acquisition strengthens Forest’s position in the gastrointestinal therapeutic market and supplements its European cystic fibrosis business.
Forest looks to capitalize on cost synergies totaling $125 million through 2016, while also driving growth through a new line of blockbuster drugs.
Forest Laboratories, LLC. A specialty pharmaceutical company that develops, manufactures, and sells branded drug products in the US and Europe. Forest Laboratories’ 14 main drugs in its portfolio treat diseases and ailments ranging from depressive disorders to Irritable Bowel Syndrome, sever dementia, and fibromyalgia.
Source:Bourne Partners Internal Research; CapitalIQ September 2016

Firm Overview

69
Bourne Partners Firm Overview
Dots represent the countries where the Bourne Partners team
has transaction experience Specialty Pharmaceuticals (Rx) Consumer Health / Wellness (OTC) Healthcare Services
Segmentation
Mergers & Acquisitions— Company and product divestments— Primarily sell-side with select buy-side assignments— $10 - 500 million transaction size focus
Business Development Support Services— In/out-licensing of late stage and approved products— United States, European, and Asian companies
focused on partnering locally or internationally
Capital Raising— $10 - 500 million raises— Debt and equity
Advisory Services
Geographic Coverage
Investment Banking Advisory Direct Investing and Fund of Funds Platform Healthcare Operational and Management Consulting
Life Sciences Merchant Bank
Nearly $5 billion in transactions in 2015
Select Tombstones

70
Relevant Industry Experience
Representative Passive, Fund, & Co-Investments
Representative Active Role Investments
Select Strategic Advisory Clients
Select Sponsor/Lender Clients
Select Recent Product Acquisition Partners

71
j
550 South Caldwell Street, Suite 900Charlotte, North Carolina 28202
www.bourne-partners.comTel: 704-552-8407Fax: 704-714-8363
jj
Xan SmithManaging Director of Business DevelopmentOffice: 704.552.8407Mobile: 910.585.1793
Over 50 years of combined pharmaceutical, medical device, biotechnology, and life sciences healthcare experience
Over 70 years of combined investment banking and private equity transaction experience
Transactions completed in more than 35 countries
Office Information Contact Details
― Mergers & Acquisitions*― Licensing Agreements ― Product Divestitures*
― Distribution Agreements― Corporate Spin-offs*
― Capital Raising*
― Strategy Consulting― Fund Management― Direct Investing
Bourne Partners is Comprised of Experienced Investment Professionals, Healthcare Executives, and Operating Partners
Bill TaylorDirector of Legal Affairs
Banks BourneChief Executive Officer
Minor HinsonChief Investment Officer
Jeremy JohnsonManaging Director
Xan SmithManaging Director
Robert StanleyVice President
Todd BokusVice President
Chris InklebargerVice President
* Investment Banking services are offered by Bourne Partners Securities, LLC, a
registered broker dealer, Member FINRA and SIPC.
Bourne Partners Senior Team