Embed Size (px)
Citation preview

2019 ANNUAL REPORT | FINANCIAL STATEMENTS
BANK OF THE WESTAND SUBSIDIARIES
The bank for a changing world®

1
Report of Independent Auditors
To the Board of Directors of Bank of the West:
We have audited the accompanying consolidated financial statements of Bank of the West and its Subsidiaries (the “Company”), which comprise the consolidated balance sheets as of December 31, 2019 and 2018, and the related consolidated statements of income, comprehensive income, changes in equity and cash flows for the years then ended. We also have audited Bank of the West and its Subsidiaries’ internal control over financial reporting as of December 31, 2019 based on criteria established in Internal Control - Integrated Framework (2013) issued by the Committee of Sponsoring Organizations of the Treadway Commission (COSO).
Management's Responsibility for the Consolidated Financial Statements and Internal Control over Financial Reporting
Management is responsible for the preparation and fair presentation of the consolidated financial statements in accordance with accounting principles generally accepted in the United States of America; this includes the design, implementation, and maintenance of effective internal control over financial reporting relevant to the preparation and fair presentation of the consolidated financial statements that are free from material misstatement, whether due to fraud or error. Management is also responsible for its assessment about the effectiveness of internal control over financial reporting, included in the accompanying Report of Management on Effectiveness of Internal Controls.
Auditors’ Responsibility
Our responsibility is to express an opinion on the consolidated financial statements and an opinion on the Company's internal control over financial reporting based on our audits. We conducted our audits in accordance with auditing standards generally accepted in the United States of America. Those standards require that we plan and perform the audits to obtain reasonable assurance about whether the consolidated financial statements are free from material misstatement and whether effective internal control over financial reporting was maintained in all material respects.
An audit of financial statements involves performing procedures to obtain audit evidence about the amounts and disclosures in the consolidated financial statements. The procedures selected depend on our judgment, including assessment of the risks of material misstatement of the consolidated financial statements, whether due to fraud or error. In making those risk assessments, we consider internal control relevant to the company's preparation and fair presentation of the consolidated financial statements in order to design audit procedures that are appropriate in the circumstances. An audit of financial statements also includes evaluating the appropriateness of accounting policies used and the reasonableness of significant accounting estimates made by management, as well as evaluating the overall presentation of the financial statements.
An audit of internal control over financial reporting involves performing procedures to obtain evidence about whether a material weakness exists. The procedures selected depend on our judgment, including assessment of the risk that a material weakness exists. An audit of internal control over financial reporting also involves obtaining an understanding of internal control over financial reporting and testing and evaluating the design and operating effectiveness of internal control over financial reporting based on the assessed risk.
We believe that the audit evidence we have obtained is sufficient and appropriate to provide a basis for our audit opinions.
Definition and Inherent Limitations of Internal Control Over Financial Reporting
A company’s internal control over financial reporting is a process effected by those charged with governance, management, and other personnel, designed to provide reasonable assurance regarding the preparation of reliable financial statements in accordance with accounting principles generally accepted in the United States of America. Because management's assessment and our audit were conducted to meet the reporting requirements of Section 112 of the Federal Deposit Insurance Corporation Improvement Act (FDICIA), our audit of Bank of the West and its subsidiaries’ internal control over financial reporting included controls over the preparation of financial statements in accordance with accounting principles generally accepted in the United States of America and with the instructions to the Federal Financial Institutions Examination Council Instructions for Consolidated Reports of Condition and Income. A company’s internal control over financial reporting includes those policies and procedures that (i) pertain to the maintenance of records that, in reasonable detail, accurately and fairly reflect the transactions and dispositions of the assets of the company; (ii) provide reasonable assurance that transactions are recorded as necessary to permit preparation of financial statements in accordance with accounting principles generally accepted in the United States of America, and that receipts and expenditures of the company are being made only in accordance with authorizations of management and those charged with governance; and (iii) provide reasonable assurance
2
regarding prevention, or timely detection and correction, of unauthorized acquisition, use, or disposition of the company’s assets that could have a material effect on the financial statements.
Because of its inherent limitations, internal control over financial reporting may not prevent, or detect and correct, misstatements. Also, projections of any assessment of effectiveness to future periods are subject to the risk that controls may become inadequate because of changes in conditions, or that the degree of compliance with the policies or procedures may deteriorate. Opinions
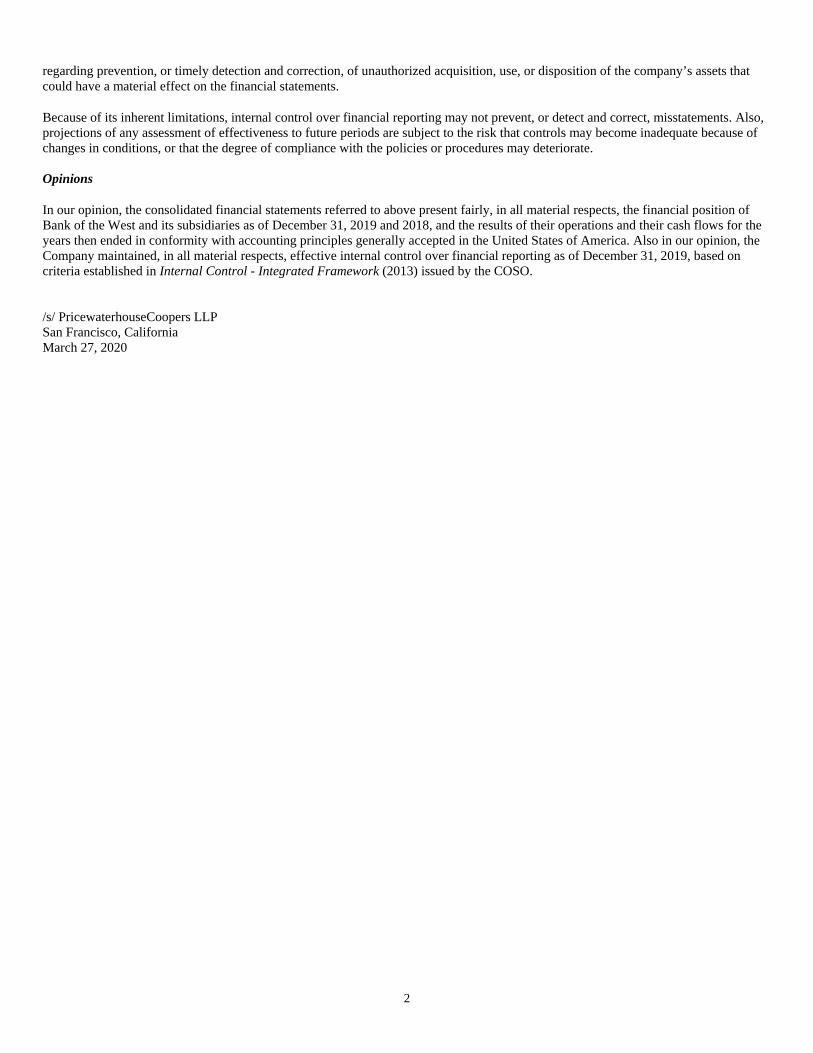
In our opinion, the consolidated financial statements referred to above present fairly, in all material respects, the financial position of Bank of the West and its subsidiaries as of December 31, 2019 and 2018, and the results of their operations and their cash flows for the years then ended in conformity with accounting principles generally accepted in the United States of America. Also in our opinion, the Company maintained, in all material respects, effective internal control over financial reporting as of December 31, 2019, based on criteria established in Internal Control - Integrated Framework (2013) issued by the COSO. /s/ PricewaterhouseCoopers LLP San Francisco, California March 27, 2020

3
BANK OF THE WEST AND SUBSIDIARIES CONSOLIDATED STATEMENTS OF INCOME
Years Ended December 31, (dollars in thousands) 2019 2018 Interest income Loans and lease financing $ 2,710,952 $ 2,590,055 Securities 393,464 291,560 Other 60,991 140,604 Total interest income 3,165,407 3,022,219 Interest expense Deposits 692,407 529,781 Short-term borrowings and long-term debt 189,172 158,333 Total interest expense 881,579 688,114 Net interest income 2,283,828 2,334,105 Provision for credit losses 145,066 112,152 Net interest income after provision for credit losses 2,138,762 2,221,953 Noninterest income Service charges on deposit accounts 151,664 146,244 Credit and debit card fees 133,297 123,811 Loan fees 60,020 66,373 Brokerage income 41,056 38,994 Other service charges and fees 39,661 40,474 Net gains on sales of loans and leases 35,603 24,852 Net gains on customer accommodation derivatives 34,917 29,751 Trust and investment services income 23,899 25,207 Bank-owned life insurance 28,210 27,633 Net gains (losses) on debt securities available for sale 8,115 (233)Other 4,858 4,252 Total noninterest income 561,300 527,358 Noninterest expense Salaries and employee benefits 1,098,307 1,088,034 Contracted services and professional fees 182,129 169,484 Occupancy 151,198 148,237 Equipment 100,441 92,361 Intangible amortization 58,722 54,507 Advertising and marketing 43,218 50,847 Regulatory assessment and fees 38,652 65,310 Collection and repossession 13,416 11,823 Other 175,954 170,725 Total noninterest expense 1,862,037 1,851,328 Income before income taxes and noncontrolling interest 838,025 897,983 Income tax expense 217,858 202,100 Net income before noncontrolling interest 620,167 695,883 Net income attributable to noncontrolling interest 2,992 3,334 Net income attributable to Bank of the West and subsidiaries $ 617,175 $ 692,549
The accompanying notes are an integral part of these consolidated financial statements.
4
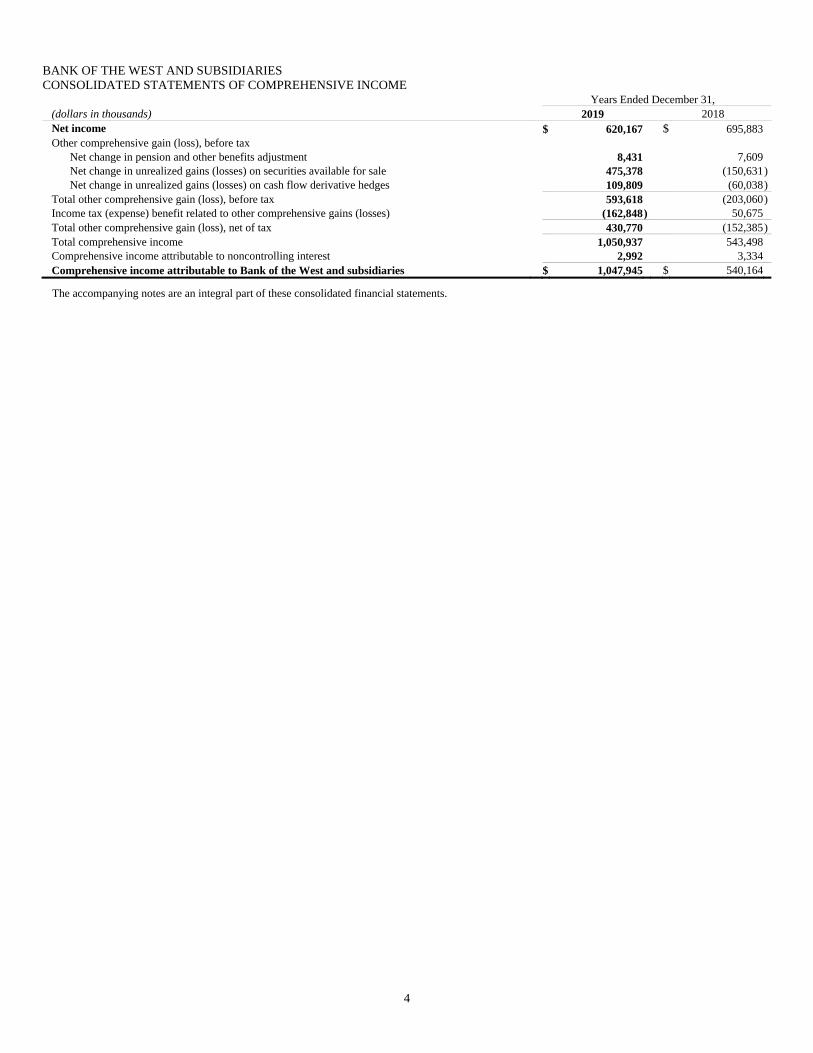
BANK OF THE WEST AND SUBSIDIARIES CONSOLIDATED STATEMENTS OF COMPREHENSIVE INCOME
Years Ended December 31, (dollars in thousands) 2019 2018 Net income $ 620,167 $ 695,883Other comprehensive gain (loss), before tax
Net change in pension and other benefits adjustment 8,431 7,609 Net change in unrealized gains (losses) on securities available for sale 475,378 (150,631)Net change in unrealized gains (losses) on cash flow derivative hedges 109,809 (60,038)
Total other comprehensive gain (loss), before tax 593,618 (203,060)Income tax (expense) benefit related to other comprehensive gains (losses) (162,848 ) 50,675 Total other comprehensive gain (loss), net of tax 430,770 (152,385)Total comprehensive income 1,050,937 543,498Comprehensive income attributable to noncontrolling interest 2,992 3,334 Comprehensive income attributable to Bank of the West and subsidiaries $ 1,047,945 $ 540,164
The accompanying notes are an integral part of these consolidated financial statements.
5
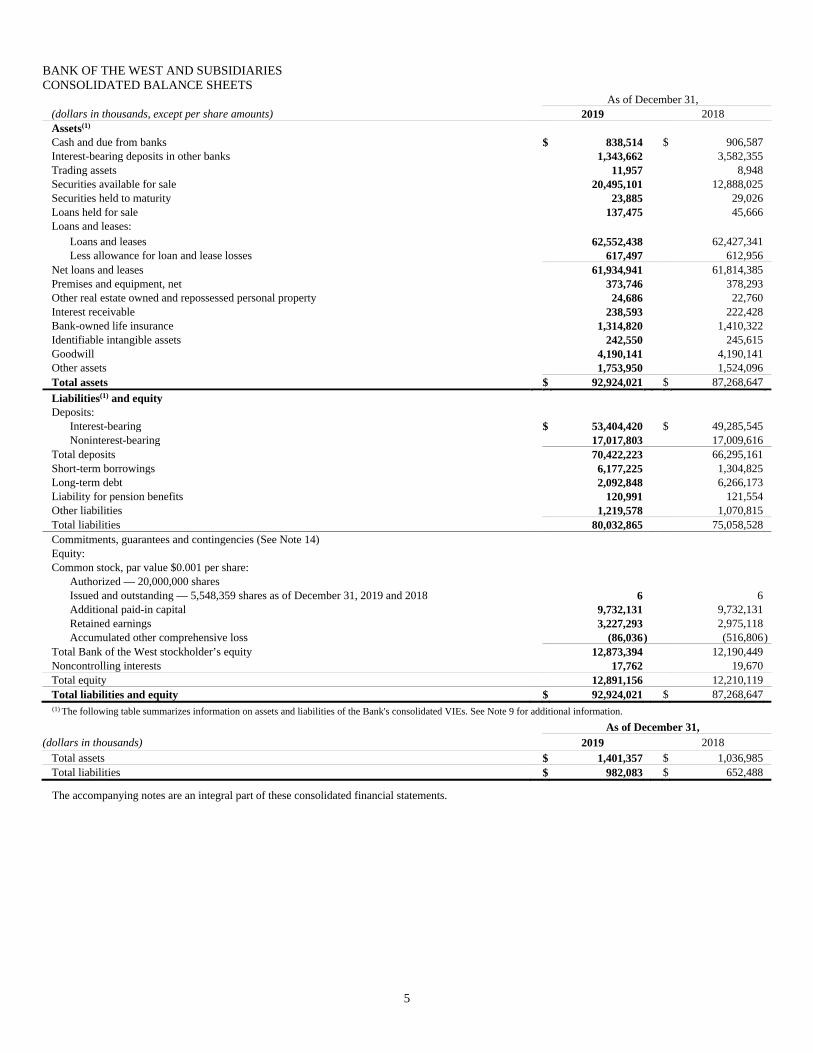
BANK OF THE WEST AND SUBSIDIARIES CONSOLIDATED BALANCE SHEETS
As of December 31, (dollars in thousands, except per share amounts) 2019 2018 Assets(1) Cash and due from banks $ 838,514 $ 906,587 Interest-bearing deposits in other banks 1,343,662 3,582,355 Trading assets 11,957 8,948 Securities available for sale 20,495,101 12,888,025 Securities held to maturity 23,885 29,026 Loans held for sale 137,475 45,666 Loans and leases:
Loans and leases 62,552,438 62,427,341 Less allowance for loan and lease losses 617,497 612,956
Net loans and leases 61,934,941 61,814,385 Premises and equipment, net 373,746 378,293 Other real estate owned and repossessed personal property 24,686 22,760 Interest receivable 238,593 222,428 Bank-owned life insurance 1,314,820 1,410,322 Identifiable intangible assets 242,550 245,615 Goodwill 4,190,141 4,190,141 Other assets 1,753,950 1,524,096 Total assets $ 92,924,021 $ 87,268,647
Liabilities(1) and equity Deposits:
Interest-bearing $ 53,404,420 $ 49,285,545 Noninterest-bearing 17,017,803 17,009,616
Total deposits 70,422,223 66,295,161 Short-term borrowings 6,177,225 1,304,825 Long-term debt 2,092,848 6,266,173 Liability for pension benefits 120,991 121,554 Other liabilities 1,219,578 1,070,815 Total liabilities 80,032,865 75,058,528 Commitments, guarantees and contingencies (See Note 14) Equity: Common stock, par value $0.001 per share:
Authorized — 20,000,000 shares Issued and outstanding — 5,548,359 shares as of December 31, 2019 and 2018 6 6 Additional paid-in capital 9,732,131 9,732,131 Retained earnings 3,227,293 2,975,118 Accumulated other comprehensive loss (86,036 ) (516,806)
Total Bank of the West stockholder’s equity 12,873,394 12,190,449 Noncontrolling interests 17,762 19,670 Total equity 12,891,156 12,210,119 Total liabilities and equity $ 92,924,021 $ 87,268,647 (1) The following table summarizes information on assets and liabilities of the Bank's consolidated VIEs. See Note 9 for additional information.
As of December 31, (dollars in thousands) 2019 2018
Total assets $ 1,401,357 $ 1,036,985 Total liabilities $ 982,083 $ 652,488
The accompanying notes are an integral part of these consolidated financial statements.
6
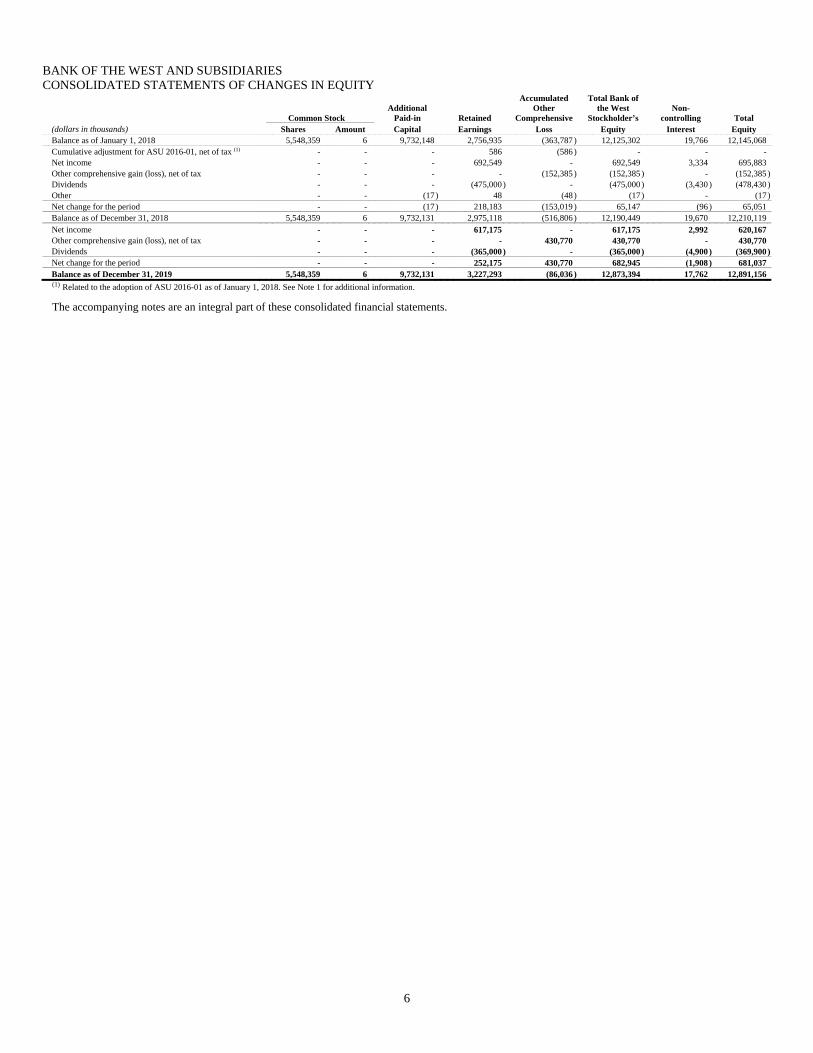
BANK OF THE WEST AND SUBSIDIARIES CONSOLIDATED STATEMENTS OF CHANGES IN EQUITY
Common Stock Additional
Paid-in Retained
Accumulated Other
Comprehensive
Total Bank of the West
Stockholder’s Non-
controlling Total (dollars in thousands) Shares Amount Capital Earnings Loss Equity Interest Equity Balance as of January 1, 2018 5,548,359 6 9,732,148 2,756,935 (363,787 ) 12,125,302 19,766 12,145,068 Cumulative adjustment for ASU 2016-01, net of tax (1) - - - 586 (586 ) - - - Net income - - - 692,549 - 692,549 3,334 695,883 Other comprehensive gain (loss), net of tax - - - - (152,385 ) (152,385 ) - (152,385)Dividends - - - (475,000) - (475,000 ) (3,430 ) (478,430)Other - - (17) 48 (48 ) (17 ) - (17)Net change for the period - - (17) 218,183 (153,019 ) 65,147 (96 ) 65,051 Balance as of December 31, 2018 5,548,359 6 9,732,131 2,975,118 (516,806 ) 12,190,449 19,670 12,210,119 Net income - - - 617,175 - 617,175 2,992 620,167 Other comprehensive gain (loss), net of tax - - - - 430,770 430,770 - 430,770 Dividends - - - (365,000) - (365,000 ) (4,900 ) (369,900)Net change for the period - - - 252,175 430,770 682,945 (1,908 ) 681,037 Balance as of December 31, 2019 5,548,359 6 9,732,131 3,227,293 (86,036 ) 12,873,394 17,762 12,891,156
(1) Related to the adoption of ASU 2016-01 as of January 1, 2018. See Note 1 for additional information.
The accompanying notes are an integral part of these consolidated financial statements.
7
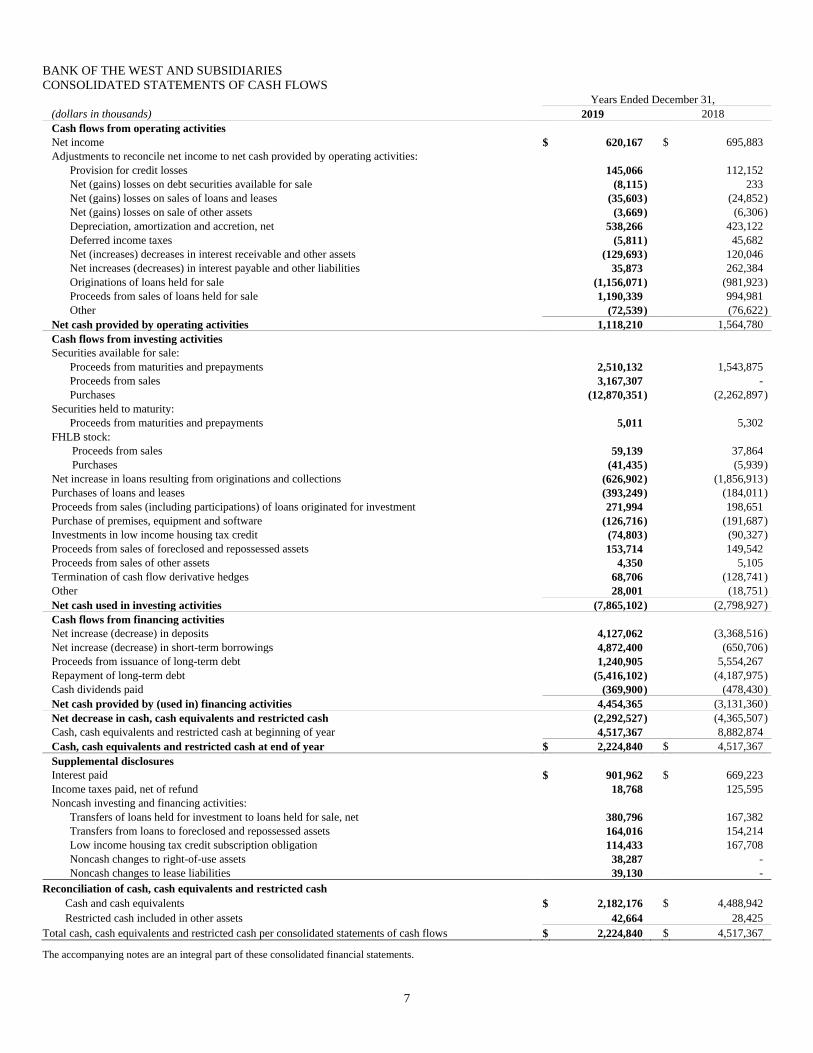
BANK OF THE WEST AND SUBSIDIARIES CONSOLIDATED STATEMENTS OF CASH FLOWS
Years Ended December 31, (dollars in thousands) 2019 2018 Cash flows from operating activities Net income $ 620,167 $ 695,883 Adjustments to reconcile net income to net cash provided by operating activities:
Provision for credit losses 145,066 112,152 Net (gains) losses on debt securities available for sale (8,115 ) 233 Net (gains) losses on sales of loans and leases (35,603 ) (24,852)Net (gains) losses on sale of other assets (3,669 ) (6,306)Depreciation, amortization and accretion, net 538,266 423,122 Deferred income taxes (5,811 ) 45,682 Net (increases) decreases in interest receivable and other assets (129,693 ) 120,046 Net increases (decreases) in interest payable and other liabilities 35,873 262,384 Originations of loans held for sale (1,156,071 ) (981,923)Proceeds from sales of loans held for sale 1,190,339 994,981 Other (72,539 ) (76,622)
Net cash provided by operating activities 1,118,210 1,564,780 Cash flows from investing activities Securities available for sale:
Proceeds from maturities and prepayments 2,510,132 1,543,875 Proceeds from sales 3,167,307 - Purchases (12,870,351 ) (2,262,897)
Securities held to maturity: Proceeds from maturities and prepayments 5,011 5,302
FHLB stock: Proceeds from sales 59,139 37,864 Purchases (41,435 ) (5,939)
Net increase in loans resulting from originations and collections (626,902 ) (1,856,913)Purchases of loans and leases (393,249 ) (184,011)Proceeds from sales (including participations) of loans originated for investment 271,994 198,651 Purchase of premises, equipment and software (126,716 ) (191,687)Investments in low income housing tax credit (74,803 ) (90,327)Proceeds from sales of foreclosed and repossessed assets 153,714 149,542 Proceeds from sales of other assets 4,350 5,105 Termination of cash flow derivative hedges 68,706 (128,741)Other 28,001 (18,751)Net cash used in investing activities (7,865,102 ) (2,798,927)Cash flows from financing activities Net increase (decrease) in deposits 4,127,062 (3,368,516)Net increase (decrease) in short-term borrowings 4,872,400 (650,706)Proceeds from issuance of long-term debt 1,240,905 5,554,267 Repayment of long-term debt (5,416,102 ) (4,187,975)Cash dividends paid (369,900 ) (478,430)Net cash provided by (used in) financing activities 4,454,365 (3,131,360)Net decrease in cash, cash equivalents and restricted cash (2,292,527 ) (4,365,507)Cash, cash equivalents and restricted cash at beginning of year 4,517,367 8,882,874 Cash, cash equivalents and restricted cash at end of year $ 2,224,840 $ 4,517,367 Supplemental disclosures Interest paid $ 901,962 $ 669,223 Income taxes paid, net of refund 18,768 125,595 Noncash investing and financing activities:
Transfers of loans held for investment to loans held for sale, net 380,796 167,382 Transfers from loans to foreclosed and repossessed assets 164,016 154,214 Low income housing tax credit subscription obligation 114,433 167,708 Noncash changes to right-of-use assets 38,287 - Noncash changes to lease liabilities 39,130 -
Reconciliation of cash, cash equivalents and restricted cash
Cash and cash equivalents $ 2,182,176 $ 4,488,942 Restricted cash included in other assets 42,664 28,425 Total cash, cash equivalents and restricted cash per consolidated statements of cash flows $ 2,224,840 $ 4,517,367
The accompanying notes are an integral part of these consolidated financial statements.

8
BANK OF THE WEST AND SUBSIDIARIES NOTES TO CONSOLIDATED FINANCIAL STATEMENTS
1. Organization and Summary of Significant Accounting Policies
Bank of the West, a State of California chartered bank, has more than 566 retail branch banking locations and other commercial banking offices as of December 31, 2019, and had more than 570 retail branch banking locations and other commercial banking offices as of December 31, 2018, located in Arizona, California, Colorado, Georgia, Idaho, Illinois, Iowa, Kansas, Minnesota, Missouri, Nebraska, Nevada, New Mexico, New York, North Dakota, Ohio, Oklahoma, Oregon, South Dakota, Texas, Utah, Washington, Wisconsin and Wyoming, providing a wide range of financial services to consumers, businesses, and government agencies. Bank of the West also provides services to Pacific Rim customers, specializing in domestic and international products and services in predominantly Asian American communities. The terms “BOW,” “the Bank,” “we,” “our,” “us” and similar terms used in this report refer to Bank of the West and its subsidiaries.
At January 1, 2016, BancWest Corporation (“BWE”), a financial holding company, owned all of the outstanding common stock of BOW. A series of internal reorganization transactions were completed on April 1, 2016, between BOW, BWE, and BNP Paribas (“BNPP”), a French banking company and then direct parent of BWE and indirect parent of BOW. As a result of the April 1 transactions, all outstanding common shares of BOW were transferred by BWE to BWE’s newly formed subsidiary BancWest Holding Inc. (“BWHI”), a bank holding company incorporated in Delaware and headquartered in San Francisco, California. BWE then transferred its ownership in BWHI to BNPP. Finally, BWE was renamed First Hawaiian, Inc. (“FHI”). FHI remained the direct parent of First Hawaiian Bank (“FHB”), a banking subsidiary headquartered in Honolulu, Hawaii. These series of transactions resulted in both FHI and BWHI becoming direct subsidiaries of BNPP as of April 1, 2016. In a related transaction, BNP Paribas USA, Inc. (“BNPP USA”), a wholly-owned subsidiary of BNPP headquartered in New York, formed a new Delaware corporation headquartered in San Francisco, BWC Holding Inc., which was subsequently renamed BancWest Corporation (“BWC”).
Federal Reserve Regulation YY – Enhanced Prudential Standards – required that certain large foreign banking organizations (“FBO”) such as BNPP establish by July 1, 2016 a U.S. intermediate holding company (“IHC”) under which the FBO must hold its interests in almost all of its U.S. subsidiaries. Accordingly, on July 1, 2016, BNPP designated BNPP USA as its IHC and undertook a new series of internal reorganization transactions including transferring BNPP’s ownership interest in FHI and BWHI to BWC. Therefore, effective July 1, 2016, BWC became the direct owner of BWHI and its direct subsidiary bank BOW and of FHI and its direct subsidiary bank FHB. Because BWC is a direct subsidiary of BNPP USA and an indirect subsidiary of BNPP, BOW remains an indirect subsidiary of BNPP.
On December 1, 2019, BWC merged with and into its parent BNPP USA. BWHI is now a direct subsidiary of BNPP USA and remains an indirect subsidiary of BNPP; consequently, BOW remains an indirect subsidiary of BNPP.
At December 31, 2019 and 2018, BWHI owned all of the outstanding common stock of BOW. BOW also had authorized 1,000,000 shares of preferred stock, none of which were issued or outstanding as of December 31, 2019 and 2018.
Regulation
The Bank’s primary regulators are the Federal Deposit Insurance Corporation (“FDIC”), the Consumer Financial Protection Bureau and the California Department of Business Oversight. The Bank is a member of the Federal Home Loan Bank System and is required to maintain an investment in the capital stock of the Federal Home Loan Bank (“FHLB”). The Bank maintains insurance on its customer deposit accounts with the FDIC, which requires quarterly assessments. BNPP USA and BWHI are regulated by the Federal Reserve Board.
Basis of presentation
The accounting and reporting policies of the Bank, and its subsidiaries, conform to accounting principles generally accepted in the United States (“GAAP”). The accompanying consolidated financial statements include the accounts of the Bank and its subsidiaries in which the Bank has controlling financial interests, as well as variable interest entities (“VIEs”), in which the Bank determines it is the primary beneficiary. The Bank is the primary beneficiary of a VIE if we have: (1) a variable interest in the entity; (2) the power to direct key activities of the VIE that most significantly impact its economic performance; and (3) the obligation to absorb losses or the right to receive benefits from the VIE that could potentially be significant to the VIE. All material intercompany transactions among the Bank and its consolidated entities have been eliminated. The Bank’s consolidated financial statements reflect the presentation and disclosure requirements in accordance with Accounting Standards Update 2013-12, Definition of a Public Business Entity.
For consolidated entities where it holds less than a 100% interest, the Bank reports income or loss attributable to noncontrolling stockholders in the consolidated statements of income, and the equity interest attributable to noncontrolling stockholders in the equity section of the consolidated balance sheets.
All other investments in entities that are not consolidated are accounted for either under the equity method, cost method or proportional amortization method where applicable.
Use of estimates
The preparation of the consolidated financial statements and related notes thereto in accordance with GAAP requires management to make judgments using estimates and assumptions that affect the reported amounts of assets and liabilities, revenue and expense and disclosures of contingent assets and liabilities. While management makes its best judgment, actual amounts or results could differ from those estimates.
9
Cash and due from banks
Cash and due from banks include noninterest-bearing amounts due from other financial institutions as well as in-transit clearings. For purposes of the consolidated statements of cash flows, the Bank includes in cash and cash equivalents: cash and due from banks, interest-bearing deposits in other banks, federal funds sold and securities purchased under agreements to resell (with original maturities of less than three months).
Interest-bearing deposits in other banks
Interest-bearing deposits in other banks include funds held in other financial institutions that are either fixed or floating interest rate instruments including certificates of deposit. Interest income is recorded when earned and presented within other interest income in the consolidated statements of income.
Securities
Securities acquired for the purposes of selling in the near term are classified as trading and are carried at fair value with unrealized gains and losses included in noninterest income.
Investments in debt securities that management has asserted positive intent and ability to hold until maturity are classified as held to maturity (“HTM”). HTM securities are carried at amortized cost.
Investments in debt securities not used for trading purposes or HTM are classified as available for sale (“AFS”). AFS securities are carried at estimated fair value with net unrealized gains and losses included in accumulated other comprehensive income (loss) (“AOCI”), net of applicable income taxes. Upon sale, realized gains and losses are recognized in income. See Note 17 for information on fair value measurement of the securities.
Premiums and discounts of mortgage-backed securities and structured notes are amortized and accreted using the effective interest method and included in interest income on a retrospective basis over the estimated life of the security for which prepayments reasonably can be expected and estimated. This method requires a retrospective adjustment of the effective yield each time the Bank changes the estimated life as if the new estimate had been known since the original acquisition date.
Premiums and discounts of all other HTM and AFS securities are amortized and accreted using the effective interest method on a prospective basis and are included in interest income. As principal repayments are received on securities, a proportionate amount of the related premium or discount is recognized in income so that the effective interest rate on the remaining portion of the security continues unchanged.
The Bank evaluates its investment securities portfolio classified as AFS and HTM for other-than-temporary impairment (“OTTI”) on a quarterly basis. If the Bank intends, or will more likely than not be required, to sell a debt security in an unrealized loss position before recovery of its amortized cost basis, the Bank recognizes the excess of the amortized cost basis over the fair value immediately in income. If the Bank has the intent and the ability to hold debt securities in an unrealized loss position, the Bank performs an expected cash flow evaluation, recognizing any credit loss impairment in income and the remaining unrealized loss in other comprehensive income (loss) (“OCI”).
The evaluation of whether the Bank expects to recover the amortized cost of a security is inherently judgmental. The evaluation includes the consideration of multiple factors including: the magnitude and duration of the unrealized loss; the financial condition of the issuer; the payment structure of the security; external credit ratings; recent events specific to the issuer and the issuer’s industry; and whether the Bank has received all scheduled principal and interest payments.
Investments in equity securities with readily determinable fair value are included in other assets and are carried at fair value with unrealized gains and losses included in noninterest income. Investments in equity securities without readily determinable fair values are measured using the measurement alternative, which allows those investments to be carried at cost, less impairment, and plus or minus subsequent adjustments for observable price changes and included in other assets. Changes in the basis of these equity investments will be reported in current earnings.
FHLB stocks are evaluated for impairment on a quarterly basis while other equity securities without readily determinable fair values are evaluated for impairment whenever changes in circumstances indicate that there may be impairment.
Loans held for sale
Loans that the Bank intends to sell are classified as held for sale (“HFS”) and are carried at the lower of cost or fair value. Fair value is determined on an individual loan basis and is measured primarily based on prevailing market prices for loans with similar characteristics. Except for loans originated for sale, any excess of cost over fair value upon transfer to HFS is recorded through the allowance for credit losses. For all loans held for sale, subsequent declines in fair value or recoveries of such declines are recognized as increases or decreases in a valuation allowance and are reported in noninterest income. Gains and losses upon sale are also reported in noninterest income.
Direct loan origination fees and costs on loans held for sale are deferred until the related loan is sold and recognized in noninterest income upon sale.
For consumer mortgage loans originated for sale, the Bank enters into short-term loan commitments to fund loans at specified rates and enters into forward commitments to sell those loans at specified rates. Such interest rate lock commitments to fund the loans and the

10
commitments to sell those loans are accounted for as derivatives at fair value with subsequent changes in fair value recorded in noninterest income.
Loans and leases
Loans and finance leases for which the Bank has the intent and the ability to hold for the foreseeable future, or until maturity or payoff, are classified in the consolidated balance sheets as loans and leases. Loans are recorded at their outstanding principal balances, net of any unearned income, cumulative charge-offs, unamortized deferred fees and costs on originated loans and unamortized premiums or discounts on purchased loans.
Net deferred fees or costs and premiums or discounts are recognized in interest income over the contractual term of the loans, adjusted for actual prepayments, using the interest method or on a straight-line basis for revolving loans.
Interest income is accrued unless the loan or lease is placed on nonaccrual status (see Nonaccrual loans and leases below). The Bank recognizes unaccreted fees and discounts or unamortized costs and premiums on loans and leases paid in full as interest income.
The Bank also charges other loan and lease fees consisting of delinquent payment charges and servicing fees, including fees for servicing loans sold to third parties, and recognizes such fees as noninterest income when earned.
Financing leases are recorded at the discounted amounts of lease payments receivable plus the estimated residual value of the leased asset. Lease payments receivable reflect contractual lease payments adjusted for renewal or termination options that we believe the customer is reasonably certain to exercise. The residual value reflects our best estimate of the expected sales price for the equipment at lease termination based on sales history adjusted for recent trends in the expected exit markets. Lease agreements may include options to renew and for the lessee to purchase the leased equipment at the end of the lease term.
We typically purchase residual value insurance on our financing leases so that our risk of loss at lease termination will be less than 10% of the initial value of the lease. The Bank reviews the estimated residual values of the leased assets at least annually. Reductions in net investment resulting from a decline in estimated residual value deemed to be other-than-temporary are recognized in noninterest income.
In connection with a lease, the Bank may finance the customer’s purchase of other products or services from the equipment vendor and allocate the contract consideration between the use of the asset and the purchase of those products or services based on information obtained from the vendor.
The Bank’s income from financing leases is interest income recognized using the effective interest method.
Loan and lease portfolio composition
The Bank’s loan and lease portfolio is divided into two segments, commercial and consumer, which are the same segments used by the Bank to determine the allowance for credit losses. The Bank further disaggregates its portfolio segments into various classes of loans for purposes of monitoring and assessing credit risk, as described below.
Commercial loans and leases
The Bank disaggregates the commercial loan and lease portfolio into the following classes:
• Loans to businesses for commercial, industrial and professional purposes (“Commercial & industrial”);
• Loans that are secured by real estate properties (“Commercial real estate”);
• Loans secured by real estate to finance land development and construction of industrial, commercial, residential or farm building (“Construction”);
• Indirect and direct leases to finance commercial equipment purchases (“Equipment leases”);
• Loans to finance agricultural production and other loans to farmers (“Agriculture”).
Consumer loans and leases
The Bank disaggregates the consumer loan and lease portfolio into the following classes:
• Consumer loans and leases such as autos, marine, recreational vehicles, personal lines of credit and credit cards (“Installments and lines”);
• Closed-end loans secured by first and junior liens on 1-4 family residential properties (“Residential secured–closed-end”);
• Revolving, open-end loans secured by first and junior liens on 1-4 family residential properties (“Residential secured–revolving, open-end”).
11
Nonaccrual loans and leases
The Bank places a loan or lease on nonaccrual status when management believes that full and timely collection of principal or interest has become doubtful; or it is 90 days past due as to principal or interest payments based on its contractual terms, unless it is well secured and in the process of collection. The Bank determines loans to be past due if payment is not received in accordance with contractual terms.
When the Bank places a loan or lease on nonaccrual status, previously accrued but uncollected interest is reversed against interest income during the current period. For nonaccrual loans and leases where ultimate collectability of the recorded balance is presumed, the Bank records such payments as interest income on a cash basis. When there are doubts about the ultimate collectability of the recorded balance on a nonaccrual loan or lease, cash payments by the borrower are applied as a reduction of the principal balance under the cost recovery method.
Nonaccrual loans and leases are generally returned to accrual status when either (1) they become current as to principal and interest, have a sustained period of repayment performance (generally six months) by the borrower, and the Bank expects payment of remaining contractual principal and interest; or (2) they are both well secured and in the process of collection.
Not all impaired loans or leases are placed on nonaccrual status; for example, restructured loans that are performing under their modified terms may continue to accrue interest or may return to accrual status after the borrower demonstrates a sustained period of performance (see Allowance for credit losses and Troubled debt restructurings below).
Allowance for credit losses
The allowance for credit losses (the “Allowance”) is management’s estimate of probable credit losses inherent in the loan and lease portfolio, as well as unfunded credit commitments, and is maintained at a level which, in management’s judgment, is adequate to absorb probable losses that have been incurred and can be reasonably estimated as of the balance sheet dates. The Allowance is increased through provisions for credit losses charged to earnings and reduced by charge-offs, net of recoveries.
The Bank determines the allocated component of the Allowance by measuring credit impairment on (1) an individual basis for nonaccrual status commercial loans above a predefined threshold and commercial and mortgage loans classified as troubled debt restructurings, and (2) on a collective basis for all other groups of loan categories with similar risk characteristics, and pools of homogeneous loans with smaller balances that are not evaluated on a case-by-case basis, such as credit card and consumer installment loans.
The Bank considers a loan to be impaired on an individual basis when, based on current information and events, it is probable that it will be unable to collect all amounts due according to the contractual terms of the loan. The Bank measures impairment by comparing the present value of the expected future cash flows discounted at the loan’s effective original interest rate with the recorded investment in the loan, except for collateral-dependent loans. For collateral-dependent loans, the Bank measures impairment by comparing the fair value of the collateral on an “as-is” basis less disposition costs with the recorded investment in the loan. On a case-by-case basis, the Bank may measure impairment based upon a loan’s observable market price.
Loans that are not assessed individually for impairment are assessed on a collective basis. The Bank estimates the inherent loss in pools of loans with similar risk characteristics incorporating probability of default over a loss emergence period and the loss given default as significant inputs. Qualitative adjustments are applied to the allowance model inputs based on an analysis of portfolio-specific external factors, key performance indicators and other qualitative factors.
The qualitative component of the Allowance is maintained to capture probable losses inherent in the loan portfolios which are not reflected in the quantitative portion of the Allowance that are ascribed to our portfolio segments. While the Bank’s allocated reserve methodology strives to reflect all risk factors, there may still be certain unidentified risk elements. The purpose of the qualitative reserve is to capture these factors. The relationship of the qualitative component to the total Allowance may fluctuate from period to period.
Management evaluates the adequacy of the Allowance based on the combined total of the quantitative and qualitative components, which considers management’s ongoing review of internal risk ratings and associated trends and factors, including:
• Trends in the volume and severity of delinquent loans, nonaccrual loans, troubled debt restructurings and other loan modifications;
• Trends in the quality of risk management and loan administration practices including findings of internal and external reviews of loans and effectiveness of collection practices;
• Changes in the quality of the Bank’s risk identification process and loan review system;
• Changes in lending policies and procedures including underwriting standards and collection, charge-off and recovery practices;
• Changes in the nature and volume of the loan portfolio;
• Changes in the concentration of credit and the levels of credit;
• Changes in the national and local economic business conditions, including the condition of various market segments.
The Bank also maintains a reserve for losses on unfunded loan commitments and letters of credit, which is recorded within other liabilities. The Bank measures the amount of reserve based on estimates of the probability of the ultimate funding and losses related to credit exposures that exist at the balance sheet date, similar to the methodology used for the loans and leases portfolio.
12
While the Bank has a formal methodology to determine the adequate and appropriate level of the allowance for credit losses, estimates of inherent loan, lease and unfunded loan commitment losses involve judgment and assumptions as to various factors, including current economic conditions. Management’s determination of adequacy of the total allowance for credit losses is based on quarterly evaluations of the above factors. Accordingly, the provision for credit losses will vary from period to period based on management’s ongoing assessment of the adequacy of the Allowance. See Note 5 for information on how the Bank’s experience and current economic conditions have influenced management’s determination of the Allowance.
Charge-off and recovery policies for loans and leases
The Bank’s policy is to fully charge-off, or partially charge down, to net realizable value when a loan or lease is deemed to be uncollectible and all commercially reasonable means of recovering those payments have been exhausted. A commercial loan or lease that is considered to be individually impaired is charged off, partially or fully, when potential recovery of the recorded loan balance is unlikely as a result of a shortfall in collateral value or the borrower’s financial difficulty. Consumer installment loans and leases are generally charged off, partially or fully, upon reaching a predetermined delinquency status that ranges from 120 to 180 days depending on the type of consumer installment loans and leases.
Recoveries of amounts on nonaccrual loans that have previously been charged off are credited to the Allowance and are generally recorded only to the extent that cash or other assets are received.
Troubled debt restructurings
In situations where for economic or legal reasons related to the borrower’s financial difficulties and the Bank grants a concession to the borrower that it would not otherwise consider, the related loan is classified as a troubled debt restructuring (“TDR”). Concessions generally include modifications to the loan’s terms, including, but not limited to, interest rate modifications and reductions, principal and interest forgiveness, term extensions, or renewals, or any other action that may minimize the potential economic loss to the Bank. A loan modified in a TDR continues to be classified as a TDR unless it is paid off or is refinanced or restructured by a borrower who is no longer experiencing financial difficulty at market terms and qualifies as a new loan.
Generally, all loans modified in a TDR (including consumer loans that have been discharged in a Chapter 7 Bankruptcy) are placed or remain on nonaccrual status at the time of the restructuring. However, certain accruing loans modified in a TDR that are current at the time of restructuring may remain on accrual status if payment in full under the restructured terms is expected. Loans classified as a TDR are considered impaired loans.
Premises and equipment
Premises and equipment, including leasehold improvements, are stated at cost less accumulated depreciation and amortization. Depreciation and amortization are computed on a straight-line basis over the estimated useful lives as follows:
Premises 10 - 39 years Furniture and equipment 3 - 20 years Leasehold improvements Shorter of the lease term or estimated remaining life
We periodically evaluate our long-lived assets for impairment. We perform these evaluations whenever events or changes in circumstances suggest that the carrying amount of an asset or group of assets is not recoverable. If impairment recognition criteria are met, an impairment charge is reported in noninterest expense.
Lease commitments
Lease commitments are transactions entered into by the Bank where the Bank is the lessee. The Bank enters into lease agreements to obtain the right to use assets for our business operations, substantially all of which are real estate.
Lease liabilities and right-of-use (“ROU”) assets are recognized when we enter into operating leases and represent our obligations and rights to use these assets over the period of the leases and may be re-measured for certain modifications, resolution of certain contingencies involving variable consideration, or our exercise of options (renewal, extension, or termination) under the lease.
Operating lease liabilities include fixed and in-substance fixed payments for the contractual duration of the lease, adjusted for renewals or terminations which were deemed probable of exercise when measured. The lease payments are discounted using a rate determined when the lease is recognized. As we typically do not know the discount rate implicit in the lease, we estimate a discount rate that we believe approximates a collateralized borrowing rate for the estimated duration of the lease. The discount rate is updated when re-measurement events occur. The related operating lease ROU assets may differ from operating lease liabilities due to initial direct costs, deferred or prepaid lease payments and lease incentives.
The Bank presents operating lease liabilities in other liabilities and the related operating lease ROU assets in other assets. The amortization of operating lease ROU assets and the accretion of operating lease liabilities are reported together as fixed lease expense and are included in occupancy within noninterest expense. The fixed lease expense is recognized on a straight-line basis over the life of the lease.

13
Some of our operating leases include variable lease payments which are periodic adjustments of our payments for the use of the asset based on changes in factors such as consumer price indices, fair market value, tax rates imposed by taxing authorities, or lessor cost of insurance. To the extent not included in operating lease liabilities and operating lease ROU assets, these variable lease payments are recognized as incurred in occupancy expense within noninterest expense. The Bank elected the practical expedient to not separate lease and non-lease components for its real estate portfolio.
Goodwill
Goodwill is the purchase premium after adjusting for the fair value of net assets acquired. Goodwill is not amortized, but is reviewed for potential impairment on an annual basis, or when events or circumstances indicate a potential impairment, at the reporting unit level. The goodwill impairment analysis is a two-step test. The first step involves comparing the fair value of each reporting unit with its carrying value, including goodwill, as measured by allocated equity. If the fair value of the reporting unit exceeds its carrying value, goodwill of the reporting unit is considered not impaired; however, if the carrying value of the reporting unit exceeds its fair value, the second step must be performed to measure potential impairment.
The second step involves calculating an implied fair value of goodwill for each reporting unit for which the first step indicated possible impairment. The implied fair value of goodwill is determined in the same manner as the amount of goodwill recognized in a business combination, which is the excess of the fair value of the reporting unit, as determined in the first step, over the aggregate fair values of the assets, liabilities and identifiable intangibles as if the reporting unit was being acquired in a business combination. If the implied fair value of goodwill exceeds the goodwill assigned to the reporting unit, there is no impairment. If the goodwill assigned to a reporting unit exceeds the implied fair value of goodwill, an impairment charge is recorded for the excess. An impairment loss recognized cannot exceed the amount of goodwill assigned to a reporting unit. An impairment loss establishes a new basis in the goodwill and subsequent reversals of goodwill impairment losses are not permitted.
Identifiable intangible assets
The Bank incurs costs to purchase and develop internal-use computer software. The treatment of costs to purchase or develop the software depends on the nature of the costs and the stage of the project. Costs incurred in the preliminary project stage, such as the cost of performing feasibility studies and evaluating alternatives, are charged to expense. Costs for significant projects are capitalized if (1) they meet capitalization criteria and (2) incurred from the time the preliminary project stage is complete through the time the project is substantially complete and the software is ready for its intended purpose.
Software licenses and internal-use development software costs are generally amortized over their estimated useful lives of five years. The Bank reviews internal-use development software costs for impairment annually or whenever changes in circumstances indicate that there may be impairment. If impairment is identified, it is measured as the amount by which the carrying basis of the asset exceeds its fair value and recognized immediately.
Other real estate owned and repossessed personal property
Other real estate owned (“OREO”) and repossessed personal property are primarily comprised of properties that we acquired through foreclosure proceedings or repossession activities. Assets acquired in satisfaction of a defaulted loan are recorded at fair value less cost to sell upon acquisition. The amount by which the recorded investment in the loan exceeds the fair value (less estimated costs to sell) is charged off against the Allowance. The amount by which the fair value (less estimated costs to sell) exceeds the recorded investment in the loan is recognized first against prior charge-off (as a recovery) with any excess recognized through noninterest income. Subsequent declines in fair value and recoveries in those declines of the assets are recognized in a valuation allowance through noninterest income. The Bank applies the five-step model to account for the derecognition of OREO. The five steps are: (1) identify the contract; (2) identify the performance obligation; (3) determine the transaction price; (4) allocate the transaction price; (5) recognize gain or loss. Gains and losses are recognized as part of noninterest income when control of OREO is transferred to the counterparty.
Transfers and servicing of financial assets
The Bank enters into loan participations and loan sales, including originations to sell residential mortgage loans to government sponsored entities, including the Federal National Mortgage Association (“FNMA”) and the Government National Mortgage Association (“GNMA”) and other institutions. The Bank records these transactions as sales and derecognizes the related financial assets.
Any interests in the loans retained by the Bank in a participation are recognized by allocating the carrying amount of the loans between the participating interests sold and interests retained based on their relative fair values at the date of transfer. Gain or loss on the sale of the participating interests is based on the proceeds received and the allocated carrying amount of assets transferred.
The Bank may retain the servicing on loans sold, which are recognized as mortgage servicing rights (“MSRs”) on the consolidated balance sheets within identifiable intangible assets. MSRs are initially recognized at fair value at the date of transfer as a component of the sales proceeds and are subsequently amortized and carried at the lower of cost or fair value. Fair value of MSRs is determined based on the present value of estimated future net servicing income. MSRs are amortized over the estimated period that net servicing income is expected to be received. Projections of the amount and timing of estimated future net cash flows are calculated using management’s best estimates, including
14
prepayment speeds, forward yield curves and default rates. These estimates are updated based on actual results, industry trends and other economic considerations.
The Bank periodically evaluates its MSRs for impairment by stratifying them based on predominant risk characteristics and comparing the carrying value of each strata to the estimated fair value measured using a discounted cash flow method as discussed in Note 3. Impairment is recognized through a valuation allowance and a charge to noninterest income, if it is considered to be temporary, or through a direct write-down of the asset and a charge to noninterest income, if it is considered other-than-temporary.
The Bank securitizes, transfers, and services consumer and commercial automotive loans and operating leases. Securitization transactions typically involve the use of VIEs and are accounted for either as sales or secured borrowings. These loans are transferred to a securitization trust such that the assets are legally isolated from the creditors of the Bank and are not available to satisfy its obligation. These assets can only be used to settle obligations of the trust. We may retain economic interests in the securitized and sold assets, which are generally retained in the form of senior or subordinated interests, interest- or principal-only strips, cash reserves, residual interests, and servicing rights.
In order to conclude whether or not a variable interest entity is required to be consolidated, careful consideration and judgment must be given to our continuing involvement with the variable interest entity. In circumstances where the Bank has both the power to direct the activities of the entity that most significantly impact the entity's performance and the obligation to absorb losses or the right to receive benefits of the entity that could be significant, we would conclude that we would consolidate the entity, which would also preclude us from recording an accounting sale on the transaction. In the case of a consolidated variable interest entity, the accounting is consistent with a secured borrowing where we continue to carry the loans and we record the related securitized debt on our consolidated balance sheets.
In transactions where we are not determined to be the primary beneficiary of the VIE, we then must determine whether or not we achieve a sale for accounting purposes. In order to achieve a sale for accounting purposes, the assets being transferred must be legally isolated, not be constrained by restrictions from further transfer, and be deemed to be beyond our control. If we were to fail any of the three criteria for sale accounting, the accounting would be consistent with the preceding paragraph as a secured borrowing. See Note 9 for discussion on VIEs.
Gains and losses on the loans sold and servicing rights associated with loan sales are determined when the related loans are sold to either a securitization trust or third-party. For loan sales with servicing retained, a servicing asset is recorded at fair value for the right to service the loans sold.
The Bank may retain servicing responsibilities on sold automobile loans and receives annual servicing fees and other ancillary fees on the outstanding loan balances. These non-mortgage servicing rights (“NMSRs”) related to automobile loans are accounted for using the amortization method. A servicing asset is established at fair value at the time of the sale. The servicing asset is then amortized against servicing income. Impairment, if any, is recognized when carrying value exceeds the fair value as determined by calculating the present value of expected net future cash flows. The primary risk characteristic for measuring servicing assets is payoff rates of the underlying loan pools. Valuation calculations rely on the predicted payoff assumption and, if actual payoff is quicker than expected, then future value would be impaired.
Securities purchased and sold agreements
Securities purchased under agreements to resell and securities sold under agreements to repurchase are treated as collateralized financing transactions and are recorded at the amounts at which the securities were acquired or sold plus accrued interest. Securities sold under agreements to repurchase are classified as short-term borrowings in the consolidated balance sheets. The fair value of collateral either received from or provided to a third-party is continually monitored and additional collateral is obtained or is requested to be returned to the Bank in accordance with the agreement. The Bank or a custodian holds all collateral.
Fair value
The Bank uses fair value measurements to record fair value adjustments to certain assets and liabilities and to determine fair value disclosures. Fair value is defined as the price that would be received to sell an asset or paid to transfer a liability in an orderly transaction between market participants at the measurement date. Trading assets, securities available for sale, certain other assets and certain liabilities are recorded at fair value on a recurring basis in accordance with applicable accounting standards. The Bank may also be required to record other assets at fair value on a nonrecurring basis, such as loans held for sale and impaired loans held for investment. These nonrecurring fair value adjustments typically involve application of lower of cost or fair value accounting or write-downs of individual assets.
The Bank values its assets and liabilities based on observable market prices or inputs. If observable prices or inputs are not available, fair values are measured using unobservable inputs based on the Bank’s own assumptions about what market participants would use to price the asset or liability.
15
Fair value measurements are classified within one of three levels in a valuation hierarchy based upon the observability of significant inputs to the valuation of an asset or liability as of the measurement date. The three levels are defined as follows:
• Level 1 inputs are quoted prices (unadjusted) in active markets for identical assets or liabilities that the Bank has the ability to access at the measurement date.
• Level 2 inputs are inputs other than quoted prices included within Level 1 that are observable for the asset or liability, either directly or indirectly. Level 2 inputs include quoted prices for similar assets or liabilities in active markets, quoted prices for identical or similar assets or liabilities in markets that are not active and inputs that are corroborated by observable market data.
• Level 3 inputs are unobservable inputs for the asset or liability for which there is limited or no market activity at the measurement date.
A financial instrument’s categorization within the valuation hierarchy is based upon the lowest level of input that is significant to the fair value measurement. See Note 17 for more information regarding fair value measurements.
Foreign currency translation
Monetary assets and liabilities denominated in foreign currencies are translated to the United States (“U.S.”) dollar equivalent at the rate of exchange at the balance sheet dates. Transactions in foreign currencies are translated to the U.S. dollar equivalent at the rate of exchange in effect at the time of the transaction. Foreign currency gains and losses are included in the consolidated statements of income within other noninterest income in the period in which they occur.
Employee pension and other postretirement benefits
The Bank provides defined benefit pension and other postretirement benefits to qualified retired employees. The Bank recognizes an asset or a liability on the overfunded or underfunded status of a defined benefit postretirement plan, measured as the difference between the fair value of plan assets and the benefit obligation. Amortization of the unrecognized net gain or loss is included as a component of net periodic benefit cost. If amortization results in an amount less than the minimum amortization required under GAAP, the minimum required amount is recorded. The amount recorded represents unrecognized net gains or losses that exceed 5% of the greater of the projected benefit obligation or the market-related value of plan assets as of the beginning of the year. The unrecognized amounts in excess of the 5% corridor are amortized on a straight-line basis over five years. Unrecognized net prior service cost or credit is amortized into net periodic pension cost on a straight-line basis over 9.2 years which is the expected period of payouts.
Accounting for defined benefit pension plans involves four key variables that are utilized in the calculation of the Bank’s annual pension costs. These factors include: (1) size of the participant population, (2) actuarial assumptions and estimates, (3) expected long-term rate of return on plan assets and (4) discount rate.
Pension expense is directly affected by the number of employees eligible for pension benefits and economic conditions, which include the actual return on plan assets. With the help of an actuary, management is able to estimate future expenses and plan obligations based on factors such as discount rate, mortality, employment termination, retirement and disability rates.
The Bank uses a building block method to calculate the expected return on plan assets based on the balance of the pension asset portfolio at the beginning of the year and the expected long-term rate of return on that portfolio. The method requires (1) the percentage of total plan assets be multiplied by the expected asset return for each component of the plan asset mix, (2) the resulting weighted expected rates of return for each component be added together to determine the total rate of return. Under this approach, forward-looking expected returns for each invested asset class are determined. Forward-looking capital market assumptions are typically developed using historical returns as a starting point and applying a combination of macroeconomics, econometrics, statistical, and other technical analysis, such as spread differentials, to forecast the expected return going forward.
Bank-owned life insurance
Bank-owned life insurance policies are accounted for at cash surrender value. The Bank invests in these policies to provide an efficient form of funding for long-term retirement and other post-employment benefits costs and is the beneficiary of these policies. Changes in cash surrender value are recorded in noninterest income.
Income taxes
The Bank recognizes current income tax expense in an amount which approximates the tax to be paid or refunded for the current period. The Bank recognizes deferred income tax liabilities and assets for the expected future tax consequences of events that the Bank includes in the consolidated financial statements or tax returns based on the difference between the book and tax bases of assets and liabilities using enacted tax rates in effect for the years in which the differences are expected to reverse. Deferred tax assets are recognized if it is more likely than not that they will be realized. Realization is dependent on generating sufficient taxable income prior to expiration of any loss carryforwards. The Bank’s net tax asset is presented as a component of other assets.
Tax benefits are recognized and measured based upon a two-step model: (1) a tax position must be more likely than not to be sustained based solely on its technical merits in order to be recognized and (2) the benefit is measured as the largest dollar amount of that position that is more likely than not to be sustained upon settlement. The difference between the benefit recognized and the tax benefit claimed on the return is

16
referred to as an unrecognized tax benefit. Tax-related interest is recognized as a component of income tax expense. Substantially all penalties are recognized as a component of other noninterest expense. The Bank recognizes interest and penalties related to unrecognized tax benefits within the income tax expense line in the accompanying consolidated statements of income.
Income taxes are allocated to the IHC parent, US subsidiaries, and affiliates as if each had filed a separate return. The Bank’s income tax filing is included in the consolidated federal income tax return filed by BNP Paribas USA, Inc. The Bank also files various combined unitary and separate company state returns according to the laws of a particular state.
Derivative instruments and hedging activities
Derivatives are recognized on the consolidated balance sheets as other assets or other liabilities at fair value and are either designated as (1) a hedge of the fair value of a recognized asset or liability or of an unrecognized firm commitment (“fair value” hedge), (2) a hedge of a forecasted transaction or the variability of cash flows to be received or paid related to a recognized asset or liability (“cash flow” hedge) or (3) held for trading, customer accommodation or not designated for hedge accounting (“free-standing derivative instrument”).
The Bank formally documents the relationship between hedging instruments and hedged items, as well as the risk management objective and strategy for undertaking various hedge transactions. At the inception of the hedge and on a quarterly basis, the Bank also formally assesses whether the derivative instruments are considered highly effective in offsetting changes in fair values of cash flows related to hedged items.
For derivatives designated as fair value hedges, changes in the fair value of the derivative instrument and changes in the fair value of the related fixed-rate hedged asset or liability or of an unrecognized firm commitment attributable to the hedged risk are recorded in the same income statement line item that is used to present the earnings effect of the hedged item.
For derivatives designated as cash flow hedge, in which derivatives hedge the variability of cash flows related to floating-rate assets and liabilities or forecasted transactions, the accounting treatment depends on the effectiveness of the hedge. Changes in the fair value of the derivative instrument are recorded in AOCI. These changes in fair value are subsequently reclassified into consolidated statements of income in future periods when the hedged transaction affects earnings. If a hedged forecasted transaction is not expected to occur or the derivative is no longer effective or expected to be effective in offsetting changes in fair value or cash flows of a hedged item, hedge accounting is ceased and any amounts reported in AOCI are immediately recognized in the same income statement line item that is used to present the earnings effect of the hedged item when the hedged item affects earnings.
For free-standing derivative instruments, any changes in the fair value of the derivative instruments are reported in noninterest income.
The Bank occasionally purchases or originates financial instruments that contain embedded features that may require recognition as separate derivative instruments. Such embedded derivatives are separated from the hybrid financial instruments and are carried at fair value with any changes in fair value recorded in income for the current period.
Valuations of derivative assets and liabilities reflect the value of the instrument including the values associated with counterparty risk, market risk and the Bank’s own credit standing. See Note 15 for additional information.
Low income housing investments
The Bank invests in limited partnerships or similar entities that own or operate affordable housing projects as defined in the Community Reinvestment Act. These investments provide the Bank with tax benefits in the form of tax deductions and tax credits. The Bank accounts for affordable housing projects using the proportional amortization method if certain conditions are met. Under the proportional amortization method, the Bank amortizes the initial cost of the investments in proportion to the tax credits and other tax benefits it receives and presents the amortization as a component of income tax expense. If the investments in affordable housing projects do not meet the conditions for proportional amortization method, they are accounted for under the equity method of accounting where the Bank records its share of the investees’ losses within noninterest expense. Low income housing investments are subject to impairment review annually.
Accounting standards adopted
The following Accounting Standard Updates (“ASU”) issued by the Financial Accounting Standards Board (“FASB”) became effective for the Bank’s 2019 annual reporting period:
ASU 2016-02: Leases (Topic 842)
In February 2016, the FASB issued new guidance that requires lessees to recognize leases on their balance sheet as right-of-use assets and lease liabilities based on the value of the discounted future lease payments, while recognizing expenses on their income statement consistent with existing accounting requirements. Lessor accounting is largely unchanged. Subsequently, the FASB issued ASU 2018-10: Codification Improvements to Topic 842, Leases, ASU 2018-11: Leases (Topic 842) – Targeted Improvement and ASU 2018-20: Leases (Topic 842): Narrow-scope Improvements for Lessors ASU 2019-01: Leases (Topic 842): Codification Improvements, which further clarified the new standard. On January 1, 2019, the Bank adopted the new accounting standards. Expanded disclosures about the nature and terms of lease agreements are required prospectively and are included in Note 7 – Lease Obligation. For the transition to the new guidance, the Bank elected several available practical expedients, including to not reassess the classification of its existing leases, any initial direct costs associated with our leases, or whether any existing contracts are or contain leases. In addition, the Bank elected the optional transition method not to restate the 2018 financial statements. See Note 21, Income Taxes, for the disclosure of the tax impacts of ASU 2016-02 (Topic 842).

17
Upon adoption, the Bank also recognized right-of-use assets and lease liabilities of $324.8 million.
ASU 2017-08: Receivables – Nonrefundable Fees and Other Costs (Subtopic 310-20) – Premium Amortization on Purchased Callable Debt Securities
In March 2017, the FASB issued new guidance that shortens the amortization period for certain callable debt securities held at a premium. Specifically, the amendments require the premium to be amortized to the earliest call date. The amendments do not require an accounting change for securities held at a discount; the discount continues to be amortized to maturity. The Bank adopted this ASU on January 1, 2019 on a modified retrospective approach. The adoption did not have a material impact on the Bank’s consolidated financial statements.
ASU 2017-12: Derivatives and Hedging (Topic 815) – Targeted Improvements to Accounting for Hedging Activities
In August 2017, the FASB issued new guidance with the objective of improving the financial reporting of hedging relationships to better portray the economic results of an entity’s risk management activities in its financial statements. The amendments also make certain targeted improvements to simplify the application of the hedge accounting guidance in current GAAP based on the feedback received from preparers, auditors, users, and other stakeholders. This ASU became effective for the Bank’s 2019 annual reporting period on a prospective basis. The adoption did not have a material impact on the Bank’s consolidated financial statements.
ASU 2018-16: Derivatives and Hedging (Topic 815) – Inclusion of the Secured Overnight Financing Rate (SOFR), Overnight Index Swap (OIS) Rate as a Benchmark Interest Rate for Hedge Accounting Purpose
In October 2018, the FASB issued guidance which expands the list of U.S. benchmark interest rates permitted in the application of hedge accounting. The Update adds the OIS rate based on SOFR as a U.S. benchmark interest rate to facilitate the LIBOR to SOFR transition and provide sufficient lead time for entities to prepare for changes to interest rate risk hedging strategies for both risk management and hedge accounting purposes. The guidance became effective January 1, 2019 prospectively. The standard did not have a material impact on the Bank’s consolidated financial statements.
Accounting standards issued but not yet effective
The following ASUs have been issued by the FASB and are applicable to the Bank but are not yet effective:
ASU 2016-13: Financial Instruments – Credit Losses (Topic 326) – Measurement of Credit Losses on Financial Instruments
In June 2016, the FASB issued new guidance that amends the accounting for credit losses on most financial instruments. For financial assets measured at amortized cost such as loans, leases and held-to-maturity securities, guidance requires the use of expected credit loss model to estimate losses expected throughout the life of the financial asset and record an allowance that, when deducted from amortized cost basis, presents the net amount expected to be collected on the financial asset. The guidance also modifies the other-than-temporary impairment model for available-for-sale debt securities to require an allowance for credit impairment instead of a direct write-down, which allows for reversal of credit impairments in future periods. As a result of continued deliberation and recommendations, the FASB issued ASU 2018-19, ASU 2019-04, ASU 2019-05, ASU 2019-10 and ASU 2019-11 to clarify guidance under Topic 326, to provide transition relief and minor updates to the original ASU. These ASUs are effective for the Bank’s 2023 annual reporting period. Early adoption is permitted. The Bank is currently assessing the impact of adopting this new standard.
ASU 2017-04: Intangibles – Goodwill and Other (Topic 350) – Simplifying the Test for Goodwill Impairment
In January 2017, the FASB issued new guidance to simplify how an entity is required to test goodwill for impairment by eliminating Step 2 from the goodwill impairment test. Step 2 measures a goodwill impairment loss by comparing the implied fair value of a reporting unit’s goodwill with the carrying amount of that goodwill. The new guidance is effective for the Bank’s 2023 annual reporting period on a prospective basis. The Bank is currently assessing the impact of adopting this new standard.
ASU 2018-13: Fair Value Measurement (Topic 820) – Disclosure Framework – Changes to the Disclosure Requirements for Fair Value Measurement
In August 2018, the FASB issued guidance which amends ASC 820 to add, remove and clarify disclosure requirements related to fair value measurements. The changes related to disclosures are part of the FASB’s disclosure framework project to improve the effectiveness of disclosures in the notes to the financial statements. The ASU is effective for the Bank’s 2020 annual reporting period on a retrospective basis. The Bank is currently assessing the impact of adopting the new standard.
ASU 2018-14: Compensation – Defined Benefit Plans (Subtopic 715-20) – Changes to the Disclosure Requirements for Defined Benefit Plans
In August 2018, the FASB issued guidance which amends ASC 715 to add, remove and clarify disclosure requirements related to defined benefit pension and other postretirement plans. The ASU’s changes related to disclosures are part of the FASB’s disclosure framework project to improve the effectiveness of disclosures in the notes to the financial statements. The ASU is effective for the Bank’s 2021 annual reporting period on a retrospective basis. The Bank is currently assessing the impact of adopting the new standard.
18
ASU 2018-15: Intangibles (Subtopic 350-40) – Customer’s Accounting for Implementation Cost Incurred in a Cloud Computing Arrangement that is a Service Contract
In August 2018, the FASB issued guidance to align the requirements for capitalizing implementation costs incurred in a hosting arrangement that is a service contract with the requirements for capitalizing implementation costs incurred to develop or obtain internal-use software (and hosting arrangements that include an internal use software license). The accounting for the service element of a hosting arrangement that is a service contract is not affected by the guidance. The ASU is effective for the Bank’s 2020 reporting period prospectively. The Bank is currently assessing the impact of adopting the new standard.
ASU 2018-18: Collaborative Arrangements (Topic 808) – Clarifying the Interaction between Topic 808 and Topic 606
In November 2018, the FASB issued guidance to clarify the interaction between Topic 808, Collaborative Arrangements and Topic 606, Revenue from Contracts with Customers. The ASU requires transactions in collaborative arrangements to be accounted for under Topic 606 if the counterparty is a customer for a good or service (or bundle of goods or services) that is distinct unit of account and precludes entities from presenting consideration from transactions with a collaborator that is not a customer together with revenue recognized from contracts with customers. The ASU is effective for the Bank’s 2020 reporting period and is applied retrospectively to the date the Bank initially applied Topic 606 either for all contracts or only for contracts that are not completed at the date of initial application of Topic 606. The Bank is currently assessing the impact of adopting the new standard.
ASU 2019-12: Income Taxes (Topic 740) – Simplifying the Accounting for Income Taxes
In December 2019, the FASB issued guidance which modifies Topic 740, Income Taxes to simplify the accounting for income taxes. The amendments are based on changes that were suggested by stakeholders as part of the FASB’s simplification initiative to reduce the complexity of accounting standards while maintaining or enhancing the helpfulness of information provided to financial statement users. The ASU is effective for the Bank’s 2021 reporting period. The transition method depends on the nature of the amendments. The Bank is currently assessing the impact of adopting the new standard.
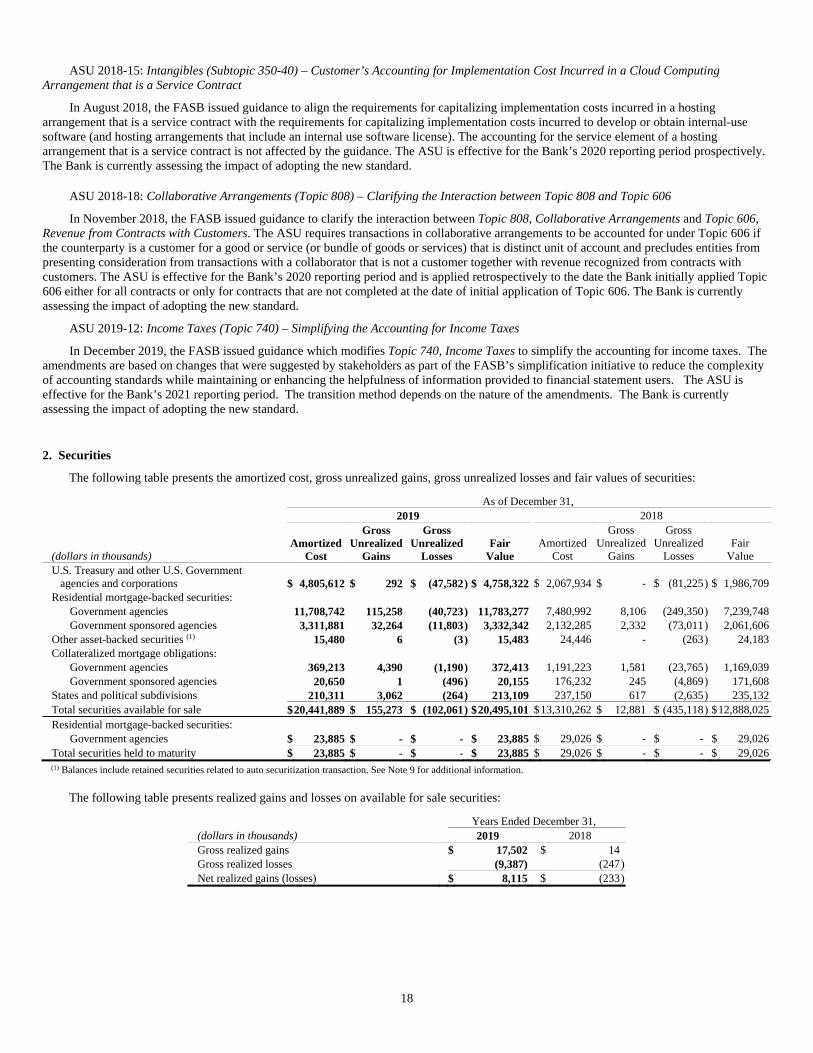
2. Securities
The following table presents the amortized cost, gross unrealized gains, gross unrealized losses and fair values of securities:
As of December 31, 2019 2018
(dollars in thousands) Amortized
Cost
Gross Unrealized
Gains
Gross Unrealized
Losses Fair
ValueAmortized
Cost
Gross Unrealized
Gains
Gross Unrealized
Losses Fair
ValueU.S. Treasury and other U.S. Government agencies and corporations $ 4,805,612 $ 292 $ (47,582) $ 4,758,322 $ 2,067,934 $ - $ (81,225) $ 1,986,709Residential mortgage-backed securities:
Government agencies 11,708,742 115,258 (40,723) 11,783,277 7,480,992 8,106 (249,350) 7,239,748Government sponsored agencies 3,311,881 32,264 (11,803) 3,332,342 2,132,285 2,332 (73,011) 2,061,606
Other asset-backed securities (1) 15,480 6 (3) 15,483 24,446 - (263) 24,183Collateralized mortgage obligations:
Government agencies 369,213 4,390 (1,190) 372,413 1,191,223 1,581 (23,765) 1,169,039Government sponsored agencies 20,650 1 (496) 20,155 176,232 245 (4,869) 171,608
States and political subdivisions 210,311 3,062 (264) 213,109 237,150 617 (2,635) 235,132Total securities available for sale $ 20,441,889 $ 155,273 $ (102,061) $20,495,101 $13,310,262 $ 12,881 $ (435,118) $12,888,025Residential mortgage-backed securities:
Government agencies $ 23,885 $ - $ - $ 23,885 $ 29,026 $ - $ - $ 29,026Total securities held to maturity $ 23,885 $ - $ - $ 23,885 $ 29,026 $ - $ - $ 29,026
(1) Balances include retained securities related to auto securitization transaction. See Note 9 for additional information.
The following table presents realized gains and losses on available for sale securities:
Years Ended December 31, (dollars in thousands) 2019 2018 Gross realized gains $ 17,502 $ 14 Gross realized losses (9,387) (247 ) Net realized gains (losses) $ 8,115 $ (233 )
19
The fair value and amortized cost of debt securities available for sale and securities held to maturity as of December 31, 2019, by contractual maturity, are shown below. Actual maturities may differ from contractual maturities because borrowers may have the right to call or prepay obligations with or without prepayment penalties.
Remaining Contractual Principal Maturity
After 1 Year After 5 Years
Within 1 But Within But Within After 10 (dollars in thousands) Year 5 Years 10 Years Years Total U.S. Treasury and other U.S. Government agencies and corporations $ - $ 1,383,812 $ 3,374,510 $ - $ 4,758,322Residential mortgage-backed securities:
Government agencies - - 25,727 11,757,550 11,783,277Government sponsored agencies - - - 3,332,342 3,332,342
Other asset-backed securities - 14,212 1,271 - 15,483 Collateralized mortgage obligations:
Government agencies - - - 372,413 372,413 Government sponsored agencies - 12 20,143 - 20,155
States and political subdivisions 14,146 120,460 59,787 18,716 213,109 Estimated fair value of debt securities available for sale $ 14,146 $ 1,518,496 $ 3,481,438 $ 15,481,021 $ 20,495,101 Total amortized cost of debt securities available for sale 14,128 1,527,133 3,518,425 15,382,203 20,441,889 Residential mortgage-backed securities:
Government agencies $ - $ - $ - $ 23,885 $ 23,885 Estimated fair value and total amortized cost of securities held to maturity $ - $ - $ - $ 23,885 $ 23,885
Securities with an aggregate carrying value of $1.8 billion and $2.2 billion were pledged to secure public deposits, repurchase agreements, borrowings from the Federal Reserve Bank (“FRB”), derivative liability positions and other purposes as of December 31, 2019 and 2018, respectively. As of December 31, 2019 and 2018, there were no secured parties that had the right to repledge or resell these securities.
We held no securities of any single issuer (other than the U.S. Government and government sponsored agencies) which were in excess of 10% of consolidated stockholder’s equity as of December 31, 2019 and 2018.
The following tables provide the fair value and gross unrealized losses on available for sale securities in an unrealized loss position as of December 31, 2019 and 2018, aggregated by investment category and length of time the individual securities have been in a continuous unrealized loss position:
As of December 31, 2019 Less Than 12 Months 12 Months or More Total Gross Gross Gross Unrealized Fair Unrealized Fair Unrealized Fair
(dollars in thousands) Losses Value Losses Value Losses Value U.S. Treasury and other U.S. Government agencies and corporations $ (38,092) $ 3,281,662 $ (9,490) $ 1,234,760 $ (47,582) $ 4,516,422 Residential mortgage-backed securities:
Government agencies (21,363) 3,523,854 (19,360) 1,945,419 (40,723) 5,469,273 Government sponsored agencies (3,456) 774,360 (8,347) 511,456 (11,803) 1,285,816
Other asset-backed securities (3) 3,747 - - (3) 3,747 Collateralized mortgage obligations:
Government agencies (498) 36,882 (692) 39,427 (1,190) 76,309 Government sponsored agencies - - (496) 20,143 (496) 20,143
States and political subdivisions (45) 5,797 (219) 5,324 (264) 11,121 Total securities available for sale $ (63,457) $ 7,626,302 $ (38,604) $ 3,756,529 $ (102,061) $ 11,382,831
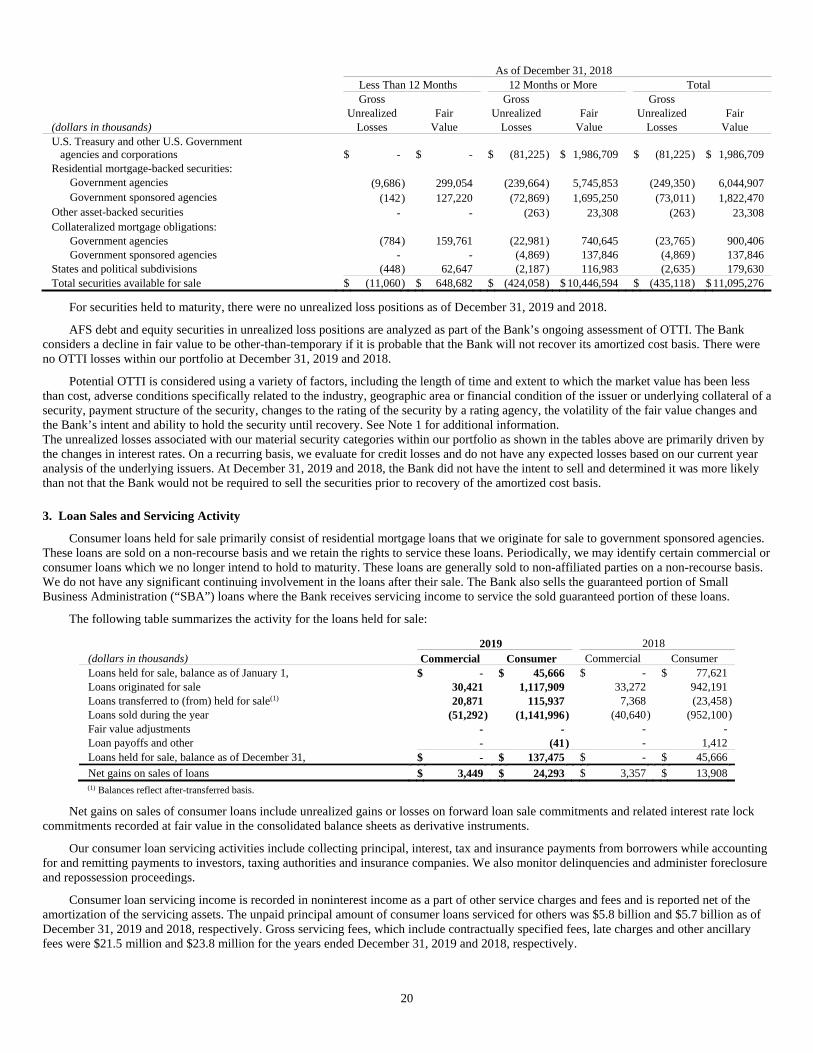
20
As of December 31, 2018 Less Than 12 Months 12 Months or More Total Gross Gross Gross Unrealized Fair Unrealized Fair Unrealized Fair
(dollars in thousands) Losses Value Losses Value Losses Value U.S. Treasury and other U.S. Government agencies and corporations $ - $ - $ (81,225) $ 1,986,709 $ (81,225) $ 1,986,709 Residential mortgage-backed securities:
Government agencies (9,686) 299,054 (239,664) 5,745,853 (249,350) 6,044,907 Government sponsored agencies (142) 127,220 (72,869) 1,695,250 (73,011) 1,822,470
Other asset-backed securities - - (263) 23,308 (263) 23,308 Collateralized mortgage obligations:
Government agencies (784) 159,761 (22,981) 740,645 (23,765) 900,406 Government sponsored agencies - - (4,869) 137,846 (4,869) 137,846
States and political subdivisions (448) 62,647 (2,187) 116,983 (2,635) 179,630 Total securities available for sale $ (11,060) $ 648,682 $ (424,058) $ 10,446,594 $ (435,118) $ 11,095,276
For securities held to maturity, there were no unrealized loss positions as of December 31, 2019 and 2018.
AFS debt and equity securities in unrealized loss positions are analyzed as part of the Bank’s ongoing assessment of OTTI. The Bank considers a decline in fair value to be other-than-temporary if it is probable that the Bank will not recover its amortized cost basis. There were no OTTI losses within our portfolio at December 31, 2019 and 2018.
Potential OTTI is considered using a variety of factors, including the length of time and extent to which the market value has been less than cost, adverse conditions specifically related to the industry, geographic area or financial condition of the issuer or underlying collateral of a security, payment structure of the security, changes to the rating of the security by a rating agency, the volatility of the fair value changes and the Bank’s intent and ability to hold the security until recovery. See Note 1 for additional information. The unrealized losses associated with our material security categories within our portfolio as shown in the tables above are primarily driven by the changes in interest rates. On a recurring basis, we evaluate for credit losses and do not have any expected losses based on our current year analysis of the underlying issuers. At December 31, 2019 and 2018, the Bank did not have the intent to sell and determined it was more likely than not that the Bank would not be required to sell the securities prior to recovery of the amortized cost basis.
3. Loan Sales and Servicing Activity
Consumer loans held for sale primarily consist of residential mortgage loans that we originate for sale to government sponsored agencies. These loans are sold on a non-recourse basis and we retain the rights to service these loans. Periodically, we may identify certain commercial or consumer loans which we no longer intend to hold to maturity. These loans are generally sold to non-affiliated parties on a non-recourse basis. We do not have any significant continuing involvement in the loans after their sale. The Bank also sells the guaranteed portion of Small Business Administration (“SBA”) loans where the Bank receives servicing income to service the sold guaranteed portion of these loans.
The following table summarizes the activity for the loans held for sale:
2019 2018 (dollars in thousands) Commercial Consumer Commercial Consumer Loans held for sale, balance as of January 1, $ - $ 45,666 $ - $ 77,621 Loans originated for sale 30,421 1,117,909 33,272 942,191 Loans transferred to (from) held for sale(1) 20,871 115,937 7,368 (23,458)Loans sold during the year (51,292) (1,141,996) (40,640 ) (952,100)Fair value adjustments - - - - Loan payoffs and other - (41) - 1,412 Loans held for sale, balance as of December 31, $ - $ 137,475 $ - $ 45,666
Net gains on sales of loans $ 3,449 $ 24,293 $ 3,357 $ 13,908
(1) Balances reflect after-transferred basis.
Net gains on sales of consumer loans include unrealized gains or losses on forward loan sale commitments and related interest rate lock commitments recorded at fair value in the consolidated balance sheets as derivative instruments.
Our consumer loan servicing activities include collecting principal, interest, tax and insurance payments from borrowers while accounting for and remitting payments to investors, taxing authorities and insurance companies. We also monitor delinquencies and administer foreclosure and repossession proceedings.
Consumer loan servicing income is recorded in noninterest income as a part of other service charges and fees and is reported net of the amortization of the servicing assets. The unpaid principal amount of consumer loans serviced for others was $5.8 billion and $5.7 billion as of December 31, 2019 and 2018, respectively. Gross servicing fees, which include contractually specified fees, late charges and other ancillary fees were $21.5 million and $23.8 million for the years ended December 31, 2019 and 2018, respectively.
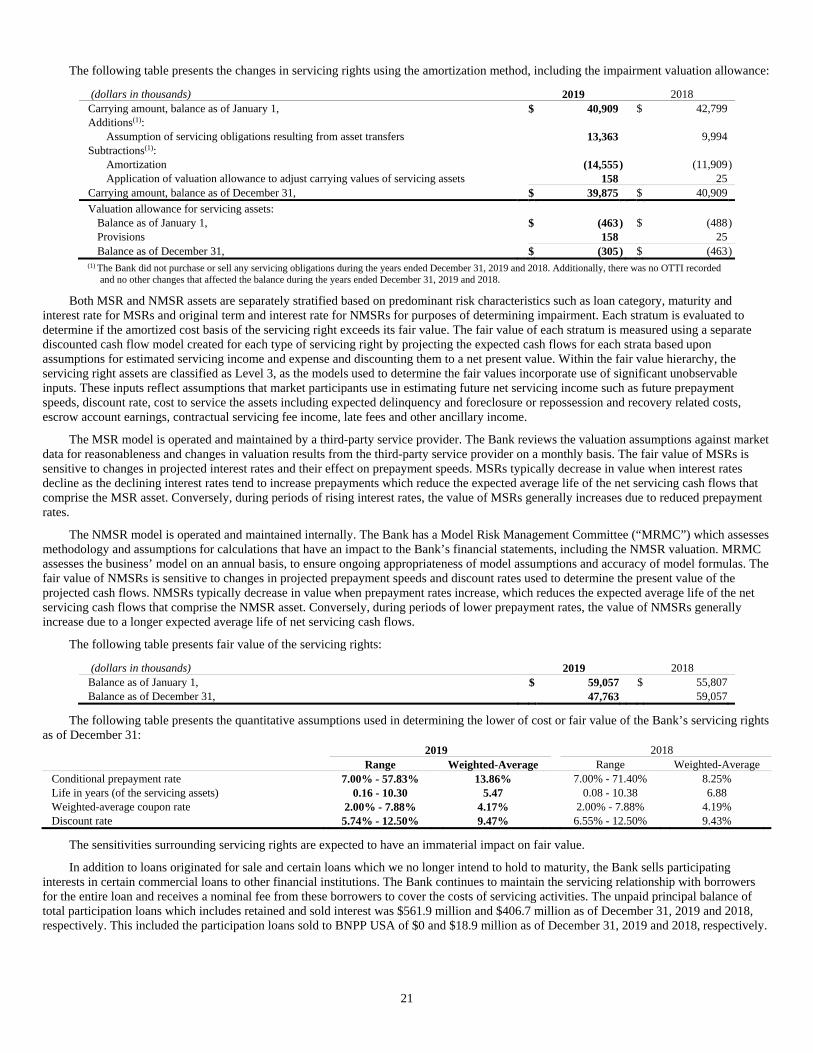
21
The following table presents the changes in servicing rights using the amortization method, including the impairment valuation allowance:
(dollars in thousands) 2019 2018 Carrying amount, balance as of January 1, $ 40,909 $ 42,799 Additions(1):
Assumption of servicing obligations resulting from asset transfers 13,363 9,994 Subtractions(1):
Amortization (14,555 ) (11,909)Application of valuation allowance to adjust carrying values of servicing assets 158 25
Carrying amount, balance as of December 31, $ 39,875 $ 40,909
Valuation allowance for servicing assets: Balance as of January 1, $ (463 ) $ (488)Provisions 158 25 Balance as of December 31, $ (305 ) $ (463)
(1) The Bank did not purchase or sell any servicing obligations during the years ended December 31, 2019 and 2018. Additionally, there was no OTTI recorded and no other changes that affected the balance during the years ended December 31, 2019 and 2018.
Both MSR and NMSR assets are separately stratified based on predominant risk characteristics such as loan category, maturity and interest rate for MSRs and original term and interest rate for NMSRs for purposes of determining impairment. Each stratum is evaluated to determine if the amortized cost basis of the servicing right exceeds its fair value. The fair value of each stratum is measured using a separate discounted cash flow model created for each type of servicing right by projecting the expected cash flows for each strata based upon assumptions for estimated servicing income and expense and discounting them to a net present value. Within the fair value hierarchy, the servicing right assets are classified as Level 3, as the models used to determine the fair values incorporate use of significant unobservable inputs. These inputs reflect assumptions that market participants use in estimating future net servicing income such as future prepayment speeds, discount rate, cost to service the assets including expected delinquency and foreclosure or repossession and recovery related costs, escrow account earnings, contractual servicing fee income, late fees and other ancillary income.
The MSR model is operated and maintained by a third-party service provider. The Bank reviews the valuation assumptions against market data for reasonableness and changes in valuation results from the third-party service provider on a monthly basis. The fair value of MSRs is sensitive to changes in projected interest rates and their effect on prepayment speeds. MSRs typically decrease in value when interest rates decline as the declining interest rates tend to increase prepayments which reduce the expected average life of the net servicing cash flows that comprise the MSR asset. Conversely, during periods of rising interest rates, the value of MSRs generally increases due to reduced prepayment rates.
The NMSR model is operated and maintained internally. The Bank has a Model Risk Management Committee (“MRMC”) which assesses methodology and assumptions for calculations that have an impact to the Bank’s financial statements, including the NMSR valuation. MRMC assesses the business’ model on an annual basis, to ensure ongoing appropriateness of model assumptions and accuracy of model formulas. The fair value of NMSRs is sensitive to changes in projected prepayment speeds and discount rates used to determine the present value of the projected cash flows. NMSRs typically decrease in value when prepayment rates increase, which reduces the expected average life of the net servicing cash flows that comprise the NMSR asset. Conversely, during periods of lower prepayment rates, the value of NMSRs generally increase due to a longer expected average life of net servicing cash flows.
The following table presents fair value of the servicing rights:
(dollars in thousands) 2019 2018 Balance as of January 1, $ 59,057 $ 55,807 Balance as of December 31, 47,763 59,057
The following table presents the quantitative assumptions used in determining the lower of cost or fair value of the Bank’s servicing rights as of December 31:
2019 2018 Range Weighted-Average Range Weighted-Average
Conditional prepayment rate 7.00% - 57.83% 13.86% 7.00% - 71.40% 8.25% Life in years (of the servicing assets) 0.16 - 10.30 5.47 0.08 - 10.38 6.88 Weighted-average coupon rate 2.00% - 7.88% 4.17% 2.00% - 7.88% 4.19% Discount rate 5.74% - 12.50% 9.47% 6.55% - 12.50% 9.43%
The sensitivities surrounding servicing rights are expected to have an immaterial impact on fair value.
In addition to loans originated for sale and certain loans which we no longer intend to hold to maturity, the Bank sells participating interests in certain commercial loans to other financial institutions. The Bank continues to maintain the servicing relationship with borrowers for the entire loan and receives a nominal fee from these borrowers to cover the costs of servicing activities. The unpaid principal balance of total participation loans which includes retained and sold interest was $561.9 million and $406.7 million as of December 31, 2019 and 2018, respectively. This included the participation loans sold to BNPP USA of $0 and $18.9 million as of December 31, 2019 and 2018, respectively.
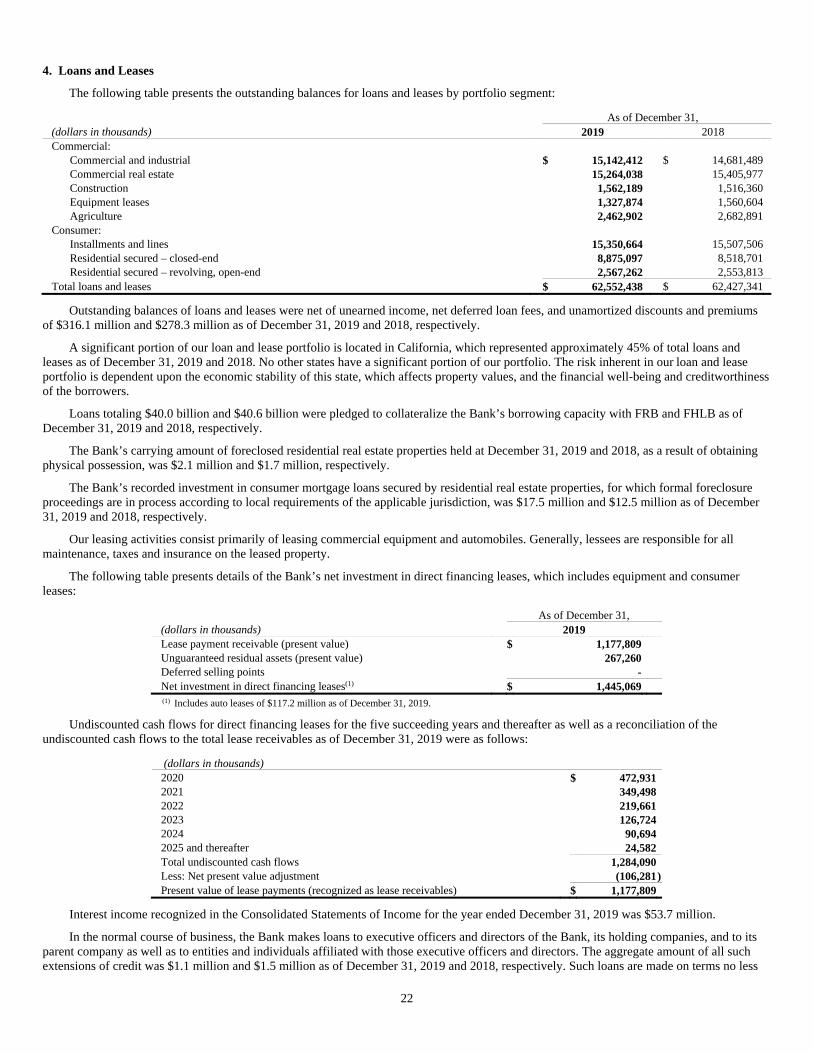
22
4. Loans and Leases
The following table presents the outstanding balances for loans and leases by portfolio segment:
As of December 31, (dollars in thousands) 2019 2018 Commercial:
Commercial and industrial $ 15,142,412 $ 14,681,489 Commercial real estate 15,264,038 15,405,977 Construction 1,562,189 1,516,360 Equipment leases 1,327,874 1,560,604 Agriculture 2,462,902 2,682,891
Consumer: Installments and lines 15,350,664 15,507,506 Residential secured – closed-end 8,875,097 8,518,701 Residential secured – revolving, open-end 2,567,262 2,553,813
Total loans and leases $ 62,552,438 $ 62,427,341
Outstanding balances of loans and leases were net of unearned income, net deferred loan fees, and unamortized discounts and premiums of $316.1 million and $278.3 million as of December 31, 2019 and 2018, respectively.
A significant portion of our loan and lease portfolio is located in California, which represented approximately 45% of total loans and leases as of December 31, 2019 and 2018. No other states have a significant portion of our portfolio. The risk inherent in our loan and lease portfolio is dependent upon the economic stability of this state, which affects property values, and the financial well-being and creditworthiness of the borrowers.
Loans totaling $40.0 billion and $40.6 billion were pledged to collateralize the Bank’s borrowing capacity with FRB and FHLB as of December 31, 2019 and 2018, respectively.
The Bank’s carrying amount of foreclosed residential real estate properties held at December 31, 2019 and 2018, as a result of obtaining physical possession, was $2.1 million and $1.7 million, respectively.
The Bank’s recorded investment in consumer mortgage loans secured by residential real estate properties, for which formal foreclosure proceedings are in process according to local requirements of the applicable jurisdiction, was $17.5 million and $12.5 million as of December 31, 2019 and 2018, respectively.
Our leasing activities consist primarily of leasing commercial equipment and automobiles. Generally, lessees are responsible for all maintenance, taxes and insurance on the leased property.
The following table presents details of the Bank’s net investment in direct financing leases, which includes equipment and consumer leases:
As of December 31, (dollars in thousands) 2019 Lease payment receivable (present value) $ 1,177,809 Unguaranteed residual assets (present value) 267,260 Deferred selling points - Net investment in direct financing leases(1) $ 1,445,069 (1) Includes auto leases of $117.2 million as of December 31, 2019.
Undiscounted cash flows for direct financing leases for the five succeeding years and thereafter as well as a reconciliation of the undiscounted cash flows to the total lease receivables as of December 31, 2019 were as follows:
(dollars in thousands)
2020 $ 472,931 2021 349,498 2022 219,661 2023 126,724 2024 90,694 2025 and thereafter 24,582 Total undiscounted cash flows 1,284,090 Less: Net present value adjustment (106,281)Present value of lease payments (recognized as lease receivables) $ 1,177,809
Interest income recognized in the Consolidated Statements of Income for the year ended December 31, 2019 was $53.7 million.
In the normal course of business, the Bank makes loans to executive officers and directors of the Bank, its holding companies, and to its parent company as well as to entities and individuals affiliated with those executive officers and directors. The aggregate amount of all such extensions of credit was $1.1 million and $1.5 million as of December 31, 2019 and 2018, respectively. Such loans are made on terms no less
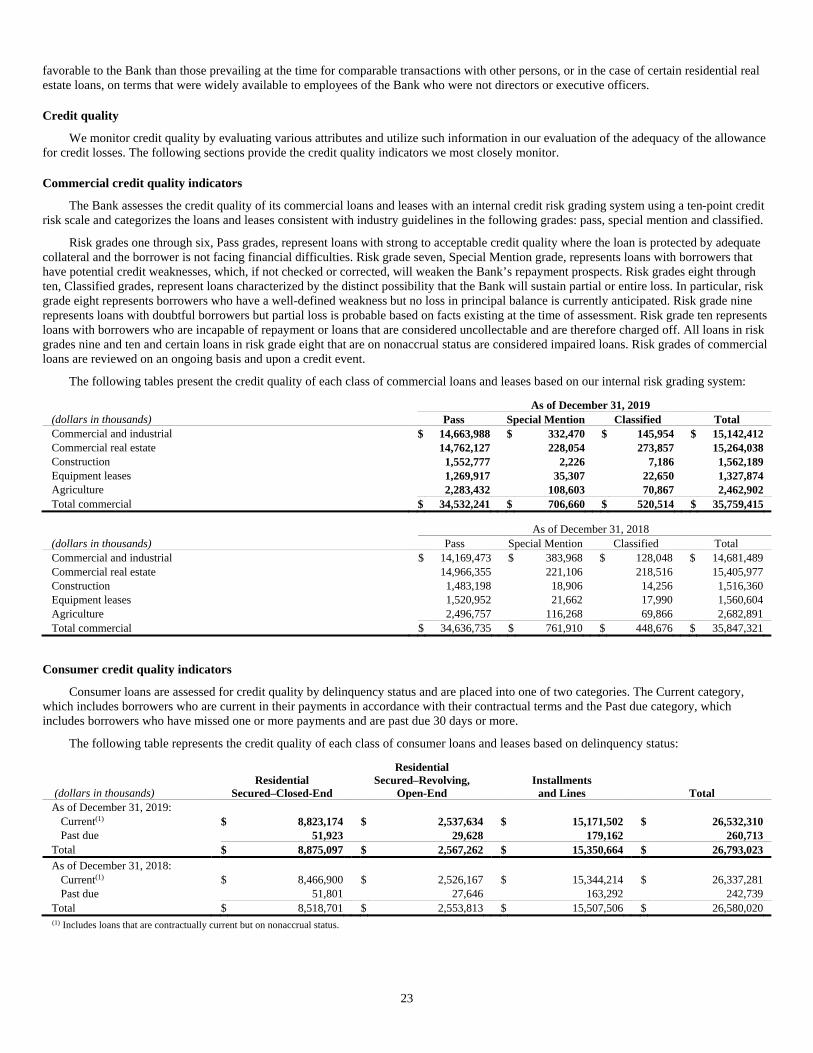
23
favorable to the Bank than those prevailing at the time for comparable transactions with other persons, or in the case of certain residential real estate loans, on terms that were widely available to employees of the Bank who were not directors or executive officers.
Credit quality
We monitor credit quality by evaluating various attributes and utilize such information in our evaluation of the adequacy of the allowance for credit losses. The following sections provide the credit quality indicators we most closely monitor.
Commercial credit quality indicators
The Bank assesses the credit quality of its commercial loans and leases with an internal credit risk grading system using a ten-point credit risk scale and categorizes the loans and leases consistent with industry guidelines in the following grades: pass, special mention and classified.
Risk grades one through six, Pass grades, represent loans with strong to acceptable credit quality where the loan is protected by adequate collateral and the borrower is not facing financial difficulties. Risk grade seven, Special Mention grade, represents loans with borrowers that have potential credit weaknesses, which, if not checked or corrected, will weaken the Bank’s repayment prospects. Risk grades eight through ten, Classified grades, represent loans characterized by the distinct possibility that the Bank will sustain partial or entire loss. In particular, risk grade eight represents borrowers who have a well-defined weakness but no loss in principal balance is currently anticipated. Risk grade nine represents loans with doubtful borrowers but partial loss is probable based on facts existing at the time of assessment. Risk grade ten represents loans with borrowers who are incapable of repayment or loans that are considered uncollectable and are therefore charged off. All loans in risk grades nine and ten and certain loans in risk grade eight that are on nonaccrual status are considered impaired loans. Risk grades of commercial loans are reviewed on an ongoing basis and upon a credit event.
The following tables present the credit quality of each class of commercial loans and leases based on our internal risk grading system:
As of December 31, 2019 (dollars in thousands) Pass Special Mention Classified Total Commercial and industrial $ 14,663,988 $ 332,470 $ 145,954 $ 15,142,412 Commercial real estate 14,762,127 228,054 273,857 15,264,038 Construction 1,552,777 2,226 7,186 1,562,189 Equipment leases 1,269,917 35,307 22,650 1,327,874 Agriculture 2,283,432 108,603 70,867 2,462,902 Total commercial $ 34,532,241 $ 706,660 $ 520,514 $ 35,759,415
As of December 31, 2018 (dollars in thousands) Pass Special Mention Classified Total Commercial and industrial $ 14,169,473 $ 383,968 $ 128,048 $ 14,681,489 Commercial real estate 14,966,355 221,106 218,516 15,405,977 Construction 1,483,198 18,906 14,256 1,516,360 Equipment leases 1,520,952 21,662 17,990 1,560,604 Agriculture 2,496,757 116,268 69,866 2,682,891 Total commercial $ 34,636,735 $ 761,910 $ 448,676 $ 35,847,321
Consumer credit quality indicators
Consumer loans are assessed for credit quality by delinquency status and are placed into one of two categories. The Current category, which includes borrowers who are current in their payments in accordance with their contractual terms and the Past due category, which includes borrowers who have missed one or more payments and are past due 30 days or more.
The following table represents the credit quality of each class of consumer loans and leases based on delinquency status:
(dollars in thousands) Residential
Secured–Closed-End
Residential Secured–Revolving,
Open-End Installments
and Lines Total As of December 31, 2019:
Current(1) $ 8,823,174 $ 2,537,634 $ 15,171,502 $ 26,532,310 Past due 51,923 29,628 179,162 260,713
Total $ 8,875,097 $ 2,567,262 $ 15,350,664 $ 26,793,023
As of December 31, 2018: Current(1) $ 8,466,900 $ 2,526,167 $ 15,344,214 $ 26,337,281 Past due 51,801 27,646 163,292 242,739
Total $ 8,518,701 $ 2,553,813 $ 15,507,506 $ 26,580,020 (1) Includes loans that are contractually current but on nonaccrual status.

24
5. Allowance for Credit Losses
The allowance for credit losses reflects management’s estimate of credit losses inherent in the loan and lease portfolio and reserve for unfunded lending commitments. We consider the allowance for credit losses at the end of 2019 to be adequate to cover such losses.
Changes in the allowance for credit losses were:
(dollars in thousands) 2019 2018 Balance as of January 1, $ 658,043 $ 666,441 Provision for credit losses 145,066 112,152 Charge-offs:
Commercial: Commercial and industrial (65,730 ) (55,465)Commercial real estate (563 ) (8,960)Construction (18 ) (109)Equipment leases (9,596 ) (10,083)
Agriculture (2,361 ) (5,328)Total commercial (78,268 ) (79,945)Consumer:
Installments and lines (155,923 ) (122,899)Residential secured—closed-end (808 ) (1,135)Residential secured—revolving, open-end - -
Total consumer (156,731 ) (124,034)Total charge-offs (234,999 ) (203,979)Recoveries:
Commercial: Commercial and industrial 24,951 23,959 Commercial real estate 4,748 2,505 Construction 1,053 10,650 Equipment leases 6,493 2,976 Agriculture 2,039 3,591
Total commercial 39,284 43,681 Consumer:
Installments and lines 38,166 33,291 Residential secured—closed-end 4,018 3,182 Residential secured—revolving, open-end 2,838 3,275
Total consumer 45,022 39,748 Total recoveries 84,306 83,429 Net charge-offs (150,693 ) (120,550)Balance as of December 31, $ 652,416 $ 658,043
Components: Allocated loans and leases $ 577,497 $ 557,956 Qualitative loans and leases 40,000 55,000
Total allowance for loans and leases 617,497 612,956 Reserve for unfunded commitments 34,919 45,087 Allowance for credit losses $ 652,416 $ 658,043
The following table summarizes the activity in the allowance for loan and lease losses by commercial and consumer portfolio segments:
2019 (dollars in thousands) Commercial Consumer Qualitative Total Balance as of January 1, $ 347,712 $ 210,244 $ 55,000 $ 612,956
Provision for loan and lease losses 36,647 133,587 (15,000) 155,234 Charge-offs (78,268) (156,731 ) - (234,999)Recoveries 39,284 45,022 - 84,306
Net charge-offs (38,984) (111,709 ) - (150,693)Balance as of December 31, $ 345,375 $ 232,122 $ 40,000 $ 617,497
2018 (dollars in thousands) Commercial Consumer Qualitative Total Balance as of January 1, $ 368,535 $ 200,299 $ 52,000 $ 620,834
Provision for loan and lease losses 15,441 94,231 3,000 112,672 Charge-offs (79,945) (124,034 ) - (203,979)Recoveries 43,681 39,748 - 83,429
Net charge-offs (36,264) (84,286 ) - (120,550)Balance as of December 31, $ 347,712 $ 210,244 $ 55,000 $ 612,956
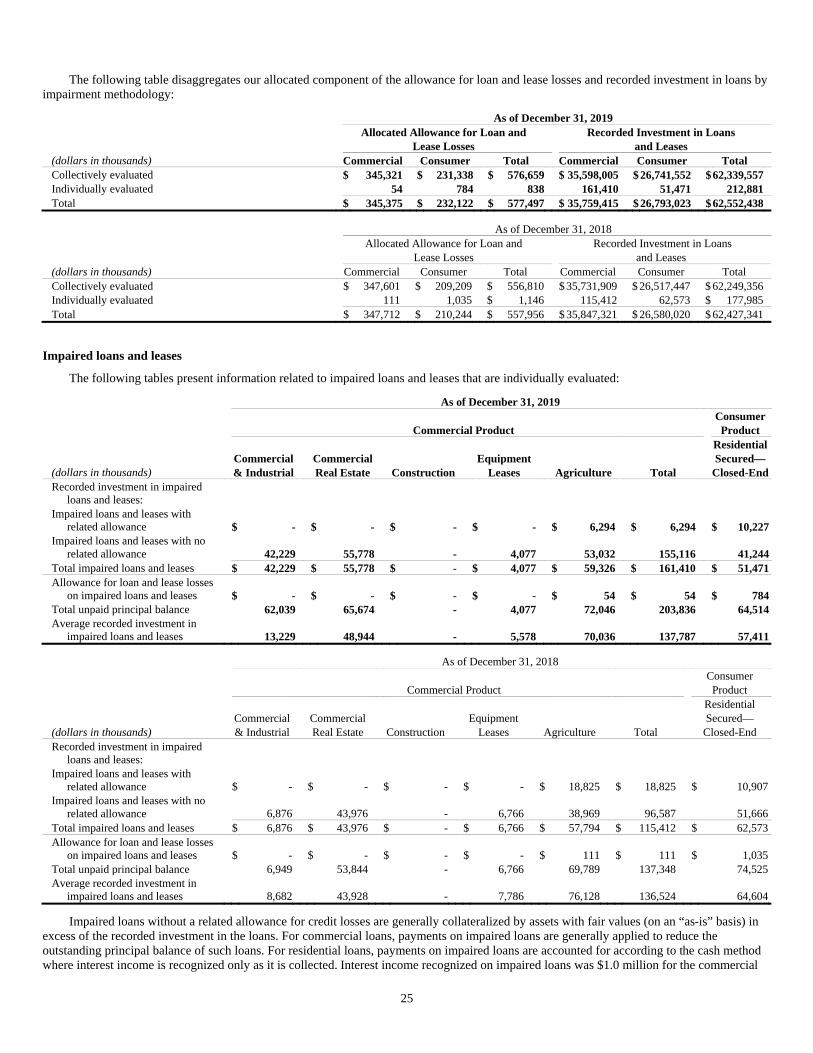
25
The following table disaggregates our allocated component of the allowance for loan and lease losses and recorded investment in loans by impairment methodology:
As of December 31, 2019 Allocated Allowance for Loan and Recorded Investment in Loans Lease Losses and Leases
(dollars in thousands) Commercial Consumer Total Commercial Consumer Total Collectively evaluated $ 345,321 $ 231,338 $ 576,659 $ 35,598,005 $ 26,741,552 $62,339,557 Individually evaluated 54 784 838 161,410 51,471 212,881 Total $ 345,375 $ 232,122 $ 577,497 $ 35,759,415 $ 26,793,023 $62,552,438
As of December 31, 2018 Allocated Allowance for Loan and Recorded Investment in Loans Lease Losses and Leases
(dollars in thousands) Commercial Consumer Total Commercial Consumer Total Collectively evaluated $ 347,601 $ 209,209 $ 556,810 $ 35,731,909 $ 26,517,447 $ 62,249,356 Individually evaluated 111 1,035 $ 1,146 115,412 62,573 $ 177,985 Total $ 347,712 $ 210,244 $ 557,956 $ 35,847,321 $ 26,580,020 $ 62,427,341
Impaired loans and leases
The following tables present information related to impaired loans and leases that are individually evaluated:
As of December 31, 2019 Consumer Commercial Product Product Residential Commercial Commercial Equipment Secured—
(dollars in thousands) & Industrial Real Estate Construction Leases Agriculture Total Closed-EndRecorded investment in impaired
loans and leases: Impaired loans and leases with
related allowance $ - $ - $ - $ - $ 6,294 $ 6,294 $ 10,227Impaired loans and leases with no
related allowance 42,229 55,778 - 4,077 53,032 155,116 41,244Total impaired loans and leases $ 42,229 $ 55,778 $ - $ 4,077 $ 59,326 $ 161,410 $ 51,471Allowance for loan and lease losses
on impaired loans and leases $ - $ - $ - $ - $ 54 $ 54 $ 784Total unpaid principal balance 62,039 65,674 - 4,077 72,046 203,836 64,514Average recorded investment in
impaired loans and leases 13,229 48,944 - 5,578 70,036 137,787 57,411
As of December 31, 2018 Consumer Commercial Product Product Residential Commercial Commercial Equipment Secured—
(dollars in thousands) & Industrial Real Estate Construction Leases Agriculture Total Closed-End Recorded investment in impaired
loans and leases: Impaired loans and leases with
related allowance $ - $ - $ - $ - $ 18,825 $ 18,825 $ 10,907Impaired loans and leases with no
related allowance 6,876 43,976 - 6,766 38,969 96,587 51,666Total impaired loans and leases $ 6,876 $ 43,976 $ - $ 6,766 $ 57,794 $ 115,412 $ 62,573Allowance for loan and lease losses
on impaired loans and leases $ - $ - $ - $ - $ 111 $ 111 $ 1,035Total unpaid principal balance 6,949 53,844 - 6,766 69,789 137,348 74,525Average recorded investment in
impaired loans and leases 8,682 43,928 - 7,786 76,128 136,524 64,604
Impaired loans without a related allowance for credit losses are generally collateralized by assets with fair values (on an “as-is” basis) in excess of the recorded investment in the loans. For commercial loans, payments on impaired loans are generally applied to reduce the outstanding principal balance of such loans. For residential loans, payments on impaired loans are accounted for according to the cash method where interest income is recognized only as it is collected. Interest income recognized on impaired loans was $1.0 million for the commercial

26
portfolio as of December 31, 2019 and 2018, respectively. Interest income recognized on impaired loans was $3.6 million and $4.4 million for the consumer portfolio as of December 31, 2019 and 2018, respectively.
Troubled debt restructurings
In situations where the borrower has financial difficulties due to economic or legal reasons and the Bank grants a concession to the borrower that it would not otherwise consider, the related loan is classified as a TDR. For the commercial loan portfolio, concessions granted by the Bank generally include term extensions, renewals, forbearances of principal and interest payments and interest rate modifications for each of the classes shown below. Such loans are considered for individually evaluated impairment if they meet certain thresholds. In addition, for smaller balance nonperforming loans, we may use third-party collection agencies who generally enter into payment or settlement arrangements with the borrowers in order to protect as much of the Bank’s investment in the loan as possible. For our consumer loan portfolio, concessions generally include term extensions, interest rate changes, payment deferrals and temporary payment reductions. TDRs not individually evaluated are incorporated into a collectively evaluated allowance. The Bank had $51.9 million and $40.9 million of commitments to lend additional funds and letters of credit to customers whose troubled debt has been restructured as of December 31, 2019 and 2018, respectively.
The following tables provide a summary of the financial effects of the modifications during the years ended December 31, 2019 and 2018. In addition, the tables provide the related outstanding balance, as well as a summary of loans outstanding at December 31, 2019 and 2018 modified as TDRs within the previous 12 months for which there was a subsequent payment default during the period. A payment default is defined as 90 days past due for the commercial portfolio and 60 days past due for the consumer portfolio.
2019 Financial Effects Subsequent Defaults Pre- Post- Balance as of Balance as of Modification Modification December 31, Number of December 31,
(dollars in thousands) Loan Balance Loan Balance 2019 Contracts 2019 Commercial TDRs:
Commercial and industrial $ 60,114 $ 59,469 $ 35,552 2 $ 661Commercial real estate 22,247 21,641 9,771 - -Construction 100 100 100 - -Agriculture 38,428 39,359 31,796 2 15,640
Consumer TDRs: Installments and lines 17,304 13,850 12,272 16 245Residential secured—closed-end 4,599 4,918 4,587 11 1,200Residential secured—revolving, open-end 2,139 2,044 2,005 5 762
Total $ 144,931 $ 141,381 $ 96,083 36 $ 18,508
2018 Financial Effects Subsequent Defaults Pre- Post- Balance as of Balance as of Modification Modification December 31, Number of December 31,
(dollars in thousands) Loan Balance Loan Balance 2018 Contracts 2018 Commercial TDRs:
Commercial and industrial $ 24,646 $ 23,338 $ 11,221 61 $ 5,105Commercial real estate 24,391 24,308 15,783 5 5,383Construction 3,050 3,050 3,050 - -Agriculture 43,603 42,097 29,855 - -
Consumer TDRs: Installments and lines 17,919 15,523 13,872 9 125Residential secured—closed-end 12,067 12,606 11,908 8 1,435Residential secured—revolving, open-end 3,287 3,286 3,266 8 651
Total $ 128,963 $ 124,208 $ 88,955 91 $ 12,699
Nonaccrual and past due loans and leases
The following tables present information relating to the past due and nonaccrual status of our loans and leases by class, which we monitor as part of our credit risk management practices:
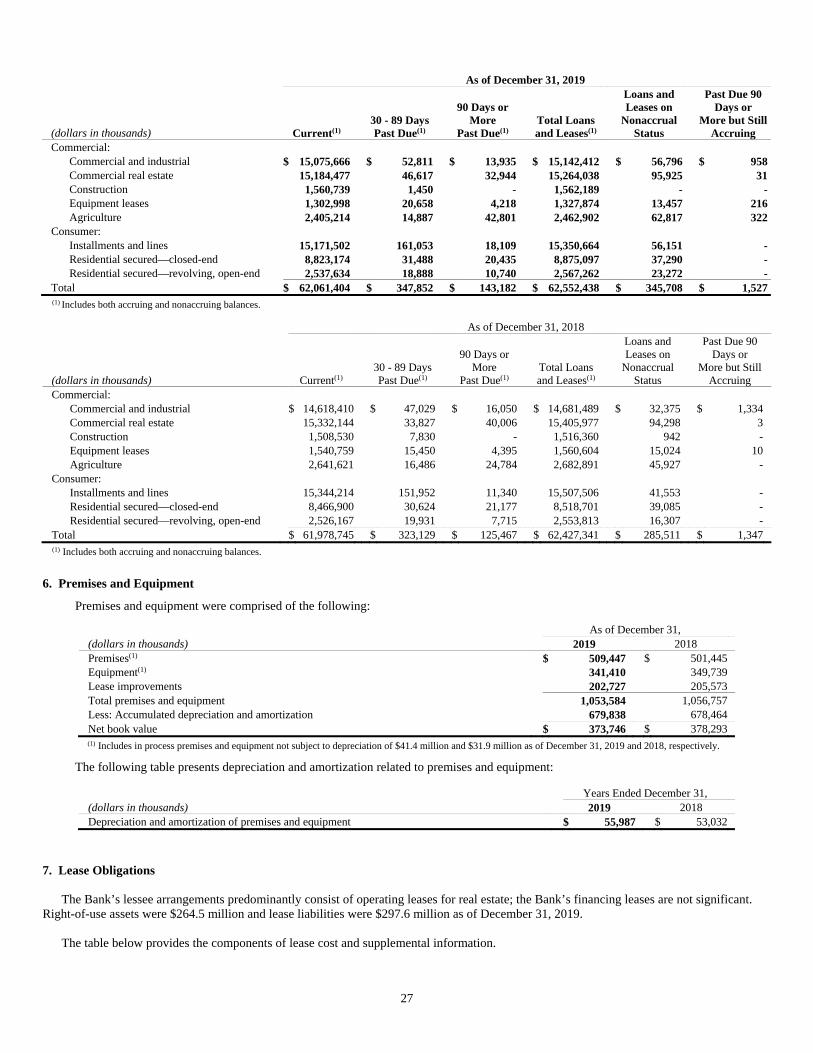
27
(1) Includes both accruing and nonaccruing balances.
As of December 31, 2018
(dollars in thousands) Current(1) 30 - 89 DaysPast Due(1)
90 Days or More
Past Due(1) Total Loans and Leases(1)
Loans and Leases on
Nonaccrual Status
Past Due 90 Days or
More but StillAccruing
Commercial: Commercial and industrial $ 14,618,410 $ 47,029 $ 16,050 $ 14,681,489 $ 32,375 $ 1,334 Commercial real estate 15,332,144 33,827 40,006 15,405,977 94,298 3 Construction 1,508,530 7,830 - 1,516,360 942 - Equipment leases 1,540,759 15,450 4,395 1,560,604 15,024 10 Agriculture 2,641,621 16,486 24,784 2,682,891 45,927 -
Consumer: Installments and lines 15,344,214 151,952 11,340 15,507,506 41,553 - Residential secured—closed-end 8,466,900 30,624 21,177 8,518,701 39,085 - Residential secured—revolving, open-end 2,526,167 19,931 7,715 2,553,813 16,307 -
Total $ 61,978,745 $ 323,129 $ 125,467 $ 62,427,341 $ 285,511 $ 1,347 (1) Includes both accruing and nonaccruing balances.
6. Premises and Equipment
Premises and equipment were comprised of the following:
As of December 31, (dollars in thousands) 2019 2018 Premises(1) $ 509,447 $ 501,445 Equipment(1) 341,410 349,739 Lease improvements 202,727 205,573 Total premises and equipment 1,053,584 1,056,757 Less: Accumulated depreciation and amortization 679,838 678,464 Net book value $ 373,746 $ 378,293
(1) Includes in process premises and equipment not subject to depreciation of $41.4 million and $31.9 million as of December 31, 2019 and 2018, respectively.
The following table presents depreciation and amortization related to premises and equipment:
Years Ended December 31, (dollars in thousands) 2019 2018 Depreciation and amortization of premises and equipment $ 55,987 $ 53,032
7. Lease Obligations The Bank’s lessee arrangements predominantly consist of operating leases for real estate; the Bank’s financing leases are not significant. Right-of-use assets were $264.5 million and lease liabilities were $297.6 million as of December 31, 2019.
The table below provides the components of lease cost and supplemental information.
As of December 31, 2019
(dollars in thousands) Current(1) 30 - 89 DaysPast Due(1)
90 Days or More
Past Due(1) Total Loans and Leases(1)
Loans and Leases on
Nonaccrual Status
Past Due 90 Days or
More but StillAccruing
Commercial: Commercial and industrial $ 15,075,666 $ 52,811 $ 13,935 $ 15,142,412 $ 56,796 $ 958Commercial real estate 15,184,477 46,617 32,944 15,264,038 95,925 31Construction 1,560,739 1,450 - 1,562,189 - -Equipment leases 1,302,998 20,658 4,218 1,327,874 13,457 216Agriculture 2,405,214 14,887 42,801 2,462,902 62,817 322
Consumer: Installments and lines 15,171,502 161,053 18,109 15,350,664 56,151 -Residential secured—closed-end 8,823,174 31,488 20,435 8,875,097 37,290 -Residential secured—revolving, open-end 2,537,634 18,888 10,740 2,567,262 23,272 -
Total $ 62,061,404 $ 347,852 $ 143,182 $ 62,552,438 $ 345,708 $ 1,527
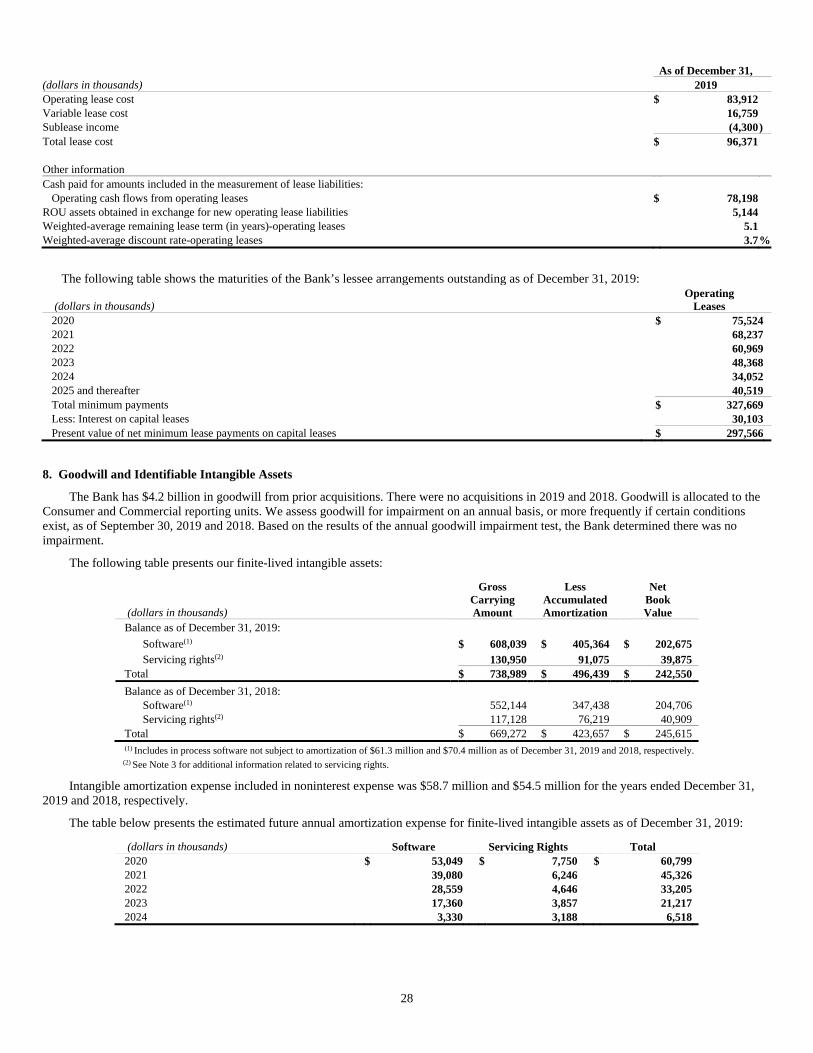
28
As of December 31, (dollars in thousands) 2019 Operating lease cost $ 83,912 Variable lease cost 16,759 Sublease income (4,300) Total lease cost $ 96,371 Other information Cash paid for amounts included in the measurement of lease liabilities:
Operating cash flows from operating leases $ 78,198 ROU assets obtained in exchange for new operating lease liabilities 5,144 Weighted-average remaining lease term (in years)-operating leases 5.1 Weighted-average discount rate-operating leases 3.7%
The following table shows the maturities of the Bank’s lessee arrangements outstanding as of December 31, 2019:
(dollars in thousands) Operating
Leases 2020 $ 75,524 2021 68,237 2022 60,969 2023 48,368 2024 34,052 2025 and thereafter 40,519 Total minimum payments $ 327,669 Less: Interest on capital leases 30,103 Present value of net minimum lease payments on capital leases $ 297,566
8. Goodwill and Identifiable Intangible Assets
The Bank has $4.2 billion in goodwill from prior acquisitions. There were no acquisitions in 2019 and 2018. Goodwill is allocated to the Consumer and Commercial reporting units. We assess goodwill for impairment on an annual basis, or more frequently if certain conditions exist, as of September 30, 2019 and 2018. Based on the results of the annual goodwill impairment test, the Bank determined there was no impairment.
The following table presents our finite-lived intangible assets:
(dollars in thousands)
Gross Carrying Amount
Less Accumulated Amortization
Net Book Value
Balance as of December 31, 2019: Software(1) $ 608,039 $ 405,364 $ 202,675 Servicing rights(2) 130,950 91,075 39,875
Total $ 738,989 $ 496,439 $ 242,550
Balance as of December 31, 2018: Software(1) 552,144 347,438 204,706 Servicing rights(2) 117,128 76,219 40,909
Total $ 669,272 $ 423,657 $ 245,615
(1) Includes in process software not subject to amortization of $61.3 million and $70.4 million as of December 31, 2019 and 2018, respectively. (2) See Note 3 for additional information related to servicing rights.
Intangible amortization expense included in noninterest expense was $58.7 million and $54.5 million for the years ended December 31, 2019 and 2018, respectively.
The table below presents the estimated future annual amortization expense for finite-lived intangible assets as of December 31, 2019:
(dollars in thousands) Software Servicing Rights Total 2020 $ 53,049 $ 7,750 $ 60,799 2021 39,080 6,246 45,326 2022 28,559 4,646 33,205 2023 17,360 3,857 21,217 2024 3,330 3,188 6,518

29
9. Variable Interest Entities
A VIE is an entity that has either a total equity investment that is insufficient to finance its activities without additional subordinated financial support or whose equity investors lack the ability to control the entity’s activities. Under existing accounting guidance, a VIE is consolidated by its primary beneficiary, the party that has both the power to direct the activities that most significantly impact the economic performance of the VIE and holds a variable interest that could potentially be significant to the VIE.
The Bank evaluates whether an entity is a VIE upon its creation and upon the occurrence of significant events, such as a change in an entity’s assets or activities. The determination of whether the Bank is the primary beneficiary involves performing a qualitative analysis of the VIE. The analysis includes its design, capital structure, contractual terms including the rights of each variable interest holder, the activities of the VIE that most significantly impact its economic performance, and whether the Bank has the power to direct those activities and our obligation to absorb losses or the right to receive benefits significant to the VIE.
Limited liability companies
The Bank has formed CLAAS Financial Services, LLC with the purpose of providing lease and loan financing to commercial entities acquiring agricultural equipment. The Bank owns 51% interest in the LLC and has the obligation to absorb losses that could be potentially significant to this LLC. The Bank also has the power to direct key activities of this LLC that significantly drive its performance through control of the Board of Directors. The Bank is the primary beneficiary of this LLC, and it is consolidated in our consolidated financial statements.
In addition to the investment in CLAAS Financial Services, LLC, the Bank has investments in limited liability companies (“LLCs”) for the purpose of managing foreclosed properties seized to mitigate losses to the Bank and its partners by selling the collateral. As of December 31, 2019, these LLCs had nominal assets.
Securitization trusts
The Bank securitized $770.0 and $750.0 million in automobile loans in 2019 and 2018, respectively, by transferring them to trusts and then issuing securities collateralized by those loans to investors. The automobile loans included in the consumer installments and lines portfolio segment, along with cash, were pledged as collateral and totaled $1,067.6 million and $707.2 million as of December 31, 2019 and 2018, respectively. The Bank continues to maintain the servicing relationship with the borrowers in exchange for a fee. Certain securities issued by the trust are retained by the Bank on a pro-rata and pari-passu basis with the securities sold to investors or are subordinated to the securities sold to investors, depending on the form of risk retention selected by the Bank for each securitization. The Bank also retained the beneficial interest in the trust for the 2019 and 2018 transactions. Each trust is structured such that investors in the securities have no recourse to the Bank.
In both the 2019 and 2018 securitization transactions, the Bank is the primary beneficiary as it holds significant variable interests and continues to service all of the loans. The Bank has the power to direct the activities that most significantly impact the economic performance of the trusts and could absorb credit losses that could potentially be significant to the trusts. The securitization trusts are determined to be VIEs. As the primary beneficiary, the assets and liabilities of the 2019 and 2018 trusts have been reflected in the Bank’s consolidated financial statements. The securitized loans continue to be recorded as loans and the obligation to remit certain cash flows collected from the borrowers to the investors in the securities was recorded as a secured borrowing and included in long-term debt. As such, no separate servicing asset has been recorded.
In the 2017 securitization transaction, the Bank has the power to direct the activities that most significantly impact the economic performance of the trust, but the Bank does not retain exposures that would provide benefits or absorb credit losses that would be significant to the trust. As the Bank does not hold variable interests in the securitization trust that would result in the Bank being the primary beneficiary of the securitization trust, the assets and liabilities of the trust are not reflected in the Bank’s consolidated financial statements, other than those securities that are retained by the Bank for risk retention purposes. See Note 2 for details of the retained securities. The securitized loans were derecognized and treated as a sale of assets as of the closing of the 2017 securitization transaction. No obligations were recorded in long-term debt. The Bank also recognized a non-mortgage servicing right asset on the balance sheet related to our ongoing role of servicing the loans for a contractually defined servicing fee. See Note 3 for further detail on the servicing asset.
Tax credit investments
The Bank owns several limited partnership interests in low-income housing developments. The Bank is not the primary beneficiary of these entities and in most instances, the Bank is one of many limited partners and our interest in the partnerships may decrease as new limited partners are added. Limited partners do not participate in the control of the partnerships’ businesses. The general partners, which are either developers or nonprofit organizations, exercise the day-to-day control and management of the projects. The general partners have exclusive control over the partnerships’ businesses and have all of the rights, powers and authority, generally conferred by law, advisable or consistent with accomplishing the partnerships’ businesses. As a limited partner, the Bank does not have an active role in any of the partnerships; our involvement is limited to providing financial support, as stated within the contractual agreements, and therefore we are not the primary beneficiary.
The business purpose of these entities is to provide affordable housing within the Bank’s service area in return for tax credits and tax loss deductions. The Bank has not received additional income or incurred additional expenses as a result of our involvement with these entities. As we are a limited partner, our maximum exposure to loss will never exceed our total investment in these entities, including our subscription amount. In the unlikely event that the general partners do not adhere to their contractual obligations to provide financial support to low-income
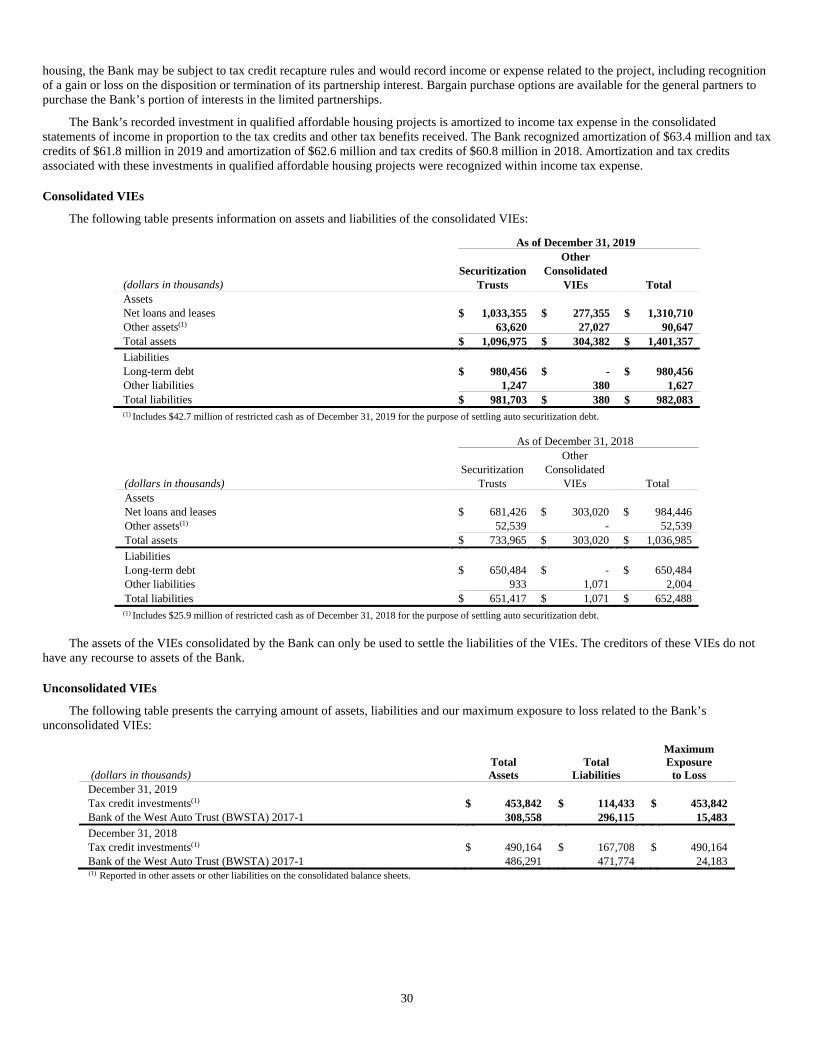
30
housing, the Bank may be subject to tax credit recapture rules and would record income or expense related to the project, including recognition of a gain or loss on the disposition or termination of its partnership interest. Bargain purchase options are available for the general partners to purchase the Bank’s portion of interests in the limited partnerships.
The Bank’s recorded investment in qualified affordable housing projects is amortized to income tax expense in the consolidated statements of income in proportion to the tax credits and other tax benefits received. The Bank recognized amortization of $63.4 million and tax credits of $61.8 million in 2019 and amortization of $62.6 million and tax credits of $60.8 million in 2018. Amortization and tax credits associated with these investments in qualified affordable housing projects were recognized within income tax expense.
Consolidated VIEs
The following table presents information on assets and liabilities of the consolidated VIEs:
As of December 31, 2019 Other Securitization Consolidated
(dollars in thousands) Trusts VIEs Total Assets Net loans and leases $ 1,033,355 $ 277,355 $ 1,310,710 Other assets(1) 63,620 27,027 90,647 Total assets $ 1,096,975 $ 304,382 $ 1,401,357
Liabilities Long-term debt $ 980,456 $ - $ 980,456 Other liabilities 1,247 380 1,627 Total liabilities $ 981,703 $ 380 $ 982,083
(1) Includes $42.7 million of restricted cash as of December 31, 2019 for the purpose of settling auto securitization debt.
As of December 31, 2018 Other Securitization Consolidated
(dollars in thousands) Trusts VIEs Total Assets Net loans and leases $ 681,426 $ 303,020 $ 984,446 Other assets(1) 52,539 - 52,539 Total assets $ 733,965 $ 303,020 $ 1,036,985
Liabilities Long-term debt $ 650,484 $ - $ 650,484 Other liabilities 933 1,071 2,004 Total liabilities $ 651,417 $ 1,071 $ 652,488
(1) Includes $25.9 million of restricted cash as of December 31, 2018 for the purpose of settling auto securitization debt.
The assets of the VIEs consolidated by the Bank can only be used to settle the liabilities of the VIEs. The creditors of these VIEs do not
have any recourse to assets of the Bank.
Unconsolidated VIEs
The following table presents the carrying amount of assets, liabilities and our maximum exposure to loss related to the Bank’s unconsolidated VIEs:
(dollars in thousands) Total Assets
Total Liabilities
Maximum Exposure
to Loss December 31, 2019 Tax credit investments(1) $ 453,842 $ 114,433 $ 453,842 Bank of the West Auto Trust (BWSTA) 2017-1 308,558 296,115 15,483
December 31, 2018 Tax credit investments(1) $ 490,164 $ 167,708 $ 490,164 Bank of the West Auto Trust (BWSTA) 2017-1 486,291 471,774 24,183
(1) Reported in other assets or other liabilities on the consolidated balance sheets.

31
10. Regulatory Capital Requirements
The Bank is subject to various regulatory capital requirements administered by federal banking agencies.
Under capital adequacy guidelines and the regulatory framework for prompt corrective actions (“PCA”), the Bank must meet specific capital guidelines that involve quantitative measures of its assets, certain off-balance sheet assets and liabilities, as calculated under regulatory accounting practices. These capital amounts and classifications are also subject to qualitative judgments by the regulators about components, risk weightings and other factors.
The federal banking agencies have established regulatory capital categories in the PCA regulations that include capital thresholds for the leverage ratio, Common Equity Tier 1 capital ratio, Tier 1 risk-based capital ratio, and the Total risk-based capital ratio for insured depository institutions. There are five PCA categories ranging from “well capitalized” to “critically under-capitalized”. A bank that fails to meet these capital measures is subject to increasingly strict limits on its activities, including its ability to make capital distributions, pay management fees, grow its balance sheet and other possible actions.
The Bank became subject to the U.S. Basel III Standardized Approach on January 1, 2015, with certain provisions subject to phase-in periods and certain instruments subject to phase-out periods. The U.S. Basel III rules were substantially phased in by January 1, 2019. The U.S. Basel III rules are complementary to the PCA rules.
The U.S. Basel III rules generally established more restrictive capital definitions, created additional categories and higher risk-weighting for certain asset classes and off-balance sheet exposures and higher leverage ratio and capital conservation buffers that will be added to the minimum capital requirements that must be met for banking organizations to avoid being subject to certain limitations on dividends and discretionary bonus payments to executive officers. The U.S. Basel III rules also implement higher minimum capital requirements. If the Bank fails to meet minimum capital requirements, the federal banking agencies can initiate certain discretionary and mandatory actions. Such regulatory actions could have a material effect on the Bank’s consolidated financial statements. The Bank constantly monitors its regulatory capital levels and, if necessary, may obtain capital from its parent company through BNPP or by other means.
The final Basel III Capital Rule updated the PCA framework to reflect new, higher regulatory capital minimums. This rule adjusts the definitions of well capitalized and adequately capitalized. In order to qualify as “well capitalized”, a bank must maintain a Tier 1 leverage ratio of at least 5.00%, a Common Equity Tier 1 capital ratio of at least 6.50%, a Tier 1 capital ratio of at least 8.00% and a total risk-based capital ratio of at least 10.00%. An “adequately capitalized” bank must maintain a Tier 1 leverage ratio of at least 4.00%, a Common Equity Tier 1 capital ratio of at least 4.50%, a Tier 1 capital ratio of at least 6.00% and a Total risk-based capital ratio of at least 8.00%.
Federal banking agencies retain the right to require a bank to maintain a higher capital level based on its particular risk profile. In addition, the Bank is required to maintain a “capital conservation buffer” consisting of at least 2.50% above each of the preceding “adequately capitalized” ratios. An institution that does not meet the “capital conservation buffer” will be subject to restrictions on certain activities including payment of dividends, stock repurchases and discretionary bonuses to executive officers. The “capital conservation buffer” is designed to absorb losses during periods of economic stress. The implementation of the capital conservation buffer began on January 1, 2016, at the 0.625% level and was phased in over a four-year period until it reached 2.50% on January 1, 2019. The Bank meets the required capital conservation buffer as of December 31, 2019.
At December 31, 2019, the Bank’s capital ratios continued to meet the regulatory capital category of “well capitalized” as defined by the FDIC’s PCA rules.
The following table presents the capital ratios in accordance with the U.S. Basel III rules as of December 31, 2019 and 2018:
To be Well Capitalized For Capital Under Prompt Corrective Under Basel III Adequacy Purposes Action Provisions
(dollars in thousands) 2019 2018 2019 2018 2019 2018 Regulatory capital:
Common equity tier 1 $ 8,766,079 $ 8,511,518 Tier 1 8,779,039 8,525,715 Total 9,431,454 9,183,757
Assets: Risk-weighted $71,014,341 $69,578,752 Adjusted average 87,699,690 83,542,973
Ratios: Common Equity Tier 1 capital to risk-weighted assets 12.34% 12.23% 4.50% 4.50 % 6.50% 6.50%Tier 1 capital to risk-weighted assets 12.36 12.25 6.00 6.00 8.00 8.00 Total capital to risk-weighted assets 13.28 13.20 8.00 8.00 10.00 10.00 Tier 1 leverage ratio(1) 10.01 10.21 4.00 4.00 5.00 5.00
(1) The leverage ratio consists of a ratio of Tier 1 capital to adjusted average assets, excluding goodwill and certain other items.
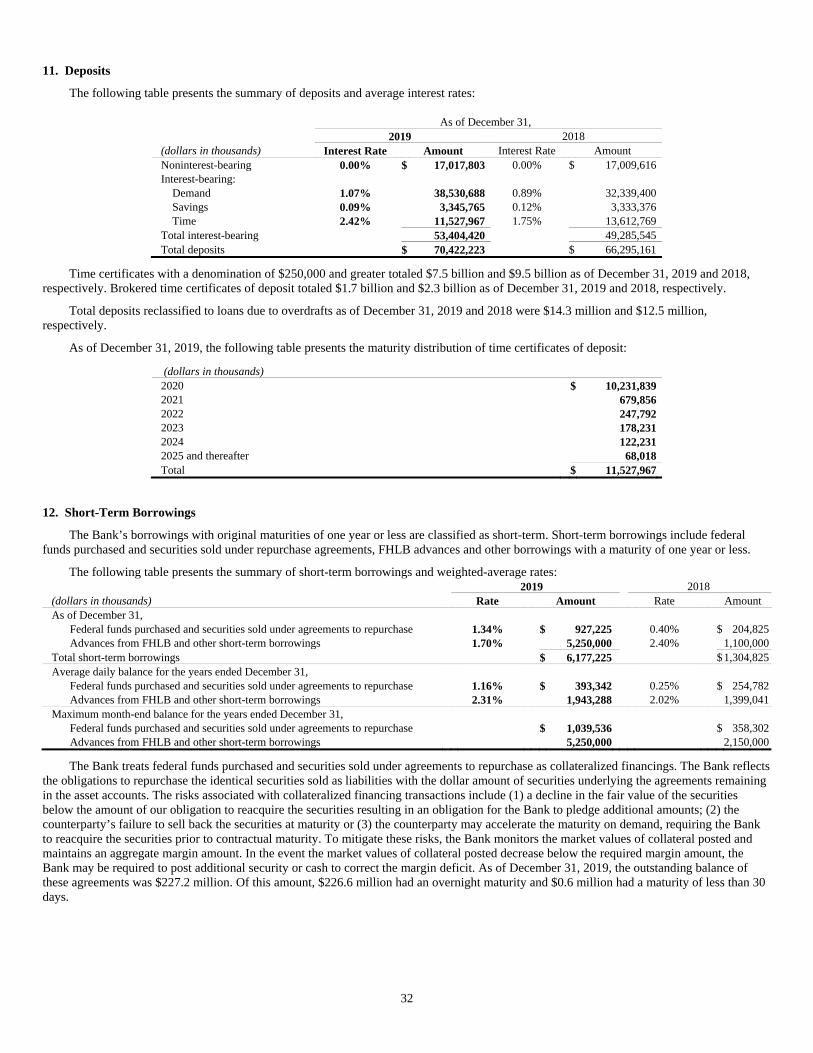
32
11. Deposits
The following table presents the summary of deposits and average interest rates:
As of December 31, 2019 2018
(dollars in thousands) Interest Rate Amount Interest Rate Amount Noninterest-bearing 0.00% $ 17,017,803 0.00% $ 17,009,616 Interest-bearing: Demand 1.07% 38,530,688 0.89% 32,339,400 Savings 0.09% 3,345,765 0.12% 3,333,376 Time 2.42% 11,527,967 1.75% 13,612,769 Total interest-bearing 53,404,420 49,285,545 Total deposits $ 70,422,223 $ 66,295,161
Time certificates with a denomination of $250,000 and greater totaled $7.5 billion and $9.5 billion as of December 31, 2019 and 2018, respectively. Brokered time certificates of deposit totaled $1.7 billion and $2.3 billion as of December 31, 2019 and 2018, respectively.
Total deposits reclassified to loans due to overdrafts as of December 31, 2019 and 2018 were $14.3 million and $12.5 million, respectively.
As of December 31, 2019, the following table presents the maturity distribution of time certificates of deposit:
(dollars in thousands) 2020 $ 10,231,839 2021 679,856 2022 247,792 2023 178,231 2024 122,231 2025 and thereafter 68,018 Total $ 11,527,967
12. Short-Term Borrowings
The Bank’s borrowings with original maturities of one year or less are classified as short-term. Short-term borrowings include federal funds purchased and securities sold under repurchase agreements, FHLB advances and other borrowings with a maturity of one year or less.
The following table presents the summary of short-term borrowings and weighted-average rates: 2019 2018
(dollars in thousands) Rate Amount Rate Amount As of December 31,
Federal funds purchased and securities sold under agreements to repurchase 1.34% $ 927,225 0.40% $ 204,825Advances from FHLB and other short-term borrowings 1.70% 5,250,000 2.40% 1,100,000
Total short-term borrowings $ 6,177,225 $1,304,825Average daily balance for the years ended December 31,
Federal funds purchased and securities sold under agreements to repurchase 1.16% $ 393,342 0.25% $ 254,782Advances from FHLB and other short-term borrowings 2.31% 1,943,288 2.02% 1,399,041
Maximum month-end balance for the years ended December 31, Federal funds purchased and securities sold under agreements to repurchase $ 1,039,536 $ 358,302Advances from FHLB and other short-term borrowings 5,250,000 2,150,000
The Bank treats federal funds purchased and securities sold under agreements to repurchase as collateralized financings. The Bank reflects the obligations to repurchase the identical securities sold as liabilities with the dollar amount of securities underlying the agreements remaining in the asset accounts. The risks associated with collateralized financing transactions include (1) a decline in the fair value of the securities below the amount of our obligation to reacquire the securities resulting in an obligation for the Bank to pledge additional amounts; (2) the counterparty’s failure to sell back the securities at maturity or (3) the counterparty may accelerate the maturity on demand, requiring the Bank to reacquire the securities prior to contractual maturity. To mitigate these risks, the Bank monitors the market values of collateral posted and maintains an aggregate margin amount. In the event the market values of collateral posted decrease below the required margin amount, the Bank may be required to post additional security or cash to correct the margin deficit. As of December 31, 2019, the outstanding balance of these agreements was $227.2 million. Of this amount, $226.6 million had an overnight maturity and $0.6 million had a maturity of less than 30 days.
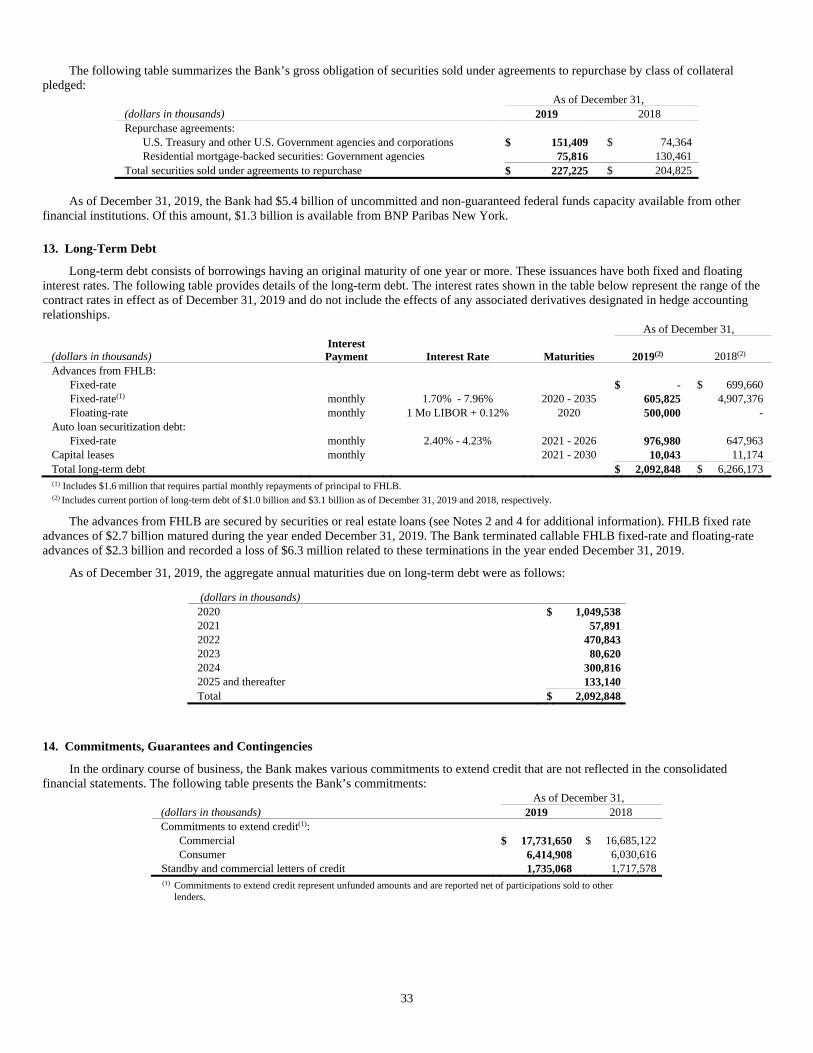
33
The following table summarizes the Bank’s gross obligation of securities sold under agreements to repurchase by class of collateral pledged:
As of December 31, (dollars in thousands) 2019 2018 Repurchase agreements:
U.S. Treasury and other U.S. Government agencies and corporations $ 151,409 $ 74,364 Residential mortgage-backed securities: Government agencies 75,816 130,461
Total securities sold under agreements to repurchase $ 227,225 $ 204,825
As of December 31, 2019, the Bank had $5.4 billion of uncommitted and non-guaranteed federal funds capacity available from other
financial institutions. Of this amount, $1.3 billion is available from BNP Paribas New York.
13. Long-Term Debt
Long-term debt consists of borrowings having an original maturity of one year or more. These issuances have both fixed and floating interest rates. The following table provides details of the long-term debt. The interest rates shown in the table below represent the range of the contract rates in effect as of December 31, 2019 and do not include the effects of any associated derivatives designated in hedge accounting relationships.
As of December 31,
(dollars in thousands) Interest Payment Interest Rate Maturities 2019(2) 2018(2)
Advances from FHLB: Fixed-rate $ - $ 699,660 Fixed-rate(1) monthly 1.70% - 7.96% 2020 - 2035 605,825 4,907,376 Floating-rate monthly 1 Mo LIBOR + 0.12% 2020 500,000 -
Auto loan securitization debt: Fixed-rate monthly 2.40% - 4.23% 2021 - 2026 976,980 647,963
Capital leases monthly 2021 - 2030 10,043 11,174 Total long-term debt $ 2,092,848 $ 6,266,173 (1) Includes $1.6 million that requires partial monthly repayments of principal to FHLB. (2) Includes current portion of long-term debt of $1.0 billion and $3.1 billion as of December 31, 2019 and 2018, respectively.
The advances from FHLB are secured by securities or real estate loans (see Notes 2 and 4 for additional information). FHLB fixed rate advances of $2.7 billion matured during the year ended December 31, 2019. The Bank terminated callable FHLB fixed-rate and floating-rate advances of $2.3 billion and recorded a loss of $6.3 million related to these terminations in the year ended December 31, 2019.
As of December 31, 2019, the aggregate annual maturities due on long-term debt were as follows:
(dollars in thousands)
2020 $ 1,049,538 2021 57,891 2022 470,843 2023 80,620 2024 300,816 2025 and thereafter 133,140 Total $ 2,092,848
14. Commitments, Guarantees and Contingencies
In the ordinary course of business, the Bank makes various commitments to extend credit that are not reflected in the consolidated financial statements. The following table presents the Bank’s commitments:
As of December 31, (dollars in thousands) 2019 2018 Commitments to extend credit(1):
Commercial $ 17,731,650 $ 16,685,122 Consumer 6,414,908 6,030,616
Standby and commercial letters of credit 1,735,068 1,717,578
(1) Commitments to extend credit represent unfunded amounts and are reported net of participations sold to other lenders.

34
Commitments to extend credit
A commitment to extend credit is a legally binding agreement to lend funds to a customer for a specified purpose with fixed expiration dates and generally requires a fee. The extension of a commitment gives rise to credit risk. The actual liquidity requirements or credit risk that the Bank will experience will be lower than the total contractual amount of commitments to extend credit, because a significant portion of those commitments are expected to expire without being drawn upon by the customer. Additionally, certain commitments are subject to loan agreements containing covenants regarding the financial performance obligations a customer must meet before the Bank is required to fund the commitment. For our consumer loan commitments, the Bank may reduce or cancel such commitments as legally permitted.
The Bank further manages the potential credit risk in commitments to extend credit by limiting the total amount of arrangements, both by individual customer and in aggregate, by monitoring the size and maturity structure of these portfolios and by applying the same credit standards maintained for all of its related credit activities.
Standby and commercial letters of credit
Standby letters of credit represent guarantees issued on behalf of customers in connection with contracts between the customers and third parties. These are conditional commitments in which the Bank assures that the third party will receive specified funds if a customer fails to meet its contractual obligations. The liquidity requirement and subsequent credit risk to the Bank arises from its obligation to make payment in the event of a customer’s contractual default. The commitments outstanding as of December 31, 2019 have maturities ranging from January 1, 2020 to November 1, 2027. In connection with the issuance of such commitments, fees are charged and recognized as income when they are earned.
The Bank has rental commitments under capital and non-cancelable operating lease agreements. See Note 7 for additional information.
Litigation
In the course of normal business, the Bank is subject to asserted and unasserted legal actions, which may seek substantial relief or damages. While the Bank is unable to predict whether the outcome of such actions will materially affect our results of operations for a particular period, based upon consultation with counsel, management does not expect that the aggregate liability, if any, resulting from these proceedings would have a material effect on the Bank’s consolidated balance sheets, consolidated statements of income or liquidity.
15. Derivative Financial Instruments
The Bank enters into derivative contracts primarily to manage its interest rate risk, as well as for customer accommodation purposes. The derivatives are recognized on the consolidated balance sheets either as assets or liabilities at fair value. Derivatives can be measured in terms of their notional amounts, but this amount is not recorded in the consolidated balance sheets and is not, when viewed in isolation, a meaningful measure of the risk profile of the instruments. The notional amount is not exchanged, but is used only as the basis on which interest and other payments are determined.
Credit and market risks are inherent in derivative instruments. Credit risk is defined as the possibility that a loss may occur from the failure of another party to perform in accordance with the terms of the contract, which exceeds the value of the existing collateral, if any. Market risk is defined as the risk of loss arising from an adverse change in the market value of the derivative instrument caused by fluctuations in market prices or rates.

35
The following table summarizes information on derivative notional or contract amounts, receivables (asset derivatives) and payables (liability derivatives) by accounting designation and contract types:
As of December 31, 2019 2018
Fair Value(1) Fair Value(1)
Notional or Notional or Contract Asset Liability Contract Asset Liability
(dollars in thousands) Amount Derivatives Derivatives Amount Derivatives Derivatives Derivatives designated as hedging instruments:
Fair value hedges: Interest rate contracts $ - $ - $ - $ - $ - $ -
Cash flow hedges: Interest rate contracts 4,350,000 147 716 4,529,506 1,760 1,053
Total derivatives designated as hedging instruments 4,350,000 147 716 4,529,506 1,760 1,053 Derivatives not designated as hedging instruments: Free-standing derivatives:
Interest rate contracts(2) 14,201,278 218,534 41,570 12,448,320 75,829 81,324 Equity derivatives 142,689 - 15,122 - - - Market-linked swaps and options(3) 1,534,380 79,949 79,949 1,671,826 41,839 41,839 Foreign exchange contracts 921,591 4,639 3,339 601,131 5,217 3,497
Total derivatives not designated as hedging instruments 16,799,938 303,122 139,980 14,721,277 122,885 126,660 Total derivatives before netting 21,149,938 303,269 140,696 19,250,783 124,645 127,713 Netting - (25,020) (25,020) - (17,483) (17,483)Total derivatives after netting $ 21,149,938 $ 278,249 $ 115,676 $ 19,250,783 $ 107,162 $ 110,230
(1) Asset derivatives and liability derivatives are recorded in other assets and other liabilities, respectively, in the consolidated balance sheets. (2) Includes derivatives related to mortgage sale activity with notional amount of $244.8 million and $89.0 million as of December 31, 2019 and 2018, respectively. The fair value of
asset derivatives was $2.3 million and $0.9 million and fair value of liability derivative was $0.3 million and $0.4 million as of December 31, 2019 and 2018, respectively. (3) Includes bifurcated derivatives embedded in market-linked instruments. The asset derivatives represent purchased options and the liability derivatives represent written market-
linked options.
Fair value hedges
The Bank uses interest rate swap contracts to hedge changes in fair value from interest rate changes of underlying fixed-rate FHLB advances. The Bank did not enter into fair value hedges during the year ended December 31, 2019.
The following table shows the effect of fair value hedging on the Bank’s pre-tax income:
Years Ended December 31, (dollars in thousands) 2019 2018 Gains (losses) recorded in net interest income $ - $ (1,443)Gains (losses) recorded in noninterest income:
Recognized on derivatives - 925 Recognized on hedged items (340 ) (1,035)Recognized as ineffective portion $ (340 ) $ (110)
Total $ (340 ) $ (1,553)
Cash flow hedges
Interest rate swap contracts are used to hedge the forecasted cash flows of underlying floating-rate loans. Changes in the fair values of derivatives designated as cash flow hedges are recorded in AOCI until income from the cash flows of the hedged items is realized. As of December 31, 2019, the weighted-average remaining life of the currently active cash flow hedge was approximately 2.0 years.
The following table shows the impact of cash flow hedging on the Bank’s pre-tax, OCI and net income:
Years Ended December 31, (dollars in thousands) 2019 2018 Net unrealized gain (loss) recognized in OCI $ 22,273 $ (101,426)Net loss reclassified from AOCI to net income 87,536 41,388
The estimated amount to be reclassified from AOCI into interest income during the next 12 months is a loss of $79.2 million. This amount could differ from amounts actually realized due to changes in interest rates and the addition of other hedges subsequent to December 31, 2019.
Free-standing derivatives
Free-standing derivative instruments include derivative transactions entered into for purposes for which hedge accounting does not apply. These derivatives include interest rate swaps, interest rate collars, interest rate floors, market-linked swaps and purchased options, written market-linked options, forward commitments to fund and sell residential mortgage loans and a funding swap. The Bank acts as a seller and
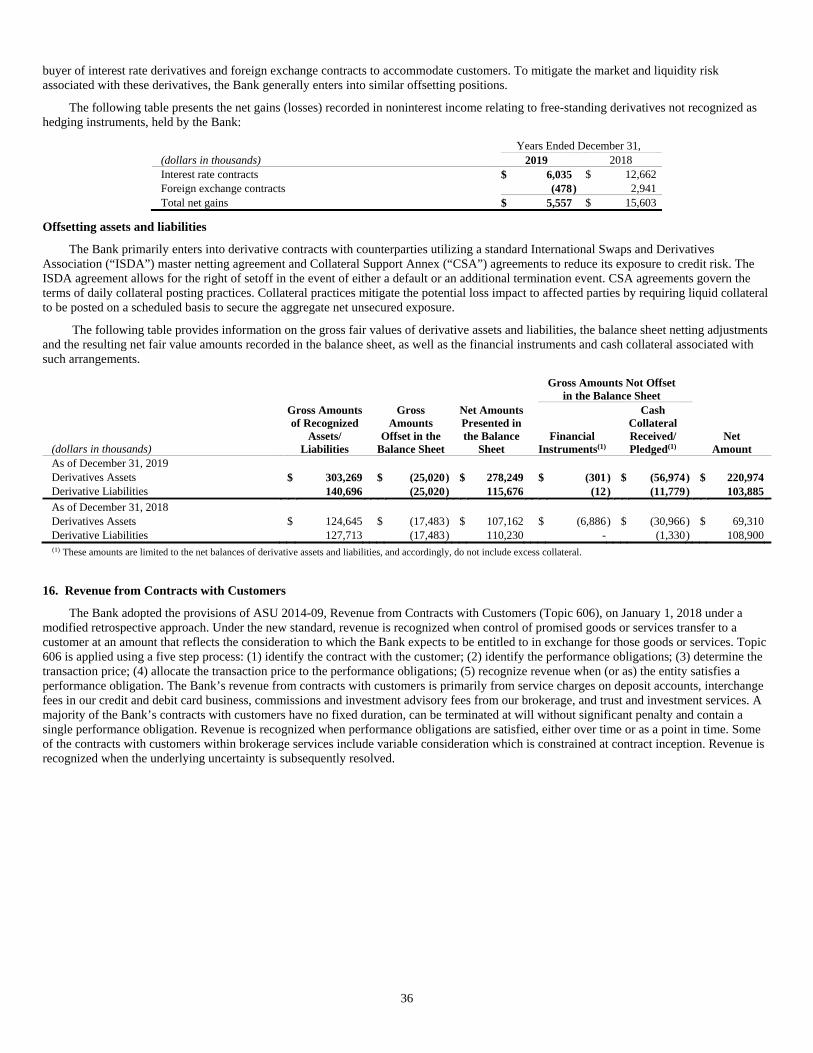
36
buyer of interest rate derivatives and foreign exchange contracts to accommodate customers. To mitigate the market and liquidity risk associated with these derivatives, the Bank generally enters into similar offsetting positions.
The following table presents the net gains (losses) recorded in noninterest income relating to free-standing derivatives not recognized as hedging instruments, held by the Bank:
Years Ended December 31, (dollars in thousands) 2019 2018 Interest rate contracts $ 6,035 $ 12,662 Foreign exchange contracts (478 ) 2,941 Total net gains $ 5,557 $ 15,603
Offsetting assets and liabilities
The Bank primarily enters into derivative contracts with counterparties utilizing a standard International Swaps and Derivatives Association (“ISDA”) master netting agreement and Collateral Support Annex (“CSA”) agreements to reduce its exposure to credit risk. The ISDA agreement allows for the right of setoff in the event of either a default or an additional termination event. CSA agreements govern the terms of daily collateral posting practices. Collateral practices mitigate the potential loss impact to affected parties by requiring liquid collateral to be posted on a scheduled basis to secure the aggregate net unsecured exposure.
The following table provides information on the gross fair values of derivative assets and liabilities, the balance sheet netting adjustments and the resulting net fair value amounts recorded in the balance sheet, as well as the financial instruments and cash collateral associated with such arrangements.
Gross Amounts Not Offset
in the Balance Sheet
(dollars in thousands)
Gross Amountsof Recognized
Assets/ Liabilities
Gross Amounts
Offset in theBalance Sheet
Net AmountsPresented inthe Balance
Sheet Financial
Instruments(1)
CashCollateral Received/ Pledged(1)
Net Amount
As of December 31, 2019 Derivatives Assets $ 303,269 $ (25,020) $ 278,249 $ (301 ) $ (56,974) $ 220,974 Derivative Liabilities 140,696 (25,020) 115,676 (12 ) (11,779) 103,885
As of December 31, 2018 Derivatives Assets $ 124,645 $ (17,483) $ 107,162 $ (6,886 ) $ (30,966) $ 69,310 Derivative Liabilities 127,713 (17,483) 110,230 - (1,330) 108,900
(1) These amounts are limited to the net balances of derivative assets and liabilities, and accordingly, do not include excess collateral.
16. Revenue from Contracts with Customers
The Bank adopted the provisions of ASU 2014-09, Revenue from Contracts with Customers (Topic 606), on January 1, 2018 under a modified retrospective approach. Under the new standard, revenue is recognized when control of promised goods or services transfer to a customer at an amount that reflects the consideration to which the Bank expects to be entitled to in exchange for those goods or services. Topic 606 is applied using a five step process: (1) identify the contract with the customer; (2) identify the performance obligations; (3) determine the transaction price; (4) allocate the transaction price to the performance obligations; (5) recognize revenue when (or as) the entity satisfies a performance obligation. The Bank’s revenue from contracts with customers is primarily from service charges on deposit accounts, interchange fees in our credit and debit card business, commissions and investment advisory fees from our brokerage, and trust and investment services. A majority of the Bank’s contracts with customers have no fixed duration, can be terminated at will without significant penalty and contain a single performance obligation. Revenue is recognized when performance obligations are satisfied, either over time or as a point in time. Some of the contracts with customers within brokerage services include variable consideration which is constrained at contract inception. Revenue is recognized when the underlying uncertainty is subsequently resolved.

37
Disaggregation of revenue
The Bank’s total revenue comprises of net interest income on financial instruments and noninterest income. Net interest income is recognized in accordance with the applicable guidance in GAAP and is out of scope of Topic 606. The following table summarizes the Bank’s total revenues disaggregated by revenue streams:
Year Ended December 31, (dollars in thousands) 2019 2018 Net interest income(1) $ 2,283,828 $ 2,334,105 Noninterest income:
Revenue from contracts with customers: Services charges on deposit accounts 151,664 146,244 Credit and debit card fees 127,952 118,841 Brokerage income 41,056 38,994 Trust and investment services income 23,899 25,207 Other service charges and fees 45,978 28,608
Total noninterest income from contacts with customers 390,549 357,894 Other noninterest income(2) 170,751 169,464
Total noninterest income $ 561,300 $ 527,358
(1) Net interest income is excluded from the scope of Topic 606. (2) Other noninterest income earned outside of Topic 606.
The following is a discussion of revenues within the scope of Topic 606.
Service charges on deposit accounts
Service charges on deposit accounts relate to fees generated from a variety of deposit products and services, such as online banking or wire transfer, rendered to customers. The consideration received may be fixed or transactional and include, but are not limited to, overdraft fees, non-sufficient fund fees, dormant fees and monthly service charges. The Bank’s execution of the services related to these fees represents its performance obligation. Fees are recognized as the services are provided to the customers, either over time or at a point in time.
Credit and debit card fees
Credit and debit card fees primarily represent revenues earned from interchange on credit and debit card transactions conducted with payment networks. Included in credit and debit card fees are merchant relationship referral revenues. The Bank recognizes the interchange revenues for services performed related to authorization and settlement of a cardholder’s transaction when a cardholder’s transaction is approved and settled. Merchant relationship referral revenues consist of fixed and variable consideration. Fixed consideration is recognized concurrently with the delivery of referral services. Variable consideration is included in the transaction price to the extent that it is probable that a significant reversal in the amount of cumulative revenue recognized will not occur. Variable consideration is based on the number of merchant referrals as well as the frequency of transactions processed over the contract period. Given that it is highly dependent on factors outside the Bank’s influence it is constrained at contract inception and is recognized as revenue when the uncertainty is subsequently resolved.
Brokerage income
The Bank, through its subsidiary BancWest Investment Services, Inc. provides brokerage services to retail customers on a range of investments including equities, mutual funds, options, fixed income and insurance products. For this service, the Bank earns commission and asset-based revenue. Commission revenue is based on investment or product type and is recognized upon trade execution. Asset-based revenue is variable and is determined based on the asset value at a point in time. Asset-based revenue is constrained until the asset value is known and the revenue can be determined. In addition, the Bank also earns investment advisory fees for advice and portfolio management. Investment advisory fees are determined based on the customers’ average daily asset balance and are recognized over the period when the related services are performed.
Trust and investment services income
The Bank offers trust administration, death settlement, investment advisory and other comparable services to legally qualifying trusts. For these services, the Bank earns trust and investment services fees which are variable as they are based upon assets under management (“AUM”) or income produced under the portfolio. Trust investment services fees, subject to market conditions and asset inflows and outflows are constrained until actual AUM and income produced are known or can be estimated. The Bank recognizes trust investment services fees over the period services are provided.
Other service charges and fees
Other fees primarily include revenues generated from ATM fees charged to non-bank customers, wire transfers, lockboxes, bank issuance of checks and insurance commissions. Such fees are recognized when the services are provided.

38
Contract balances
A contract asset is the right to consideration for transferred goods or services when the amount is conditioned on something other than the passage of time. A contract liability is the Bank’s obligation to transfer goods or services to a customer for which the Bank has received consideration from customer. As of December 31, 2019, there were no material contract liabilities on the Bank’s consolidated balance sheets.
Other
The Bank also did not have any material capitalizable costs to obtain or costs to fulfill a contract or use any significant judgments or estimates in recognizing revenue for financial reporting purposes.
17. Fair Value
The Bank determines the fair value of certain assets and liabilities based on the fair value hierarchy established under applicable accounting guidance, which requires an entity to maximize the use of observable inputs and minimize the use of unobservable inputs when performing fair value measurement.
Recurring fair value measurements:
The Bank measures certain financial instruments at fair value on a recurring basis. These instruments are primarily securities available for sale and derivatives. The Bank has an organized and established process for determining and reviewing recurring fair value measurements reported in our consolidated financial statements. The fair value of assets and liabilities is determined using several methods including third-party pricing services or internally-developed models in accordance with the Bank’s policy.
The fair value measurements are reviewed to ensure they are reasonable and in line with market experience in similar asset classes. For example, we perform one or more of the following procedures to validate the fair value measurement:
• Corroborate pricing by reference to other independent market data such as broker quotes, market transactions and relevant benchmark indices;
• Review pricing by Bank personnel familiar with market liquidity and other market-related conditions;
• Compare to other pricing vendors (if available); and
• Challenge vendor pricing and investigate prices on a specific instrument-by-instrument basis
The following is a description of valuation methodologies used for assets and liabilities recorded at fair value on a recurring basis; as well as, the general classification of such assets and liabilities pursuant to the valuation hierarchy.
Trading assets
Trading assets consist of U.S. Treasury securities. The trading assets are classified as Level 1 and fair value is determined using quoted market prices (unadjusted) in active markets for identical securities.
Securities
The Bank has an Impairment and Valuation Steering Committee (“IVSC”) to oversee its valuation framework for measuring the fair value of available for sale securities. The Bank utilizes third-party pricing services in determining the fair value of substantially all securities. IVSC consists of senior executive management and other relevant employees who meet on a quarterly basis and monitor the use of pricing sources and pricing leveling. In addition, a cross-functional team comprised of representatives from our Treasury and Risk groups, reviews and approves the fair value measurements on a monthly basis. This management team also analyzes changes in fair value from period to period.
Securities classified as Level 1 are priced using quoted market prices (unadjusted) in active markets for identical securities, and consist of U.S. Treasury securities. When quoted market prices are not available, fair values are classified as Level 2 using quoted prices for similar assets in markets that are either active or not active and through model-based techniques in which all significant inputs are observable for the asset, either directly or indirectly, for substantially the full term of the financial instrument. Examples of such instruments include agency mortgage-backed securities and municipal securities.
If relevant market prices are limited or unavailable, fair value measurements may require use of significant unobservable inputs, in which case the fair values are classified as Level 3. Level 3 securities primarily consist of Community Reinvestment Act (“CRA”) bonds, which are categorized within states and political subdivisions, and are valued using proprietary discounted cash flow models from a third-party service provider. The significant input to the valuation model is a bond yield, which consists of interest rate yield curves, credit spreads and liquidity spreads. This requires judgment due to the absence of available market prices and lack of liquidity. An increase or decrease in any of the factors that comprise the bond yields would result in lower or higher fair values for CRA bonds, respectively. Additionally, an equity certificate that is retained as part of the auto securitization transaction is classified as Level 3.
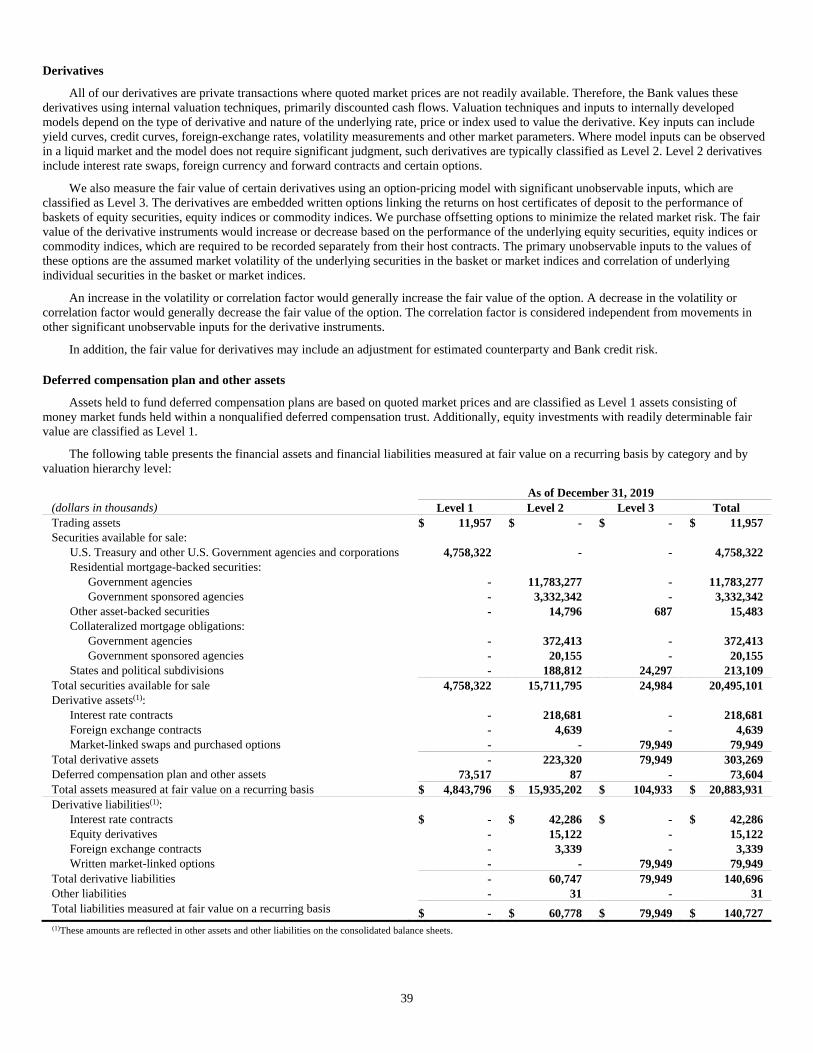
39
Derivatives
All of our derivatives are private transactions where quoted market prices are not readily available. Therefore, the Bank values these derivatives using internal valuation techniques, primarily discounted cash flows. Valuation techniques and inputs to internally developed models depend on the type of derivative and nature of the underlying rate, price or index used to value the derivative. Key inputs can include yield curves, credit curves, foreign-exchange rates, volatility measurements and other market parameters. Where model inputs can be observed in a liquid market and the model does not require significant judgment, such derivatives are typically classified as Level 2. Level 2 derivatives include interest rate swaps, foreign currency and forward contracts and certain options.
We also measure the fair value of certain derivatives using an option-pricing model with significant unobservable inputs, which are classified as Level 3. The derivatives are embedded written options linking the returns on host certificates of deposit to the performance of baskets of equity securities, equity indices or commodity indices. We purchase offsetting options to minimize the related market risk. The fair value of the derivative instruments would increase or decrease based on the performance of the underlying equity securities, equity indices or commodity indices, which are required to be recorded separately from their host contracts. The primary unobservable inputs to the values of these options are the assumed market volatility of the underlying securities in the basket or market indices and correlation of underlying individual securities in the basket or market indices.
An increase in the volatility or correlation factor would generally increase the fair value of the option. A decrease in the volatility or correlation factor would generally decrease the fair value of the option. The correlation factor is considered independent from movements in other significant unobservable inputs for the derivative instruments.
In addition, the fair value for derivatives may include an adjustment for estimated counterparty and Bank credit risk.
Deferred compensation plan and other assets
Assets held to fund deferred compensation plans are based on quoted market prices and are classified as Level 1 assets consisting of money market funds held within a nonqualified deferred compensation trust. Additionally, equity investments with readily determinable fair value are classified as Level 1.
The following table presents the financial assets and financial liabilities measured at fair value on a recurring basis by category and by valuation hierarchy level:
As of December 31, 2019 (dollars in thousands) Level 1 Level 2 Level 3 Total Trading assets $ 11,957 $ - $ - $ 11,957Securities available for sale:
U.S. Treasury and other U.S. Government agencies and corporations 4,758,322 - - 4,758,322Residential mortgage-backed securities:
Government agencies - 11,783,277 - 11,783,277Government sponsored agencies - 3,332,342 - 3,332,342
Other asset-backed securities - 14,796 687 15,483Collateralized mortgage obligations:
Government agencies - 372,413 - 372,413Government sponsored agencies - 20,155 - 20,155
States and political subdivisions - 188,812 24,297 213,109Total securities available for sale 4,758,322 15,711,795 24,984 20,495,101Derivative assets(1):
Interest rate contracts - 218,681 - 218,681Foreign exchange contracts - 4,639 - 4,639Market-linked swaps and purchased options - - 79,949 79,949
Total derivative assets - 223,320 79,949 303,269Deferred compensation plan and other assets 73,517 87 - 73,604Total assets measured at fair value on a recurring basis $ 4,843,796 $ 15,935,202 $ 104,933 $ 20,883,931Derivative liabilities(1):
Interest rate contracts $ - $ 42,286 $ - $ 42,286Equity derivatives - 15,122 - 15,122Foreign exchange contracts - 3,339 - 3,339Written market-linked options - - 79,949 79,949
Total derivative liabilities - 60,747 79,949 140,696Other liabilities - 31 - 31Total liabilities measured at fair value on a recurring basis $ - $ 60,778 $ 79,949 $ 140,727 (1)These amounts are reflected in other assets and other liabilities on the consolidated balance sheets.
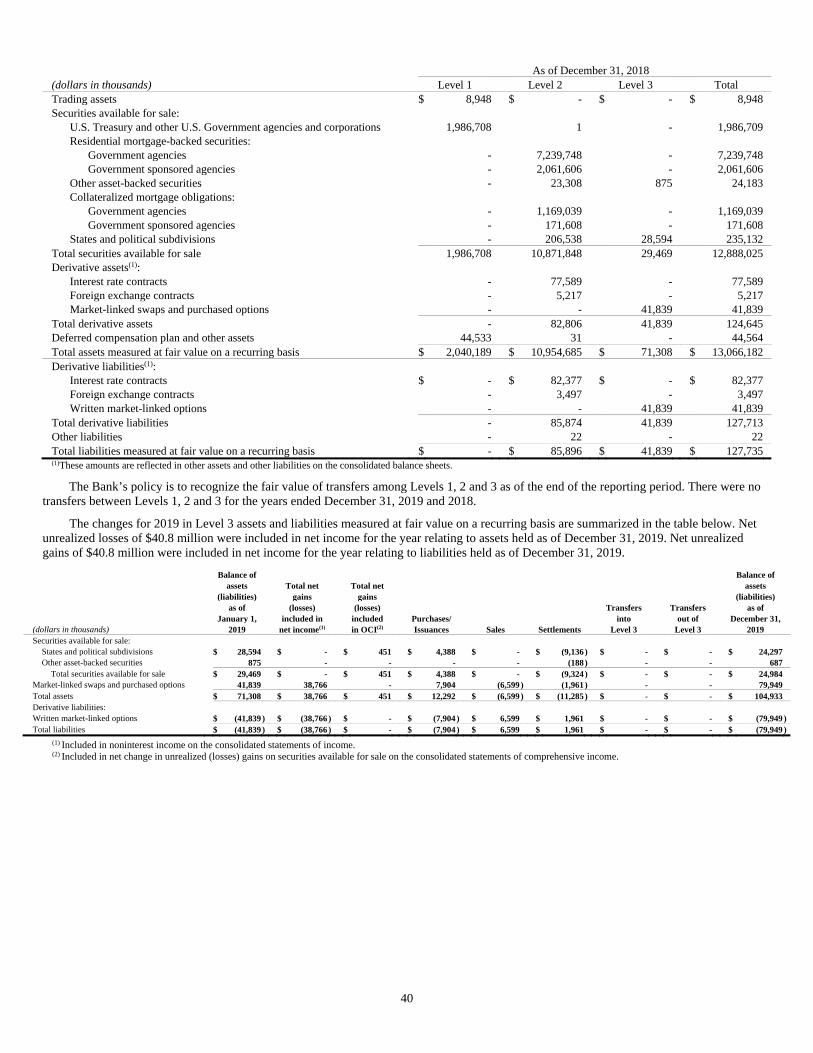
40
As of December 31, 2018 (dollars in thousands) Level 1 Level 2 Level 3 Total Trading assets $ 8,948 $ - $ - $ 8,948 Securities available for sale:
U.S. Treasury and other U.S. Government agencies and corporations 1,986,708 1 - 1,986,709 Residential mortgage-backed securities:
Government agencies - 7,239,748 - 7,239,748 Government sponsored agencies - 2,061,606 - 2,061,606
Other asset-backed securities - 23,308 875 24,183 Collateralized mortgage obligations:
Government agencies - 1,169,039 - 1,169,039 Government sponsored agencies - 171,608 - 171,608
States and political subdivisions - 206,538 28,594 235,132 Total securities available for sale 1,986,708 10,871,848 29,469 12,888,025 Derivative assets(1):
Interest rate contracts - 77,589 - 77,589 Foreign exchange contracts - 5,217 - 5,217 Market-linked swaps and purchased options - - 41,839 41,839
Total derivative assets - 82,806 41,839 124,645 Deferred compensation plan and other assets 44,533 31 - 44,564 Total assets measured at fair value on a recurring basis $ 2,040,189 $ 10,954,685 $ 71,308 $ 13,066,182 Derivative liabilities(1):
Interest rate contracts $ - $ 82,377 $ - $ 82,377 Foreign exchange contracts - 3,497 - 3,497 Written market-linked options - - 41,839 41,839
Total derivative liabilities - 85,874 41,839 127,713 Other liabilities - 22 - 22 Total liabilities measured at fair value on a recurring basis $ - $ 85,896 $ 41,839 $ 127,735 (1)These amounts are reflected in other assets and other liabilities on the consolidated balance sheets.
The Bank’s policy is to recognize the fair value of transfers among Levels 1, 2 and 3 as of the end of the reporting period. There were no transfers between Levels 1, 2 and 3 for the years ended December 31, 2019 and 2018.
The changes for 2019 in Level 3 assets and liabilities measured at fair value on a recurring basis are summarized in the table below. Net unrealized losses of $40.8 million were included in net income for the year relating to assets held as of December 31, 2019. Net unrealized gains of $40.8 million were included in net income for the year relating to liabilities held as of December 31, 2019.
Balance of Balance of assets Total net Total net assets (liabilities) gains gains (liabilities) as of (losses) (losses) Transfers Transfers as of January 1, included in included Purchases/ into out of December 31,
(dollars in thousands) 2019 net income(1) in OCI(2) Issuances Sales Settlements Level 3 Level 3 2019
Securities available for sale: States and political subdivisions $ 28,594 $ - $ 451 $ 4,388 $ - $ (9,136 ) $ - $ - $ 24,297 Other asset-backed securities 875 - - - - (188 ) - - 687
Total securities available for sale $ 29,469 $ - $ 451 $ 4,388 $ - $ (9,324 ) $ - $ - $ 24,984 Market-linked swaps and purchased options 41,839 38,766 - 7,904 (6,599 ) (1,961 ) - - 79,949 Total assets $ 71,308 $ 38,766 $ 451 $ 12,292 $ (6,599 ) $ (11,285 ) $ - $ - $ 104,933 Derivative liabilities: Written market-linked options $ (41,839 ) $ (38,766 ) $ - $ (7,904 ) $ 6,599 $ 1,961 $ - $ - $ (79,949 )Total liabilities $ (41,839 ) $ (38,766 ) $ - $ (7,904 ) $ 6,599 $ 1,961 $ - $ - $ (79,949 )
(1) Included in noninterest income on the consolidated statements of income. (2) Included in net change in unrealized (losses) gains on securities available for sale on the consolidated statements of comprehensive income.
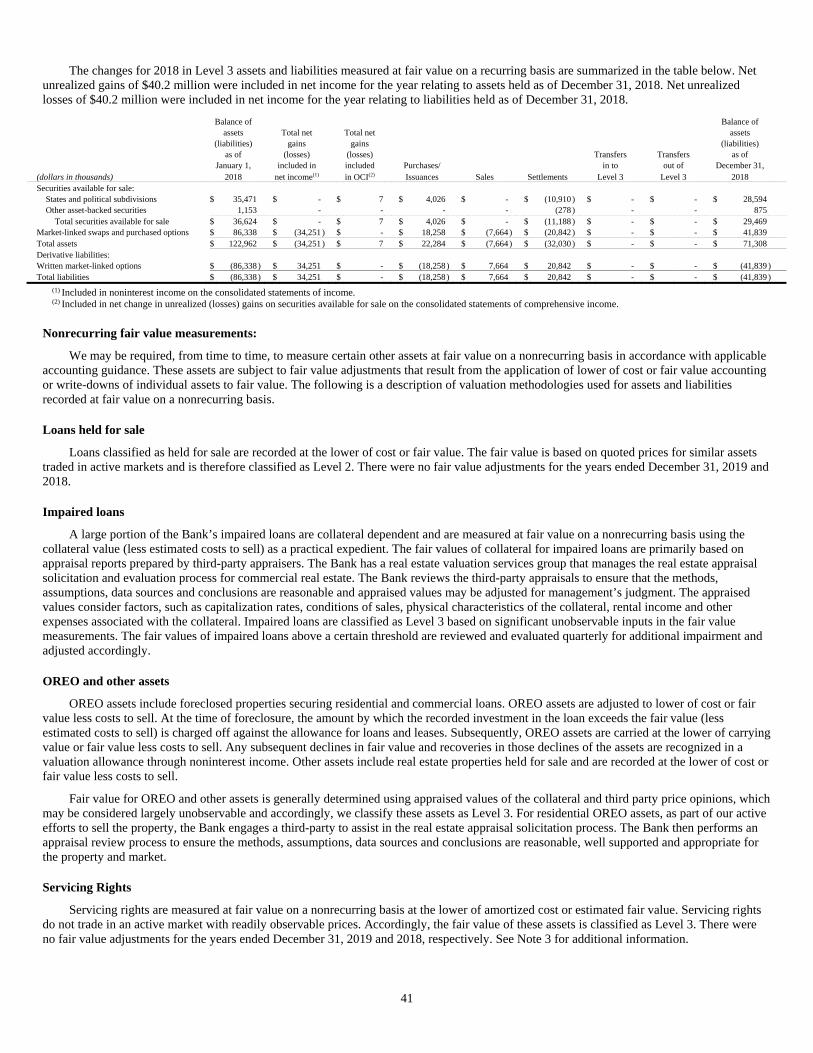
41
The changes for 2018 in Level 3 assets and liabilities measured at fair value on a recurring basis are summarized in the table below. Net unrealized gains of $40.2 million were included in net income for the year relating to assets held as of December 31, 2018. Net unrealized losses of $40.2 million were included in net income for the year relating to liabilities held as of December 31, 2018.
Balance of Balance of assets Total net Total net assets (liabilities) gains gains (liabilities) as of (losses) (losses) Transfers Transfers as of January 1, included in included Purchases/ in to out of December 31,
(dollars in thousands) 2018 net income(1) in OCI(2) Issuances Sales Settlements Level 3 Level 3 2018 Securities available for sale:
States and political subdivisions $ 35,471 $ - $ 7 $ 4,026 $ - $ (10,910 ) $ - $ - $ 28,594 Other asset-backed securities 1,153 - - - - (278 ) - - 875
Total securities available for sale $ 36,624 $ - $ 7 $ 4,026 $ - $ (11,188 ) $ - $ - $ 29,469 Market-linked swaps and purchased options $ 86,338 $ (34,251 ) $ - $ 18,258 $ (7,664) $ (20,842 ) $ - $ - $ 41,839 Total assets $ 122,962 $ (34,251 ) $ 7 $ 22,284 $ (7,664) $ (32,030 ) $ - $ - $ 71,308 Derivative liabilities: Written market-linked options $ (86,338 ) $ 34,251 $ - $ (18,258) $ 7,664 $ 20,842 $ - $ - $ (41,839 ) Total liabilities $ (86,338 ) $ 34,251 $ - $ (18,258) $ 7,664 $ 20,842 $ - $ - $ (41,839 )
(1) Included in noninterest income on the consolidated statements of income. (2) Included in net change in unrealized (losses) gains on securities available for sale on the consolidated statements of comprehensive income.
Nonrecurring fair value measurements:
We may be required, from time to time, to measure certain other assets at fair value on a nonrecurring basis in accordance with applicable accounting guidance. These assets are subject to fair value adjustments that result from the application of lower of cost or fair value accounting or write-downs of individual assets to fair value. The following is a description of valuation methodologies used for assets and liabilities recorded at fair value on a nonrecurring basis.
Loans held for sale
Loans classified as held for sale are recorded at the lower of cost or fair value. The fair value is based on quoted prices for similar assets traded in active markets and is therefore classified as Level 2. There were no fair value adjustments for the years ended December 31, 2019 and 2018.
Impaired loans
A large portion of the Bank’s impaired loans are collateral dependent and are measured at fair value on a nonrecurring basis using the collateral value (less estimated costs to sell) as a practical expedient. The fair values of collateral for impaired loans are primarily based on appraisal reports prepared by third-party appraisers. The Bank has a real estate valuation services group that manages the real estate appraisal solicitation and evaluation process for commercial real estate. The Bank reviews the third-party appraisals to ensure that the methods, assumptions, data sources and conclusions are reasonable and appraised values may be adjusted for management’s judgment. The appraised values consider factors, such as capitalization rates, conditions of sales, physical characteristics of the collateral, rental income and other expenses associated with the collateral. Impaired loans are classified as Level 3 based on significant unobservable inputs in the fair value measurements. The fair values of impaired loans above a certain threshold are reviewed and evaluated quarterly for additional impairment and adjusted accordingly.
OREO and other assets
OREO assets include foreclosed properties securing residential and commercial loans. OREO assets are adjusted to lower of cost or fair value less costs to sell. At the time of foreclosure, the amount by which the recorded investment in the loan exceeds the fair value (less estimated costs to sell) is charged off against the allowance for loans and leases. Subsequently, OREO assets are carried at the lower of carrying value or fair value less costs to sell. Any subsequent declines in fair value and recoveries in those declines of the assets are recognized in a valuation allowance through noninterest income. Other assets include real estate properties held for sale and are recorded at the lower of cost or fair value less costs to sell.
Fair value for OREO and other assets is generally determined using appraised values of the collateral and third party price opinions, which may be considered largely unobservable and accordingly, we classify these assets as Level 3. For residential OREO assets, as part of our active efforts to sell the property, the Bank engages a third-party to assist in the real estate appraisal solicitation process. The Bank then performs an appraisal review process to ensure the methods, assumptions, data sources and conclusions are reasonable, well supported and appropriate for the property and market.
Servicing Rights
Servicing rights are measured at fair value on a nonrecurring basis at the lower of amortized cost or estimated fair value. Servicing rights do not trade in an active market with readily observable prices. Accordingly, the fair value of these assets is classified as Level 3. There were no fair value adjustments for the years ended December 31, 2019 and 2018, respectively. See Note 3 for additional information.
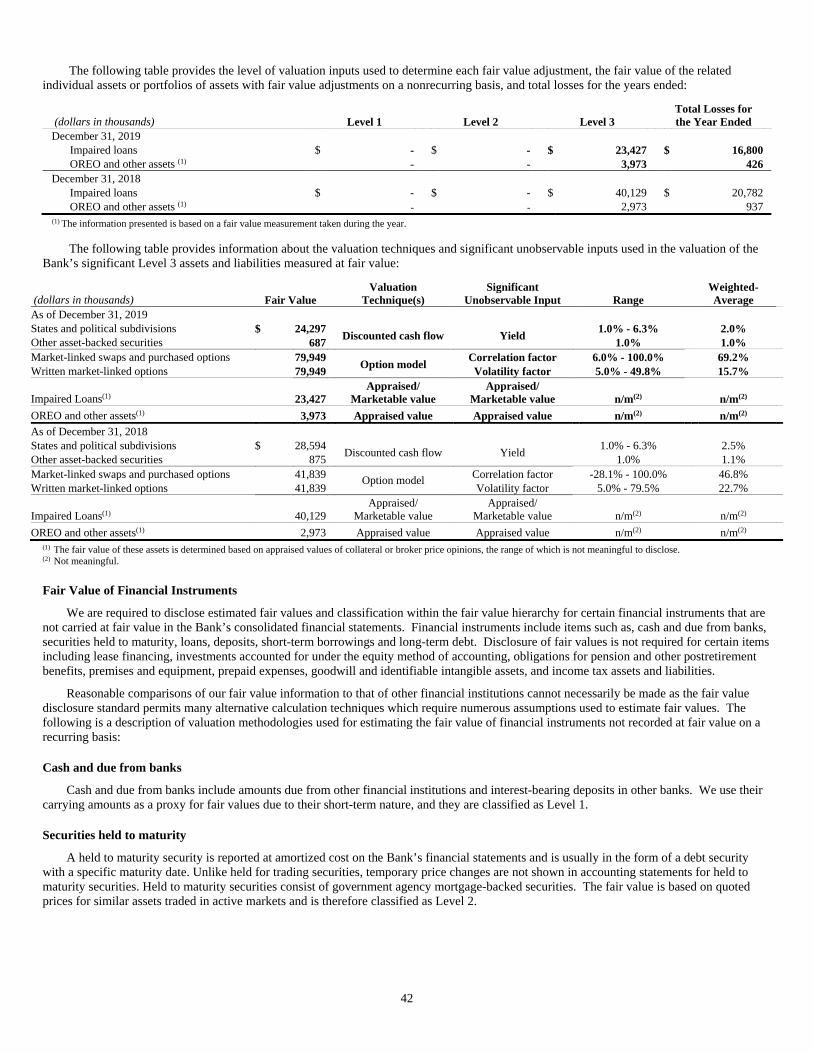
42
The following table provides the level of valuation inputs used to determine each fair value adjustment, the fair value of the related individual assets or portfolios of assets with fair value adjustments on a nonrecurring basis, and total losses for the years ended:
(dollars in thousands) Level 1 Level 2 Level 3 Total Losses for the Year Ended
December 31, 2019 Impaired loans $ - $ - $ 23,427 $ 16,800 OREO and other assets (1) - - 3,973 426
December 31, 2018 Impaired loans $ - $ - $ 40,129 $ 20,782 OREO and other assets (1) - - 2,973 937
(1) The information presented is based on a fair value measurement taken during the year.
The following table provides information about the valuation techniques and significant unobservable inputs used in the valuation of the Bank’s significant Level 3 assets and liabilities measured at fair value:
(dollars in thousands) Fair Value Valuation
Technique(s)Significant
Unobservable Input Range Weighted- Average
As of December 31, 2019 States and political subdivisions $ 24,297
Discounted cash flow Yield 1.0% - 6.3% 2.0%
Other asset-backed securities 687 1.0% 1.0% Market-linked swaps and purchased options 79,949
Option model Correlation factor 6.0% - 100.0% 69.2%
Written market-linked options 79,949 Volatility factor 5.0% - 49.8% 15.7%
Impaired Loans(1) 23,427 Appraised/
Marketable valueAppraised/
Marketable value n/m(2) n/m(2)
OREO and other assets(1) 3,973 Appraised value Appraised value n/m(2) n/m(2)
As of December 31, 2018 States and political subdivisions $ 28,594
Discounted cash flow Yield 1.0% - 6.3% 2.5%
Other asset-backed securities 875 1.0% 1.1% Market-linked swaps and purchased options 41,839 Option model Correlation factor -28.1% - 100.0% 46.8% Written market-linked options 41,839 Volatility factor 5.0% - 79.5% 22.7%
Impaired Loans(1) 40,129 Appraised/
Marketable valueAppraised/
Marketable value n/m(2) n/m(2)
OREO and other assets(1) 2,973 Appraised value Appraised value n/m(2) n/m(2)
(1) The fair value of these assets is determined based on appraised values of collateral or broker price opinions, the range of which is not meaningful to disclose. (2) Not meaningful.
Fair Value of Financial Instruments
We are required to disclose estimated fair values and classification within the fair value hierarchy for certain financial instruments that are not carried at fair value in the Bank’s consolidated financial statements. Financial instruments include items such as, cash and due from banks, securities held to maturity, loans, deposits, short-term borrowings and long-term debt. Disclosure of fair values is not required for certain items including lease financing, investments accounted for under the equity method of accounting, obligations for pension and other postretirement benefits, premises and equipment, prepaid expenses, goodwill and identifiable intangible assets, and income tax assets and liabilities.
Reasonable comparisons of our fair value information to that of other financial institutions cannot necessarily be made as the fair value disclosure standard permits many alternative calculation techniques which require numerous assumptions used to estimate fair values. The following is a description of valuation methodologies used for estimating the fair value of financial instruments not recorded at fair value on a recurring basis:
Cash and due from banks
Cash and due from banks include amounts due from other financial institutions and interest-bearing deposits in other banks. We use their carrying amounts as a proxy for fair values due to their short-term nature, and they are classified as Level 1.
Securities held to maturity
A held to maturity security is reported at amortized cost on the Bank’s financial statements and is usually in the form of a debt security with a specific maturity date. Unlike held for trading securities, temporary price changes are not shown in accounting statements for held to maturity securities. Held to maturity securities consist of government agency mortgage-backed securities. The fair value is based on quoted prices for similar assets traded in active markets and is therefore classified as Level 2.
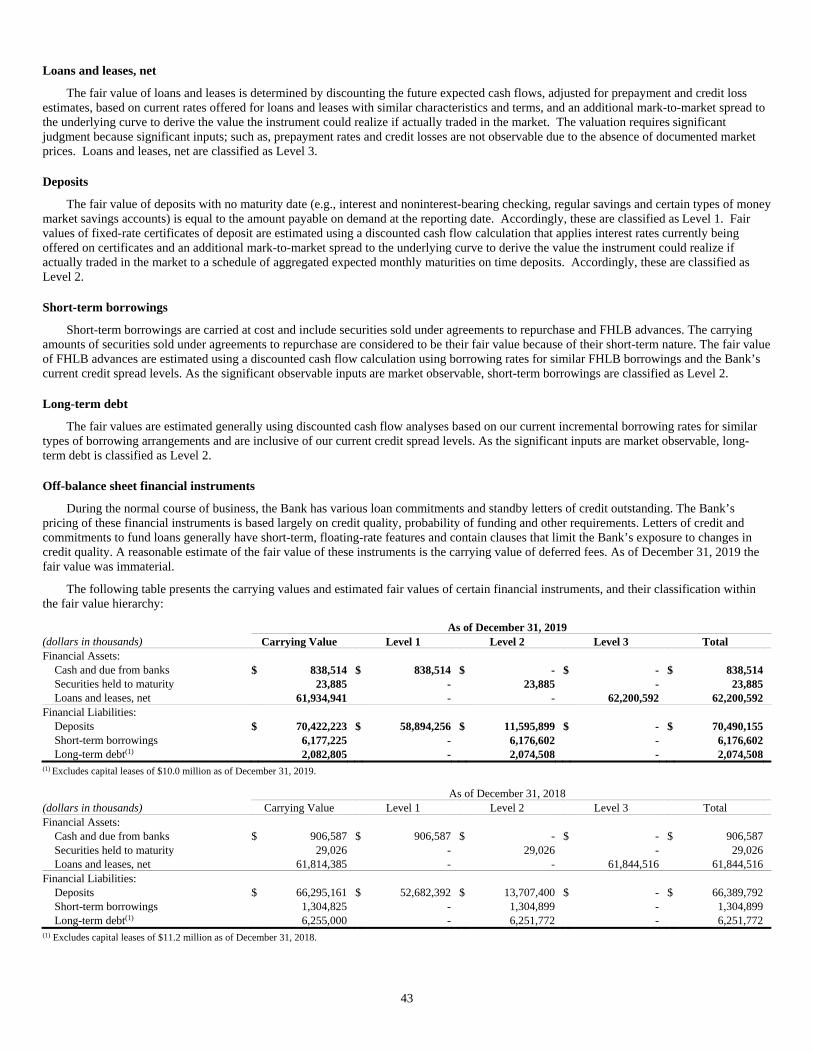
43
Loans and leases, net
The fair value of loans and leases is determined by discounting the future expected cash flows, adjusted for prepayment and credit loss estimates, based on current rates offered for loans and leases with similar characteristics and terms, and an additional mark-to-market spread to the underlying curve to derive the value the instrument could realize if actually traded in the market. The valuation requires significant judgment because significant inputs; such as, prepayment rates and credit losses are not observable due to the absence of documented market prices. Loans and leases, net are classified as Level 3.
Deposits
The fair value of deposits with no maturity date (e.g., interest and noninterest-bearing checking, regular savings and certain types of money market savings accounts) is equal to the amount payable on demand at the reporting date. Accordingly, these are classified as Level 1. Fair values of fixed-rate certificates of deposit are estimated using a discounted cash flow calculation that applies interest rates currently being offered on certificates and an additional mark-to-market spread to the underlying curve to derive the value the instrument could realize if actually traded in the market to a schedule of aggregated expected monthly maturities on time deposits. Accordingly, these are classified as Level 2.
Short-term borrowings
Short-term borrowings are carried at cost and include securities sold under agreements to repurchase and FHLB advances. The carrying amounts of securities sold under agreements to repurchase are considered to be their fair value because of their short-term nature. The fair value of FHLB advances are estimated using a discounted cash flow calculation using borrowing rates for similar FHLB borrowings and the Bank’s current credit spread levels. As the significant observable inputs are market observable, short-term borrowings are classified as Level 2.
Long-term debt
The fair values are estimated generally using discounted cash flow analyses based on our current incremental borrowing rates for similar types of borrowing arrangements and are inclusive of our current credit spread levels. As the significant inputs are market observable, long-term debt is classified as Level 2.
Off-balance sheet financial instruments
During the normal course of business, the Bank has various loan commitments and standby letters of credit outstanding. The Bank’s pricing of these financial instruments is based largely on credit quality, probability of funding and other requirements. Letters of credit and commitments to fund loans generally have short-term, floating-rate features and contain clauses that limit the Bank’s exposure to changes in credit quality. A reasonable estimate of the fair value of these instruments is the carrying value of deferred fees. As of December 31, 2019 the fair value was immaterial.
The following table presents the carrying values and estimated fair values of certain financial instruments, and their classification within the fair value hierarchy:
As of December 31, 2019 (dollars in thousands) Carrying Value Level 1 Level 2 Level 3 Total Financial Assets:
Cash and due from banks $ 838,514 $ 838,514 $ - $ - $ 838,514 Securities held to maturity 23,885 - 23,885 - 23,885 Loans and leases, net 61,934,941 - - 62,200,592 62,200,592
Financial Liabilities: Deposits $ 70,422,223 $ 58,894,256 $ 11,595,899 $ - $ 70,490,155 Short-term borrowings 6,177,225 - 6,176,602 - 6,176,602 Long-term debt(1) 2,082,805 - 2,074,508 - 2,074,508
(1) Excludes capital leases of $10.0 million as of December 31, 2019.
As of December 31, 2018 (dollars in thousands) Carrying Value Level 1 Level 2 Level 3 Total Financial Assets:
Cash and due from banks $ 906,587 $ 906,587 $ - $ - $ 906,587 Securities held to maturity 29,026 - 29,026 - 29,026 Loans and leases, net 61,814,385 - - 61,844,516 61,844,516
Financial Liabilities: Deposits $ 66,295,161 $ 52,682,392 $ 13,707,400 $ - $ 66,389,792 Short-term borrowings 1,304,825 - 1,304,899 - 1,304,899 Long-term debt(1) 6,255,000 - 6,251,772 - 6,251,772
(1) Excludes capital leases of $11.2 million as of December 31, 2018.

44
18. Cash and Dividend Restrictions
Federal Reserve Board regulations require the Bank to maintain reserve balances against certain deposit liabilities with the Federal Reserve Bank. The required reserve balance was $309.0 million and $253.7 million as of December 31, 2019 and 2018, respectively.
California statutes limit the amount of dividends the Bank may declare or pay to the lesser of the Bank’s retained earnings or the net income of the Bank for the prior three years less any dividends paid during those three years. The amount available for payment of dividends without prior regulatory approval was $0.5 billion and $0.4 billion as of December 31, 2019 and 2018, respectively.
19. Other Comprehensive Income (Loss)
The following table provides the details for OCI:
Years Ended December 31, 2019 2018
(dollars in thousands) Pre-tax Amount
Income tax
(Expense)Benefit
After-taxAmount
Pre-tax Amount
Income tax(Expense)
Benefit After-tax Amount
Pension and other benefits adjustment: Net actuarial losses arising during the period $ (2,157) $ 592 $ (1,565) $ (5,165 ) $ 706 $ (4,459)Reclassification of amounts to net periodic benefit costs(1):
Amortization of net loss 11,984 (3,288) 8,696 14,169 (3,823) 10,346 Amortization of net prior service credit (1,396) 383 (1,013) (1,395 ) 377 (1,018)
Subtotal reclassifications to net periodic benefit costs $ 10,588 $ (2,905) $ 7,683 $ 12,774 $ (3,446) $ 9,328 Net change in pension and other benefits adjustment $ 8,431 $ (2,313) $ 6,118 $ 7,609 $ (2,740) $ 4,869 Securities available for sale:
Unrealized net gains (losses) arising during the year $ 483,493 $ (132,637) $ 350,856 $ (150,864 ) $ 38,496 $ (112,368)Reclassification of net realized (gains) losses to net income (8,115) 2,226 (5,889) 233 (63) 170
Net change in unrealized gains (losses) on securities available for sale $ 475,378 $ (130,411) $ 344,967 $ (150,631 ) $ 38,433 $ (112,198)Cash flow derivative hedges:
Unrealized net gains (losses) arising during the year $ 22,273 $ (6,110) $ 16,163 $ (101,426 ) $ 26,149 $ (75,277)Reclassification of net losses on loans and lease financing to net income 87,536 (24,014) 63,522 41,388 (11,167) 30,221
Net change in unrealized gains (losses) on cash flow derivative hedges $ 109,809 $ (30,124) $ 79,685 $ (60,038 ) $ 14,982 $ (45,056)OCI for the year $ 593,618 $ (162,848) $ 430,770 $ (203,060 ) $ 50,675 $ (152,385)
(1) These items are included in the computation of net periodic benefit cost recorded in salaries and employee benefits; see Note 20 for additional details.
The following table summarizes the changes in AOCI balances, net of tax:
(dollars in thousands)
Pensionand Other Benefits
Securities Available for Sale
Cash Flow Derivative
Hedges Total AOCI
Balance as of January 1, 2018 $ (60,640) $ (195,489) $ (107,658) $ (363,787)OCI before reclassifications (4,459) (112,368) (75,277) (192,104)Amounts reclassified from AOCI 9,328 170 30,221 39,719 Cumulative adjustment for ASU 2016-01 and other (5) (620) (9) (634)
Balance as of December 31, 2018 (55,776) (308,307) (152,723) (516,806)OCI before reclassifications (1,565) 350,856 16,163 365,454 Amounts reclassified from AOCI 7,683 (5,889) 63,522 65,316
Balance as of December 31, 2019 $ (49,658) $ 36,660 $ (73,038) $ (86,036)
20. Employee Pension and Other Postretirement Benefits
The Bank maintains both qualified and nonqualified defined benefit plans. The Bank’s other retirement plans consist of nonqualified, supplemental retirement plans and a qualified defined contribution plan. The Bank recognizes the overfunded and unfunded status of its pension plans as an asset and liability in the consolidated balance sheets.
Defined Contribution Plans:
401(k) match plan
The Bank matches 100% of employee contributions up to 6% of pay to the Bank of the West 401(k) Savings Plan, a defined contribution plan. Active employees are immediately vested in all employer matching contributions. The plan covers all employees who satisfy eligibility requirements. Matching employer contributions to the 401(k) plan for the years ended December 31, 2019 and 2018 were $42.4 million and $40.5 million, respectively.

45
Variable incentive plan
Effective 2017, eligible employees can earn both corporate short-term and long-term incentives under the Variable Incentive Plan (“VIP”). VIP replaced the Incentive Plan for Key Executives (“IPKE”), and the Long-Term Incentive Plan (“LTIP”). Long-term incentives under VIP are earned and paid in tranches over a three-year period following the year of initial grant. VIP limits the aggregate and individual value of the awards that can be issued in any one fiscal year and have the same limits on individual awards. Salary and employee benefits expense for the Bank includes VIP expense (formerly IPKE and LTIP) of $73.4 million and $77.9 million for the years ended December 31, 2019 and 2018, respectively.
Performance share plan and other incentive plans
The Bank has a Performance Share Plan (“PSP”) which was designed to reward certain employees for their performance and Bank of the West’s performance over a multi-year performance cycle. Salary and employee benefit expense for the Bank includes PSP expense of $8.0 million and $7.4 million for the years ended December 31, 2019 and 2018, respectively.
The Bank participates in a Global Stock Incentive Plan (“GSIP”), in which certain members of the Bank’s senior management team receive stock option awards from BNPP for shares of BNPP stock. The last grants from the plan were made in March 2012. These grants fully vested in 2016. Additionally, the Global Sustainability and Incentive Scheme (“GSIS”) and Contingent Sustainable and International Scheme (“CSIS”) were created to reward, retain and motivate certain employees and to fairly compensate them by aligning their interest with the operational performance of BNPP, including performance on Corporate Social Responsibility (“CSR”). The GSIS and CSIS plans were created to replace the GSIP on a go-forward basis. See Note 22 for additional information.
Defined Benefit Pension Plans:
Qualified pension plans
The Bank had previously offered the Employees’ Retirement Plan (“ERP”) of BancWest Corporation to its employees, which is a noncontributory defined benefit pension plan. The ERP was frozen on January 1, 2010 to new participants; however, interest continues to accrue for existing plan participants with cash balance accounts.
Additionally, in connection with the acquisition of United California Bank (“UCB”) in 2002, the Bank assumed the pension obligations of UCB’s funded noncontributory final average pay defined benefit pension plan (“the Plan”) that was frozen on June 30, 2003 to new participants and benefit accruals. In 2016, ERP assets attributable to Bank of the West employees were transferred to UCB Retirement Plan.
Nonqualified pension plans
The Bank sponsored an unfunded excess benefit pension plan and an unfunded supplemental executive retirement plan (“SERP”). The unfunded excess plan was frozen on January 1, 2010 to new participants and benefit accruals. The SERP was frozen in 2002, to new participants; however, benefits continue to accrue for existing plan participants.
The Bank assumed the pension obligations of UCB’s unfunded supplemental pension benefit plan (“UCB SEP”) which was available to eligible key executives. The UCB SEP was frozen on June 30, 2003 to new participants and benefit accruals.
Other Postretirement Benefits:
Postretirement medical and life insurance plan
The Bank offers an unfunded postretirement medical and life insurance plan for qualified retirees. The benefits include access to medical benefits and medical credits to offset premiums for its under 65 retirees. Retirees over 65 have access to retiree medical credits only to be used as reimbursement for qualified medical expenses. Retirees also receive a life insurance benefit in the amount of $10,000.
Effective 2016, benefits were eliminated for participants that did not meet the age of 55 and 10 years of service eligibility requirement as of December 31, 2016 and medical credit accruals are frozen as of December 31, 2016 for those that are eligible for benefits.
Executive life insurance plan
The Bank also offered pre-and postretirement life insurance benefits to certain executives under the unfunded Executive Life Insurance Plan (the “ELIP”).
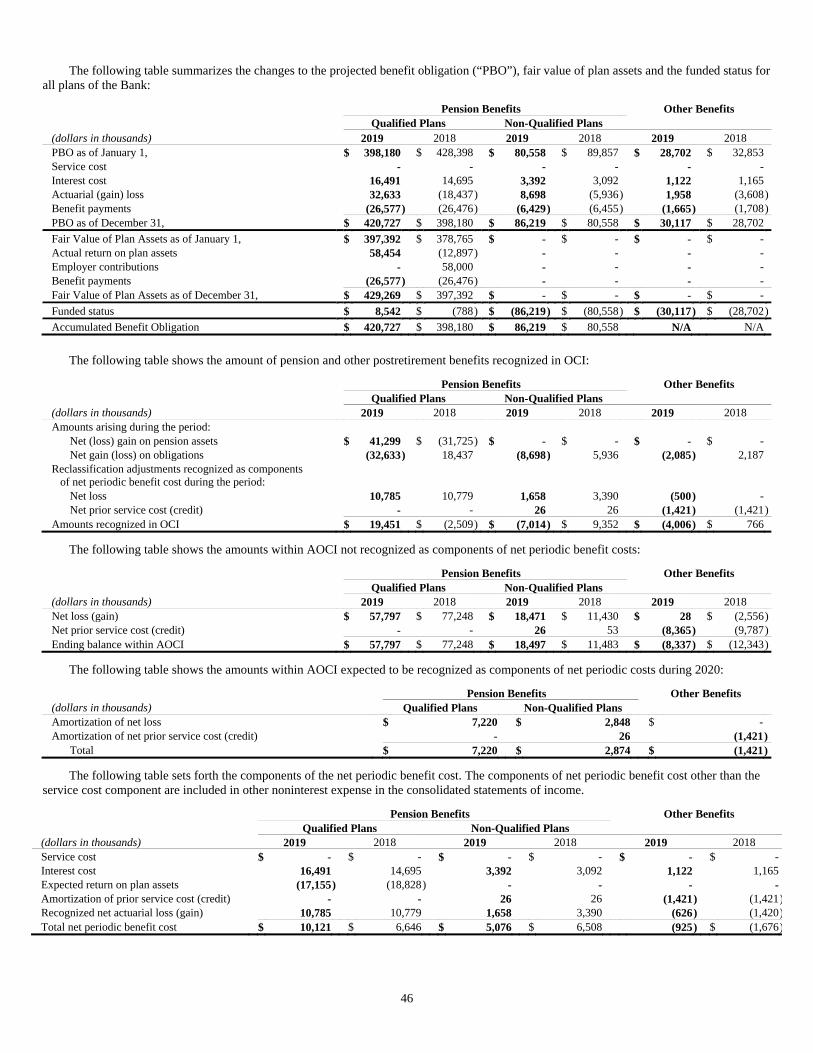
46
The following table summarizes the changes to the projected benefit obligation (“PBO”), fair value of plan assets and the funded status for all plans of the Bank:
Pension Benefits Other Benefits Qualified Plans Non-Qualified Plans
(dollars in thousands) 2019 2018 2019 2018 2019 2018 PBO as of January 1, $ 398,180 $ 428,398 $ 80,558 $ 89,857 $ 28,702 $ 32,853 Service cost - - - - - - Interest cost 16,491 14,695 3,392 3,092 1,122 1,165 Actuarial (gain) loss 32,633 (18,437) 8,698 (5,936 ) 1,958 (3,608)Benefit payments (26,577) (26,476) (6,429) (6,455 ) (1,665) (1,708)PBO as of December 31, $ 420,727 $ 398,180 $ 86,219 $ 80,558 $ 30,117 $ 28,702
Fair Value of Plan Assets as of January 1, $ 397,392 $ 378,765 $ - $ - $ - $ - Actual return on plan assets 58,454 (12,897) - - - - Employer contributions - 58,000 - - - - Benefit payments (26,577) (26,476) - - - - Fair Value of Plan Assets as of December 31, $ 429,269 $ 397,392 $ - $ - $ - $ -
Funded status $ 8,542 $ (788) $ (86,219) $ (80,558 ) $ (30,117) $ (28,702)
Accumulated Benefit Obligation $ 420,727 $ 398,180 $ 86,219 $ 80,558 N/A N/A
The following table shows the amount of pension and other postretirement benefits recognized in OCI:
Pension Benefits Other Benefits Qualified Plans Non-Qualified Plans
(dollars in thousands) 2019 2018 2019 2018 2019 2018 Amounts arising during the period:
Net (loss) gain on pension assets $ 41,299 $ (31,725) $ - $ - $ - $ - Net gain (loss) on obligations (32,633) 18,437 (8,698) 5,936 (2,085) 2,187
Reclassification adjustments recognized as components of net periodic benefit cost during the period:
Net loss 10,785 10,779 1,658 3,390 (500) - Net prior service cost (credit) - - 26 26 (1,421) (1,421)
Amounts recognized in OCI $ 19,451 $ (2,509) $ (7,014) $ 9,352 $ (4,006) $ 766
The following table shows the amounts within AOCI not recognized as components of net periodic benefit costs:
Pension Benefits Other Benefits Qualified Plans Non-Qualified Plans
(dollars in thousands) 2019 2018 2019 2018 2019 2018 Net loss (gain) $ 57,797 $ 77,248 $ 18,471 $ 11,430 $ 28 $ (2,556)Net prior service cost (credit) - - 26 53 (8,365) (9,787)Ending balance within AOCI $ 57,797 $ 77,248 $ 18,497 $ 11,483 $ (8,337) $ (12,343)
The following table shows the amounts within AOCI expected to be recognized as components of net periodic costs during 2020:
Pension Benefits Other Benefits (dollars in thousands) Qualified Plans Non-Qualified Plans Amortization of net loss $ 7,220 $ 2,848 $ - Amortization of net prior service cost (credit) - 26 (1,421)
Total $ 7,220 $ 2,874 $ (1,421)
The following table sets forth the components of the net periodic benefit cost. The components of net periodic benefit cost other than the service cost component are included in other noninterest expense in the consolidated statements of income.
Pension Benefits Other Benefits Qualified Plans Non-Qualified Plans
(dollars in thousands) 2019 2018 2019 2018 2019 2018 Service cost $ - $ - $ - $ - $ - $ -Interest cost 16,491 14,695 3,392 3,092 1,122 1,165Expected return on plan assets (17,155) (18,828) - - - -Amortization of prior service cost (credit) - - 26 26 (1,421) (1,421)Recognized net actuarial loss (gain) 10,785 10,779 1,658 3,390 (626) (1,420)Total net periodic benefit cost $ 10,121 $ 6,646 $ 5,076 $ 6,508 (925) $ (1,676)
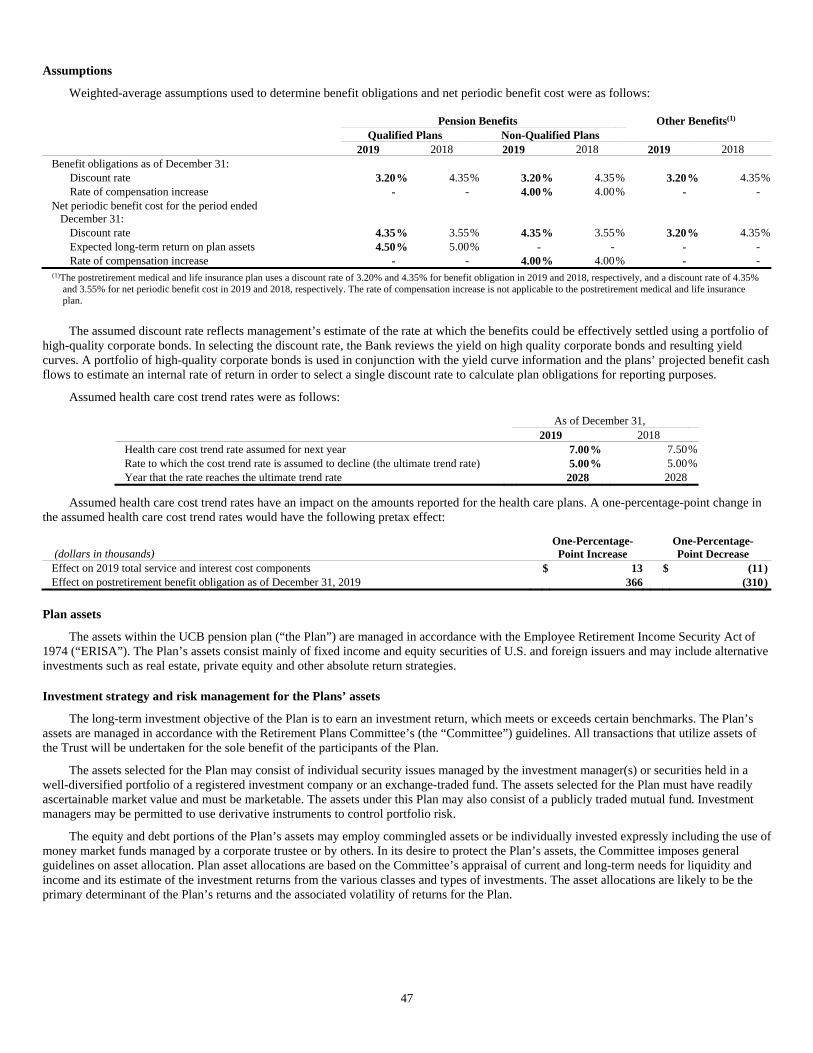
47
Assumptions
Weighted-average assumptions used to determine benefit obligations and net periodic benefit cost were as follows:
Pension Benefits Other Benefits(1) Qualified Plans Non-Qualified Plans 2019 2018 2019 2018 2019 2018
Benefit obligations as of December 31: Discount rate 3.20% 4.35% 3.20% 4.35 % 3.20% 4.35%Rate of compensation increase - - 4.00% 4.00 % - -
Net periodic benefit cost for the period ended December 31:
Discount rate 4.35% 3.55% 4.35% 3.55 % 3.20% 4.35%Expected long-term return on plan assets 4.50% 5.00% - - - - Rate of compensation increase - - 4.00% 4.00 % - -
(1)The postretirement medical and life insurance plan uses a discount rate of 3.20% and 4.35% for benefit obligation in 2019 and 2018, respectively, and a discount rate of 4.35% and 3.55% for net periodic benefit cost in 2019 and 2018, respectively. The rate of compensation increase is not applicable to the postretirement medical and life insurance plan.
The assumed discount rate reflects management’s estimate of the rate at which the benefits could be effectively settled using a portfolio of high-quality corporate bonds. In selecting the discount rate, the Bank reviews the yield on high quality corporate bonds and resulting yield curves. A portfolio of high-quality corporate bonds is used in conjunction with the yield curve information and the plans’ projected benefit cash flows to estimate an internal rate of return in order to select a single discount rate to calculate plan obligations for reporting purposes.
Assumed health care cost trend rates were as follows:
As of December 31, 2019 2018
Health care cost trend rate assumed for next year 7.00 % 7.50%Rate to which the cost trend rate is assumed to decline (the ultimate trend rate) 5.00 % 5.00%Year that the rate reaches the ultimate trend rate 2028 2028
Assumed health care cost trend rates have an impact on the amounts reported for the health care plans. A one-percentage-point change in the assumed health care cost trend rates would have the following pretax effect:
(dollars in thousands) One-Percentage-
Point Increase One-Percentage- Point Decrease
Effect on 2019 total service and interest cost components $ 13 $ (11)Effect on postretirement benefit obligation as of December 31, 2019 366 (310)
Plan assets
The assets within the UCB pension plan (“the Plan”) are managed in accordance with the Employee Retirement Income Security Act of 1974 (“ERISA”). The Plan’s assets consist mainly of fixed income and equity securities of U.S. and foreign issuers and may include alternative investments such as real estate, private equity and other absolute return strategies.
Investment strategy and risk management for the Plans’ assets
The long-term investment objective of the Plan is to earn an investment return, which meets or exceeds certain benchmarks. The Plan’s assets are managed in accordance with the Retirement Plans Committee’s (the “Committee”) guidelines. All transactions that utilize assets of the Trust will be undertaken for the sole benefit of the participants of the Plan.
The assets selected for the Plan may consist of individual security issues managed by the investment manager(s) or securities held in a well-diversified portfolio of a registered investment company or an exchange-traded fund. The assets selected for the Plan must have readily ascertainable market value and must be marketable. The assets under this Plan may also consist of a publicly traded mutual fund. Investment managers may be permitted to use derivative instruments to control portfolio risk.
The equity and debt portions of the Plan’s assets may employ commingled assets or be individually invested expressly including the use of money market funds managed by a corporate trustee or by others. In its desire to protect the Plan’s assets, the Committee imposes general guidelines on asset allocation. Plan asset allocations are based on the Committee’s appraisal of current and long-term needs for liquidity and income and its estimate of the investment returns from the various classes and types of investments. The asset allocations are likely to be the primary determinant of the Plan’s returns and the associated volatility of returns for the Plan.

48
The target asset allocations for the Plan are as follows:
As of December 31, 2019 2018
Equity 23% 23% Fixed Income 77% 77% Total 100% 100%
(1)Target asset allocations were effective as of period end and did not impact the expected long-term return on plan assets assumption for 2019.
Concentration of risk
The Bank describes “risk” as the possibility of not achieving the Plan’s actuarial rates of return. Risks associated with the Plan’s investments include systematic and nonsystematic risk, interest rate, yield curve, reinvestment and credit risk and the combination of these risks. The Bank mitigates the credit risk of investments by establishing guidelines with the investment managers. Both the Bank and our investment managers monitor the diversity of the Plan’s assets to ensure that they meet ERISA requirements. Equity securities in the Plans did not include BancWest or BNP Paribas stock as of December 31, 2019 and 2018.
The tables below summarize the Bank’s pension plan assets by investment category. The three-level hierarchy that describes the inputs used to measure assets at fair value is discussed in Note 1:
As of December 31, 2019
(dollars in thousands) Level 1 Level 2 Level 3 Total Fair
Value Asset Category:
Cash and equivalents $ 7,608 $ - $ - $ 7,608 Fixed income:
U.S. Government agency and government sponsored agency securities and corporate securities 3,552 245,446 - 248,998 Mutual funds 12,177 - - 12,177 Municipal bonds - 45,562 - 45,562 Contracts/annuities - - 13,906 13,906
Equities: Mutual funds 26,588 - - 26,588 Exchange-traded funds 30,131 - - 30,131 Common stock 44,299 - - 44,299
Total plan assets $ 124,355 $ 291,008 $ 13,906 $ 429,269
As of December 31, 2018
(dollars in thousands) Level 1 Level 2 Level 3 Total Fair
Value Asset Category:
Cash and equivalents $ 3,885 $ - $ - $ 3,885 Fixed income:
U.S. Government agency and government sponsored agency securities and corporate securities 2,507 227,036 - 229,543 Mutual funds 12,729 - - 12,729 Municipal bonds - 45,522 - 45,522 Contracts/annuities - - 13,385 13,385
Equities: Mutual funds 36,160 - - 36,160 Exchange-traded funds 17,574 - - 17,574 Common stock 38,594 - - 38,594
Total plan assets $ 111,449 $ 272,558 $ 13,385 $ 397,392
The changes in the Bank’s Level 3 pension plan assets were as follows:
(dollars in thousands) Contracts/Annuities Balance as of January 1, 2019 $ 13,385
Actual return on plan assets 614 Distributions and settlements (2,265) Contributions 2,262 Service fees (90)
Balance as of December 31, 2019 $ 13,906
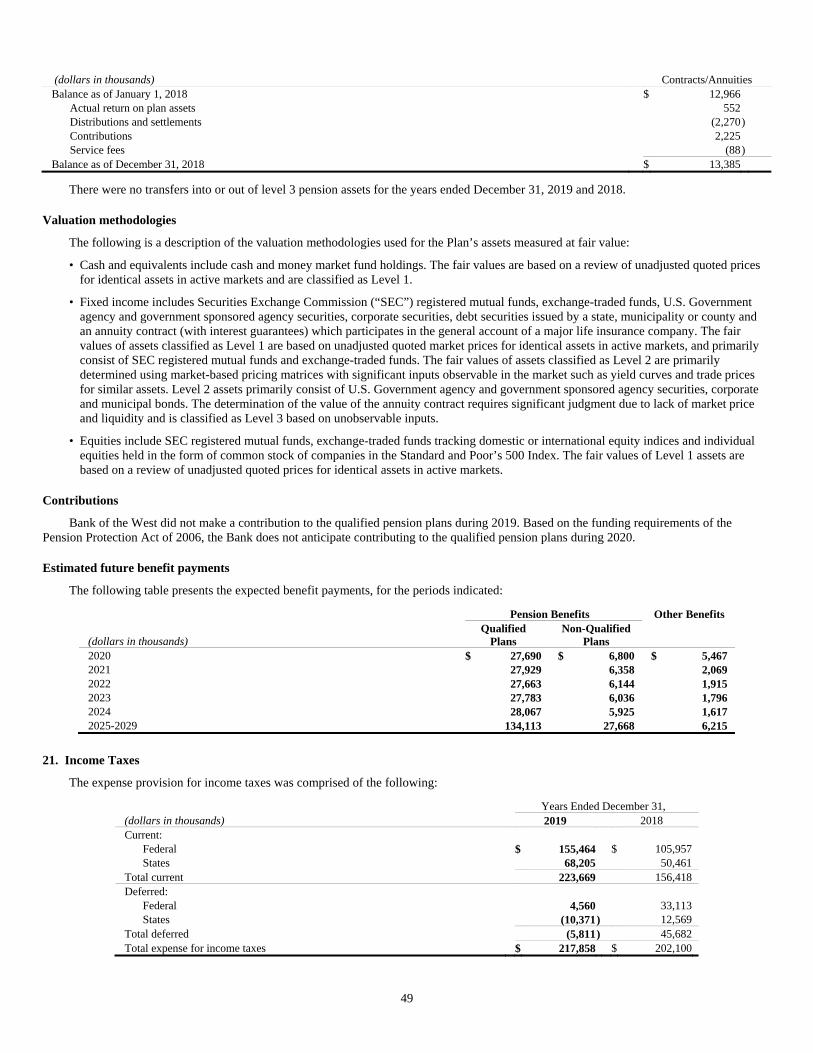
49
(dollars in thousands) Contracts/Annuities Balance as of January 1, 2018 $ 12,966
Actual return on plan assets 552 Distributions and settlements (2,270) Contributions 2,225 Service fees (88)
Balance as of December 31, 2018 $ 13,385
There were no transfers into or out of level 3 pension assets for the years ended December 31, 2019 and 2018.
Valuation methodologies
The following is a description of the valuation methodologies used for the Plan’s assets measured at fair value:
• Cash and equivalents include cash and money market fund holdings. The fair values are based on a review of unadjusted quoted prices for identical assets in active markets and are classified as Level 1.
• Fixed income includes Securities Exchange Commission (“SEC”) registered mutual funds, exchange-traded funds, U.S. Government agency and government sponsored agency securities, corporate securities, debt securities issued by a state, municipality or county and an annuity contract (with interest guarantees) which participates in the general account of a major life insurance company. The fair values of assets classified as Level 1 are based on unadjusted quoted market prices for identical assets in active markets, and primarily consist of SEC registered mutual funds and exchange-traded funds. The fair values of assets classified as Level 2 are primarily determined using market-based pricing matrices with significant inputs observable in the market such as yield curves and trade prices for similar assets. Level 2 assets primarily consist of U.S. Government agency and government sponsored agency securities, corporate and municipal bonds. The determination of the value of the annuity contract requires significant judgment due to lack of market price and liquidity and is classified as Level 3 based on unobservable inputs.
• Equities include SEC registered mutual funds, exchange-traded funds tracking domestic or international equity indices and individual equities held in the form of common stock of companies in the Standard and Poor’s 500 Index. The fair values of Level 1 assets are based on a review of unadjusted quoted prices for identical assets in active markets.
Contributions
Bank of the West did not make a contribution to the qualified pension plans during 2019. Based on the funding requirements of the Pension Protection Act of 2006, the Bank does not anticipate contributing to the qualified pension plans during 2020.
Estimated future benefit payments
The following table presents the expected benefit payments, for the periods indicated:
Pension Benefits Other Benefits
(dollars in thousands) Qualified
Plans Non-Qualified
Plans 2020 $ 27,690 $ 6,800 $ 5,467 2021 27,929 6,358 2,069 2022 27,663 6,144 1,915 2023 27,783 6,036 1,796 2024 28,067 5,925 1,617 2025-2029 134,113 27,668 6,215
21. Income Taxes
The expense provision for income taxes was comprised of the following:
Years Ended December 31, (dollars in thousands) 2019 2018 Current:
Federal $ 155,464 $ 105,957 States 68,205 50,461
Total current 223,669 156,418 Deferred:
Federal 4,560 33,113 States (10,371 ) 12,569
Total deferred (5,811 ) 45,682 Total expense for income taxes $ 217,858 $ 202,100
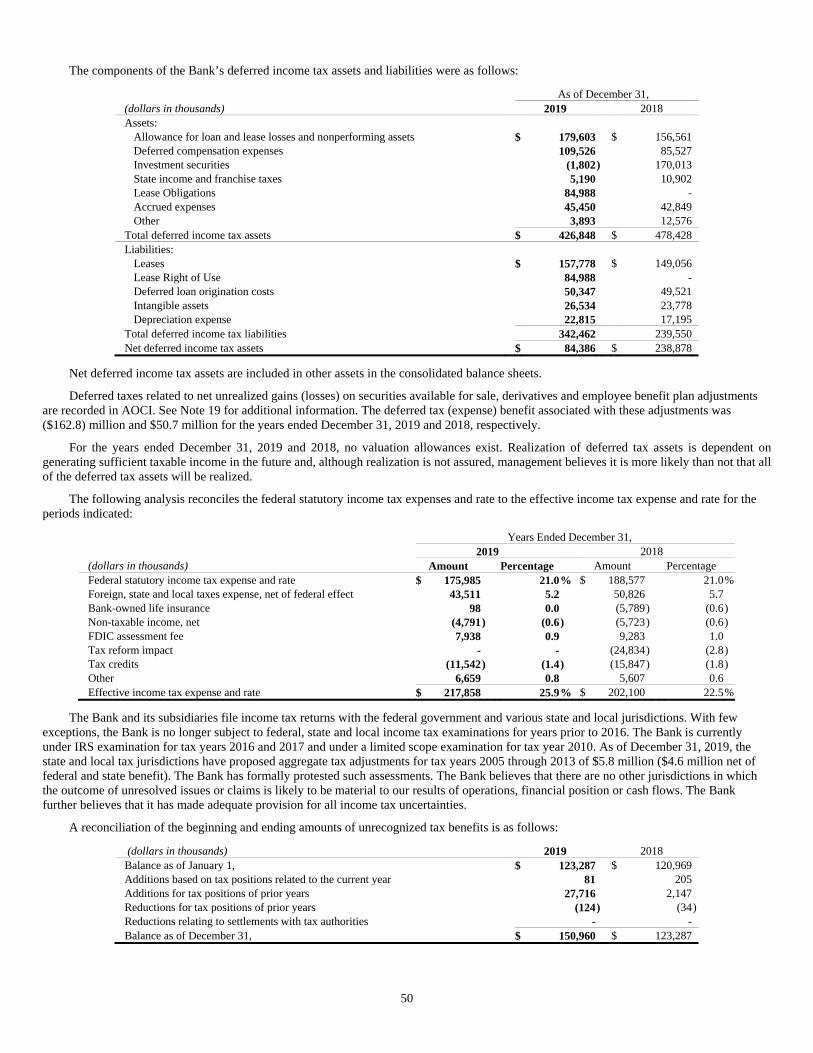
50
The components of the Bank’s deferred income tax assets and liabilities were as follows:
As of December 31, (dollars in thousands) 2019 2018 Assets:
Allowance for loan and lease losses and nonperforming assets $ 179,603 $ 156,561 Deferred compensation expenses 109,526 85,527 Investment securities (1,802 ) 170,013 State income and franchise taxes 5,190 10,902 Lease Obligations 84,988 - Accrued expenses 45,450 42,849 Other 3,893 12,576
Total deferred income tax assets $ 426,848 $ 478,428 Liabilities:
Leases $ 157,778 $ 149,056 Lease Right of Use 84,988 - Deferred loan origination costs 50,347 49,521 Intangible assets 26,534 23,778 Depreciation expense 22,815 17,195
Total deferred income tax liabilities 342,462 239,550 Net deferred income tax assets $ 84,386 $ 238,878
Net deferred income tax assets are included in other assets in the consolidated balance sheets.
Deferred taxes related to net unrealized gains (losses) on securities available for sale, derivatives and employee benefit plan adjustments are recorded in AOCI. See Note 19 for additional information. The deferred tax (expense) benefit associated with these adjustments was ($162.8) million and $50.7 million for the years ended December 31, 2019 and 2018, respectively.
For the years ended December 31, 2019 and 2018, no valuation allowances exist. Realization of deferred tax assets is dependent on generating sufficient taxable income in the future and, although realization is not assured, management believes it is more likely than not that all of the deferred tax assets will be realized.
The following analysis reconciles the federal statutory income tax expenses and rate to the effective income tax expense and rate for the periods indicated:
Years Ended December 31, 2019 2018
(dollars in thousands) Amount Percentage Amount Percentage Federal statutory income tax expense and rate $ 175,985 21.0% $ 188,577 21.0%Foreign, state and local taxes expense, net of federal effect 43,511 5.2 50,826 5.7 Bank-owned life insurance 98 0.0 (5,789 ) (0.6) Non-taxable income, net (4,791) (0.6) (5,723 ) (0.6) FDIC assessment fee 7,938 0.9 9,283 1.0 Tax reform impact - - (24,834 ) (2.8) Tax credits (11,542) (1.4) (15,847 ) (1.8) Other 6,659 0.8 5,607 0.6 Effective income tax expense and rate $ 217,858 25.9% $ 202,100 22.5%
The Bank and its subsidiaries file income tax returns with the federal government and various state and local jurisdictions. With few exceptions, the Bank is no longer subject to federal, state and local income tax examinations for years prior to 2016. The Bank is currently under IRS examination for tax years 2016 and 2017 and under a limited scope examination for tax year 2010. As of December 31, 2019, the state and local tax jurisdictions have proposed aggregate tax adjustments for tax years 2005 through 2013 of $5.8 million ($4.6 million net of federal and state benefit). The Bank has formally protested such assessments. The Bank believes that there are no other jurisdictions in which the outcome of unresolved issues or claims is likely to be material to our results of operations, financial position or cash flows. The Bank further believes that it has made adequate provision for all income tax uncertainties.
A reconciliation of the beginning and ending amounts of unrecognized tax benefits is as follows:
(dollars in thousands) 2019 2018 Balance as of January 1, $ 123,287 $ 120,969 Additions based on tax positions related to the current year 81 205 Additions for tax positions of prior years 27,716 2,147 Reductions for tax positions of prior years (124 ) (34)Reductions relating to settlements with tax authorities - - Balance as of December 31, $ 150,960 $ 123,287

51
Included in the balance of unrecognized tax benefits are $119.4 million and $98.2 million of tax benefits as of December 31, 2019 and 2018, respectively, which if recognized, will affect the effective tax rate.
The Bank recognizes interest accrued related to unrecognized tax benefits and penalties as income tax expense. Related to the unrecognized tax benefits noted above, the Bank accrued interest of $3.1 million ($2.5 million, net of federal and state tax benefit) and no penalties during 2019. In total, as of December 31, 2019, the Bank has recognized a liability for interest of $10.9 million ($8.8 million, net of federal and state benefit) and penalties of $1.3 million. The Bank accrued interest of $2.0 million ($1.6 million, net of federal and state tax benefit) and no penalties during 2018. In total, as of December 31, 2018, the Bank had recognized a liability for interest of $7.8 million ($6.4 million, net of federal and state tax benefit) and penalties of $1.3 million.
The Bank believes there is no amount in unrecognized tax benefits which is reasonably possible to decrease within twelve months of the reporting date with respect to the refund claims and certain liabilities.
On December 22, 2017, the Tax Cuts and Jobs Act (“Tax Reform”) was enacted. The Tax Reform significantly revised the U.S. federal income tax law, among other things, by permanently reducing the U.S. corporate income tax rate. The reduction in tax rate requires the Bank to revalue its deferred tax assets and liabilities and reassess the value of its low income housing investments. The impact of any changes resulting from the Tax Reform is recognized within income tax expense in the period the tax law change is enacted. Due to the complexities involved in the accounting for the Tax Reform, the Bank recorded provisional amounts to remeasure the deferred tax assets and liabilities that were booked during 2017, based on current information and interpretation of the Tax Reform at the time. During 2018, the Bank has completed the accounting for the remeasurement of the deferred tax assets and liabilities. Upon completion of the analysis, the Bank reduced deferred tax assets and liabilities by $19.8 million.
22. Transactions with Affiliates
The Bank participates in various transactions with its affiliates including BancWest Corporation, BNP Paribas and their affiliates. These transactions are subject to federal and state statutory and regulatory restrictions and limitations which require, among other items, to be collateralized, be subject to quantitative limitations, and be on terms at least as favorable to the Bank as those prevailing at the time for similar non-affiliate transactions. These transactions have included the sales and purchases of assets, foreign exchange activities, financial guarantees, international services, interest rate swaps and intercompany deposits and borrowings.
The following table presents amounts due to and from affiliates and off-balance sheet transactions:
As of December 31, (dollars in thousands) 2019 2018 Cash and due from banks $ 25,993 $ 19,270 Loans 2,701 3,021 Deposits 4,136,879 4,948,447 Other assets 148,628 63,397 Other liabilities 127,382 106,920 Derivatives (notional or contract amounts):
Foreign exchange contracts 209,986 36,369 Interest rate contracts 1,324,578 1,494,271
Off-balance sheet transactions: Commitments and standby letters of credit 214,410 171,406 Guarantees received 522,487 401,367
Net interest expense to affiliates for the years ended December 31, 2019 and 2018 was $36.3 million and $114.8 million, respectively. Noninterest income from affiliate transactions, which includes fair value adjustments related to derivatives, was a net loss of $4.0 million and $28.6 million for the years ended December 31, 2019 and 2018, respectively. Noninterest expense from affiliate transactions was $14.8 million and $12.2 million for the years ended December 31, 2019 and 2018, respectively.
Under the Management Services Agreement, the Bank was reimbursed for salary, occupancy and other expenses incurred on behalf of BancWest Corporation and BancWest Holding, Inc. in the amount of $46.8 million and $49.9 million for the years ended December 31, 2019 and 2018, respectively.
In addition, the Bank maintained a receivable related to income taxes and uncertain tax positions of $10.6 million with its affiliates as of December 31, 2019. The Bank maintained a receivable related to income tax overpayments of $186.4 million and a payable related to income taxes and uncertain tax positions of $115.0 million with its affiliates as of December 31, 2018.
Incentive plans
The Bank participates in the GSIP and GSIS incentive plans. Salary and employee benefits expense under these plans was $1.1 million for the years ended December 31, 2019 and 2018. See Note 20 for additional information.

52
23. Subsequent Events
We have evaluated the effects of subsequent events that have occurred after December 31, 2019 through March 27, 2020, the date of our financial statement issuance, and noted the following material event:
On January 23, 2020, the Bank’s Board of Directors declared a cash dividend of $14.42 per outstanding common share, for a total of $80.0 million. The dividend was paid on January 30, 2020 to BWHI.
In December 2019, an outbreak of a novel strain of coronavirus (COVID-19) emerged globally and continued into the first quarter. The extent of the impact of COVID-19 on the Bank’s operational and financial performance will depend on future developments, including the duration and continued spread of the outbreak. The outcomes could be material to the Bank’s operating results for any particular period, depending, in part, upon the operating results for such period and cannot be estimated at this time.

Bank of the West 180 Montgomery Street San Francisco, CA 94104 Phone: 415.765.4800 www.bankofthewest.com