Embed Size (px)
Citation preview

8/14/2019 BOWIE COUNTY - Texarkana ISD - 1999 Texas School Survey of Drug and Alcohol Use
http://slidepdf.com/reader/full/bowie-county-texarkana-isd-1999-texas-school-survey-of-drug-and-alcohol 1/185
8/14/2019 BOWIE COUNTY - Texarkana ISD - 1999 Texas School Survey of Drug and Alcohol Use
http://slidepdf.com/reader/full/bowie-county-texarkana-isd-1999-texas-school-survey-of-drug-and-alcohol 2/185
Texarkana
Spring 1999
──────────────────────────────────────────────────────────────────────────────────────────────
Table T-1: How recently, if ever, have you used...
Past School Ever Never
Month Year Used Used
─────────────────────────────────────────────────────────────────────────────────────
Any tobacco product All 23.7% 33.2% 56.4% 43.6%
Grade 8 18.6% 26.2% 51.4% 48.6%
Grade 10 25.9% 38.2% 60.5% 39.5%
Grade 12 28.4% 37.3% 58.7% 41.3%
─────────────────────────────────────────────────────────────────────────────────────
Cigarettes All 23.1% 32.3% 55.0% 45.0%
Grade 8 18.0% 25.3% 50.3% 49.7%
Grade 10 24.8% 36.2% 57.8% 42.2%
Grade 12 28.0% 37.5% 58.5% 41.5%─────────────────────────────────────────────────────────────────────────────────────
Smokeless tobacco All 4.5% 6.9% 14.5% 85.5%
Grade 8 3.2% 4.5% 9.4% 90.6%
Grade 10 5.6% 9.3% 19.6% 80.4%
Grade 12 5.1% 7.6% 16.2% 83.8%
──────────────────────────────────────────────────────────────────────────────────────────────
Table T-2: How often do you normally use...
Any tobacco product?
Several Several About About Less Than
Never Every Times Times Once a Once a Once a
Used Day a Week a Month Month Year Year
All 48.8% 9.6% 4.5% 5.0% 7.9% 9.2% 14.9%
Grade 8 54.8% 4.5% 3.4% 5.1% 6.8% 11.0% 14.4%
Grade 10 44.6% 13.4% 5.0% 4.0% 8.9% 7.9% 16.3%
Grade 12 45.4% 12.6% 5.5% 6.0% 8.2% 8.2% 14.2%
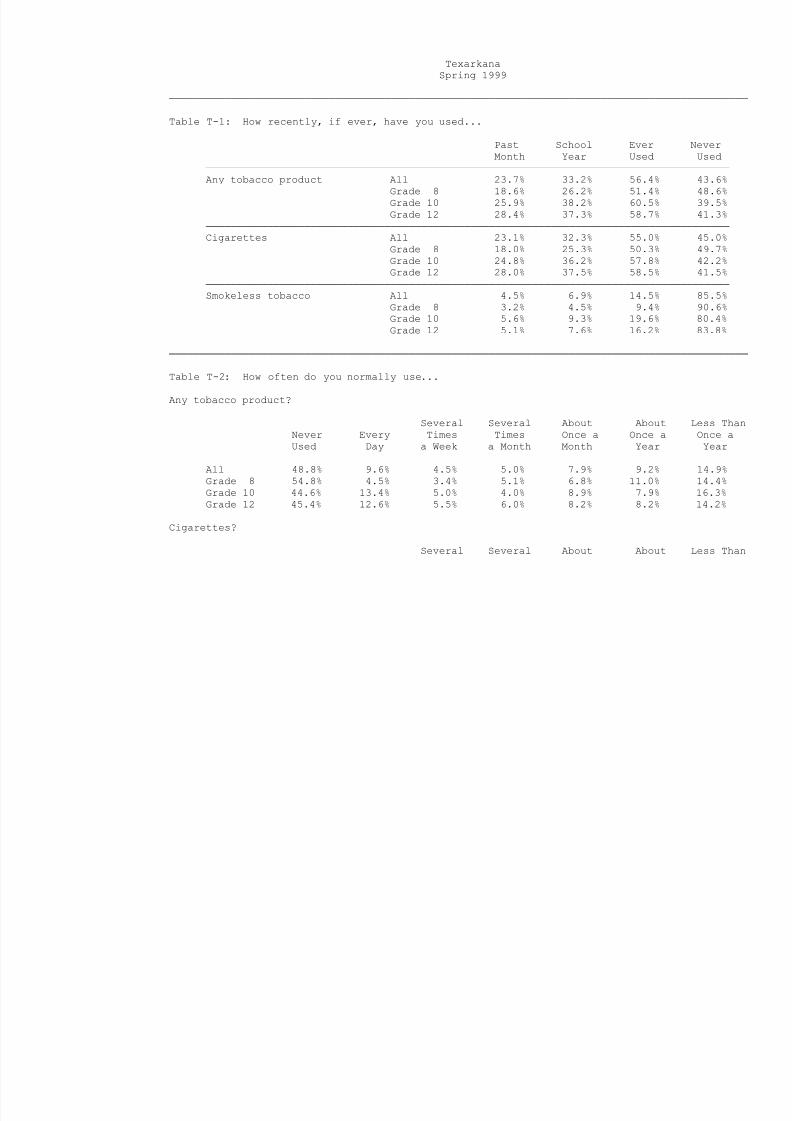
Cigarettes?
Several Several About About Less Than
8/14/2019 BOWIE COUNTY - Texarkana ISD - 1999 Texas School Survey of Drug and Alcohol Use
http://slidepdf.com/reader/full/bowie-county-texarkana-isd-1999-texas-school-survey-of-drug-and-alcohol 3/185
Never Every Times Times Once a Once a Once a
Used Day a Week a Month Month Year Year
All 48.3% 9.5% 4.6% 4.8% 8.1% 9.4% 15.3%
Grade 8 54.7% 4.2% 3.5% 4.2% 7.4% 11.2% 14.7%
Grade 10 44.1% 12.8% 5.1% 4.1% 9.2% 7.7% 16.9%
Grade 12 44.0% 13.1% 5.7% 6.3% 8.0% 8.6% 14.3%
Smokeless tobacco?
Several Several About About Less Than
Never Every Times Times Once a Once a Once a
Used Day a Week a Month Month Year Year
All 85.8% 0.7% 0.8% 1.2% 3.3% 3.0% 5.2%
Grade 8 89.3% 0.4% 0.7% 1.9% 2.6% 3.3% 1.9%
Grade 10 81.3% 1.6% 0.5% 1.6% 3.3% 3.3% 8.2%
Grade 12 85.8% * % 1.2% * % 4.1% 2.4% 6.5%
8/14/2019 BOWIE COUNTY - Texarkana ISD - 1999 Texas School Survey of Drug and Alcohol Use
http://slidepdf.com/reader/full/bowie-county-texarkana-isd-1999-texas-school-survey-of-drug-and-alcohol 4/185
Texarkana
Spring 1999
──────────────────────────────────────────────────────────────────────────────────────────────
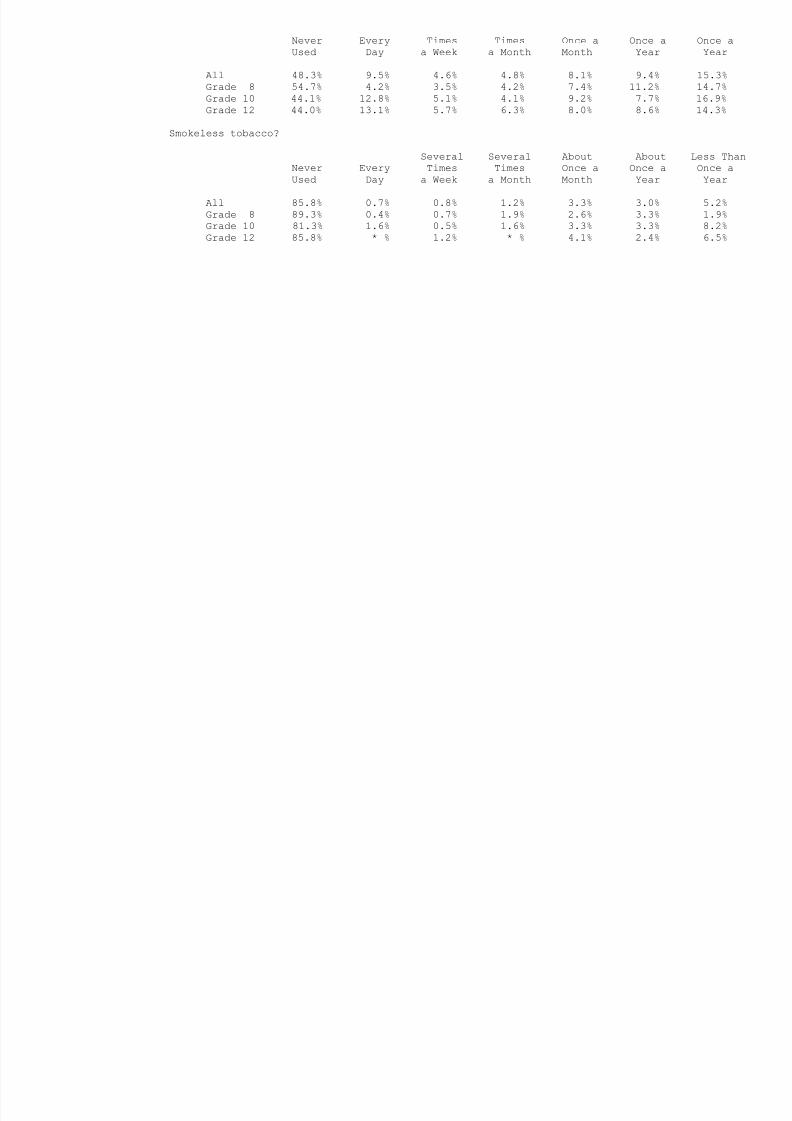
Table T-3: In the past 30 days, how many cigarettes have you smoked?
>1 But >10 But >1 Pack
<1 Per <10 Per <1 Pack But <2 >2 Packs
None Day Day Per Day Packs/Day Per Day
All 74.8% 11.4% 9.1% 2.8% 1.6% 0.3%
Grade 8 81.4% 11.5% 5.4% 1.0% 0.7% * %
Grade 10 71.6% 9.5% 12.3% 4.3% 1.4% 0.9%
Grade 12 69.5% 13.2% 10.5% 3.7% 3.2% * %
──────────────────────────────────────────────────────────────────────────────────────────────
Table T-4: Average age of first use of:
Grade 8 Grade 10 Grade 12
Tobacco 11.4 12.2 13.8
──────────────────────────────────────────────────────────────────────────────────────────────
Table T-5: If you wanted some, how difficult would it be to get...
Cigarettes?
Never Very Somewhat Somewhat Very
Heard Of Impossible Difficult Difficult Easy Easy
All 4.9% 10.4% 3.4% 4.8% 18.1% 58.4%
Grade 8 8.5% 17.6% 5.5% 8.5% 23.5% 36.5%
Grade 10 3.4% 6.7% 3.4% 4.3% 17.3% 64.9%
Grade 12 1.6% 4.3% 0.5% * % 11.4% 82.2%
Smokeless Tobacco?
Never Very Somewhat Somewhat Very
Heard Of Impossible Difficult Difficult Easy Easy
8/14/2019 BOWIE COUNTY - Texarkana ISD - 1999 Texas School Survey of Drug and Alcohol Use
http://slidepdf.com/reader/full/bowie-county-texarkana-isd-1999-texas-school-survey-of-drug-and-alcohol 5/185
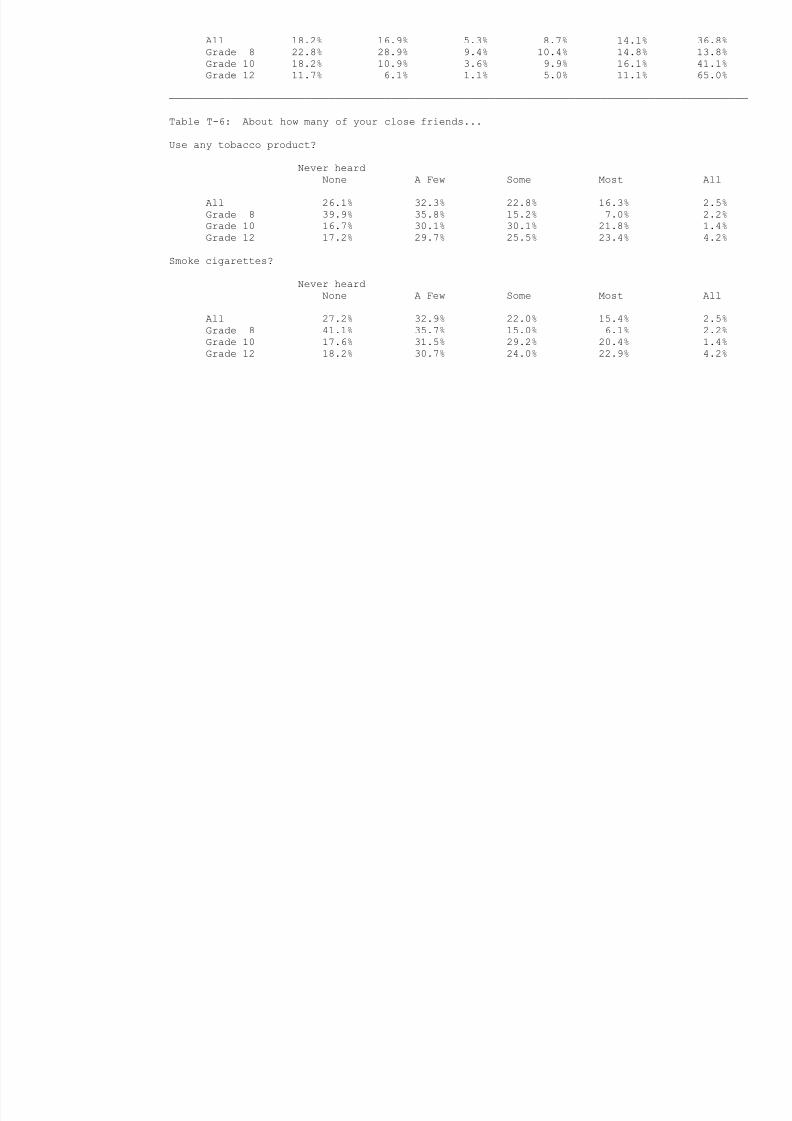
All 18.2% 16.9% 5.3% 8.7% 14.1% 36.8%
Grade 8 22.8% 28.9% 9.4% 10.4% 14.8% 13.8%
Grade 10 18.2% 10.9% 3.6% 9.9% 16.1% 41.1%
Grade 12 11.7% 6.1% 1.1% 5.0% 11.1% 65.0%
──────────────────────────────────────────────────────────────────────────────────────────────
Table T-6: About how many of your close friends...
Use any tobacco product?
Never heard
None A Few Some Most All
All 26.1% 32.3% 22.8% 16.3% 2.5%
Grade 8 39.9% 35.8% 15.2% 7.0% 2.2%
Grade 10 16.7% 30.1% 30.1% 21.8% 1.4%
Grade 12 17.2% 29.7% 25.5% 23.4% 4.2%
Smoke cigarettes?
Never heard
None A Few Some Most All
All 27.2% 32.9% 22.0% 15.4% 2.5%
Grade 8 41.1% 35.7% 15.0% 6.1% 2.2%
Grade 10 17.6% 31.5% 29.2% 20.4% 1.4%
Grade 12 18.2% 30.7% 24.0% 22.9% 4.2%
8/14/2019 BOWIE COUNTY - Texarkana ISD - 1999 Texas School Survey of Drug and Alcohol Use
http://slidepdf.com/reader/full/bowie-county-texarkana-isd-1999-texas-school-survey-of-drug-and-alcohol 6/185
Texarkana
Spring 1999
──────────────────────────────────────────────────────────────────────────────────────────────
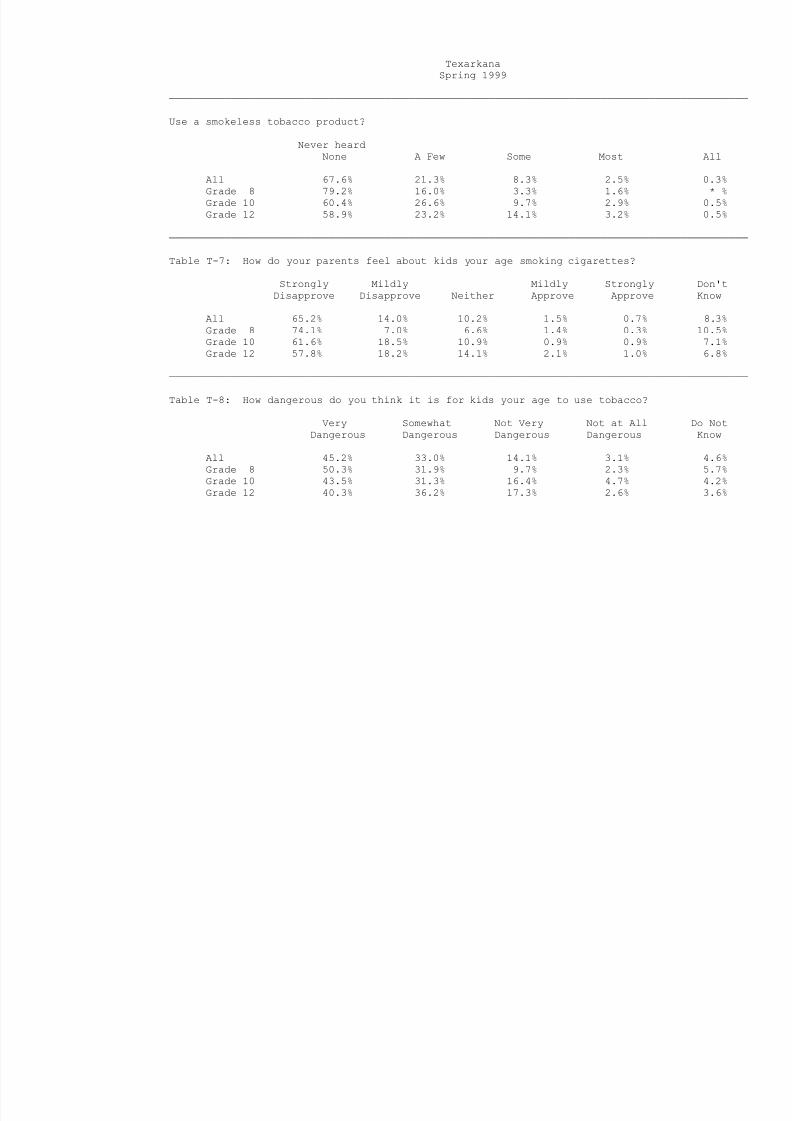
Use a smokeless tobacco product?
Never heard
None A Few Some Most All
All 67.6% 21.3% 8.3% 2.5% 0.3%
Grade 8 79.2% 16.0% 3.3% 1.6% * %
Grade 10 60.4% 26.6% 9.7% 2.9% 0.5%
Grade 12 58.9% 23.2% 14.1% 3.2% 0.5%
──────────────────────────────────────────────────────────────────────────────────────────────
Table T-7: How do your parents feel about kids your age smoking cigarettes?
Strongly Mildly Mildly Strongly Don't
Disapprove Disapprove Neither Approve Approve Know
All 65.2% 14.0% 10.2% 1.5% 0.7% 8.3%
Grade 8 74.1% 7.0% 6.6% 1.4% 0.3% 10.5%
Grade 10 61.6% 18.5% 10.9% 0.9% 0.9% 7.1%
Grade 12 57.8% 18.2% 14.1% 2.1% 1.0% 6.8%
──────────────────────────────────────────────────────────────────────────────────────────────
Table T-8: How dangerous do you think it is for kids your age to use tobacco?
Very Somewhat Not Very Not at All Do Not
Dangerous Dangerous Dangerous Dangerous Know
All 45.2% 33.0% 14.1% 3.1% 4.6%
Grade 8 50.3% 31.9% 9.7% 2.3% 5.7%
Grade 10 43.5% 31.3% 16.4% 4.7% 4.2%
Grade 12 40.3% 36.2% 17.3% 2.6% 3.6%

8/14/2019 BOWIE COUNTY - Texarkana ISD - 1999 Texas School Survey of Drug and Alcohol Use
http://slidepdf.com/reader/full/bowie-county-texarkana-isd-1999-texas-school-survey-of-drug-and-alcohol 7/185
8/14/2019 BOWIE COUNTY - Texarkana ISD - 1999 Texas School Survey of Drug and Alcohol Use
http://slidepdf.com/reader/full/bowie-county-texarkana-isd-1999-texas-school-survey-of-drug-and-alcohol 8/185
Texarkana
Spring 1999
──────────────────────────────────────────────────────────────────────────────────────────────
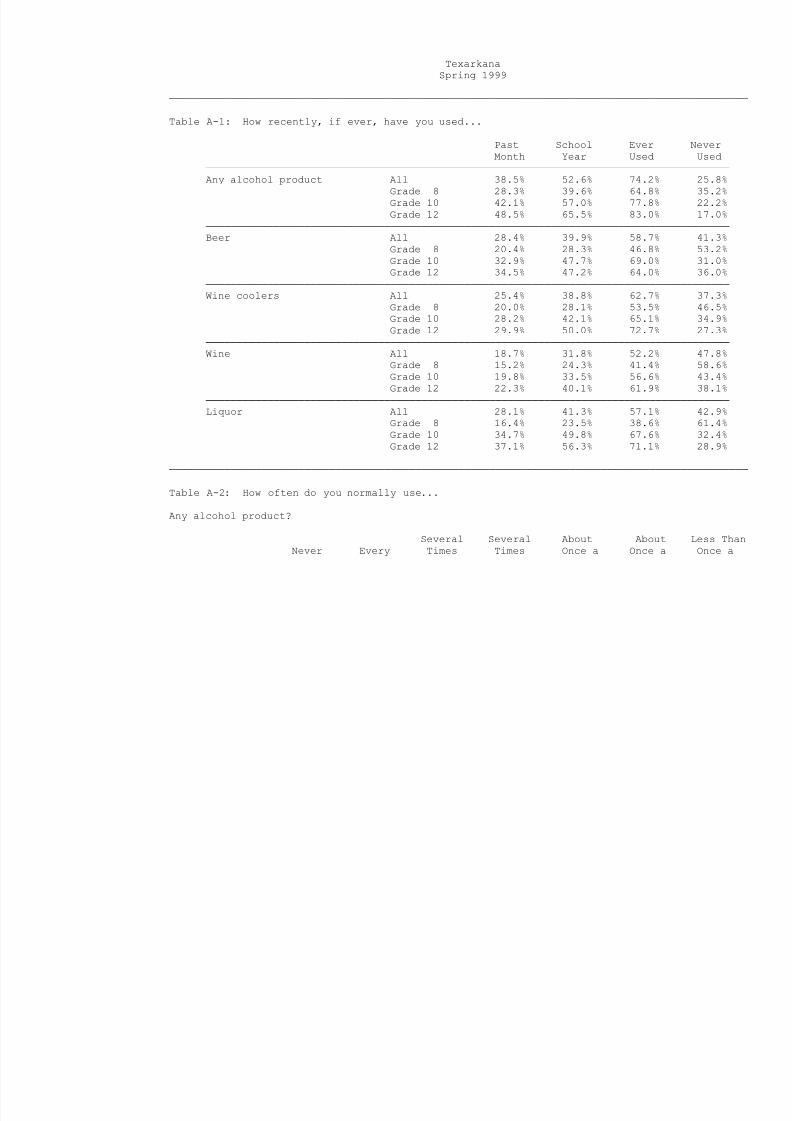
Table A-1: How recently, if ever, have you used...
Past School Ever Never
Month Year Used Used
─────────────────────────────────────────────────────────────────────────────────────
Any alcohol product All 38.5% 52.6% 74.2% 25.8%
Grade 8 28.3% 39.6% 64.8% 35.2%
Grade 10 42.1% 57.0% 77.8% 22.2%
Grade 12 48.5% 65.5% 83.0% 17.0%
─────────────────────────────────────────────────────────────────────────────────────
Beer All 28.4% 39.9% 58.7% 41.3%
Grade 8 20.4% 28.3% 46.8% 53.2%
Grade 10 32.9% 47.7% 69.0% 31.0%
Grade 12 34.5% 47.2% 64.0% 36.0%─────────────────────────────────────────────────────────────────────────────────────
Wine coolers All 25.4% 38.8% 62.7% 37.3%
Grade 8 20.0% 28.1% 53.5% 46.5%
Grade 10 28.2% 42.1% 65.1% 34.9%
Grade 12 29.9% 50.0% 72.7% 27.3%
─────────────────────────────────────────────────────────────────────────────────────
Wine All 18.7% 31.8% 52.2% 47.8%
Grade 8 15.2% 24.3% 41.4% 58.6%
Grade 10 19.8% 33.5% 56.6% 43.4%
Grade 12 22.3% 40.1% 61.9% 38.1%
─────────────────────────────────────────────────────────────────────────────────────
Liquor All 28.1% 41.3% 57.1% 42.9%
Grade 8 16.4% 23.5% 38.6% 61.4%
Grade 10 34.7% 49.8% 67.6% 32.4%
Grade 12 37.1% 56.3% 71.1% 28.9%
──────────────────────────────────────────────────────────────────────────────────────────────
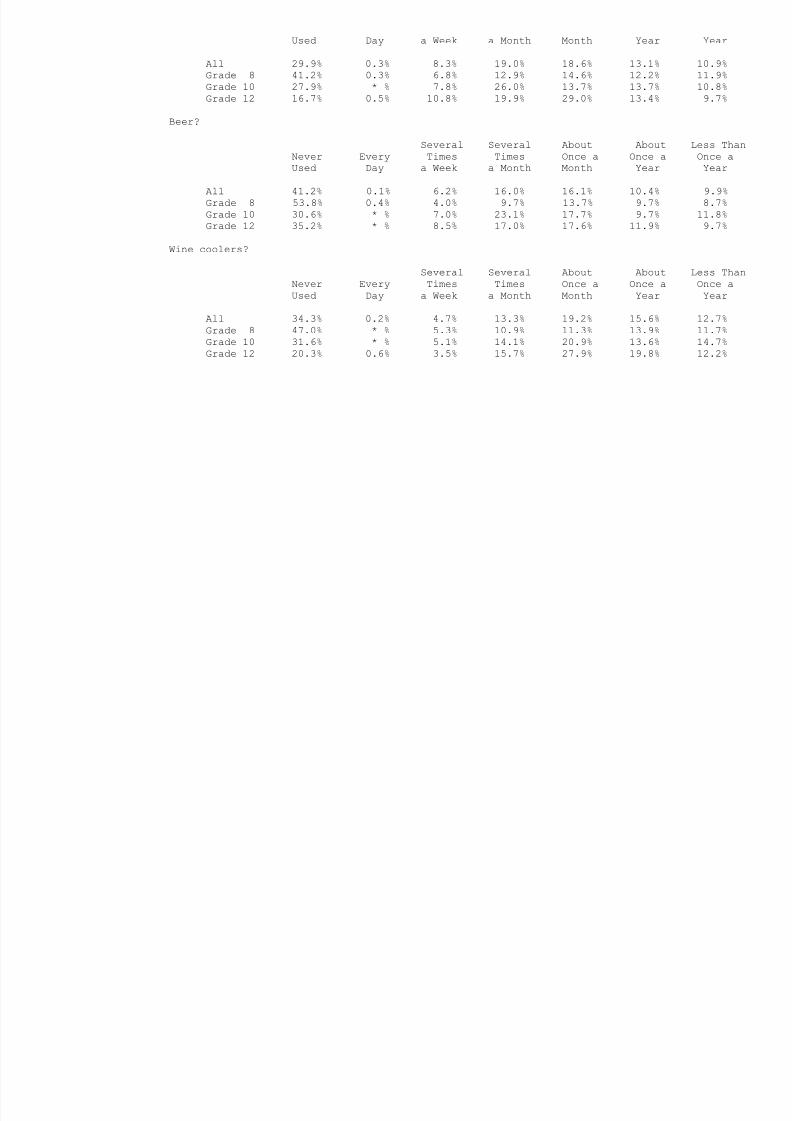
Table A-2: How often do you normally use...
Any alcohol product?
Several Several About About Less ThanNever Every Times Times Once a Once a Once a
8/14/2019 BOWIE COUNTY - Texarkana ISD - 1999 Texas School Survey of Drug and Alcohol Use
http://slidepdf.com/reader/full/bowie-county-texarkana-isd-1999-texas-school-survey-of-drug-and-alcohol 9/185
Used Day a Week a Month Month Year Year
All 29.9% 0.3% 8.3% 19.0% 18.6% 13.1% 10.9%
Grade 8 41.2% 0.3% 6.8% 12.9% 14.6% 12.2% 11.9%
Grade 10 27.9% * % 7.8% 26.0% 13.7% 13.7% 10.8%
Grade 12 16.7% 0.5% 10.8% 19.9% 29.0% 13.4% 9.7%
Beer?
Several Several About About Less Than
Never Every Times Times Once a Once a Once a
Used Day a Week a Month Month Year Year
All 41.2% 0.1% 6.2% 16.0% 16.1% 10.4% 9.9%
Grade 8 53.8% 0.4% 4.0% 9.7% 13.7% 9.7% 8.7%
Grade 10 30.6% * % 7.0% 23.1% 17.7% 9.7% 11.8%
Grade 12 35.2% * % 8.5% 17.0% 17.6% 11.9% 9.7%
Wine coolers?
Several Several About About Less ThanNever Every Times Times Once a Once a Once a
Used Day a Week a Month Month Year Year
All 34.3% 0.2% 4.7% 13.3% 19.2% 15.6% 12.7%
Grade 8 47.0% * % 5.3% 10.9% 11.3% 13.9% 11.7%
Grade 10 31.6% * % 5.1% 14.1% 20.9% 13.6% 14.7%
Grade 12 20.3% 0.6% 3.5% 15.7% 27.9% 19.8% 12.2%
8/14/2019 BOWIE COUNTY - Texarkana ISD - 1999 Texas School Survey of Drug and Alcohol Use
http://slidepdf.com/reader/full/bowie-county-texarkana-isd-1999-texas-school-survey-of-drug-and-alcohol 10/185
Texarkana
Spring 1999
──────────────────────────────────────────────────────────────────────────────────────────────
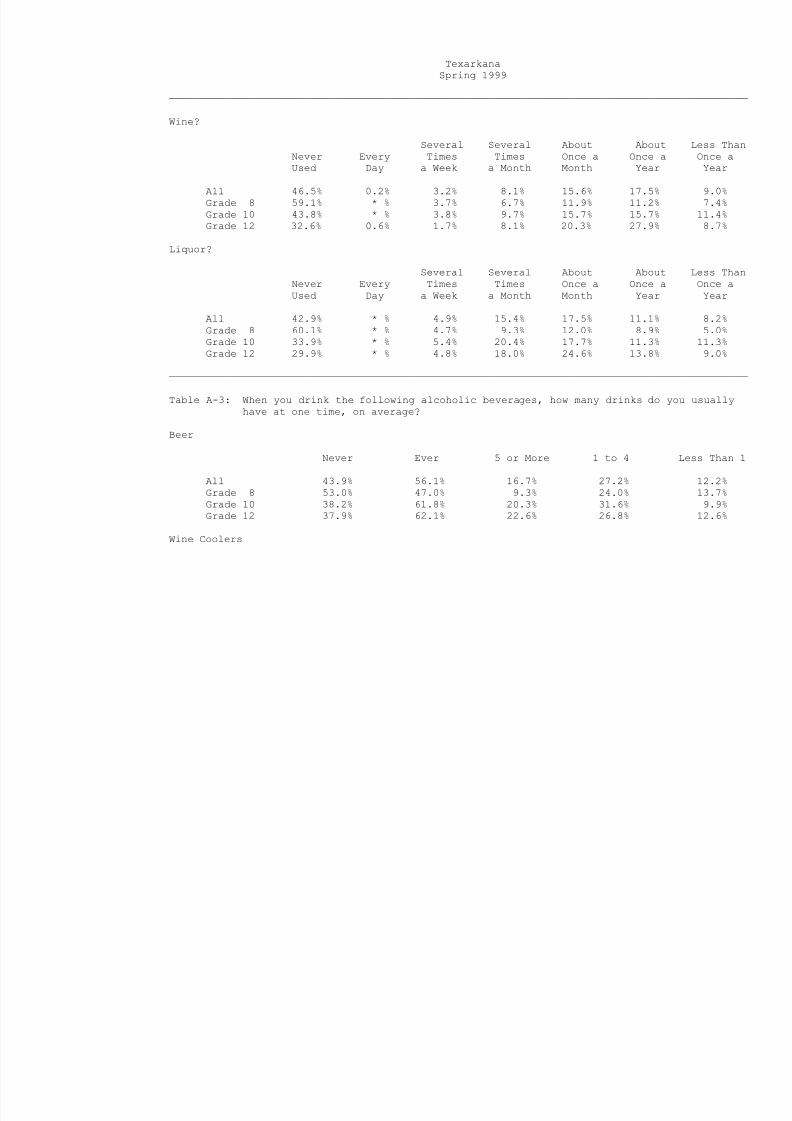
Wine?
Several Several About About Less Than
Never Every Times Times Once a Once a Once a
Used Day a Week a Month Month Year Year
All 46.5% 0.2% 3.2% 8.1% 15.6% 17.5% 9.0%
Grade 8 59.1% * % 3.7% 6.7% 11.9% 11.2% 7.4%
Grade 10 43.8% * % 3.8% 9.7% 15.7% 15.7% 11.4%
Grade 12 32.6% 0.6% 1.7% 8.1% 20.3% 27.9% 8.7%
Liquor?
Several Several About About Less ThanNever Every Times Times Once a Once a Once a
Used Day a Week a Month Month Year Year
All 42.9% * % 4.9% 15.4% 17.5% 11.1% 8.2%
Grade 8 60.1% * % 4.7% 9.3% 12.0% 8.9% 5.0%
Grade 10 33.9% * % 5.4% 20.4% 17.7% 11.3% 11.3%
Grade 12 29.9% * % 4.8% 18.0% 24.6% 13.8% 9.0%
──────────────────────────────────────────────────────────────────────────────────────────────
Table A-3: When you drink the following alcoholic beverages, how many drinks do you usually
have at one time, on average?
Beer
Never Ever 5 or More 1 to 4 Less Than 1
All 43.9% 56.1% 16.7% 27.2% 12.2%
Grade 8 53.0% 47.0% 9.3% 24.0% 13.7%
Grade 10 38.2% 61.8% 20.3% 31.6% 9.9%
Grade 12 37.9% 62.1% 22.6% 26.8% 12.6%
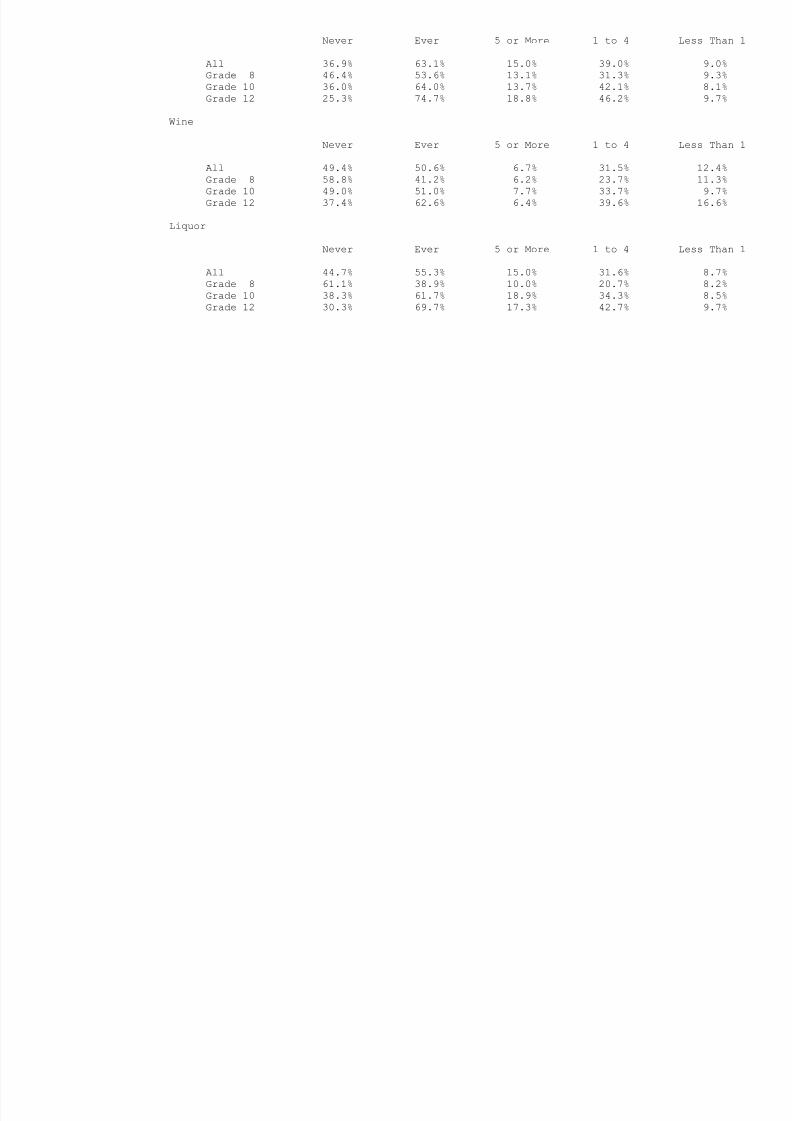
Wine Coolers
8/14/2019 BOWIE COUNTY - Texarkana ISD - 1999 Texas School Survey of Drug and Alcohol Use
http://slidepdf.com/reader/full/bowie-county-texarkana-isd-1999-texas-school-survey-of-drug-and-alcohol 11/185
Never Ever 5 or More 1 to 4 Less Than 1
All 36.9% 63.1% 15.0% 39.0% 9.0%
Grade 8 46.4% 53.6% 13.1% 31.3% 9.3%
Grade 10 36.0% 64.0% 13.7% 42.1% 8.1%
Grade 12 25.3% 74.7% 18.8% 46.2% 9.7%
Wine
Never Ever 5 or More 1 to 4 Less Than 1
All 49.4% 50.6% 6.7% 31.5% 12.4%
Grade 8 58.8% 41.2% 6.2% 23.7% 11.3%
Grade 10 49.0% 51.0% 7.7% 33.7% 9.7%
Grade 12 37.4% 62.6% 6.4% 39.6% 16.6%
Liquor
Never Ever 5 or More 1 to 4 Less Than 1
All 44.7% 55.3% 15.0% 31.6% 8.7%Grade 8 61.1% 38.9% 10.0% 20.7% 8.2%
Grade 10 38.3% 61.7% 18.9% 34.3% 8.5%
Grade 12 30.3% 69.7% 17.3% 42.7% 9.7%
8/14/2019 BOWIE COUNTY - Texarkana ISD - 1999 Texas School Survey of Drug and Alcohol Use
http://slidepdf.com/reader/full/bowie-county-texarkana-isd-1999-texas-school-survey-of-drug-and-alcohol 12/185
Texarkana
Spring 1999
──────────────────────────────────────────────────────────────────────────────────────────────
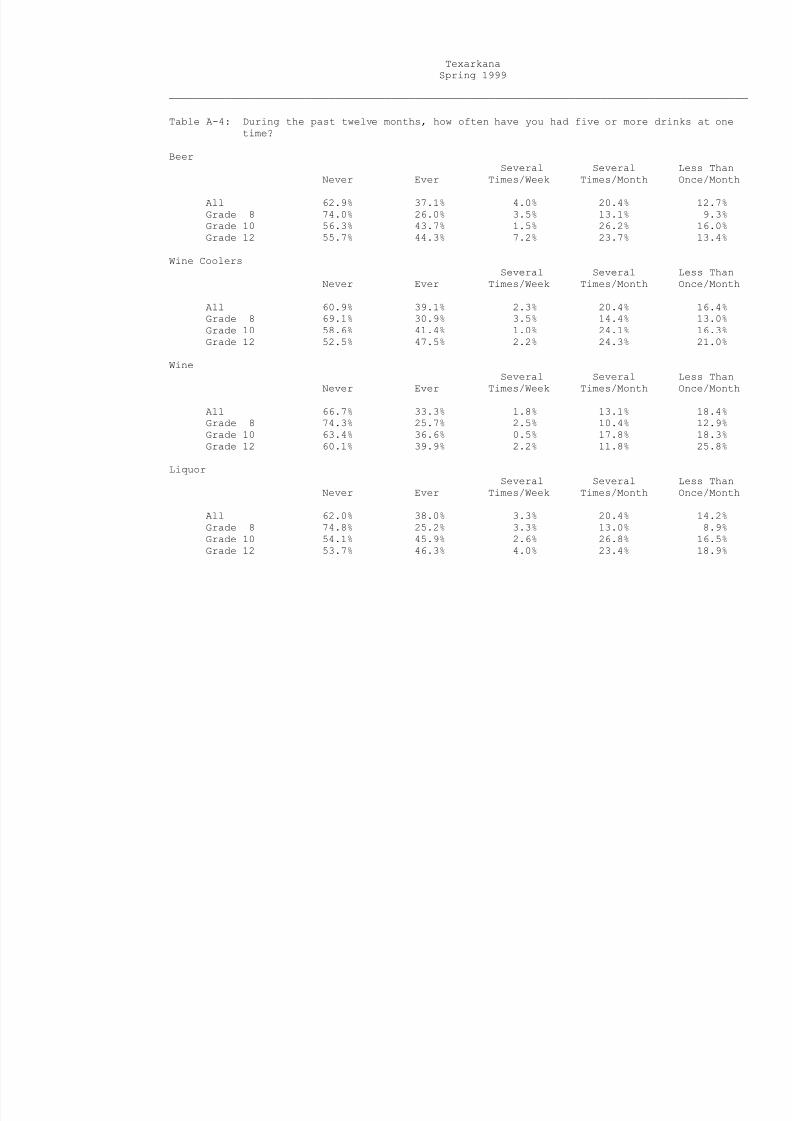
Table A-4: During the past twelve months, how often have you had five or more drinks at one
time?
Beer
Several Several Less Than
Never Ever Times/Week Times/Month Once/Month
All 62.9% 37.1% 4.0% 20.4% 12.7%
Grade 8 74.0% 26.0% 3.5% 13.1% 9.3%
Grade 10 56.3% 43.7% 1.5% 26.2% 16.0%
Grade 12 55.7% 44.3% 7.2% 23.7% 13.4%
Wine Coolers
Several Several Less ThanNever Ever Times/Week Times/Month Once/Month
All 60.9% 39.1% 2.3% 20.4% 16.4%
Grade 8 69.1% 30.9% 3.5% 14.4% 13.0%
Grade 10 58.6% 41.4% 1.0% 24.1% 16.3%
Grade 12 52.5% 47.5% 2.2% 24.3% 21.0%
Wine
Several Several Less Than
Never Ever Times/Week Times/Month Once/Month
All 66.7% 33.3% 1.8% 13.1% 18.4%
Grade 8 74.3% 25.7% 2.5% 10.4% 12.9%
Grade 10 63.4% 36.6% 0.5% 17.8% 18.3%
Grade 12 60.1% 39.9% 2.2% 11.8% 25.8%
Liquor
Several Several Less Than
Never Ever Times/Week Times/Month Once/Month
All 62.0% 38.0% 3.3% 20.4% 14.2%
Grade 8 74.8% 25.2% 3.3% 13.0% 8.9%
Grade 10 54.1% 45.9% 2.6% 26.8% 16.5%Grade 12 53.7% 46.3% 4.0% 23.4% 18.9%
8/14/2019 BOWIE COUNTY - Texarkana ISD - 1999 Texas School Survey of Drug and Alcohol Use
http://slidepdf.com/reader/full/bowie-county-texarkana-isd-1999-texas-school-survey-of-drug-and-alcohol 13/185
──────────────────────────────────────────────────────────────────────────────────────────────
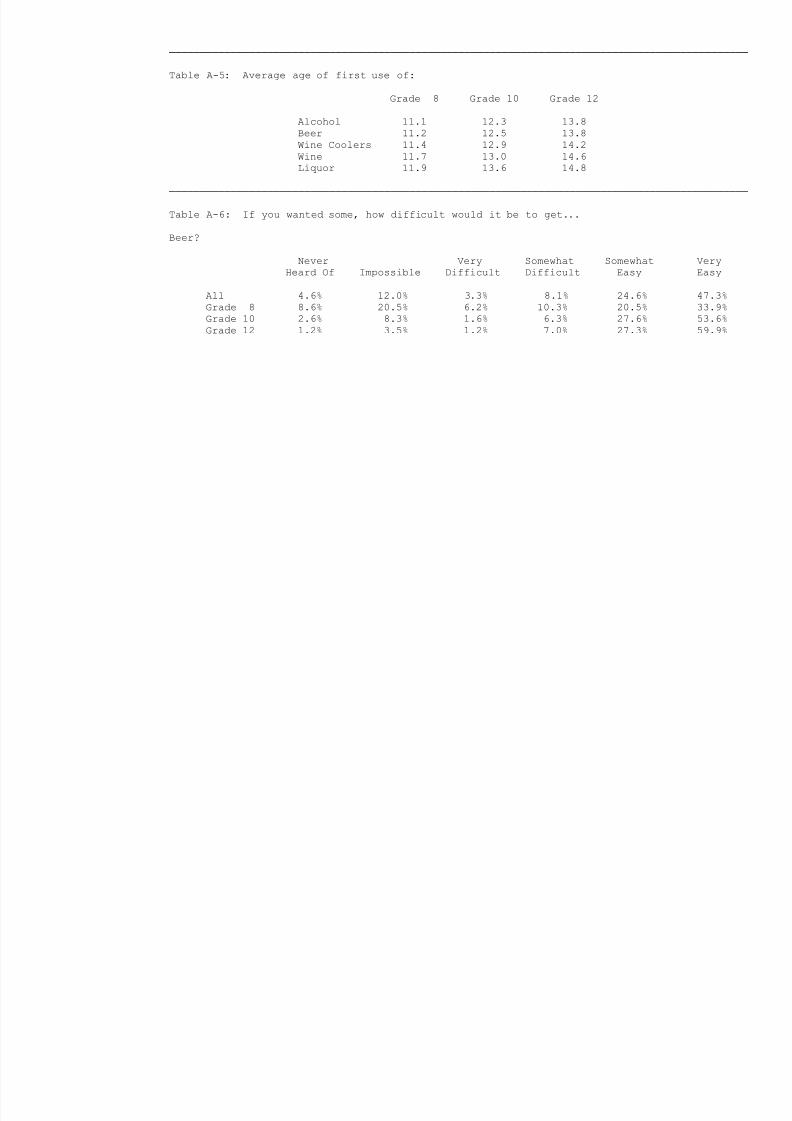
Table A-5: Average age of first use of:
Grade 8 Grade 10 Grade 12
Alcohol 11.1 12.3 13.8
Beer 11.2 12.5 13.8Wine Coolers 11.4 12.9 14.2
Wine 11.7 13.0 14.6
Liquor 11.9 13.6 14.8
──────────────────────────────────────────────────────────────────────────────────────────────
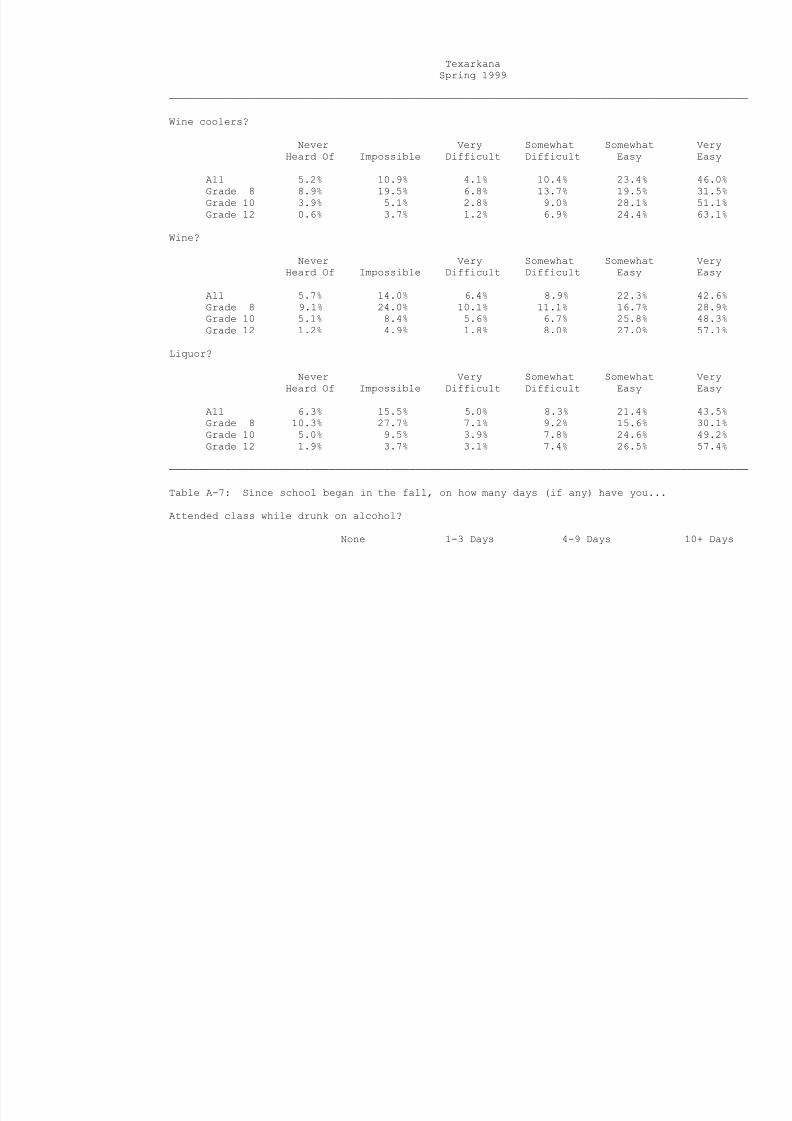
Table A-6: If you wanted some, how difficult would it be to get...
Beer?
Never Very Somewhat Somewhat Very
Heard Of Impossible Difficult Difficult Easy Easy
All 4.6% 12.0% 3.3% 8.1% 24.6% 47.3%
Grade 8 8.6% 20.5% 6.2% 10.3% 20.5% 33.9%
Grade 10 2.6% 8.3% 1.6% 6.3% 27.6% 53.6%
Grade 12 1.2% 3.5% 1.2% 7.0% 27.3% 59.9%
8/14/2019 BOWIE COUNTY - Texarkana ISD - 1999 Texas School Survey of Drug and Alcohol Use
http://slidepdf.com/reader/full/bowie-county-texarkana-isd-1999-texas-school-survey-of-drug-and-alcohol 14/185
Texarkana
Spring 1999
──────────────────────────────────────────────────────────────────────────────────────────────
Wine coolers?
Never Very Somewhat Somewhat Very
Heard Of Impossible Difficult Difficult Easy Easy
All 5.2% 10.9% 4.1% 10.4% 23.4% 46.0%
Grade 8 8.9% 19.5% 6.8% 13.7% 19.5% 31.5%
Grade 10 3.9% 5.1% 2.8% 9.0% 28.1% 51.1%
Grade 12 0.6% 3.7% 1.2% 6.9% 24.4% 63.1%
Wine?
Never Very Somewhat Somewhat Very
Heard Of Impossible Difficult Difficult Easy Easy
All 5.7% 14.0% 6.4% 8.9% 22.3% 42.6%
Grade 8 9.1% 24.0% 10.1% 11.1% 16.7% 28.9%
Grade 10 5.1% 8.4% 5.6% 6.7% 25.8% 48.3%
Grade 12 1.2% 4.9% 1.8% 8.0% 27.0% 57.1%
Liquor?
Never Very Somewhat Somewhat Very
Heard Of Impossible Difficult Difficult Easy Easy
All 6.3% 15.5% 5.0% 8.3% 21.4% 43.5%Grade 8 10.3% 27.7% 7.1% 9.2% 15.6% 30.1%
Grade 10 5.0% 9.5% 3.9% 7.8% 24.6% 49.2%
Grade 12 1.9% 3.7% 3.1% 7.4% 26.5% 57.4%
──────────────────────────────────────────────────────────────────────────────────────────────
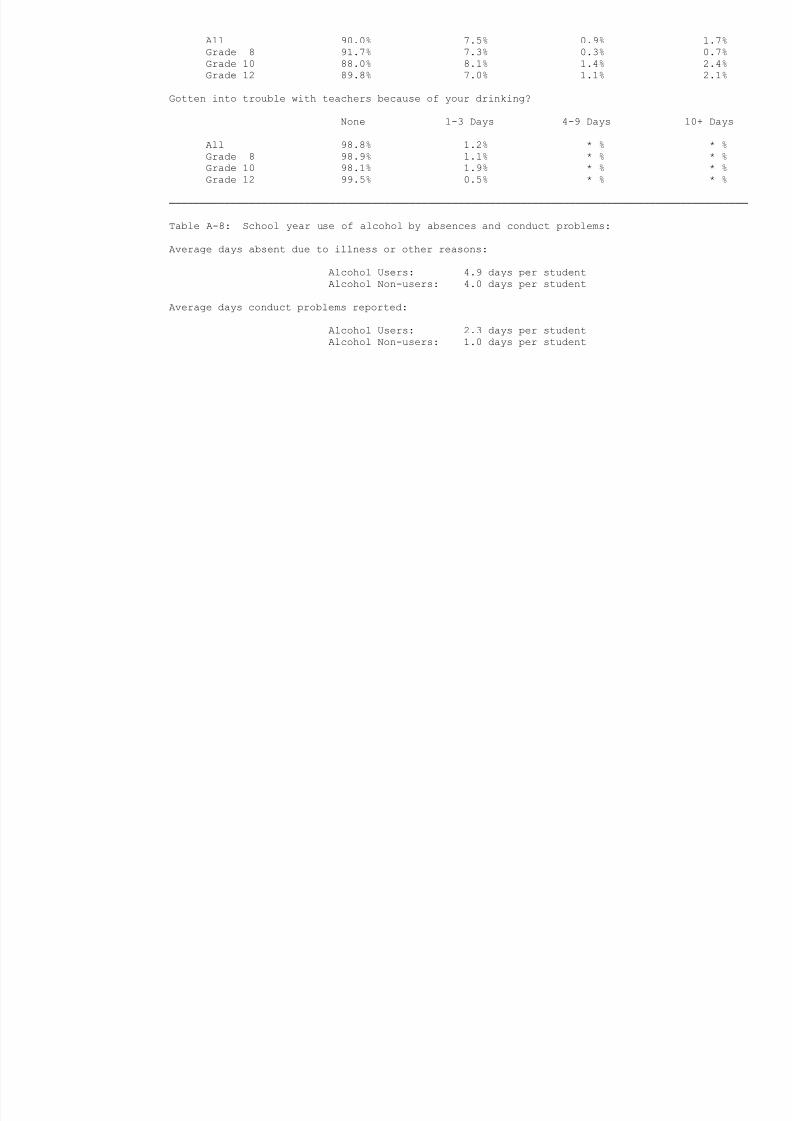
Table A-7: Since school began in the fall, on how many days (if any) have you...
Attended class while drunk on alcohol?
None 1-3 Days 4-9 Days 10+ Days
8/14/2019 BOWIE COUNTY - Texarkana ISD - 1999 Texas School Survey of Drug and Alcohol Use
http://slidepdf.com/reader/full/bowie-county-texarkana-isd-1999-texas-school-survey-of-drug-and-alcohol 15/185
All 90.0% 7.5% 0.9% 1.7%
Grade 8 91.7% 7.3% 0.3% 0.7%
Grade 10 88.0% 8.1% 1.4% 2.4%
Grade 12 89.8% 7.0% 1.1% 2.1%
Gotten into trouble with teachers because of your drinking?
None 1-3 Days 4-9 Days 10+ Days
All 98.8% 1.2% * % * %
Grade 8 98.9% 1.1% * % * %
Grade 10 98.1% 1.9% * % * %
Grade 12 99.5% 0.5% * % * %
──────────────────────────────────────────────────────────────────────────────────────────────
Table A-8: School year use of alcohol by absences and conduct problems:
Average days absent due to illness or other reasons:
Alcohol Users: 4.9 days per studentAlcohol Non-users: 4.0 days per student
Average days conduct problems reported:
Alcohol Users: 2.3 days per student
Alcohol Non-users: 1.0 days per student
8/14/2019 BOWIE COUNTY - Texarkana ISD - 1999 Texas School Survey of Drug and Alcohol Use
http://slidepdf.com/reader/full/bowie-county-texarkana-isd-1999-texas-school-survey-of-drug-and-alcohol 16/185
Texarkana
Spring 1999
──────────────────────────────────────────────────────────────────────────────────────────────
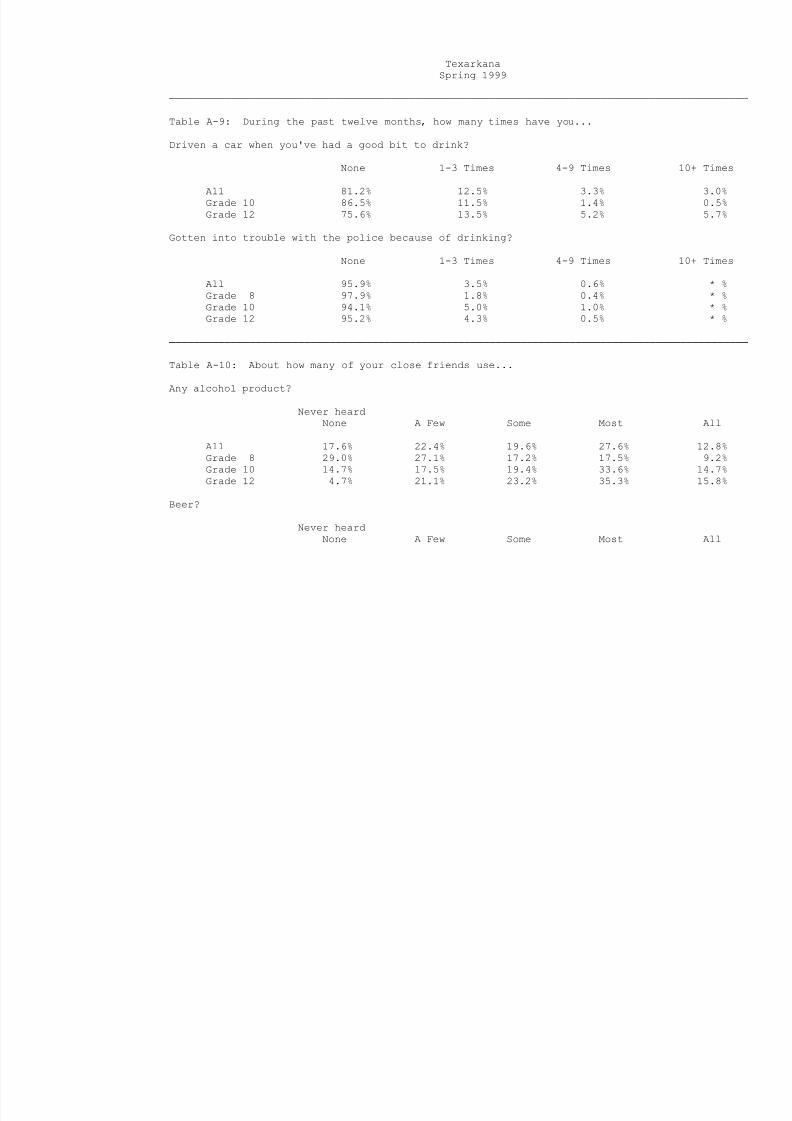
Table A-9: During the past twelve months, how many times have you...
Driven a car when you've had a good bit to drink?
None 1-3 Times 4-9 Times 10+ Times
All 81.2% 12.5% 3.3% 3.0%
Grade 10 86.5% 11.5% 1.4% 0.5%
Grade 12 75.6% 13.5% 5.2% 5.7%
Gotten into trouble with the police because of drinking?
None 1-3 Times 4-9 Times 10+ Times
All 95.9% 3.5% 0.6% * %
Grade 8 97.9% 1.8% 0.4% * %
Grade 10 94.1% 5.0% 1.0% * %
Grade 12 95.2% 4.3% 0.5% * %
──────────────────────────────────────────────────────────────────────────────────────────────
Table A-10: About how many of your close friends use...
Any alcohol product?
Never heardNone A Few Some Most All
All 17.6% 22.4% 19.6% 27.6% 12.8%
Grade 8 29.0% 27.1% 17.2% 17.5% 9.2%
Grade 10 14.7% 17.5% 19.4% 33.6% 14.7%
Grade 12 4.7% 21.1% 23.2% 35.3% 15.8%
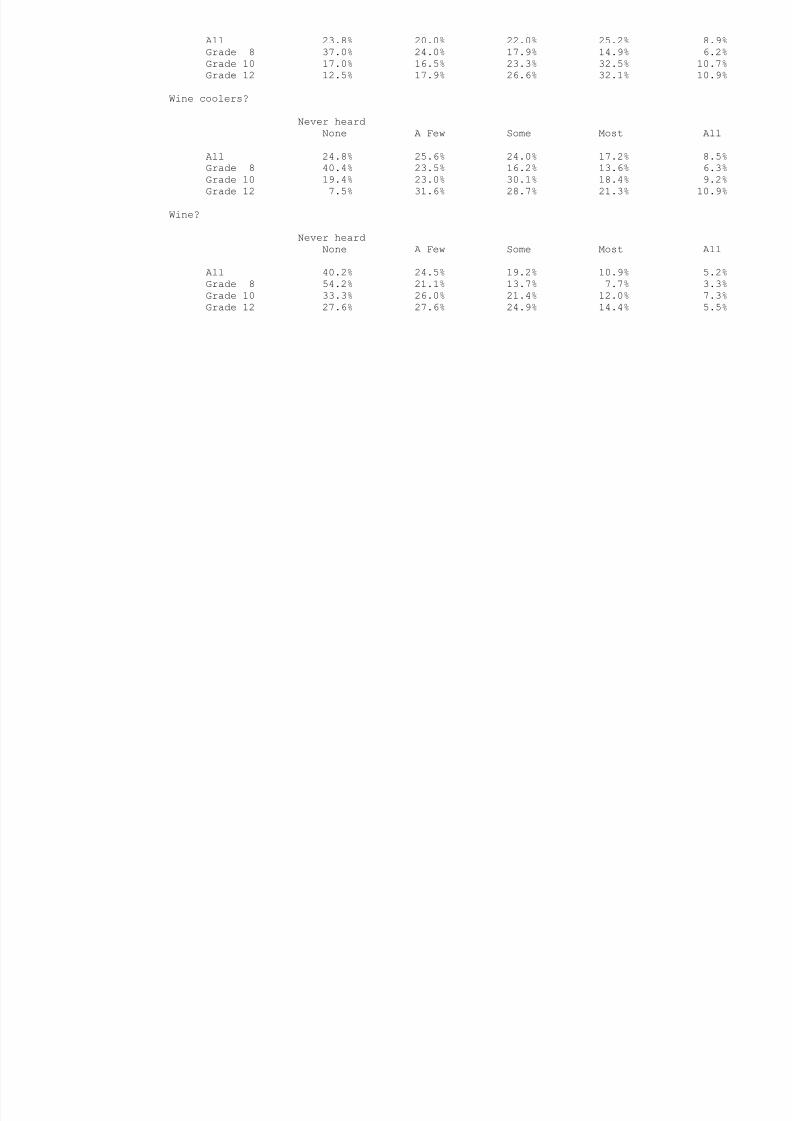
Beer?
Never heard
None A Few Some Most All
8/14/2019 BOWIE COUNTY - Texarkana ISD - 1999 Texas School Survey of Drug and Alcohol Use
http://slidepdf.com/reader/full/bowie-county-texarkana-isd-1999-texas-school-survey-of-drug-and-alcohol 17/185
All 23.8% 20.0% 22.0% 25.2% 8.9%
Grade 8 37.0% 24.0% 17.9% 14.9% 6.2%
Grade 10 17.0% 16.5% 23.3% 32.5% 10.7%
Grade 12 12.5% 17.9% 26.6% 32.1% 10.9%
Wine coolers?
Never heard
None A Few Some Most All
All 24.8% 25.6% 24.0% 17.2% 8.5%
Grade 8 40.4% 23.5% 16.2% 13.6% 6.3%
Grade 10 19.4% 23.0% 30.1% 18.4% 9.2%
Grade 12 7.5% 31.6% 28.7% 21.3% 10.9%
Wine?
Never heard
None A Few Some Most All
All 40.2% 24.5% 19.2% 10.9% 5.2%Grade 8 54.2% 21.1% 13.7% 7.7% 3.3%
Grade 10 33.3% 26.0% 21.4% 12.0% 7.3%
Grade 12 27.6% 27.6% 24.9% 14.4% 5.5%
8/14/2019 BOWIE COUNTY - Texarkana ISD - 1999 Texas School Survey of Drug and Alcohol Use
http://slidepdf.com/reader/full/bowie-county-texarkana-isd-1999-texas-school-survey-of-drug-and-alcohol 18/185
Texarkana
Spring 1999
──────────────────────────────────────────────────────────────────────────────────────────────
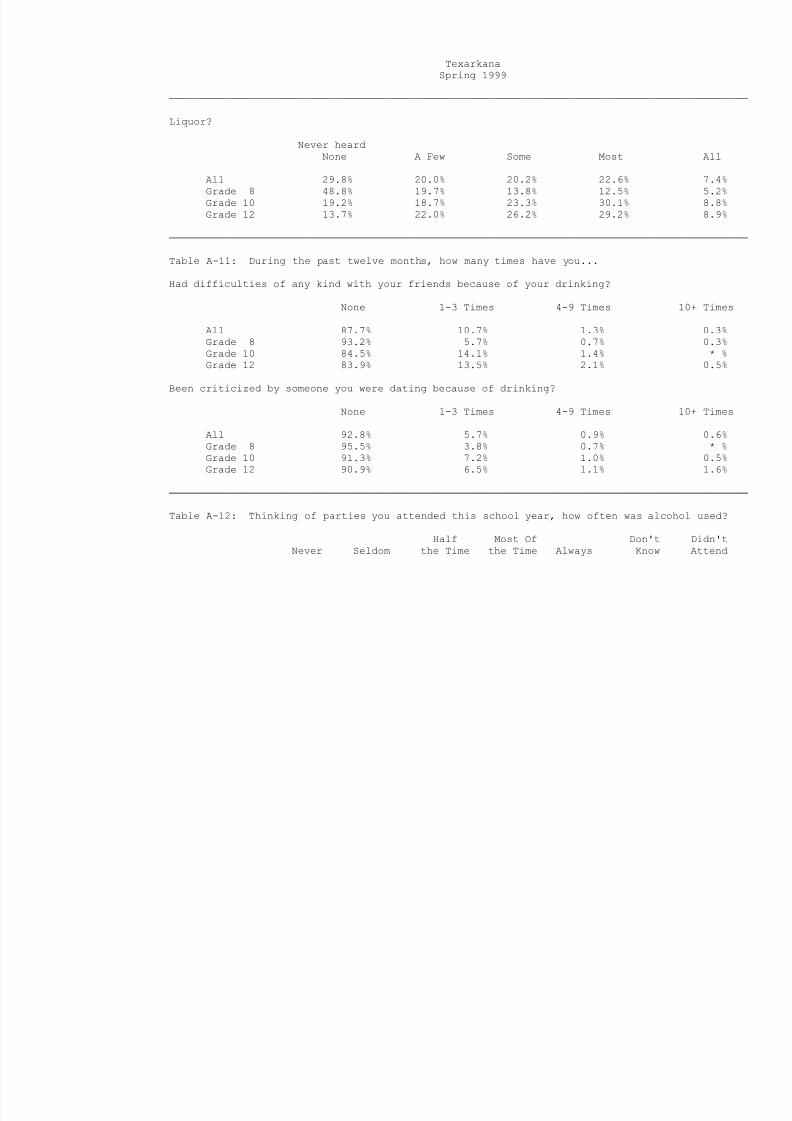
Liquor?
Never heard
None A Few Some Most All
All 29.8% 20.0% 20.2% 22.6% 7.4%
Grade 8 48.8% 19.7% 13.8% 12.5% 5.2%
Grade 10 19.2% 18.7% 23.3% 30.1% 8.8%
Grade 12 13.7% 22.0% 26.2% 29.2% 8.9%
──────────────────────────────────────────────────────────────────────────────────────────────
Table A-11: During the past twelve months, how many times have you...
Had difficulties of any kind with your friends because of your drinking?
None 1-3 Times 4-9 Times 10+ Times
All 87.7% 10.7% 1.3% 0.3%
Grade 8 93.2% 5.7% 0.7% 0.3%
Grade 10 84.5% 14.1% 1.4% * %
Grade 12 83.9% 13.5% 2.1% 0.5%
Been criticized by someone you were dating because of drinking?
None 1-3 Times 4-9 Times 10+ Times
All 92.8% 5.7% 0.9% 0.6%
Grade 8 95.5% 3.8% 0.7% * %
Grade 10 91.3% 7.2% 1.0% 0.5%
Grade 12 90.9% 6.5% 1.1% 1.6%
──────────────────────────────────────────────────────────────────────────────────────────────
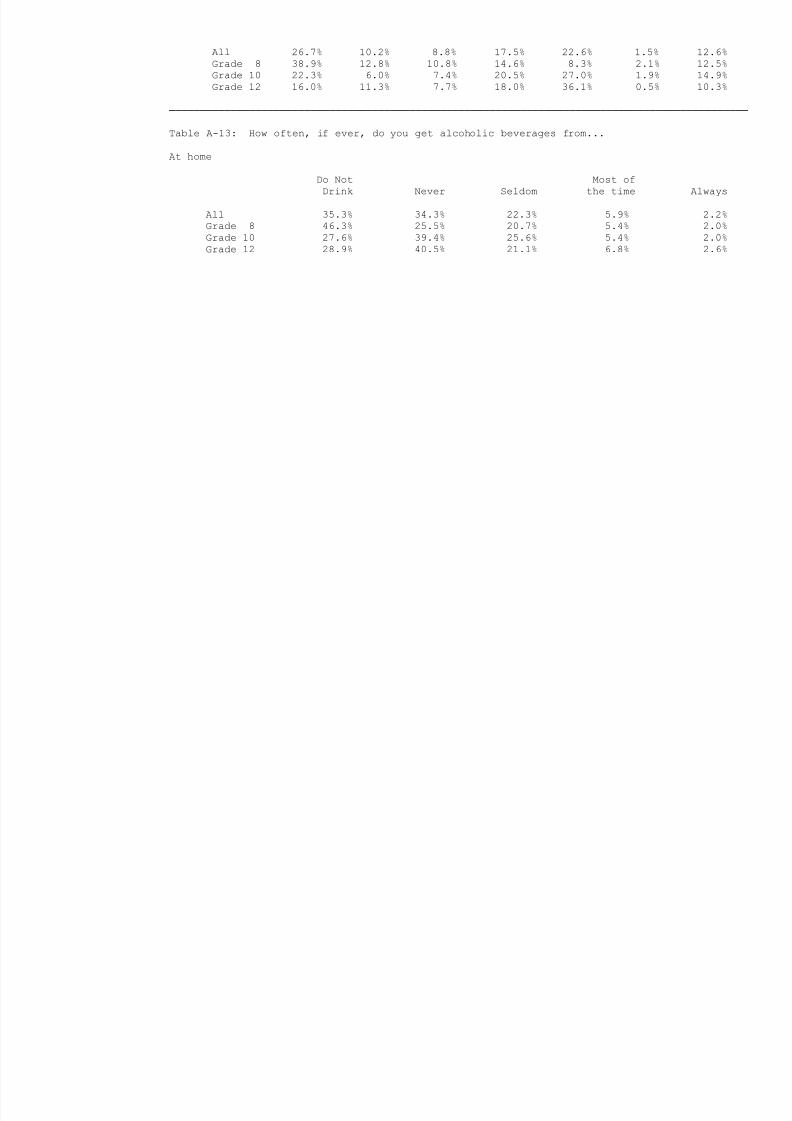
Table A-12: Thinking of parties you attended this school year, how often was alcohol used?
Half Most Of Don't Didn't
Never Seldom the Time the Time Always Know Attend
8/14/2019 BOWIE COUNTY - Texarkana ISD - 1999 Texas School Survey of Drug and Alcohol Use
http://slidepdf.com/reader/full/bowie-county-texarkana-isd-1999-texas-school-survey-of-drug-and-alcohol 19/185
All 26.7% 10.2% 8.8% 17.5% 22.6% 1.5% 12.6%
Grade 8 38.9% 12.8% 10.8% 14.6% 8.3% 2.1% 12.5%
Grade 10 22.3% 6.0% 7.4% 20.5% 27.0% 1.9% 14.9%
Grade 12 16.0% 11.3% 7.7% 18.0% 36.1% 0.5% 10.3%
──────────────────────────────────────────────────────────────────────────────────────────────
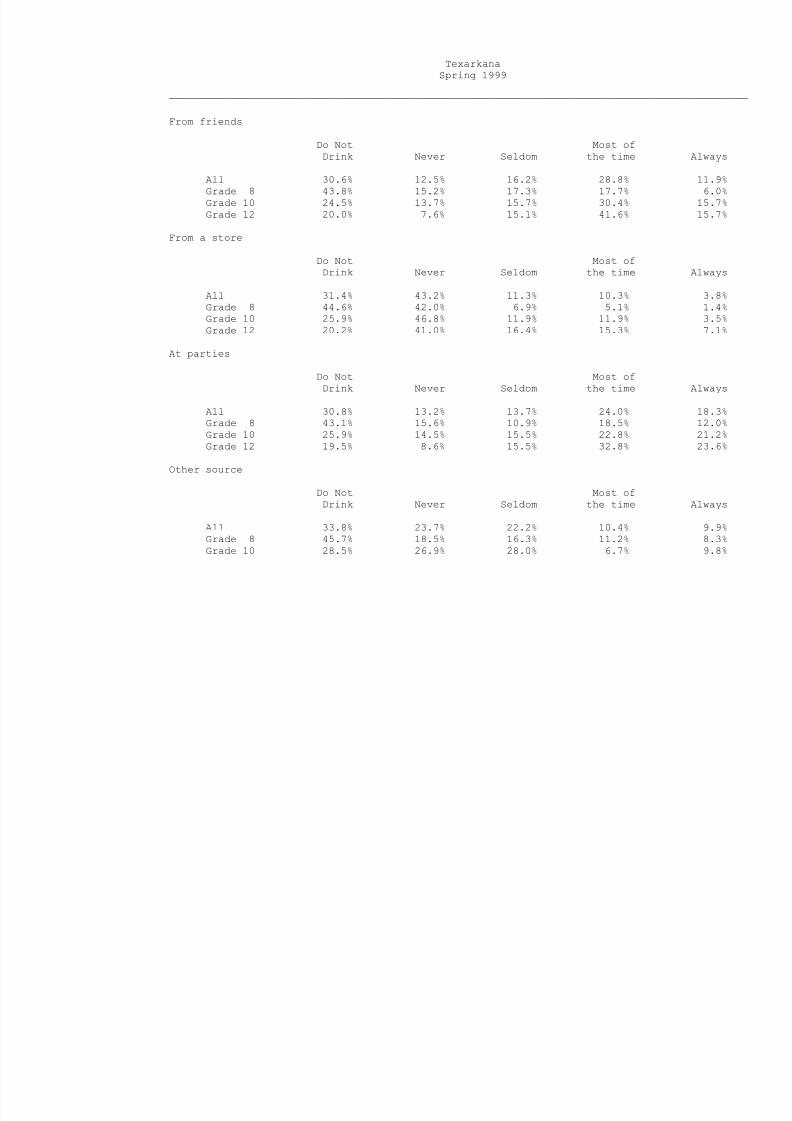
Table A-13: How often, if ever, do you get alcoholic beverages from...
At home
Do Not Most of
Drink Never Seldom the time Always
All 35.3% 34.3% 22.3% 5.9% 2.2%
Grade 8 46.3% 25.5% 20.7% 5.4% 2.0%
Grade 10 27.6% 39.4% 25.6% 5.4% 2.0%
Grade 12 28.9% 40.5% 21.1% 6.8% 2.6%
8/14/2019 BOWIE COUNTY - Texarkana ISD - 1999 Texas School Survey of Drug and Alcohol Use
http://slidepdf.com/reader/full/bowie-county-texarkana-isd-1999-texas-school-survey-of-drug-and-alcohol 20/185
Texarkana
Spring 1999
──────────────────────────────────────────────────────────────────────────────────────────────
From friends
Do Not Most of
Drink Never Seldom the time Always
All 30.6% 12.5% 16.2% 28.8% 11.9%
Grade 8 43.8% 15.2% 17.3% 17.7% 6.0%
Grade 10 24.5% 13.7% 15.7% 30.4% 15.7%
Grade 12 20.0% 7.6% 15.1% 41.6% 15.7%
From a store
Do Not Most of
Drink Never Seldom the time Always
All 31.4% 43.2% 11.3% 10.3% 3.8%
Grade 8 44.6% 42.0% 6.9% 5.1% 1.4%
Grade 10 25.9% 46.8% 11.9% 11.9% 3.5%
Grade 12 20.2% 41.0% 16.4% 15.3% 7.1%
At parties
Do Not Most of
Drink Never Seldom the time Always
All 30.8% 13.2% 13.7% 24.0% 18.3%Grade 8 43.1% 15.6% 10.9% 18.5% 12.0%
Grade 10 25.9% 14.5% 15.5% 22.8% 21.2%
Grade 12 19.5% 8.6% 15.5% 32.8% 23.6%
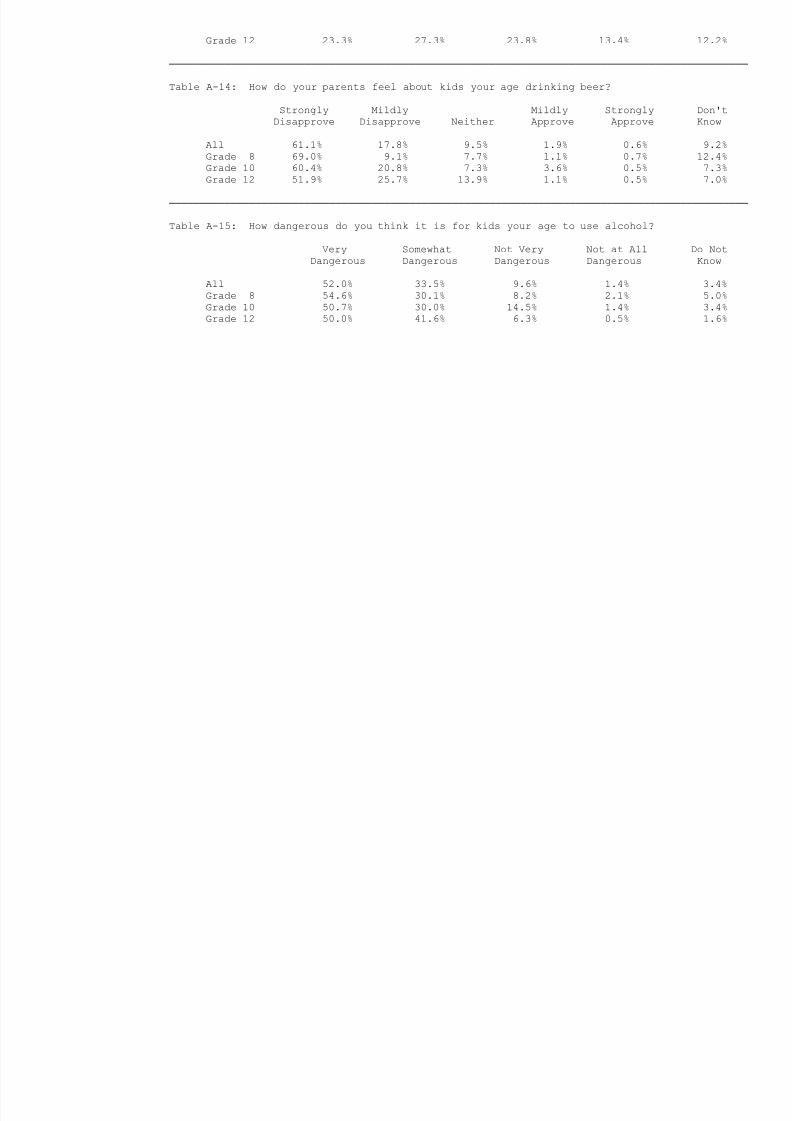
Other source
Do Not Most of
Drink Never Seldom the time Always
All 33.8% 23.7% 22.2% 10.4% 9.9%
Grade 8 45.7% 18.5% 16.3% 11.2% 8.3%
Grade 10 28.5% 26.9% 28.0% 6.7% 9.8%
8/14/2019 BOWIE COUNTY - Texarkana ISD - 1999 Texas School Survey of Drug and Alcohol Use
http://slidepdf.com/reader/full/bowie-county-texarkana-isd-1999-texas-school-survey-of-drug-and-alcohol 21/185
Grade 12 23.3% 27.3% 23.8% 13.4% 12.2%
──────────────────────────────────────────────────────────────────────────────────────────────
Table A-14: How do your parents feel about kids your age drinking beer?
Strongly Mildly Mildly Strongly Don't
Disapprove Disapprove Neither Approve Approve Know
All 61.1% 17.8% 9.5% 1.9% 0.6% 9.2%
Grade 8 69.0% 9.1% 7.7% 1.1% 0.7% 12.4%
Grade 10 60.4% 20.8% 7.3% 3.6% 0.5% 7.3%
Grade 12 51.9% 25.7% 13.9% 1.1% 0.5% 7.0%
──────────────────────────────────────────────────────────────────────────────────────────────
Table A-15: How dangerous do you think it is for kids your age to use alcohol?
Very Somewhat Not Very Not at All Do Not
Dangerous Dangerous Dangerous Dangerous Know
All 52.0% 33.5% 9.6% 1.4% 3.4%
Grade 8 54.6% 30.1% 8.2% 2.1% 5.0%
Grade 10 50.7% 30.0% 14.5% 1.4% 3.4%
Grade 12 50.0% 41.6% 6.3% 0.5% 1.6%

8/14/2019 BOWIE COUNTY - Texarkana ISD - 1999 Texas School Survey of Drug and Alcohol Use
http://slidepdf.com/reader/full/bowie-county-texarkana-isd-1999-texas-school-survey-of-drug-and-alcohol 22/185
8/14/2019 BOWIE COUNTY - Texarkana ISD - 1999 Texas School Survey of Drug and Alcohol Use
http://slidepdf.com/reader/full/bowie-county-texarkana-isd-1999-texas-school-survey-of-drug-and-alcohol 23/185
Texarkana
Spring 1999
──────────────────────────────────────────────────────────────────────────────────────────────
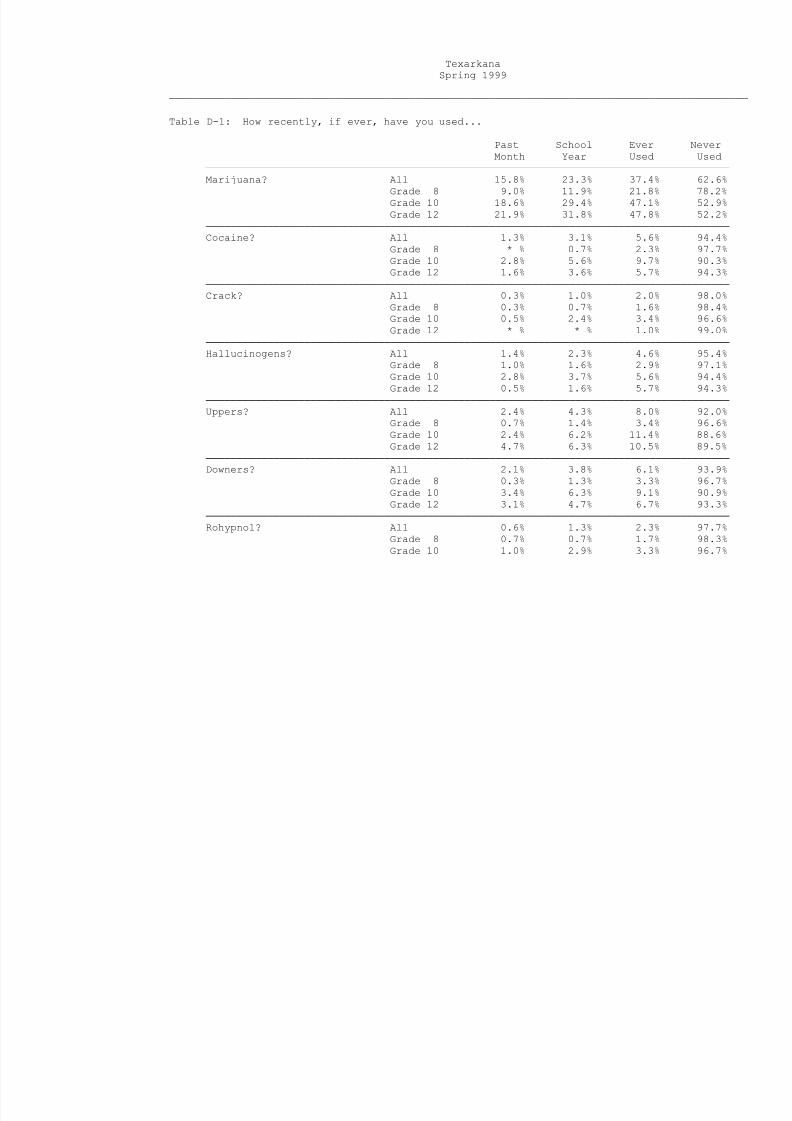
Table D-1: How recently, if ever, have you used...
Past School Ever Never
Month Year Used Used
─────────────────────────────────────────────────────────────────────────────────────
Marijuana? All 15.8% 23.3% 37.4% 62.6%
Grade 8 9.0% 11.9% 21.8% 78.2%
Grade 10 18.6% 29.4% 47.1% 52.9%
Grade 12 21.9% 31.8% 47.8% 52.2%
─────────────────────────────────────────────────────────────────────────────────────
Cocaine? All 1.3% 3.1% 5.6% 94.4%
Grade 8 * % 0.7% 2.3% 97.7%
Grade 10 2.8% 5.6% 9.7% 90.3%
Grade 12 1.6% 3.6% 5.7% 94.3%─────────────────────────────────────────────────────────────────────────────────────
Crack? All 0.3% 1.0% 2.0% 98.0%
Grade 8 0.3% 0.7% 1.6% 98.4%
Grade 10 0.5% 2.4% 3.4% 96.6%
Grade 12 * % * % 1.0% 99.0%
─────────────────────────────────────────────────────────────────────────────────────
Hallucinogens? All 1.4% 2.3% 4.6% 95.4%
Grade 8 1.0% 1.6% 2.9% 97.1%
Grade 10 2.8% 3.7% 5.6% 94.4%
Grade 12 0.5% 1.6% 5.7% 94.3%
─────────────────────────────────────────────────────────────────────────────────────
Uppers? All 2.4% 4.3% 8.0% 92.0%Grade 8 0.7% 1.4% 3.4% 96.6%
Grade 10 2.4% 6.2% 11.4% 88.6%
Grade 12 4.7% 6.3% 10.5% 89.5%
─────────────────────────────────────────────────────────────────────────────────────
Downers? All 2.1% 3.8% 6.1% 93.9%
Grade 8 0.3% 1.3% 3.3% 96.7%
Grade 10 3.4% 6.3% 9.1% 90.9%
Grade 12 3.1% 4.7% 6.7% 93.3%
─────────────────────────────────────────────────────────────────────────────────────
Rohypnol? All 0.6% 1.3% 2.3% 97.7%
Grade 8 0.7% 0.7% 1.7% 98.3%
Grade 10 1.0% 2.9% 3.3% 96.7%
8/14/2019 BOWIE COUNTY - Texarkana ISD - 1999 Texas School Survey of Drug and Alcohol Use
http://slidepdf.com/reader/full/bowie-county-texarkana-isd-1999-texas-school-survey-of-drug-and-alcohol 24/185
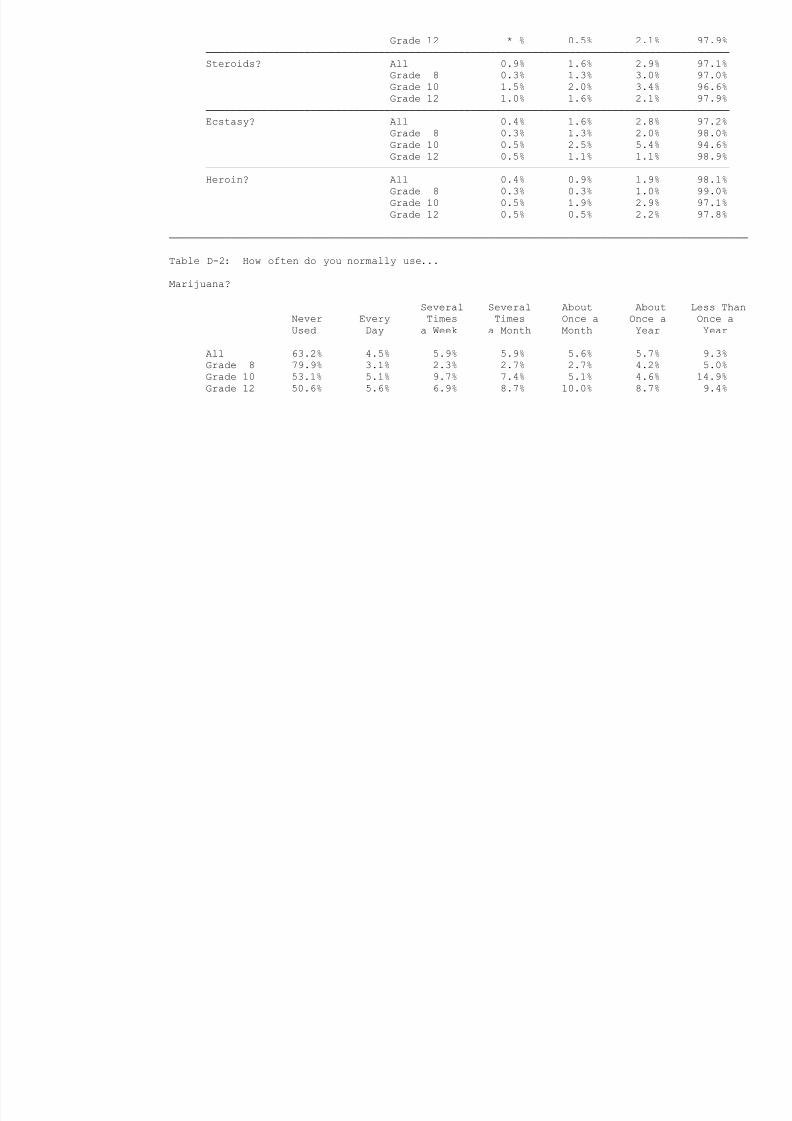
Grade 12 * % 0.5% 2.1% 97.9%
─────────────────────────────────────────────────────────────────────────────────────
Steroids? All 0.9% 1.6% 2.9% 97.1%
Grade 8 0.3% 1.3% 3.0% 97.0%
Grade 10 1.5% 2.0% 3.4% 96.6%
Grade 12 1.0% 1.6% 2.1% 97.9%
─────────────────────────────────────────────────────────────────────────────────────
Ecstasy? All 0.4% 1.6% 2.8% 97.2%
Grade 8 0.3% 1.3% 2.0% 98.0%
Grade 10 0.5% 2.5% 5.4% 94.6%
Grade 12 0.5% 1.1% 1.1% 98.9%
─────────────────────────────────────────────────────────────────────────────────────
Heroin? All 0.4% 0.9% 1.9% 98.1%
Grade 8 0.3% 0.3% 1.0% 99.0%
Grade 10 0.5% 1.9% 2.9% 97.1%
Grade 12 0.5% 0.5% 2.2% 97.8%
──────────────────────────────────────────────────────────────────────────────────────────────
Table D-2: How often do you normally use...
Marijuana?
Several Several About About Less Than
Never Every Times Times Once a Once a Once a
Used Day a Week a Month Month Year Year
All 63.2% 4.5% 5.9% 5.9% 5.6% 5.7% 9.3%
Grade 8 79.9% 3.1% 2.3% 2.7% 2.7% 4.2% 5.0%
Grade 10 53.1% 5.1% 9.7% 7.4% 5.1% 4.6% 14.9%
Grade 12 50.6% 5.6% 6.9% 8.7% 10.0% 8.7% 9.4%
8/14/2019 BOWIE COUNTY - Texarkana ISD - 1999 Texas School Survey of Drug and Alcohol Use
http://slidepdf.com/reader/full/bowie-county-texarkana-isd-1999-texas-school-survey-of-drug-and-alcohol 25/185
Texarkana
Spring 1999
──────────────────────────────────────────────────────────────────────────────────────────────
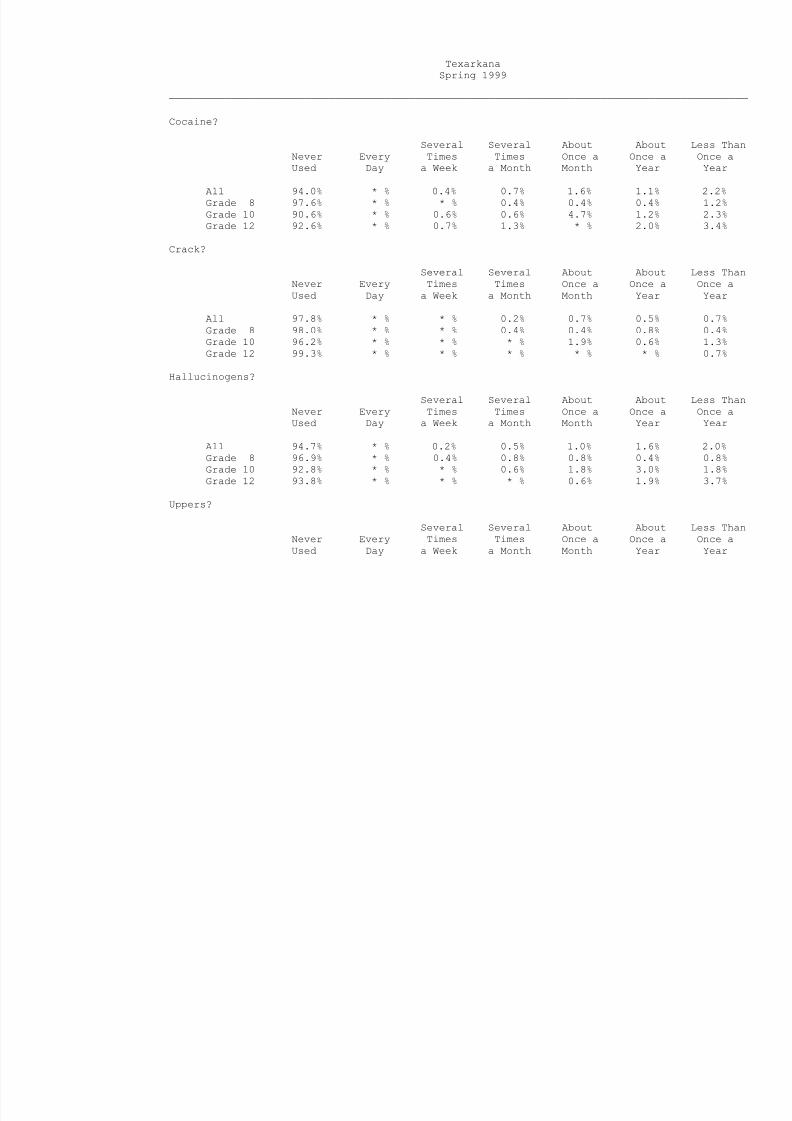
Cocaine?
Several Several About About Less Than
Never Every Times Times Once a Once a Once a
Used Day a Week a Month Month Year Year
All 94.0% * % 0.4% 0.7% 1.6% 1.1% 2.2%
Grade 8 97.6% * % * % 0.4% 0.4% 0.4% 1.2%
Grade 10 90.6% * % 0.6% 0.6% 4.7% 1.2% 2.3%
Grade 12 92.6% * % 0.7% 1.3% * % 2.0% 3.4%
Crack?
Several Several About About Less ThanNever Every Times Times Once a Once a Once a
Used Day a Week a Month Month Year Year
All 97.8% * % * % 0.2% 0.7% 0.5% 0.7%
Grade 8 98.0% * % * % 0.4% 0.4% 0.8% 0.4%
Grade 10 96.2% * % * % * % 1.9% 0.6% 1.3%
Grade 12 99.3% * % * % * % * % * % 0.7%
Hallucinogens?
Several Several About About Less Than
Never Every Times Times Once a Once a Once aUsed Day a Week a Month Month Year Year
All 94.7% * % 0.2% 0.5% 1.0% 1.6% 2.0%
Grade 8 96.9% * % 0.4% 0.8% 0.8% 0.4% 0.8%
Grade 10 92.8% * % * % 0.6% 1.8% 3.0% 1.8%
Grade 12 93.8% * % * % * % 0.6% 1.9% 3.7%
Uppers?
Several Several About About Less Than
Never Every Times Times Once a Once a Once a
Used Day a Week a Month Month Year Year
8/14/2019 BOWIE COUNTY - Texarkana ISD - 1999 Texas School Survey of Drug and Alcohol Use
http://slidepdf.com/reader/full/bowie-county-texarkana-isd-1999-texas-school-survey-of-drug-and-alcohol 26/185
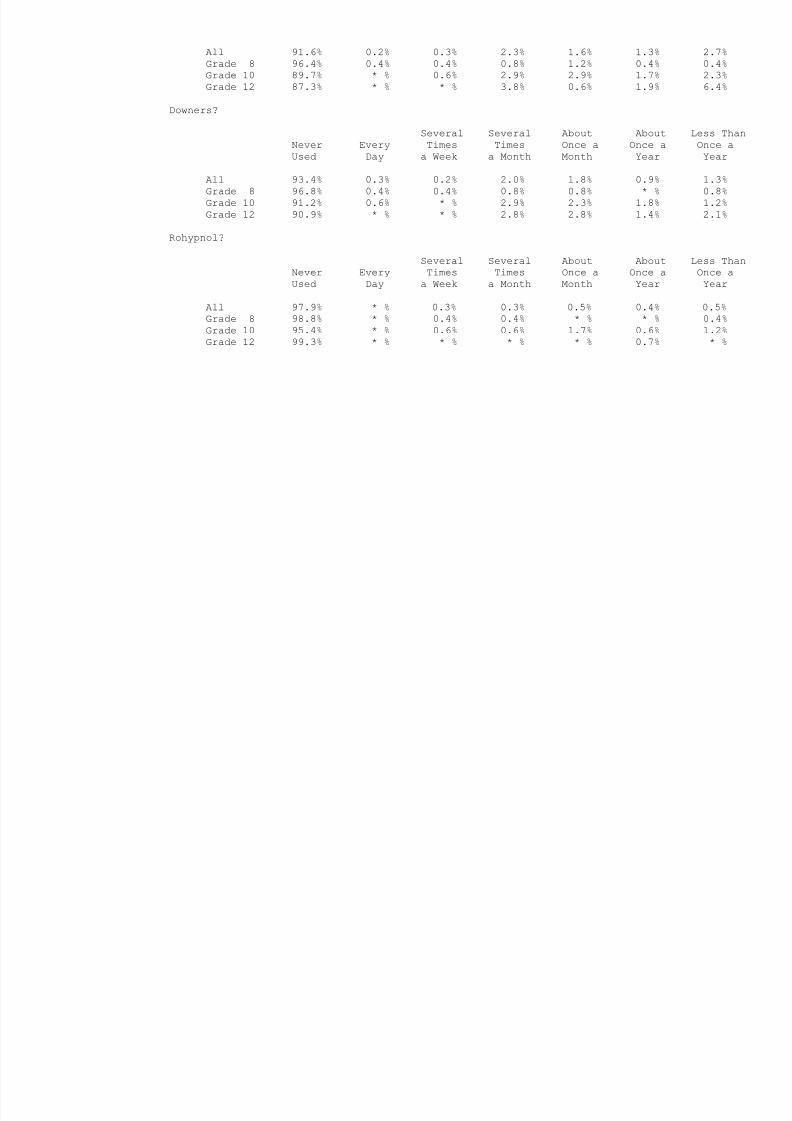
All 91.6% 0.2% 0.3% 2.3% 1.6% 1.3% 2.7%
Grade 8 96.4% 0.4% 0.4% 0.8% 1.2% 0.4% 0.4%
Grade 10 89.7% * % 0.6% 2.9% 2.9% 1.7% 2.3%
Grade 12 87.3% * % * % 3.8% 0.6% 1.9% 6.4%
Downers?
Several Several About About Less Than
Never Every Times Times Once a Once a Once a
Used Day a Week a Month Month Year Year
All 93.4% 0.3% 0.2% 2.0% 1.8% 0.9% 1.3%
Grade 8 96.8% 0.4% 0.4% 0.8% 0.8% * % 0.8%
Grade 10 91.2% 0.6% * % 2.9% 2.3% 1.8% 1.2%
Grade 12 90.9% * % * % 2.8% 2.8% 1.4% 2.1%
Rohypnol?
Several Several About About Less Than
Never Every Times Times Once a Once a Once aUsed Day a Week a Month Month Year Year
All 97.9% * % 0.3% 0.3% 0.5% 0.4% 0.5%
Grade 8 98.8% * % 0.4% 0.4% * % * % 0.4%
Grade 10 95.4% * % 0.6% 0.6% 1.7% 0.6% 1.2%
Grade 12 99.3% * % * % * % * % 0.7% * %
8/14/2019 BOWIE COUNTY - Texarkana ISD - 1999 Texas School Survey of Drug and Alcohol Use
http://slidepdf.com/reader/full/bowie-county-texarkana-isd-1999-texas-school-survey-of-drug-and-alcohol 27/185
Texarkana
Spring 1999
──────────────────────────────────────────────────────────────────────────────────────────────
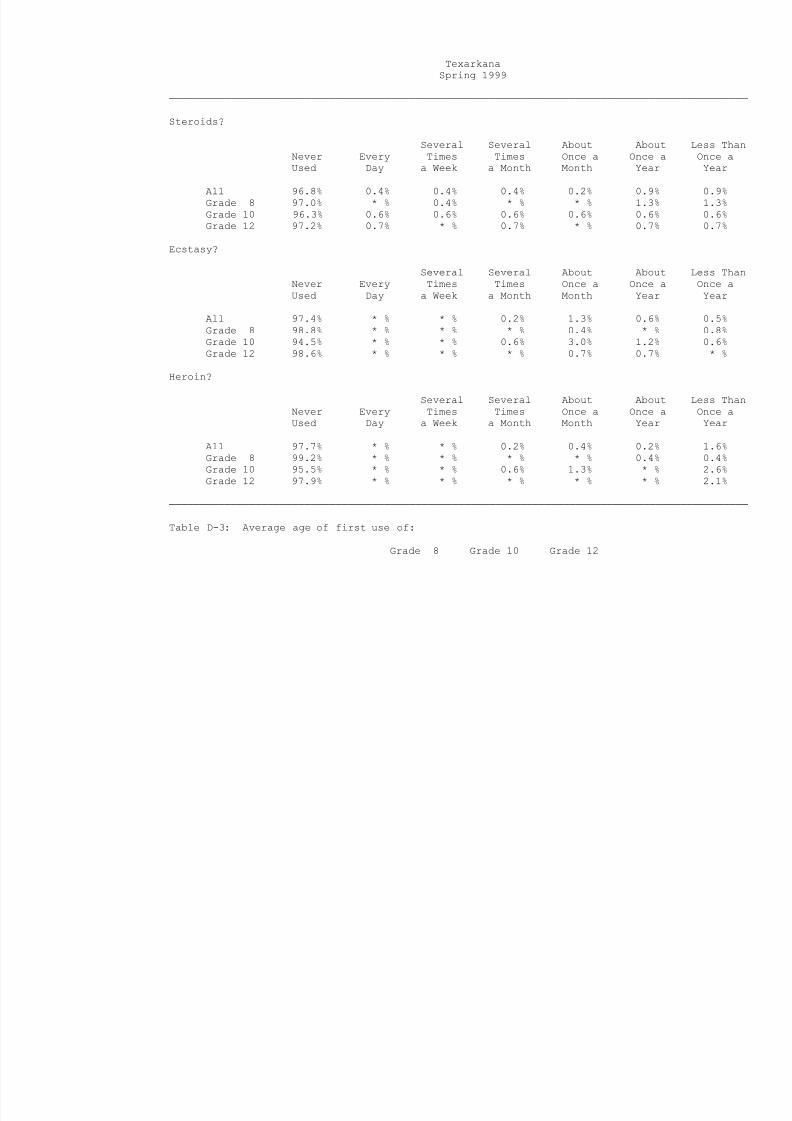
Steroids?
Several Several About About Less Than
Never Every Times Times Once a Once a Once a
Used Day a Week a Month Month Year Year
All 96.8% 0.4% 0.4% 0.4% 0.2% 0.9% 0.9%
Grade 8 97.0% * % 0.4% * % * % 1.3% 1.3%
Grade 10 96.3% 0.6% 0.6% 0.6% 0.6% 0.6% 0.6%
Grade 12 97.2% 0.7% * % 0.7% * % 0.7% 0.7%
Ecstasy?
Several Several About About Less ThanNever Every Times Times Once a Once a Once a
Used Day a Week a Month Month Year Year
All 97.4% * % * % 0.2% 1.3% 0.6% 0.5%
Grade 8 98.8% * % * % * % 0.4% * % 0.8%
Grade 10 94.5% * % * % 0.6% 3.0% 1.2% 0.6%
Grade 12 98.6% * % * % * % 0.7% 0.7% * %
Heroin?
Several Several About About Less Than
Never Every Times Times Once a Once a Once aUsed Day a Week a Month Month Year Year
All 97.7% * % * % 0.2% 0.4% 0.2% 1.6%
Grade 8 99.2% * % * % * % * % 0.4% 0.4%
Grade 10 95.5% * % * % 0.6% 1.3% * % 2.6%
Grade 12 97.9% * % * % * % * % * % 2.1%
──────────────────────────────────────────────────────────────────────────────────────────────
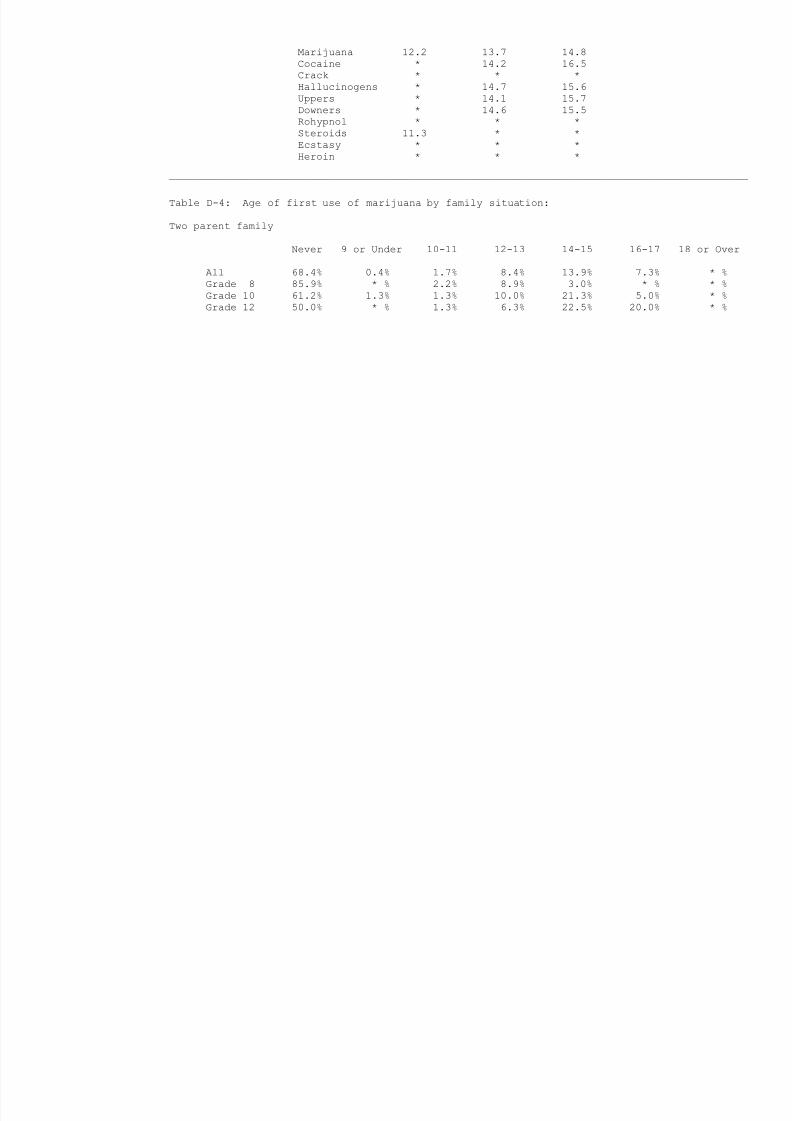
Table D-3: Average age of first use of:
Grade 8 Grade 10 Grade 12
8/14/2019 BOWIE COUNTY - Texarkana ISD - 1999 Texas School Survey of Drug and Alcohol Use
http://slidepdf.com/reader/full/bowie-county-texarkana-isd-1999-texas-school-survey-of-drug-and-alcohol 28/185
Marijuana 12.2 13.7 14.8
Cocaine * 14.2 16.5
Crack * * *
Hallucinogens * 14.7 15.6
Uppers * 14.1 15.7
Downers * 14.6 15.5
Rohypnol * * *
Steroids 11.3 * *
Ecstasy * * *
Heroin * * *
──────────────────────────────────────────────────────────────────────────────────────────────
Table D-4: Age of first use of marijuana by family situation:
Two parent family
Never 9 or Under 10-11 12-13 14-15 16-17 18 or Over
All 68.4% 0.4% 1.7% 8.4% 13.9% 7.3% * %Grade 8 85.9% * % 2.2% 8.9% 3.0% * % * %
Grade 10 61.2% 1.3% 1.3% 10.0% 21.3% 5.0% * %
Grade 12 50.0% * % 1.3% 6.3% 22.5% 20.0% * %
8/14/2019 BOWIE COUNTY - Texarkana ISD - 1999 Texas School Survey of Drug and Alcohol Use
http://slidepdf.com/reader/full/bowie-county-texarkana-isd-1999-texas-school-survey-of-drug-and-alcohol 29/185
Texarkana
Spring 1999
──────────────────────────────────────────────────────────────────────────────────────────────
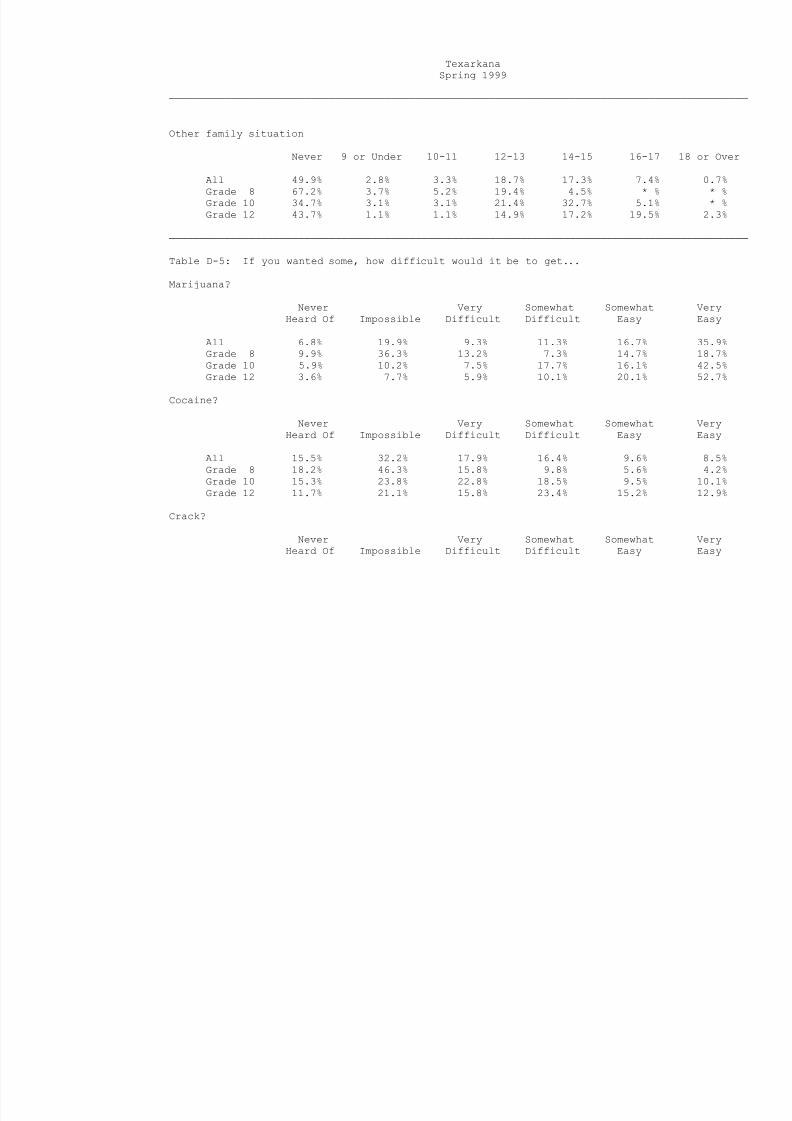
Other family situation
Never 9 or Under 10-11 12-13 14-15 16-17 18 or Over
All 49.9% 2.8% 3.3% 18.7% 17.3% 7.4% 0.7%
Grade 8 67.2% 3.7% 5.2% 19.4% 4.5% * % * %
Grade 10 34.7% 3.1% 3.1% 21.4% 32.7% 5.1% * %
Grade 12 43.7% 1.1% 1.1% 14.9% 17.2% 19.5% 2.3%
──────────────────────────────────────────────────────────────────────────────────────────────
Table D-5: If you wanted some, how difficult would it be to get...
Marijuana?
Never Very Somewhat Somewhat Very
Heard Of Impossible Difficult Difficult Easy Easy
All 6.8% 19.9% 9.3% 11.3% 16.7% 35.9%
Grade 8 9.9% 36.3% 13.2% 7.3% 14.7% 18.7%
Grade 10 5.9% 10.2% 7.5% 17.7% 16.1% 42.5%
Grade 12 3.6% 7.7% 5.9% 10.1% 20.1% 52.7%
Cocaine?
Never Very Somewhat Somewhat Very
Heard Of Impossible Difficult Difficult Easy Easy
All 15.5% 32.2% 17.9% 16.4% 9.6% 8.5%
Grade 8 18.2% 46.3% 15.8% 9.8% 5.6% 4.2%
Grade 10 15.3% 23.8% 22.8% 18.5% 9.5% 10.1%
Grade 12 11.7% 21.1% 15.8% 23.4% 15.2% 12.9%
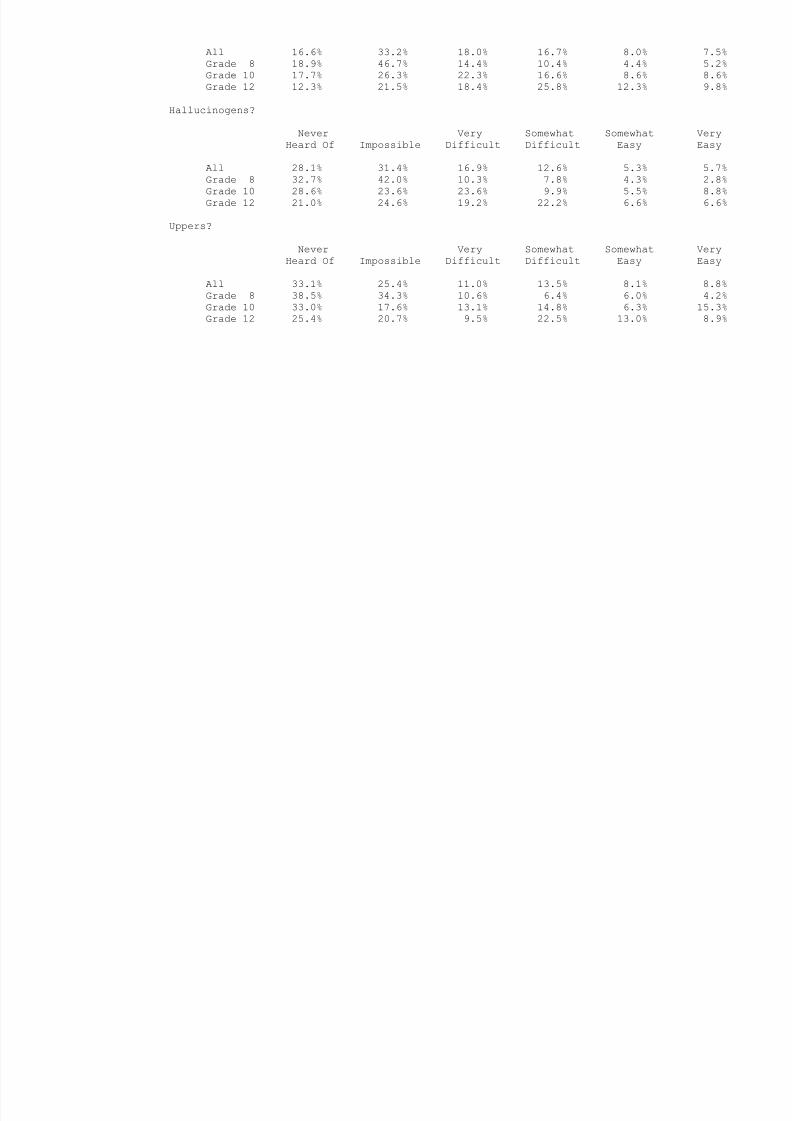
Crack?
Never Very Somewhat Somewhat Very
Heard Of Impossible Difficult Difficult Easy Easy
8/14/2019 BOWIE COUNTY - Texarkana ISD - 1999 Texas School Survey of Drug and Alcohol Use
http://slidepdf.com/reader/full/bowie-county-texarkana-isd-1999-texas-school-survey-of-drug-and-alcohol 30/185
All 16.6% 33.2% 18.0% 16.7% 8.0% 7.5%
Grade 8 18.9% 46.7% 14.4% 10.4% 4.4% 5.2%
Grade 10 17.7% 26.3% 22.3% 16.6% 8.6% 8.6%
Grade 12 12.3% 21.5% 18.4% 25.8% 12.3% 9.8%
Hallucinogens?
Never Very Somewhat Somewhat Very
Heard Of Impossible Difficult Difficult Easy Easy
All 28.1% 31.4% 16.9% 12.6% 5.3% 5.7%
Grade 8 32.7% 42.0% 10.3% 7.8% 4.3% 2.8%
Grade 10 28.6% 23.6% 23.6% 9.9% 5.5% 8.8%
Grade 12 21.0% 24.6% 19.2% 22.2% 6.6% 6.6%
Uppers?
Never Very Somewhat Somewhat Very
Heard Of Impossible Difficult Difficult Easy Easy
All 33.1% 25.4% 11.0% 13.5% 8.1% 8.8%
Grade 8 38.5% 34.3% 10.6% 6.4% 6.0% 4.2%
Grade 10 33.0% 17.6% 13.1% 14.8% 6.3% 15.3%
Grade 12 25.4% 20.7% 9.5% 22.5% 13.0% 8.9%
8/14/2019 BOWIE COUNTY - Texarkana ISD - 1999 Texas School Survey of Drug and Alcohol Use
http://slidepdf.com/reader/full/bowie-county-texarkana-isd-1999-texas-school-survey-of-drug-and-alcohol 31/185
Texarkana
Spring 1999
──────────────────────────────────────────────────────────────────────────────────────────────
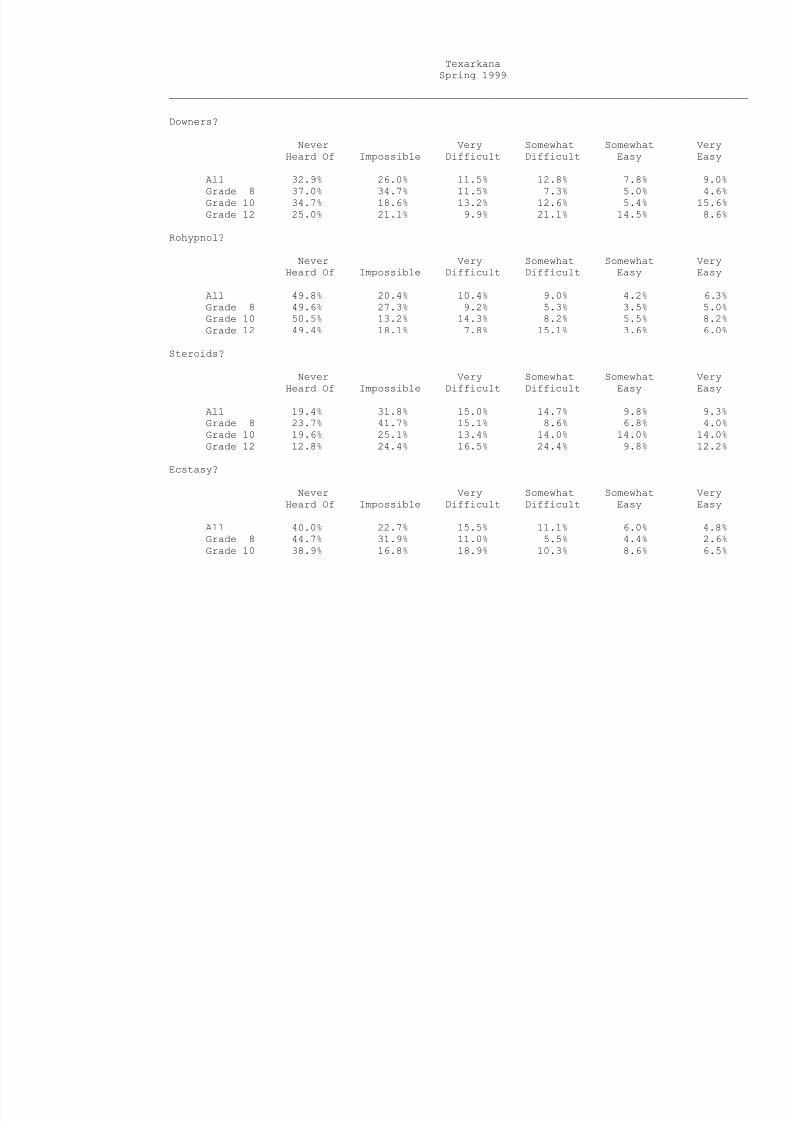
Downers?
Never Very Somewhat Somewhat Very
Heard Of Impossible Difficult Difficult Easy Easy
All 32.9% 26.0% 11.5% 12.8% 7.8% 9.0%
Grade 8 37.0% 34.7% 11.5% 7.3% 5.0% 4.6%
Grade 10 34.7% 18.6% 13.2% 12.6% 5.4% 15.6%
Grade 12 25.0% 21.1% 9.9% 21.1% 14.5% 8.6%
Rohypnol?
Never Very Somewhat Somewhat Very
Heard Of Impossible Difficult Difficult Easy Easy
All 49.8% 20.4% 10.4% 9.0% 4.2% 6.3%
Grade 8 49.6% 27.3% 9.2% 5.3% 3.5% 5.0%
Grade 10 50.5% 13.2% 14.3% 8.2% 5.5% 8.2%
Grade 12 49.4% 18.1% 7.8% 15.1% 3.6% 6.0%
Steroids?
Never Very Somewhat Somewhat Very
Heard Of Impossible Difficult Difficult Easy Easy
All 19.4% 31.8% 15.0% 14.7% 9.8% 9.3%Grade 8 23.7% 41.7% 15.1% 8.6% 6.8% 4.0%
Grade 10 19.6% 25.1% 13.4% 14.0% 14.0% 14.0%
Grade 12 12.8% 24.4% 16.5% 24.4% 9.8% 12.2%
Ecstasy?
Never Very Somewhat Somewhat Very
Heard Of Impossible Difficult Difficult Easy Easy
All 40.0% 22.7% 15.5% 11.1% 6.0% 4.8%
Grade 8 44.7% 31.9% 11.0% 5.5% 4.4% 2.6%
Grade 10 38.9% 16.8% 18.9% 10.3% 8.6% 6.5%
8/14/2019 BOWIE COUNTY - Texarkana ISD - 1999 Texas School Survey of Drug and Alcohol Use
http://slidepdf.com/reader/full/bowie-county-texarkana-isd-1999-texas-school-survey-of-drug-and-alcohol 32/185
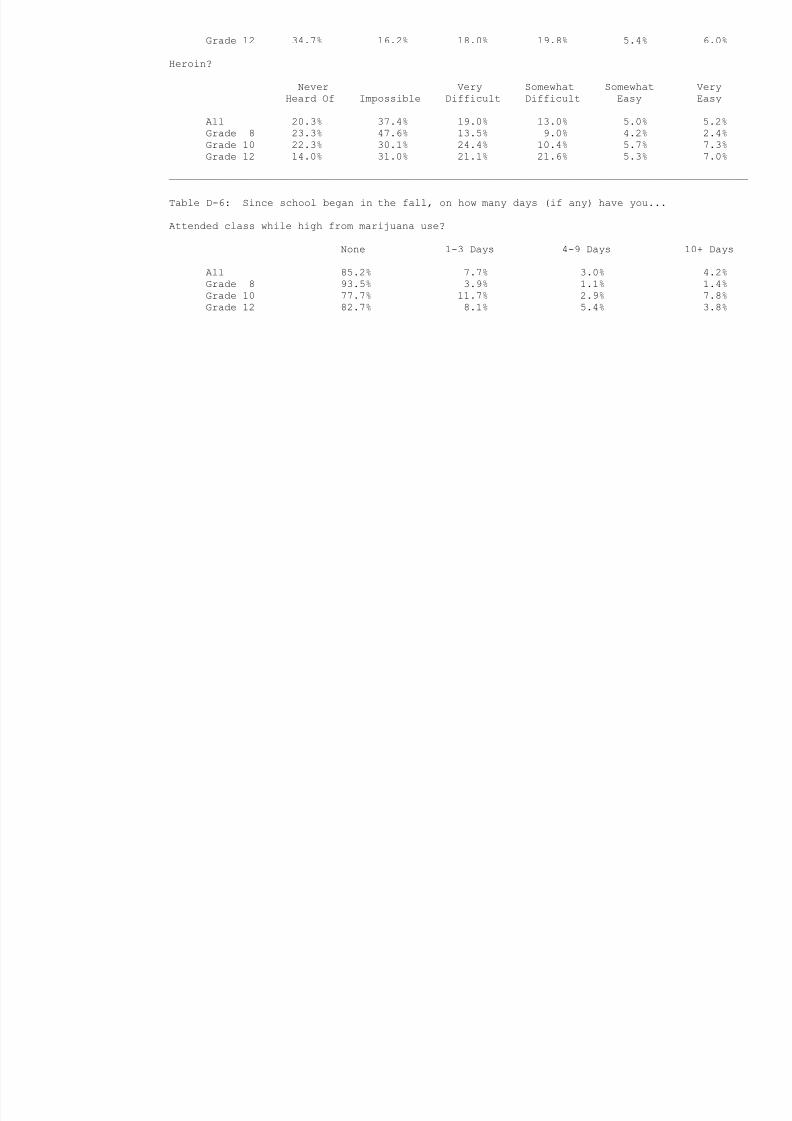
Grade 12 34.7% 16.2% 18.0% 19.8% 5.4% 6.0%
Heroin?
Never Very Somewhat Somewhat Very
Heard Of Impossible Difficult Difficult Easy Easy
All 20.3% 37.4% 19.0% 13.0% 5.0% 5.2%
Grade 8 23.3% 47.6% 13.5% 9.0% 4.2% 2.4%
Grade 10 22.3% 30.1% 24.4% 10.4% 5.7% 7.3%
Grade 12 14.0% 31.0% 21.1% 21.6% 5.3% 7.0%
──────────────────────────────────────────────────────────────────────────────────────────────
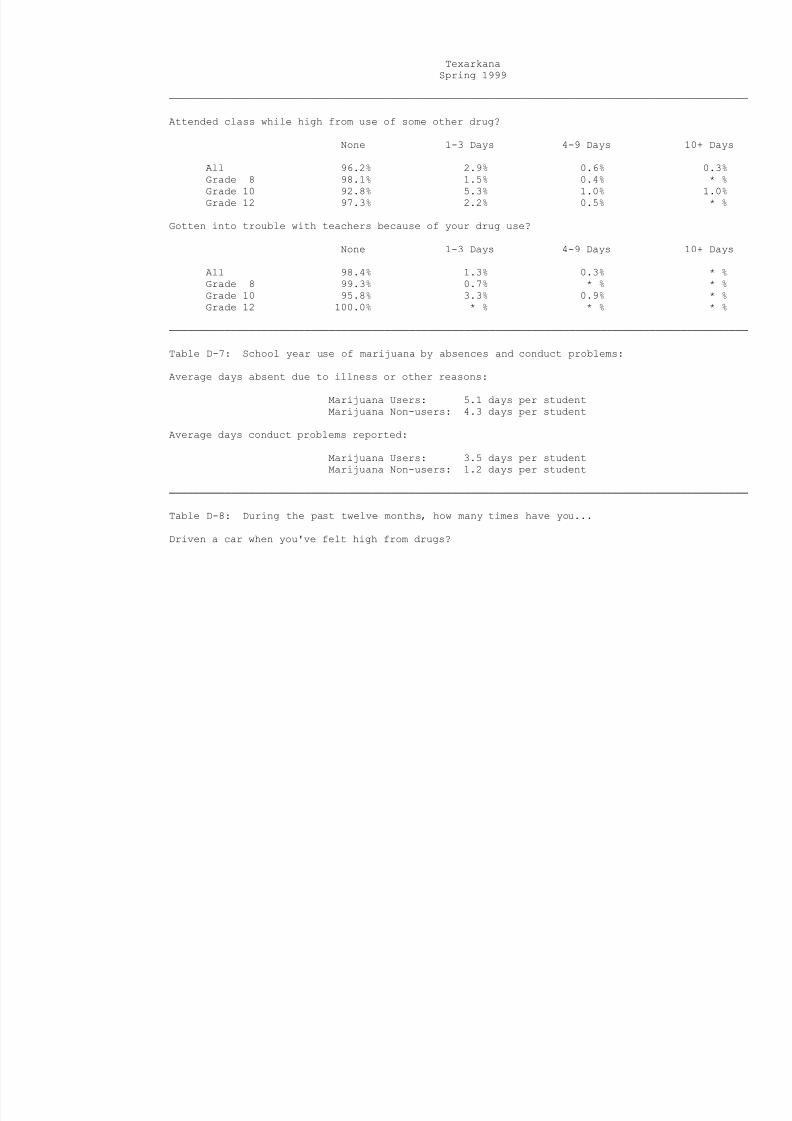
Table D-6: Since school began in the fall, on how many days (if any) have you...
Attended class while high from marijuana use?
None 1-3 Days 4-9 Days 10+ Days
All 85.2% 7.7% 3.0% 4.2%Grade 8 93.5% 3.9% 1.1% 1.4%
Grade 10 77.7% 11.7% 2.9% 7.8%
Grade 12 82.7% 8.1% 5.4% 3.8%
8/14/2019 BOWIE COUNTY - Texarkana ISD - 1999 Texas School Survey of Drug and Alcohol Use
http://slidepdf.com/reader/full/bowie-county-texarkana-isd-1999-texas-school-survey-of-drug-and-alcohol 33/185
8/14/2019 BOWIE COUNTY - Texarkana ISD - 1999 Texas School Survey of Drug and Alcohol Use
http://slidepdf.com/reader/full/bowie-county-texarkana-isd-1999-texas-school-survey-of-drug-and-alcohol 34/185
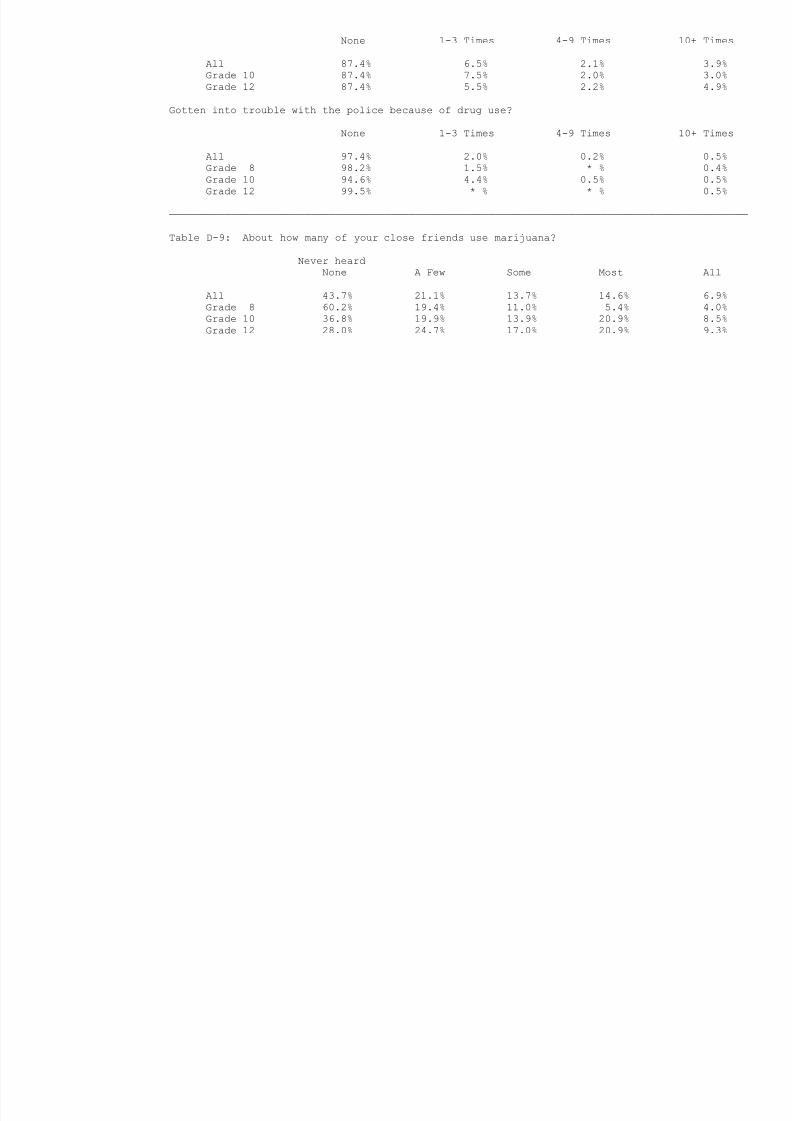
None 1-3 Times 4-9 Times 10+ Times
All 87.4% 6.5% 2.1% 3.9%
Grade 10 87.4% 7.5% 2.0% 3.0%
Grade 12 87.4% 5.5% 2.2% 4.9%
Gotten into trouble with the police because of drug use?
None 1-3 Times 4-9 Times 10+ Times
All 97.4% 2.0% 0.2% 0.5%
Grade 8 98.2% 1.5% * % 0.4%
Grade 10 94.6% 4.4% 0.5% 0.5%
Grade 12 99.5% * % * % 0.5%
──────────────────────────────────────────────────────────────────────────────────────────────
Table D-9: About how many of your close friends use marijuana?
Never heard
None A Few Some Most All
All 43.7% 21.1% 13.7% 14.6% 6.9%
Grade 8 60.2% 19.4% 11.0% 5.4% 4.0%
Grade 10 36.8% 19.9% 13.9% 20.9% 8.5%
Grade 12 28.0% 24.7% 17.0% 20.9% 9.3%
8/14/2019 BOWIE COUNTY - Texarkana ISD - 1999 Texas School Survey of Drug and Alcohol Use
http://slidepdf.com/reader/full/bowie-county-texarkana-isd-1999-texas-school-survey-of-drug-and-alcohol 35/185
Texarkana
Spring 1999
──────────────────────────────────────────────────────────────────────────────────────────────
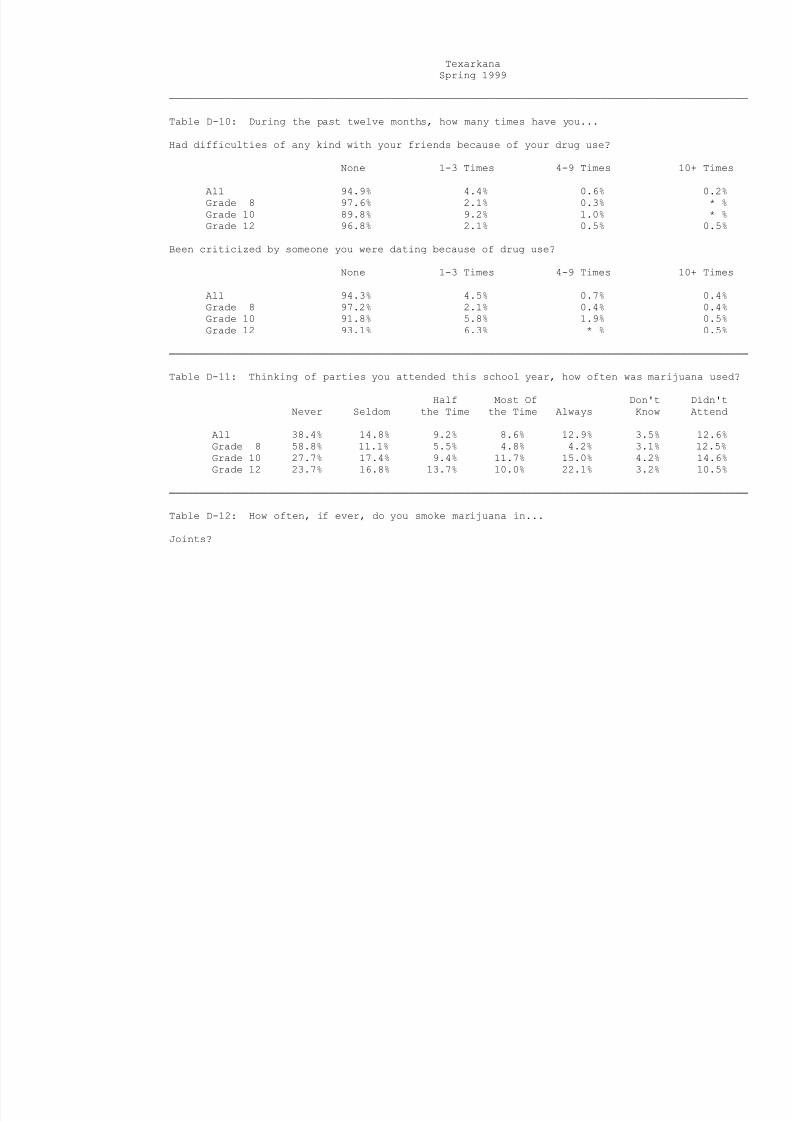
Table D-10: During the past twelve months, how many times have you...
Had difficulties of any kind with your friends because of your drug use?
None 1-3 Times 4-9 Times 10+ Times
All 94.9% 4.4% 0.6% 0.2%
Grade 8 97.6% 2.1% 0.3% * %
Grade 10 89.8% 9.2% 1.0% * %
Grade 12 96.8% 2.1% 0.5% 0.5%
Been criticized by someone you were dating because of drug use?
None 1-3 Times 4-9 Times 10+ Times
All 94.3% 4.5% 0.7% 0.4%
Grade 8 97.2% 2.1% 0.4% 0.4%
Grade 10 91.8% 5.8% 1.9% 0.5%
Grade 12 93.1% 6.3% * % 0.5%
──────────────────────────────────────────────────────────────────────────────────────────────
Table D-11: Thinking of parties you attended this school year, how often was marijuana used?
Half Most Of Don't Didn't
Never Seldom the Time the Time Always Know Attend
All 38.4% 14.8% 9.2% 8.6% 12.9% 3.5% 12.6%
Grade 8 58.8% 11.1% 5.5% 4.8% 4.2% 3.1% 12.5%
Grade 10 27.7% 17.4% 9.4% 11.7% 15.0% 4.2% 14.6%
Grade 12 23.7% 16.8% 13.7% 10.0% 22.1% 3.2% 10.5%
──────────────────────────────────────────────────────────────────────────────────────────────
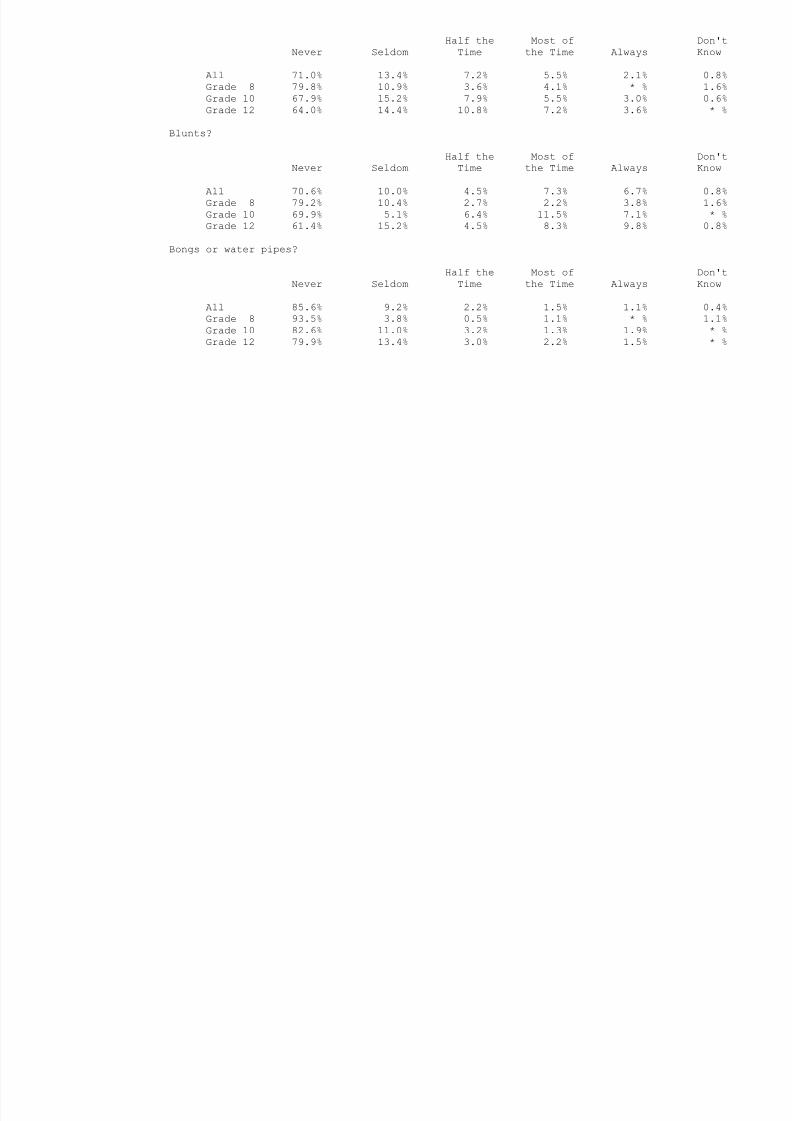
Table D-12: How often, if ever, do you smoke marijuana in...
Joints?
8/14/2019 BOWIE COUNTY - Texarkana ISD - 1999 Texas School Survey of Drug and Alcohol Use
http://slidepdf.com/reader/full/bowie-county-texarkana-isd-1999-texas-school-survey-of-drug-and-alcohol 36/185
Half the Most of Don't
Never Seldom Time the Time Always Know
All 71.0% 13.4% 7.2% 5.5% 2.1% 0.8%
Grade 8 79.8% 10.9% 3.6% 4.1% * % 1.6%
Grade 10 67.9% 15.2% 7.9% 5.5% 3.0% 0.6%
Grade 12 64.0% 14.4% 10.8% 7.2% 3.6% * %
Blunts?
Half the Most of Don't
Never Seldom Time the Time Always Know
All 70.6% 10.0% 4.5% 7.3% 6.7% 0.8%
Grade 8 79.2% 10.4% 2.7% 2.2% 3.8% 1.6%
Grade 10 69.9% 5.1% 6.4% 11.5% 7.1% * %
Grade 12 61.4% 15.2% 4.5% 8.3% 9.8% 0.8%
Bongs or water pipes?
Half the Most of Don'tNever Seldom Time the Time Always Know
All 85.6% 9.2% 2.2% 1.5% 1.1% 0.4%
Grade 8 93.5% 3.8% 0.5% 1.1% * % 1.1%
Grade 10 82.6% 11.0% 3.2% 1.3% 1.9% * %
Grade 12 79.9% 13.4% 3.0% 2.2% 1.5% * %
8/14/2019 BOWIE COUNTY - Texarkana ISD - 1999 Texas School Survey of Drug and Alcohol Use
http://slidepdf.com/reader/full/bowie-county-texarkana-isd-1999-texas-school-survey-of-drug-and-alcohol 37/185
Texarkana
Spring 1999
──────────────────────────────────────────────────────────────────────────────────────────────
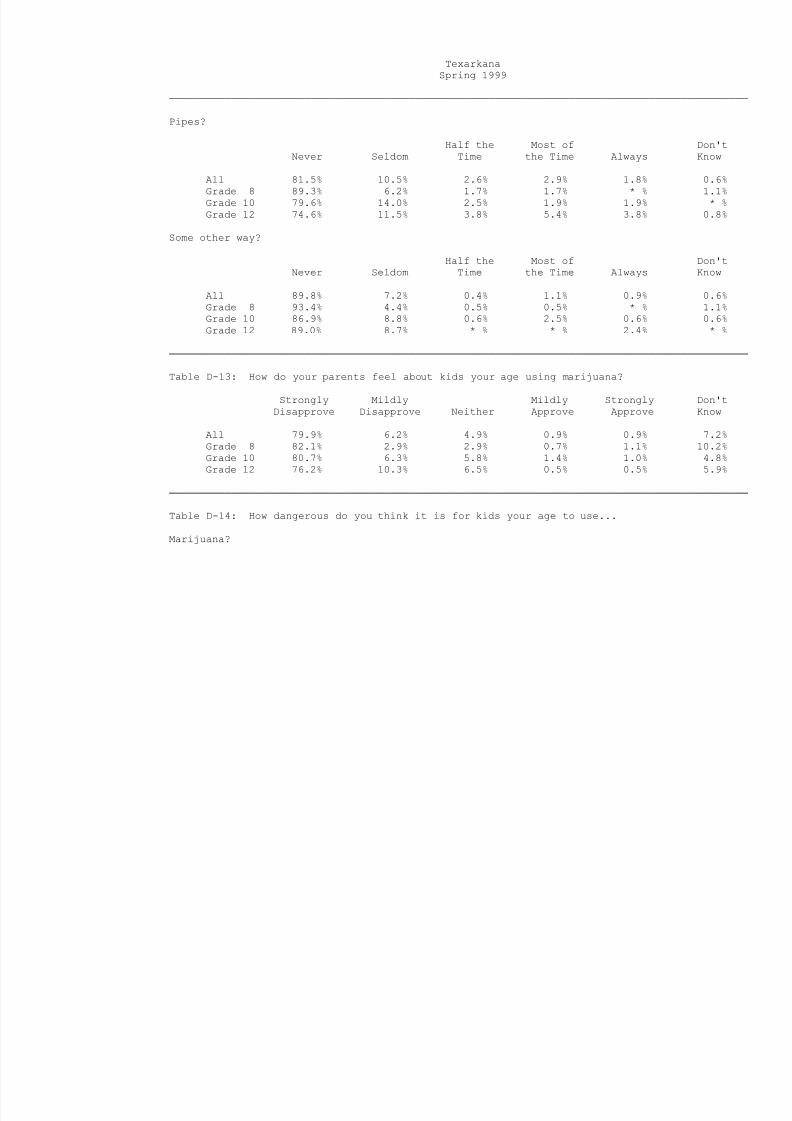
Pipes?
Half the Most of Don't
Never Seldom Time the Time Always Know
All 81.5% 10.5% 2.6% 2.9% 1.8% 0.6%
Grade 8 89.3% 6.2% 1.7% 1.7% * % 1.1%
Grade 10 79.6% 14.0% 2.5% 1.9% 1.9% * %
Grade 12 74.6% 11.5% 3.8% 5.4% 3.8% 0.8%
Some other way?
Half the Most of Don't
Never Seldom Time the Time Always Know
All 89.8% 7.2% 0.4% 1.1% 0.9% 0.6%
Grade 8 93.4% 4.4% 0.5% 0.5% * % 1.1%
Grade 10 86.9% 8.8% 0.6% 2.5% 0.6% 0.6%
Grade 12 89.0% 8.7% * % * % 2.4% * %
──────────────────────────────────────────────────────────────────────────────────────────────
Table D-13: How do your parents feel about kids your age using marijuana?
Strongly Mildly Mildly Strongly Don't
Disapprove Disapprove Neither Approve Approve Know
All 79.9% 6.2% 4.9% 0.9% 0.9% 7.2%
Grade 8 82.1% 2.9% 2.9% 0.7% 1.1% 10.2%
Grade 10 80.7% 6.3% 5.8% 1.4% 1.0% 4.8%
Grade 12 76.2% 10.3% 6.5% 0.5% 0.5% 5.9%
──────────────────────────────────────────────────────────────────────────────────────────────
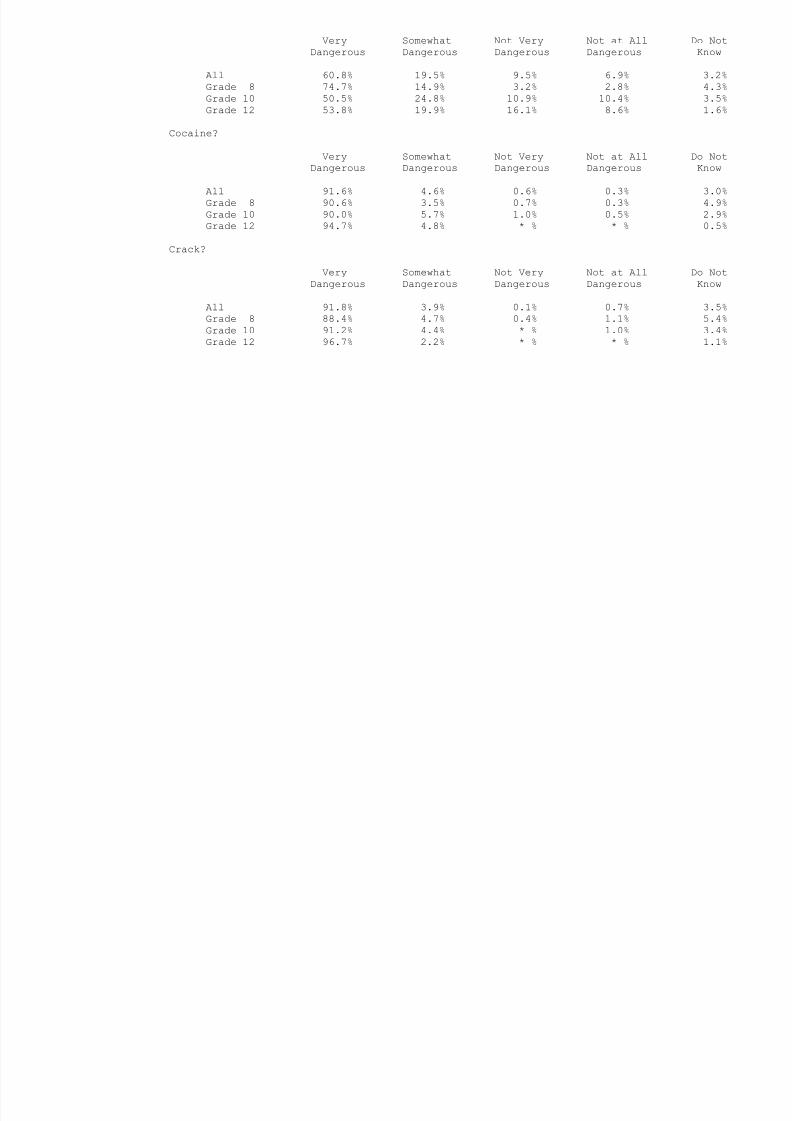
Table D-14: How dangerous do you think it is for kids your age to use...
Marijuana?
8/14/2019 BOWIE COUNTY - Texarkana ISD - 1999 Texas School Survey of Drug and Alcohol Use
http://slidepdf.com/reader/full/bowie-county-texarkana-isd-1999-texas-school-survey-of-drug-and-alcohol 38/185
Very Somewhat Not Very Not at All Do Not
Dangerous Dangerous Dangerous Dangerous Know
All 60.8% 19.5% 9.5% 6.9% 3.2%
Grade 8 74.7% 14.9% 3.2% 2.8% 4.3%
Grade 10 50.5% 24.8% 10.9% 10.4% 3.5%
Grade 12 53.8% 19.9% 16.1% 8.6% 1.6%
Cocaine?
Very Somewhat Not Very Not at All Do Not
Dangerous Dangerous Dangerous Dangerous Know
All 91.6% 4.6% 0.6% 0.3% 3.0%
Grade 8 90.6% 3.5% 0.7% 0.3% 4.9%
Grade 10 90.0% 5.7% 1.0% 0.5% 2.9%
Grade 12 94.7% 4.8% * % * % 0.5%
Crack?
Very Somewhat Not Very Not at All Do NotDangerous Dangerous Dangerous Dangerous Know
All 91.8% 3.9% 0.1% 0.7% 3.5%
Grade 8 88.4% 4.7% 0.4% 1.1% 5.4%
Grade 10 91.2% 4.4% * % 1.0% 3.4%
Grade 12 96.7% 2.2% * % * % 1.1%
8/14/2019 BOWIE COUNTY - Texarkana ISD - 1999 Texas School Survey of Drug and Alcohol Use
http://slidepdf.com/reader/full/bowie-county-texarkana-isd-1999-texas-school-survey-of-drug-and-alcohol 39/185
Texarkana
Spring 1999
──────────────────────────────────────────────────────────────────────────────────────────────
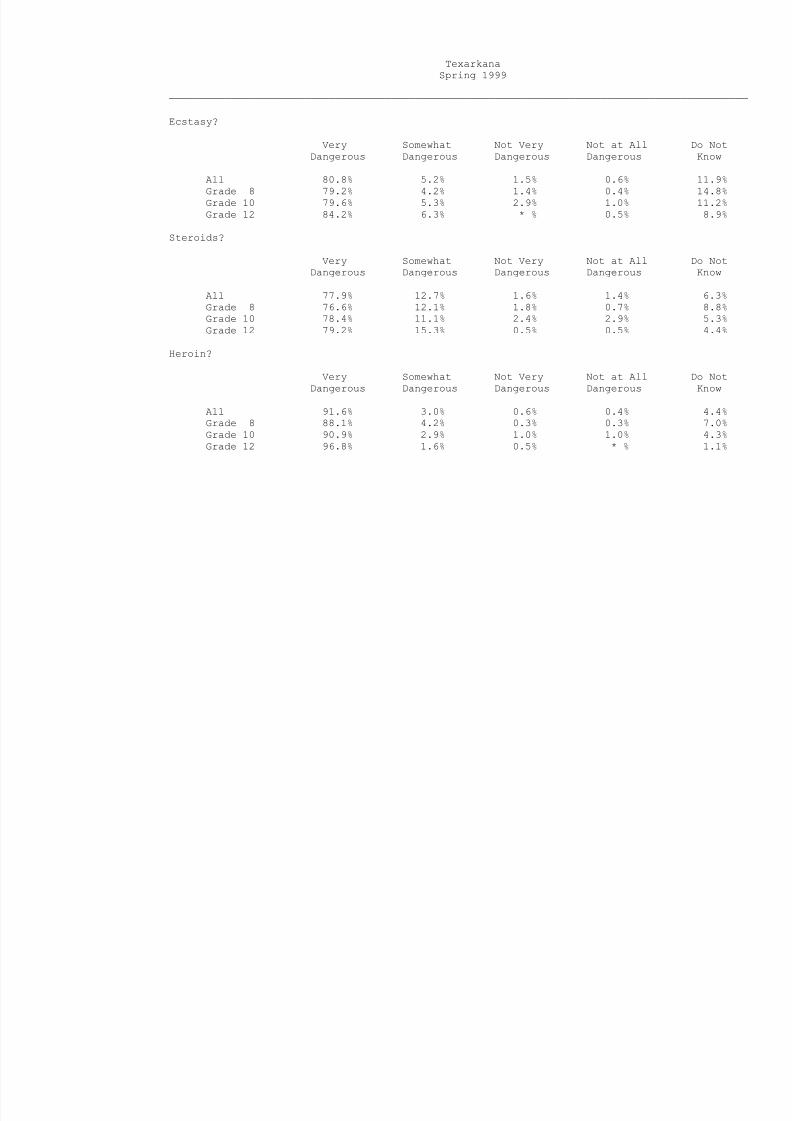
Ecstasy?
Very Somewhat Not Very Not at All Do NotDangerous Dangerous Dangerous Dangerous Know
All 80.8% 5.2% 1.5% 0.6% 11.9%
Grade 8 79.2% 4.2% 1.4% 0.4% 14.8%
Grade 10 79.6% 5.3% 2.9% 1.0% 11.2%
Grade 12 84.2% 6.3% * % 0.5% 8.9%
Steroids?
Very Somewhat Not Very Not at All Do Not
Dangerous Dangerous Dangerous Dangerous Know
All 77.9% 12.7% 1.6% 1.4% 6.3%
Grade 8 76.6% 12.1% 1.8% 0.7% 8.8%
Grade 10 78.4% 11.1% 2.4% 2.9% 5.3%
Grade 12 79.2% 15.3% 0.5% 0.5% 4.4%
Heroin?
Very Somewhat Not Very Not at All Do Not
Dangerous Dangerous Dangerous Dangerous Know
All 91.6% 3.0% 0.6% 0.4% 4.4%Grade 8 88.1% 4.2% 0.3% 0.3% 7.0%
Grade 10 90.9% 2.9% 1.0% 1.0% 4.3%
Grade 12 96.8% 1.6% 0.5% * % 1.1%

8/14/2019 BOWIE COUNTY - Texarkana ISD - 1999 Texas School Survey of Drug and Alcohol Use
http://slidepdf.com/reader/full/bowie-county-texarkana-isd-1999-texas-school-survey-of-drug-and-alcohol 40/185
8/14/2019 BOWIE COUNTY - Texarkana ISD - 1999 Texas School Survey of Drug and Alcohol Use
http://slidepdf.com/reader/full/bowie-county-texarkana-isd-1999-texas-school-survey-of-drug-and-alcohol 41/185
Texarkana
Spring 1999
──────────────────────────────────────────────────────────────────────────────────────────────
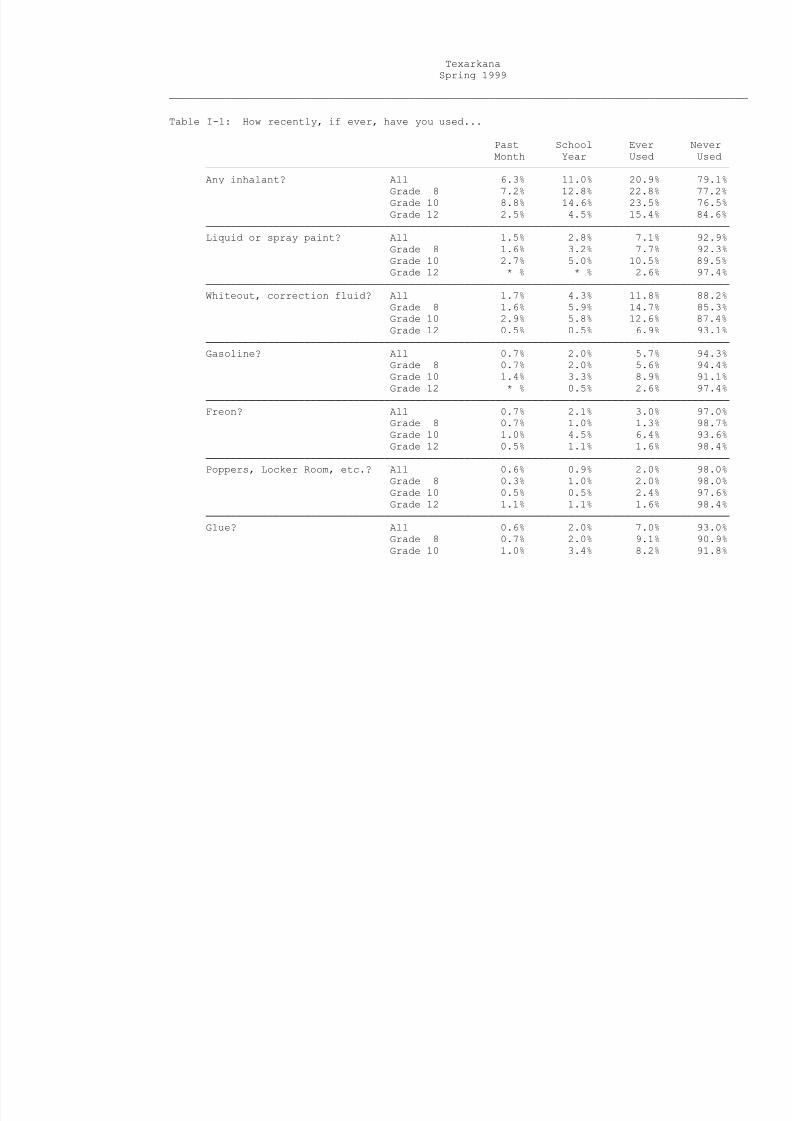
Table I-1: How recently, if ever, have you used...
Past School Ever NeverMonth Year Used Used
─────────────────────────────────────────────────────────────────────────────────────
Any inhalant? All 6.3% 11.0% 20.9% 79.1%
Grade 8 7.2% 12.8% 22.8% 77.2%
Grade 10 8.8% 14.6% 23.5% 76.5%
Grade 12 2.5% 4.5% 15.4% 84.6%
─────────────────────────────────────────────────────────────────────────────────────
Liquid or spray paint? All 1.5% 2.8% 7.1% 92.9%
Grade 8 1.6% 3.2% 7.7% 92.3%
Grade 10 2.7% 5.0% 10.5% 89.5%
Grade 12 * % * % 2.6% 97.4%
─────────────────────────────────────────────────────────────────────────────────────
Whiteout, correction fluid? All 1.7% 4.3% 11.8% 88.2%
Grade 8 1.6% 5.9% 14.7% 85.3%
Grade 10 2.9% 5.8% 12.6% 87.4%
Grade 12 0.5% 0.5% 6.9% 93.1%
─────────────────────────────────────────────────────────────────────────────────────
Gasoline? All 0.7% 2.0% 5.7% 94.3%
Grade 8 0.7% 2.0% 5.6% 94.4%
Grade 10 1.4% 3.3% 8.9% 91.1%
Grade 12 * % 0.5% 2.6% 97.4%
─────────────────────────────────────────────────────────────────────────────────────
Freon? All 0.7% 2.1% 3.0% 97.0%Grade 8 0.7% 1.0% 1.3% 98.7%
Grade 10 1.0% 4.5% 6.4% 93.6%
Grade 12 0.5% 1.1% 1.6% 98.4%
─────────────────────────────────────────────────────────────────────────────────────
Poppers, Locker Room, etc.? All 0.6% 0.9% 2.0% 98.0%
Grade 8 0.3% 1.0% 2.0% 98.0%
Grade 10 0.5% 0.5% 2.4% 97.6%
Grade 12 1.1% 1.1% 1.6% 98.4%
─────────────────────────────────────────────────────────────────────────────────────
Glue? All 0.6% 2.0% 7.0% 93.0%
Grade 8 0.7% 2.0% 9.1% 90.9%
Grade 10 1.0% 3.4% 8.2% 91.8%
8/14/2019 BOWIE COUNTY - Texarkana ISD - 1999 Texas School Survey of Drug and Alcohol Use
http://slidepdf.com/reader/full/bowie-county-texarkana-isd-1999-texas-school-survey-of-drug-and-alcohol 42/185
Grade 12 * % 0.5% 2.7% 97.3%
─────────────────────────────────────────────────────────────────────────────────────
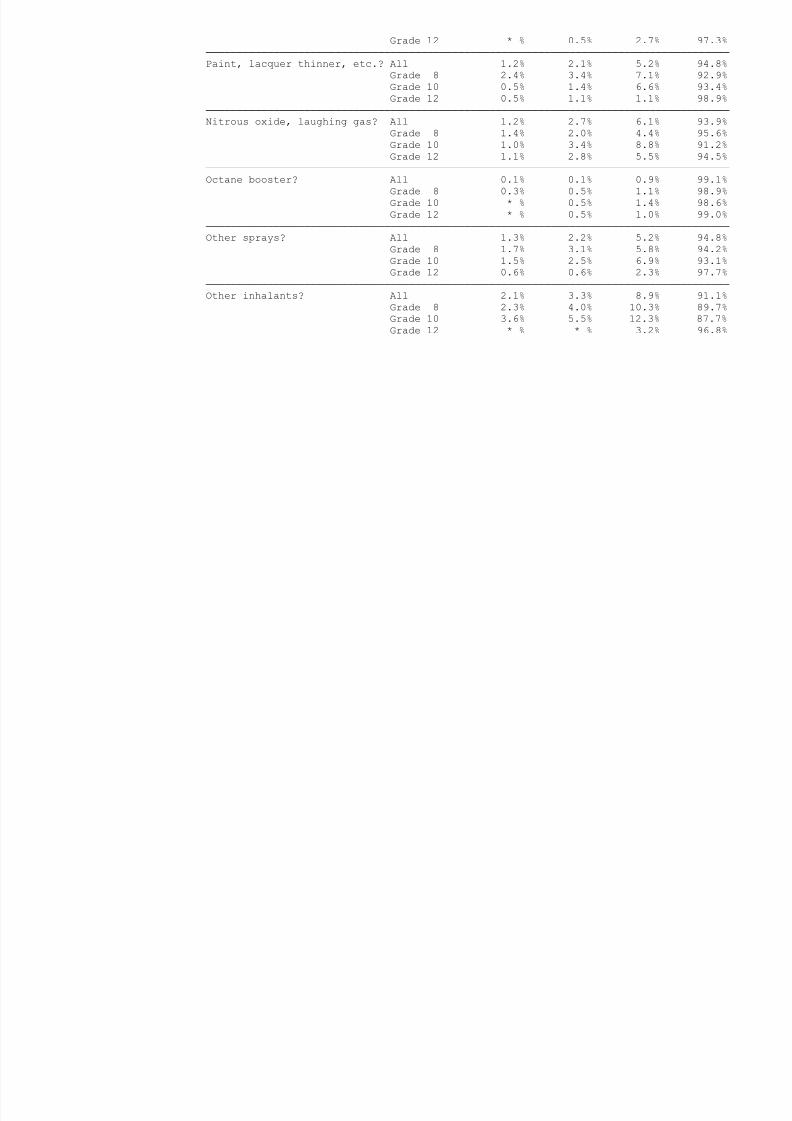
Paint, lacquer thinner, etc.? All 1.2% 2.1% 5.2% 94.8%
Grade 8 2.4% 3.4% 7.1% 92.9%
Grade 10 0.5% 1.4% 6.6% 93.4%
Grade 12 0.5% 1.1% 1.1% 98.9%
─────────────────────────────────────────────────────────────────────────────────────
Nitrous oxide, laughing gas? All 1.2% 2.7% 6.1% 93.9%
Grade 8 1.4% 2.0% 4.4% 95.6%
Grade 10 1.0% 3.4% 8.8% 91.2%Grade 12 1.1% 2.8% 5.5% 94.5%
─────────────────────────────────────────────────────────────────────────────────────
Octane booster? All 0.1% 0.1% 0.9% 99.1%
Grade 8 0.3% 0.5% 1.1% 98.9%
Grade 10 * % 0.5% 1.4% 98.6%
Grade 12 * % 0.5% 1.0% 99.0%
─────────────────────────────────────────────────────────────────────────────────────
Other sprays? All 1.3% 2.2% 5.2% 94.8%
Grade 8 1.7% 3.1% 5.8% 94.2%
Grade 10 1.5% 2.5% 6.9% 93.1%
Grade 12 0.6% 0.6% 2.3% 97.7%
─────────────────────────────────────────────────────────────────────────────────────
Other inhalants? All 2.1% 3.3% 8.9% 91.1%
Grade 8 2.3% 4.0% 10.3% 89.7%
Grade 10 3.6% 5.5% 12.3% 87.7%
Grade 12 * % * % 3.2% 96.8%
8/14/2019 BOWIE COUNTY - Texarkana ISD - 1999 Texas School Survey of Drug and Alcohol Use
http://slidepdf.com/reader/full/bowie-county-texarkana-isd-1999-texas-school-survey-of-drug-and-alcohol 43/185
Texarkana
Spring 1999
──────────────────────────────────────────────────────────────────────────────────────────────
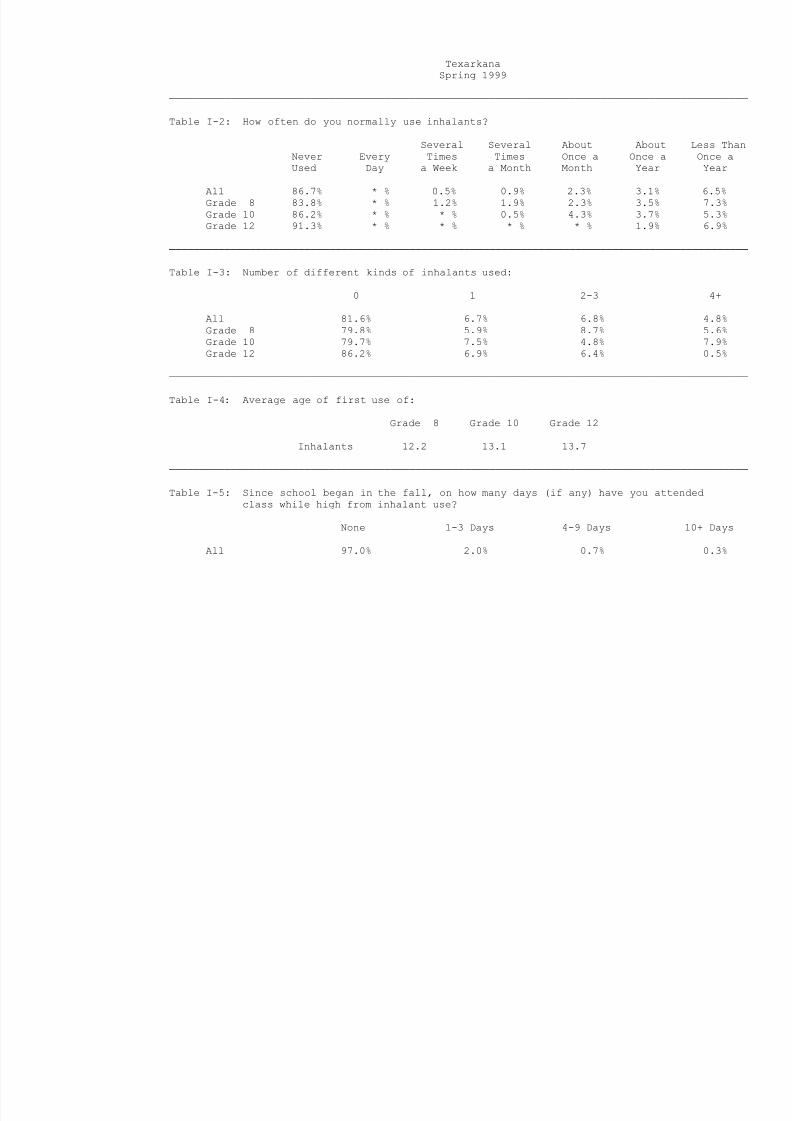
Table I-2: How often do you normally use inhalants?
Several Several About About Less ThanNever Every Times Times Once a Once a Once a
Used Day a Week a Month Month Year Year
All 86.7% * % 0.5% 0.9% 2.3% 3.1% 6.5%
Grade 8 83.8% * % 1.2% 1.9% 2.3% 3.5% 7.3%
Grade 10 86.2% * % * % 0.5% 4.3% 3.7% 5.3%
Grade 12 91.3% * % * % * % * % 1.9% 6.9%
──────────────────────────────────────────────────────────────────────────────────────────────
Table I-3: Number of different kinds of inhalants used:
0 1 2-3 4+
All 81.6% 6.7% 6.8% 4.8%
Grade 8 79.8% 5.9% 8.7% 5.6%
Grade 10 79.7% 7.5% 4.8% 7.9%
Grade 12 86.2% 6.9% 6.4% 0.5%
──────────────────────────────────────────────────────────────────────────────────────────────
Table I-4: Average age of first use of:
Grade 8 Grade 10 Grade 12
Inhalants 12.2 13.1 13.7
──────────────────────────────────────────────────────────────────────────────────────────────
Table I-5: Since school began in the fall, on how many days (if any) have you attended
class while high from inhalant use?
None 1-3 Days 4-9 Days 10+ Days
All 97.0% 2.0% 0.7% 0.3%
8/14/2019 BOWIE COUNTY - Texarkana ISD - 1999 Texas School Survey of Drug and Alcohol Use
http://slidepdf.com/reader/full/bowie-county-texarkana-isd-1999-texas-school-survey-of-drug-and-alcohol 44/185
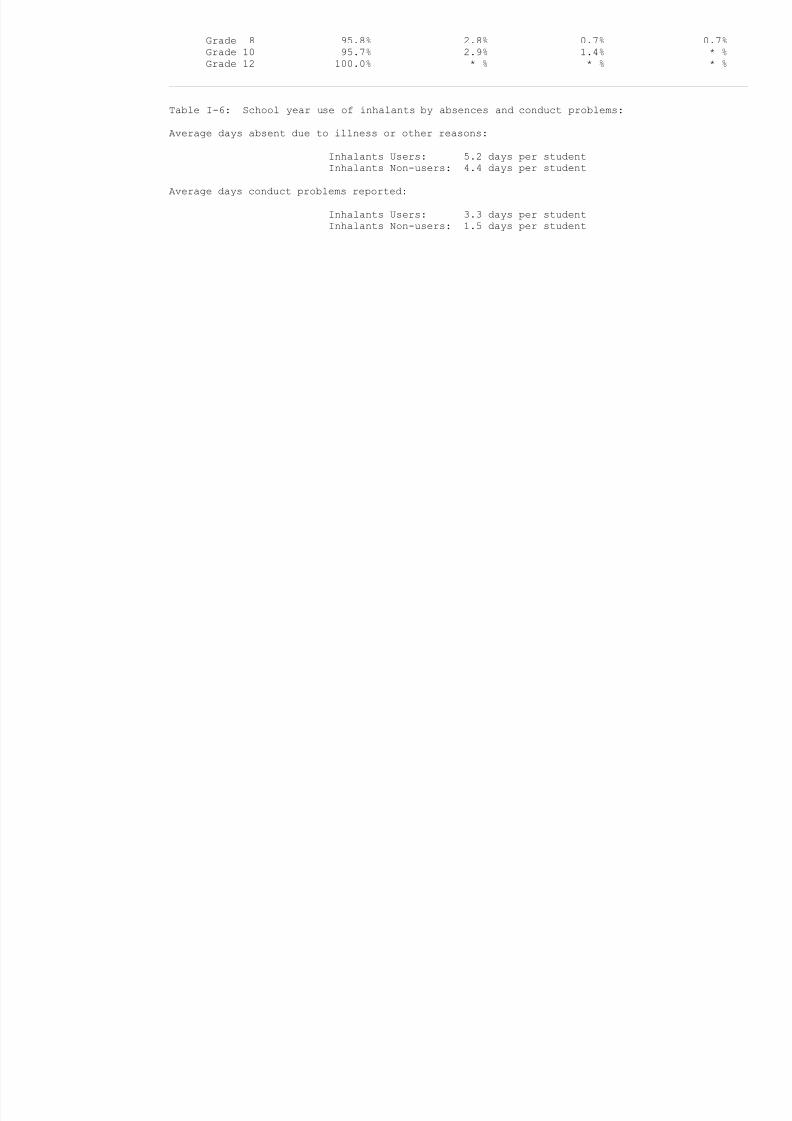
Grade 8 95.8% 2.8% 0.7% 0.7%
Grade 10 95.7% 2.9% 1.4% * %
Grade 12 100.0% * % * % * %
──────────────────────────────────────────────────────────────────────────────────────────────
Table I-6: School year use of inhalants by absences and conduct problems:
Average days absent due to illness or other reasons:
Inhalants Users: 5.2 days per student
Inhalants Non-users: 4.4 days per student
Average days conduct problems reported:
Inhalants Users: 3.3 days per student
Inhalants Non-users: 1.5 days per student
8/14/2019 BOWIE COUNTY - Texarkana ISD - 1999 Texas School Survey of Drug and Alcohol Use
http://slidepdf.com/reader/full/bowie-county-texarkana-isd-1999-texas-school-survey-of-drug-and-alcohol 45/185
Texarkana
Spring 1999
──────────────────────────────────────────────────────────────────────────────────────────────
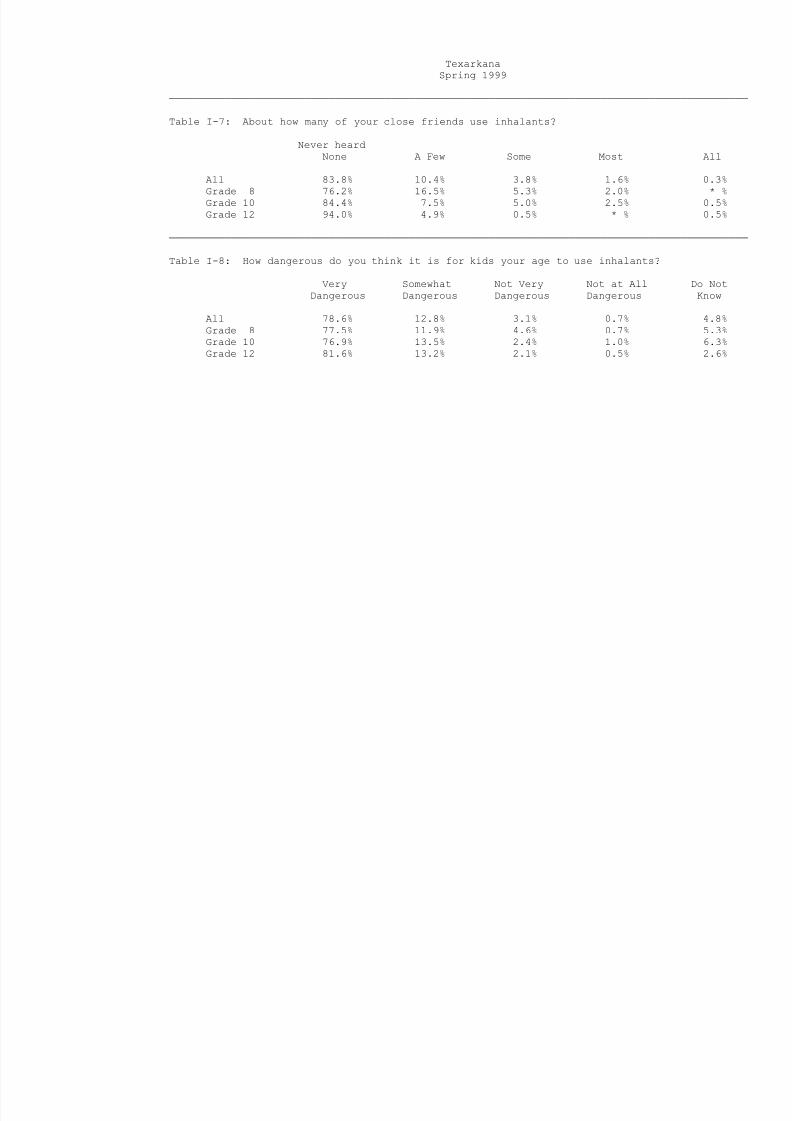
Table I-7: About how many of your close friends use inhalants?
Never heardNone A Few Some Most All
All 83.8% 10.4% 3.8% 1.6% 0.3%
Grade 8 76.2% 16.5% 5.3% 2.0% * %
Grade 10 84.4% 7.5% 5.0% 2.5% 0.5%
Grade 12 94.0% 4.9% 0.5% * % 0.5%
──────────────────────────────────────────────────────────────────────────────────────────────
Table I-8: How dangerous do you think it is for kids your age to use inhalants?
Very Somewhat Not Very Not at All Do Not
Dangerous Dangerous Dangerous Dangerous Know
All 78.6% 12.8% 3.1% 0.7% 4.8%
Grade 8 77.5% 11.9% 4.6% 0.7% 5.3%
Grade 10 76.9% 13.5% 2.4% 1.0% 6.3%
Grade 12 81.6% 13.2% 2.1% 0.5% 2.6%

8/14/2019 BOWIE COUNTY - Texarkana ISD - 1999 Texas School Survey of Drug and Alcohol Use
http://slidepdf.com/reader/full/bowie-county-texarkana-isd-1999-texas-school-survey-of-drug-and-alcohol 46/185
8/14/2019 BOWIE COUNTY - Texarkana ISD - 1999 Texas School Survey of Drug and Alcohol Use
http://slidepdf.com/reader/full/bowie-county-texarkana-isd-1999-texas-school-survey-of-drug-and-alcohol 47/185
Texarkana
Spring 1999
──────────────────────────────────────────────────────────────────────────────────────────────
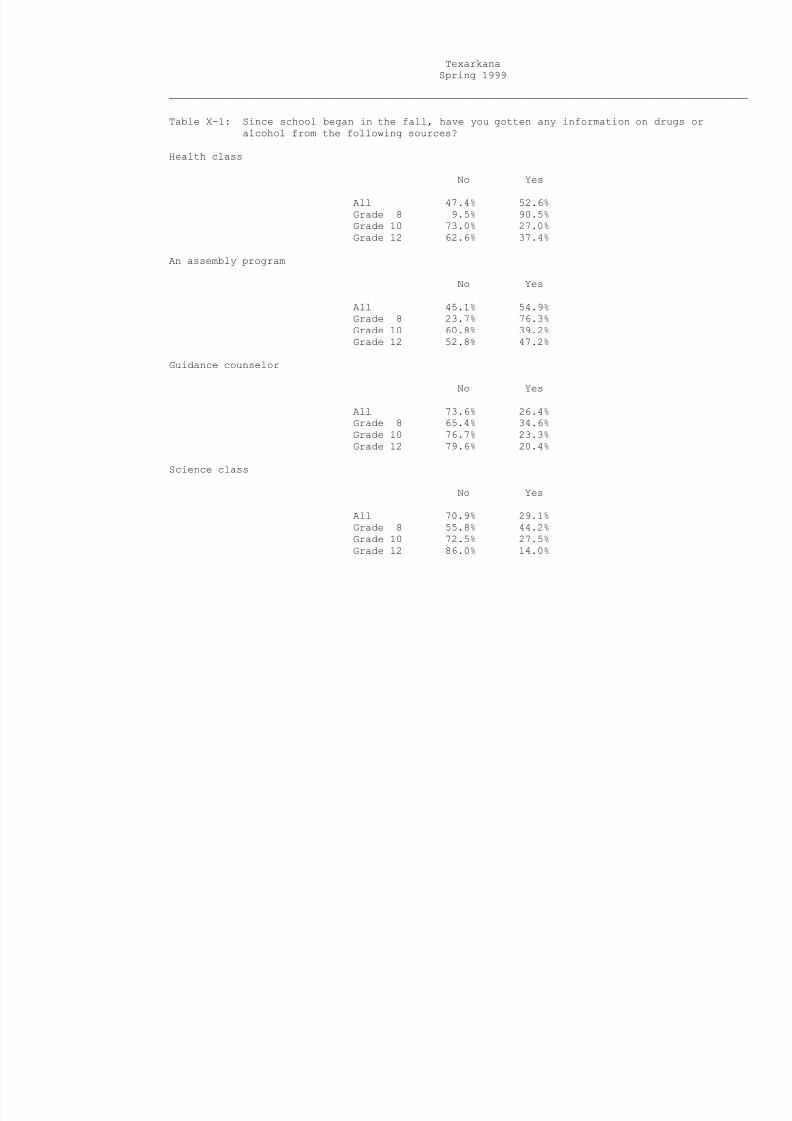
Table X-1: Since school began in the fall, have you gotten any information on drugs or
alcohol from the following sources?
Health class
No Yes
All 47.4% 52.6%
Grade 8 9.5% 90.5%
Grade 10 73.0% 27.0%
Grade 12 62.6% 37.4%
An assembly program
No Yes
All 45.1% 54.9%
Grade 8 23.7% 76.3%
Grade 10 60.8% 39.2%
Grade 12 52.8% 47.2%
Guidance counselor
No Yes
All 73.6% 26.4%Grade 8 65.4% 34.6%
Grade 10 76.7% 23.3%
Grade 12 79.6% 20.4%
Science class
No Yes
All 70.9% 29.1%
Grade 8 55.8% 44.2%
Grade 10 72.5% 27.5%
Grade 12 86.0% 14.0%
8/14/2019 BOWIE COUNTY - Texarkana ISD - 1999 Texas School Survey of Drug and Alcohol Use
http://slidepdf.com/reader/full/bowie-county-texarkana-isd-1999-texas-school-survey-of-drug-and-alcohol 48/185
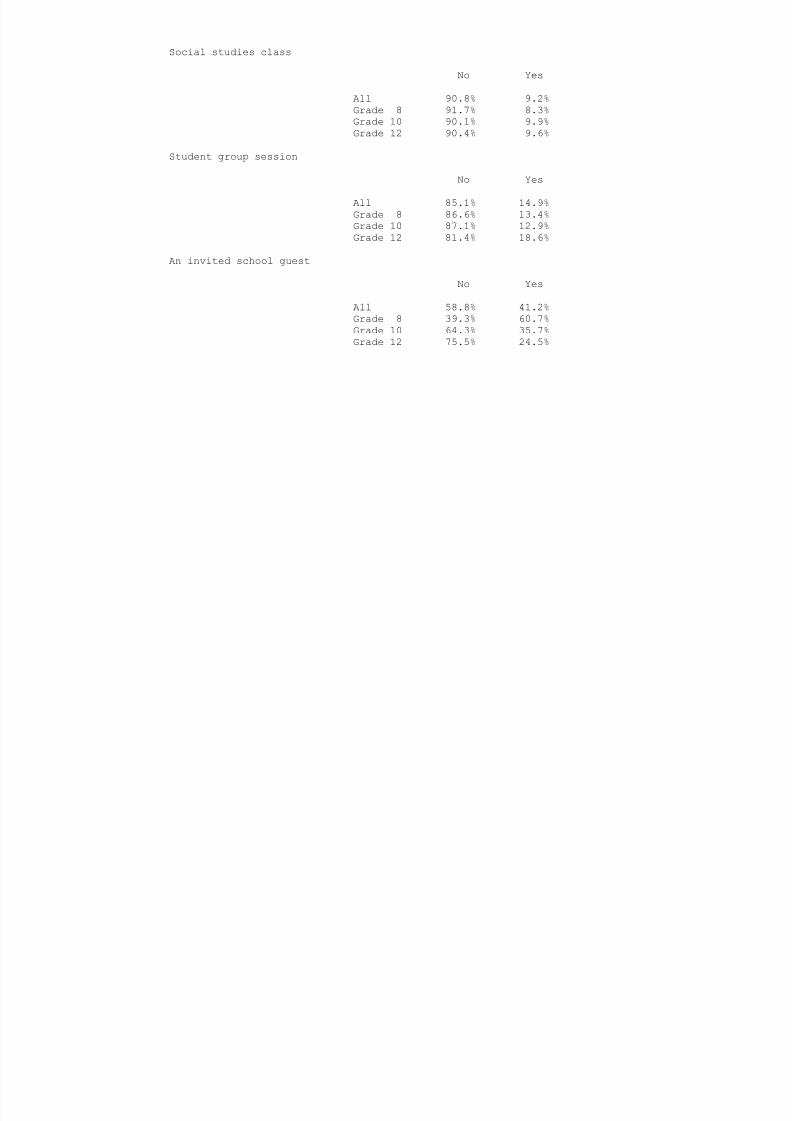
Social studies class
No Yes
All 90.8% 9.2%
Grade 8 91.7% 8.3%
Grade 10 90.1% 9.9%
Grade 12 90.4% 9.6%
Student group session
No Yes
All 85.1% 14.9%
Grade 8 86.6% 13.4%
Grade 10 87.1% 12.9%
Grade 12 81.4% 18.6%
An invited school guest
No Yes
All 58.8% 41.2%
Grade 8 39.3% 60.7%
Grade 10 64.3% 35.7%
Grade 12 75.5% 24.5%
8/14/2019 BOWIE COUNTY - Texarkana ISD - 1999 Texas School Survey of Drug and Alcohol Use
http://slidepdf.com/reader/full/bowie-county-texarkana-isd-1999-texas-school-survey-of-drug-and-alcohol 49/185
Texarkana
Spring 1999
──────────────────────────────────────────────────────────────────────────────────────────────
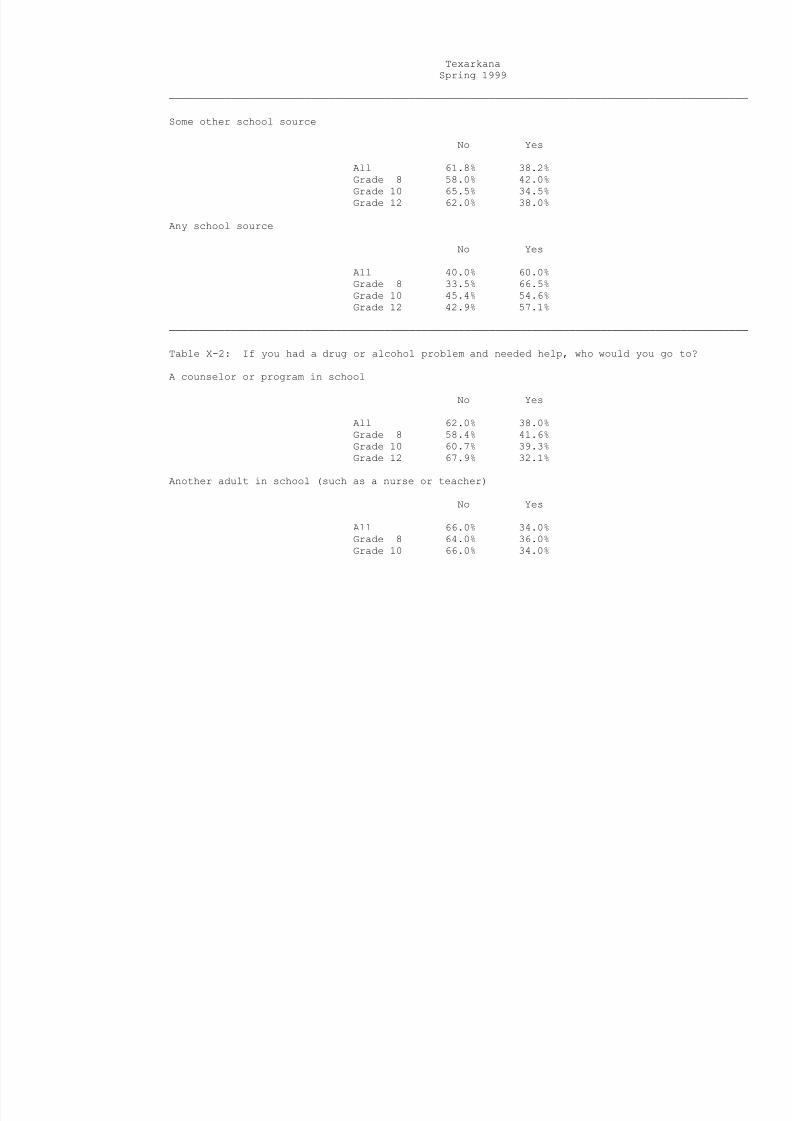
Some other school source
No Yes
All 61.8% 38.2%
Grade 8 58.0% 42.0%
Grade 10 65.5% 34.5%
Grade 12 62.0% 38.0%
Any school source
No Yes
All 40.0% 60.0%
Grade 8 33.5% 66.5%
Grade 10 45.4% 54.6%
Grade 12 42.9% 57.1%
──────────────────────────────────────────────────────────────────────────────────────────────
Table X-2: If you had a drug or alcohol problem and needed help, who would you go to?
A counselor or program in school
No Yes
All 62.0% 38.0%
Grade 8 58.4% 41.6%
Grade 10 60.7% 39.3%
Grade 12 67.9% 32.1%
Another adult in school (such as a nurse or teacher)
No Yes
All 66.0% 34.0%
Grade 8 64.0% 36.0%
Grade 10 66.0% 34.0%
8/14/2019 BOWIE COUNTY - Texarkana ISD - 1999 Texas School Survey of Drug and Alcohol Use
http://slidepdf.com/reader/full/bowie-county-texarkana-isd-1999-texas-school-survey-of-drug-and-alcohol 50/185
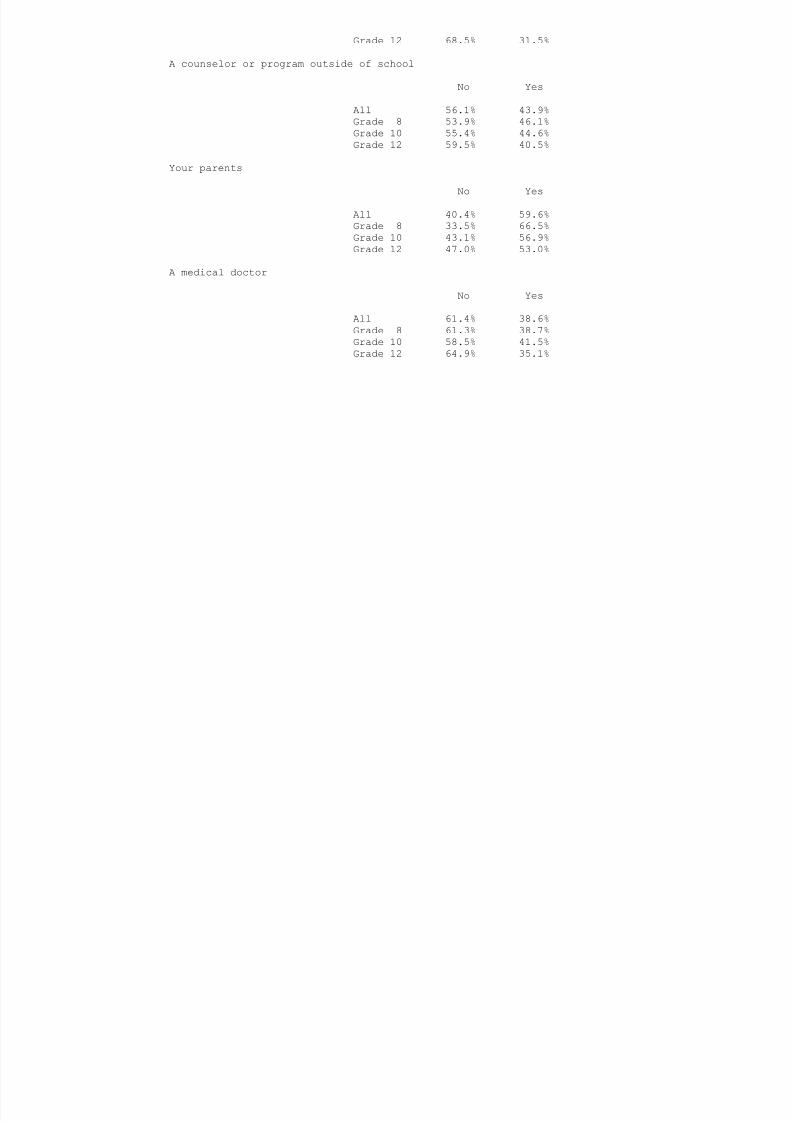
Grade 12 68.5% 31.5%
A counselor or program outside of school
No Yes
All 56.1% 43.9%
Grade 8 53.9% 46.1%
Grade 10 55.4% 44.6%
Grade 12 59.5% 40.5%
Your parents
No Yes
All 40.4% 59.6%
Grade 8 33.5% 66.5%
Grade 10 43.1% 56.9%
Grade 12 47.0% 53.0%
A medical doctor
No Yes
All 61.4% 38.6%
Grade 8 61.3% 38.7%
Grade 10 58.5% 41.5%
Grade 12 64.9% 35.1%
8/14/2019 BOWIE COUNTY - Texarkana ISD - 1999 Texas School Survey of Drug and Alcohol Use
http://slidepdf.com/reader/full/bowie-county-texarkana-isd-1999-texas-school-survey-of-drug-and-alcohol 51/185
Texarkana
Spring 1999
──────────────────────────────────────────────────────────────────────────────────────────────
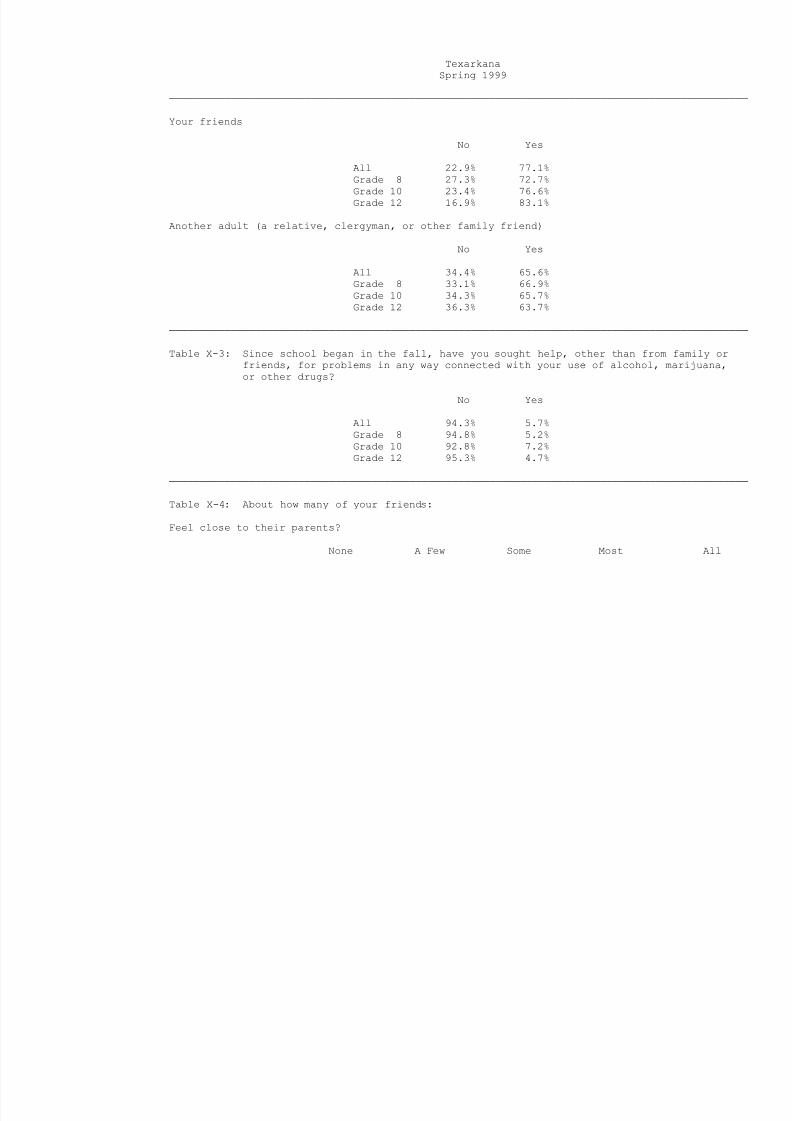
Your friends
No Yes
All 22.9% 77.1%
Grade 8 27.3% 72.7%
Grade 10 23.4% 76.6%
Grade 12 16.9% 83.1%
Another adult (a relative, clergyman, or other family friend)
No Yes
All 34.4% 65.6%
Grade 8 33.1% 66.9%
Grade 10 34.3% 65.7%
Grade 12 36.3% 63.7%
──────────────────────────────────────────────────────────────────────────────────────────────
Table X-3: Since school began in the fall, have you sought help, other than from family or
friends, for problems in any way connected with your use of alcohol, marijuana,
or other drugs?
No Yes
All 94.3% 5.7%
Grade 8 94.8% 5.2%
Grade 10 92.8% 7.2%
Grade 12 95.3% 4.7%
──────────────────────────────────────────────────────────────────────────────────────────────
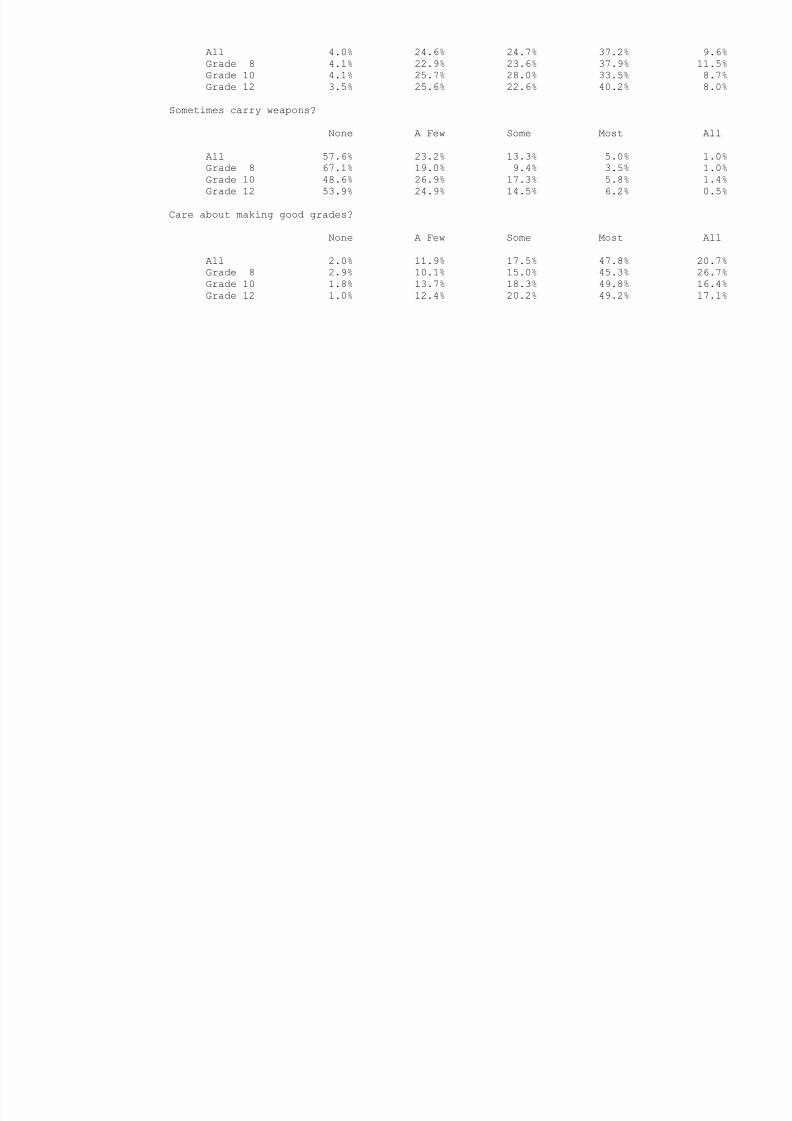
Table X-4: About how many of your friends:
Feel close to their parents?
None A Few Some Most All
8/14/2019 BOWIE COUNTY - Texarkana ISD - 1999 Texas School Survey of Drug and Alcohol Use
http://slidepdf.com/reader/full/bowie-county-texarkana-isd-1999-texas-school-survey-of-drug-and-alcohol 52/185
All 4.0% 24.6% 24.7% 37.2% 9.6%
Grade 8 4.1% 22.9% 23.6% 37.9% 11.5%
Grade 10 4.1% 25.7% 28.0% 33.5% 8.7%
Grade 12 3.5% 25.6% 22.6% 40.2% 8.0%
Sometimes carry weapons?
None A Few Some Most All
All 57.6% 23.2% 13.3% 5.0% 1.0%
Grade 8 67.1% 19.0% 9.4% 3.5% 1.0%
Grade 10 48.6% 26.9% 17.3% 5.8% 1.4%
Grade 12 53.9% 24.9% 14.5% 6.2% 0.5%
Care about making good grades?
None A Few Some Most All
All 2.0% 11.9% 17.5% 47.8% 20.7%
Grade 8 2.9% 10.1% 15.0% 45.3% 26.7%
Grade 10 1.8% 13.7% 18.3% 49.8% 16.4%
Grade 12 1.0% 12.4% 20.2% 49.2% 17.1%
8/14/2019 BOWIE COUNTY - Texarkana ISD - 1999 Texas School Survey of Drug and Alcohol Use
http://slidepdf.com/reader/full/bowie-county-texarkana-isd-1999-texas-school-survey-of-drug-and-alcohol 53/185
Texarkana
Spring 1999
──────────────────────────────────────────────────────────────────────────────────────────────
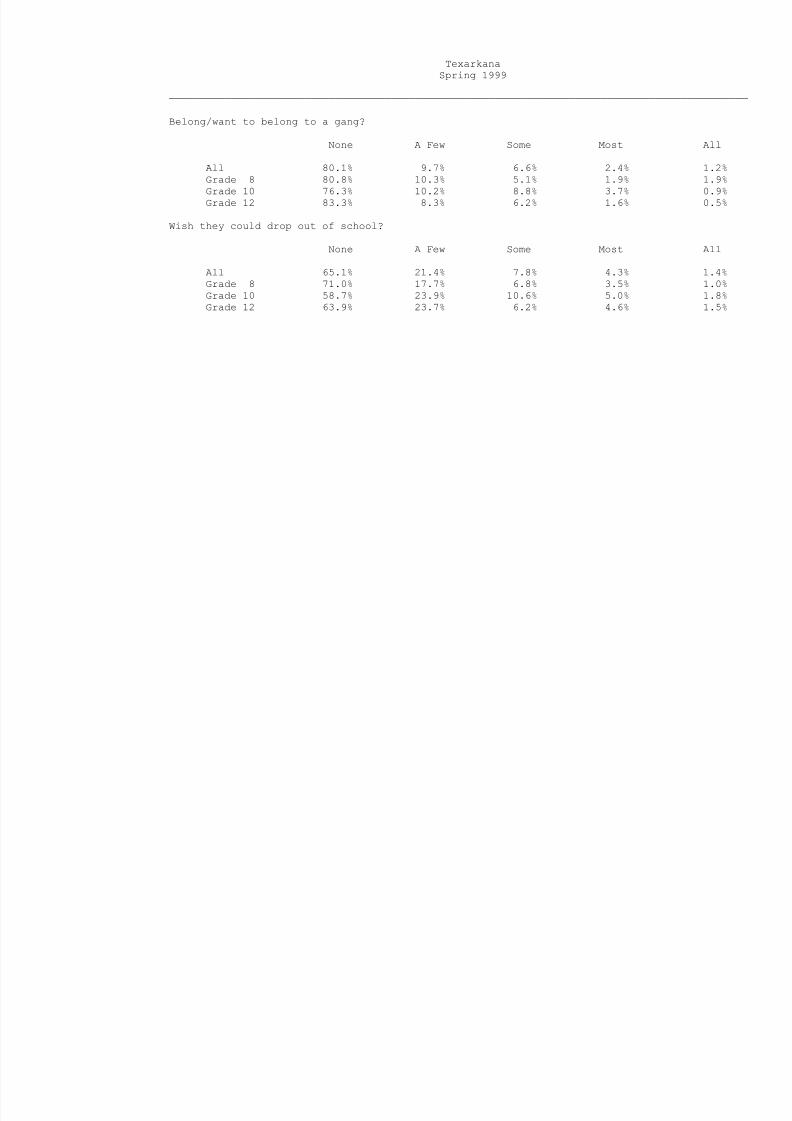
Belong/want to belong to a gang?
None A Few Some Most All
All 80.1% 9.7% 6.6% 2.4% 1.2%
Grade 8 80.8% 10.3% 5.1% 1.9% 1.9%
Grade 10 76.3% 10.2% 8.8% 3.7% 0.9%
Grade 12 83.3% 8.3% 6.2% 1.6% 0.5%
Wish they could drop out of school?
None A Few Some Most All
All 65.1% 21.4% 7.8% 4.3% 1.4%
Grade 8 71.0% 17.7% 6.8% 3.5% 1.0%
Grade 10 58.7% 23.9% 10.6% 5.0% 1.8%
Grade 12 63.9% 23.7% 6.2% 4.6% 1.5%
T k
8/14/2019 BOWIE COUNTY - Texarkana ISD - 1999 Texas School Survey of Drug and Alcohol Use
http://slidepdf.com/reader/full/bowie-county-texarkana-isd-1999-texas-school-survey-of-drug-and-alcohol 54/185
Texarkana
Spring 1999
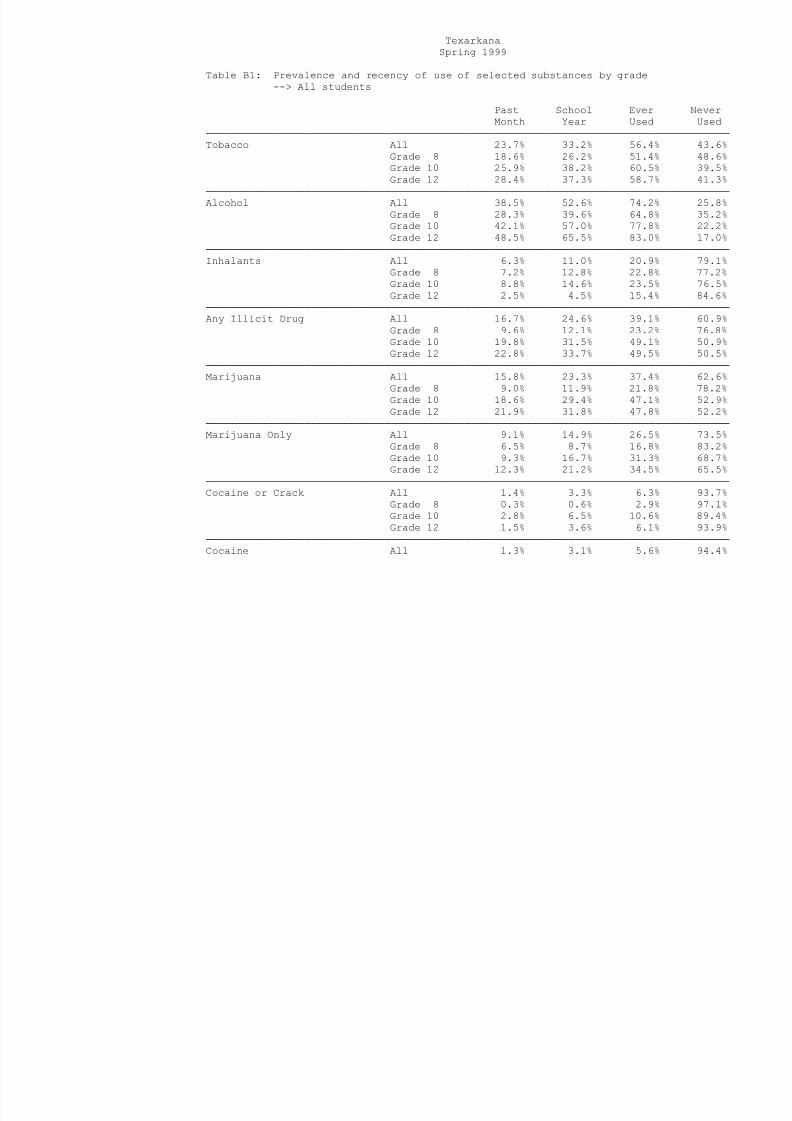
Table B1: Prevalence and recency of use of selected substances by grade
--> All students
Past School Ever Never
Month Year Used Used
─────────────────────────────────────────────────────────────────────────────────────
Tobacco All 23.7% 33.2% 56.4% 43.6%Grade 8 18.6% 26.2% 51.4% 48.6%
Grade 10 25.9% 38.2% 60.5% 39.5%
Grade 12 28.4% 37.3% 58.7% 41.3%
─────────────────────────────────────────────────────────────────────────────────────
Alcohol All 38.5% 52.6% 74.2% 25.8%
Grade 8 28.3% 39.6% 64.8% 35.2%
Grade 10 42.1% 57.0% 77.8% 22.2%
Grade 12 48.5% 65.5% 83.0% 17.0%
─────────────────────────────────────────────────────────────────────────────────────
Inhalants All 6.3% 11.0% 20.9% 79.1%
Grade 8 7.2% 12.8% 22.8% 77.2%
Grade 10 8.8% 14.6% 23.5% 76.5%
Grade 12 2.5% 4.5% 15.4% 84.6%
─────────────────────────────────────────────────────────────────────────────────────
Any Illicit Drug All 16.7% 24.6% 39.1% 60.9%
Grade 8 9.6% 12.1% 23.2% 76.8%
Grade 10 19.8% 31.5% 49.1% 50.9%
Grade 12 22.8% 33.7% 49.5% 50.5%
─────────────────────────────────────────────────────────────────────────────────────
Marijuana All 15.8% 23.3% 37.4% 62.6%
Grade 8 9.0% 11.9% 21.8% 78.2%
Grade 10 18.6% 29.4% 47.1% 52.9%
Grade 12 21.9% 31.8% 47.8% 52.2%─────────────────────────────────────────────────────────────────────────────────────
Marijuana Only All 9.1% 14.9% 26.5% 73.5%
Grade 8 6.5% 8.7% 16.8% 83.2%
Grade 10 9.3% 16.7% 31.3% 68.7%
Grade 12 12.3% 21.2% 34.5% 65.5%
─────────────────────────────────────────────────────────────────────────────────────
Cocaine or Crack All 1.4% 3.3% 6.3% 93.7%
Grade 8 0.3% 0.6% 2.9% 97.1%
Grade 10 2.8% 6.5% 10.6% 89.4%
Grade 12 1.5% 3.6% 6.1% 93.9%
─────────────────────────────────────────────────────────────────────────────────────
Cocaine All 1.3% 3.1% 5.6% 94.4%
Grade 8 * % 0 7% 2 3% 97 7%

8/14/2019 BOWIE COUNTY - Texarkana ISD - 1999 Texas School Survey of Drug and Alcohol Use
http://slidepdf.com/reader/full/bowie-county-texarkana-isd-1999-texas-school-survey-of-drug-and-alcohol 55/185
Grade 8 * % 0.7% 2.3% 97.7%
Grade 10 2.8% 5.6% 9.7% 90.3%
Grade 12 1.6% 3.6% 5.7% 94.3%
─────────────────────────────────────────────────────────────────────────────────────
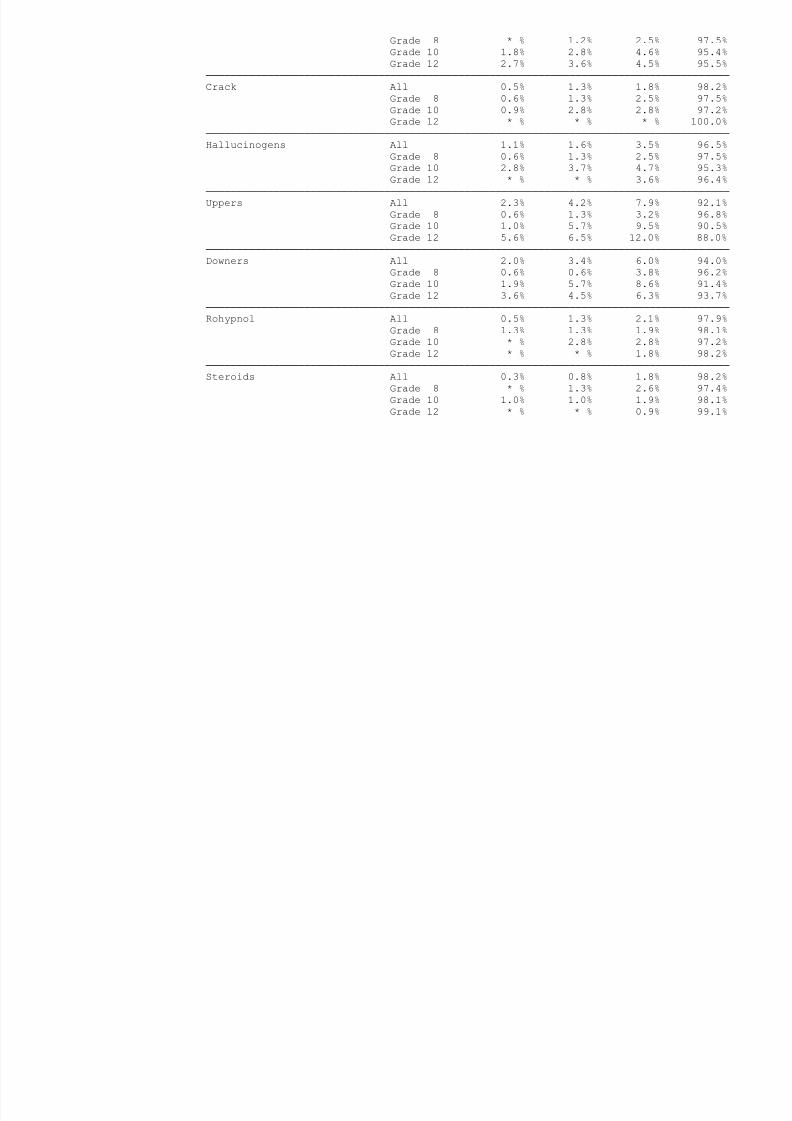
Crack All 0.3% 1.0% 2.0% 98.0%
Grade 8 0.3% 0.7% 1.6% 98.4%
Grade 10 0.5% 2.4% 3.4% 96.6%
Grade 12 * % * % 1.0% 99.0%
─────────────────────────────────────────────────────────────────────────────────────
Hallucinogens All 1.4% 2.3% 4.6% 95.4%Grade 8 1.0% 1.6% 2.9% 97.1%
Grade 10 2.8% 3.7% 5.6% 94.4%
Grade 12 0.5% 1.6% 5.7% 94.3%
─────────────────────────────────────────────────────────────────────────────────────
Uppers All 2.4% 4.3% 8.0% 92.0%
Grade 8 0.7% 1.4% 3.4% 96.6%
Grade 10 2.4% 6.2% 11.4% 88.6%
Grade 12 4.7% 6.3% 10.5% 89.5%
─────────────────────────────────────────────────────────────────────────────────────
Downers All 2.1% 3.8% 6.1% 93.9%
Grade 8 0.3% 1.3% 3.3% 96.7%
Grade 10 3.4% 6.3% 9.1% 90.9%
Grade 12 3.1% 4.7% 6.7% 93.3%
─────────────────────────────────────────────────────────────────────────────────────
Rohypnol All 0.6% 1.3% 2.3% 97.7%
Grade 8 0.7% 0.7% 1.7% 98.3%
Grade 10 1.0% 2.9% 3.3% 96.7%
Grade 12 * % 0.5% 2.1% 97.9%
─────────────────────────────────────────────────────────────────────────────────────
Steroids All 0.9% 1.6% 2.9% 97.1%
Grade 8 0.3% 1.3% 3.0% 97.0%
Grade 10 1.5% 2.0% 3.4% 96.6%
Grade 12 1.0% 1.6% 2.1% 97.9%
Texarkana

8/14/2019 BOWIE COUNTY - Texarkana ISD - 1999 Texas School Survey of Drug and Alcohol Use
http://slidepdf.com/reader/full/bowie-county-texarkana-isd-1999-texas-school-survey-of-drug-and-alcohol 56/185
Texarkana
Spring 1999
Table B1 continued from previous page
Past School Ever Never
Month Year Used Used
─────────────────────────────────────────────────────────────────────────────────────
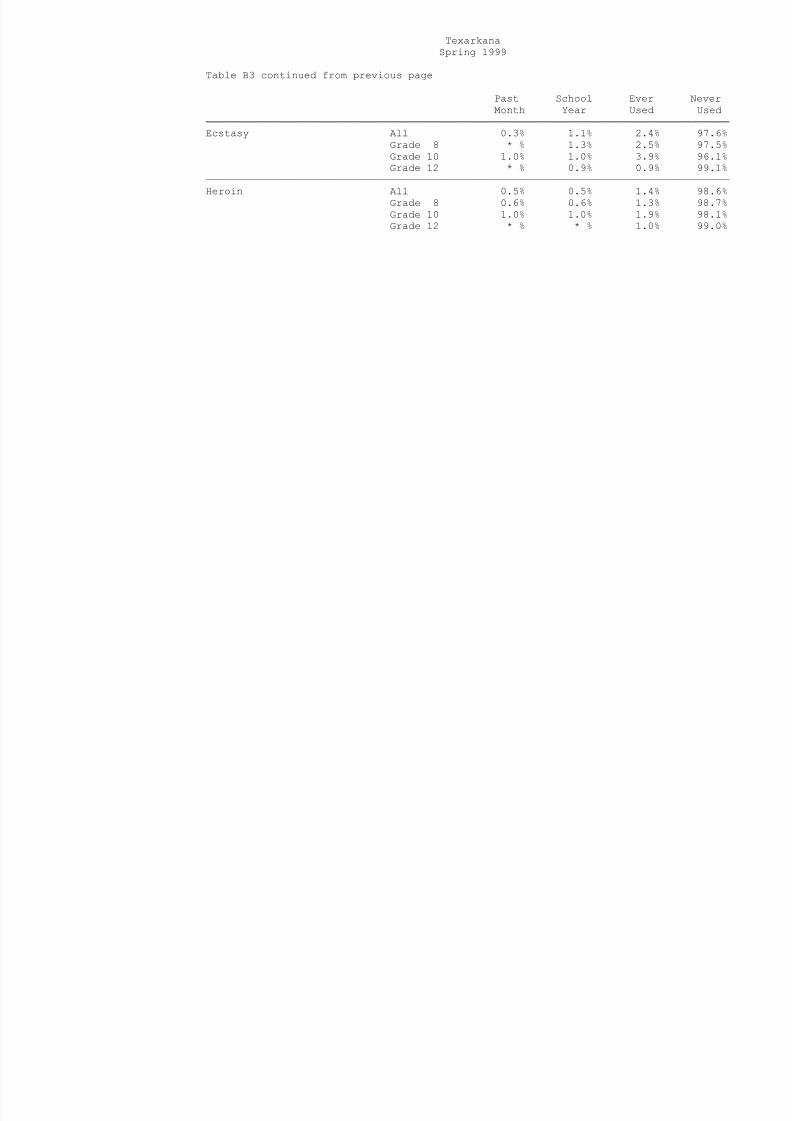
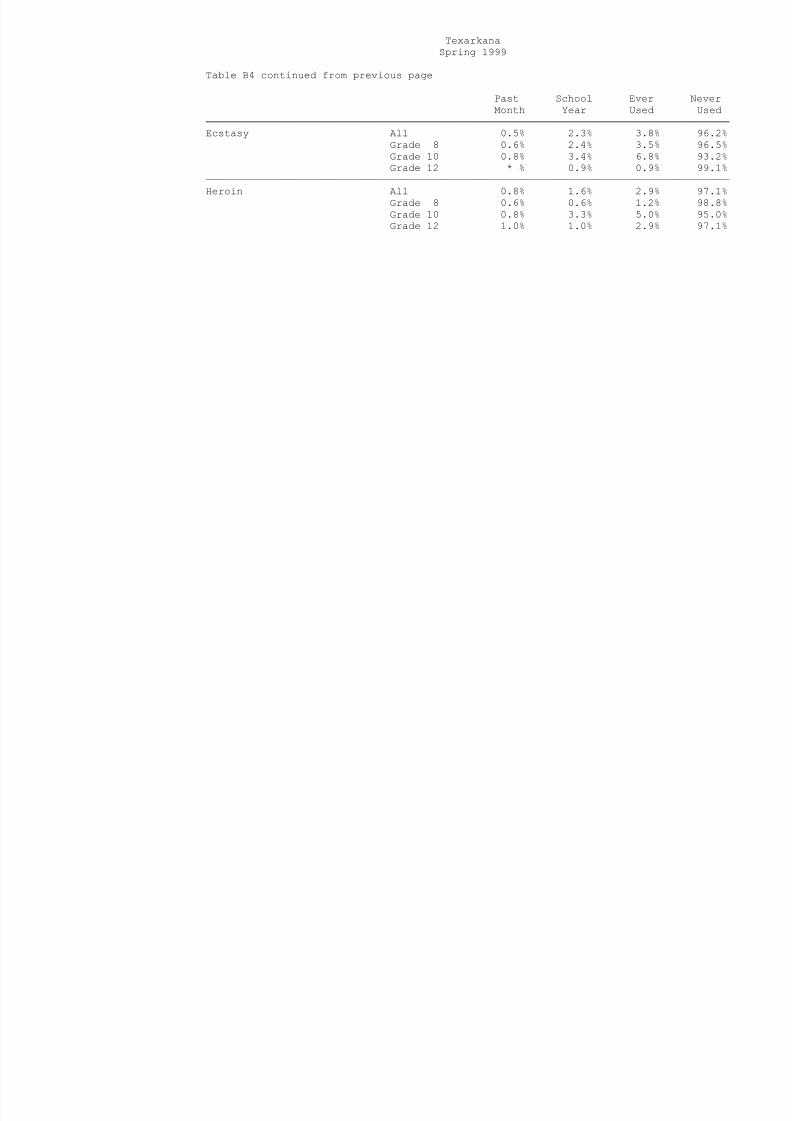
Ecstasy All 0.4% 1.6% 2.8% 97.2%
Grade 8 0.3% 1.3% 2.0% 98.0%Grade 10 0.5% 2.5% 5.4% 94.6%
Grade 12 0.5% 1.1% 1.1% 98.9%
─────────────────────────────────────────────────────────────────────────────────────
Heroin All 0.4% 0.9% 1.9% 98.1%
Grade 8 0.3% 0.3% 1.0% 99.0%
Grade 10 0.5% 1.9% 2.9% 97.1%
Grade 12 0.5% 0.5% 2.2% 97.8%
Texarkana

8/14/2019 BOWIE COUNTY - Texarkana ISD - 1999 Texas School Survey of Drug and Alcohol Use
http://slidepdf.com/reader/full/bowie-county-texarkana-isd-1999-texas-school-survey-of-drug-and-alcohol 57/185
Texarkana
Spring 1999
Table B2: Prevalence and recency of use of selected substances by grade
--> Male students
Past School Ever Never
Month Year Used Used
─────────────────────────────────────────────────────────────────────────────────────
Tobacco All 24.6% 31.6% 57.2% 42.8%Grade 8 20.3% 25.5% 53.6% 46.4%
Grade 10 28.4% 37.6% 58.7% 41.3%
Grade 12 26.4% 33.3% 60.9% 39.1%
─────────────────────────────────────────────────────────────────────────────────────
Alcohol All 40.0% 52.2% 73.8% 26.2%
Grade 8 30.5% 39.0% 62.3% 37.7%
Grade 10 45.5% 61.8% 80.9% 19.1%
Grade 12 47.7% 60.5% 82.6% 17.4%
─────────────────────────────────────────────────────────────────────────────────────
Inhalants All 7.6% 14.0% 24.2% 75.8%
Grade 8 7.1% 14.8% 23.2% 76.8%
Grade 10 10.5% 19.3% 28.9% 71.1%
Grade 12 4.7% 5.8% 19.8% 80.2%
─────────────────────────────────────────────────────────────────────────────────────
Any Illicit Drug All 17.2% 25.4% 40.1% 59.9%
Grade 8 10.5% 13.7% 26.8% 73.2%
Grade 10 21.8% 36.4% 50.0% 50.0%
Grade 12 21.6% 29.5% 47.7% 52.3%
─────────────────────────────────────────────────────────────────────────────────────
Marijuana All 16.1% 23.5% 38.6% 61.4%
Grade 8 10.5% 13.8% 27.0% 73.0%
Grade 10 20.2% 33.0% 46.8% 53.2%
Grade 12 19.5% 26.4% 46.0% 54.0%─────────────────────────────────────────────────────────────────────────────────────
Marijuana Only All 8.5% 14.2% 25.9% 74.1%
Grade 8 7.1% 10.3% 21.9% 78.1%
Grade 10 7.8% 16.5% 27.0% 73.0%
Grade 12 11.4% 17.0% 30.7% 69.3%
─────────────────────────────────────────────────────────────────────────────────────
Cocaine or Crack All 1.2% 3.7% 8.6% 91.4%
Grade 8 * % * % 2.7% 97.3%
Grade 10 3.8% 8.5% 16.0% 84.0%
Grade 12 * % 3.6% 8.3% 91.7%
─────────────────────────────────────────────────────────────────────────────────────
Cocaine All 1.3% 3.8% 7.8% 92.2%
Grade 8 * % * % 2 1% 97 9%

8/14/2019 BOWIE COUNTY - Texarkana ISD - 1999 Texas School Survey of Drug and Alcohol Use
http://slidepdf.com/reader/full/bowie-county-texarkana-isd-1999-texas-school-survey-of-drug-and-alcohol 58/185
Grade 8 % % 2.1% 97.9%
Grade 10 3.8% 8.5% 15.1% 84.9%
Grade 12 * % 3.7% 7.3% 92.7%
─────────────────────────────────────────────────────────────────────────────────────
Crack All * % 0.6% 2.2% 97.8%
Grade 8 * % * % 0.7% 99.3%
Grade 10 * % 2.0% 4.0% 96.0%
Grade 12 * % * % 2.4% 97.6%
─────────────────────────────────────────────────────────────────────────────────────
Hallucinogens All 1.8% 3.1% 5.9% 94.1%Grade 8 1.4% 2.1% 3.4% 96.6%
Grade 10 2.8% 3.8% 6.6% 93.4%
Grade 12 1.2% 3.7% 8.7% 91.3%
─────────────────────────────────────────────────────────────────────────────────────
Uppers All 2.6% 4.5% 8.2% 91.8%
Grade 8 0.7% 1.4% 3.6% 96.4%
Grade 10 3.8% 6.7% 13.5% 86.5%
Grade 12 3.7% 6.1% 8.5% 91.5%
─────────────────────────────────────────────────────────────────────────────────────
Downers All 2.2% 4.4% 6.3% 93.7%
Grade 8 * % 2.1% 2.8% 97.2%
Grade 10 4.9% 6.9% 9.8% 90.2%
Grade 12 2.4% 4.9% 7.3% 92.7%
─────────────────────────────────────────────────────────────────────────────────────
Rohypnol All 0.6% 1.3% 2.5% 97.5%
Grade 8 * % * % 1.4% 98.6%
Grade 10 2.0% 3.0% 4.0% 96.0%
Grade 12 * % 1.2% 2.4% 97.6%
─────────────────────────────────────────────────────────────────────────────────────
Steroids All 1.6% 2.6% 4.1% 95.9%
Grade 8 0.7% 1.4% 3.5% 96.5%
Grade 10 2.0% 3.1% 5.1% 94.9%
Grade 12 2.5% 3.7% 3.7% 96.3%
Texarkana

8/14/2019 BOWIE COUNTY - Texarkana ISD - 1999 Texas School Survey of Drug and Alcohol Use
http://slidepdf.com/reader/full/bowie-county-texarkana-isd-1999-texas-school-survey-of-drug-and-alcohol 59/185
Texarkana
Spring 1999
Table B2 continued from previous page
Past School Ever Never
Month Year Used Used
─────────────────────────────────────────────────────────────────────────────────────
Ecstasy All 0.6% 2.2% 3.2% 96.8%
Grade 8 0.7% 1.4% 1.4% 98.6%Grade 10 * % 4.0% 7.0% 93.0%
Grade 12 1.2% 1.2% 1.2% 98.8%
─────────────────────────────────────────────────────────────────────────────────────
Heroin All 0.3% 1.3% 2.6% 97.4%
Grade 8 * % * % 0.7% 99.3%
Grade 10 * % 2.9% 3.9% 96.1%
Grade 12 1.2% 1.2% 3.6% 96.4%
Texarkana

8/14/2019 BOWIE COUNTY - Texarkana ISD - 1999 Texas School Survey of Drug and Alcohol Use
http://slidepdf.com/reader/full/bowie-county-texarkana-isd-1999-texas-school-survey-of-drug-and-alcohol 60/185
Texarkana
Spring 1999
Table B3: Prevalence and recency of use of selected substances by grade
--> Female students
Past School Ever Never
Month Year Used Used
─────────────────────────────────────────────────────────────────────────────────────
Tobacco All 22.8% 34.6% 55.4% 44.6%Grade 8 17.1% 26.8% 49.4% 50.6%
Grade 10 22.7% 38.2% 61.8% 38.2%
Grade 12 30.1% 40.7% 56.6% 43.4%
─────────────────────────────────────────────────────────────────────────────────────
Alcohol All 37.1% 53.0% 74.4% 25.6%
Grade 8 26.2% 40.2% 67.1% 32.9%
Grade 10 38.2% 51.8% 74.5% 25.5%
Grade 12 49.6% 69.9% 83.2% 16.8%
─────────────────────────────────────────────────────────────────────────────────────
Inhalants All 5.2% 8.3% 17.9% 82.1%
Grade 8 7.3% 10.9% 22.4% 77.6%
Grade 10 7.2% 9.9% 18.0% 82.0%Grade 12 0.9% 3.5% 12.3% 87.7%
─────────────────────────────────────────────────────────────────────────────────────
Any Illicit Drug All 16.0% 23.6% 37.9% 62.1%
Grade 8 8.7% 10.6% 19.9% 80.1%
Grade 10 17.1% 26.1% 47.7% 52.3%
Grade 12 23.9% 37.2% 50.4% 49.6%
─────────────────────────────────────────────────────────────────────────────────────
Marijuana All 15.3% 22.9% 36.0% 64.0%
Grade 8 7.5% 10.0% 16.9% 83.1%
Grade 10 16.2% 25.2% 46.8% 53.2%
Grade 12 23.9% 36.3% 48.7% 51.3%─────────────────────────────────────────────────────────────────────────────────────
Marijuana Only All 9.4% 15.3% 26.6% 73.4%
Grade 8 6.0% 7.2% 12.0% 88.0%
Grade 10 9.9% 16.2% 35.1% 64.9%
Grade 12 13.2% 24.6% 36.8% 63.2%
─────────────────────────────────────────────────────────────────────────────────────
Cocaine or Crack All 1.6% 3.0% 4.2% 95.8%
Grade 8 0.6% 1.2% 3.1% 96.9%
Grade 10 1.8% 4.6% 5.5% 94.5%
Grade 12 2.7% 3.6% 4.5% 95.5%
─────────────────────────────────────────────────────────────────────────────────────
Cocaine All 1.4% 2.4% 3.7% 96.3%
Grade 8 * % 1.2% 2.5% 97.5%
8/14/2019 BOWIE COUNTY - Texarkana ISD - 1999 Texas School Survey of Drug and Alcohol Use
http://slidepdf.com/reader/full/bowie-county-texarkana-isd-1999-texas-school-survey-of-drug-and-alcohol 61/185
G ade . . .
Grade 10 1.8% 2.8% 4.6% 95.4%
Grade 12 2.7% 3.6% 4.5% 95.5%
─────────────────────────────────────────────────────────────────────────────────────
Crack All 0.5% 1.3% 1.8% 98.2%
Grade 8 0.6% 1.3% 2.5% 97.5%
Grade 10 0.9% 2.8% 2.8% 97.2%
Grade 12 * % * % * % 100.0%
─────────────────────────────────────────────────────────────────────────────────────
Hallucinogens All 1.1% 1.6% 3.5% 96.5%Grade 8 0.6% 1.3% 2.5% 97.5%
Grade 10 2.8% 3.7% 4.7% 95.3%
Grade 12 * % * % 3.6% 96.4%
─────────────────────────────────────────────────────────────────────────────────────
Uppers All 2.3% 4.2% 7.9% 92.1%
Grade 8 0.6% 1.3% 3.2% 96.8%
Grade 10 1.0% 5.7% 9.5% 90.5%
Grade 12 5.6% 6.5% 12.0% 88.0%
─────────────────────────────────────────────────────────────────────────────────────
Downers All 2.0% 3.4% 6.0% 94.0%
Grade 8 0.6% 0.6% 3.8% 96.2%
Grade 10 1.9% 5.7% 8.6% 91.4%Grade 12 3.6% 4.5% 6.3% 93.7%
─────────────────────────────────────────────────────────────────────────────────────
Rohypnol All 0.5% 1.3% 2.1% 97.9%
Grade 8 1.3% 1.3% 1.9% 98.1%
Grade 10 * % 2.8% 2.8% 97.2%
Grade 12 * % * % 1.8% 98.2%
─────────────────────────────────────────────────────────────────────────────────────
Steroids All 0.3% 0.8% 1.8% 98.2%
Grade 8 * % 1.3% 2.6% 97.4%
Grade 10 1.0% 1.0% 1.9% 98.1%
Grade 12 * % * % 0.9% 99.1%
Texarkana
8/14/2019 BOWIE COUNTY - Texarkana ISD - 1999 Texas School Survey of Drug and Alcohol Use
http://slidepdf.com/reader/full/bowie-county-texarkana-isd-1999-texas-school-survey-of-drug-and-alcohol 62/185
Spring 1999
Table B3 continued from previous page
Past School Ever Never
Month Year Used Used
─────────────────────────────────────────────────────────────────────────────────────
Ecstasy All 0.3% 1.1% 2.4% 97.6%
Grade 8 * % 1.3% 2.5% 97.5%Grade 10 1.0% 1.0% 3.9% 96.1%
Grade 12 * % 0.9% 0.9% 99.1%
─────────────────────────────────────────────────────────────────────────────────────
Heroin All 0.5% 0.5% 1.4% 98.6%
Grade 8 0.6% 0.6% 1.3% 98.7%
Grade 10 1.0% 1.0% 1.9% 98.1%
Grade 12 * % * % 1.0% 99.0%
Texarkana

8/14/2019 BOWIE COUNTY - Texarkana ISD - 1999 Texas School Survey of Drug and Alcohol Use
http://slidepdf.com/reader/full/bowie-county-texarkana-isd-1999-texas-school-survey-of-drug-and-alcohol 63/185
Spring 1999
Table B4: Prevalence and recency of use of selected substances by grade
--> White students
Past School Ever Never
Month Year Used Used
─────────────────────────────────────────────────────────────────────────────────────
Tobacco All 28.0% 40.6% 61.3% 38.7%Grade 8 21.0% 33.0% 52.3% 47.7%
Grade 10 30.5% 45.3% 68.8% 31.3%
Grade 12 34.9% 45.9% 65.1% 34.9%
─────────────────────────────────────────────────────────────────────────────────────
Alcohol All 41.6% 56.3% 74.7% 25.3%
Grade 8 29.5% 41.5% 64.2% 35.8%
Grade 10 45.7% 64.3% 81.4% 18.6%
Grade 12 53.7% 67.6% 81.5% 18.5%
─────────────────────────────────────────────────────────────────────────────────────
Inhalants All 8.4% 13.6% 28.0% 72.0%
Grade 8 8.5% 13.6% 26.0% 74.0%
Grade 10 11.5% 19.8% 32.8% 67.2%Grade 12 4.6% 6.5% 25.0% 75.0%
─────────────────────────────────────────────────────────────────────────────────────
Any Illicit Drug All 14.5% 22.6% 37.8% 62.2%
Grade 8 6.9% 9.2% 21.8% 78.2%
Grade 10 16.3% 28.7% 45.7% 54.3%
Grade 12 22.9% 33.9% 50.5% 49.5%
─────────────────────────────────────────────────────────────────────────────────────
Marijuana All 13.1% 20.7% 35.3% 64.7%
Grade 8 6.3% 9.2% 20.1% 79.9%
Grade 10 14.1% 25.8% 43.0% 57.0%
Grade 12 21.3% 30.6% 47.2% 52.8%
─────────────────────────────────────────────────────────────────────────────────────
Marijuana Only All 3.4% 8.9% 20.1% 79.9%
Grade 8 2.8% 4.5% 13.6% 86.4%
Grade 10 1.5% 9.2% 21.4% 78.6%
Grade 12 6.4% 14.7% 27.5% 72.5%
─────────────────────────────────────────────────────────────────────────────────────
Cocaine or Crack All 2.3% 5.1% 8.6% 91.4%
Grade 8 0.6% 1.2% 4.0% 96.0%
Grade 10 4.7% 9.4% 13.4% 86.6%
Grade 12 1.9% 5.7% 9.4% 90.6%
─────────────────────────────────────────────────────────────────────────────────────
Cocaine All 2.1% 4.7% 7.7% 92.3%
Grade 8 * % 1.2% 2.9% 97.1%

8/14/2019 BOWIE COUNTY - Texarkana ISD - 1999 Texas School Survey of Drug and Alcohol Use
http://slidepdf.com/reader/full/bowie-county-texarkana-isd-1999-texas-school-survey-of-drug-and-alcohol 64/185
Grade 10 4.7% 7.9% 12.6% 87.4%
Grade 12 1.9% 5.8% 8.7% 91.3%
─────────────────────────────────────────────────────────────────────────────────────
Crack All 0.5% 1.8% 3.0% 97.0%
Grade 8 0.6% 1.2% 2.9% 97.1%
Grade 10 0.8% 4.2% 4.2% 95.8%
Grade 12 * % * % 1.9% 98.1%
─────────────────────────────────────────────────────────────────────────────────────
Hallucinogens All 2.3% 3.5% 6.4% 93.6%Grade 8 1.2% 2.3% 4.1% 95.9%
Grade 10 4.8% 5.6% 7.1% 92.9%
Grade 12 1.0% 2.9% 8.6% 91.4%
─────────────────────────────────────────────────────────────────────────────────────
Uppers All 3.2% 6.4% 12.2% 87.8%
Grade 8 0.6% 1.8% 4.8% 95.2%
Grade 10 3.2% 8.9% 16.9% 83.1%
Grade 12 6.9% 9.8% 16.7% 83.3%
─────────────────────────────────────────────────────────────────────────────────────
Downers All 3.2% 5.5% 9.3% 90.7%
Grade 8 0.6% 1.8% 5.3% 94.7%
Grade 10 4.9% 9.0% 13.9% 86.1%Grade 12 4.8% 6.7% 9.5% 90.5%
─────────────────────────────────────────────────────────────────────────────────────
Rohypnol All 0.8% 1.8% 2.9% 97.1%
Grade 8 0.6% 0.6% 1.2% 98.8%
Grade 10 1.6% 4.0% 4.0% 96.0%
Grade 12 * % 1.0% 3.8% 96.2%
─────────────────────────────────────────────────────────────────────────────────────
Steroids All 1.3% 2.3% 4.1% 95.9%
Grade 8 0.6% 2.3% 4.1% 95.9%
Grade 10 1.7% 1.7% 4.2% 95.8%
Grade 12 1.9% 2.9% 3.9% 96.1%
Texarkana
8/14/2019 BOWIE COUNTY - Texarkana ISD - 1999 Texas School Survey of Drug and Alcohol Use
http://slidepdf.com/reader/full/bowie-county-texarkana-isd-1999-texas-school-survey-of-drug-and-alcohol 65/185
Spring 1999
Table B4 continued from previous page
Past School Ever Never
Month Year Used Used
─────────────────────────────────────────────────────────────────────────────────────
Ecstasy All 0.5% 2.3% 3.8% 96.2%
Grade 8 0.6% 2.4% 3.5% 96.5%Grade 10 0.8% 3.4% 6.8% 93.2%
Grade 12 * % 0.9% 0.9% 99.1%
─────────────────────────────────────────────────────────────────────────────────────
Heroin All 0.8% 1.6% 2.9% 97.1%
Grade 8 0.6% 0.6% 1.2% 98.8%
Grade 10 0.8% 3.3% 5.0% 95.0%
Grade 12 1.0% 1.0% 2.9% 97.1%
Texarkana
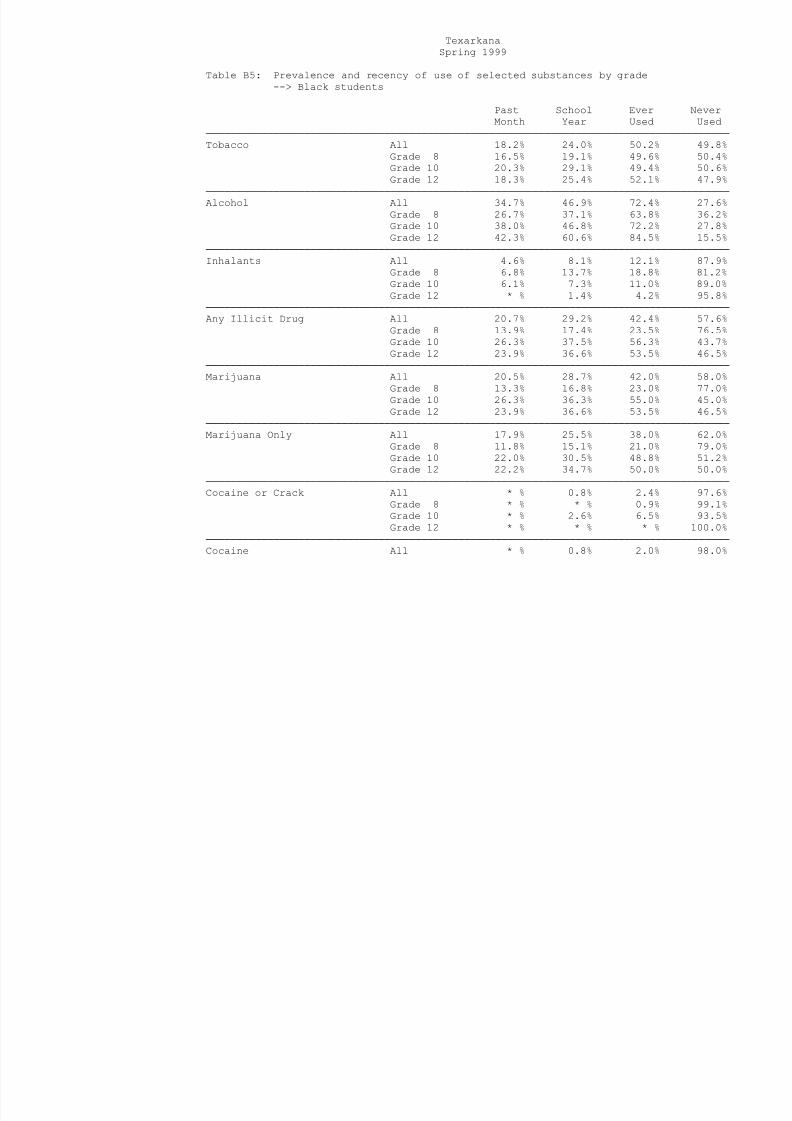
8/14/2019 BOWIE COUNTY - Texarkana ISD - 1999 Texas School Survey of Drug and Alcohol Use
http://slidepdf.com/reader/full/bowie-county-texarkana-isd-1999-texas-school-survey-of-drug-and-alcohol 66/185
Spring 1999
Table B5: Prevalence and recency of use of selected substances by grade
--> Black students
Past School Ever Never
Month Year Used Used
─────────────────────────────────────────────────────────────────────────────────────
Tobacco All 18.2% 24.0% 50.2% 49.8%Grade 8 16.5% 19.1% 49.6% 50.4%
Grade 10 20.3% 29.1% 49.4% 50.6%
Grade 12 18.3% 25.4% 52.1% 47.9%
─────────────────────────────────────────────────────────────────────────────────────
Alcohol All 34.7% 46.9% 72.4% 27.6%
Grade 8 26.7% 37.1% 63.8% 36.2%
Grade 10 38.0% 46.8% 72.2% 27.8%
Grade 12 42.3% 60.6% 84.5% 15.5%
─────────────────────────────────────────────────────────────────────────────────────
Inhalants All 4.6% 8.1% 12.1% 87.9%
Grade 8 6.8% 13.7% 18.8% 81.2%
Grade 10 6.1% 7.3% 11.0% 89.0%Grade 12 * % 1.4% 4.2% 95.8%
─────────────────────────────────────────────────────────────────────────────────────
Any Illicit Drug All 20.7% 29.2% 42.4% 57.6%
Grade 8 13.9% 17.4% 23.5% 76.5%
Grade 10 26.3% 37.5% 56.3% 43.7%
Grade 12 23.9% 36.6% 53.5% 46.5%
─────────────────────────────────────────────────────────────────────────────────────
Marijuana All 20.5% 28.7% 42.0% 58.0%
Grade 8 13.3% 16.8% 23.0% 77.0%
Grade 10 26.3% 36.3% 55.0% 45.0%
Grade 12 23.9% 36.6% 53.5% 46.5%
─────────────────────────────────────────────────────────────────────────────────────
Marijuana Only All 17.9% 25.5% 38.0% 62.0%
Grade 8 11.8% 15.1% 21.0% 79.0%
Grade 10 22.0% 30.5% 48.8% 51.2%
Grade 12 22.2% 34.7% 50.0% 50.0%
─────────────────────────────────────────────────────────────────────────────────────
Cocaine or Crack All * % 0.8% 2.4% 97.6%
Grade 8 * % * % 0.9% 99.1%
Grade 10 * % 2.6% 6.5% 93.5%
Grade 12 * % * % * % 100.0%
─────────────────────────────────────────────────────────────────────────────────────
Cocaine All * % 0.8% 2.0% 98.0%
Grade 8 * % * % 0.9% 99.1%
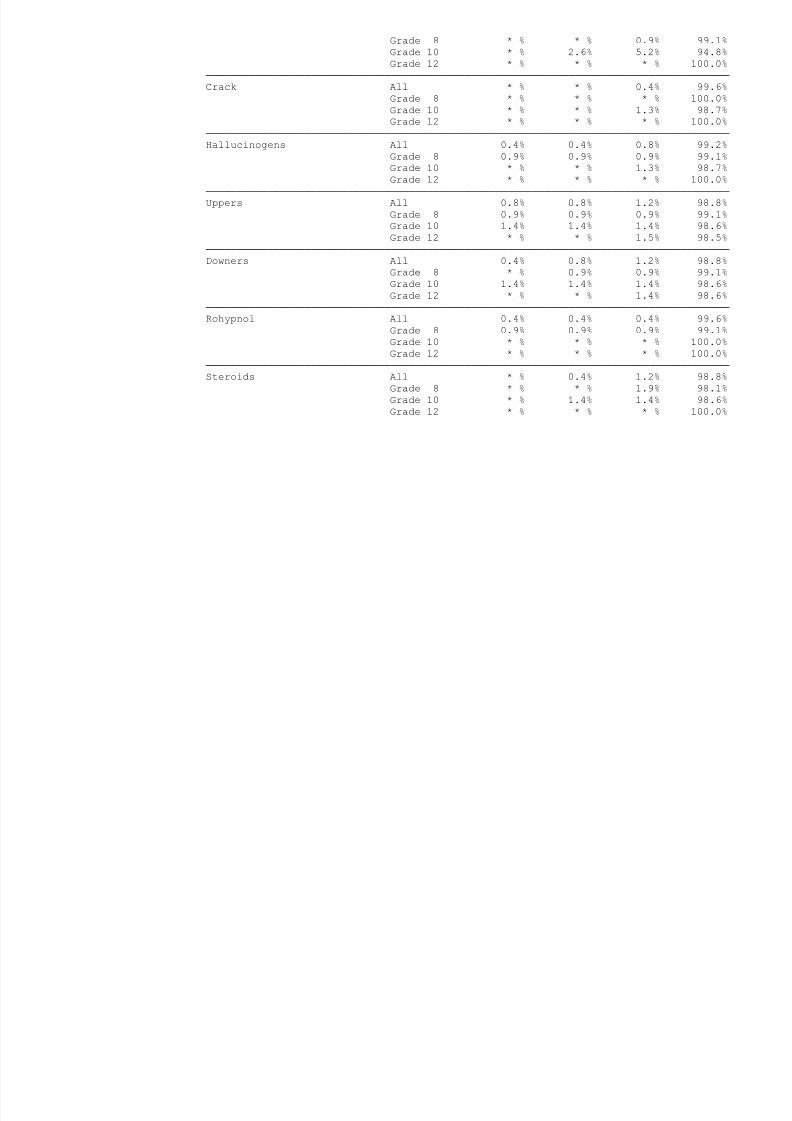
8/14/2019 BOWIE COUNTY - Texarkana ISD - 1999 Texas School Survey of Drug and Alcohol Use
http://slidepdf.com/reader/full/bowie-county-texarkana-isd-1999-texas-school-survey-of-drug-and-alcohol 67/185
Grade 10 * % 2.6% 5.2% 94.8%
Grade 12 * % * % * % 100.0%
─────────────────────────────────────────────────────────────────────────────────────
Crack All * % * % 0.4% 99.6%
Grade 8 * % * % * % 100.0%
Grade 10 * % * % 1.3% 98.7%
Grade 12 * % * % * % 100.0%
─────────────────────────────────────────────────────────────────────────────────────
Hallucinogens All 0.4% 0.4% 0.8% 99.2%Grade 8 0.9% 0.9% 0.9% 99.1%
Grade 10 * % * % 1.3% 98.7%
Grade 12 * % * % * % 100.0%
─────────────────────────────────────────────────────────────────────────────────────
Uppers All 0.8% 0.8% 1.2% 98.8%
Grade 8 0.9% 0.9% 0.9% 99.1%
Grade 10 1.4% 1.4% 1.4% 98.6%
Grade 12 * % * % 1.5% 98.5%
─────────────────────────────────────────────────────────────────────────────────────
Downers All 0.4% 0.8% 1.2% 98.8%
Grade 8 * % 0.9% 0.9% 99.1%
Grade 10 1.4% 1.4% 1.4% 98.6%Grade 12 * % * % 1.4% 98.6%
─────────────────────────────────────────────────────────────────────────────────────
Rohypnol All 0.4% 0.4% 0.4% 99.6%
Grade 8 0.9% 0.9% 0.9% 99.1%
Grade 10 * % * % * % 100.0%
Grade 12 * % * % * % 100.0%
─────────────────────────────────────────────────────────────────────────────────────
Steroids All * % 0.4% 1.2% 98.8%
Grade 8 * % * % 1.9% 98.1%
Grade 10 * % 1.4% 1.4% 98.6%
Grade 12 * % * % * % 100.0%
Texarkana
i 1999

8/14/2019 BOWIE COUNTY - Texarkana ISD - 1999 Texas School Survey of Drug and Alcohol Use
http://slidepdf.com/reader/full/bowie-county-texarkana-isd-1999-texas-school-survey-of-drug-and-alcohol 68/185
Spring 1999
Table B5 continued from previous page
Past School Ever Never
Month Year Used Used
─────────────────────────────────────────────────────────────────────────────────────
Ecstasy All * % 0.4% 1.3% 98.7%
Grade 8 * % * % * % 100.0%Grade 10 * % 1.4% 4.2% 95.8%
Grade 12 * % * % * % 100.0%
─────────────────────────────────────────────────────────────────────────────────────
Heroin All * % * % 0.4% 99.6%
Grade 8 * % * % 0.9% 99.1%
Grade 10 * % * % * % 100.0%
Grade 12 * % * % * % 100.0%
Texarkana
S i 1999
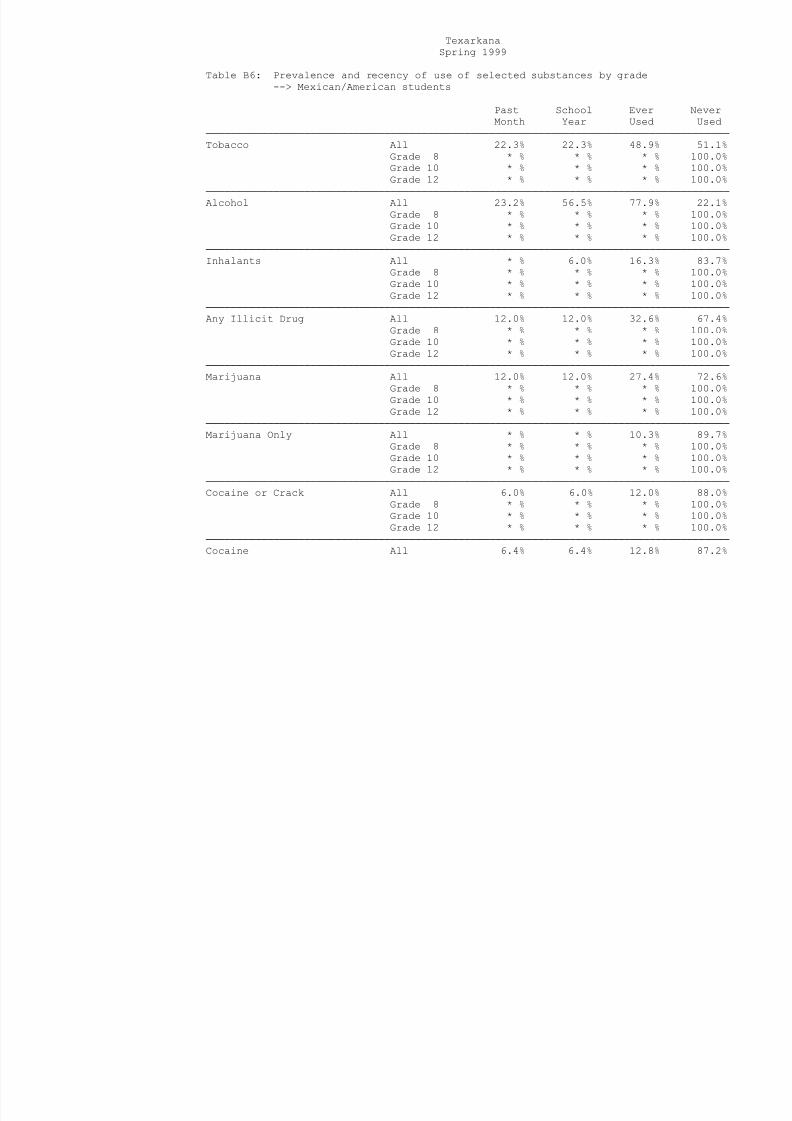
8/14/2019 BOWIE COUNTY - Texarkana ISD - 1999 Texas School Survey of Drug and Alcohol Use
http://slidepdf.com/reader/full/bowie-county-texarkana-isd-1999-texas-school-survey-of-drug-and-alcohol 69/185
Spring 1999
Table B6: Prevalence and recency of use of selected substances by grade
--> Mexican/American students
Past School Ever Never
Month Year Used Used
─────────────────────────────────────────────────────────────────────────────────────
Tobacco All 22.3% 22.3% 48.9% 51.1%Grade 8 * % * % * % 100.0%
Grade 10 * % * % * % 100.0%
Grade 12 * % * % * % 100.0%
─────────────────────────────────────────────────────────────────────────────────────
Alcohol All 23.2% 56.5% 77.9% 22.1%
Grade 8 * % * % * % 100.0%
Grade 10 * % * % * % 100.0%
Grade 12 * % * % * % 100.0%
─────────────────────────────────────────────────────────────────────────────────────
Inhalants All * % 6.0% 16.3% 83.7%
Grade 8 * % * % * % 100.0%
Grade 10 * % * % * % 100.0%Grade 12 * % * % * % 100.0%
─────────────────────────────────────────────────────────────────────────────────────
Any Illicit Drug All 12.0% 12.0% 32.6% 67.4%
Grade 8 * % * % * % 100.0%
Grade 10 * % * % * % 100.0%
Grade 12 * % * % * % 100.0%
─────────────────────────────────────────────────────────────────────────────────────
Marijuana All 12.0% 12.0% 27.4% 72.6%
Grade 8 * % * % * % 100.0%
Grade 10 * % * % * % 100.0%
Grade 12 * % * % * % 100.0%
─────────────────────────────────────────────────────────────────────────────────────
Marijuana Only All * % * % 10.3% 89.7%
Grade 8 * % * % * % 100.0%
Grade 10 * % * % * % 100.0%
Grade 12 * % * % * % 100.0%
─────────────────────────────────────────────────────────────────────────────────────
Cocaine or Crack All 6.0% 6.0% 12.0% 88.0%
Grade 8 * % * % * % 100.0%
Grade 10 * % * % * % 100.0%
Grade 12 * % * % * % 100.0%
─────────────────────────────────────────────────────────────────────────────────────
Cocaine All 6.4% 6.4% 12.8% 87.2%
Grade 8 * % * % * % 100.0%
G d 10 * % * % * % 100 0%
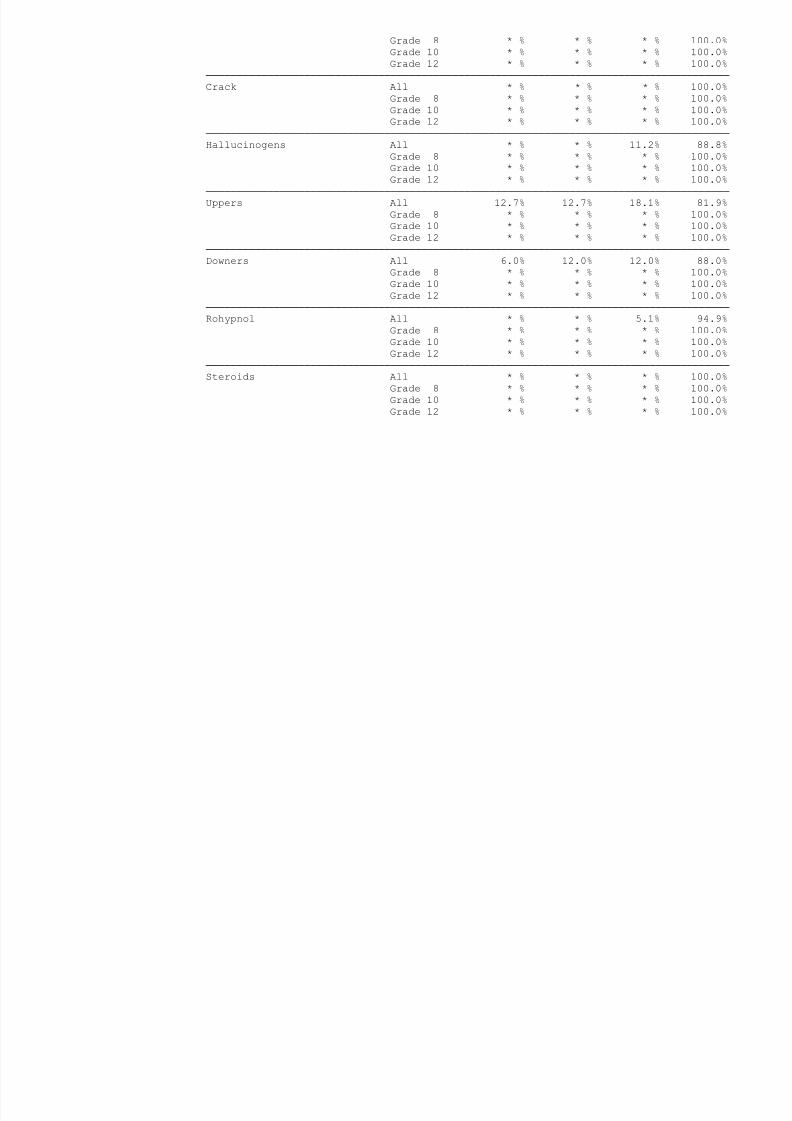
8/14/2019 BOWIE COUNTY - Texarkana ISD - 1999 Texas School Survey of Drug and Alcohol Use
http://slidepdf.com/reader/full/bowie-county-texarkana-isd-1999-texas-school-survey-of-drug-and-alcohol 70/185
Grade 10 * % * % * % 100.0%
Grade 12 * % * % * % 100.0%
─────────────────────────────────────────────────────────────────────────────────────
Crack All * % * % * % 100.0%
Grade 8 * % * % * % 100.0%
Grade 10 * % * % * % 100.0%
Grade 12 * % * % * % 100.0%
─────────────────────────────────────────────────────────────────────────────────────
Hallucinogens All * % * % 11.2% 88.8%Grade 8 * % * % * % 100.0%
Grade 10 * % * % * % 100.0%
Grade 12 * % * % * % 100.0%
─────────────────────────────────────────────────────────────────────────────────────
Uppers All 12.7% 12.7% 18.1% 81.9%
Grade 8 * % * % * % 100.0%
Grade 10 * % * % * % 100.0%
Grade 12 * % * % * % 100.0%
─────────────────────────────────────────────────────────────────────────────────────
Downers All 6.0% 12.0% 12.0% 88.0%
Grade 8 * % * % * % 100.0%
Grade 10 * % * % * % 100.0%Grade 12 * % * % * % 100.0%
─────────────────────────────────────────────────────────────────────────────────────
Rohypnol All * % * % 5.1% 94.9%
Grade 8 * % * % * % 100.0%
Grade 10 * % * % * % 100.0%
Grade 12 * % * % * % 100.0%
─────────────────────────────────────────────────────────────────────────────────────
Steroids All * % * % * % 100.0%
Grade 8 * % * % * % 100.0%
Grade 10 * % * % * % 100.0%
Grade 12 * % * % * % 100.0%
Texarkana
Spring 1999
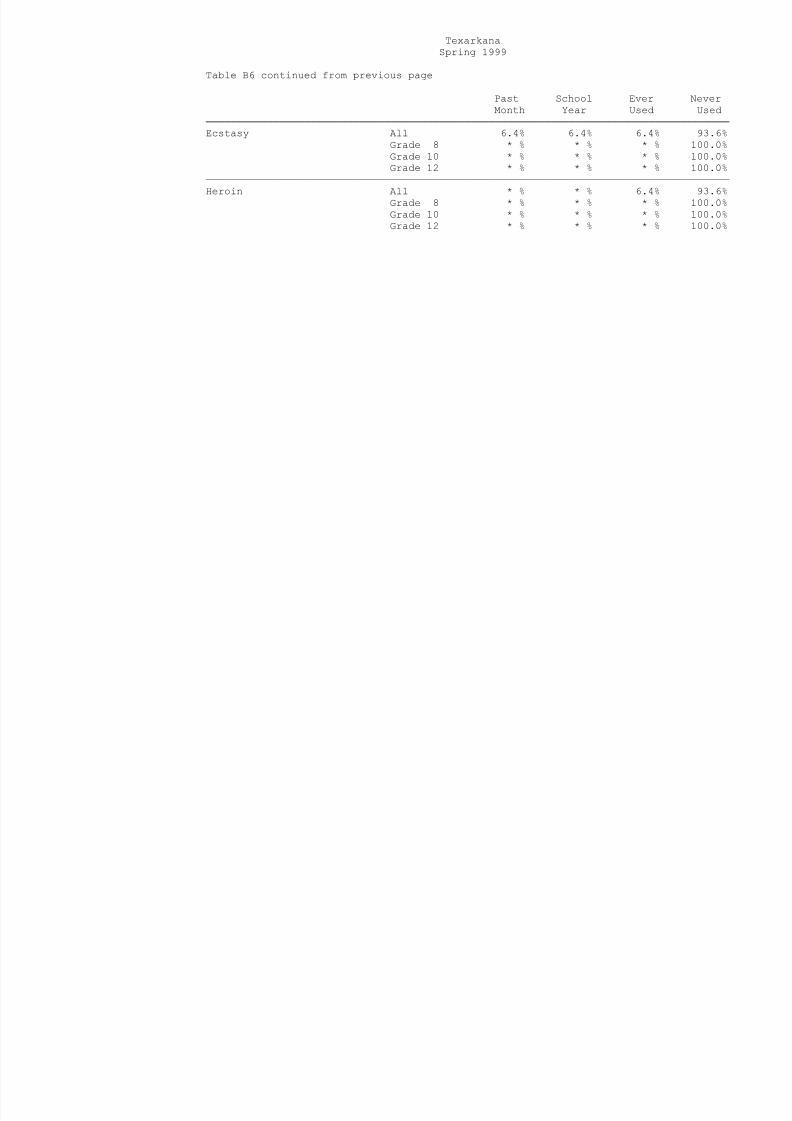
8/14/2019 BOWIE COUNTY - Texarkana ISD - 1999 Texas School Survey of Drug and Alcohol Use
http://slidepdf.com/reader/full/bowie-county-texarkana-isd-1999-texas-school-survey-of-drug-and-alcohol 71/185
Spring 1999
Table B6 continued from previous page
Past School Ever Never
Month Year Used Used
─────────────────────────────────────────────────────────────────────────────────────
Ecstasy All 6.4% 6.4% 6.4% 93.6%
Grade 8 * % * % * % 100.0%Grade 10 * % * % * % 100.0%
Grade 12 * % * % * % 100.0%
─────────────────────────────────────────────────────────────────────────────────────
Heroin All * % * % 6.4% 93.6%
Grade 8 * % * % * % 100.0%
Grade 10 * % * % * % 100.0%
Grade 12 * % * % * % 100.0%
Texarkana
Spring 1999
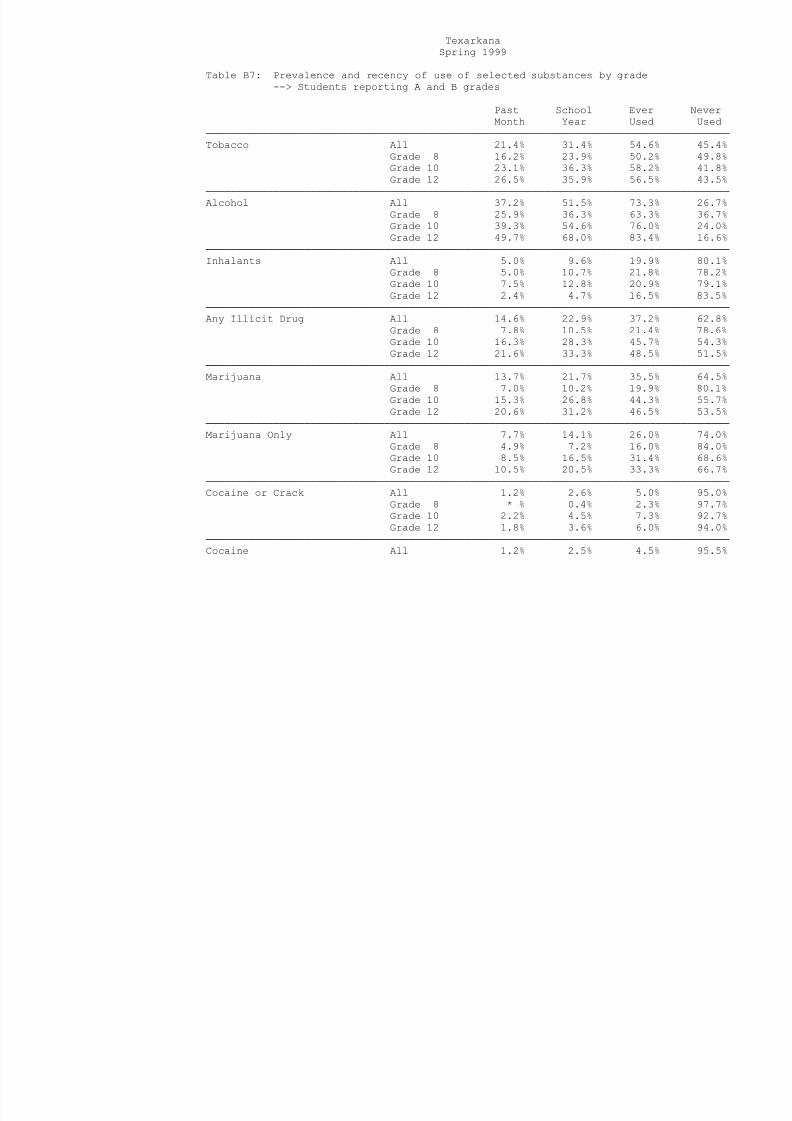
8/14/2019 BOWIE COUNTY - Texarkana ISD - 1999 Texas School Survey of Drug and Alcohol Use
http://slidepdf.com/reader/full/bowie-county-texarkana-isd-1999-texas-school-survey-of-drug-and-alcohol 72/185
Spring 1999
Table B7: Prevalence and recency of use of selected substances by grade
--> Students reporting A and B grades
Past School Ever Never
Month Year Used Used
─────────────────────────────────────────────────────────────────────────────────────
Tobacco All 21.4% 31.4% 54.6% 45.4%Grade 8 16.2% 23.9% 50.2% 49.8%
Grade 10 23.1% 36.3% 58.2% 41.8%
Grade 12 26.5% 35.9% 56.5% 43.5%
─────────────────────────────────────────────────────────────────────────────────────
Alcohol All 37.2% 51.5% 73.3% 26.7%
Grade 8 25.9% 36.3% 63.3% 36.7%
Grade 10 39.3% 54.6% 76.0% 24.0%
Grade 12 49.7% 68.0% 83.4% 16.6%
─────────────────────────────────────────────────────────────────────────────────────
Inhalants All 5.0% 9.6% 19.9% 80.1%
Grade 8 5.0% 10.7% 21.8% 78.2%
Grade 10 7.5% 12.8% 20.9% 79.1%Grade 12 2.4% 4.7% 16.5% 83.5%
─────────────────────────────────────────────────────────────────────────────────────
Any Illicit Drug All 14.6% 22.9% 37.2% 62.8%
Grade 8 7.8% 10.5% 21.4% 78.6%
Grade 10 16.3% 28.3% 45.7% 54.3%
Grade 12 21.6% 33.3% 48.5% 51.5%
─────────────────────────────────────────────────────────────────────────────────────
Marijuana All 13.7% 21.7% 35.5% 64.5%
Grade 8 7.0% 10.2% 19.9% 80.1%
Grade 10 15.3% 26.8% 44.3% 55.7%
Grade 12 20.6% 31.2% 46.5% 53.5%
─────────────────────────────────────────────────────────────────────────────────────
Marijuana Only All 7.7% 14.1% 26.0% 74.0%
Grade 8 4.9% 7.2% 16.0% 84.0%
Grade 10 8.5% 16.5% 31.4% 68.6%
Grade 12 10.5% 20.5% 33.3% 66.7%
─────────────────────────────────────────────────────────────────────────────────────
Cocaine or Crack All 1.2% 2.6% 5.0% 95.0%
Grade 8 * % 0.4% 2.3% 97.7%
Grade 10 2.2% 4.5% 7.3% 92.7%
Grade 12 1.8% 3.6% 6.0% 94.0%
─────────────────────────────────────────────────────────────────────────────────────
Cocaine All 1.2% 2.5% 4.5% 95.5%
Grade 8 * % 0.4% 2.0% 98.0%
Grade 10 2 2% 3 9% 6 7% 93 3%
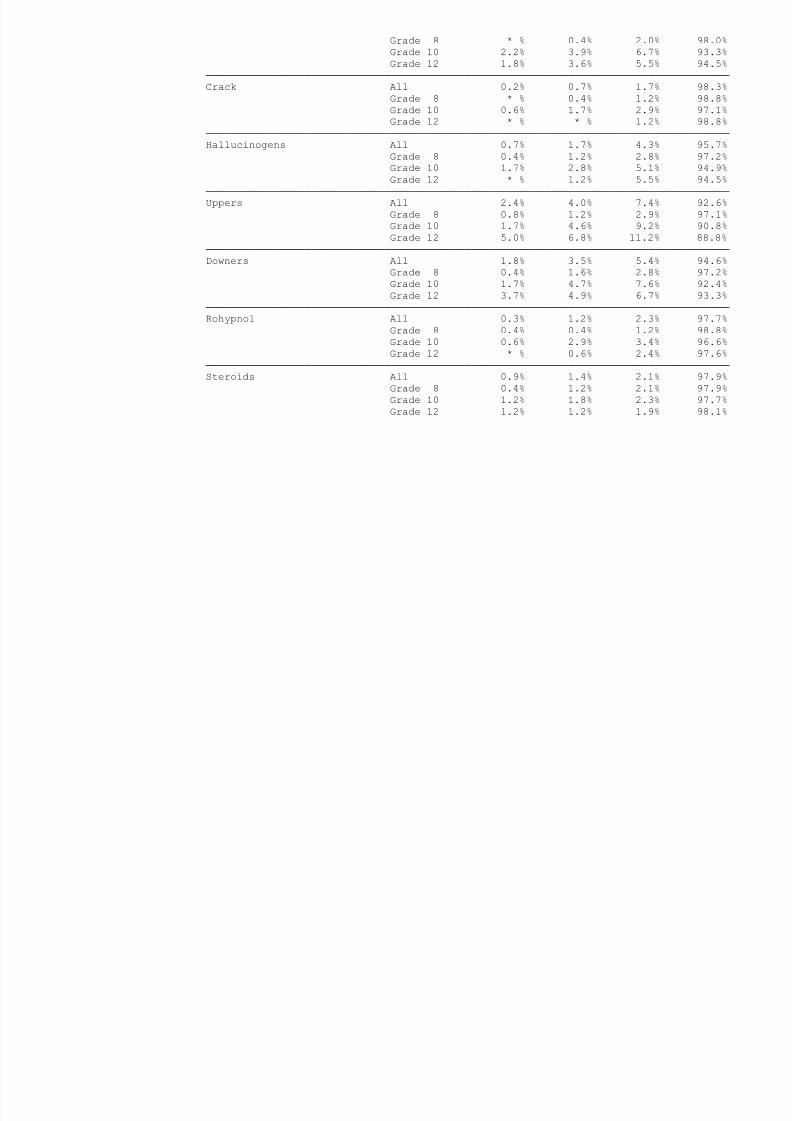
8/14/2019 BOWIE COUNTY - Texarkana ISD - 1999 Texas School Survey of Drug and Alcohol Use
http://slidepdf.com/reader/full/bowie-county-texarkana-isd-1999-texas-school-survey-of-drug-and-alcohol 73/185
Grade 10 2.2% 3.9% 6.7% 93.3%
Grade 12 1.8% 3.6% 5.5% 94.5%
─────────────────────────────────────────────────────────────────────────────────────
Crack All 0.2% 0.7% 1.7% 98.3%
Grade 8 * % 0.4% 1.2% 98.8%
Grade 10 0.6% 1.7% 2.9% 97.1%
Grade 12 * % * % 1.2% 98.8%
─────────────────────────────────────────────────────────────────────────────────────
Hallucinogens All 0.7% 1.7% 4.3% 95.7%Grade 8 0.4% 1.2% 2.8% 97.2%
Grade 10 1.7% 2.8% 5.1% 94.9%
Grade 12 * % 1.2% 5.5% 94.5%
─────────────────────────────────────────────────────────────────────────────────────
Uppers All 2.4% 4.0% 7.4% 92.6%
Grade 8 0.8% 1.2% 2.9% 97.1%
Grade 10 1.7% 4.6% 9.2% 90.8%
Grade 12 5.0% 6.8% 11.2% 88.8%
─────────────────────────────────────────────────────────────────────────────────────
Downers All 1.8% 3.5% 5.4% 94.6%
Grade 8 0.4% 1.6% 2.8% 97.2%
Grade 10 1.7% 4.7% 7.6% 92.4%Grade 12 3.7% 4.9% 6.7% 93.3%
─────────────────────────────────────────────────────────────────────────────────────
Rohypnol All 0.3% 1.2% 2.3% 97.7%
Grade 8 0.4% 0.4% 1.2% 98.8%
Grade 10 0.6% 2.9% 3.4% 96.6%
Grade 12 * % 0.6% 2.4% 97.6%
─────────────────────────────────────────────────────────────────────────────────────
Steroids All 0.9% 1.4% 2.1% 97.9%
Grade 8 0.4% 1.2% 2.1% 97.9%
Grade 10 1.2% 1.8% 2.3% 97.7%
Grade 12 1.2% 1.2% 1.9% 98.1%
Texarkana
Spring 1999

8/14/2019 BOWIE COUNTY - Texarkana ISD - 1999 Texas School Survey of Drug and Alcohol Use
http://slidepdf.com/reader/full/bowie-county-texarkana-isd-1999-texas-school-survey-of-drug-and-alcohol 74/185
Spring 1999
Table B7 continued from previous page
Past School Ever Never
Month Year Used Used
─────────────────────────────────────────────────────────────────────────────────────
Ecstasy All 0.2% 1.2% 1.8% 98.2%
Grade 8 * % 0.8% 1.2% 98.8%Grade 10 0.6% 2.4% 3.6% 96.4%
Grade 12 * % 0.6% 0.6% 99.4%
─────────────────────────────────────────────────────────────────────────────────────
Heroin All 0.4% 0.7% 1.8% 98.2%
Grade 8 * % * % 0.8% 99.2%
Grade 10 0.6% 1.8% 2.3% 97.7%
Grade 12 0.6% 0.6% 2.5% 97.5%
Texarkana
Spring 1999

8/14/2019 BOWIE COUNTY - Texarkana ISD - 1999 Texas School Survey of Drug and Alcohol Use
http://slidepdf.com/reader/full/bowie-county-texarkana-isd-1999-texas-school-survey-of-drug-and-alcohol 75/185
Spring 1999
Table B8: Prevalence and recency of use of selected substances by grade
--> Students reporting C, D, and F grades
Past School Ever Never
Month Year Used Used
─────────────────────────────────────────────────────────────────────────────────────
Tobacco All 36.1% 43.5% 66.3% 33.7%Grade 8 30.4% 37.5% 58.9% 41.1%
Grade 10 39.5% 47.4% 71.1% 28.9%
Grade 12 41.4% 48.3% 72.4% 27.6%
─────────────────────────────────────────────────────────────────────────────────────
Alcohol All 46.3% 59.8% 79.3% 20.7%
Grade 8 40.4% 56.1% 73.7% 26.3%
Grade 10 55.3% 68.4% 86.8% 13.2%
Grade 12 44.8% 55.2% 79.3% 20.7%
─────────────────────────────────────────────────────────────────────────────────────
Inhalants All 12.5% 17.3% 25.5% 74.5%
Grade 8 17.9% 23.2% 28.6% 71.4%
Grade 10 13.2% 21.1% 34.2% 65.8%Grade 12 3.3% 3.3% 10.0% 90.0%
─────────────────────────────────────────────────────────────────────────────────────
Any Illicit Drug All 27.6% 33.6% 49.3% 50.7%
Grade 8 18.2% 20.0% 32.7% 67.3%
Grade 10 36.8% 47.4% 65.8% 34.2%
Grade 12 31.0% 37.9% 55.2% 44.8%
─────────────────────────────────────────────────────────────────────────────────────
Marijuana All 26.9% 32.1% 47.2% 52.8%
Grade 8 18.5% 20.4% 31.5% 68.5%
Grade 10 34.2% 42.1% 60.5% 39.5%
Grade 12 31.0% 37.9% 55.2% 44.8%
─────────────────────────────────────────────────────────────────────────────────────
Marijuana Only All 16.2% 19.5% 29.3% 70.7%
Grade 8 14.0% 15.8% 21.1% 78.9%
Grade 10 13.2% 18.4% 31.6% 68.4%
Grade 12 23.3% 26.7% 40.0% 60.0%
─────────────────────────────────────────────────────────────────────────────────────
Cocaine or Crack All 2.6% 7.0% 13.0% 87.0%
Grade 8 1.9% 1.9% 5.8% 94.2%
Grade 10 5.4% 16.2% 27.0% 73.0%
Grade 12 * % 3.4% 6.9% 93.1%
─────────────────────────────────────────────────────────────────────────────────────
Cocaine All 1.8% 6.2% 11.6% 88.4%
Grade 8 * % 2.0% 3.9% 96.1%
Grade 10 5.4% 13.5% 24.3% 75.7%

8/14/2019 BOWIE COUNTY - Texarkana ISD - 1999 Texas School Survey of Drug and Alcohol Use
http://slidepdf.com/reader/full/bowie-county-texarkana-isd-1999-texas-school-survey-of-drug-and-alcohol 76/185
Grade 10 5.4% 13.5% 24.3% 75.7%
Grade 12 * % 3.6% 7.1% 92.9%
─────────────────────────────────────────────────────────────────────────────────────
Crack All 0.8% 2.6% 3.4% 96.6%
Grade 8 2.0% 2.0% 3.9% 96.1%
Grade 10 * % 5.7% 5.7% 94.3%
Grade 12 * % * % * % 100.0%
─────────────────────────────────────────────────────────────────────────────────────
Hallucinogens All 5.2% 5.2% 6.1% 93.9%Grade 8 3.8% 3.8% 3.8% 96.2%
Grade 10 8.1% 8.1% 8.1% 91.9%
Grade 12 3.6% 3.6% 7.1% 92.9%
─────────────────────────────────────────────────────────────────────────────────────
Uppers All 2.7% 6.1% 11.3% 88.7%
Grade 8 * % 1.9% 5.7% 94.3%
Grade 10 5.4% 13.5% 21.6% 78.4%
Grade 12 3.6% 3.6% 7.1% 92.9%
─────────────────────────────────────────────────────────────────────────────────────
Downers All 3.6% 5.5% 9.7% 90.3%
Grade 8 * % * % 5.8% 94.2%
Grade 10 11.1% 13.9% 16.7% 83.3%Grade 12 * % 3.6% 7.1% 92.9%
─────────────────────────────────────────────────────────────────────────────────────
Rohypnol All 1.7% 1.7% 2.5% 97.5%
Grade 8 2.0% 2.0% 3.9% 96.1%
Grade 10 2.9% 2.9% 2.9% 97.1%
Grade 12 * % * % * % 100.0%
─────────────────────────────────────────────────────────────────────────────────────
Steroids All 0.9% 2.7% 7.0% 93.0%
Grade 8 * % 1.9% 7.5% 92.5%
Grade 10 3.0% 3.0% 9.1% 90.9%
Grade 12 * % 3.6% 3.6% 96.4%
Texarkana
Spring 1999

8/14/2019 BOWIE COUNTY - Texarkana ISD - 1999 Texas School Survey of Drug and Alcohol Use
http://slidepdf.com/reader/full/bowie-county-texarkana-isd-1999-texas-school-survey-of-drug-and-alcohol 77/185
p g
Table B8 continued from previous page
Past School Ever Never
Month Year Used Used
─────────────────────────────────────────────────────────────────────────────────────
Ecstasy All 1.8% 3.5% 8.0% 92.0%
Grade 8 1.9% 3.8% 5.8% 94.2%Grade 10 * % 2.8% 13.9% 86.1%
Grade 12 3.8% 3.8% 3.8% 96.2%
─────────────────────────────────────────────────────────────────────────────────────
Heroin All 0.8% 1.8% 2.7% 97.3%
Grade 8 2.0% 2.0% 2.0% 98.0%
Grade 10 * % 2.8% 5.6% 94.4%
Grade 12 * % * % * % 100.0%
Texarkana
Spring 1999

8/14/2019 BOWIE COUNTY - Texarkana ISD - 1999 Texas School Survey of Drug and Alcohol Use
http://slidepdf.com/reader/full/bowie-county-texarkana-isd-1999-texas-school-survey-of-drug-and-alcohol 78/185
p g
Table B9: Prevalence and recency of use of selected substances by grade
--> Students living with two parents
Past School Ever Never
Month Year Used Used
─────────────────────────────────────────────────────────────────────────────────────
Tobacco All 19.3% 25.7% 46.3% 53.7%Grade 8 12.7% 19.1% 40.1% 59.9%
Grade 10 21.6% 29.4% 49.0% 51.0%
Grade 12 26.0% 31.0% 52.0% 48.0%
─────────────────────────────────────────────────────────────────────────────────────
Alcohol All 35.2% 47.5% 66.9% 33.1%
Grade 8 24.2% 32.5% 57.3% 42.7%
Grade 10 36.9% 49.5% 68.0% 32.0%
Grade 12 48.5% 65.7% 78.8% 21.2%
─────────────────────────────────────────────────────────────────────────────────────
Inhalants All 5.5% 9.3% 18.7% 81.3%
Grade 8 5.0% 8.8% 18.2% 81.8%
Grade 10 8.6% 14.3% 21.9% 78.1%Grade 12 3.0% 5.0% 16.0% 84.0%
─────────────────────────────────────────────────────────────────────────────────────
Any Illicit Drug All 11.2% 17.8% 28.9% 71.1%
Grade 8 5.8% 7.7% 14.7% 85.3%
Grade 10 12.5% 20.2% 34.6% 65.4%
Grade 12 17.0% 29.0% 42.0% 58.0%
─────────────────────────────────────────────────────────────────────────────────────
Marijuana All 10.1% 16.5% 27.1% 72.9%
Grade 8 5.1% 7.7% 13.5% 86.5%
Grade 10 10.7% 18.4% 33.0% 67.0%
Grade 12 16.2% 26.3% 39.4% 60.6%
─────────────────────────────────────────────────────────────────────────────────────
Marijuana Only All 5.3% 10.5% 18.7% 81.3%
Grade 8 3.8% 5.7% 10.1% 89.9%
Grade 10 5.7% 10.5% 21.9% 78.1%
Grade 12 7.0% 17.0% 27.0% 73.0%
─────────────────────────────────────────────────────────────────────────────────────
Cocaine or Crack All 1.5% 3.0% 5.3% 94.7%
Grade 8 * % 0.6% 1.9% 98.1%
Grade 10 3.0% 5.0% 7.0% 93.0%
Grade 12 2.0% 4.0% 8.1% 91.9%
─────────────────────────────────────────────────────────────────────────────────────
Cocaine All 1.5% 2.4% 4.7% 95.3%
Grade 8 * % 0.6% 1.9% 98.1%
Grade 10 3.0% 3.0% 6.0% 94.0%

8/14/2019 BOWIE COUNTY - Texarkana ISD - 1999 Texas School Survey of Drug and Alcohol Use
http://slidepdf.com/reader/full/bowie-county-texarkana-isd-1999-texas-school-survey-of-drug-and-alcohol 79/185
Grade 12 2.0% 4.1% 7.1% 92.9%
─────────────────────────────────────────────────────────────────────────────────────
Crack All 0.3% 1.5% 2.1% 97.9%
Grade 8 * % 0.7% 0.7% 99.3%
Grade 10 1.0% 4.1% 4.1% 95.9%
Grade 12 * % * % 2.1% 97.9%
─────────────────────────────────────────────────────────────────────────────────────
Hallucinogens All 1.2% 1.8% 3.2% 96.8%Grade 8 0.6% 0.6% 1.9% 98.1%
Grade 10 3.0% 3.0% 3.0% 97.0%
Grade 12 * % 2.1% 5.2% 94.8%
─────────────────────────────────────────────────────────────────────────────────────
Uppers All 2.5% 4.4% 6.8% 93.2%
Grade 8 0.7% 0.7% 2.0% 98.0%
Grade 10 2.1% 5.2% 9.4% 90.6%
Grade 12 5.3% 8.4% 10.5% 89.5%
─────────────────────────────────────────────────────────────────────────────────────
Downers All 2.8% 3.7% 5.1% 94.9%
Grade 8 0.7% 0.7% 2.0% 98.0%
Grade 10 4.2% 6.3% 8.4% 91.6%Grade 12 4.2% 5.2% 6.2% 93.8%
─────────────────────────────────────────────────────────────────────────────────────
Rohypnol All 0.3% 1.2% 1.8% 98.2%
Grade 8 * % * % 1.4% 98.6%
Grade 10 1.0% 3.0% 3.0% 97.0%
Grade 12 * % 1.0% 1.0% 99.0%
─────────────────────────────────────────────────────────────────────────────────────
Steroids All 1.2% 1.5% 2.3% 97.7%
Grade 8 0.7% 1.3% 2.0% 98.0%
Grade 10 2.1% 2.1% 4.2% 95.8%
Grade 12 1.0% 1.0% 1.0% 99.0%
Texarkana
Spring 1999

8/14/2019 BOWIE COUNTY - Texarkana ISD - 1999 Texas School Survey of Drug and Alcohol Use
http://slidepdf.com/reader/full/bowie-county-texarkana-isd-1999-texas-school-survey-of-drug-and-alcohol 80/185
Table B9 continued from previous page
Past School Ever Never
Month Year Used Used
─────────────────────────────────────────────────────────────────────────────────────
Ecstasy All 0.3% 1.2% 2.1% 97.9%
Grade 8 0.7% 1.3% 1.3% 98.7%Grade 10 * % 1.0% 4.1% 95.9%
Grade 12 * % 1.0% 1.0% 99.0%
─────────────────────────────────────────────────────────────────────────────────────
Heroin All 0.6% 0.6% 1.9% 98.1%
Grade 8 * % * % * % 100.0%
Grade 10 1.0% 1.0% 2.1% 97.9%
Grade 12 1.0% 1.0% 4.2% 95.8%
Texarkana
Spring 1999

8/14/2019 BOWIE COUNTY - Texarkana ISD - 1999 Texas School Survey of Drug and Alcohol Use
http://slidepdf.com/reader/full/bowie-county-texarkana-isd-1999-texas-school-survey-of-drug-and-alcohol 81/185
Table B10: Prevalence and recency of use of selected substances by grade
--> Students not living with two parents
Past School Ever Never
Month Year Used Used
─────────────────────────────────────────────────────────────────────────────────────
Tobacco All 28.2% 40.7% 65.8% 34.2%Grade 8 24.4% 33.1% 62.5% 37.5%
Grade 10 30.2% 46.6% 70.7% 29.3%
Grade 12 31.3% 44.4% 64.6% 35.4%
─────────────────────────────────────────────────────────────────────────────────────
Alcohol All 41.8% 57.8% 81.1% 18.9%
Grade 8 32.3% 46.6% 72.0% 28.0%
Grade 10 46.6% 63.8% 87.1% 12.9%
Grade 12 49.5% 66.7% 86.9% 13.1%
─────────────────────────────────────────────────────────────────────────────────────
Inhalants All 7.0% 12.4% 23.0% 77.0%
Grade 8 9.3% 16.8% 27.3% 72.7%
Grade 10 8.5% 14.4% 24.6% 75.4%Grade 12 2.0% 4.0% 15.2% 84.8%
─────────────────────────────────────────────────────────────────────────────────────
Any Illicit Drug All 21.9% 31.1% 48.4% 51.6%
Grade 8 13.3% 16.5% 31.6% 68.4%
Grade 10 26.7% 42.2% 62.1% 37.9%
Grade 12 28.3% 38.4% 55.6% 44.4%
─────────────────────────────────────────────────────────────────────────────────────
Marijuana All 21.2% 29.9% 46.7% 53.3%
Grade 8 12.8% 16.0% 30.1% 69.9%
Grade 10 25.9% 39.7% 59.5% 40.5%
Grade 12 27.3% 37.4% 54.5% 45.5%
─────────────────────────────────────────────────────────────────────────────────────Marijuana Only All 12.5% 19.1% 33.4% 66.6%
Grade 8 9.2% 11.7% 23.3% 76.7%
Grade 10 12.7% 22.9% 39.8% 60.2%
Grade 12 17.0% 25.0% 40.0% 60.0%
─────────────────────────────────────────────────────────────────────────────────────
Cocaine or Crack All 1.4% 3.7% 7.2% 92.8%
Grade 8 0.6% 0.6% 3.9% 96.1%
Grade 10 2.6% 7.8% 13.9% 86.1%
Grade 12 1.0% 3.1% 4.1% 95.9%
─────────────────────────────────────────────────────────────────────────────────────
Cocaine All 1.2% 3.8% 6.5% 93.5%
Grade 8 * % 0.7% 2.6% 97.4%
Grade 10 2.6% 7.8% 13.0% 87.0%
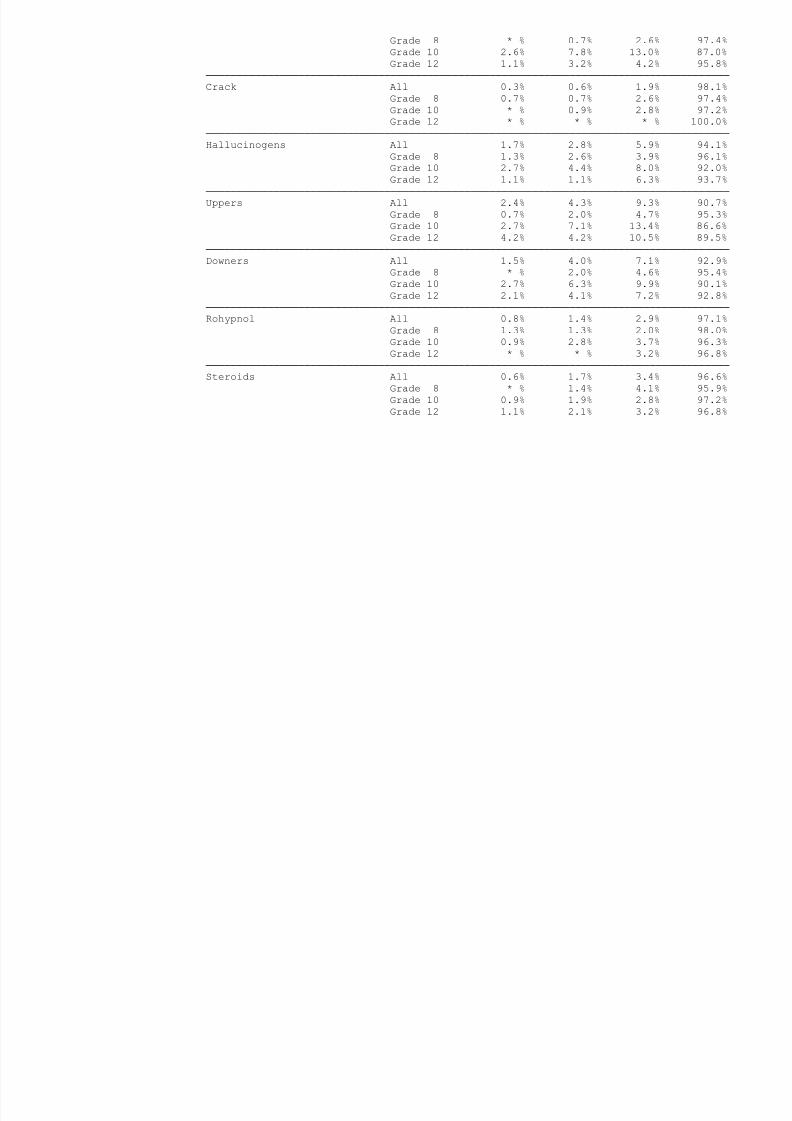
8/14/2019 BOWIE COUNTY - Texarkana ISD - 1999 Texas School Survey of Drug and Alcohol Use
http://slidepdf.com/reader/full/bowie-county-texarkana-isd-1999-texas-school-survey-of-drug-and-alcohol 82/185
Grade 12 1.1% 3.2% 4.2% 95.8%
─────────────────────────────────────────────────────────────────────────────────────
Crack All 0.3% 0.6% 1.9% 98.1%
Grade 8 0.7% 0.7% 2.6% 97.4%
Grade 10 * % 0.9% 2.8% 97.2%
Grade 12 * % * % * % 100.0%
─────────────────────────────────────────────────────────────────────────────────────
Hallucinogens All 1.7% 2.8% 5.9% 94.1%Grade 8 1.3% 2.6% 3.9% 96.1%
Grade 10 2.7% 4.4% 8.0% 92.0%
Grade 12 1.1% 1.1% 6.3% 93.7%
─────────────────────────────────────────────────────────────────────────────────────
Uppers All 2.4% 4.3% 9.3% 90.7%
Grade 8 0.7% 2.0% 4.7% 95.3%
Grade 10 2.7% 7.1% 13.4% 86.6%
Grade 12 4.2% 4.2% 10.5% 89.5%
─────────────────────────────────────────────────────────────────────────────────────
Downers All 1.5% 4.0% 7.1% 92.9%
Grade 8 * % 2.0% 4.6% 95.4%
Grade 10 2.7% 6.3% 9.9% 90.1%Grade 12 2.1% 4.1% 7.2% 92.8%
─────────────────────────────────────────────────────────────────────────────────────
Rohypnol All 0.8% 1.4% 2.9% 97.1%
Grade 8 1.3% 1.3% 2.0% 98.0%
Grade 10 0.9% 2.8% 3.7% 96.3%
Grade 12 * % * % 3.2% 96.8%
─────────────────────────────────────────────────────────────────────────────────────
Steroids All 0.6% 1.7% 3.4% 96.6%
Grade 8 * % 1.4% 4.1% 95.9%
Grade 10 0.9% 1.9% 2.8% 97.2%
Grade 12 1.1% 2.1% 3.2% 96.8%
Texarkana
Spring 1999

8/14/2019 BOWIE COUNTY - Texarkana ISD - 1999 Texas School Survey of Drug and Alcohol Use
http://slidepdf.com/reader/full/bowie-county-texarkana-isd-1999-texas-school-survey-of-drug-and-alcohol 83/185
Table B10 continued from previous page
Past School Ever Never
Month Year Used Used
─────────────────────────────────────────────────────────────────────────────────────
Ecstasy All 0.6% 2.1% 3.5% 96.5%
Grade 8 * % 1.3% 2.7% 97.3%Grade 10 1.0% 3.9% 6.8% 93.2%
Grade 12 1.1% 1.1% 1.1% 98.9%
─────────────────────────────────────────────────────────────────────────────────────
Heroin All 0.3% 1.2% 2.0% 98.0%
Grade 8 0.7% 0.7% 2.0% 98.0%
Grade 10 * % 2.8% 3.7% 96.3%
Grade 12 * % * % * % 100.0%
Texarkana
Spring 1999

8/14/2019 BOWIE COUNTY - Texarkana ISD - 1999 Texas School Survey of Drug and Alcohol Use
http://slidepdf.com/reader/full/bowie-county-texarkana-isd-1999-texas-school-survey-of-drug-and-alcohol 84/185
Table B11: Prevalence and recency of use of selected substances by grade
--> Students who would seek help from adults for substance abuse problems
Past School Ever Never
Month Year Used Used
─────────────────────────────────────────────────────────────────────────────────────
Tobacco All 21.8% 30.7% 53.2% 46.8%Grade 8 15.7% 23.7% 48.6% 51.4%
Grade 10 24.6% 36.4% 58.8% 41.2%
Grade 12 26.8% 33.8% 52.9% 47.1%
─────────────────────────────────────────────────────────────────────────────────────
Alcohol All 37.4% 50.6% 72.8% 27.2%
Grade 8 26.8% 37.6% 64.0% 36.0%
Grade 10 43.5% 55.4% 75.8% 24.2%
Grade 12 44.9% 62.8% 81.4% 18.6%
─────────────────────────────────────────────────────────────────────────────────────
Inhalants All 6.3% 10.9% 20.3% 79.7%
Grade 8 6.3% 11.9% 20.6% 79.4%
Grade 10 9.5% 14.7% 24.2% 75.8%Grade 12 2.5% 5.1% 15.3% 84.7%
─────────────────────────────────────────────────────────────────────────────────────
Any Illicit Drug All 14.9% 21.8% 37.5% 62.5%
Grade 8 7.2% 10.4% 22.4% 77.6%
Grade 10 20.9% 29.9% 48.7% 51.3%
Grade 12 18.5% 28.0% 45.2% 54.8%
─────────────────────────────────────────────────────────────────────────────────────
Marijuana All 13.9% 20.2% 35.4% 64.6%
Grade 8 6.8% 10.0% 20.9% 79.1%
Grade 10 19.3% 27.3% 46.0% 54.0%
Grade 12 17.3% 25.6% 42.9% 57.1%
─────────────────────────────────────────────────────────────────────────────────────Marijuana Only All 7.8% 12.7% 25.6% 74.4%
Grade 8 5.5% 8.3% 17.4% 82.6%
Grade 10 10.0% 15.3% 31.6% 68.4%
Grade 12 8.2% 15.8% 29.7% 70.3%
─────────────────────────────────────────────────────────────────────────────────────
Cocaine or Crack All 1.6% 3.8% 6.6% 93.4%
Grade 8 0.4% 0.4% 2.0% 98.0%
Grade 10 3.3% 7.7% 11.5% 88.5%
Grade 12 1.3% 3.9% 7.2% 92.8%
─────────────────────────────────────────────────────────────────────────────────────
Cocaine All 1.5% 3.5% 5.9% 94.1%
Grade 8 * % 0.4% 1.6% 98.4%
Grade 10 3.3% 6.6% 10.4% 89.6%
G d 12 1 3% 4 0% 6 7% 93 3%

8/14/2019 BOWIE COUNTY - Texarkana ISD - 1999 Texas School Survey of Drug and Alcohol Use
http://slidepdf.com/reader/full/bowie-county-texarkana-isd-1999-texas-school-survey-of-drug-and-alcohol 85/185
Grade 12 1.3% 4.0% 6.7% 93.3%
─────────────────────────────────────────────────────────────────────────────────────
Crack All 0.3% 1.1% 2.0% 98.0%
Grade 8 0.4% 0.4% 0.8% 99.2%
Grade 10 0.6% 2.9% 4.0% 96.0%
Grade 12 * % * % 1.3% 98.7%
─────────────────────────────────────────────────────────────────────────────────────
Hallucinogens All 1.6% 2.3% 4.5% 95.5%Grade 8 0.8% 0.8% 1.6% 98.4%
Grade 10 3.3% 4.4% 6.7% 93.3%
Grade 12 0.7% 2.0% 6.0% 94.0%
─────────────────────────────────────────────────────────────────────────────────────
Uppers All 2.6% 4.7% 7.8% 92.2%
Grade 8 0.4% 0.9% 2.6% 97.4%
Grade 10 2.8% 6.7% 11.2% 88.8%
Grade 12 5.4% 7.4% 10.8% 89.2%
─────────────────────────────────────────────────────────────────────────────────────
Downers All 2.2% 3.7% 5.8% 94.2%
Grade 8 * % 0.4% 2.5% 97.5%
Grade 10 4.0% 6.3% 8.5% 91.5%Grade 12 3.3% 5.3% 7.3% 92.7%
─────────────────────────────────────────────────────────────────────────────────────
Rohypnol All 0.7% 1.4% 2.5% 97.5%
Grade 8 0.8% 0.8% 1.7% 98.3%
Grade 10 1.1% 2.8% 3.4% 96.6%
Grade 12 * % 0.7% 2.7% 97.3%
─────────────────────────────────────────────────────────────────────────────────────
Steroids All 1.1% 1.7% 2.7% 97.3%
Grade 8 0.4% 0.8% 2.1% 97.9%
Grade 10 1.7% 2.3% 4.0% 96.0%
Grade 12 1.4% 2.0% 2.0% 98.0%
Texarkana
Spring 1999

8/14/2019 BOWIE COUNTY - Texarkana ISD - 1999 Texas School Survey of Drug and Alcohol Use
http://slidepdf.com/reader/full/bowie-county-texarkana-isd-1999-texas-school-survey-of-drug-and-alcohol 86/185
Table B11 continued from previous page
Past School Ever Never
Month Year Used Used
─────────────────────────────────────────────────────────────────────────────────────
Ecstasy All 0.4% 1.3% 2.6% 97.4%
Grade 8 * % 0.4% 0.8% 99.2%Grade 10 0.6% 2.3% 5.8% 94.2%
Grade 12 0.7% 1.4% 1.4% 98.6%
─────────────────────────────────────────────────────────────────────────────────────
Heroin All 0.5% 1.1% 2.2% 97.8%
Grade 8 0.4% 0.4% 0.8% 99.2%
Grade 10 0.6% 2.3% 3.4% 96.6%
Grade 12 0.7% 0.7% 2.8% 97.2%
Texarkana
Spring 1999

8/14/2019 BOWIE COUNTY - Texarkana ISD - 1999 Texas School Survey of Drug and Alcohol Use
http://slidepdf.com/reader/full/bowie-county-texarkana-isd-1999-texas-school-survey-of-drug-and-alcohol 87/185
Table B12: Prevalence and recency of use of selected substances by grade
--> Students who wouldn't seek help from adults for substance abuse problems
Past School Ever Never
Month Year Used Used
─────────────────────────────────────────────────────────────────────────────────────
Tobacco All 28.4% 42.9% 68.4% 31.6%
Grade 8 26.3% 34.2% 60.5% 39.5%
Grade 10 28.6% 46.4% 64.3% 35.7%
Grade 12 30.0% 47.5% 77.5% 22.5%
─────────────────────────────────────────────────────────────────────────────────────
Alcohol All 42.5% 63.3% 81.8% 18.2%
Grade 8 36.8% 50.0% 71.1% 28.9%
Grade 10 27.6% 65.5% 86.2% 13.8%
Grade 12 57.5% 72.5% 87.5% 12.5%
─────────────────────────────────────────────────────────────────────────────────────
Inhalants All 6.3% 10.8% 23.5% 76.5%
Grade 8 10.5% 18.4% 39.5% 60.5%
Grade 10 6.9% 13.8% 17.2% 82.8%Grade 12 2.5% 2.5% 15.0% 85.0%
─────────────────────────────────────────────────────────────────────────────────────
Any Illicit Drug All 27.5% 39.3% 49.8% 50.2%
Grade 8 27.0% 27.0% 35.1% 64.9%
Grade 10 13.8% 37.9% 51.7% 48.3%
Grade 12 37.5% 50.0% 60.0% 40.0%
─────────────────────────────────────────────────────────────────────────────────────
Marijuana All 26.9% 39.7% 49.4% 50.6%
Grade 8 25.0% 27.8% 33.3% 66.7%
Grade 10 13.8% 37.9% 51.7% 48.3%
Grade 12 37.5% 50.0% 60.0% 40.0%
─────────────────────────────────────────────────────────────────────────────────────Marijuana Only All 15.2% 24.0% 31.6% 68.4%
Grade 8 13.2% 13.2% 18.4% 81.6%
Grade 10 3.4% 20.7% 27.6% 72.4%
Grade 12 25.0% 35.0% 45.0% 55.0%
─────────────────────────────────────────────────────────────────────────────────────
Cocaine or Crack All 1.0% 1.9% 6.5% 93.5%
Grade 8 * % 2.8% 11.1% 88.9%
Grade 10 * % * % 7.1% 92.9%
Grade 12 2.5% 2.5% 2.5% 97.5%
─────────────────────────────────────────────────────────────────────────────────────
Cocaine All 1.0% 1.9% 5.7% 94.3%
Grade 8 * % 2.9% 8.8% 91.2%
Grade 10 * % * % 7.1% 92.9%
Grade 12 2 5% 2 5% 2 5% 97 5%
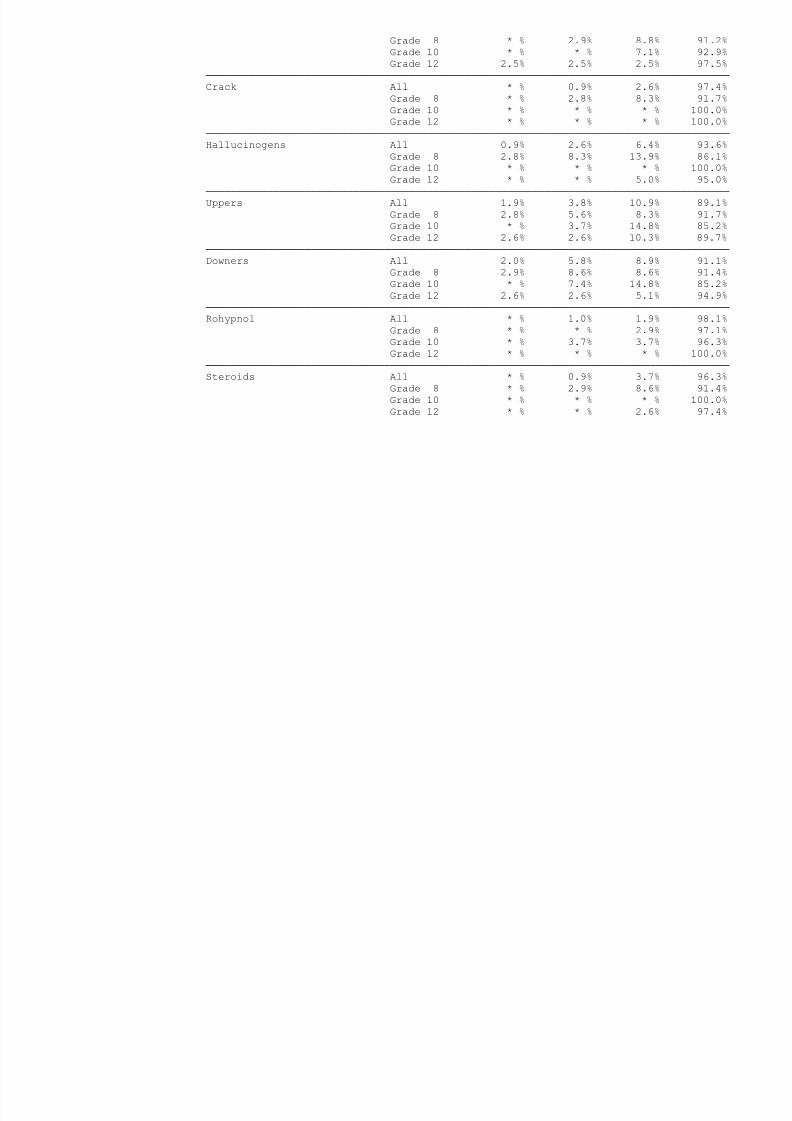
8/14/2019 BOWIE COUNTY - Texarkana ISD - 1999 Texas School Survey of Drug and Alcohol Use
http://slidepdf.com/reader/full/bowie-county-texarkana-isd-1999-texas-school-survey-of-drug-and-alcohol 88/185
Grade 12 2.5% 2.5% 2.5% 97.5%
─────────────────────────────────────────────────────────────────────────────────────
Crack All * % 0.9% 2.6% 97.4%
Grade 8 * % 2.8% 8.3% 91.7%
Grade 10 * % * % * % 100.0%
Grade 12 * % * % * % 100.0%
─────────────────────────────────────────────────────────────────────────────────────
Hallucinogens All 0.9% 2.6% 6.4% 93.6%
Grade 8 2.8% 8.3% 13.9% 86.1%
Grade 10 * % * % * % 100.0%
Grade 12 * % * % 5.0% 95.0%
─────────────────────────────────────────────────────────────────────────────────────
Uppers All 1.9% 3.8% 10.9% 89.1%
Grade 8 2.8% 5.6% 8.3% 91.7%
Grade 10 * % 3.7% 14.8% 85.2%
Grade 12 2.6% 2.6% 10.3% 89.7%
─────────────────────────────────────────────────────────────────────────────────────
Downers All 2.0% 5.8% 8.9% 91.1%
Grade 8 2.9% 8.6% 8.6% 91.4%
Grade 10 * % 7.4% 14.8% 85.2%Grade 12 2.6% 2.6% 5.1% 94.9%
─────────────────────────────────────────────────────────────────────────────────────
Rohypnol All * % 1.0% 1.9% 98.1%
Grade 8 * % * % 2.9% 97.1%
Grade 10 * % 3.7% 3.7% 96.3%
Grade 12 * % * % * % 100.0%
─────────────────────────────────────────────────────────────────────────────────────
Steroids All * % 0.9% 3.7% 96.3%
Grade 8 * % 2.9% 8.6% 91.4%
Grade 10 * % * % * % 100.0%
Grade 12 * % * % 2.6% 97.4%
Texarkana
Spring 1999
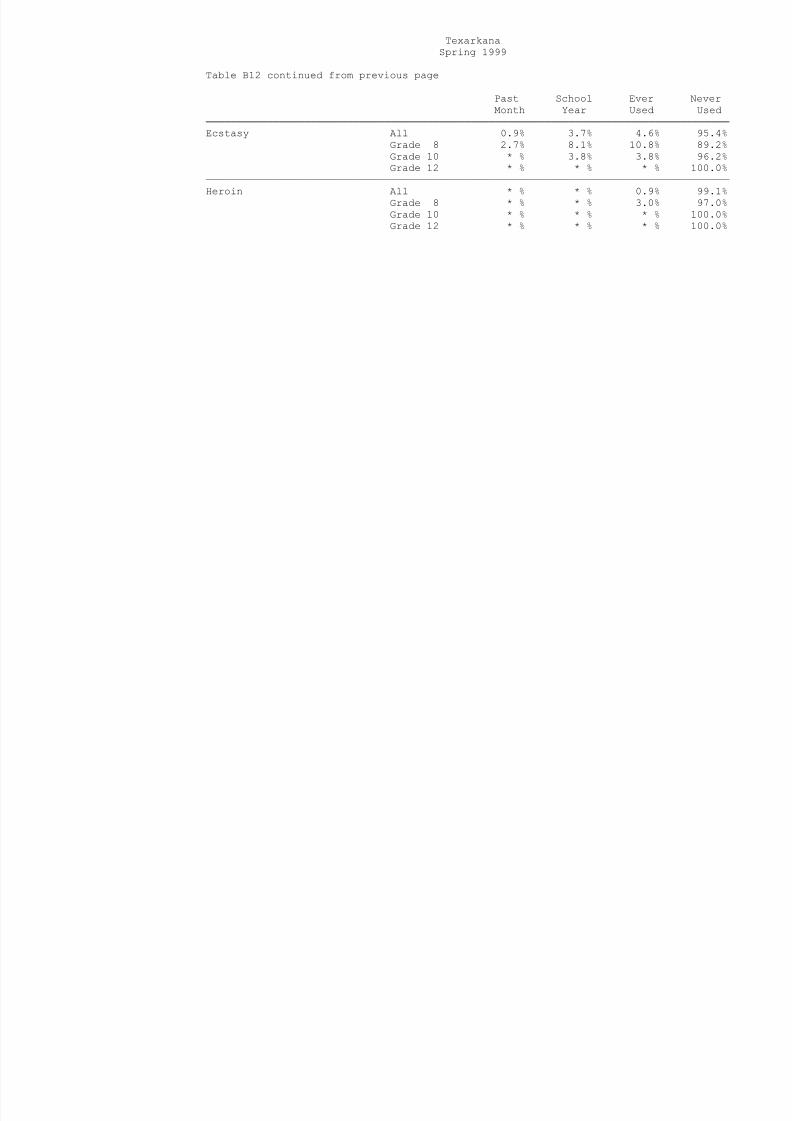
8/14/2019 BOWIE COUNTY - Texarkana ISD - 1999 Texas School Survey of Drug and Alcohol Use
http://slidepdf.com/reader/full/bowie-county-texarkana-isd-1999-texas-school-survey-of-drug-and-alcohol 89/185
Table B12 continued from previous page
Past School Ever Never
Month Year Used Used
─────────────────────────────────────────────────────────────────────────────────────
Ecstasy All 0.9% 3.7% 4.6% 95.4%
Grade 8 2.7% 8.1% 10.8% 89.2%
Grade 10 * % 3.8% 3.8% 96.2%
Grade 12 * % * % * % 100.0%
─────────────────────────────────────────────────────────────────────────────────────
Heroin All * % * % 0.9% 99.1%
Grade 8 * % * % 3.0% 97.0%
Grade 10 * % * % * % 100.0%
Grade 12 * % * % * % 100.0%
Texarkana
Spring 1999

8/14/2019 BOWIE COUNTY - Texarkana ISD - 1999 Texas School Survey of Drug and Alcohol Use
http://slidepdf.com/reader/full/bowie-county-texarkana-isd-1999-texas-school-survey-of-drug-and-alcohol 90/185
Table B13: Prevalence and recency of use of selected substances by grade
--> Students living in town three years or less
Past School Ever Never
Month Year Used Used
─────────────────────────────────────────────────────────────────────────────────────
Tobacco All 22.7% 30.3% 57.1% 42.9%
Grade 8 19.1% 24.5% 51.8% 48.2%
Grade 10 24.6% 36.1% 62.3% 37.7%
Grade 12 30.0% 36.7% 63.3% 36.7%
─────────────────────────────────────────────────────────────────────────────────────
Alcohol All 37.6% 50.3% 75.8% 24.2%
Grade 8 30.0% 39.1% 70.9% 29.1%
Grade 10 43.3% 61.7% 81.7% 18.3%
Grade 12 50.0% 63.3% 80.0% 20.0%
─────────────────────────────────────────────────────────────────────────────────────
Inhalants All 8.4% 13.3% 24.1% 75.9%
Grade 8 8.2% 13.6% 26.4% 73.6%
Grade 10 11.3% 16.1% 25.8% 74.2%Grade 12 3.3% 6.7% 13.3% 86.7%
─────────────────────────────────────────────────────────────────────────────────────
Any Illicit Drug All 18.0% 22.3% 36.4% 63.6%
Grade 8 12.0% 13.0% 26.9% 73.1%
Grade 10 23.0% 31.1% 44.3% 55.7%
Grade 12 26.7% 33.3% 50.0% 50.0%
─────────────────────────────────────────────────────────────────────────────────────
Marijuana All 16.9% 21.2% 34.3% 65.7%
Grade 8 12.0% 13.0% 25.0% 75.0%
Grade 10 21.3% 29.5% 42.6% 57.4%
Grade 12 23.3% 30.0% 46.7% 53.3%
─────────────────────────────────────────────────────────────────────────────────────Marijuana Only All 9.9% 13.0% 22.5% 77.5%
Grade 8 9.0% 9.9% 18.0% 82.0%
Grade 10 9.7% 16.1% 25.8% 74.2%
Grade 12 13.3% 16.7% 30.0% 70.0%
─────────────────────────────────────────────────────────────────────────────────────
Cocaine or Crack All 2.1% 3.8% 6.2% 93.8%
Grade 8 0.9% 0.9% 4.7% 95.3%
Grade 10 5.1% 8.5% 10.2% 89.8%
Grade 12 * % 3.3% 3.3% 96.7%
─────────────────────────────────────────────────────────────────────────────────────
Cocaine All 1.6% 3.8% 5.8% 94.2%
Grade 8 * % 0.9% 3.7% 96.3%
Grade 10 5.1% 8.5% 10.2% 89.8%
Grade 12 * % 3.4% 3.4% 96.6%
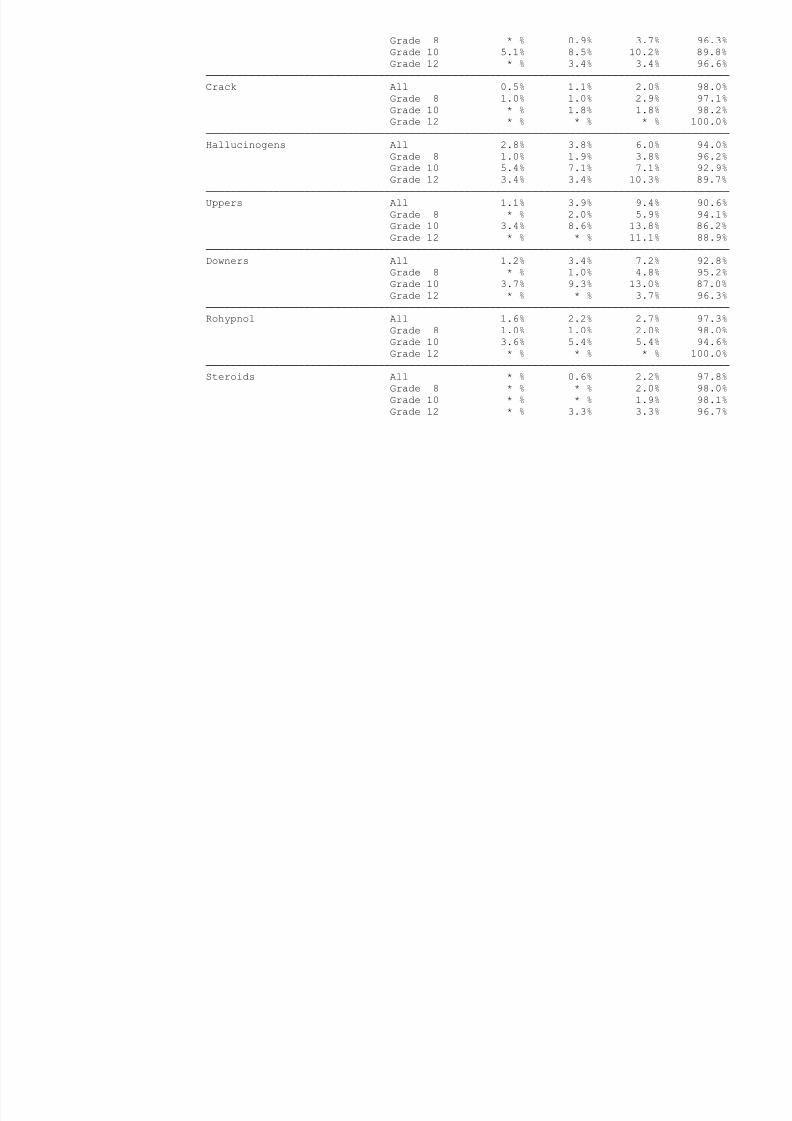
8/14/2019 BOWIE COUNTY - Texarkana ISD - 1999 Texas School Survey of Drug and Alcohol Use
http://slidepdf.com/reader/full/bowie-county-texarkana-isd-1999-texas-school-survey-of-drug-and-alcohol 91/185
Grade 12 % 3.4% 3.4% 96.6%
─────────────────────────────────────────────────────────────────────────────────────
Crack All 0.5% 1.1% 2.0% 98.0%
Grade 8 1.0% 1.0% 2.9% 97.1%
Grade 10 * % 1.8% 1.8% 98.2%
Grade 12 * % * % * % 100.0%
─────────────────────────────────────────────────────────────────────────────────────
Hallucinogens All 2.8% 3.8% 6.0% 94.0%
Grade 8 1.0% 1.9% 3.8% 96.2%
Grade 10 5.4% 7.1% 7.1% 92.9%
Grade 12 3.4% 3.4% 10.3% 89.7%
─────────────────────────────────────────────────────────────────────────────────────
Uppers All 1.1% 3.9% 9.4% 90.6%
Grade 8 * % 2.0% 5.9% 94.1%
Grade 10 3.4% 8.6% 13.8% 86.2%
Grade 12 * % * % 11.1% 88.9%
─────────────────────────────────────────────────────────────────────────────────────
Downers All 1.2% 3.4% 7.2% 92.8%
Grade 8 * % 1.0% 4.8% 95.2%
Grade 10 3.7% 9.3% 13.0% 87.0%Grade 12 * % * % 3.7% 96.3%
─────────────────────────────────────────────────────────────────────────────────────
Rohypnol All 1.6% 2.2% 2.7% 97.3%
Grade 8 1.0% 1.0% 2.0% 98.0%
Grade 10 3.6% 5.4% 5.4% 94.6%
Grade 12 * % * % * % 100.0%
─────────────────────────────────────────────────────────────────────────────────────
Steroids All * % 0.6% 2.2% 97.8%
Grade 8 * % * % 2.0% 98.0%
Grade 10 * % * % 1.9% 98.1%
Grade 12 * % 3.3% 3.3% 96.7%
Texarkana
Spring 1999
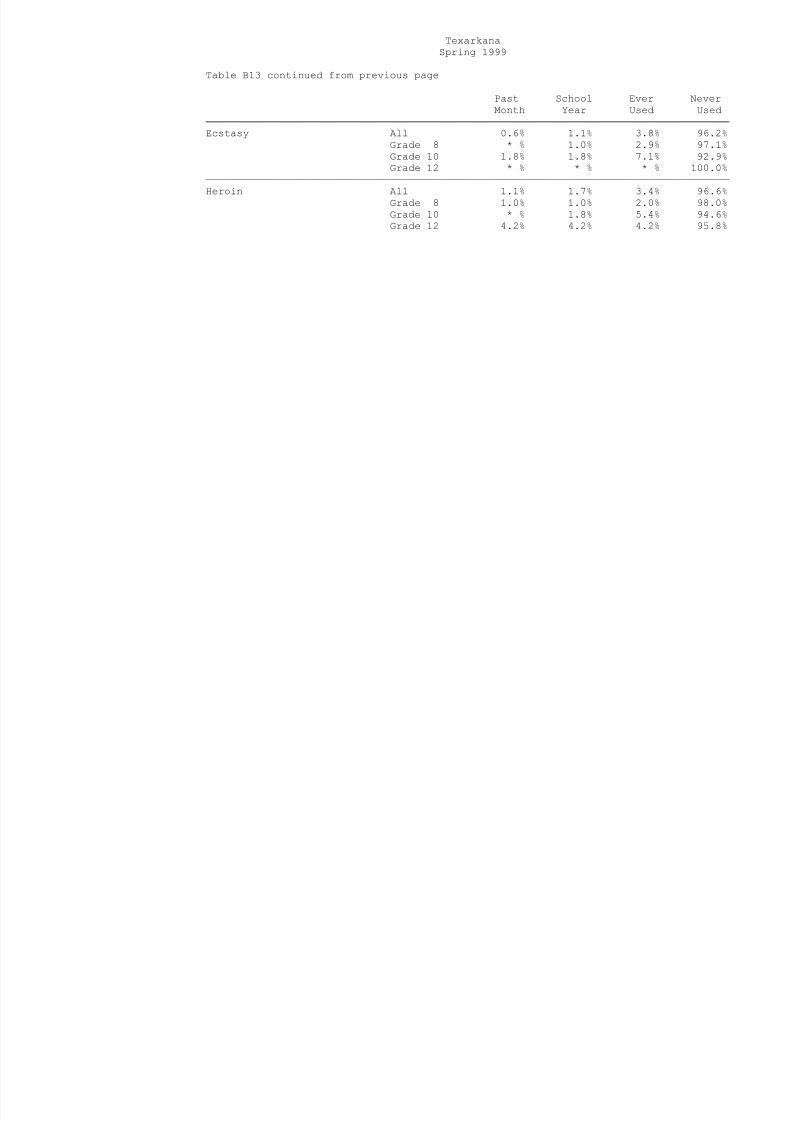
8/14/2019 BOWIE COUNTY - Texarkana ISD - 1999 Texas School Survey of Drug and Alcohol Use
http://slidepdf.com/reader/full/bowie-county-texarkana-isd-1999-texas-school-survey-of-drug-and-alcohol 92/185
Table B13 continued from previous page
Past School Ever Never
Month Year Used Used
─────────────────────────────────────────────────────────────────────────────────────
Ecstasy All 0.6% 1.1% 3.8% 96.2%
Grade 8 * % 1.0% 2.9% 97.1%
Grade 10 1.8% 1.8% 7.1% 92.9%
Grade 12 * % * % * % 100.0%
─────────────────────────────────────────────────────────────────────────────────────
Heroin All 1.1% 1.7% 3.4% 96.6%
Grade 8 1.0% 1.0% 2.0% 98.0%
Grade 10 * % 1.8% 5.4% 94.6%
Grade 12 4.2% 4.2% 4.2% 95.8%
Texarkana
Spring 1999
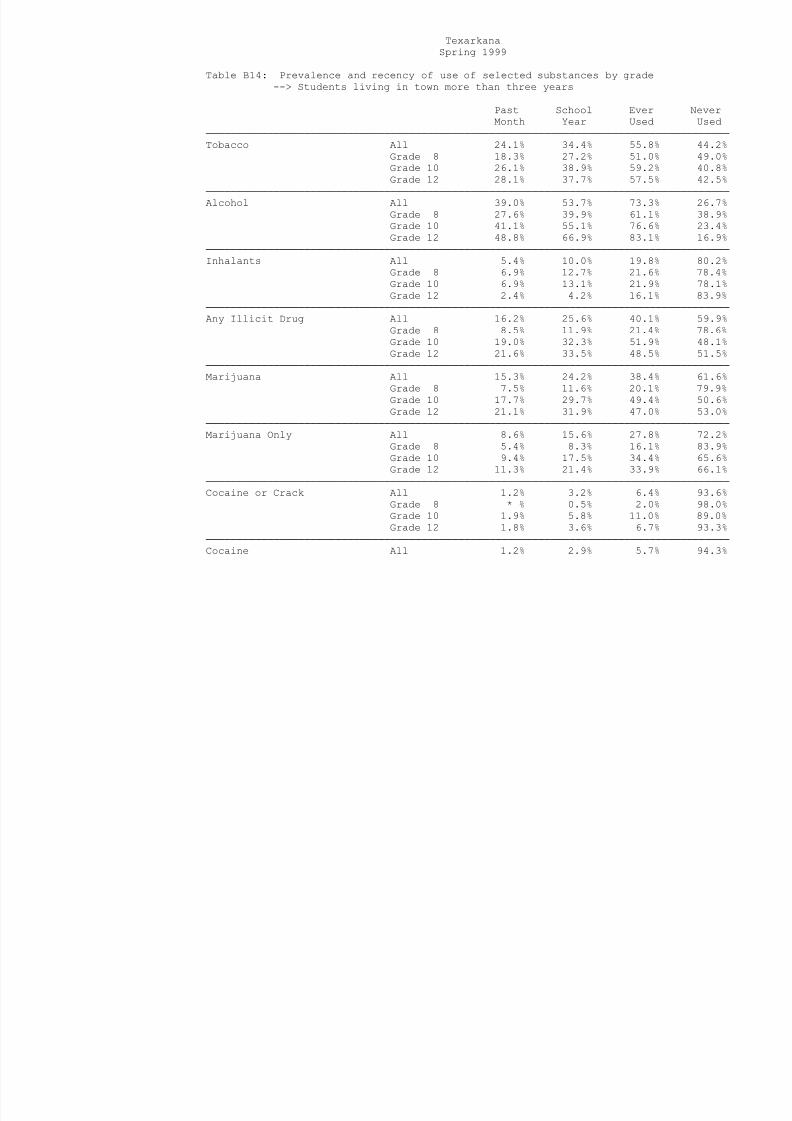
8/14/2019 BOWIE COUNTY - Texarkana ISD - 1999 Texas School Survey of Drug and Alcohol Use
http://slidepdf.com/reader/full/bowie-county-texarkana-isd-1999-texas-school-survey-of-drug-and-alcohol 93/185
Table B14: Prevalence and recency of use of selected substances by grade
--> Students living in town more than three years
Past School Ever Never
Month Year Used Used
─────────────────────────────────────────────────────────────────────────────────────
Tobacco All 24.1% 34.4% 55.8% 44.2%
Grade 8 18.3% 27.2% 51.0% 49.0%
Grade 10 26.1% 38.9% 59.2% 40.8%
Grade 12 28.1% 37.7% 57.5% 42.5%
─────────────────────────────────────────────────────────────────────────────────────
Alcohol All 39.0% 53.7% 73.3% 26.7%
Grade 8 27.6% 39.9% 61.1% 38.9%
Grade 10 41.1% 55.1% 76.6% 23.4%
Grade 12 48.8% 66.9% 83.1% 16.9%
─────────────────────────────────────────────────────────────────────────────────────
Inhalants All 5.4% 10.0% 19.8% 80.2%
Grade 8 6.9% 12.7% 21.6% 78.4%
Grade 10 6.9% 13.1% 21.9% 78.1%Grade 12 2.4% 4.2% 16.1% 83.9%
─────────────────────────────────────────────────────────────────────────────────────
Any Illicit Drug All 16.2% 25.6% 40.1% 59.9%
Grade 8 8.5% 11.9% 21.4% 78.6%
Grade 10 19.0% 32.3% 51.9% 48.1%
Grade 12 21.6% 33.5% 48.5% 51.5%
─────────────────────────────────────────────────────────────────────────────────────
Marijuana All 15.3% 24.2% 38.4% 61.6%
Grade 8 7.5% 11.6% 20.1% 79.9%
Grade 10 17.7% 29.7% 49.4% 50.6%
Grade 12 21.1% 31.9% 47.0% 53.0%
─────────────────────────────────────────────────────────────────────────────────────Marijuana Only All 8.6% 15.6% 27.8% 72.2%
Grade 8 5.4% 8.3% 16.1% 83.9%
Grade 10 9.4% 17.5% 34.4% 65.6%
Grade 12 11.3% 21.4% 33.9% 66.1%
─────────────────────────────────────────────────────────────────────────────────────
Cocaine or Crack All 1.2% 3.2% 6.4% 93.6%
Grade 8 * % 0.5% 2.0% 98.0%
Grade 10 1.9% 5.8% 11.0% 89.0%
Grade 12 1.8% 3.6% 6.7% 93.3%
─────────────────────────────────────────────────────────────────────────────────────
Cocaine All 1.2% 2.9% 5.7% 94.3%
Grade 8 * % 0.5% 1.6% 98.4%
Grade 10 1.9% 4.5% 9.7% 90.3%
Grade 12 1.8% 3.7% 6.1% 93.9%

8/14/2019 BOWIE COUNTY - Texarkana ISD - 1999 Texas School Survey of Drug and Alcohol Use
http://slidepdf.com/reader/full/bowie-county-texarkana-isd-1999-texas-school-survey-of-drug-and-alcohol 94/185
─────────────────────────────────────────────────────────────────────────────────────
Crack All 0.2% 1.0% 2.0% 98.0%
Grade 8 * % 0.5% 1.0% 99.0%
Grade 10 0.7% 2.7% 4.1% 95.9%
Grade 12 * % * % 1.2% 98.8%
─────────────────────────────────────────────────────────────────────────────────────
Hallucinogens All 1.0% 1.8% 4.2% 95.8%
Grade 8 1.0% 1.5% 2.6% 97.4%
Grade 10 1.9% 2.6% 5.2% 94.8%
Grade 12 * % 1.2% 5.0% 95.0%
─────────────────────────────────────────────────────────────────────────────────────
Uppers All 2.9% 4.6% 7.7% 92.3%
Grade 8 1.1% 1.1% 2.1% 97.9%
Grade 10 2.0% 5.4% 10.7% 89.3%
Grade 12 5.6% 7.5% 10.6% 89.4%
─────────────────────────────────────────────────────────────────────────────────────
Downers All 2.5% 4.1% 5.9% 94.1%
Grade 8 0.5% 1.5% 2.6% 97.4%
Grade 10 3.3% 5.3% 7.9% 92.1%Grade 12 3.7% 5.5% 7.3% 92.7%
─────────────────────────────────────────────────────────────────────────────────────
Rohypnol All 0.2% 1.0% 2.2% 97.8%
Grade 8 0.5% 0.5% 1.6% 98.4%
Grade 10 * % 2.0% 2.7% 97.3%
Grade 12 * % 0.6% 2.5% 97.5%
─────────────────────────────────────────────────────────────────────────────────────
Steroids All 1.2% 2.0% 3.2% 96.8%
Grade 8 0.5% 2.1% 3.6% 96.4%
Grade 10 2.0% 2.7% 4.1% 95.9%
Grade 12 1.3% 1.3% 1.9% 98.1%
Texarkana
Spring 1999

8/14/2019 BOWIE COUNTY - Texarkana ISD - 1999 Texas School Survey of Drug and Alcohol Use
http://slidepdf.com/reader/full/bowie-county-texarkana-isd-1999-texas-school-survey-of-drug-and-alcohol 95/185
Table B14 continued from previous page
Past School Ever Never
Month Year Used Used
─────────────────────────────────────────────────────────────────────────────────────
Ecstasy All 0.4% 1.8% 2.4% 97.6%
Grade 8 0.5% 1.6% 1.6% 98.4%
Grade 10 * % 2.8% 4.9% 95.1%
Grade 12 0.6% 1.2% 1.2% 98.8%
─────────────────────────────────────────────────────────────────────────────────────
Heroin All 0.2% 0.6% 1.4% 98.6%
Grade 8 * % * % 0.5% 99.5%
Grade 10 0.7% 2.0% 2.0% 98.0%
Grade 12 * % * % 1.9% 98.1%
Texarkana
Spring 1999
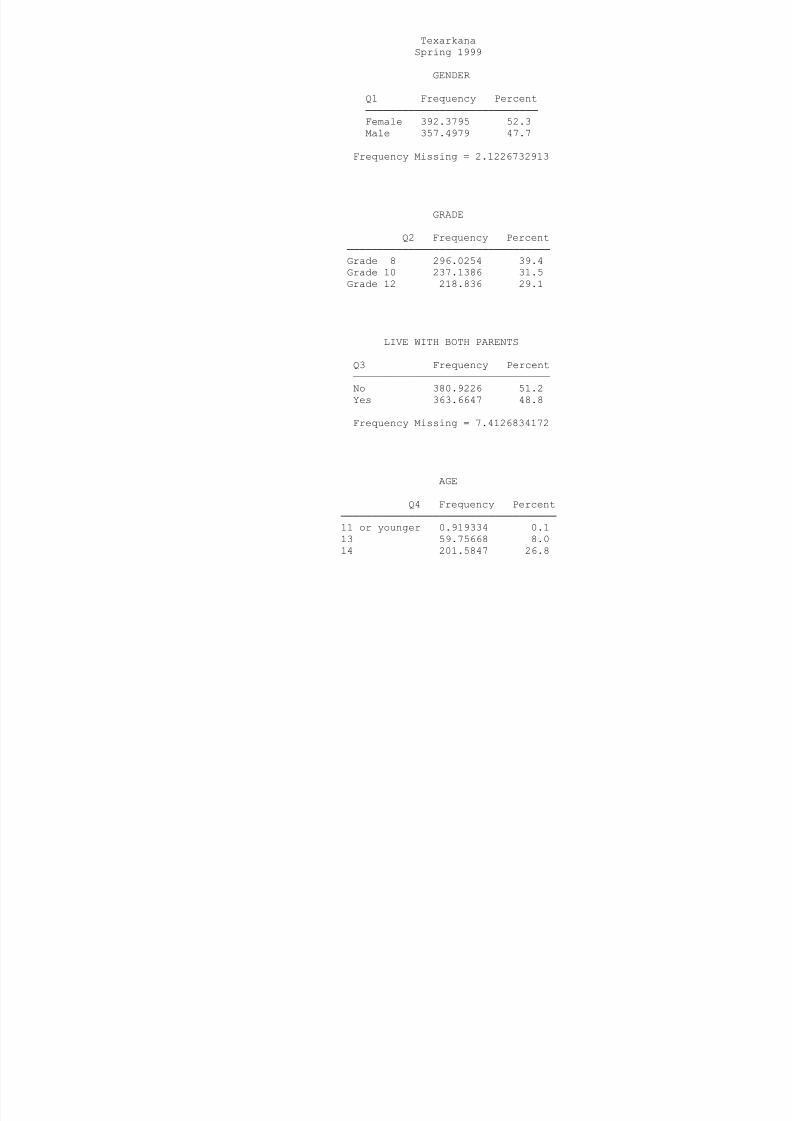
8/14/2019 BOWIE COUNTY - Texarkana ISD - 1999 Texas School Survey of Drug and Alcohol Use
http://slidepdf.com/reader/full/bowie-county-texarkana-isd-1999-texas-school-survey-of-drug-and-alcohol 96/185
GENDER
Q1 Frequency Percent
────────────────────────────
Female 392.3795 52.3
Male 357.4979 47.7
Frequency Missing = 2.1226732913
GRADE
Q2 Frequency Percent
─────────────────────────────────
Grade 8 296.0254 39.4
Grade 10 237.1386 31.5
Grade 12 218.836 29.1
LIVE WITH BOTH PARENTS
Q3 Frequency Percent
────────────────────────────────
No 380.9226 51.2
Yes 363.6647 48.8
Frequency Missing = 7.4126834172
AGE
Q4 Frequency Percent
───────────────────────────────────
11 or younger 0.919334 0.1
13 59.75668 8.0
14 201.5847 26.8
15 80.48186 10.7
16 168.6755 22.5
17 90.80523 12.1
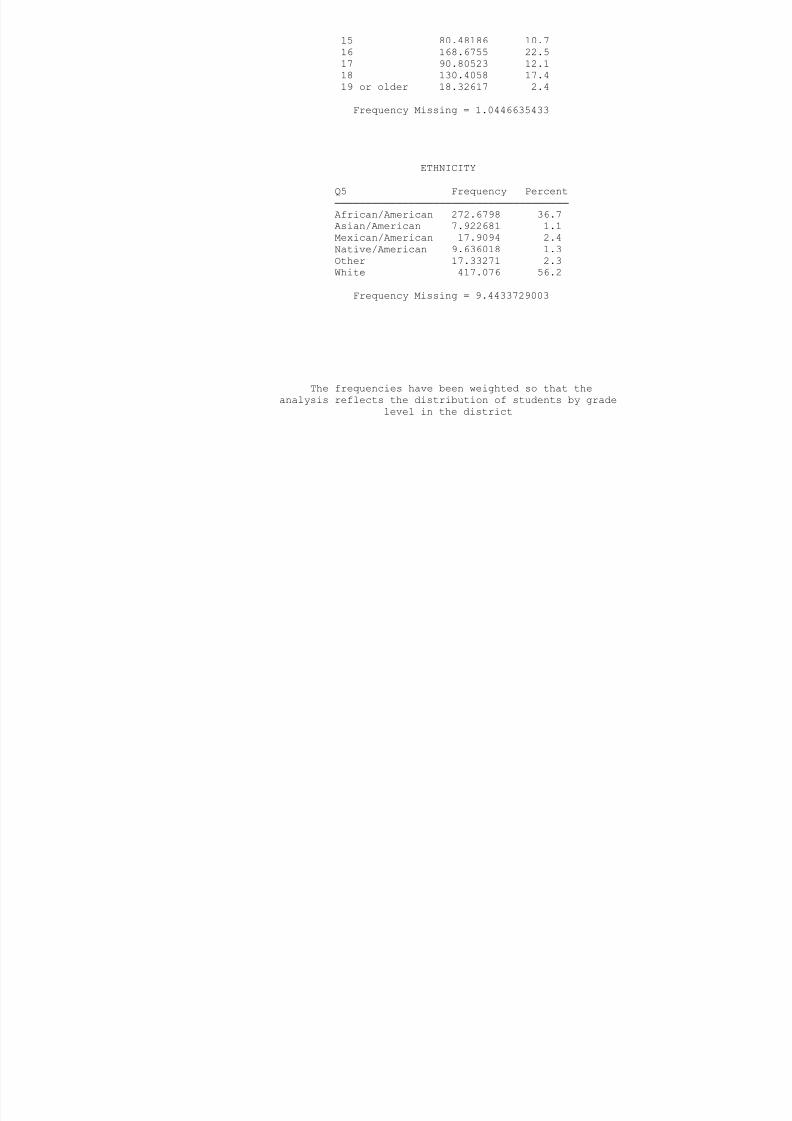
8/14/2019 BOWIE COUNTY - Texarkana ISD - 1999 Texas School Survey of Drug and Alcohol Use
http://slidepdf.com/reader/full/bowie-county-texarkana-isd-1999-texas-school-survey-of-drug-and-alcohol 97/185
18 130.4058 17.4
19 or older 18.32617 2.4
Frequency Missing = 1.0446635433
ETHNICITY
Q5 Frequency Percent
──────────────────────────────────────
African/American 272.6798 36.7
Asian/American 7.922681 1.1
Mexican/American 17.9094 2.4
Native/American 9.636018 1.3
Other 17.33271 2.3
White 417.076 56.2
Frequency Missing = 9.4433729003
The frequencies have been weighted so that the
analysis reflects the distribution of students by grade
level in the district
Texarkana
Spring 1999
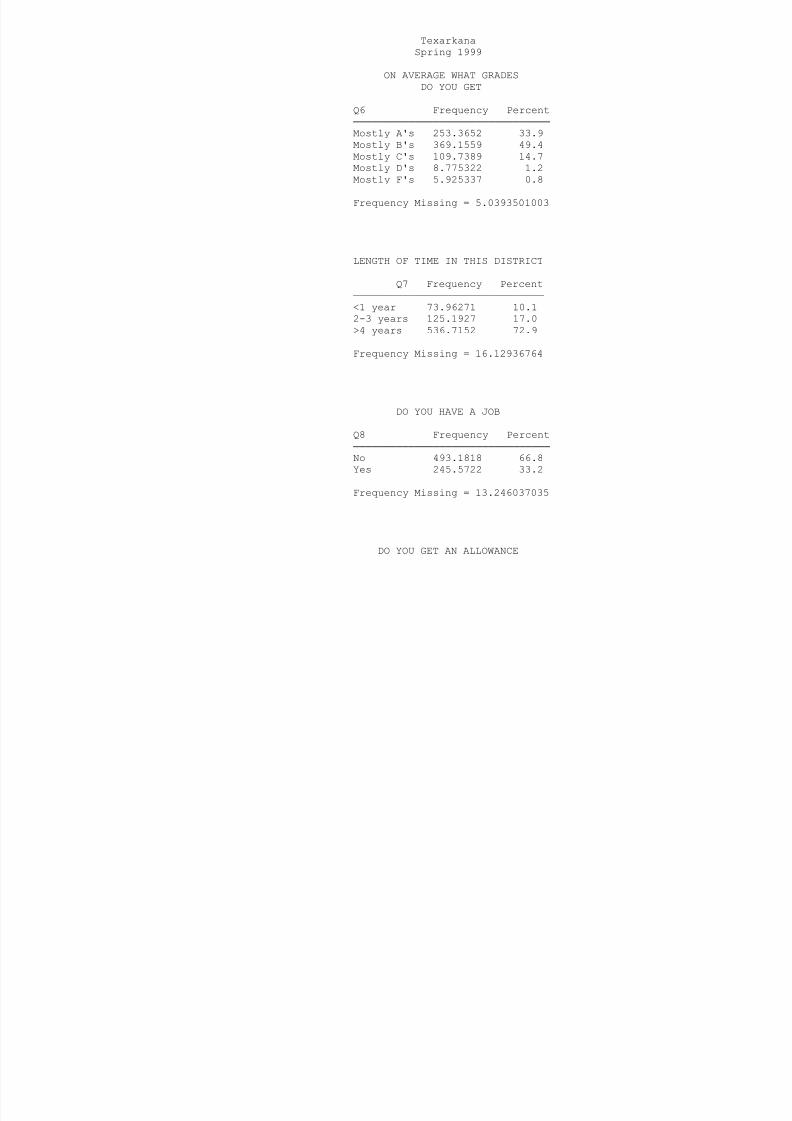
8/14/2019 BOWIE COUNTY - Texarkana ISD - 1999 Texas School Survey of Drug and Alcohol Use
http://slidepdf.com/reader/full/bowie-county-texarkana-isd-1999-texas-school-survey-of-drug-and-alcohol 98/185
ON AVERAGE WHAT GRADES
DO YOU GET
Q6 Frequency Percent
────────────────────────────────
Mostly A's 253.3652 33.9
Mostly B's 369.1559 49.4
Mostly C's 109.7389 14.7
Mostly D's 8.775322 1.2
Mostly F's 5.925337 0.8
Frequency Missing = 5.0393501003
LENGTH OF TIME IN THIS DISTRICT
Q7 Frequency Percent───────────────────────────────
<1 year 73.96271 10.1
2-3 years 125.1927 17.0
>4 years 536.7152 72.9
Frequency Missing = 16.12936764
DO YOU HAVE A JOB
Q8 Frequency Percent
────────────────────────────────
No 493.1818 66.8
Yes 245.5722 33.2
Frequency Missing = 13.246037035
DO YOU GET AN ALLOWANCE
Q9 Frequency Percent
────────────────────────────────
415 343 56 4
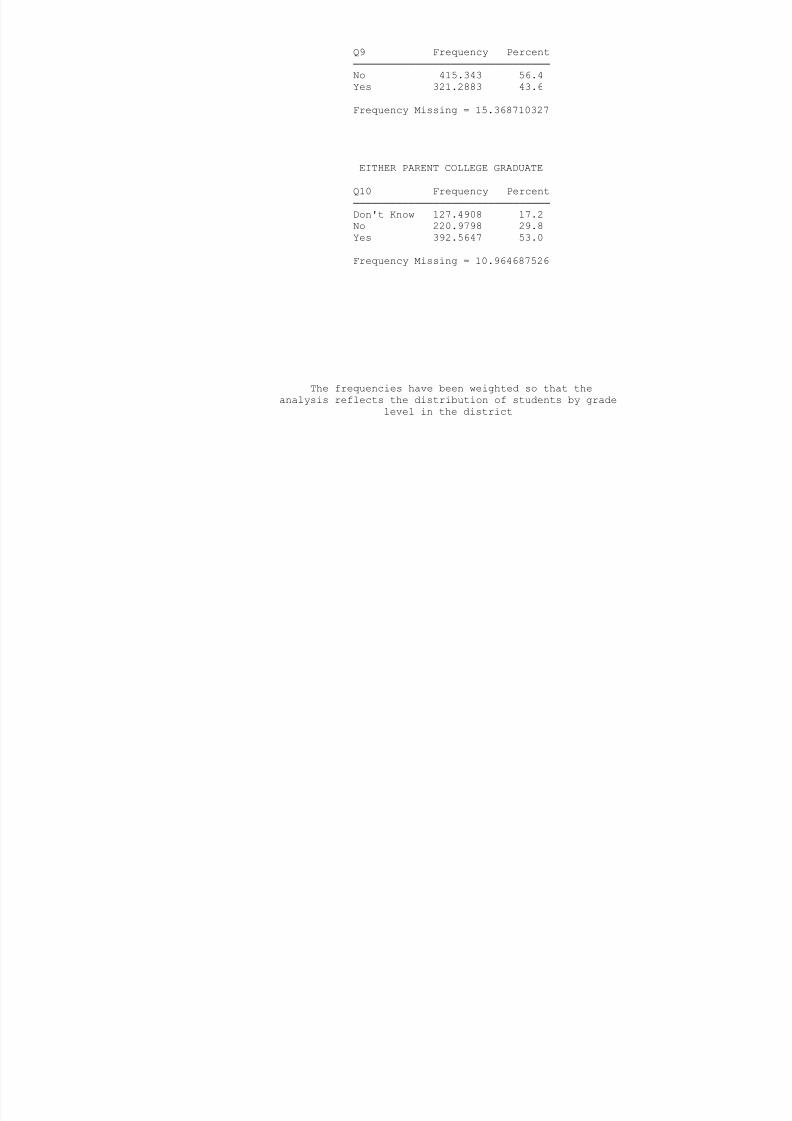
8/14/2019 BOWIE COUNTY - Texarkana ISD - 1999 Texas School Survey of Drug and Alcohol Use
http://slidepdf.com/reader/full/bowie-county-texarkana-isd-1999-texas-school-survey-of-drug-and-alcohol 99/185
No 415.343 56.4
Yes 321.2883 43.6
Frequency Missing = 15.368710327
EITHER PARENT COLLEGE GRADUATE
Q10 Frequency Percent
────────────────────────────────
Don't Know 127.4908 17.2
No 220.9798 29.8
Yes 392.5647 53.0
Frequency Missing = 10.964687526
The frequencies have been weighted so that the
analysis reflects the distribution of students by grade
level in the district
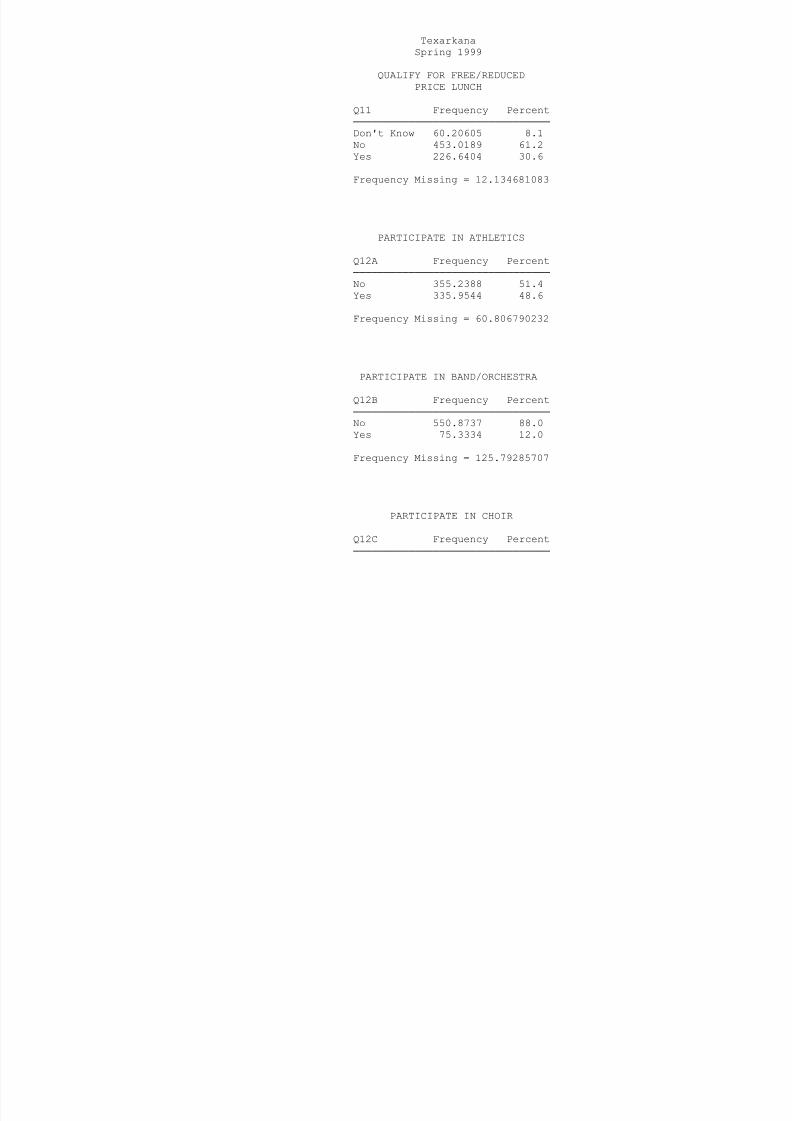
8/14/2019 BOWIE COUNTY - Texarkana ISD - 1999 Texas School Survey of Drug and Alcohol Use
http://slidepdf.com/reader/full/bowie-county-texarkana-isd-1999-texas-school-survey-of-drug-and-alcohol 100/185
No 559.8498 89.3
Yes 67.02606 10.7
Freq enc Missing 125 12418356
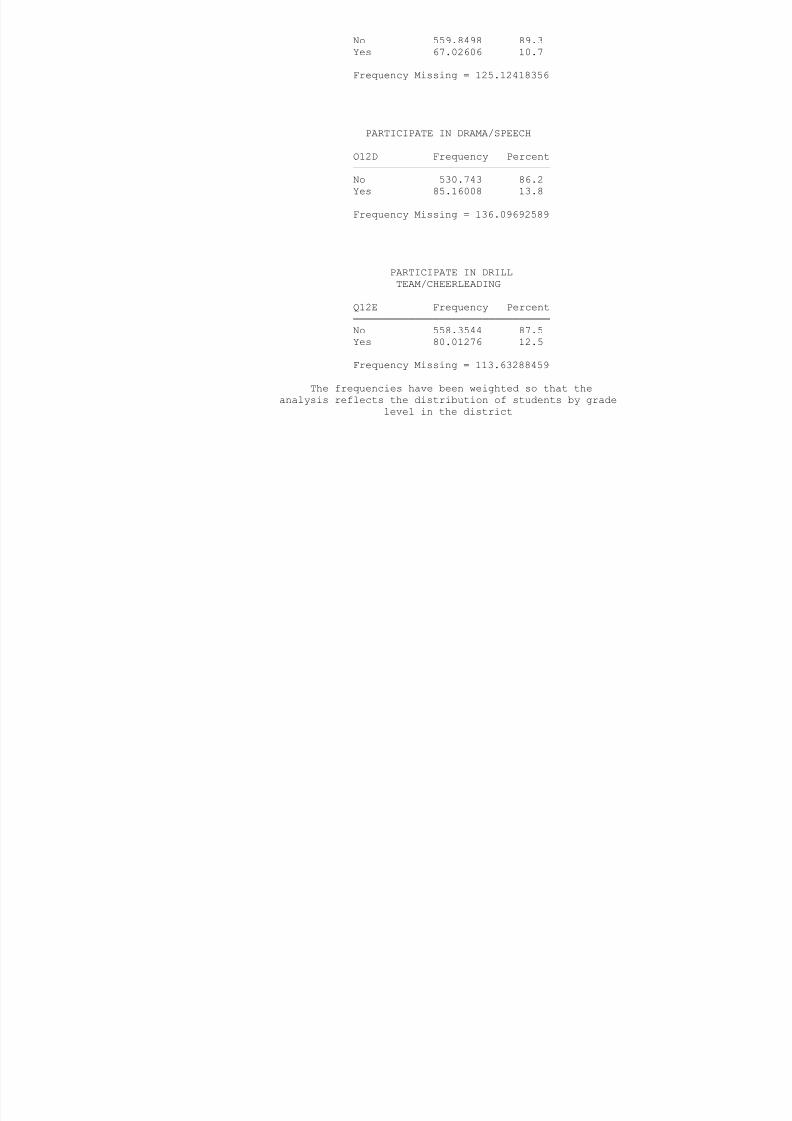
8/14/2019 BOWIE COUNTY - Texarkana ISD - 1999 Texas School Survey of Drug and Alcohol Use
http://slidepdf.com/reader/full/bowie-county-texarkana-isd-1999-texas-school-survey-of-drug-and-alcohol 101/185
Frequency Missing = 125.12418356
PARTICIPATE IN DRAMA/SPEECH
Q12D Frequency Percent
────────────────────────────────
No 530.743 86.2
Yes 85.16008 13.8
Frequency Missing = 136.09692589
PARTICIPATE IN DRILL
TEAM/CHEERLEADING
Q12E Frequency Percent
────────────────────────────────
No 558.3544 87.5
Yes 80.01276 12.5
Frequency Missing = 113.63288459
The frequencies have been weighted so that the
analysis reflects the distribution of students by grade
level in the district
Texarkana
Spring 1999
PARTICIPATE IN STUDENT
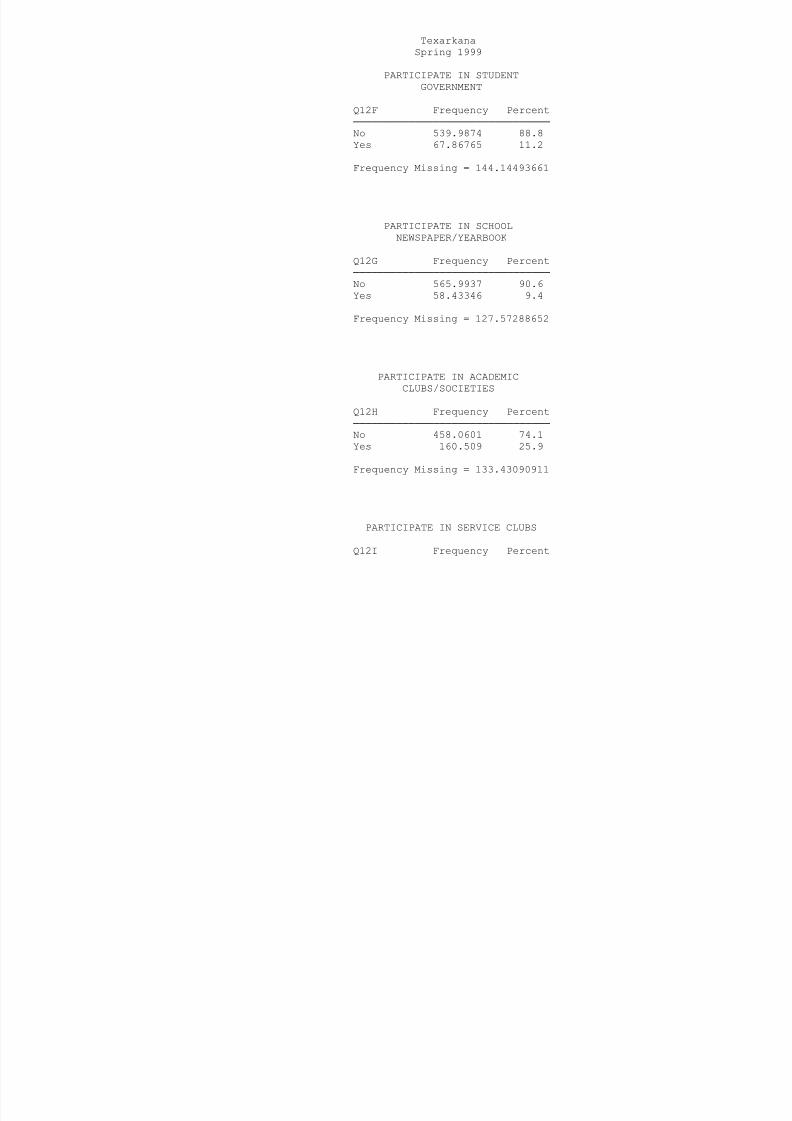
8/14/2019 BOWIE COUNTY - Texarkana ISD - 1999 Texas School Survey of Drug and Alcohol Use
http://slidepdf.com/reader/full/bowie-county-texarkana-isd-1999-texas-school-survey-of-drug-and-alcohol 102/185
PARTICIPATE IN STUDENT
GOVERNMENT
Q12F Frequency Percent
────────────────────────────────
No 539.9874 88.8
Yes 67.86765 11.2
Frequency Missing = 144.14493661
PARTICIPATE IN SCHOOL
NEWSPAPER/YEARBOOK
Q12G Frequency Percent
────────────────────────────────
No 565.9937 90.6Yes 58.43346 9.4
Frequency Missing = 127.57288652
PARTICIPATE IN ACADEMIC
CLUBS/SOCIETIES
Q12H Frequency Percent
────────────────────────────────No 458.0601 74.1
Yes 160.509 25.9
Frequency Missing = 133.43090911
PARTICIPATE IN SERVICE CLUBS
Q12I Frequency Percent
────────────────────────────────
No 495.6275 80.5
Yes 119.8657 19.5
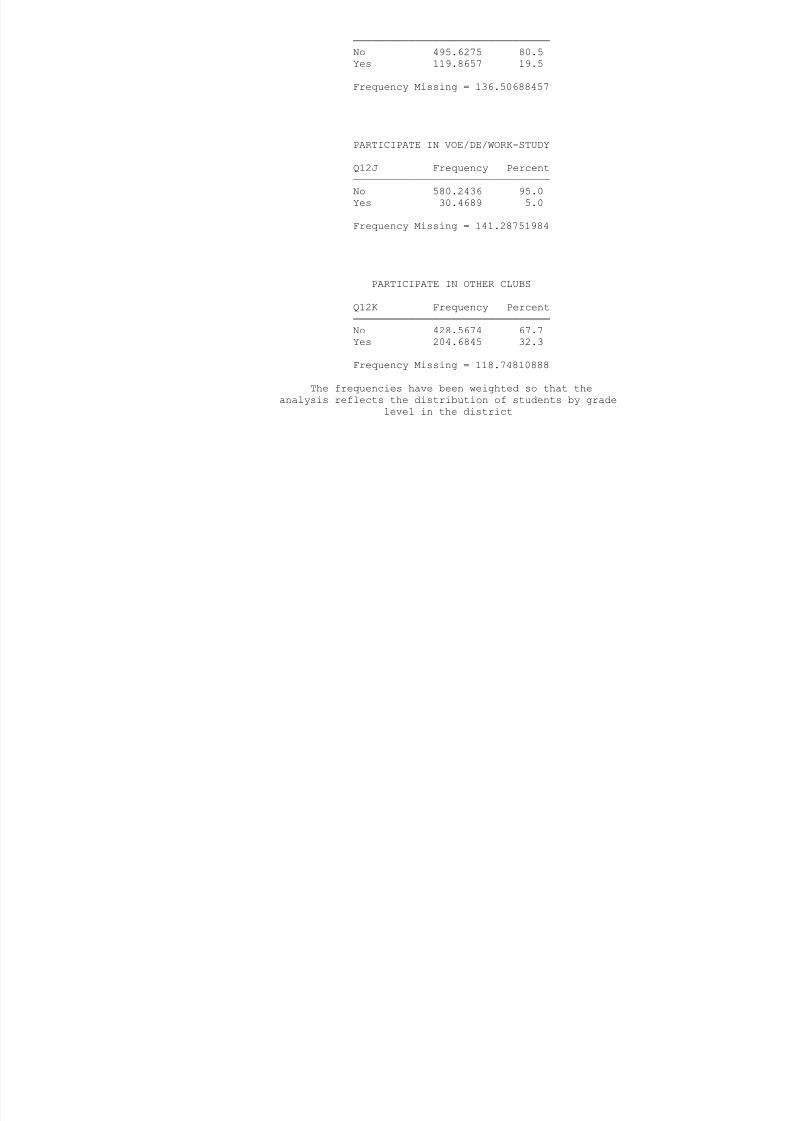
8/14/2019 BOWIE COUNTY - Texarkana ISD - 1999 Texas School Survey of Drug and Alcohol Use
http://slidepdf.com/reader/full/bowie-county-texarkana-isd-1999-texas-school-survey-of-drug-and-alcohol 103/185
Frequency Missing = 136.50688457
PARTICIPATE IN VOE/DE/WORK-STUDY
Q12J Frequency Percent
────────────────────────────────
No 580.2436 95.0
Yes 30.4689 5.0
Frequency Missing = 141.28751984
PARTICIPATE IN OTHER CLUBS
Q12K Frequency Percent
────────────────────────────────
No 428.5674 67.7
Yes 204.6845 32.3
Frequency Missing = 118.74810888
The frequencies have been weighted so that the
analysis reflects the distribution of students by grade
level in the district
Texarkana
Spring 1999
DO YOU FEEL SAFE IN YOUR HOME
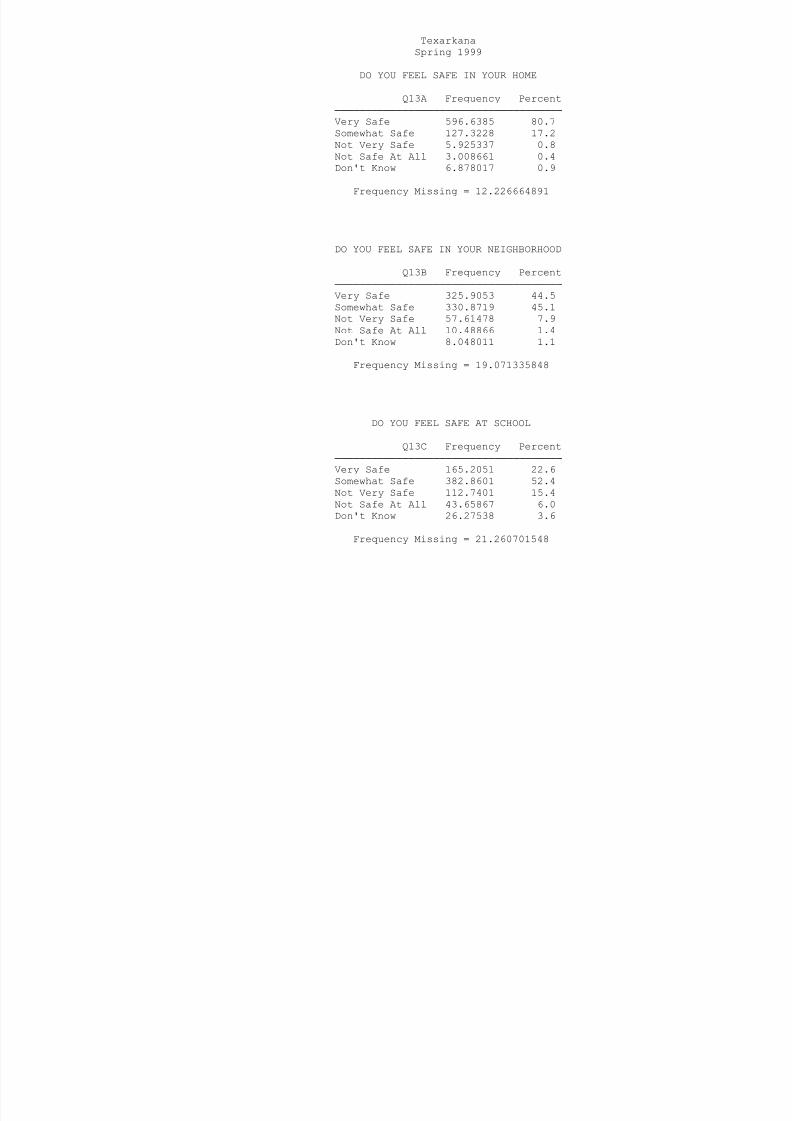
8/14/2019 BOWIE COUNTY - Texarkana ISD - 1999 Texas School Survey of Drug and Alcohol Use
http://slidepdf.com/reader/full/bowie-county-texarkana-isd-1999-texas-school-survey-of-drug-and-alcohol 104/185
DO YOU FEEL SAFE IN YOUR HOME
Q13A Frequency Percent
─────────────────────────────────────
Very Safe 596.6385 80.7
Somewhat Safe 127.3228 17.2
Not Very Safe 5.925337 0.8
Not Safe At All 3.008661 0.4
Don't Know 6.878017 0.9
Frequency Missing = 12.226664891
DO YOU FEEL SAFE IN YOUR NEIGHBORHOOD
Q13B Frequency Percent
─────────────────────────────────────Very Safe 325.9053 44.5
Somewhat Safe 330.8719 45.1
Not Very Safe 57.61478 7.9
Not Safe At All 10.48866 1.4
Don't Know 8.048011 1.1
Frequency Missing = 19.071335848
DO YOU FEEL SAFE AT SCHOOL
Q13C Frequency Percent
─────────────────────────────────────
Very Safe 165.2051 22.6
Somewhat Safe 382.8601 52.4
Not Very Safe 112.7401 15.4
Not Safe At All 43.65867 6.0
Don't Know 26.27538 3.6
Frequency Missing = 21.260701548
FRIENDS FEELING CLOSE
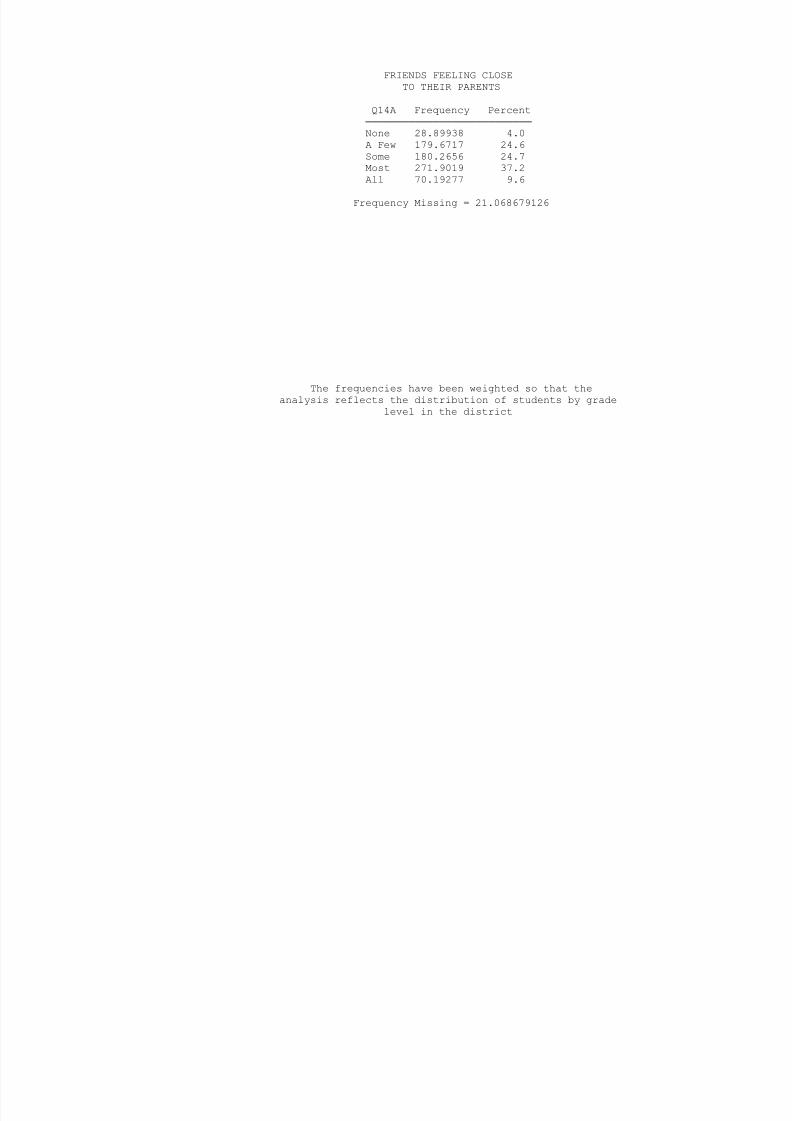
8/14/2019 BOWIE COUNTY - Texarkana ISD - 1999 Texas School Survey of Drug and Alcohol Use
http://slidepdf.com/reader/full/bowie-county-texarkana-isd-1999-texas-school-survey-of-drug-and-alcohol 105/185
FRIENDS FEELING CLOSE
TO THEIR PARENTS
Q14A Frequency Percent
───────────────────────────
None 28.89938 4.0
A Few 179.6717 24.6
Some 180.2656 24.7
Most 271.9019 37.2
All 70.19277 9.6
Frequency Missing = 21.068679126
The frequencies have been weighted so that the
analysis reflects the distribution of students by grade
level in the district
Texarkana
Spring 1999
HOW MANY FRIENDS
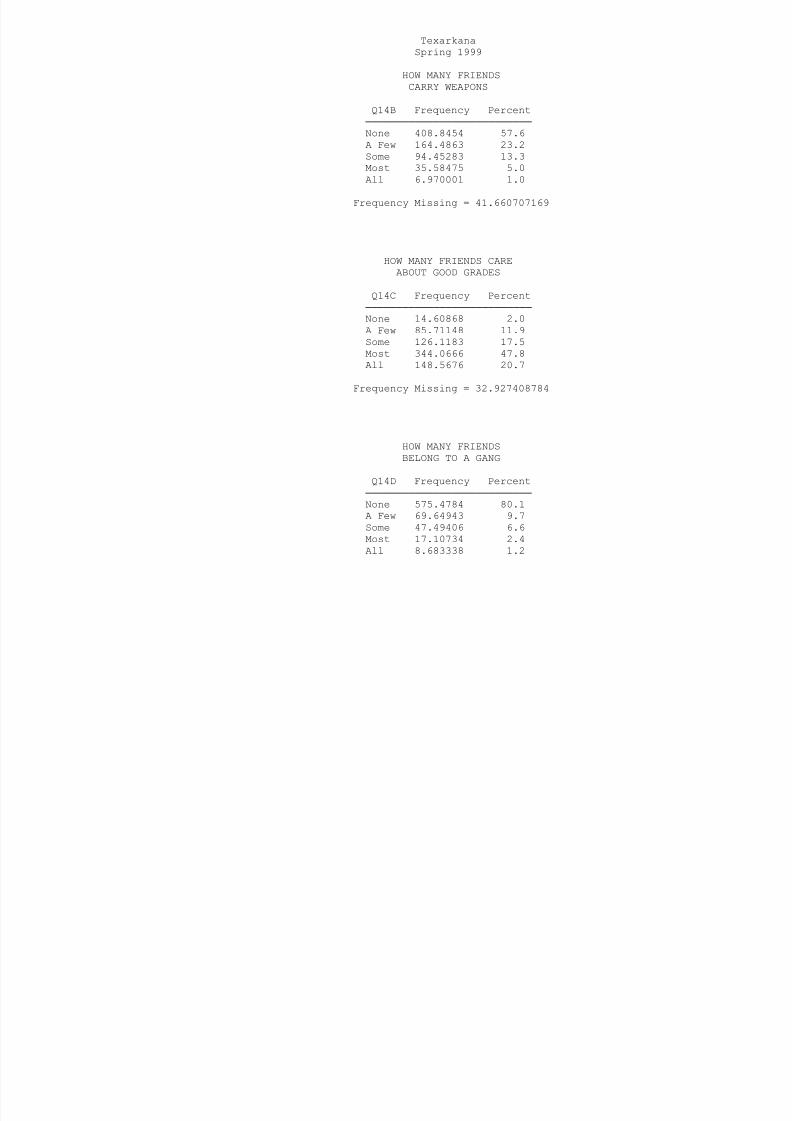
8/14/2019 BOWIE COUNTY - Texarkana ISD - 1999 Texas School Survey of Drug and Alcohol Use
http://slidepdf.com/reader/full/bowie-county-texarkana-isd-1999-texas-school-survey-of-drug-and-alcohol 106/185
HOW MANY FRIENDS
CARRY WEAPONS
Q14B Frequency Percent
───────────────────────────
None 408.8454 57.6
A Few 164.4863 23.2
Some 94.45283 13.3Most 35.58475 5.0
All 6.970001 1.0
Frequency Missing = 41.660707169
HOW MANY FRIENDS CARE
ABOUT GOOD GRADES
Q14C Frequency Percent
───────────────────────────
None 14.60868 2.0
A Few 85.71148 11.9
Some 126.1183 17.5
Most 344.0666 47.8
All 148.5676 20.7
Frequency Missing = 32.927408784
HOW MANY FRIENDS
BELONG TO A GANG
Q14D Frequency Percent
───────────────────────────
None 575.4784 80.1
A Few 69.64943 9.7
Some 47.49406 6.6
Most 17.10734 2.4
All 8.683338 1.2
Frequency Missing = 33.587405053
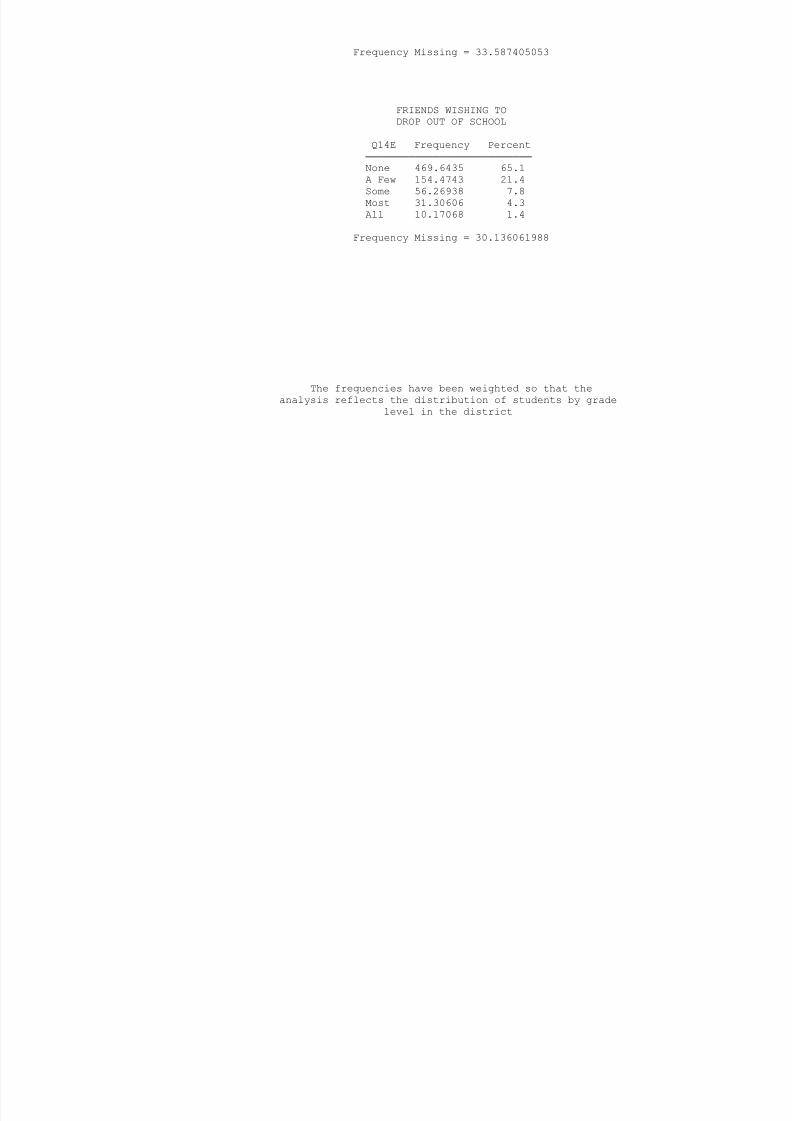
8/14/2019 BOWIE COUNTY - Texarkana ISD - 1999 Texas School Survey of Drug and Alcohol Use
http://slidepdf.com/reader/full/bowie-county-texarkana-isd-1999-texas-school-survey-of-drug-and-alcohol 107/185
FRIENDS WISHING TO
DROP OUT OF SCHOOL
Q14E Frequency Percent
───────────────────────────None 469.6435 65.1
A Few 154.4743 21.4
Some 56.26938 7.8
Most 31.30606 4.3
All 10.17068 1.4
Frequency Missing = 30.136061988
The frequencies have been weighted so that the
analysis reflects the distribution of students by grade
level in the district
Texarkana
Spring 1999
PARENTS ATTEND PTA/SCHOOL
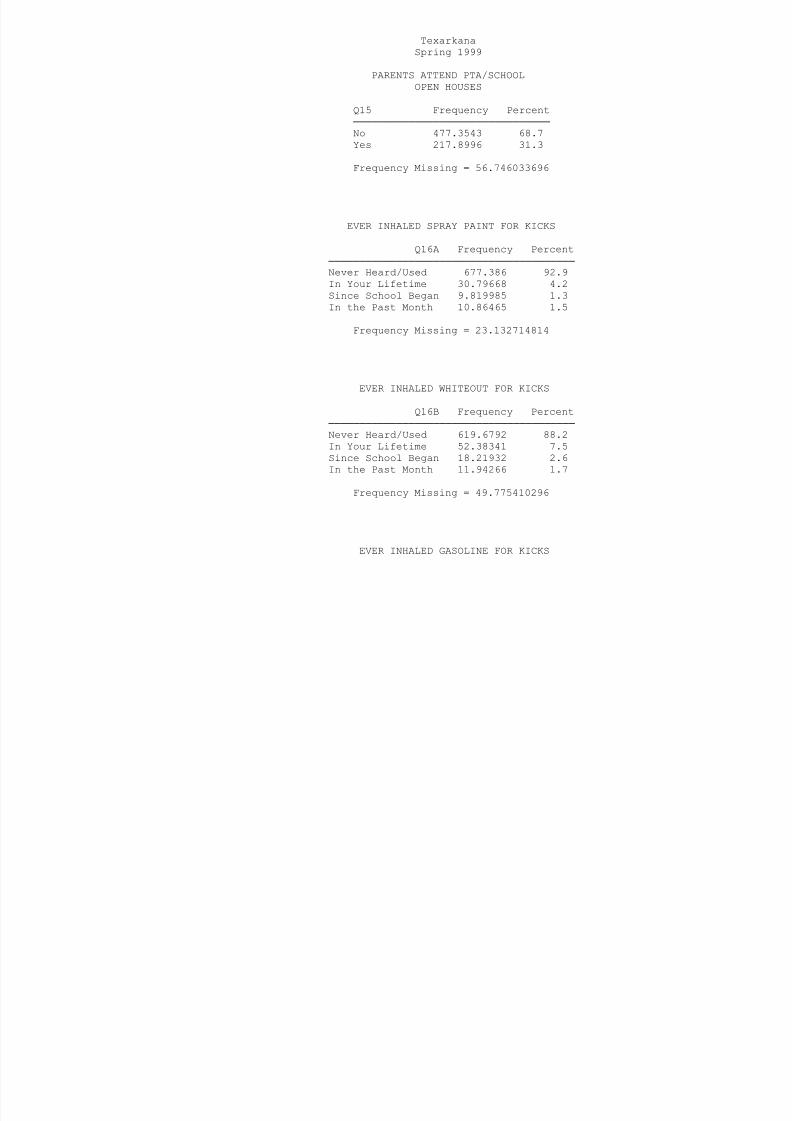
8/14/2019 BOWIE COUNTY - Texarkana ISD - 1999 Texas School Survey of Drug and Alcohol Use
http://slidepdf.com/reader/full/bowie-county-texarkana-isd-1999-texas-school-survey-of-drug-and-alcohol 108/185
OPEN HOUSES
Q15 Frequency Percent
────────────────────────────────
No 477.3543 68.7
Yes 217.8996 31.3
Frequency Missing = 56.746033696
EVER INHALED SPRAY PAINT FOR KICKS
Q16A Frequency Percent
────────────────────────────────────────
Never Heard/Used 677.386 92.9
In Your Lifetime 30.79668 4.2
Since School Began 9.819985 1.3
In the Past Month 10.86465 1.5
Frequency Missing = 23.132714814
EVER INHALED WHITEOUT FOR KICKS
Q16B Frequency Percent
────────────────────────────────────────Never Heard/Used 619.6792 88.2
In Your Lifetime 52.38341 7.5
Since School Began 18.21932 2.6
In the Past Month 11.94266 1.7
Frequency Missing = 49.775410296
EVER INHALED GASOLINE FOR KICKS
Q16C Frequency Percent
────────────────────────────────────────
Never Heard/Used 669.9066 94.3
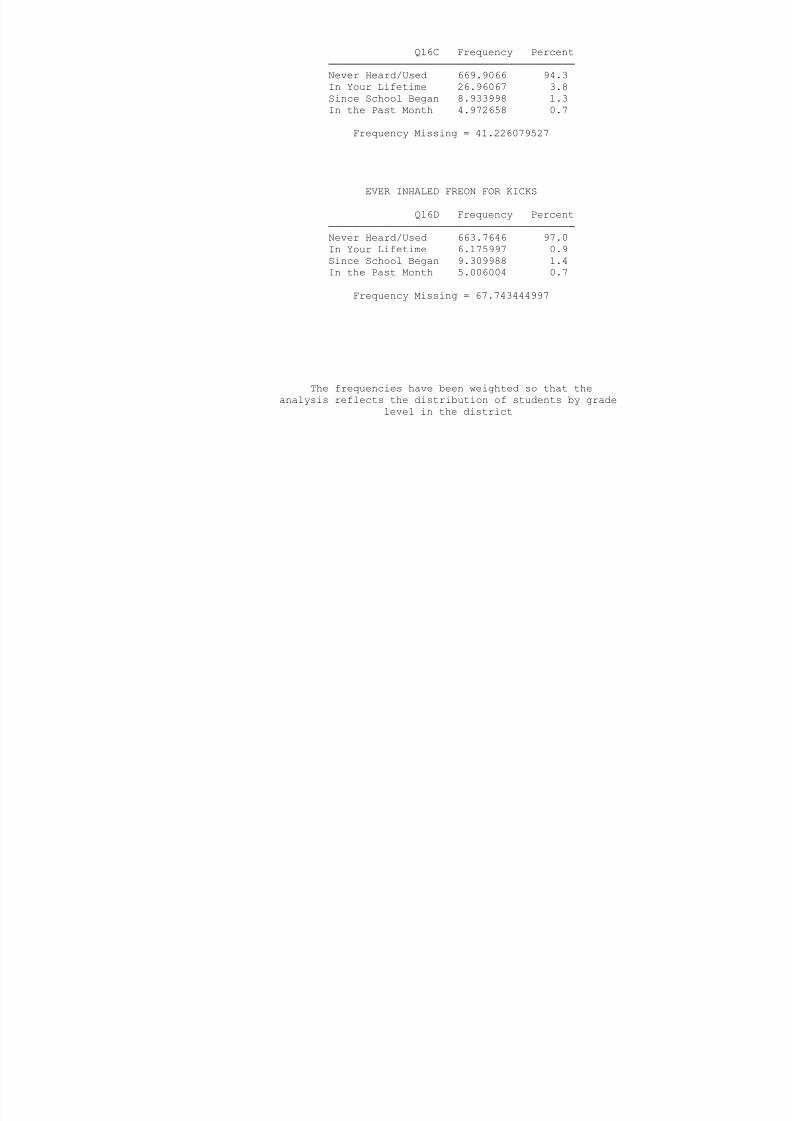
8/14/2019 BOWIE COUNTY - Texarkana ISD - 1999 Texas School Survey of Drug and Alcohol Use
http://slidepdf.com/reader/full/bowie-county-texarkana-isd-1999-texas-school-survey-of-drug-and-alcohol 109/185
In Your Lifetime 26.96067 3.8
Since School Began 8.933998 1.3
In the Past Month 4.972658 0.7
Frequency Missing = 41.226079527
EVER INHALED FREON FOR KICKS
Q16D Frequency Percent
────────────────────────────────────────
Never Heard/Used 663.7646 97.0
In Your Lifetime 6.175997 0.9
Since School Began 9.309988 1.4
In the Past Month 5.006004 0.7
Frequency Missing = 67.743444997
The frequencies have been weighted so that the
analysis reflects the distribution of students by grade
level in the district
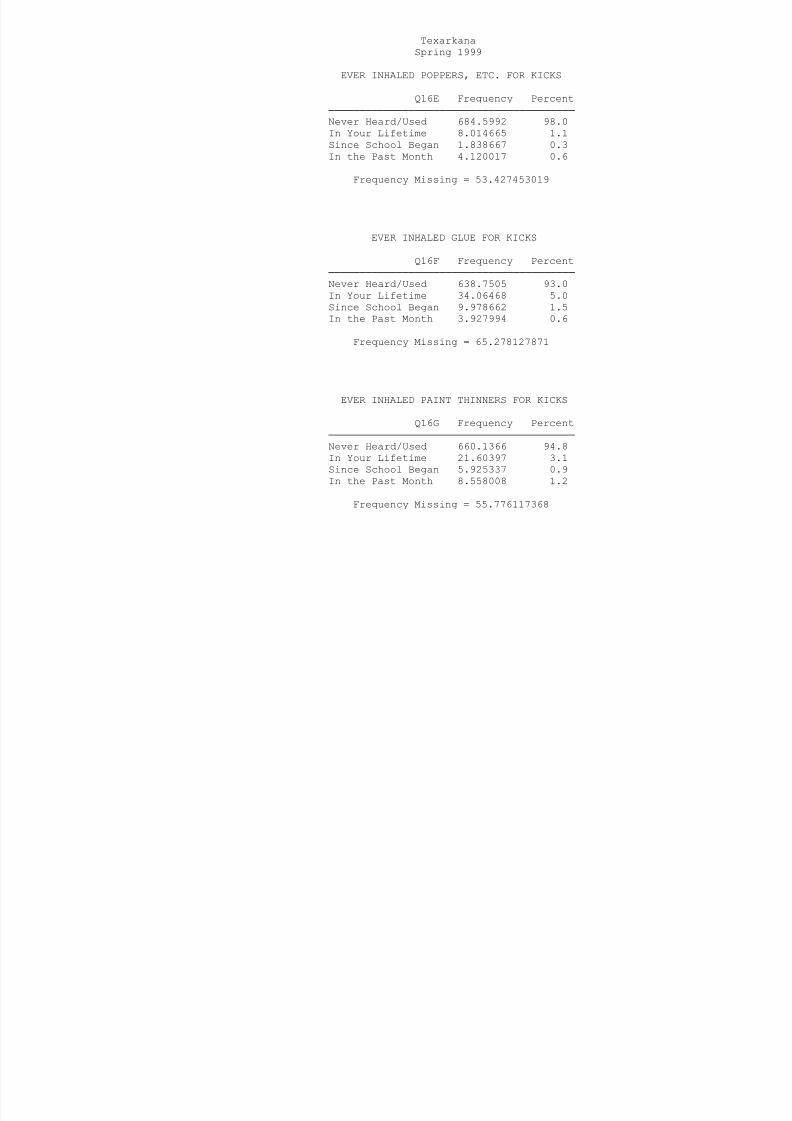
8/14/2019 BOWIE COUNTY - Texarkana ISD - 1999 Texas School Survey of Drug and Alcohol Use
http://slidepdf.com/reader/full/bowie-county-texarkana-isd-1999-texas-school-survey-of-drug-and-alcohol 110/185
EVER INHALED NITROUS OXIDE FOR KICKS
Q16H Frequency Percent
────────────────────────────────────────
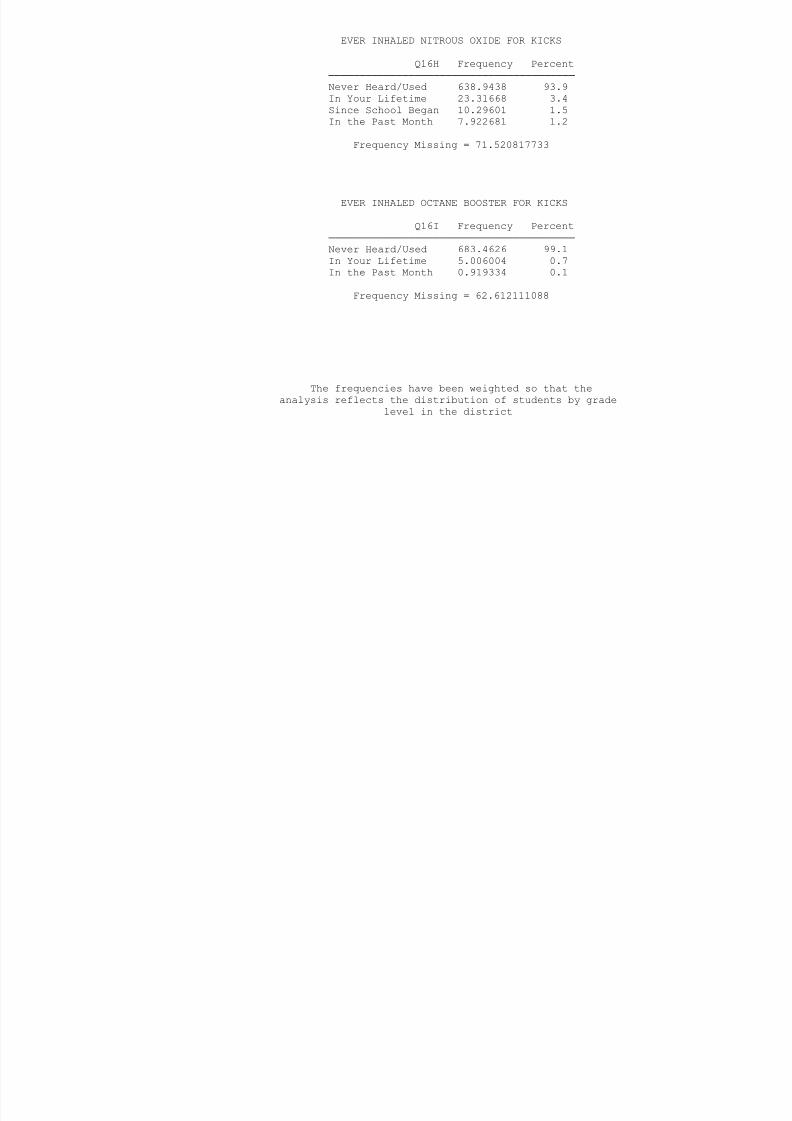
8/14/2019 BOWIE COUNTY - Texarkana ISD - 1999 Texas School Survey of Drug and Alcohol Use
http://slidepdf.com/reader/full/bowie-county-texarkana-isd-1999-texas-school-survey-of-drug-and-alcohol 111/185
Never Heard/Used 638.9438 93.9
In Your Lifetime 23.31668 3.4
Since School Began 10.29601 1.5
In the Past Month 7.922681 1.2
Frequency Missing = 71.520817733
EVER INHALED OCTANE BOOSTER FOR KICKS
Q16I Frequency Percent
────────────────────────────────────────
Never Heard/Used 683.4626 99.1
In Your Lifetime 5.006004 0.7
In the Past Month 0.919334 0.1
Frequency Missing = 62.612111088
The frequencies have been weighted so that the
analysis reflects the distribution of students by grade
level in the district
Texarkana
Spring 1999
EVER INHALED OTHER SPRAYS FOR KICKS
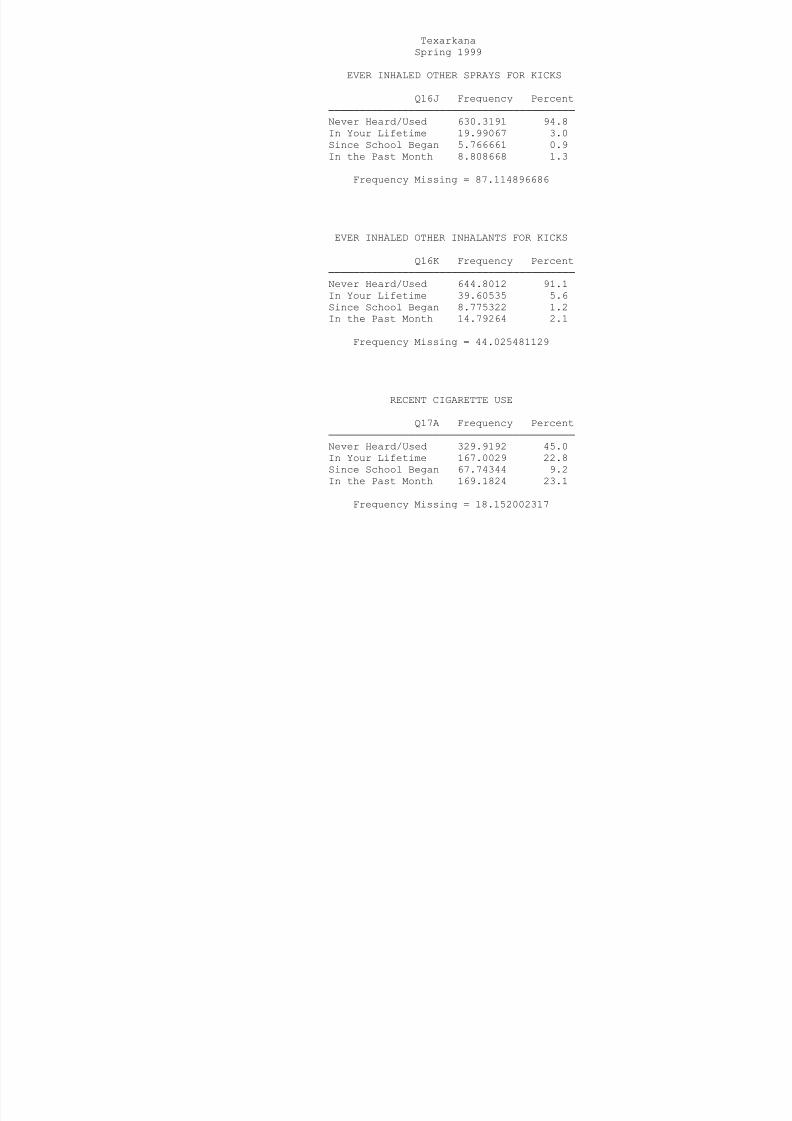
8/14/2019 BOWIE COUNTY - Texarkana ISD - 1999 Texas School Survey of Drug and Alcohol Use
http://slidepdf.com/reader/full/bowie-county-texarkana-isd-1999-texas-school-survey-of-drug-and-alcohol 112/185
Q16J Frequency Percent
────────────────────────────────────────
Never Heard/Used 630.3191 94.8
In Your Lifetime 19.99067 3.0
Since School Began 5.766661 0.9
In the Past Month 8.808668 1.3
Frequency Missing = 87.114896686
EVER INHALED OTHER INHALANTS FOR KICKS
Q16K Frequency Percent
────────────────────────────────────────
Never Heard/Used 644.8012 91.1
In Your Lifetime 39.60535 5.6
Since School Began 8.775322 1.2
In the Past Month 14.79264 2.1
Frequency Missing = 44.025481129
RECENT CIGARETTE USE
Q17A Frequency Percent────────────────────────────────────────
Never Heard/Used 329.9192 45.0
In Your Lifetime 167.0029 22.8
Since School Began 67.74344 9.2
In the Past Month 169.1824 23.1
Frequency Missing = 18.152002317
RECENT SMOKELESS TOBACCO USE
Q17B Frequency Percent
────────────────────────────────────────

8/14/2019 BOWIE COUNTY - Texarkana ISD - 1999 Texas School Survey of Drug and Alcohol Use
http://slidepdf.com/reader/full/bowie-county-texarkana-isd-1999-texas-school-survey-of-drug-and-alcohol 113/185
Never Heard/Used 616.9645 85.5
In Your Lifetime 55.09877 7.6
Since School Began 17.42469 2.4
In the Past Month 32.5094 4.5
Frequency Missing = 30.002677169
RECENT BEER USE
Q17C Frequency Percent
────────────────────────────────────────
Never Heard/Used 300.0598 41.3
In Your Lifetime 136.9502 18.8
Since School Began 83.36282 11.5
In the Past Month 206.3131 28.4
Frequency Missing = 25.314025709
The frequencies have been weighted so that the
analysis reflects the distribution of students by grade
level in the district
Texarkana
Spring 1999
RECENT WINE COOLER USE
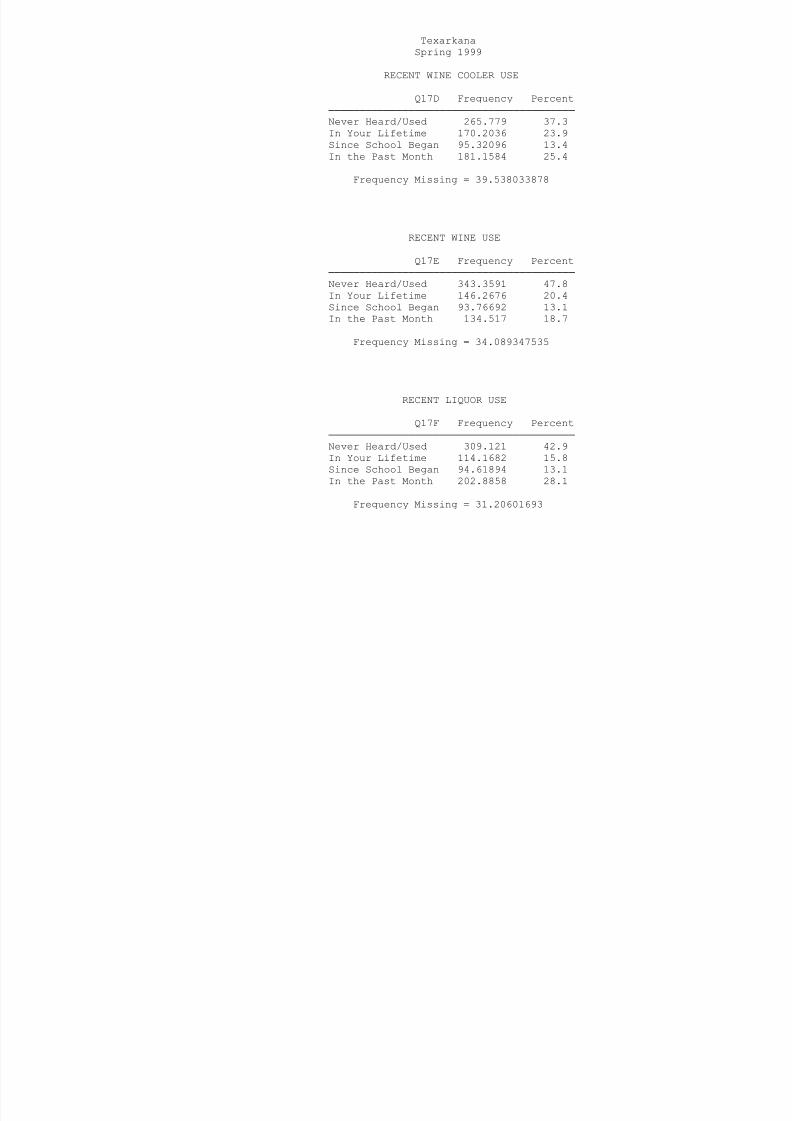
8/14/2019 BOWIE COUNTY - Texarkana ISD - 1999 Texas School Survey of Drug and Alcohol Use
http://slidepdf.com/reader/full/bowie-county-texarkana-isd-1999-texas-school-survey-of-drug-and-alcohol 114/185
Q17D Frequency Percent
────────────────────────────────────────
Never Heard/Used 265.779 37.3
In Your Lifetime 170.2036 23.9
Since School Began 95.32096 13.4
In the Past Month 181.1584 25.4
Frequency Missing = 39.538033878
RECENT WINE USE
Q17E Frequency Percent
────────────────────────────────────────
Never Heard/Used 343.3591 47.8
In Your Lifetime 146.2676 20.4
Since School Began 93.76692 13.1
In the Past Month 134.517 18.7
Frequency Missing = 34.089347535
RECENT LIQUOR USE
Q17F Frequency Percent────────────────────────────────────────
Never Heard/Used 309.121 42.9
In Your Lifetime 114.1682 15.8
Since School Began 94.61894 13.1
In the Past Month 202.8858 28.1
Frequency Missing = 31.20601693
RECENT MARIJUANA USE
Q18A Frequency Percent
────────────────────────────────────────
N H d/U d 459 734 62 6
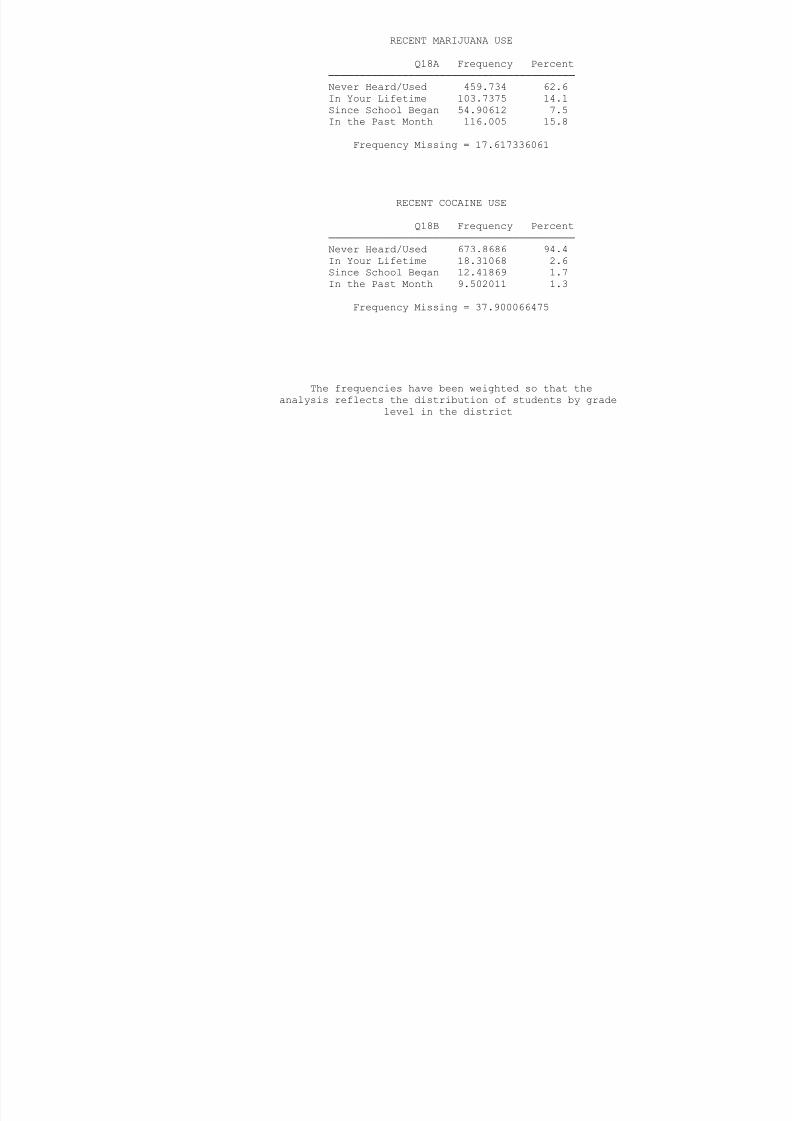
8/14/2019 BOWIE COUNTY - Texarkana ISD - 1999 Texas School Survey of Drug and Alcohol Use
http://slidepdf.com/reader/full/bowie-county-texarkana-isd-1999-texas-school-survey-of-drug-and-alcohol 115/185
Never Heard/Used 459.734 62.6
In Your Lifetime 103.7375 14.1
Since School Began 54.90612 7.5
In the Past Month 116.005 15.8
Frequency Missing = 17.617336061
RECENT COCAINE USE
Q18B Frequency Percent
────────────────────────────────────────
Never Heard/Used 673.8686 94.4
In Your Lifetime 18.31068 2.6
Since School Began 12.41869 1.7
In the Past Month 9.502011 1.3
Frequency Missing = 37.900066475
The frequencies have been weighted so that the
analysis reflects the distribution of students by grade
level in the district
Texarkana
Spring 1999
RECENT CRACK USE
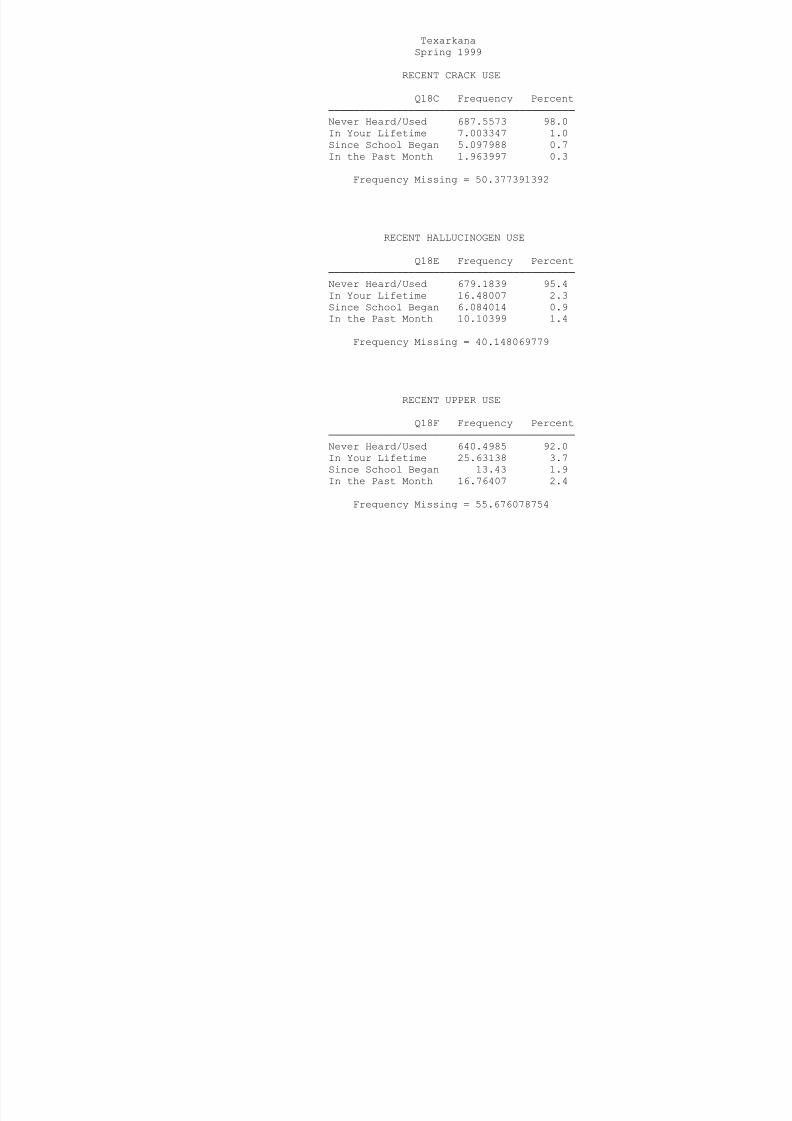
8/14/2019 BOWIE COUNTY - Texarkana ISD - 1999 Texas School Survey of Drug and Alcohol Use
http://slidepdf.com/reader/full/bowie-county-texarkana-isd-1999-texas-school-survey-of-drug-and-alcohol 116/185
Q18C Frequency Percent
────────────────────────────────────────
Never Heard/Used 687.5573 98.0
In Your Lifetime 7.003347 1.0
Since School Began 5.097988 0.7
In the Past Month 1.963997 0.3
Frequency Missing = 50.377391392
RECENT HALLUCINOGEN USE
Q18E Frequency Percent
────────────────────────────────────────
Never Heard/Used 679.1839 95.4
In Your Lifetime 16.48007 2.3
Since School Began 6.084014 0.9
In the Past Month 10.10399 1.4
Frequency Missing = 40.148069779
RECENT UPPER USE
Q18F Frequency Percent────────────────────────────────────────
Never Heard/Used 640.4985 92.0
In Your Lifetime 25.63138 3.7
Since School Began 13.43 1.9
In the Past Month 16.76407 2.4
Frequency Missing = 55.676078754
RECENT DOWNER USE
Q18G Frequency Percent
────────────────────────────────────────
Never Heard/Used 660 8479 93 9
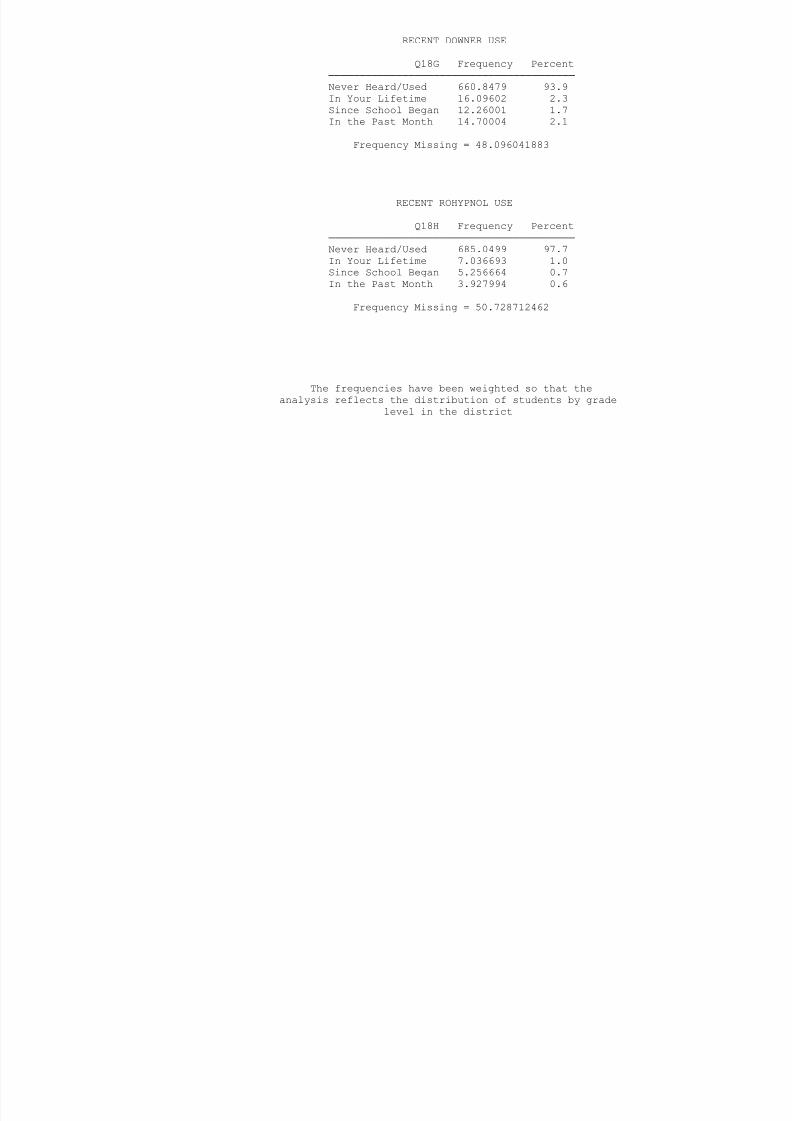
8/14/2019 BOWIE COUNTY - Texarkana ISD - 1999 Texas School Survey of Drug and Alcohol Use
http://slidepdf.com/reader/full/bowie-county-texarkana-isd-1999-texas-school-survey-of-drug-and-alcohol 117/185
Never Heard/Used 660.8479 93.9
In Your Lifetime 16.09602 2.3
Since School Began 12.26001 1.7
In the Past Month 14.70004 2.1
Frequency Missing = 48.096041883
RECENT ROHYPNOL USE
Q18H Frequency Percent
────────────────────────────────────────
Never Heard/Used 685.0499 97.7
In Your Lifetime 7.036693 1.0
Since School Began 5.256664 0.7
In the Past Month 3.927994 0.6
Frequency Missing = 50.728712462
The frequencies have been weighted so that the
analysis reflects the distribution of students by grade
level in the district
Texarkana
Spring 1999
RECENT STEROID USE
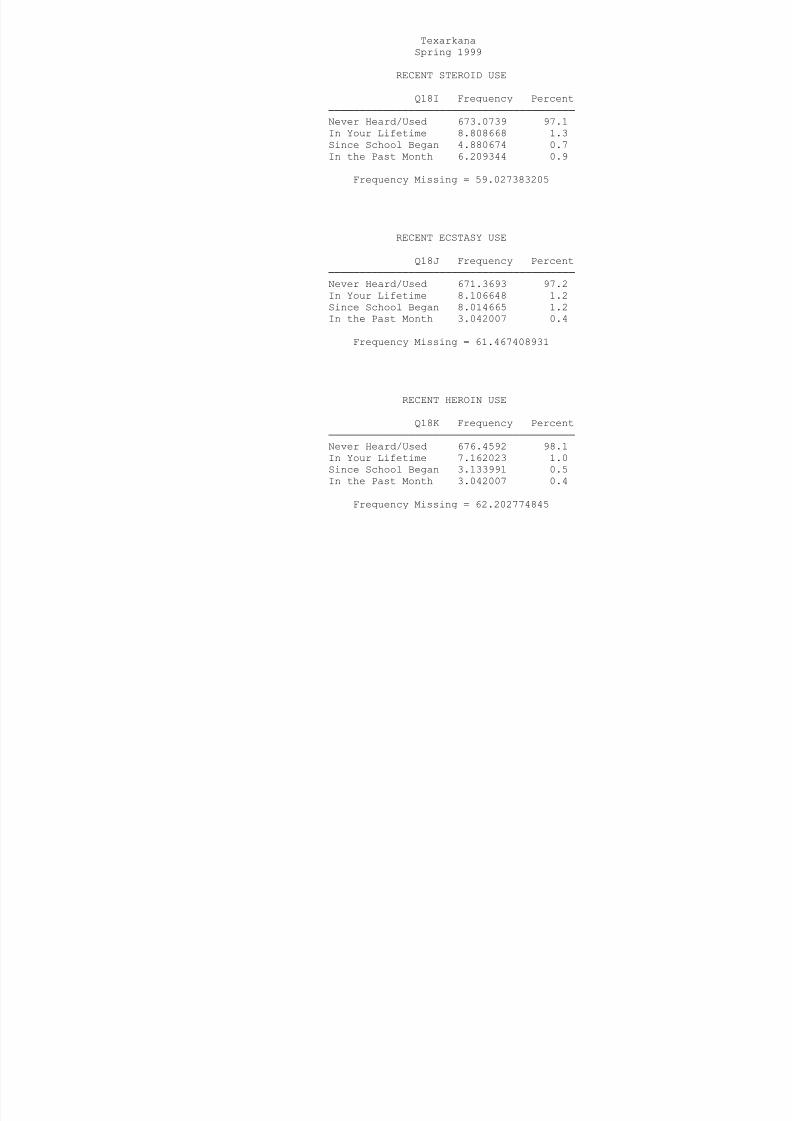
8/14/2019 BOWIE COUNTY - Texarkana ISD - 1999 Texas School Survey of Drug and Alcohol Use
http://slidepdf.com/reader/full/bowie-county-texarkana-isd-1999-texas-school-survey-of-drug-and-alcohol 118/185
Q18I Frequency Percent
────────────────────────────────────────
Never Heard/Used 673.0739 97.1
In Your Lifetime 8.808668 1.3
Since School Began 4.880674 0.7
In the Past Month 6.209344 0.9
Frequency Missing = 59.027383205
RECENT ECSTASY USE
Q18J Frequency Percent
────────────────────────────────────────
Never Heard/Used 671.3693 97.2
In Your Lifetime 8.106648 1.2
Since School Began 8.014665 1.2
In the Past Month 3.042007 0.4
Frequency Missing = 61.467408931
RECENT HEROIN USE
Q18K Frequency Percent────────────────────────────────────────
Never Heard/Used 676.4592 98.1
In Your Lifetime 7.162023 1.0
Since School Began 3.133991 0.5
In the Past Month 3.042007 0.4
Frequency Missing = 62.202774845
TOBACCO USE IN PAST MONTH
Q19A Frequency Percent
──────────────────────────────────────
Never Heard/Used 520 3981 72 9
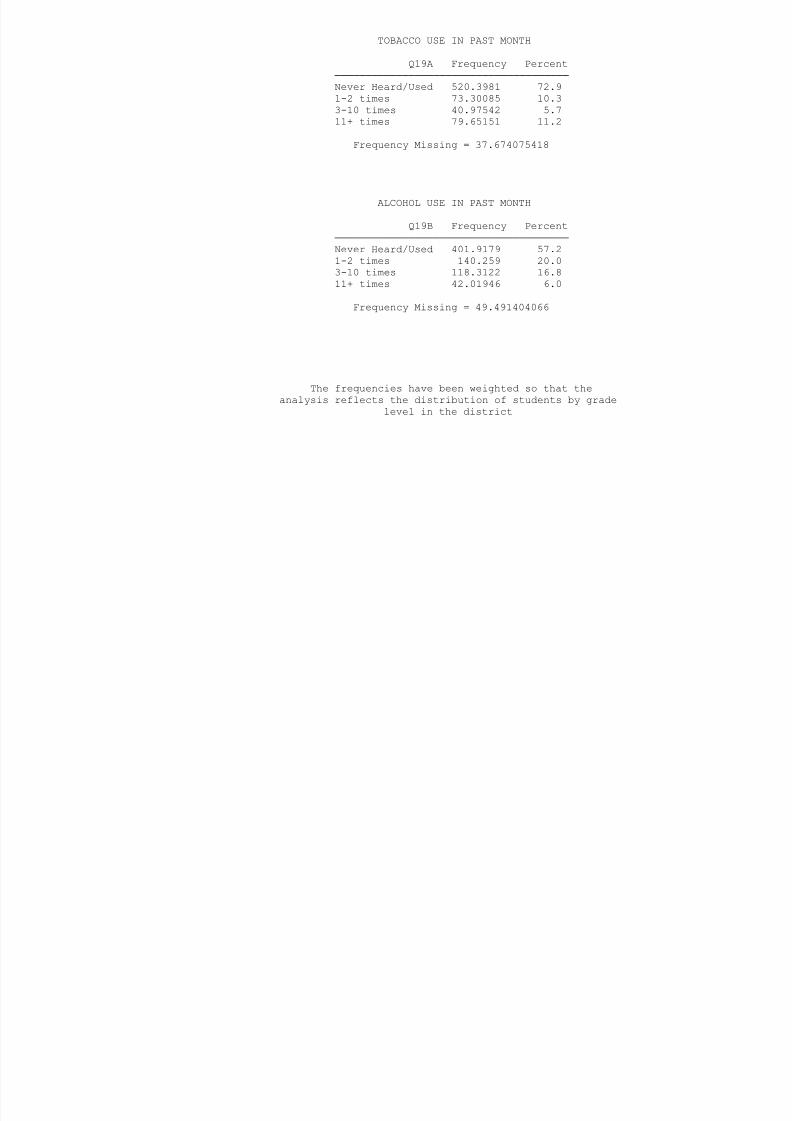
8/14/2019 BOWIE COUNTY - Texarkana ISD - 1999 Texas School Survey of Drug and Alcohol Use
http://slidepdf.com/reader/full/bowie-county-texarkana-isd-1999-texas-school-survey-of-drug-and-alcohol 119/185
Never Heard/Used 520.3981 72.9
1-2 times 73.30085 10.3
3-10 times 40.97542 5.7
11+ times 79.65151 11.2
Frequency Missing = 37.674075418
ALCOHOL USE IN PAST MONTH
Q19B Frequency Percent
──────────────────────────────────────
Never Heard/Used 401.9179 57.2
1-2 times 140.259 20.0
3-10 times 118.3122 16.8
11+ times 42.01946 6.0
Frequency Missing = 49.491404066
The frequencies have been weighted so that the
analysis reflects the distribution of students by grade
level in the district
Texarkana
Spring 1999
INHALANT USE IN PAST MONTH
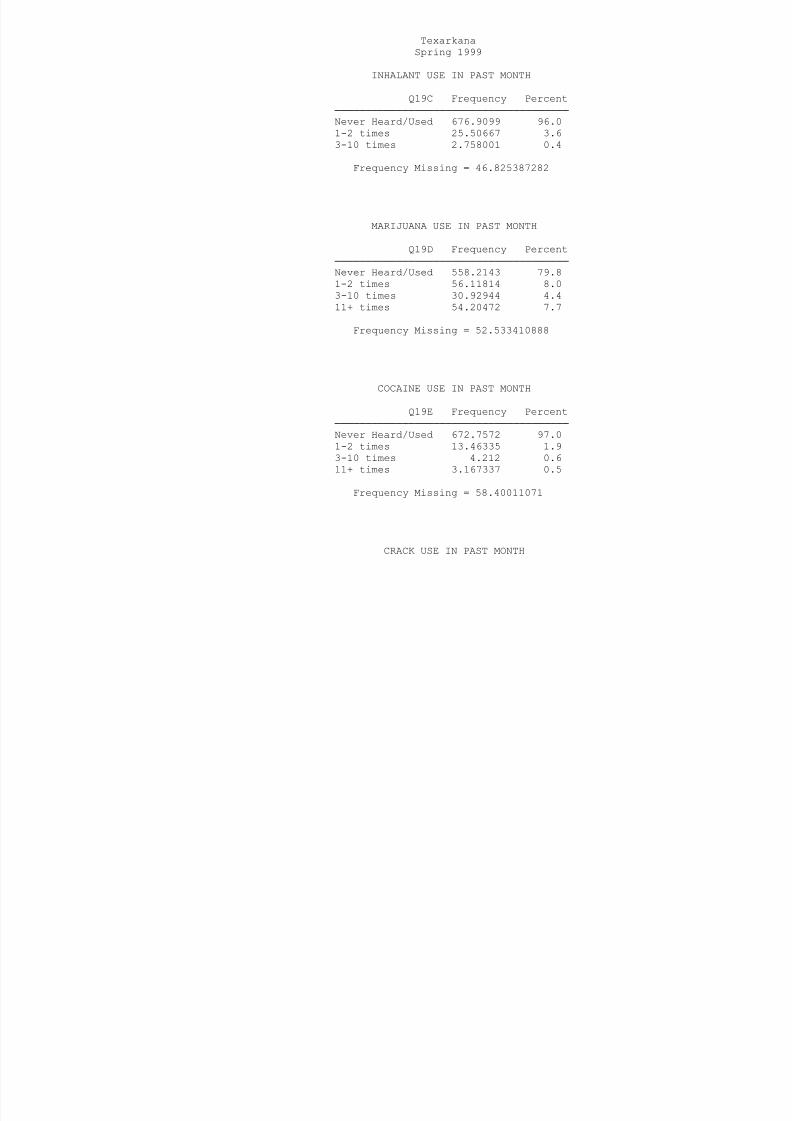
8/14/2019 BOWIE COUNTY - Texarkana ISD - 1999 Texas School Survey of Drug and Alcohol Use
http://slidepdf.com/reader/full/bowie-county-texarkana-isd-1999-texas-school-survey-of-drug-and-alcohol 120/185
Q19C Frequency Percent
──────────────────────────────────────
Never Heard/Used 676.9099 96.0
1-2 times 25.50667 3.6
3-10 times 2.758001 0.4
Frequency Missing = 46.825387282
MARIJUANA USE IN PAST MONTH
Q19D Frequency Percent
──────────────────────────────────────
Never Heard/Used 558.2143 79.8
1-2 times 56.11814 8.0
3-10 times 30.92944 4.4
11+ times 54.20472 7.7
Frequency Missing = 52.533410888
COCAINE USE IN PAST MONTH
Q19E Frequency Percent
──────────────────────────────────────Never Heard/Used 672.7572 97.0
1-2 times 13.46335 1.9
3-10 times 4.212 0.6
11+ times 3.167337 0.5
Frequency Missing = 58.40011071
CRACK USE IN PAST MONTH
Q19F Frequency Percent
──────────────────────────────────────
Never Heard/Used 689.8639 99.0
1-2 times 4.847328 0.7
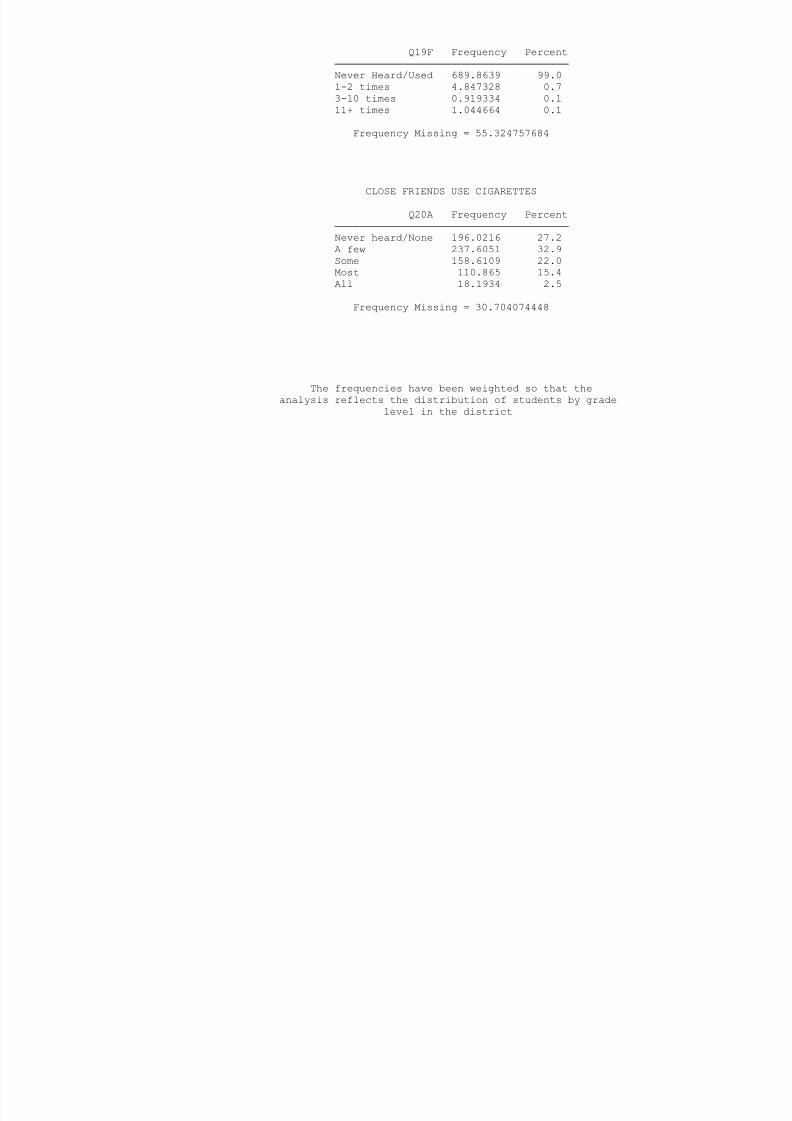
8/14/2019 BOWIE COUNTY - Texarkana ISD - 1999 Texas School Survey of Drug and Alcohol Use
http://slidepdf.com/reader/full/bowie-county-texarkana-isd-1999-texas-school-survey-of-drug-and-alcohol 121/185
1 2 times 4.847328 0.7
3-10 times 0.919334 0.1
11+ times 1.044664 0.1
Frequency Missing = 55.324757684
CLOSE FRIENDS USE CIGARETTES
Q20A Frequency Percent
──────────────────────────────────────
Never heard/None 196.0216 27.2
A few 237.6051 32.9
Some 158.6109 22.0
Most 110.865 15.4
All 18.1934 2.5
Frequency Missing = 30.704074448
The frequencies have been weighted so that the
analysis reflects the distribution of students by grade
level in the district
Texarkana
Spring 1999
CLOSE FRIENDS USE SMOKELESS TOBACCO
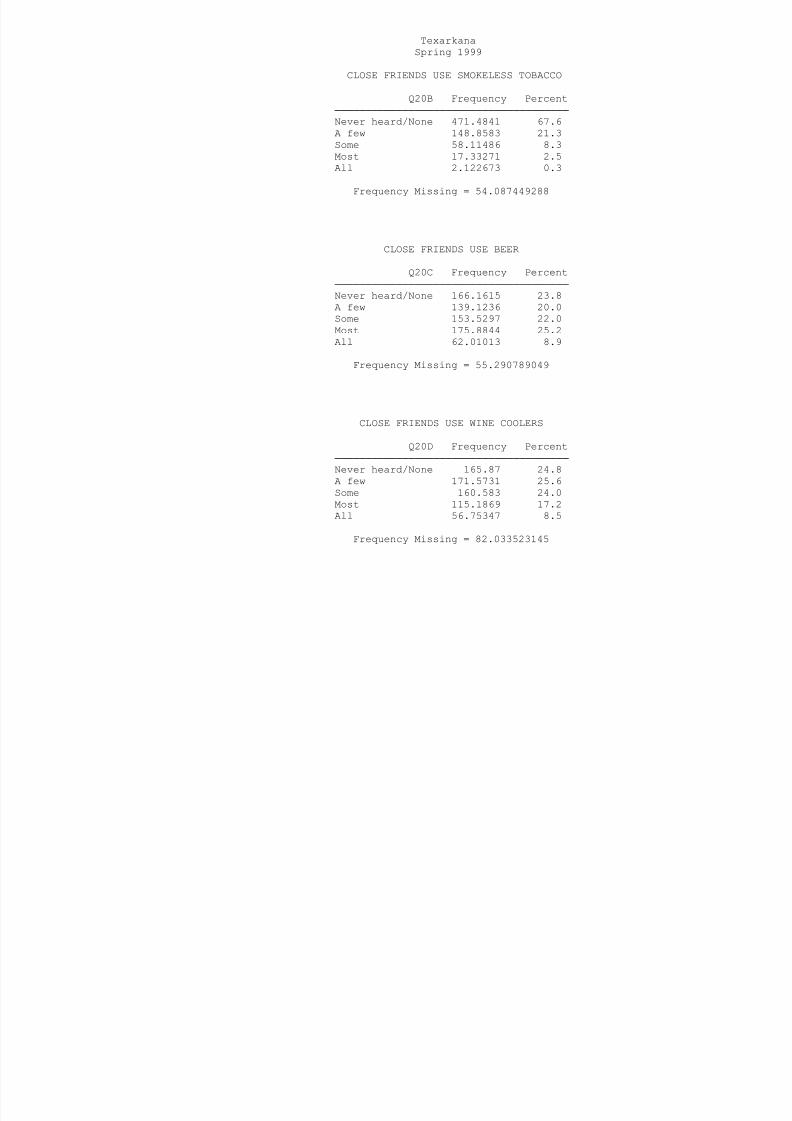
8/14/2019 BOWIE COUNTY - Texarkana ISD - 1999 Texas School Survey of Drug and Alcohol Use
http://slidepdf.com/reader/full/bowie-county-texarkana-isd-1999-texas-school-survey-of-drug-and-alcohol 122/185
Q20B Frequency Percent
──────────────────────────────────────
Never heard/None 471.4841 67.6
A few 148.8583 21.3
Some 58.11486 8.3
Most 17.33271 2.5All 2.122673 0.3
Frequency Missing = 54.087449288
CLOSE FRIENDS USE BEER
Q20C Frequency Percent
──────────────────────────────────────
Never heard/None 166.1615 23.8
A few 139.1236 20.0
Some 153.5297 22.0
Most 175.8844 25.2
All 62.01013 8.9
Frequency Missing = 55.290789049
CLOSE FRIENDS USE WINE COOLERS
Q20D Frequency Percent
──────────────────────────────────────
Never heard/None 165.87 24.8
A few 171.5731 25.6
Some 160.583 24.0
Most 115.1869 17.2
All 56.75347 8.5
Frequency Missing = 82.033523145
CLOSE FRIENDS USE WINE
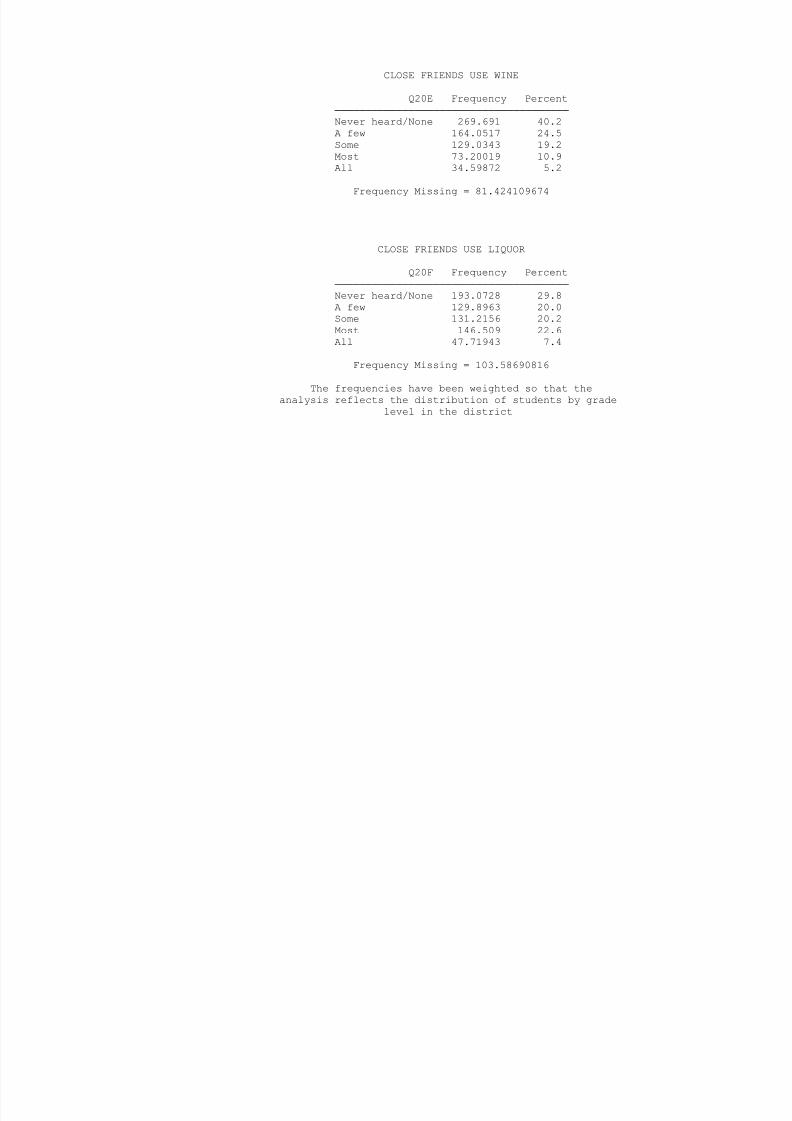
8/14/2019 BOWIE COUNTY - Texarkana ISD - 1999 Texas School Survey of Drug and Alcohol Use
http://slidepdf.com/reader/full/bowie-county-texarkana-isd-1999-texas-school-survey-of-drug-and-alcohol 123/185
Q20E Frequency Percent
──────────────────────────────────────
Never heard/None 269.691 40.2
A few 164.0517 24.5
Some 129.0343 19.2
Most 73.20019 10.9All 34.59872 5.2
Frequency Missing = 81.424109674
CLOSE FRIENDS USE LIQUOR
Q20F Frequency Percent
──────────────────────────────────────
Never heard/None 193.0728 29.8
A few 129.8963 20.0
Some 131.2156 20.2
Most 146.509 22.6
All 47.71943 7.4
Frequency Missing = 103.58690816
The frequencies have been weighted so that the
analysis reflects the distribution of students by grade
level in the district
Texarkana
Spring 1999
CLOSE FRIENDS USE INHALANTS
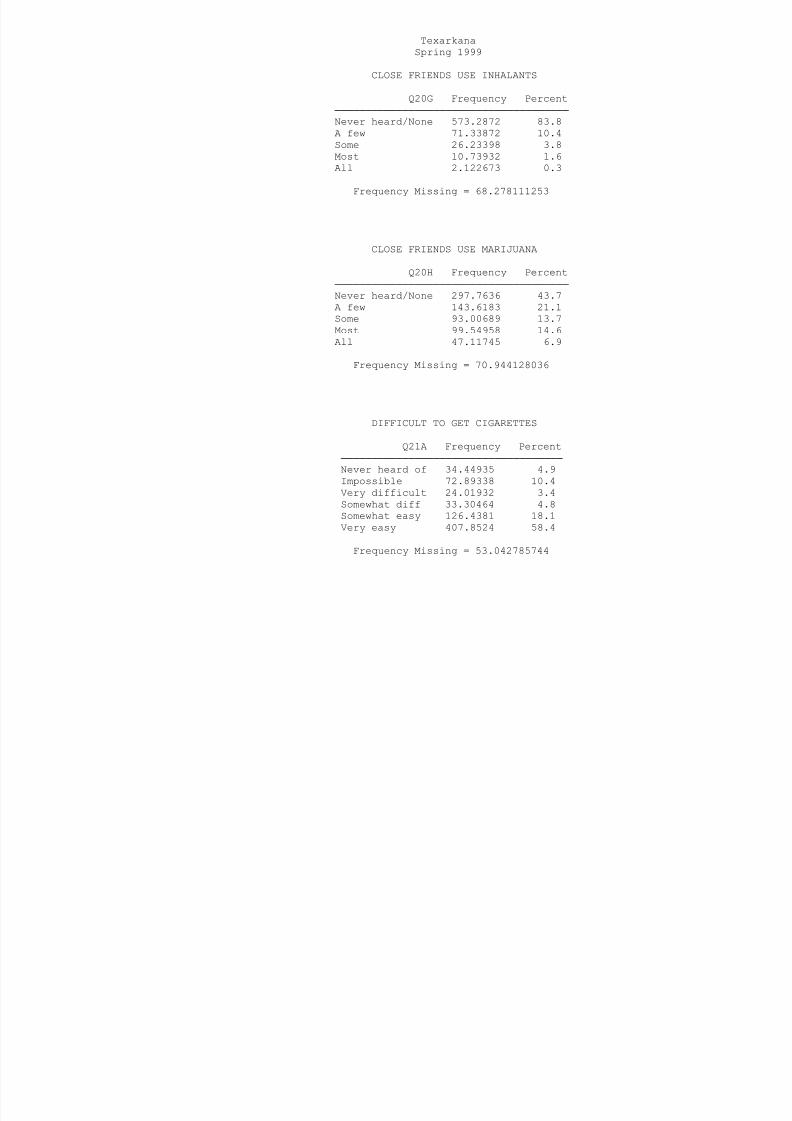
8/14/2019 BOWIE COUNTY - Texarkana ISD - 1999 Texas School Survey of Drug and Alcohol Use
http://slidepdf.com/reader/full/bowie-county-texarkana-isd-1999-texas-school-survey-of-drug-and-alcohol 124/185
Q20G Frequency Percent
──────────────────────────────────────
Never heard/None 573.2872 83.8
A few 71.33872 10.4
Some 26.23398 3.8
Most 10.73932 1.6All 2.122673 0.3
Frequency Missing = 68.278111253
CLOSE FRIENDS USE MARIJUANA
Q20H Frequency Percent
──────────────────────────────────────
Never heard/None 297.7636 43.7
A few 143.6183 21.1
Some 93.00689 13.7
Most 99.54958 14.6
All 47.11745 6.9
Frequency Missing = 70.944128036
DIFFICULT TO GET CIGARETTES
Q21A Frequency Percent
────────────────────────────────────
Never heard of 34.44935 4.9
Impossible 72.89338 10.4
Very difficult 24.01932 3.4
Somewhat diff 33.30464 4.8
Somewhat easy 126.4381 18.1
Very easy 407.8524 58.4
Frequency Missing = 53.042785744
DIFFICULT TO GET SMOKELESS TOBACCO
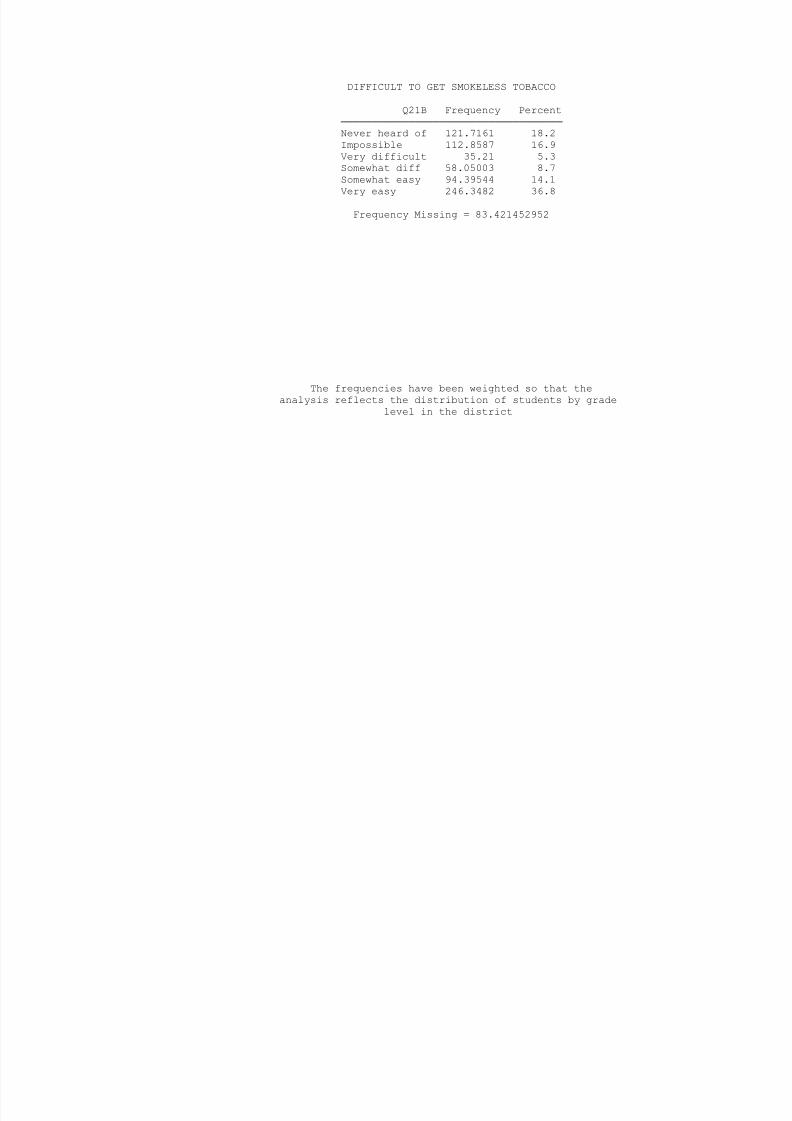
8/14/2019 BOWIE COUNTY - Texarkana ISD - 1999 Texas School Survey of Drug and Alcohol Use
http://slidepdf.com/reader/full/bowie-county-texarkana-isd-1999-texas-school-survey-of-drug-and-alcohol 125/185
Q21B Frequency Percent
────────────────────────────────────
Never heard of 121.7161 18.2
Impossible 112.8587 16.9
Very difficult 35.21 5.3Somewhat diff 58.05003 8.7
Somewhat easy 94.39544 14.1
Very easy 246.3482 36.8
Frequency Missing = 83.421452952
The frequencies have been weighted so that the
analysis reflects the distribution of students by grade
level in the district
Texarkana
Spring 1999
DIFFICULT TO GET BEER
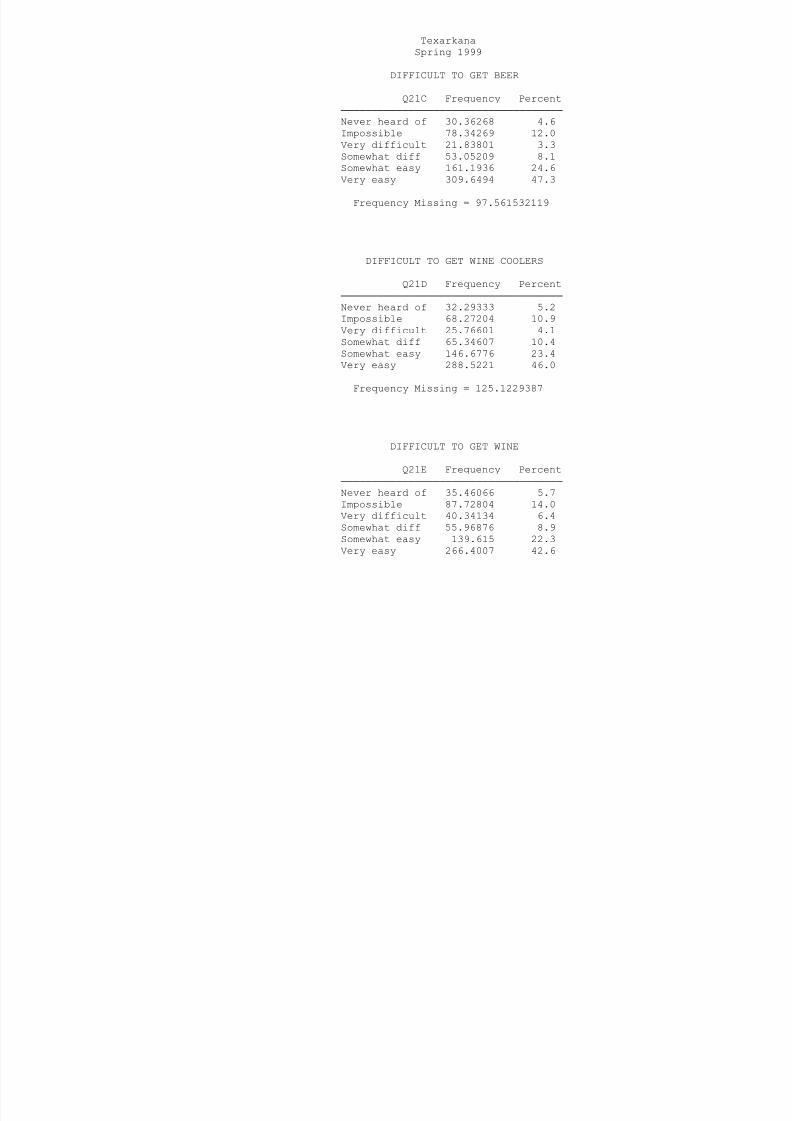
8/14/2019 BOWIE COUNTY - Texarkana ISD - 1999 Texas School Survey of Drug and Alcohol Use
http://slidepdf.com/reader/full/bowie-county-texarkana-isd-1999-texas-school-survey-of-drug-and-alcohol 126/185
Q21C Frequency Percent
────────────────────────────────────
Never heard of 30.36268 4.6
Impossible 78.34269 12.0
Very difficult 21.83801 3.3
Somewhat diff 53.05209 8.1Somewhat easy 161.1936 24.6
Very easy 309.6494 47.3
Frequency Missing = 97.561532119
DIFFICULT TO GET WINE COOLERS
Q21D Frequency Percent
────────────────────────────────────
Never heard of 32.29333 5.2
Impossible 68.27204 10.9
Very difficult 25.76601 4.1
Somewhat diff 65.34607 10.4
Somewhat easy 146.6776 23.4
Very easy 288.5221 46.0
Frequency Missing = 125.1229387
DIFFICULT TO GET WINE
Q21E Frequency Percent
────────────────────────────────────
Never heard of 35.46066 5.7
Impossible 87.72804 14.0
Very difficult 40.34134 6.4
Somewhat diff 55.96876 8.9
Somewhat easy 139.615 22.3
Very easy 266.4007 42.6
Frequency Missing = 126.48557711
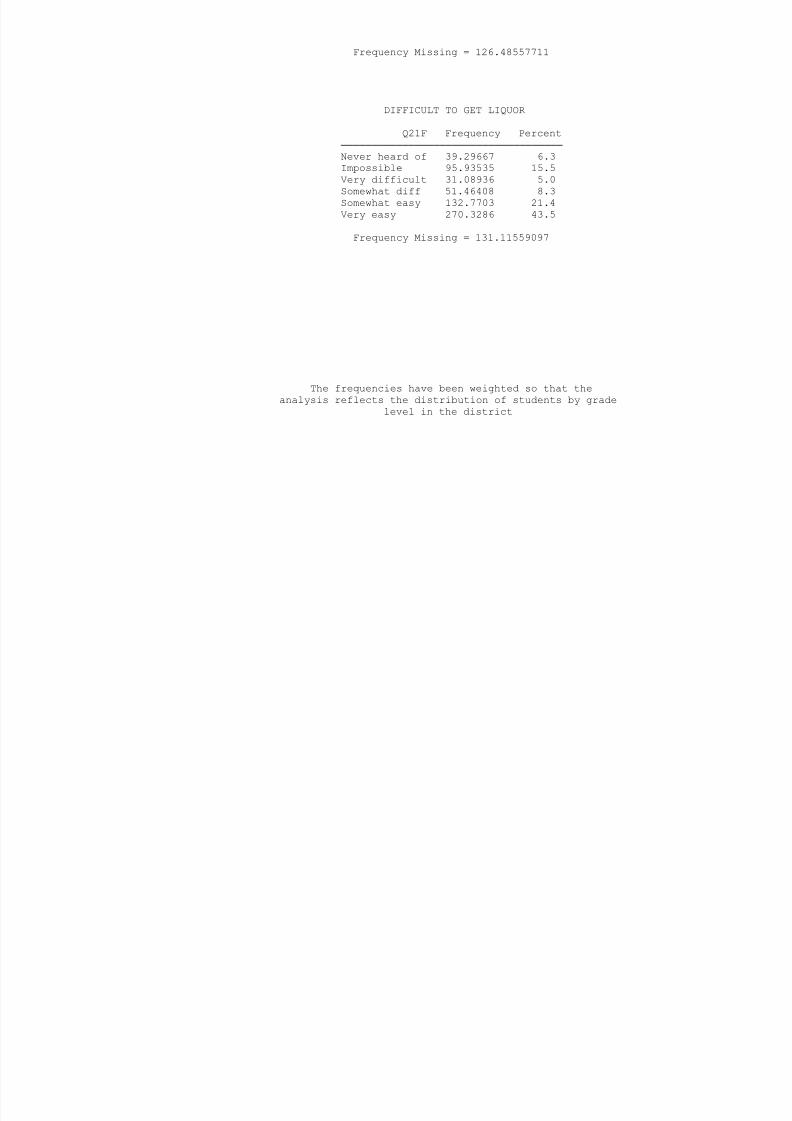
8/14/2019 BOWIE COUNTY - Texarkana ISD - 1999 Texas School Survey of Drug and Alcohol Use
http://slidepdf.com/reader/full/bowie-county-texarkana-isd-1999-texas-school-survey-of-drug-and-alcohol 127/185
DIFFICULT TO GET LIQUOR
Q21F Frequency Percent
────────────────────────────────────
Never heard of 39.29667 6.3Impossible 95.93535 15.5
Very difficult 31.08936 5.0
Somewhat diff 51.46408 8.3
Somewhat easy 132.7703 21.4
Very easy 270.3286 43.5
Frequency Missing = 131.11559097
The frequencies have been weighted so that the
analysis reflects the distribution of students by grade
level in the district

8/14/2019 BOWIE COUNTY - Texarkana ISD - 1999 Texas School Survey of Drug and Alcohol Use
http://slidepdf.com/reader/full/bowie-county-texarkana-isd-1999-texas-school-survey-of-drug-and-alcohol 128/185
Frequency Missing = 108.20886721
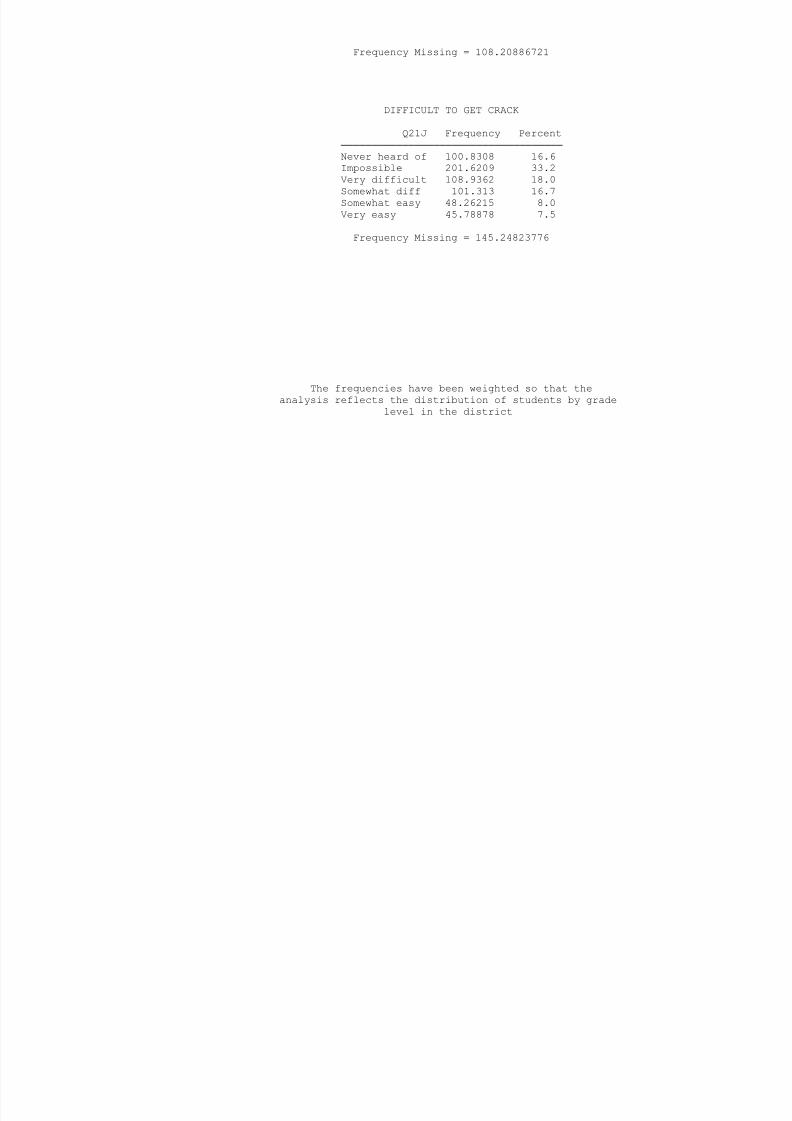
8/14/2019 BOWIE COUNTY - Texarkana ISD - 1999 Texas School Survey of Drug and Alcohol Use
http://slidepdf.com/reader/full/bowie-county-texarkana-isd-1999-texas-school-survey-of-drug-and-alcohol 129/185
DIFFICULT TO GET CRACK
Q21J Frequency Percent
────────────────────────────────────
Never heard of 100.8308 16.6Impossible 201.6209 33.2
Very difficult 108.9362 18.0
Somewhat diff 101.313 16.7
Somewhat easy 48.26215 8.0
Very easy 45.78878 7.5
Frequency Missing = 145.24823776
The frequencies have been weighted so that the
analysis reflects the distribution of students by grade
level in the district
Texarkana
Spring 1999
DIFFICULT TO GET HALLUCINOGENS
Q21L F P t
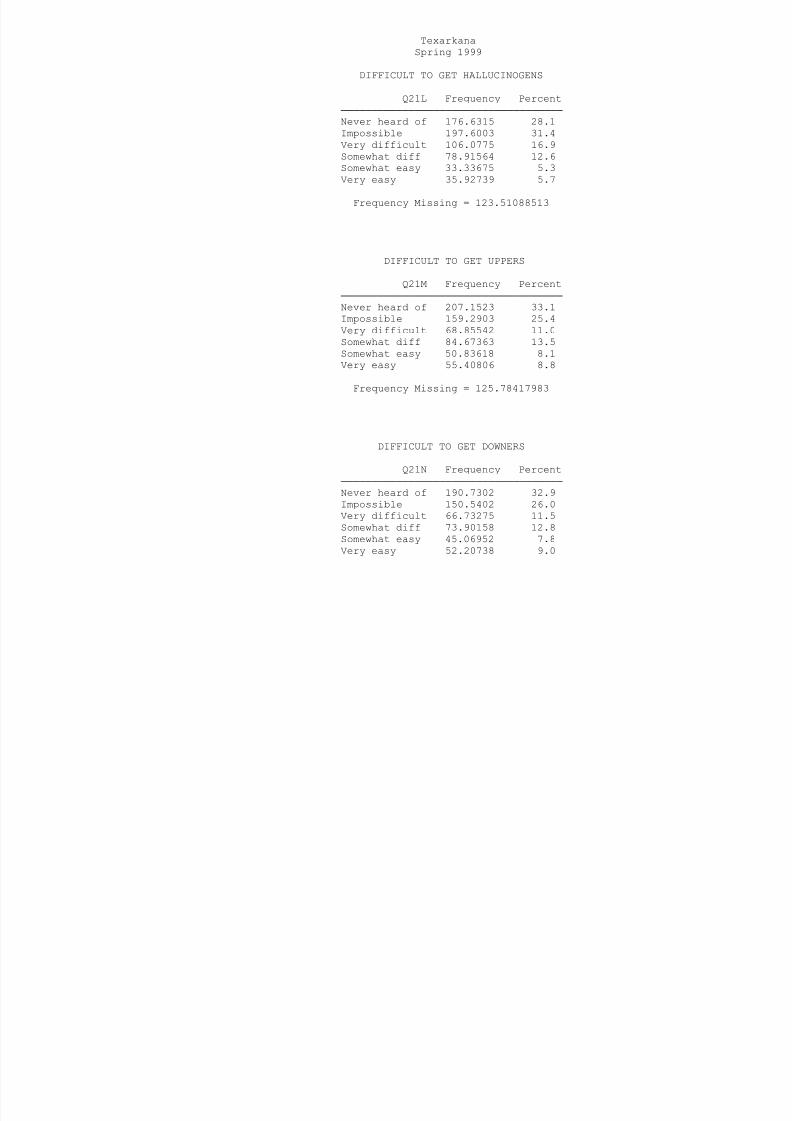
8/14/2019 BOWIE COUNTY - Texarkana ISD - 1999 Texas School Survey of Drug and Alcohol Use
http://slidepdf.com/reader/full/bowie-county-texarkana-isd-1999-texas-school-survey-of-drug-and-alcohol 130/185
Q21L Frequency Percent
────────────────────────────────────
Never heard of 176.6315 28.1
Impossible 197.6003 31.4
Very difficult 106.0775 16.9
Somewhat diff 78.91564 12.6Somewhat easy 33.33675 5.3
Very easy 35.92739 5.7
Frequency Missing = 123.51088513
DIFFICULT TO GET UPPERS
Q21M Frequency Percent
────────────────────────────────────Never heard of 207.1523 33.1
Impossible 159.2903 25.4
Very difficult 68.85542 11.0
Somewhat diff 84.67363 13.5
Somewhat easy 50.83618 8.1
Very easy 55.40806 8.8
Frequency Missing = 125.78417983
DIFFICULT TO GET DOWNERS
Q21N Frequency Percent
────────────────────────────────────
Never heard of 190.7302 32.9
Impossible 150.5402 26.0
Very difficult 66.73275 11.5
Somewhat diff 73.90158 12.8
Somewhat easy 45.06952 7.8
Very easy 52.20738 9.0
Frequency Missing = 172.81832158

8/14/2019 BOWIE COUNTY - Texarkana ISD - 1999 Texas School Survey of Drug and Alcohol Use
http://slidepdf.com/reader/full/bowie-county-texarkana-isd-1999-texas-school-survey-of-drug-and-alcohol 131/185
DIFFICULT TO GET ROHYPNOL
Q21O Frequency Percent
────────────────────────────────────
Never heard of 313.2125 49.8Impossible 128.2009 20.4
Very difficult 65.07805 10.4
Somewhat diff 56.4102 9.0
Somewhat easy 26.10803 4.2
Very easy 39.32072 6.3
Frequency Missing = 123.66956135
The frequencies have been weighted so that the
analysis reflects the distribution of students by grade
level in the district
Texarkana
Spring 1999
DIFFICULT TO GET STEROIDS
Q21P Frequency Percent

8/14/2019 BOWIE COUNTY - Texarkana ISD - 1999 Texas School Survey of Drug and Alcohol Use
http://slidepdf.com/reader/full/bowie-county-texarkana-isd-1999-texas-school-survey-of-drug-and-alcohol 132/185
Q21P Frequency Percent
────────────────────────────────────
Never heard of 119.8774 19.4
Impossible 196.7729 31.8
Very difficult 92.7902 15.0
Somewhat diff 91.30098 14.7Somewhat easy 60.83208 9.8
Very easy 57.78945 9.3
Frequency Missing = 132.63690559
DIFFICULT TO GET ECSTASY
Q21Q Frequency Percent
────────────────────────────────────Never heard of 249.899 40.0
Impossible 141.4729 22.7
Very difficult 96.48352 15.5
Somewhat diff 69.21293 11.1
Somewhat easy 37.44871 6.0
Very easy 29.75139 4.8
Frequency Missing = 127.73156274
DIFFICULT TO GET HEROIN
Q21R Frequency Percent
────────────────────────────────────
Never heard of 132.3881 20.3
Impossible 243.6737 37.4
Very difficult 123.7615 19.0
Somewhat diff 84.6823 13.0
Somewhat easy 32.22539 5.0
Very easy 33.99674 5.2
Frequency Missing = 101.27221245
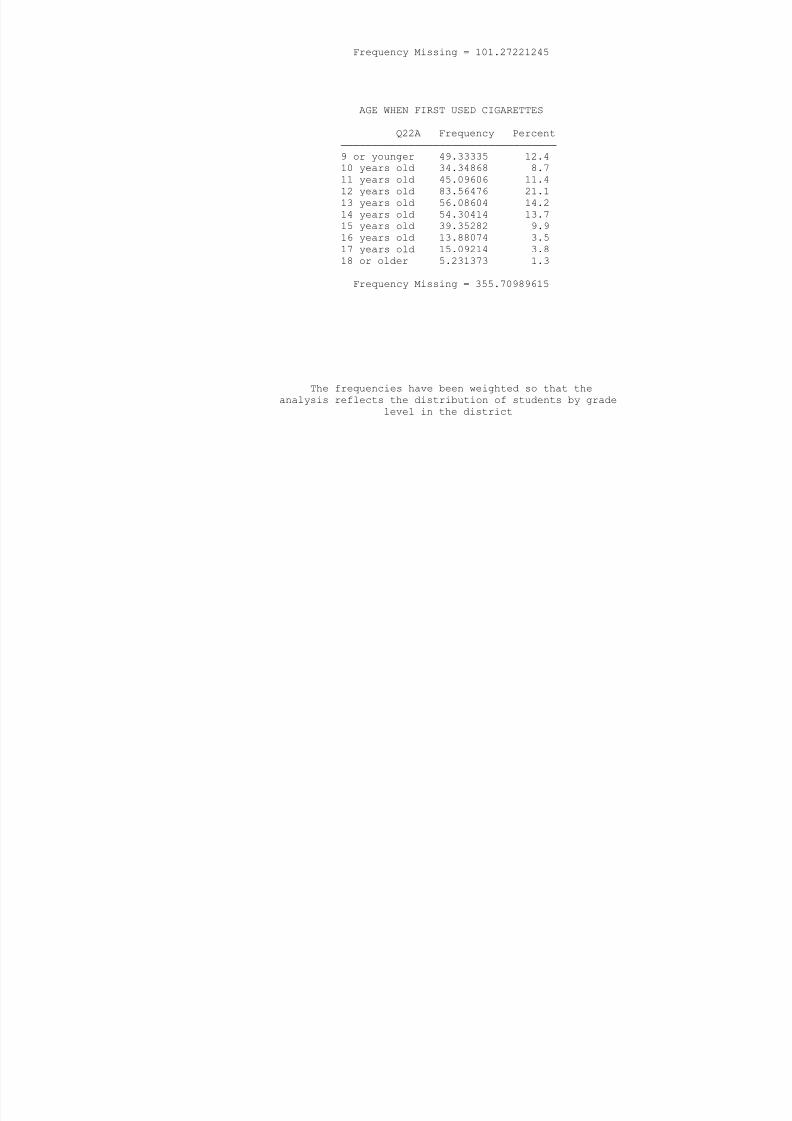
8/14/2019 BOWIE COUNTY - Texarkana ISD - 1999 Texas School Survey of Drug and Alcohol Use
http://slidepdf.com/reader/full/bowie-county-texarkana-isd-1999-texas-school-survey-of-drug-and-alcohol 133/185
AGE WHEN FIRST USED CIGARETTES
Q22A Frequency Percent
───────────────────────────────────
9 or younger 49.33335 12.410 years old 34.34868 8.7
11 years old 45.09606 11.4
12 years old 83.56476 21.1
13 years old 56.08604 14.2
14 years old 54.30414 13.7
15 years old 39.35282 9.9
16 years old 13.88074 3.5
17 years old 15.09214 3.8
18 or older 5.231373 1.3
Frequency Missing = 355.70989615
The frequencies have been weighted so that the
analysis reflects the distribution of students by grade
level in the district
Texarkana
Spring 1999
AGE WHEN FIRST USED
SMOKELESS TOBACCO
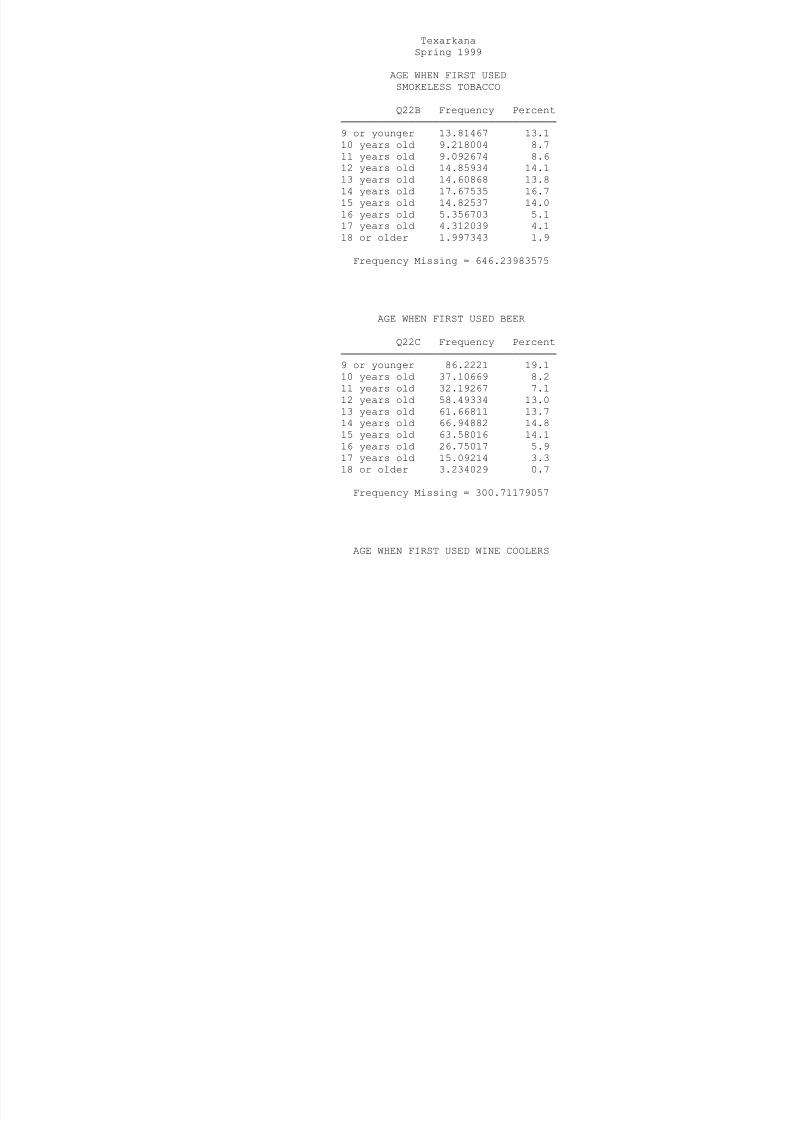
8/14/2019 BOWIE COUNTY - Texarkana ISD - 1999 Texas School Survey of Drug and Alcohol Use
http://slidepdf.com/reader/full/bowie-county-texarkana-isd-1999-texas-school-survey-of-drug-and-alcohol 134/185
Q22B Frequency Percent
───────────────────────────────────
9 or younger 13.81467 13.1
10 years old 9.218004 8.7
11 years old 9.092674 8.612 years old 14.85934 14.1
13 years old 14.60868 13.8
14 years old 17.67535 16.7
15 years old 14.82537 14.0
16 years old 5.356703 5.1
17 years old 4.312039 4.1
18 or older 1.997343 1.9
Frequency Missing = 646.23983575
AGE WHEN FIRST USED BEER
Q22C Frequency Percent
───────────────────────────────────
9 or younger 86.2221 19.1
10 years old 37.10669 8.2
11 years old 32.19267 7.1
12 years old 58.49334 13.0
13 years old 61.66811 13.7
14 years old 66.94882 14.8
15 years old 63.58016 14.1
16 years old 26.75017 5.9
17 years old 15.09214 3.3
18 or older 3.234029 0.7
Frequency Missing = 300.71179057
AGE WHEN FIRST USED WINE COOLERS
Q22D Frequency Percent
───────────────────────────────────
9 or younger 54.19741 12.2
10 years old 27.11935 6.1
11 years old 50 16132 11 3
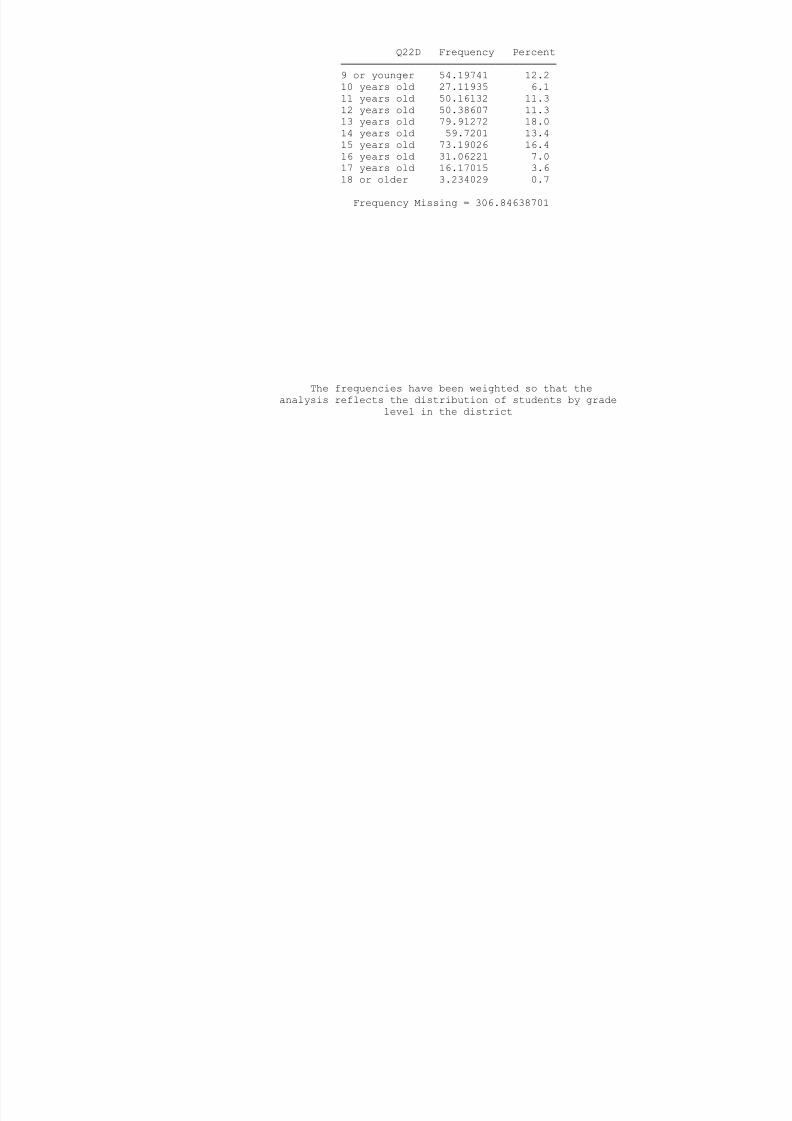
8/14/2019 BOWIE COUNTY - Texarkana ISD - 1999 Texas School Survey of Drug and Alcohol Use
http://slidepdf.com/reader/full/bowie-county-texarkana-isd-1999-texas-school-survey-of-drug-and-alcohol 135/185
11 years old 50.16132 11.3
12 years old 50.38607 11.3
13 years old 79.91272 18.0
14 years old 59.7201 13.4
15 years old 73.19026 16.4
16 years old 31.06221 7.017 years old 16.17015 3.6
18 or older 3.234029 0.7
Frequency Missing = 306.84638701
The frequencies have been weighted so that the
analysis reflects the distribution of students by grade
level in the district
Texarkana
Spring 1999
AGE WHEN FIRST USED WINE
Q22E Frequency Percent

8/14/2019 BOWIE COUNTY - Texarkana ISD - 1999 Texas School Survey of Drug and Alcohol Use
http://slidepdf.com/reader/full/bowie-county-texarkana-isd-1999-texas-school-survey-of-drug-and-alcohol 136/185
Q22E Frequency Percent
───────────────────────────────────
9 or younger 35.30136 9.7
10 years old 18.50332 5.1
11 years old 31.30668 8.6
12 years old 41.05997 11.313 years old 54.60675 15.0
14 years old 68.18551 18.8
15 years old 66.98092 18.4
16 years old 26.78351 7.4
17 years old 16.17015 4.5
18 or older 4.312039 1.2
Frequency Missing = 388.78979364
AGE WHEN FIRST USED LIQUOR
Q22F Frequency Percent
───────────────────────────────────
9 or younger 28.70735 7.6
10 years old 19.11336 5.0
11 years old 16.19668 4.3
12 years old 41.25199 10.9
13 years old 61.15873 16.2
14 years old 62.27803 16.5
15 years old 84.39756 22.3
16 years old 43.86494 11.6
17 years old 15.09214 4.0
18 or older 6.468058 1.7
Frequency Missing = 373.47116156
AGE WHEN FIRST USED INHALANTS
Q22G Frequency Percent
───────────────────────────────────
9 or younger 10.898 11.6
10 years old 5.03935 5.4
11 years old 6.878017 7.3
12 years old 21.07736 22.4
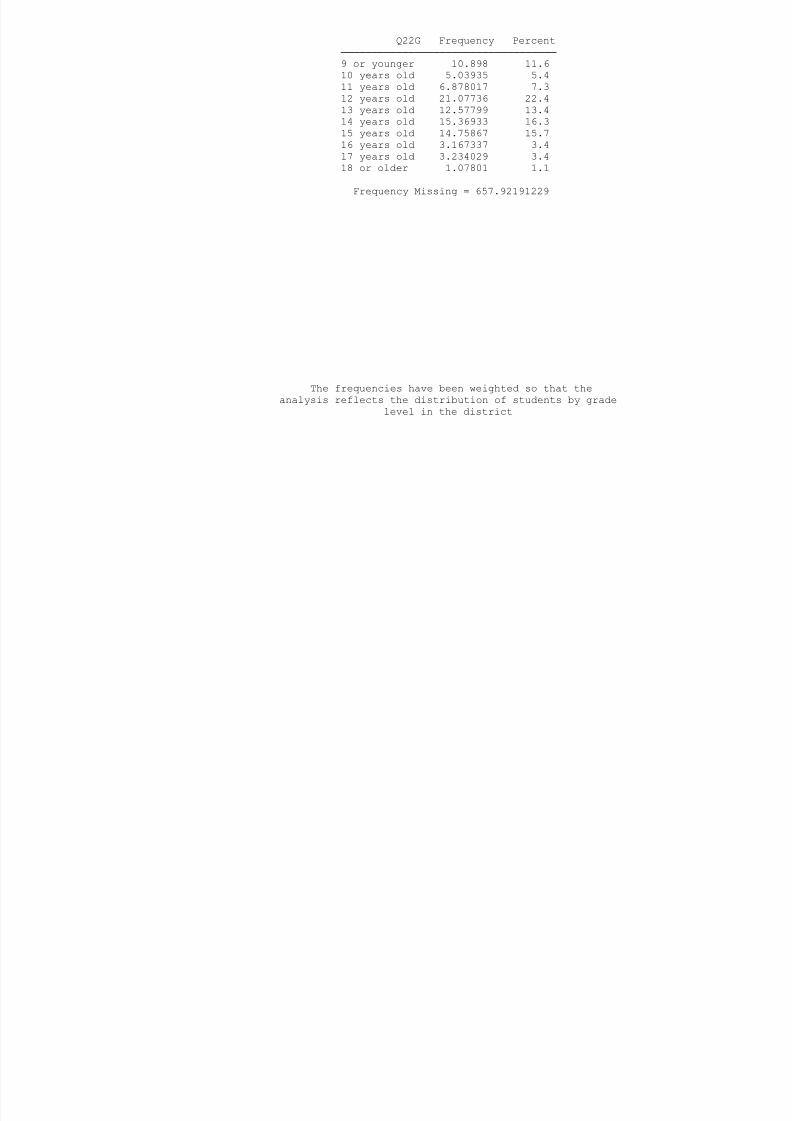
8/14/2019 BOWIE COUNTY - Texarkana ISD - 1999 Texas School Survey of Drug and Alcohol Use
http://slidepdf.com/reader/full/bowie-county-texarkana-isd-1999-texas-school-survey-of-drug-and-alcohol 137/185
12 years old 21.07736 22.4
13 years old 12.57799 13.4
14 years old 15.36933 16.3
15 years old 14.75867 15.7
16 years old 3.167337 3.4
17 years old 3.234029 3.418 or older 1.07801 1.1
Frequency Missing = 657.92191229
The frequencies have been weighted so that the
analysis reflects the distribution of students by grade
level in the district
Texarkana
Spring 1999
AGE WHEN FIRST USED MARIJUANA
Q22H Frequency Percent
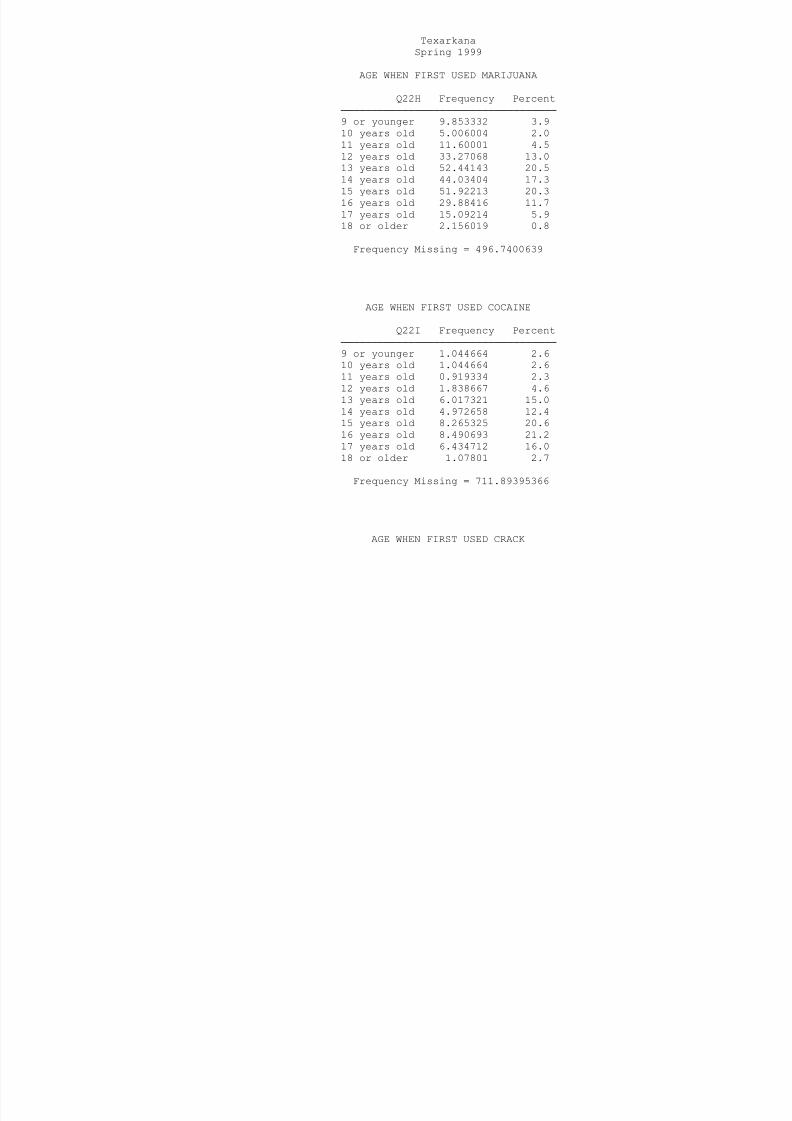
8/14/2019 BOWIE COUNTY - Texarkana ISD - 1999 Texas School Survey of Drug and Alcohol Use
http://slidepdf.com/reader/full/bowie-county-texarkana-isd-1999-texas-school-survey-of-drug-and-alcohol 138/185
Q q y
───────────────────────────────────
9 or younger 9.853332 3.9
10 years old 5.006004 2.0
11 years old 11.60001 4.5
12 years old 33.27068 13.013 years old 52.44143 20.5
14 years old 44.03404 17.3
15 years old 51.92213 20.3
16 years old 29.88416 11.7
17 years old 15.09214 5.9
18 or older 2.156019 0.8
Frequency Missing = 496.7400639
AGE WHEN FIRST USED COCAINE
Q22I Frequency Percent
───────────────────────────────────
9 or younger 1.044664 2.6
10 years old 1.044664 2.6
11 years old 0.919334 2.3
12 years old 1.838667 4.6
13 years old 6.017321 15.0
14 years old 4.972658 12.4
15 years old 8.265325 20.6
16 years old 8.490693 21.2
17 years old 6.434712 16.0
18 or older 1.07801 2.7
Frequency Missing = 711.89395366
AGE WHEN FIRST USED CRACK
Q22J Frequency Percent
───────────────────────────────────
9 or younger 1.044664 8.6
10 years old 1.044664 8.6
11 years old 0.919334 7.6
13 years old 1.044664 8.6
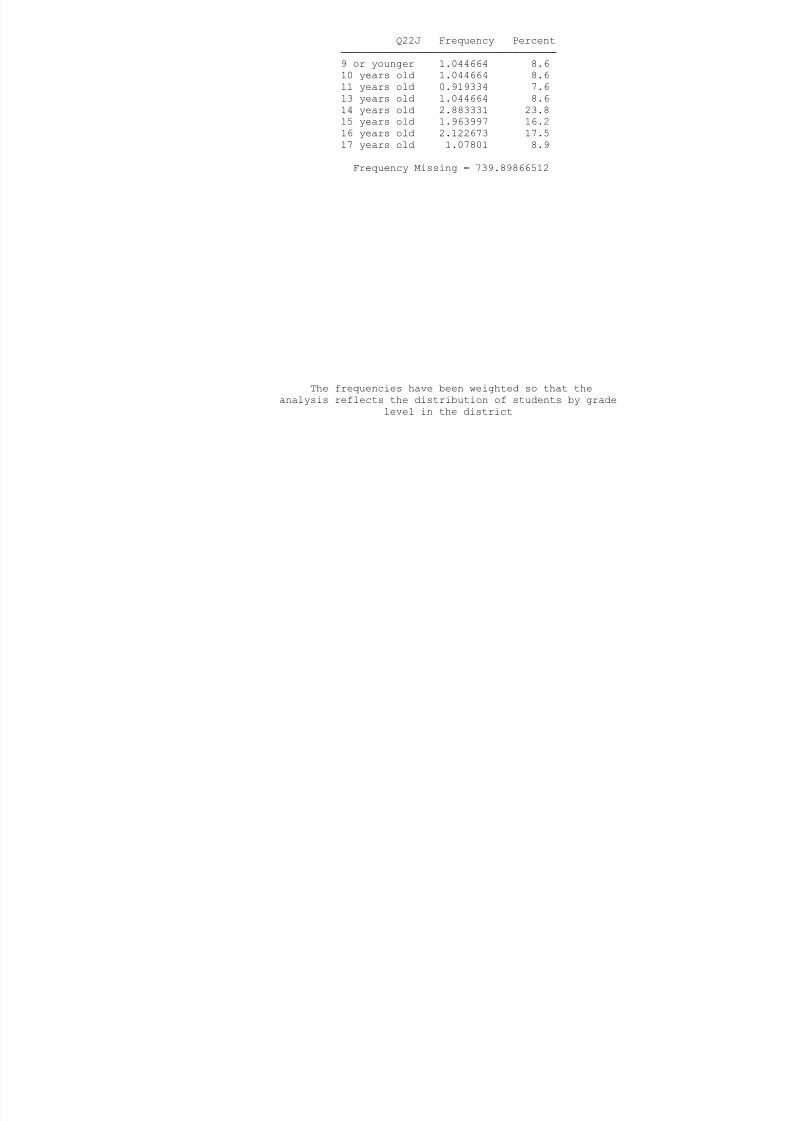
8/14/2019 BOWIE COUNTY - Texarkana ISD - 1999 Texas School Survey of Drug and Alcohol Use
http://slidepdf.com/reader/full/bowie-county-texarkana-isd-1999-texas-school-survey-of-drug-and-alcohol 139/185
y
14 years old 2.883331 23.8
15 years old 1.963997 16.2
16 years old 2.122673 17.5
17 years old 1.07801 8.9
Frequency Missing = 739.89866512
The frequencies have been weighted so that the
analysis reflects the distribution of students by grade
level in the district
Texarkana
Spring 1999
AGE WHEN FIRST USED HALLUCINOGENS
Q22L Frequency Percent
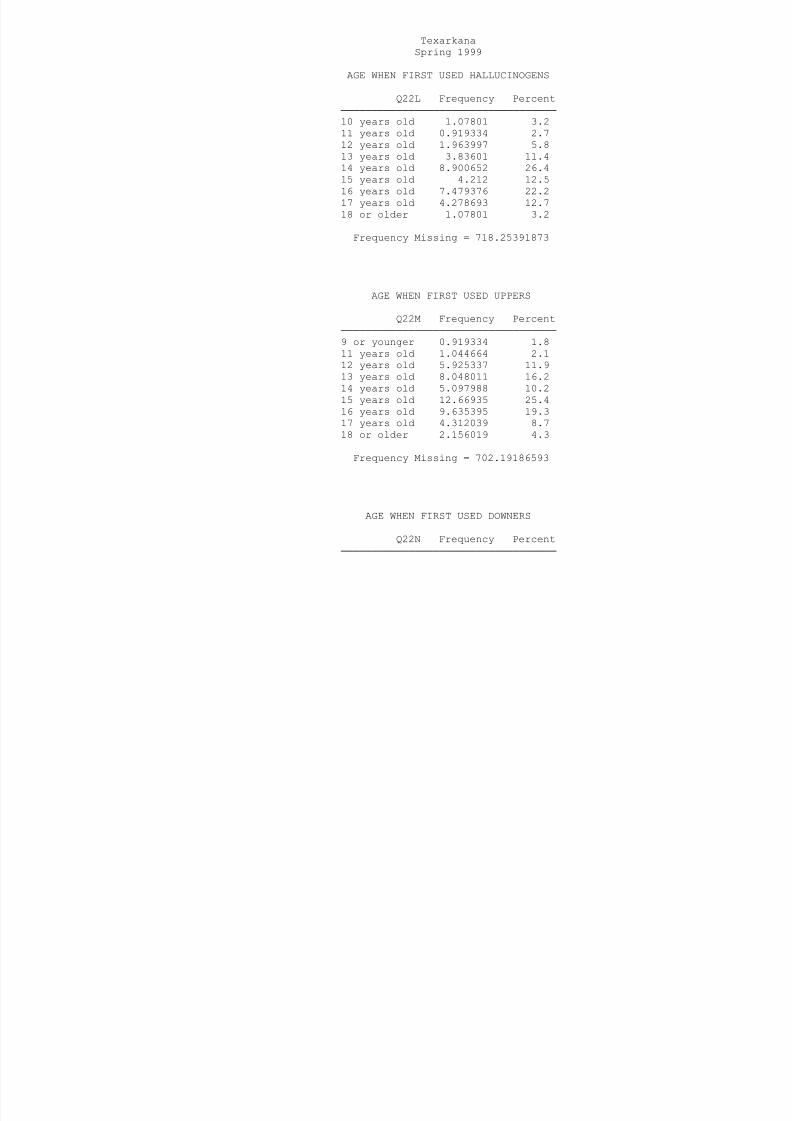
8/14/2019 BOWIE COUNTY - Texarkana ISD - 1999 Texas School Survey of Drug and Alcohol Use
http://slidepdf.com/reader/full/bowie-county-texarkana-isd-1999-texas-school-survey-of-drug-and-alcohol 140/185
q y
───────────────────────────────────
10 years old 1.07801 3.2
11 years old 0.919334 2.7
12 years old 1.963997 5.8
13 years old 3.83601 11.414 years old 8.900652 26.4
15 years old 4.212 12.5
16 years old 7.479376 22.2
17 years old 4.278693 12.7
18 or older 1.07801 3.2
Frequency Missing = 718.25391873
AGE WHEN FIRST USED UPPERS
Q22M Frequency Percent
───────────────────────────────────
9 or younger 0.919334 1.8
11 years old 1.044664 2.1
12 years old 5.925337 11.9
13 years old 8.048011 16.2
14 years old 5.097988 10.2
15 years old 12.66935 25.4
16 years old 9.635395 19.3
17 years old 4.312039 8.7
18 or older 2.156019 4.3
Frequency Missing = 702.19186593
AGE WHEN FIRST USED DOWNERS
Q22N Frequency Percent
───────────────────────────────────
10 years old 0.919334 2.3
11 years old 0.919334 2.3
12 years old 3.83601 9.6
13 years old 7.889335 19.7
14 years old 5.29001 13.2
15 years old 9.435318 23.6
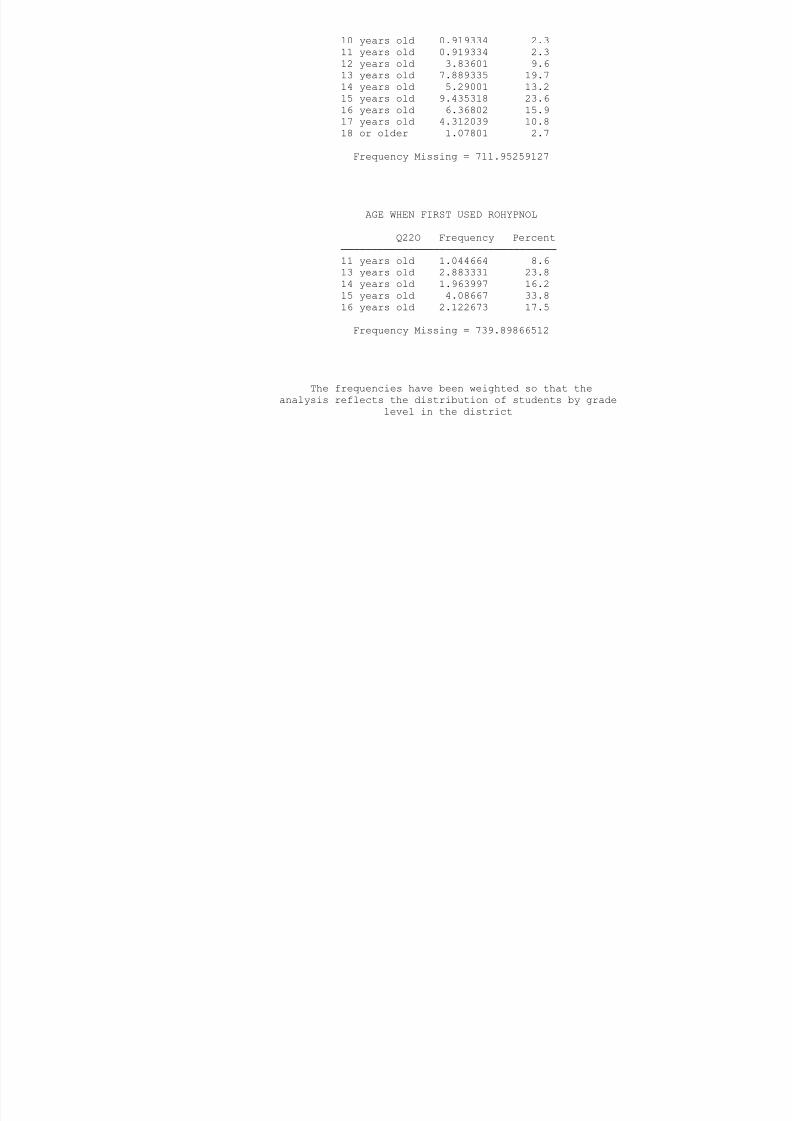
8/14/2019 BOWIE COUNTY - Texarkana ISD - 1999 Texas School Survey of Drug and Alcohol Use
http://slidepdf.com/reader/full/bowie-county-texarkana-isd-1999-texas-school-survey-of-drug-and-alcohol 141/185
16 years old 6.36802 15.9
17 years old 4.312039 10.8
18 or older 1.07801 2.7
Frequency Missing = 711.95259127
AGE WHEN FIRST USED ROHYPNOL
Q22O Frequency Percent
───────────────────────────────────
11 years old 1.044664 8.6
13 years old 2.883331 23.8
14 years old 1.963997 16.2
15 years old 4.08667 33.816 years old 2.122673 17.5
Frequency Missing = 739.89866512
The frequencies have been weighted so that the
analysis reflects the distribution of students by grade
level in the district
Texarkana
Spring 1999
AGE WHEN FIRST USED STEROIDS
Q22P Frequency Percent
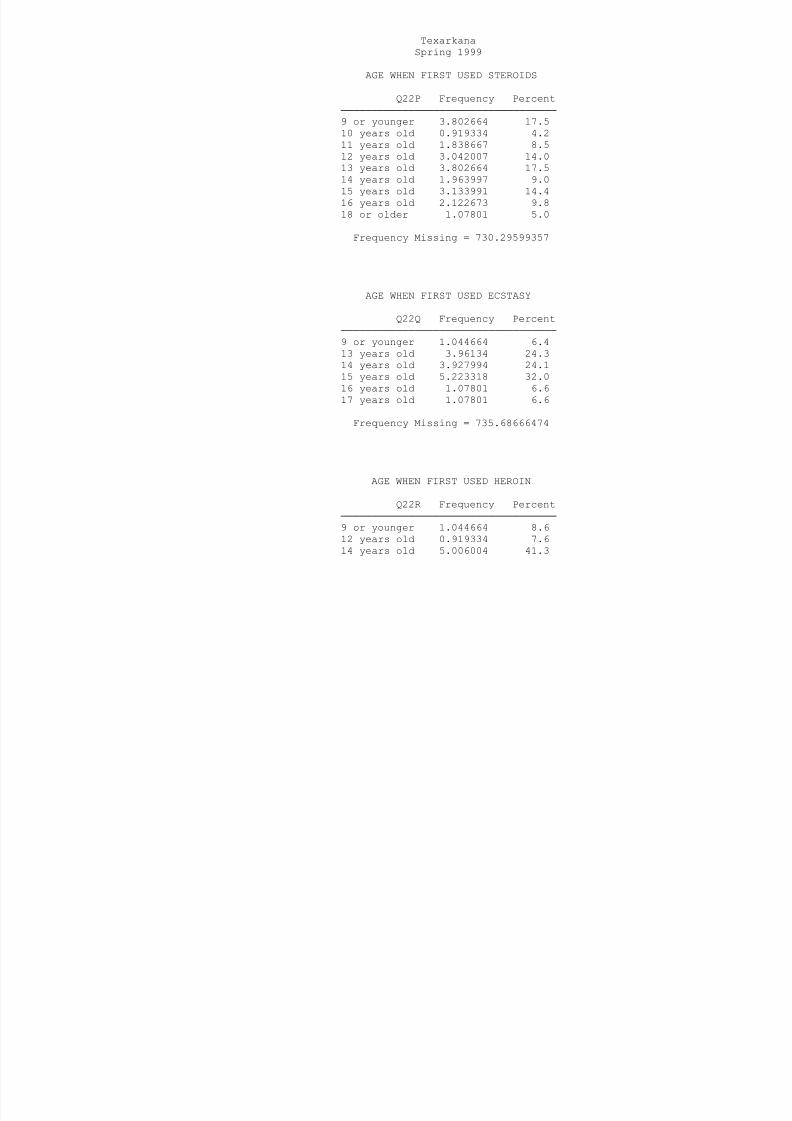
8/14/2019 BOWIE COUNTY - Texarkana ISD - 1999 Texas School Survey of Drug and Alcohol Use
http://slidepdf.com/reader/full/bowie-county-texarkana-isd-1999-texas-school-survey-of-drug-and-alcohol 142/185
───────────────────────────────────
9 or younger 3.802664 17.5
10 years old 0.919334 4.2
11 years old 1.838667 8.5
12 years old 3.042007 14.013 years old 3.802664 17.5
14 years old 1.963997 9.0
15 years old 3.133991 14.4
16 years old 2.122673 9.8
18 or older 1.07801 5.0
Frequency Missing = 730.29599357
AGE WHEN FIRST USED ECSTASY
Q22Q Frequency Percent
───────────────────────────────────
9 or younger 1.044664 6.4
13 years old 3.96134 24.3
14 years old 3.927994 24.1
15 years old 5.223318 32.0
16 years old 1.07801 6.6
17 years old 1.07801 6.6
Frequency Missing = 735.68666474
AGE WHEN FIRST USED HEROIN
Q22R Frequency Percent
───────────────────────────────────
9 or younger 1.044664 8.6
12 years old 0.919334 7.6
14 years old 5.006004 41.3
15 years old 1.963997 16.2
16 years old 2.122673 17.5
17 years old 1.07801 8.9
Frequency Missing = 739.86531892
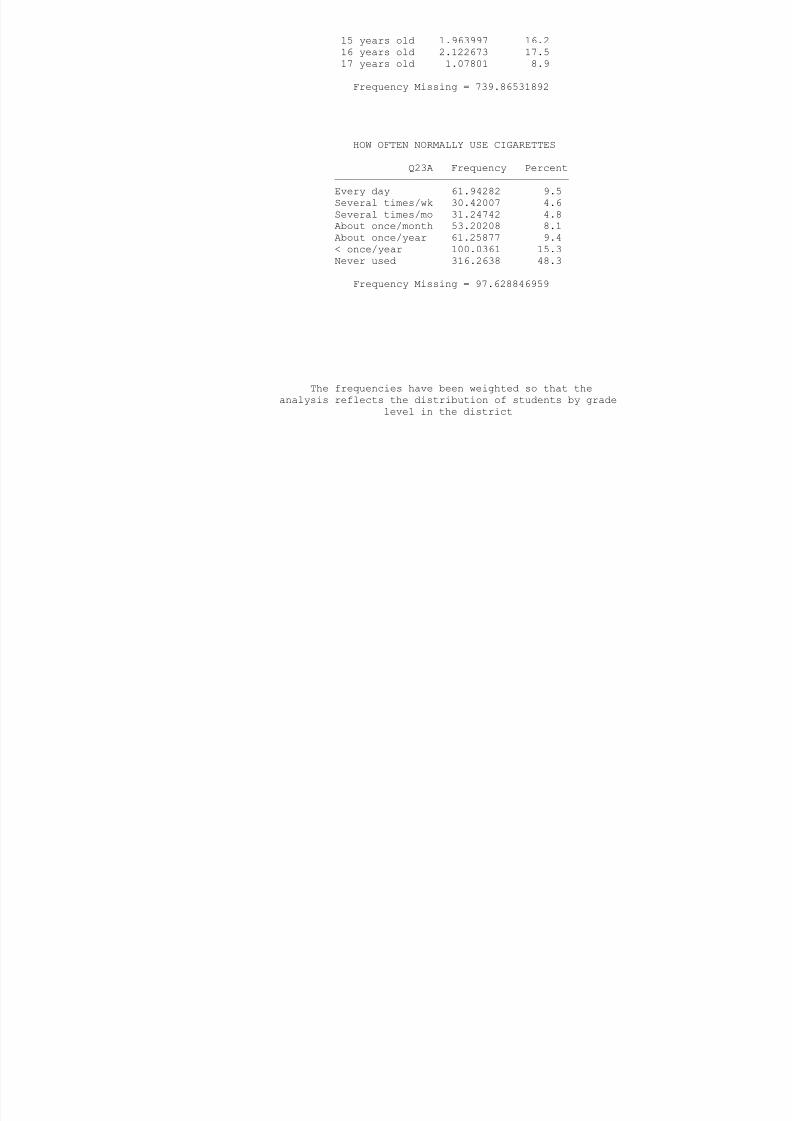
8/14/2019 BOWIE COUNTY - Texarkana ISD - 1999 Texas School Survey of Drug and Alcohol Use
http://slidepdf.com/reader/full/bowie-county-texarkana-isd-1999-texas-school-survey-of-drug-and-alcohol 143/185
HOW OFTEN NORMALLY USE CIGARETTES
Q23A Frequency Percent
──────────────────────────────────────
Every day 61.94282 9.5
Several times/wk 30.42007 4.6
Several times/mo 31.24742 4.8
About once/month 53.20208 8.1
About once/year 61.25877 9.4
< once/year 100.0361 15.3
Never used 316.2638 48.3
Frequency Missing = 97.628846959
The frequencies have been weighted so that the
analysis reflects the distribution of students by grade
level in the district
Texarkana
Spring 1999
HOW OFTEN NORMALLY USE
SMOKELESS TOBACCO
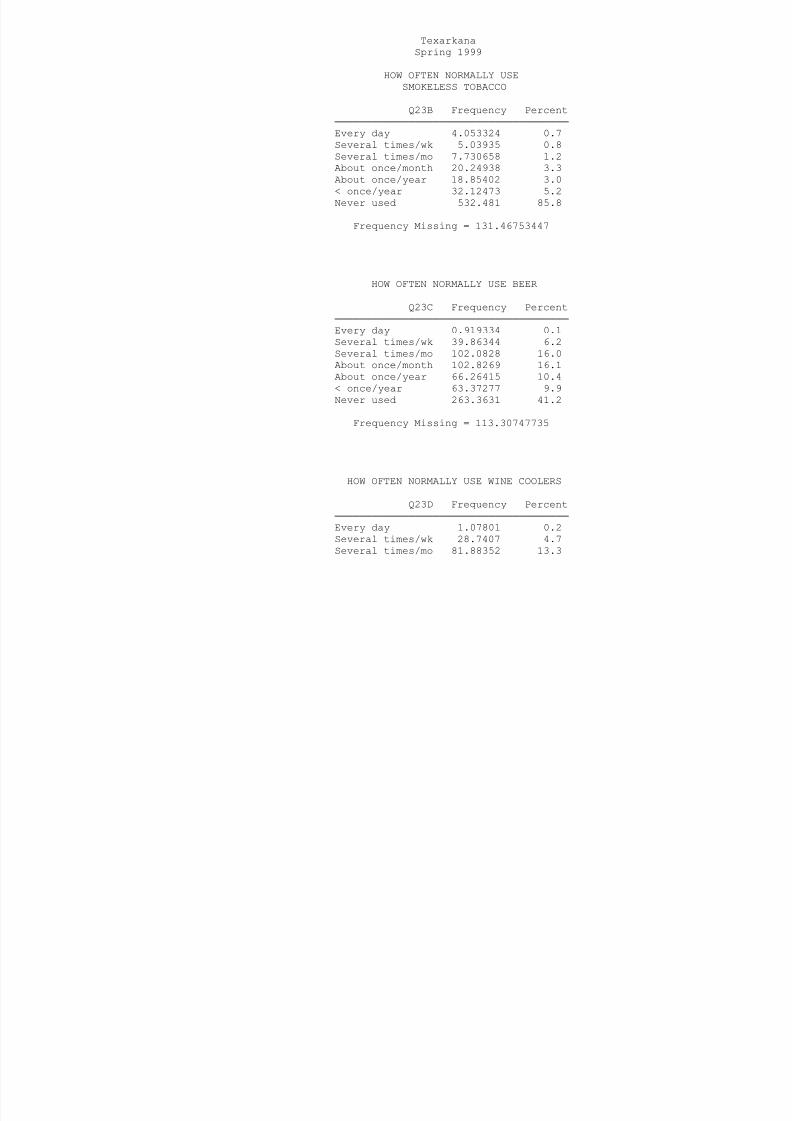
8/14/2019 BOWIE COUNTY - Texarkana ISD - 1999 Texas School Survey of Drug and Alcohol Use
http://slidepdf.com/reader/full/bowie-county-texarkana-isd-1999-texas-school-survey-of-drug-and-alcohol 144/185
Q23B Frequency Percent
──────────────────────────────────────
Every day 4.053324 0.7
Several times/wk 5.03935 0.8
Several times/mo 7.730658 1.2About once/month 20.24938 3.3
About once/year 18.85402 3.0
< once/year 32.12473 5.2
Never used 532.481 85.8
Frequency Missing = 131.46753447
HOW OFTEN NORMALLY USE BEER
Q23C Frequency Percent
──────────────────────────────────────
Every day 0.919334 0.1
Several times/wk 39.86344 6.2
Several times/mo 102.0828 16.0
About once/month 102.8269 16.1
About once/year 66.26415 10.4
< once/year 63.37277 9.9
Never used 263.3631 41.2
Frequency Missing = 113.30747735
HOW OFTEN NORMALLY USE WINE COOLERS
Q23D Frequency Percent
──────────────────────────────────────
Every day 1.07801 0.2
Several times/wk 28.7407 4.7
Several times/mo 81.88352 13.3
About once/month 117.977 19.2
About once/year 95.7396 15.6
< once/year 78.2988 12.7
Never used 211.1482 34.3
Frequency Missing = 137.13415706
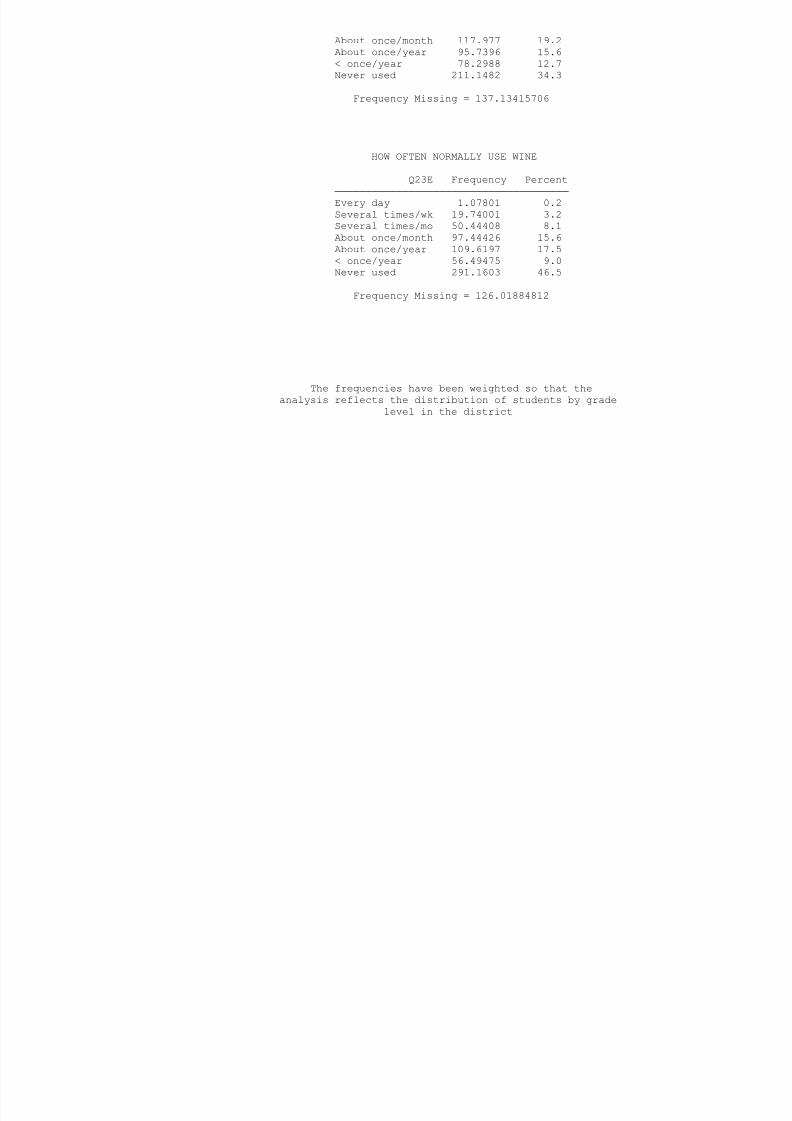
8/14/2019 BOWIE COUNTY - Texarkana ISD - 1999 Texas School Survey of Drug and Alcohol Use
http://slidepdf.com/reader/full/bowie-county-texarkana-isd-1999-texas-school-survey-of-drug-and-alcohol 145/185
HOW OFTEN NORMALLY USE WINE
Q23E Frequency Percent
──────────────────────────────────────
Every day 1.07801 0.2
Several times/wk 19.74001 3.2
Several times/mo 50.44408 8.1
About once/month 97.44426 15.6
About once/year 109.6197 17.5
< once/year 56.49475 9.0
Never used 291.1603 46.5
Frequency Missing = 126.01884812
The frequencies have been weighted so that the
analysis reflects the distribution of students by grade
level in the district
Texarkana
Spring 1999
HOW OFTEN NORMALLY USE LIQUOR
Q23F Frequency Percent
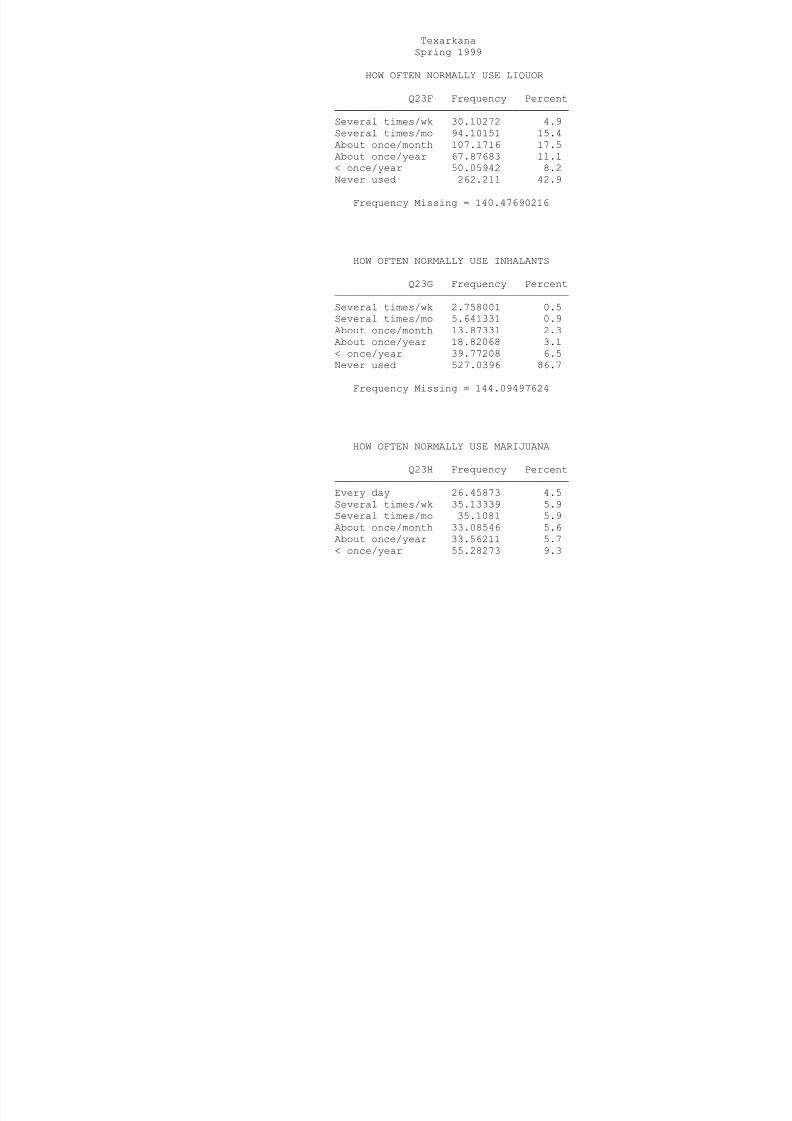
8/14/2019 BOWIE COUNTY - Texarkana ISD - 1999 Texas School Survey of Drug and Alcohol Use
http://slidepdf.com/reader/full/bowie-county-texarkana-isd-1999-texas-school-survey-of-drug-and-alcohol 146/185
──────────────────────────────────────
Several times/wk 30.10272 4.9
Several times/mo 94.10151 15.4
About once/month 107.1716 17.5
About once/year 67.87683 11.1< once/year 50.05942 8.2
Never used 262.211 42.9
Frequency Missing = 140.47690216
HOW OFTEN NORMALLY USE INHALANTS
Q23G Frequency Percent
──────────────────────────────────────Several times/wk 2.758001 0.5
Several times/mo 5.641331 0.9
About once/month 13.87331 2.3
About once/year 18.82068 3.1
< once/year 39.77208 6.5
Never used 527.0396 86.7
Frequency Missing = 144.09497624
HOW OFTEN NORMALLY USE MARIJUANA
Q23H Frequency Percent
──────────────────────────────────────
Every day 26.45873 4.5
Several times/wk 35.13339 5.9
Several times/mo 35.1081 5.9
About once/month 33.08546 5.6
About once/year 33.56211 5.7
< once/year 55.28273 9.3
Never used 374.7745 63.2
Frequency Missing = 158.59493584
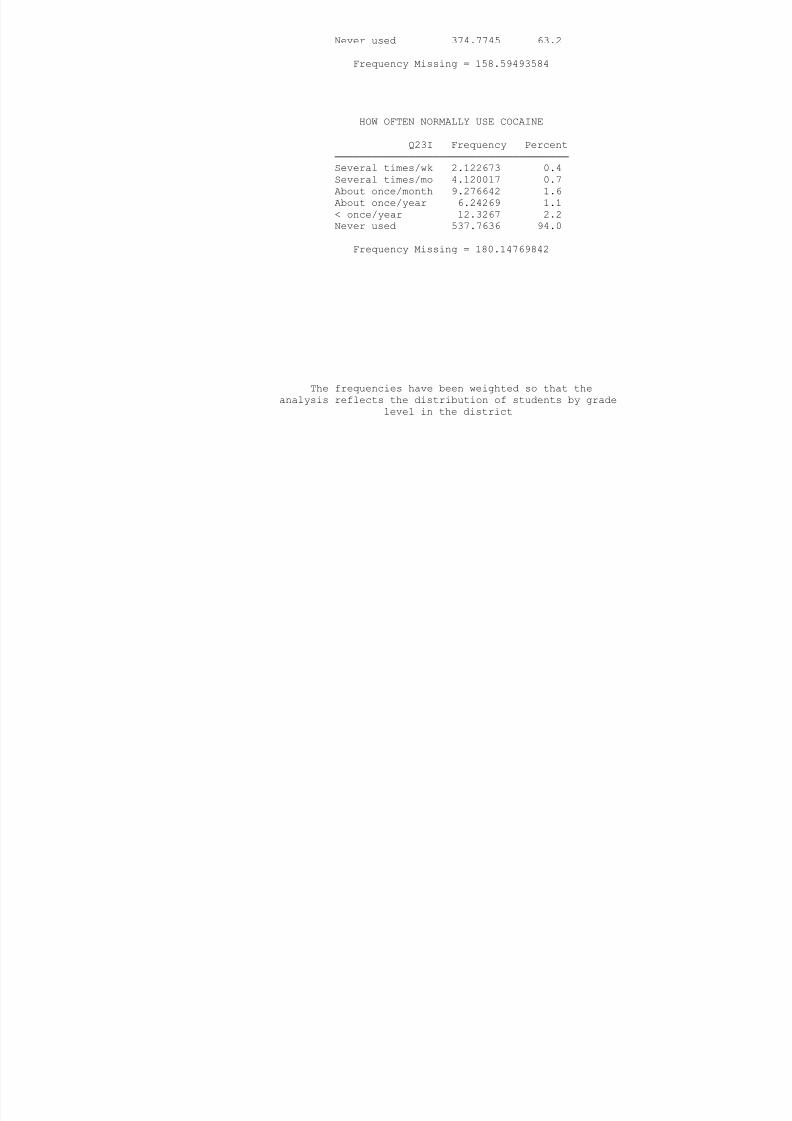
8/14/2019 BOWIE COUNTY - Texarkana ISD - 1999 Texas School Survey of Drug and Alcohol Use
http://slidepdf.com/reader/full/bowie-county-texarkana-isd-1999-texas-school-survey-of-drug-and-alcohol 147/185
HOW OFTEN NORMALLY USE COCAINE
Q23I Frequency Percent
──────────────────────────────────────Several times/wk 2.122673 0.4
Several times/mo 4.120017 0.7
About once/month 9.276642 1.6
About once/year 6.24269 1.1
< once/year 12.3267 2.2
Never used 537.7636 94.0
Frequency Missing = 180.14769842
The frequencies have been weighted so that the
analysis reflects the distribution of students by grade
level in the district
Texarkana
Spring 1999
HOW OFTEN NORMALLY USE CRACK
Q23J Frequency Percent

8/14/2019 BOWIE COUNTY - Texarkana ISD - 1999 Texas School Survey of Drug and Alcohol Use
http://slidepdf.com/reader/full/bowie-county-texarkana-isd-1999-texas-school-survey-of-drug-and-alcohol 148/185
──────────────────────────────────────
Several times/mo 0.919334 0.2
About once/month 4.053324 0.7
About once/year 2.883331 0.5
< once/year 4.08667 0.7Never used 541.5403 97.8
Frequency Missing = 198.51701456
HOW OFTEN NORMALLY USE HALLUCINOGENS
Q23L Frequency Percent
──────────────────────────────────────
Several times/wk 0.919334 0.2Several times/mo 2.883331 0.5
About once/month 6.050667 1.0
About once/year 9.37668 1.6
< once/year 11.44072 2.0
Never used 551.7777 94.7
Frequency Missing = 169.55156856
HOW OFTEN NORMALLY USE UPPERS
Q23M Frequency Percent
──────────────────────────────────────
Every day 0.919334 0.2
Several times/wk 1.963997 0.3
Several times/mo 13.53004 2.3
About once/month 9.059328 1.6
About once/year 7.287353 1.3
< once/year 15.87809 2.7
Never used 533.1336 91.6
Frequency Missing = 170.22829687
HOW OFTEN NORMALLY USE DOWNERS
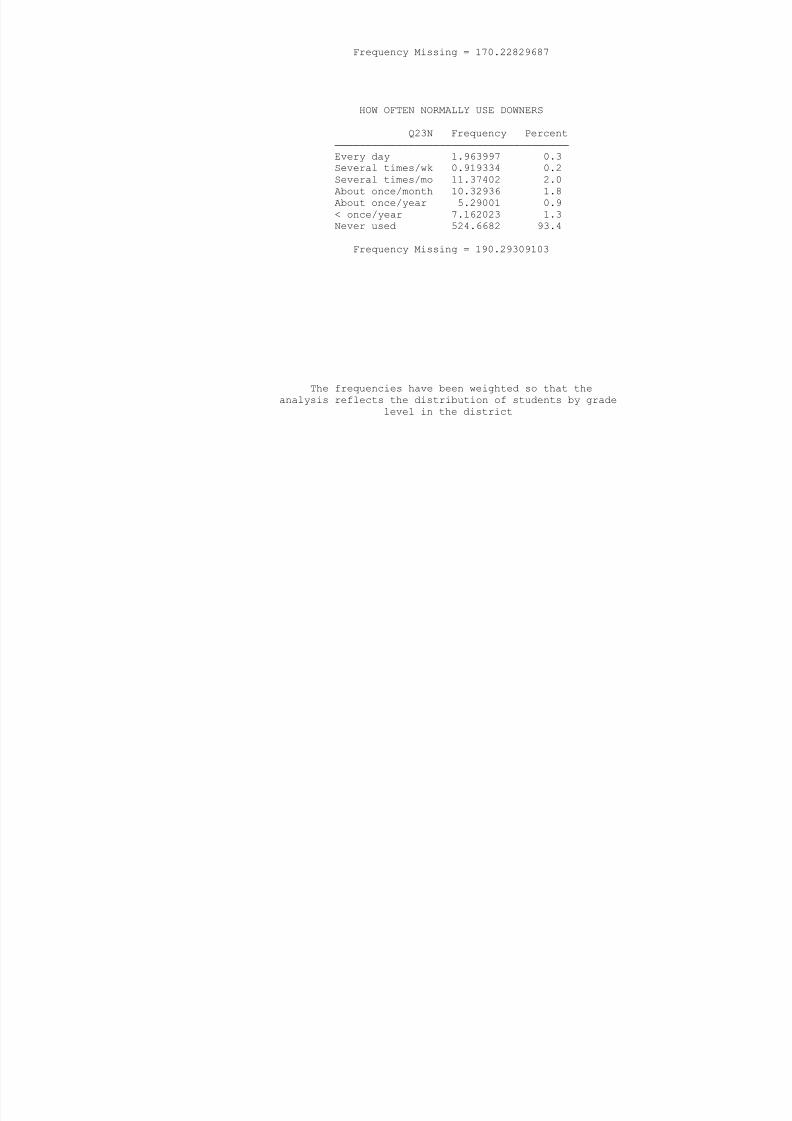
8/14/2019 BOWIE COUNTY - Texarkana ISD - 1999 Texas School Survey of Drug and Alcohol Use
http://slidepdf.com/reader/full/bowie-county-texarkana-isd-1999-texas-school-survey-of-drug-and-alcohol 149/185
HOW OFTEN NORMALLY USE DOWNERS
Q23N Frequency Percent
──────────────────────────────────────
Every day 1.963997 0.3Several times/wk 0.919334 0.2
Several times/mo 11.37402 2.0
About once/month 10.32936 1.8
About once/year 5.29001 0.9
< once/year 7.162023 1.3
Never used 524.6682 93.4
Frequency Missing = 190.29309103
The frequencies have been weighted so that the
analysis reflects the distribution of students by grade
level in the district
Texarkana
Spring 1999
HOW OFTEN NORMALLY USE ROHYPNOL
Q23O Frequency Percent
──────────────────────────────────────

8/14/2019 BOWIE COUNTY - Texarkana ISD - 1999 Texas School Survey of Drug and Alcohol Use
http://slidepdf.com/reader/full/bowie-county-texarkana-isd-1999-texas-school-survey-of-drug-and-alcohol 150/185
──────────────────────────────────────
Several times/wk 1.963997 0.3
Several times/mo 1.963997 0.3
About once/month 3.133991 0.5
About once/year 2.122673 0.4< once/year 3.008661 0.5
Never used 567.7403 97.9
Frequency Missing = 172.0663415
HOW OFTEN NORMALLY USE STEROIDS
Q23P Frequency Percent
──────────────────────────────────────Every day 2.122673 0.4
Several times/wk 1.963997 0.4
Several times/mo 2.122673 0.4
About once/month 1.044664 0.2
About once/year 4.880674 0.9
< once/year 4.880674 0.9
Never used 520.7389 96.8
Frequency Missing = 214.24572319
HOW OFTEN NORMALLY USE ECSTASY
Q23Q Frequency Percent
──────────────────────────────────────
Several times/mo 1.044664 0.2
About once/month 7.220661 1.3
About once/year 3.167337 0.6
< once/year 2.883331 0.5
Never used 538.7156 97.4
Frequency Missing = 198.96837424
HOW OFTEN NORMALLY USE HEROIN
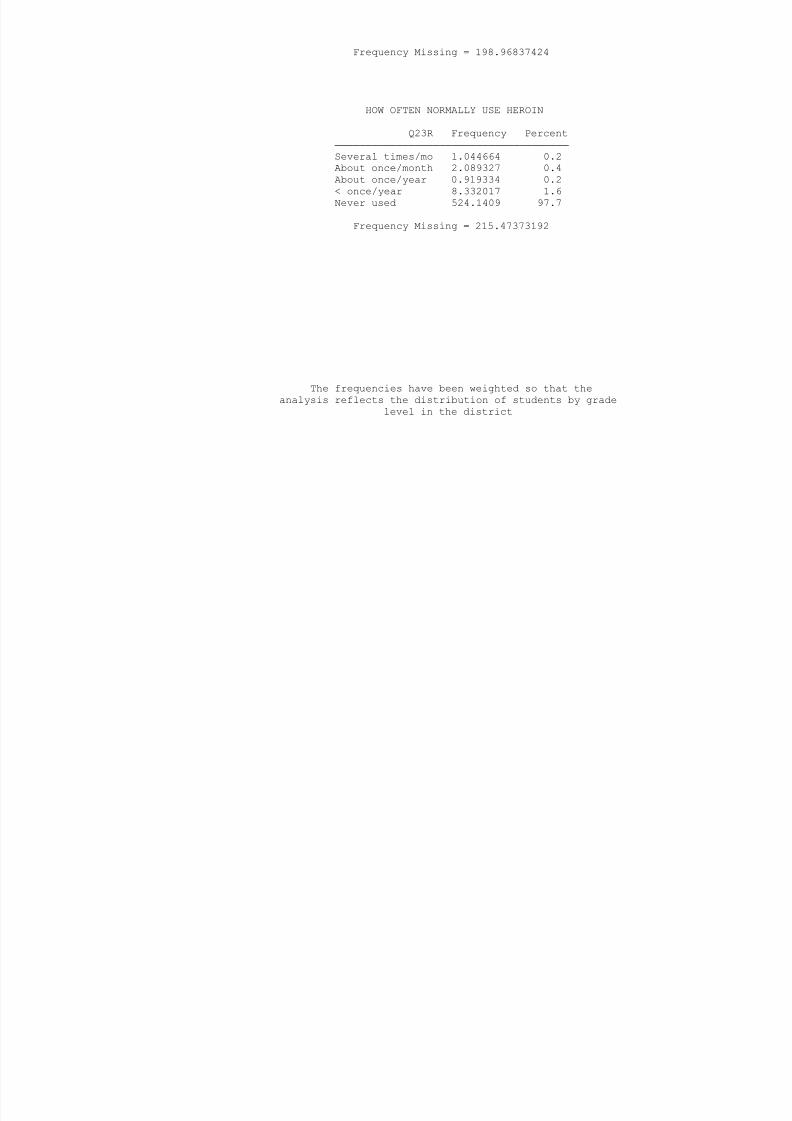
8/14/2019 BOWIE COUNTY - Texarkana ISD - 1999 Texas School Survey of Drug and Alcohol Use
http://slidepdf.com/reader/full/bowie-county-texarkana-isd-1999-texas-school-survey-of-drug-and-alcohol 151/185
HOW OFTEN NORMALLY USE HEROIN
Q23R Frequency Percent
──────────────────────────────────────
Several times/mo 1.044664 0.2About once/month 2.089327 0.4
About once/year 0.919334 0.2
< once/year 8.332017 1.6
Never used 524.1409 97.7
Frequency Missing = 215.47373192
The frequencies have been weighted so that the
analysis reflects the distribution of students by grade
level in the district
Texarkana
Spring 1999
HOW MANY CIGARETTES IN PAST 30 DAYS
Q24 Frequency Percent
──────────────────────────────────────
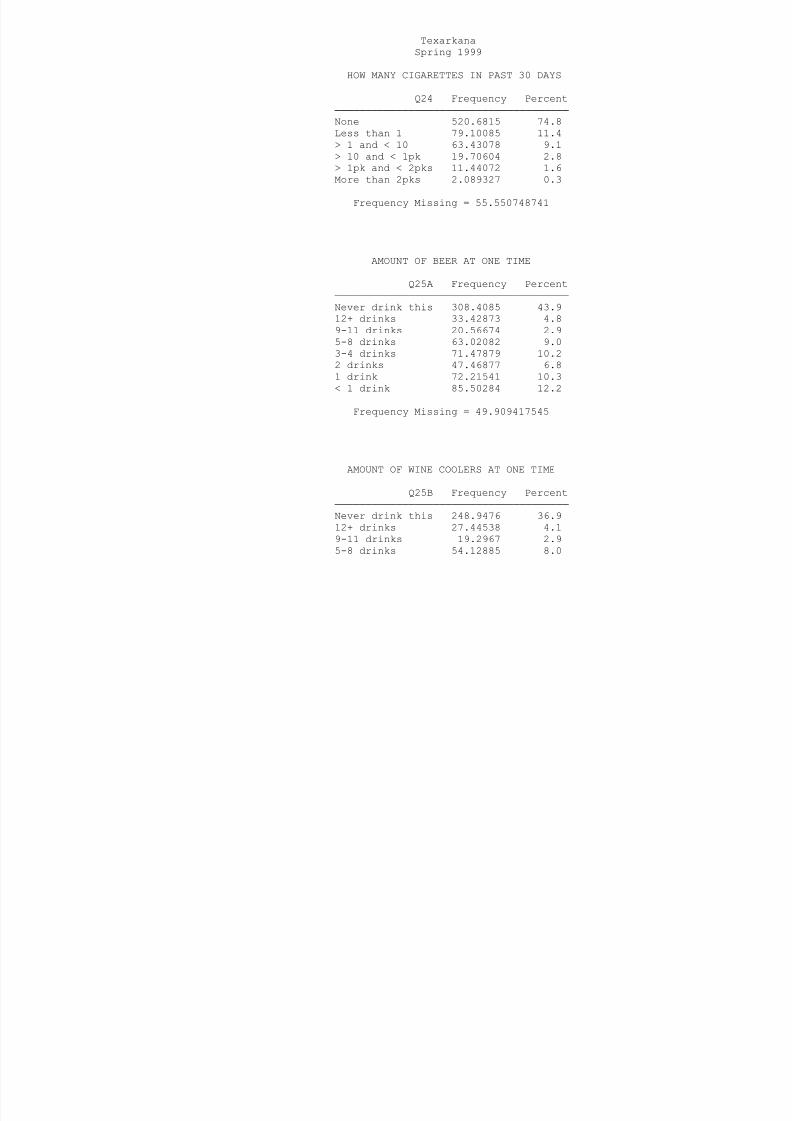
8/14/2019 BOWIE COUNTY - Texarkana ISD - 1999 Texas School Survey of Drug and Alcohol Use
http://slidepdf.com/reader/full/bowie-county-texarkana-isd-1999-texas-school-survey-of-drug-and-alcohol 152/185
None 520.6815 74.8
Less than 1 79.10085 11.4
> 1 and < 10 63.43078 9.1
> 10 and < 1pk 19.70604 2.8> 1pk and < 2pks 11.44072 1.6
More than 2pks 2.089327 0.3
Frequency Missing = 55.550748741
AMOUNT OF BEER AT ONE TIME
Q25A Frequency Percent
──────────────────────────────────────Never drink this 308.4085 43.9
12+ drinks 33.42873 4.8
9-11 drinks 20.56674 2.9
5-8 drinks 63.02082 9.0
3-4 drinks 71.47879 10.2
2 drinks 47.46877 6.8
1 drink 72.21541 10.3
< 1 drink 85.50284 12.2
Frequency Missing = 49.909417545
AMOUNT OF WINE COOLERS AT ONE TIME
Q25B Frequency Percent
──────────────────────────────────────
Never drink this 248.9476 36.9
12+ drinks 27.44538 4.1
9-11 drinks 19.2967 2.9
5-8 drinks 54.12885 8.0
3-4 drinks 91.57756 13.6
2 drinks 73.96022 11.0
1 drink 97.53749 14.5
< 1 drink 60.9408 9.0
Frequency Missing = 78.165411462
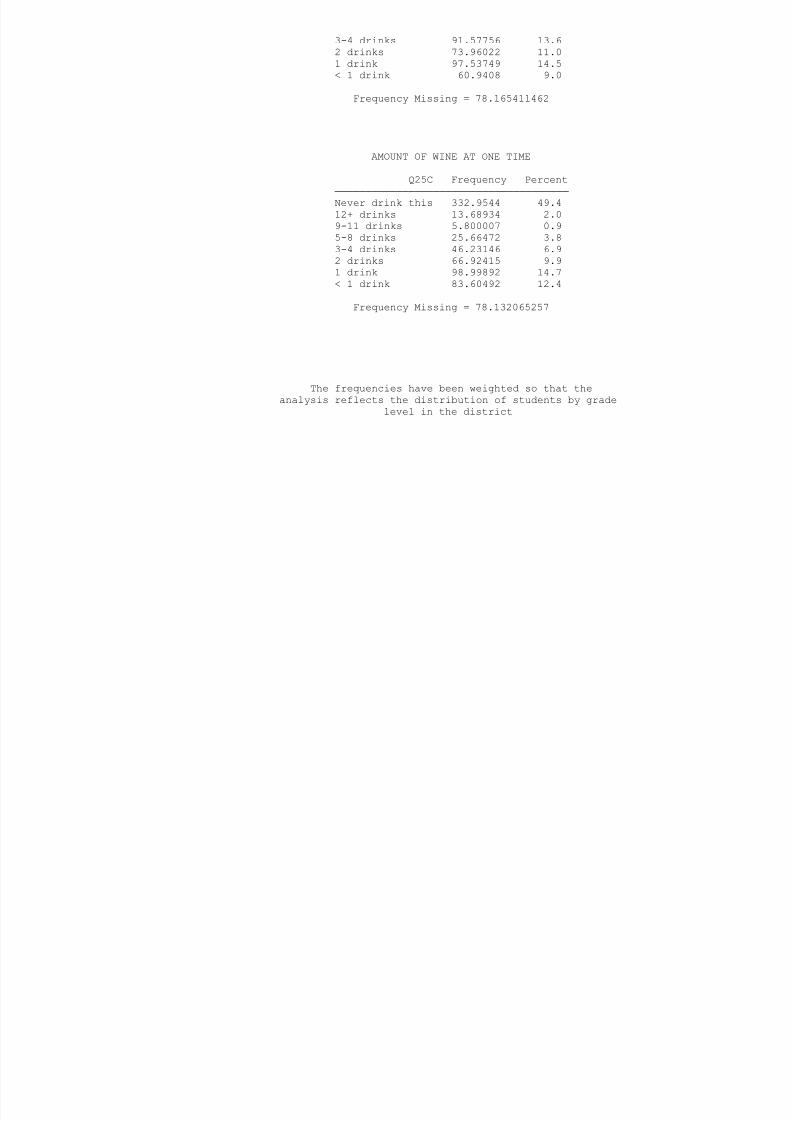
8/14/2019 BOWIE COUNTY - Texarkana ISD - 1999 Texas School Survey of Drug and Alcohol Use
http://slidepdf.com/reader/full/bowie-county-texarkana-isd-1999-texas-school-survey-of-drug-and-alcohol 153/185
AMOUNT OF WINE AT ONE TIME
Q25C Frequency Percent
──────────────────────────────────────
Never drink this 332.9544 49.4
12+ drinks 13.68934 2.0
9-11 drinks 5.800007 0.9
5-8 drinks 25.66472 3.8
3-4 drinks 46.23146 6.9
2 drinks 66.92415 9.9
1 drink 98.99892 14.7
< 1 drink 83.60492 12.4
Frequency Missing = 78.132065257
The frequencies have been weighted so that the
analysis reflects the distribution of students by grade
level in the district
Texarkana
Spring 1999
AMOUNT OF LIQUOR AT ONE TIME
Q25D Frequency Percent
──────────────────────────────────────
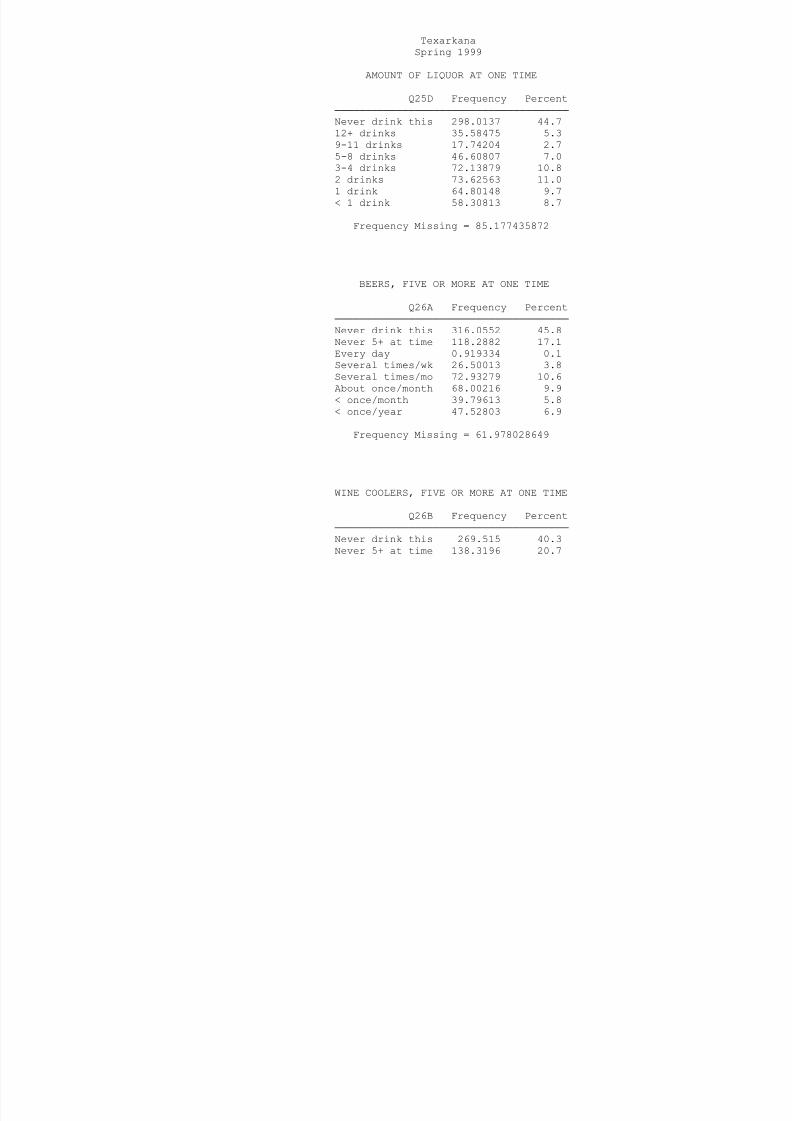
8/14/2019 BOWIE COUNTY - Texarkana ISD - 1999 Texas School Survey of Drug and Alcohol Use
http://slidepdf.com/reader/full/bowie-county-texarkana-isd-1999-texas-school-survey-of-drug-and-alcohol 154/185
Never drink this 298.0137 44.7
12+ drinks 35.58475 5.3
9-11 drinks 17.74204 2.7
5-8 drinks 46.60807 7.03-4 drinks 72.13879 10.8
2 drinks 73.62563 11.0
1 drink 64.80148 9.7
< 1 drink 58.30813 8.7
Frequency Missing = 85.177435872
BEERS, FIVE OR MORE AT ONE TIME
Q26A Frequency Percent
──────────────────────────────────────
Never drink this 316.0552 45.8
Never 5+ at time 118.2882 17.1
Every day 0.919334 0.1
Several times/wk 26.50013 3.8
Several times/mo 72.93279 10.6
About once/month 68.00216 9.9
< once/month 39.79613 5.8
< once/year 47.52803 6.9
Frequency Missing = 61.978028649
WINE COOLERS, FIVE OR MORE AT ONE TIME
Q26B Frequency Percent
──────────────────────────────────────
Never drink this 269.515 40.3
Never 5+ at time 138.3196 20.7
Several times/wk 15.5947 2.3
Several times/mo 58.52544 8.7
About once/month 77.78818 11.6
< once/month 51.56287 7.7
< once/year 57.89074 8.7
Frequency Missing = 82.803480124
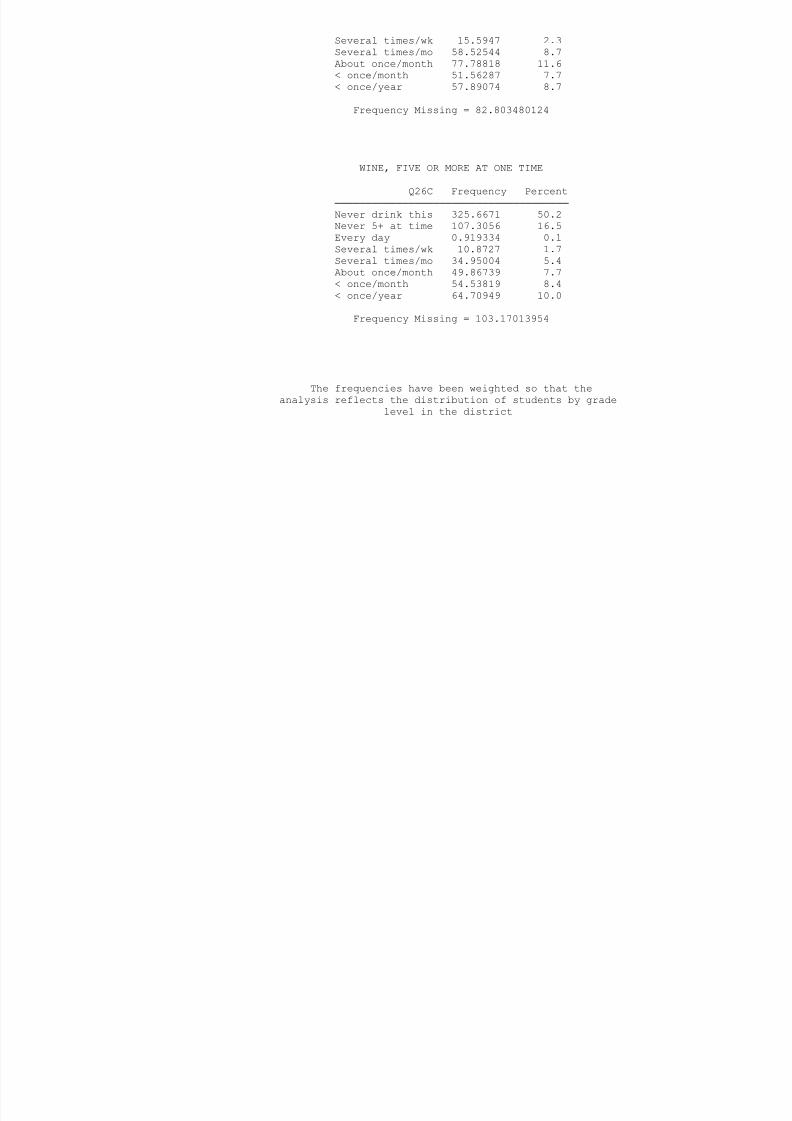
8/14/2019 BOWIE COUNTY - Texarkana ISD - 1999 Texas School Survey of Drug and Alcohol Use
http://slidepdf.com/reader/full/bowie-county-texarkana-isd-1999-texas-school-survey-of-drug-and-alcohol 155/185
q y g
WINE, FIVE OR MORE AT ONE TIME
Q26C Frequency Percent
──────────────────────────────────────
Never drink this 325.6671 50.2
Never 5+ at time 107.3056 16.5
Every day 0.919334 0.1
Several times/wk 10.8727 1.7
Several times/mo 34.95004 5.4
About once/month 49.86739 7.7
< once/month 54.53819 8.4
< once/year 64.70949 10.0
Frequency Missing = 103.17013954
The frequencies have been weighted so that the
analysis reflects the distribution of students by grade
level in the district
Texarkana
Spring 1999
LIQUOR, FIVE OR MORE AT ONE TIME
Q26D Frequency Percent
──────────────────────────────────────
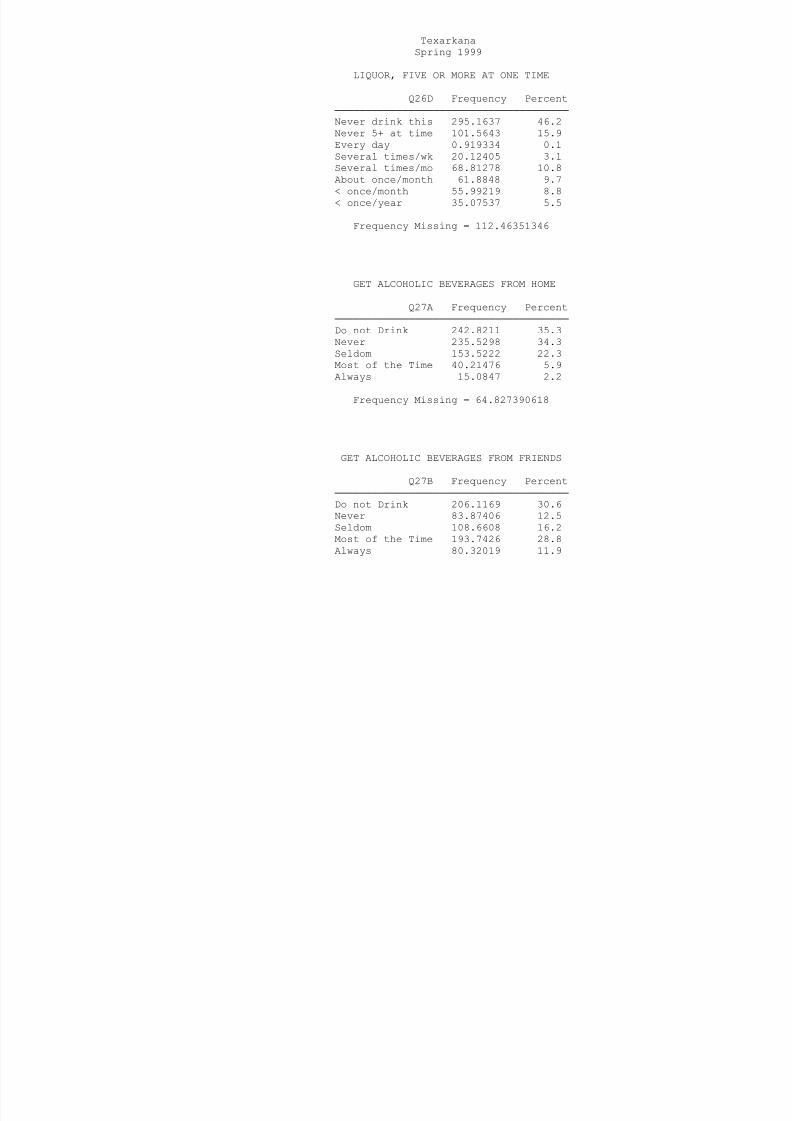
8/14/2019 BOWIE COUNTY - Texarkana ISD - 1999 Texas School Survey of Drug and Alcohol Use
http://slidepdf.com/reader/full/bowie-county-texarkana-isd-1999-texas-school-survey-of-drug-and-alcohol 156/185
Never drink this 295.1637 46.2
Never 5+ at time 101.5643 15.9
Every day 0.919334 0.1
Several times/wk 20.12405 3.1
Several times/mo 68.81278 10.8
About once/month 61.8848 9.7
< once/month 55.99219 8.8
< once/year 35.07537 5.5
Frequency Missing = 112.46351346
GET ALCOHOLIC BEVERAGES FROM HOME
Q27A Frequency Percent
──────────────────────────────────────
Do not Drink 242.8211 35.3
Never 235.5298 34.3
Seldom 153.5222 22.3
Most of the Time 40.21476 5.9
Always 15.0847 2.2
Frequency Missing = 64.827390618
GET ALCOHOLIC BEVERAGES FROM FRIENDS
Q27B Frequency Percent
──────────────────────────────────────
Do not Drink 206.1169 30.6
Never 83.87406 12.5
Seldom 108.6608 16.2
Most of the Time 193.7426 28.8
Always 80.32019 11.9
Frequency Missing = 79.28544465
GET ALCOHOLIC BEVERAGES FROM A STORE
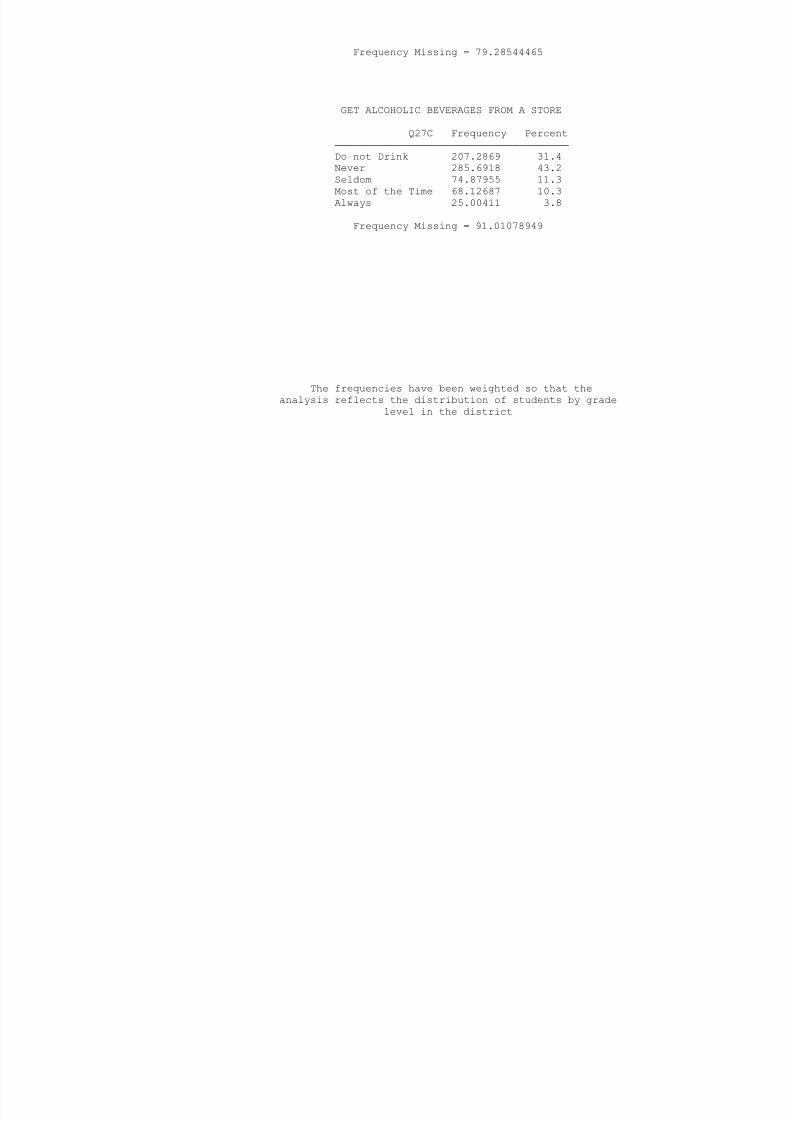
8/14/2019 BOWIE COUNTY - Texarkana ISD - 1999 Texas School Survey of Drug and Alcohol Use
http://slidepdf.com/reader/full/bowie-county-texarkana-isd-1999-texas-school-survey-of-drug-and-alcohol 157/185
Q27C Frequency Percent
──────────────────────────────────────
Do not Drink 207.2869 31.4
Never 285.6918 43.2
Seldom 74.87955 11.3
Most of the Time 68.12687 10.3
Always 25.00411 3.8
Frequency Missing = 91.01078949
The frequencies have been weighted so that the
analysis reflects the distribution of students by grade
level in the district
Texarkana
Spring 1999
GET ALCOHOLIC BEVERAGES AT PARTIES
Q27D Frequency Percent
──────────────────────────────────────
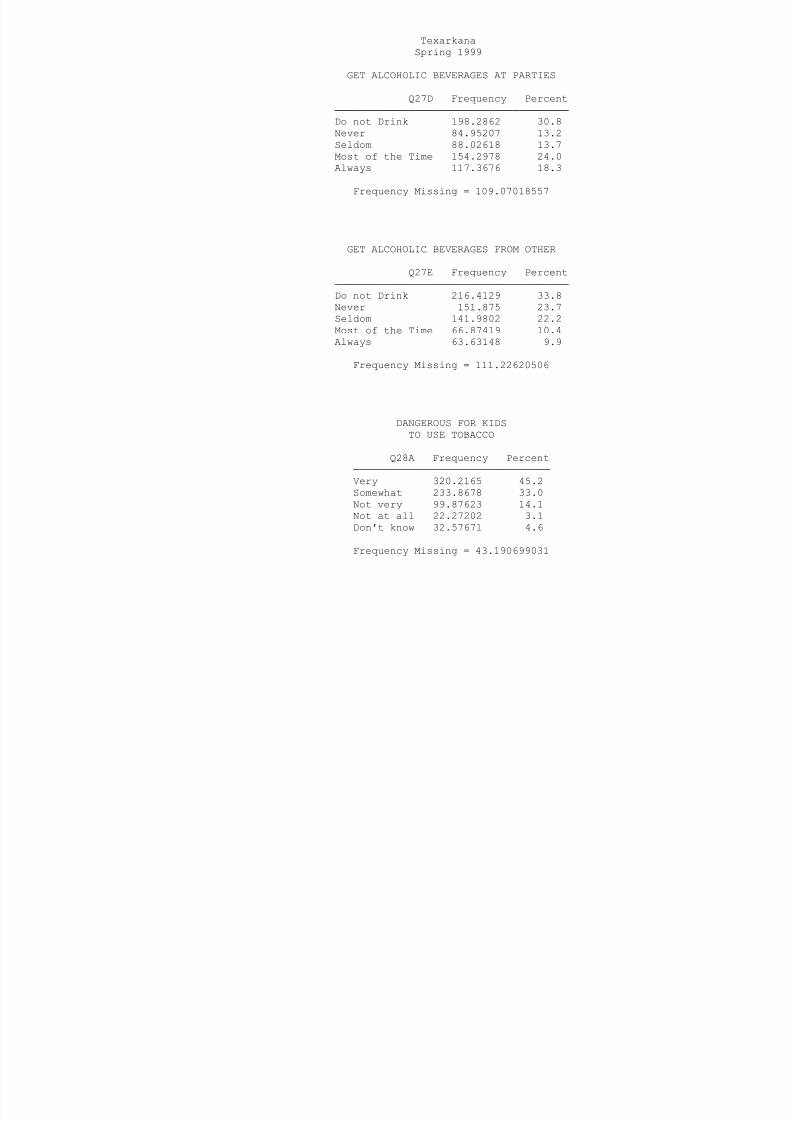
8/14/2019 BOWIE COUNTY - Texarkana ISD - 1999 Texas School Survey of Drug and Alcohol Use
http://slidepdf.com/reader/full/bowie-county-texarkana-isd-1999-texas-school-survey-of-drug-and-alcohol 158/185
Do not Drink 198.2862 30.8
Never 84.95207 13.2
Seldom 88.02618 13.7
Most of the Time 154.2978 24.0
Always 117.3676 18.3
Frequency Missing = 109.07018557
GET ALCOHOLIC BEVERAGES FROM OTHER
Q27E Frequency Percent
──────────────────────────────────────
Do not Drink 216.4129 33.8Never 151.875 23.7
Seldom 141.9802 22.2
Most of the Time 66.87419 10.4
Always 63.63148 9.9
Frequency Missing = 111.22620506
DANGEROUS FOR KIDS
TO USE TOBACCO
Q28A Frequency Percent
────────────────────────────────
Very 320.2165 45.2
Somewhat 233.8678 33.0
Not very 99.87623 14.1
Not at all 22.27202 3.1
Don't know 32.57671 4.6
Frequency Missing = 43.190699031
DANGEROUS FOR KIDS
TO USE ALCOHOL

8/14/2019 BOWIE COUNTY - Texarkana ISD - 1999 Texas School Survey of Drug and Alcohol Use
http://slidepdf.com/reader/full/bowie-county-texarkana-isd-1999-texas-school-survey-of-drug-and-alcohol 159/185
Q28B Frequency Percent
────────────────────────────────
Very 353.678 52.0
Somewhat 228.0753 33.5
Not very 65.42069 9.6
Not at all 9.728002 1.4
Don't know 23.41734 3.4
Frequency Missing = 71.680738811
The frequencies have been weighted so that the
analysis reflects the distribution of students by grade
level in the district
Texarkana
Spring 1999
DANGEROUS FOR KIDS
TO USE INHALANTS
Q28C Frequency Percent
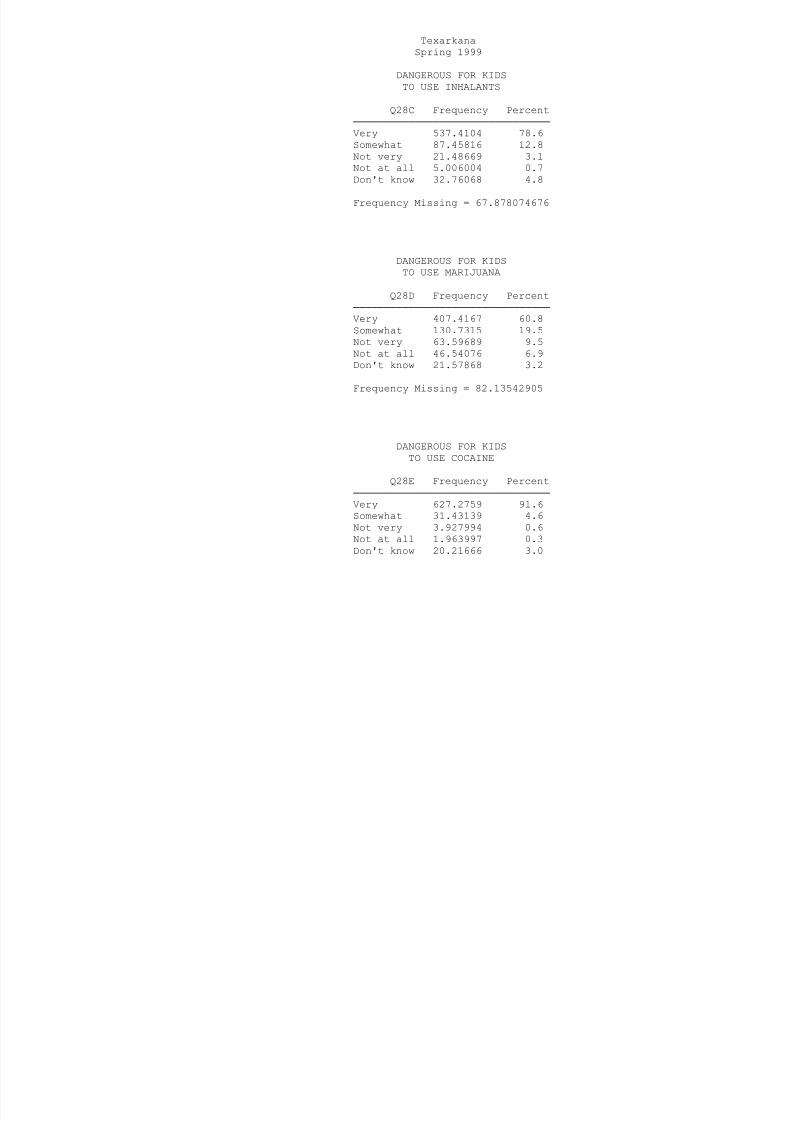
8/14/2019 BOWIE COUNTY - Texarkana ISD - 1999 Texas School Survey of Drug and Alcohol Use
http://slidepdf.com/reader/full/bowie-county-texarkana-isd-1999-texas-school-survey-of-drug-and-alcohol 160/185
────────────────────────────────
Very 537.4104 78.6
Somewhat 87.45816 12.8
Not very 21.48669 3.1
Not at all 5.006004 0.7
Don't know 32.76068 4.8
Frequency Missing = 67.878074676
DANGEROUS FOR KIDS
TO USE MARIJUANA
Q28D Frequency Percent────────────────────────────────
Very 407.4167 60.8
Somewhat 130.7315 19.5
Not very 63.59689 9.5
Not at all 46.54076 6.9
Don't know 21.57868 3.2
Frequency Missing = 82.13542905
DANGEROUS FOR KIDS
TO USE COCAINE
Q28E Frequency Percent
────────────────────────────────
Very 627.2759 91.6
Somewhat 31.43139 4.6
Not very 3.927994 0.6
Not at all 1.963997 0.3
Don't know 20.21666 3.0
Frequency Missing = 67.184109772
DANGEROUS FOR KIDS TO USE CRACK

8/14/2019 BOWIE COUNTY - Texarkana ISD - 1999 Texas School Survey of Drug and Alcohol Use
http://slidepdf.com/reader/full/bowie-county-texarkana-isd-1999-texas-school-survey-of-drug-and-alcohol 161/185
Q28F Frequency Percent
────────────────────────────────
Very 608.3545 91.8
Somewhat 25.66535 3.9
Not very 0.919334 0.1
Not at all 4.847328 0.7
Don't know 23.25867 3.5
Frequency Missing = 88.954808608
The frequencies have been weighted so that the
analysis reflects the distribution of students by grade
level in the district
Texarkana
Spring 1999
DANGEROUS FOR KIDS
TO USE ECSTASY
Q28G Frequency Percent
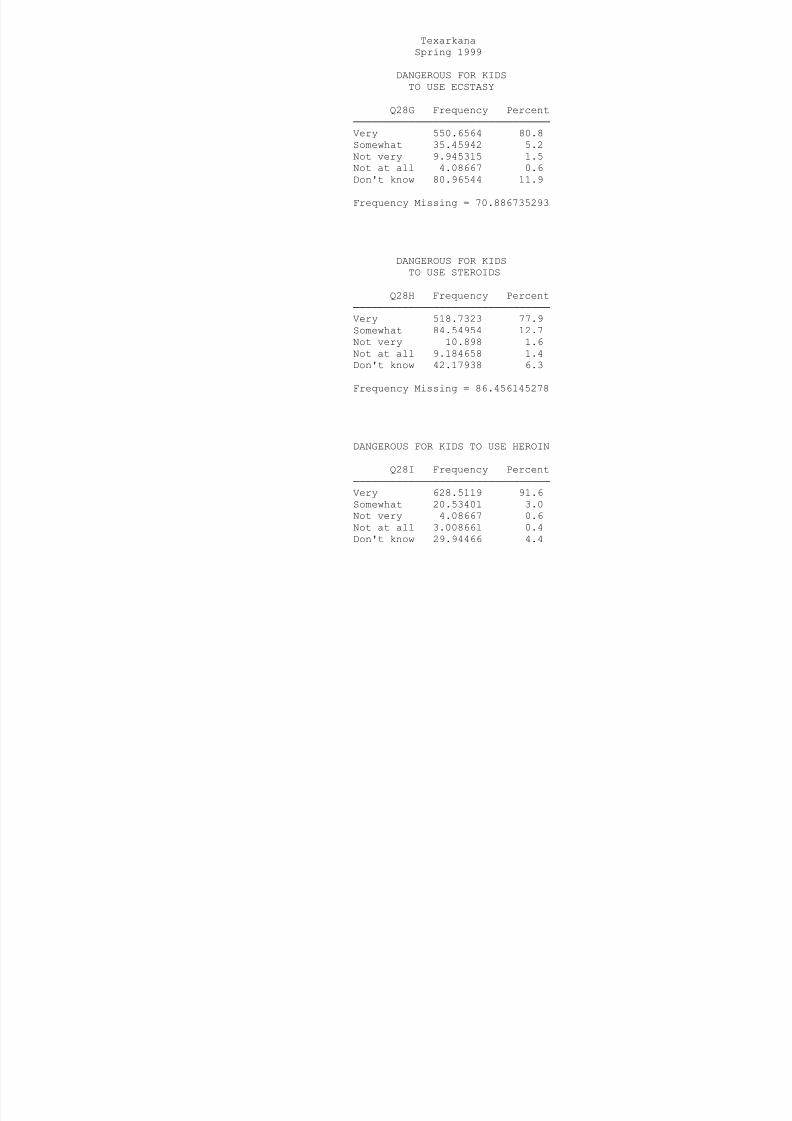
8/14/2019 BOWIE COUNTY - Texarkana ISD - 1999 Texas School Survey of Drug and Alcohol Use
http://slidepdf.com/reader/full/bowie-county-texarkana-isd-1999-texas-school-survey-of-drug-and-alcohol 162/185
────────────────────────────────
Very 550.6564 80.8
Somewhat 35.45942 5.2
Not very 9.945315 1.5
Not at all 4.08667 0.6
Don't know 80.96544 11.9
Frequency Missing = 70.886735293
DANGEROUS FOR KIDS
TO USE STEROIDS
Q28H Frequency Percent────────────────────────────────
Very 518.7323 77.9
Somewhat 84.54954 12.7
Not very 10.898 1.6
Not at all 9.184658 1.4
Don't know 42.17938 6.3
Frequency Missing = 86.456145278
DANGEROUS FOR KIDS TO USE HEROIN
Q28I Frequency Percent
────────────────────────────────
Very 628.5119 91.6
Somewhat 20.53401 3.0
Not very 4.08667 0.6
Not at all 3.008661 0.4
Don't know 29.94466 4.4
Frequency Missing = 65.914077602
USE MARIJUANA AS JOINTS
Q29A Frequency Percent
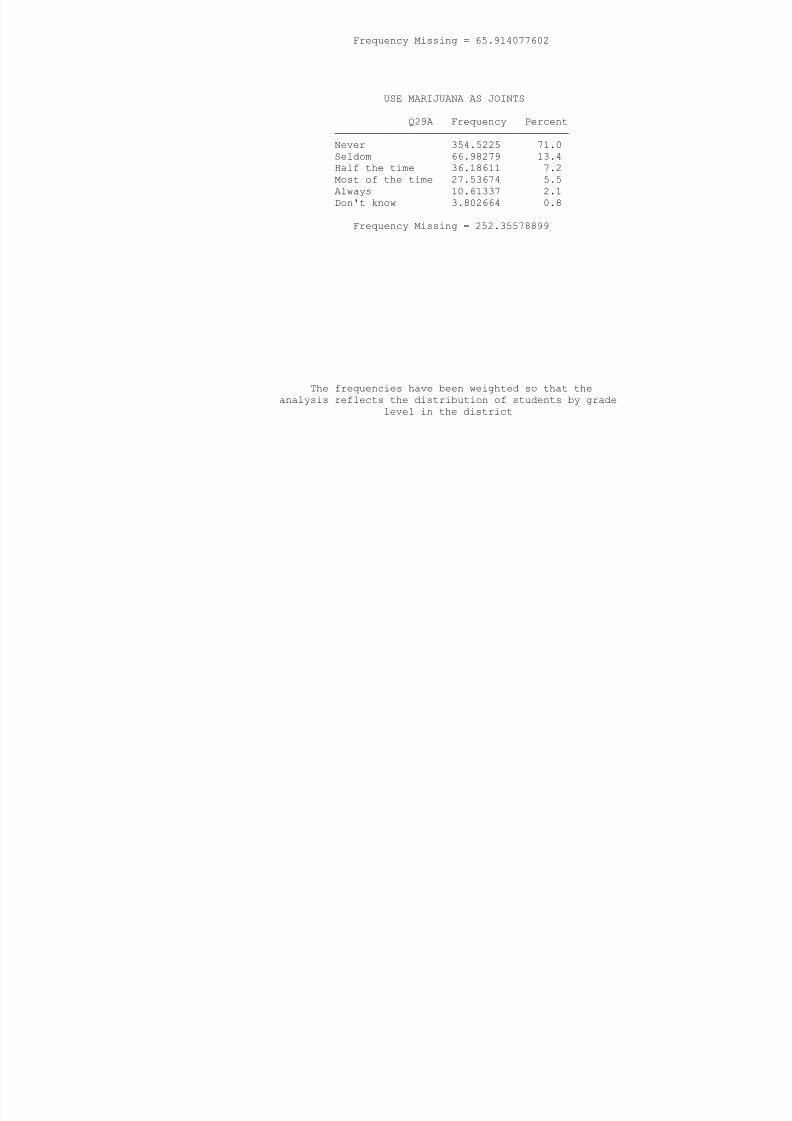
8/14/2019 BOWIE COUNTY - Texarkana ISD - 1999 Texas School Survey of Drug and Alcohol Use
http://slidepdf.com/reader/full/bowie-county-texarkana-isd-1999-texas-school-survey-of-drug-and-alcohol 163/185
Q29A Frequency Percent
──────────────────────────────────────
Never 354.5225 71.0
Seldom 66.98279 13.4
Half the time 36.18611 7.2
Most of the time 27.53674 5.5
Always 10.61337 2.1
Don't know 3.802664 0.8
Frequency Missing = 252.35578899
The frequencies have been weighted so that the
analysis reflects the distribution of students by grade
level in the district
Texarkana
Spring 1999
USE MARIJUANA AS BLUNTS
Q29B Frequency Percent
──────────────────────────────────────
Never 334 4905 70 6
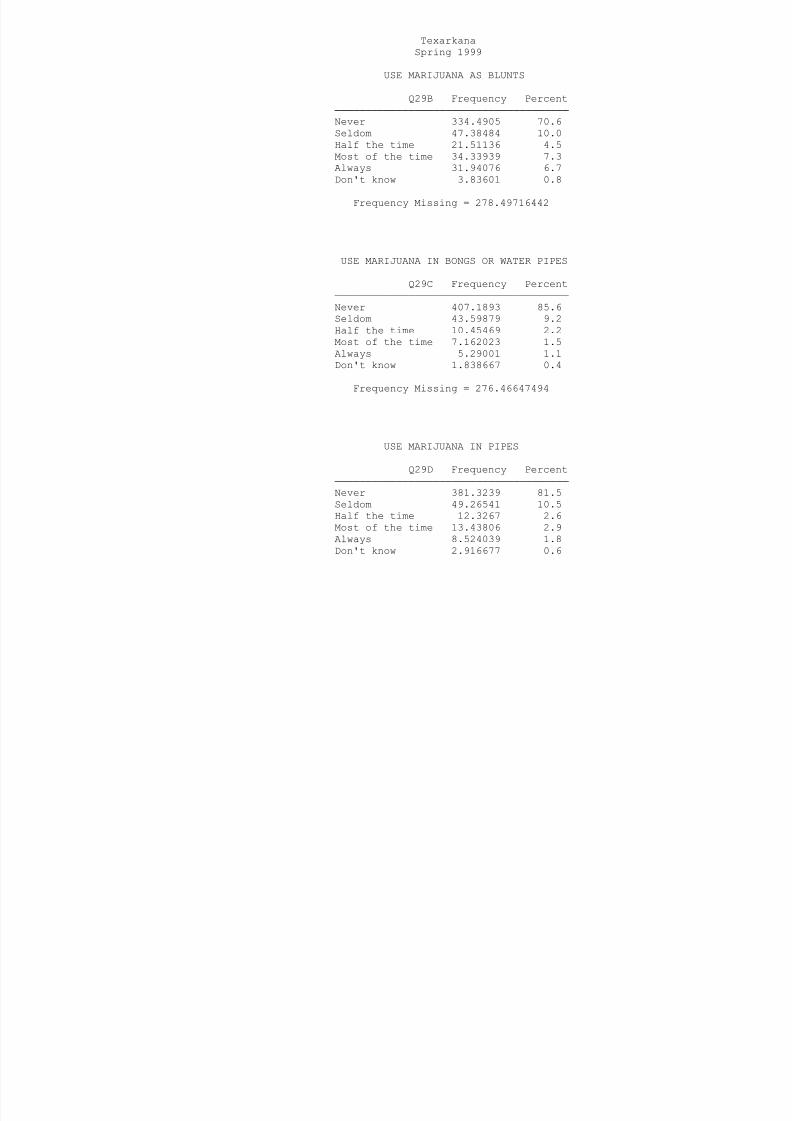
8/14/2019 BOWIE COUNTY - Texarkana ISD - 1999 Texas School Survey of Drug and Alcohol Use
http://slidepdf.com/reader/full/bowie-county-texarkana-isd-1999-texas-school-survey-of-drug-and-alcohol 164/185
Never 334.4905 70.6
Seldom 47.38484 10.0
Half the time 21.51136 4.5
Most of the time 34.33939 7.3
Always 31.94076 6.7
Don't know 3.83601 0.8
Frequency Missing = 278.49716442
USE MARIJUANA IN BONGS OR WATER PIPES
Q29C Frequency Percent
──────────────────────────────────────Never 407.1893 85.6
Seldom 43.59879 9.2
Half the time 10.45469 2.2
Most of the time 7.162023 1.5
Always 5.29001 1.1
Don't know 1.838667 0.4
Frequency Missing = 276.46647494
USE MARIJUANA IN PIPES
Q29D Frequency Percent
──────────────────────────────────────
Never 381.3239 81.5
Seldom 49.26541 10.5
Half the time 12.3267 2.6
Most of the time 13.43806 2.9
Always 8.524039 1.8
Don't know 2.916677 0.6
Frequency Missing = 284.20518803
USE MARIJUANA OTHER WAYS
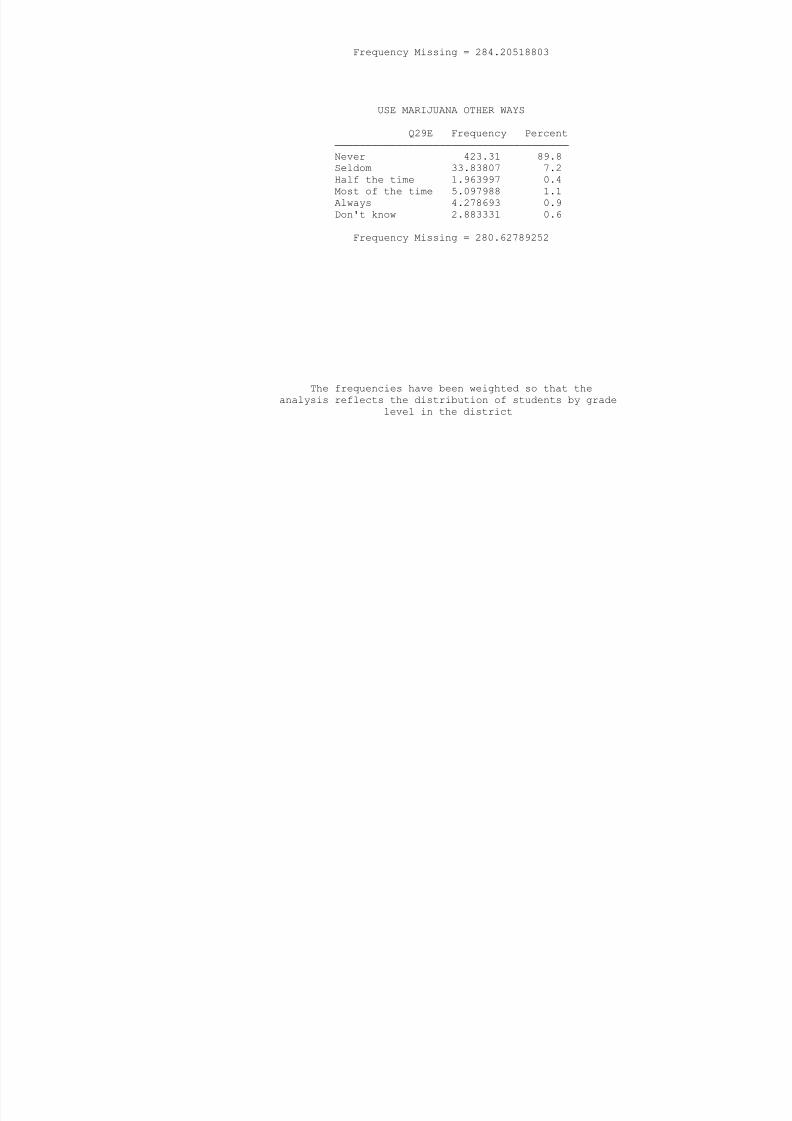
8/14/2019 BOWIE COUNTY - Texarkana ISD - 1999 Texas School Survey of Drug and Alcohol Use
http://slidepdf.com/reader/full/bowie-county-texarkana-isd-1999-texas-school-survey-of-drug-and-alcohol 165/185
Q29E Frequency Percent
──────────────────────────────────────
Never 423.31 89.8
Seldom 33.83807 7.2
Half the time 1.963997 0.4
Most of the time 5.097988 1.1
Always 4.278693 0.9
Don't know 2.883331 0.6
Frequency Missing = 280.62789252
The frequencies have been weighted so that the
analysis reflects the distribution of students by grade
level in the district
Texarkana
Spring 1999
DAYS SKIPPED SINCE SEPTEMBER
Q30A Frequency Percent
──────────────────────────────
None 514 482 72 4
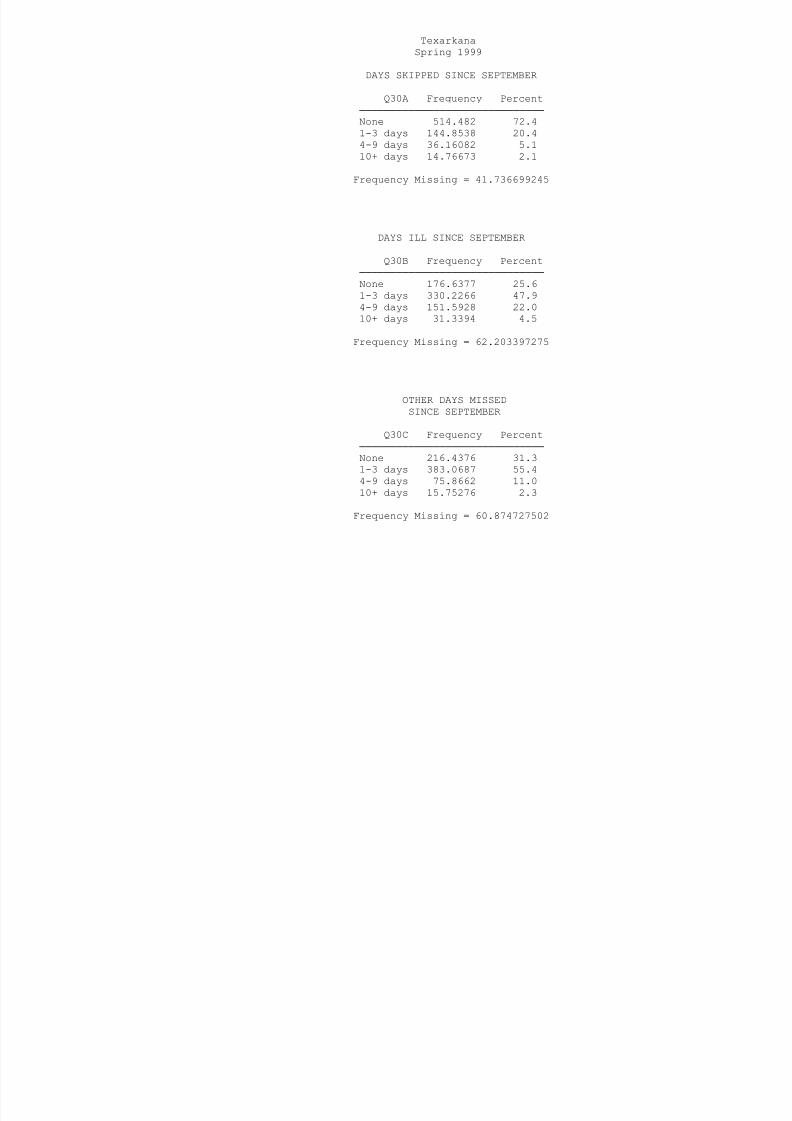
8/14/2019 BOWIE COUNTY - Texarkana ISD - 1999 Texas School Survey of Drug and Alcohol Use
http://slidepdf.com/reader/full/bowie-county-texarkana-isd-1999-texas-school-survey-of-drug-and-alcohol 166/185
None 514.482 72.4
1-3 days 144.8538 20.4
4-9 days 36.16082 5.1
10+ days 14.76673 2.1
Frequency Missing = 41.736699245
DAYS ILL SINCE SEPTEMBER
Q30B Frequency Percent
──────────────────────────────
None 176.6377 25.6
1-3 days 330.2266 47.94-9 days 151.5928 22.0
10+ days 31.3394 4.5
Frequency Missing = 62.203397275
OTHER DAYS MISSED
SINCE SEPTEMBER
Q30C Frequency Percent──────────────────────────────
None 216.4376 31.3
1-3 days 383.0687 55.4
4-9 days 75.8662 11.0
10+ days 15.75276 2.3
Frequency Missing = 60.874727502
SENT TO PRINCIPAL/DEAN
SINCE SEPTEMBER
Q30D Frequency Percent
──────────────────────────────
None 592.7432 84.8
1-3 days 83.84009 12.0
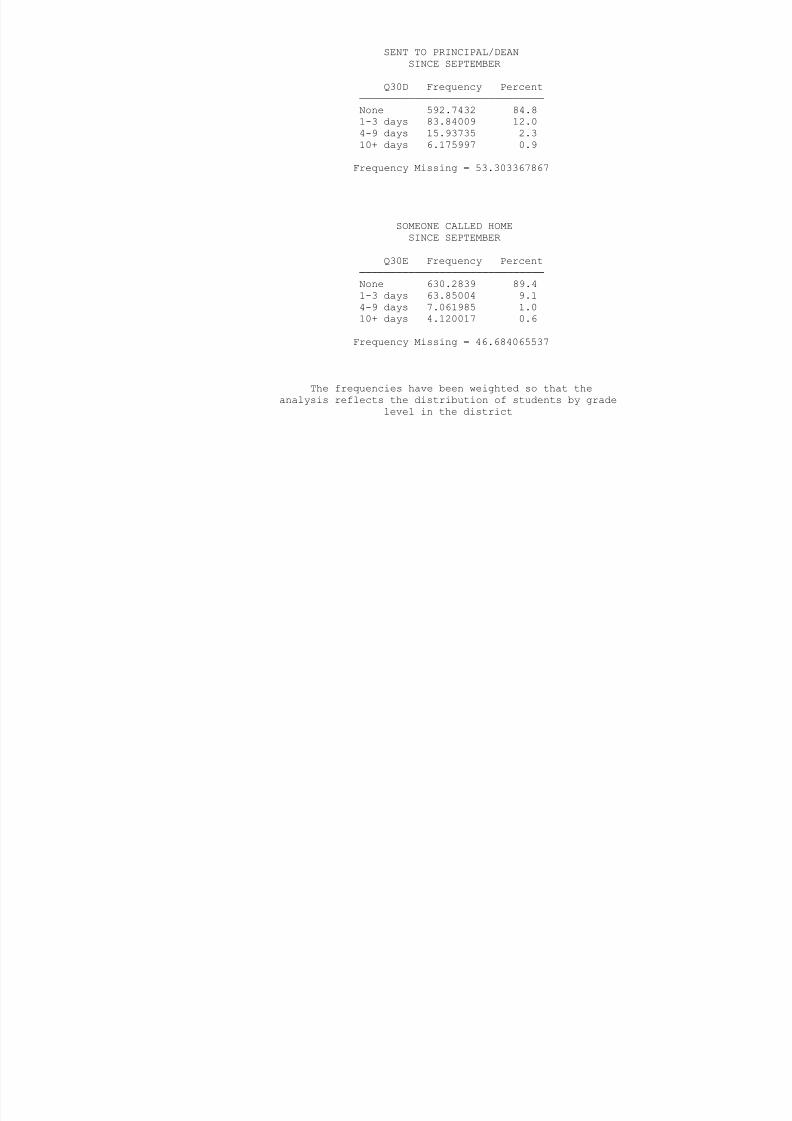
8/14/2019 BOWIE COUNTY - Texarkana ISD - 1999 Texas School Survey of Drug and Alcohol Use
http://slidepdf.com/reader/full/bowie-county-texarkana-isd-1999-texas-school-survey-of-drug-and-alcohol 167/185
1 3 days 83.84009 12.0
4-9 days 15.93735 2.3
10+ days 6.175997 0.9
Frequency Missing = 53.303367867
SOMEONE CALLED HOME
SINCE SEPTEMBER
Q30E Frequency Percent
──────────────────────────────
None 630.2839 89.4
1-3 days 63.85004 9.14-9 days 7.061985 1.0
10+ days 4.120017 0.6
Frequency Missing = 46.684065537
The frequencies have been weighted so that the
analysis reflects the distribution of students by grade
level in the district
Texarkana
Spring 1999
IN TROUBLE FOR DRINKING
SINCE SEPTEMBER
Q30F Frequency Percent
──────────────────────────────
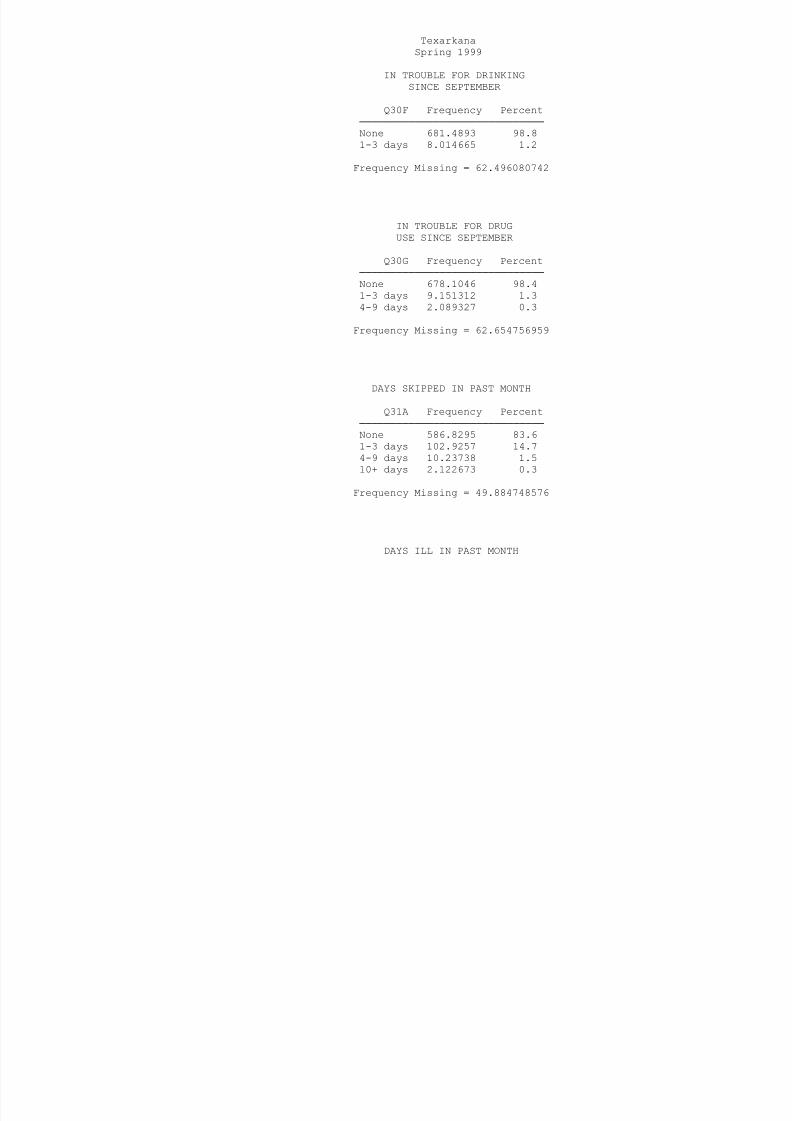
8/14/2019 BOWIE COUNTY - Texarkana ISD - 1999 Texas School Survey of Drug and Alcohol Use
http://slidepdf.com/reader/full/bowie-county-texarkana-isd-1999-texas-school-survey-of-drug-and-alcohol 168/185
None 681.4893 98.8
1-3 days 8.014665 1.2
Frequency Missing = 62.496080742
IN TROUBLE FOR DRUG
USE SINCE SEPTEMBER
Q30G Frequency Percent
──────────────────────────────
None 678.1046 98.4
1-3 days 9.151312 1.34-9 days 2.089327 0.3
Frequency Missing = 62.654756959
DAYS SKIPPED IN PAST MONTH
Q31A Frequency Percent
──────────────────────────────
None 586.8295 83.61-3 days 102.9257 14.7
4-9 days 10.23738 1.5
10+ days 2.122673 0.3
Frequency Missing = 49.884748576
DAYS ILL IN PAST MONTH
Q31B Frequency Percent
──────────────────────────────
None 447.8296 65.0
1-3 days 215.8176 31.3
4-9 days 21.01004 3.1
10+ days 4.053324 0.6
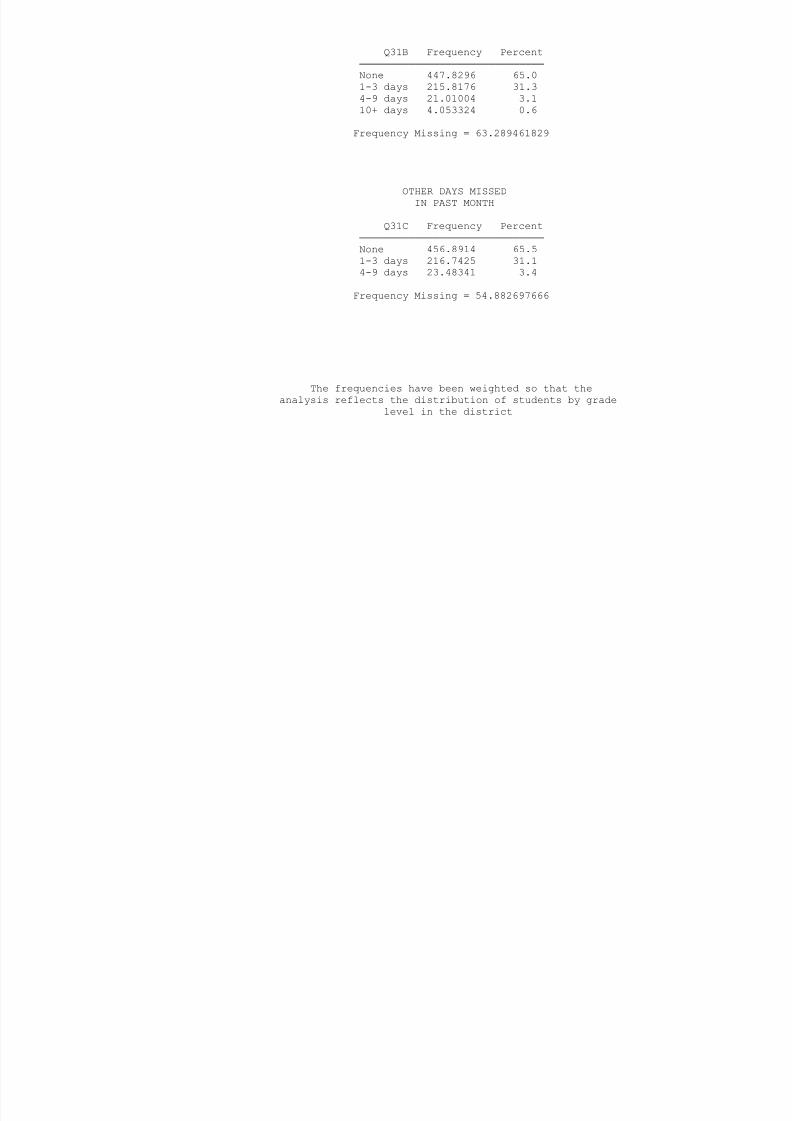
8/14/2019 BOWIE COUNTY - Texarkana ISD - 1999 Texas School Survey of Drug and Alcohol Use
http://slidepdf.com/reader/full/bowie-county-texarkana-isd-1999-texas-school-survey-of-drug-and-alcohol 169/185
Frequency Missing = 63.289461829
OTHER DAYS MISSED
IN PAST MONTH
Q31C Frequency Percent
──────────────────────────────
None 456.8914 65.5
1-3 days 216.7425 31.1
4-9 days 23.48341 3.4
Frequency Missing = 54.882697666
The frequencies have been weighted so that the
analysis reflects the distribution of students by grade
level in the district
Texarkana
Spring 1999
SENT TO PRINCIPAL/DEAN
IN PAST MONTH
Q31D Frequency Percent
──────────────────────────────
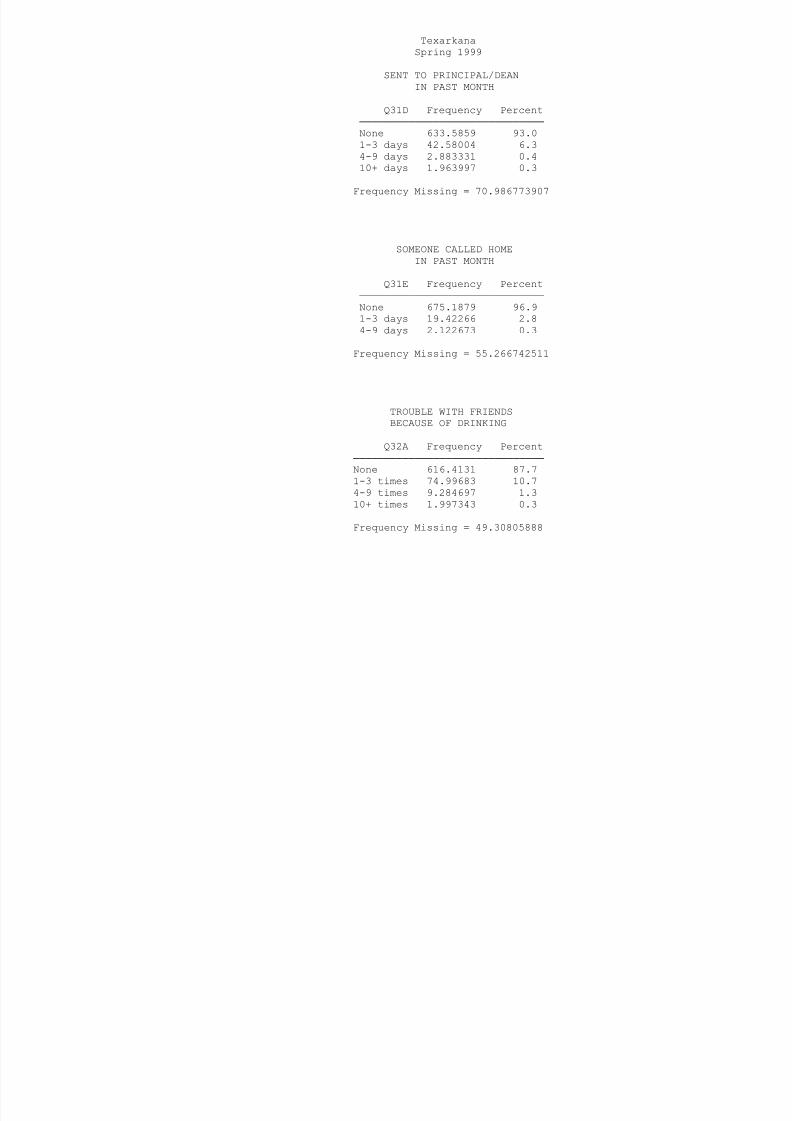
8/14/2019 BOWIE COUNTY - Texarkana ISD - 1999 Texas School Survey of Drug and Alcohol Use
http://slidepdf.com/reader/full/bowie-county-texarkana-isd-1999-texas-school-survey-of-drug-and-alcohol 170/185
None 633.5859 93.0
1-3 days 42.58004 6.3
4-9 days 2.883331 0.4
10+ days 1.963997 0.3
Frequency Missing = 70.986773907
SOMEONE CALLED HOME
IN PAST MONTH
Q31E Frequency Percent
──────────────────────────────None 675.1879 96.9
1-3 days 19.42266 2.8
4-9 days 2.122673 0.3
Frequency Missing = 55.266742511
TROUBLE WITH FRIENDS
BECAUSE OF DRINKING
Q32A Frequency Percent
───────────────────────────────
None 616.4131 87.7
1-3 times 74.99683 10.7
4-9 times 9.284697 1.3
10+ times 1.997343 0.3
Frequency Missing = 49.30805888
DRIVEN A CAR AFTER
A GOOD BIT TO DRINK
Q32B Frequency Percent
───────────────────────────────
None 590.8909 85.6

8/14/2019 BOWIE COUNTY - Texarkana ISD - 1999 Texas School Survey of Drug and Alcohol Use
http://slidepdf.com/reader/full/bowie-county-texarkana-isd-1999-texas-school-survey-of-drug-and-alcohol 171/185
1-3 times 68.72885 10.0
4-9 times 16.67209 2.4
10+ times 13.8221 2.0
Frequency Missing = 61.886044841
CRITICIZED BY DATE
BECAUSE OF DRINKING
Q32C Frequency Percent
───────────────────────────────
None 635.3251 92.81-3 times 38.71874 5.7
4-9 times 6.084014 0.9
10+ times 4.278693 0.6
Frequency Missing = 67.593446015
The frequencies have been weighted so that the
analysis reflects the distribution of students by grade
level in the district
Texarkana
Spring 1999
TROUBLE WITH POLICE
BECAUSE OF DRINKING
Q32D Frequency Percent
───────────────────────────────

8/14/2019 BOWIE COUNTY - Texarkana ISD - 1999 Texas School Survey of Drug and Alcohol Use
http://slidepdf.com/reader/full/bowie-county-texarkana-isd-1999-texas-school-survey-of-drug-and-alcohol 172/185
None 644.8685 95.9
1-3 times 23.66738 3.5
4-9 times 4.08667 0.6
Frequency Missing = 79.377428458
TROUBLE WITH FRIENDS
BECAUSE OF DRUG USE
Q32E Frequency Percent
───────────────────────────────
None 646.8739 94.91-3 times 29.67665 4.4
4-9 times 4.08667 0.6
10+ times 1.07801 0.2
Frequency Missing = 70.284754198
DRIVEN A CAR WHILE
HIGH FROM DRUGS
Q32F Frequency Percent
───────────────────────────────
None 602.4731 90.8
1-3 times 31.96605 4.8
4-9 times 11.24869 1.7
10+ times 17.80874 2.7
Frequency Missing = 88.503448924
CRITICIZED BY DATE
BECAUSE OF DRUG USE
Q32G Frequency Percent
───────────────────────────────
None 642.9965 94.3
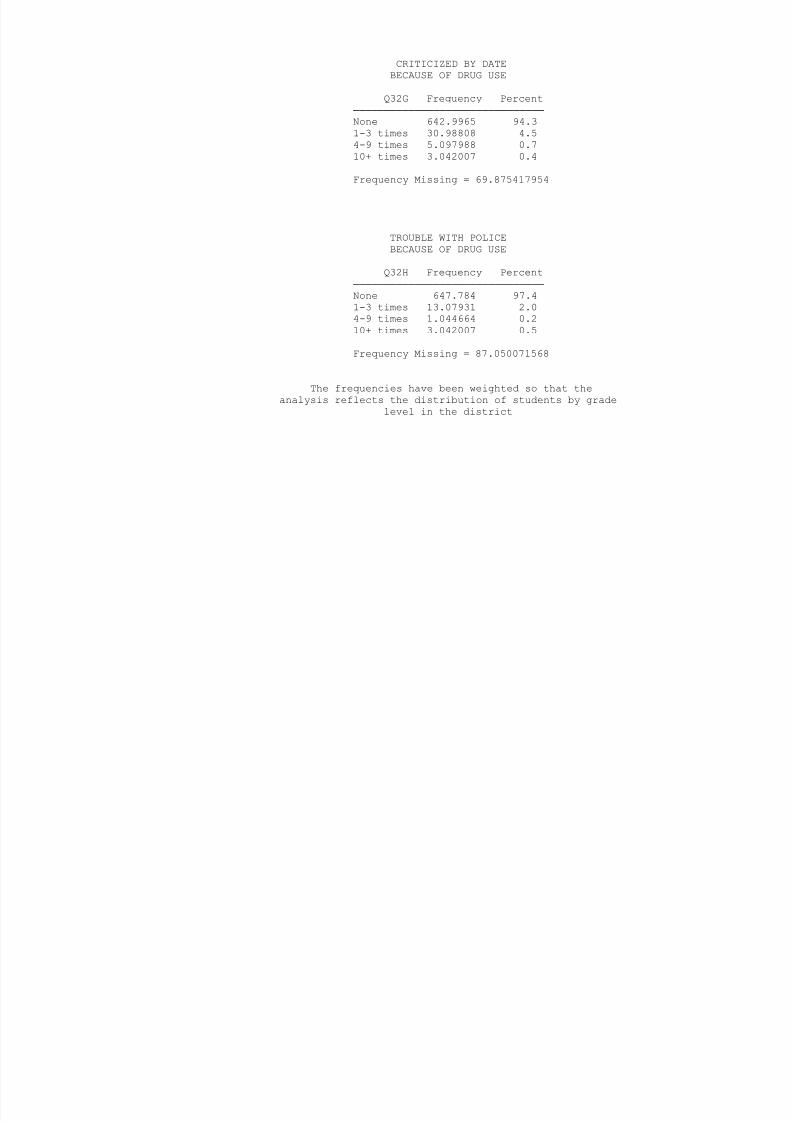
8/14/2019 BOWIE COUNTY - Texarkana ISD - 1999 Texas School Survey of Drug and Alcohol Use
http://slidepdf.com/reader/full/bowie-county-texarkana-isd-1999-texas-school-survey-of-drug-and-alcohol 173/185
1-3 times 30.98808 4.5
4-9 times 5.097988 0.7
10+ times 3.042007 0.4
Frequency Missing = 69.875417954
TROUBLE WITH POLICE
BECAUSE OF DRUG USE
Q32H Frequency Percent
───────────────────────────────
None 647.784 97.41-3 times 13.07931 2.0
4-9 times 1.044664 0.2
10+ times 3.042007 0.5
Frequency Missing = 87.050071568
The frequencies have been weighted so that the
analysis reflects the distribution of students by grade
level in the district
Texarkana
Spring 1999
CLASS DAYS DRUNK ON
ALCOHOL SINCE SEPT
Q33A Frequency Percent
──────────────────────────────
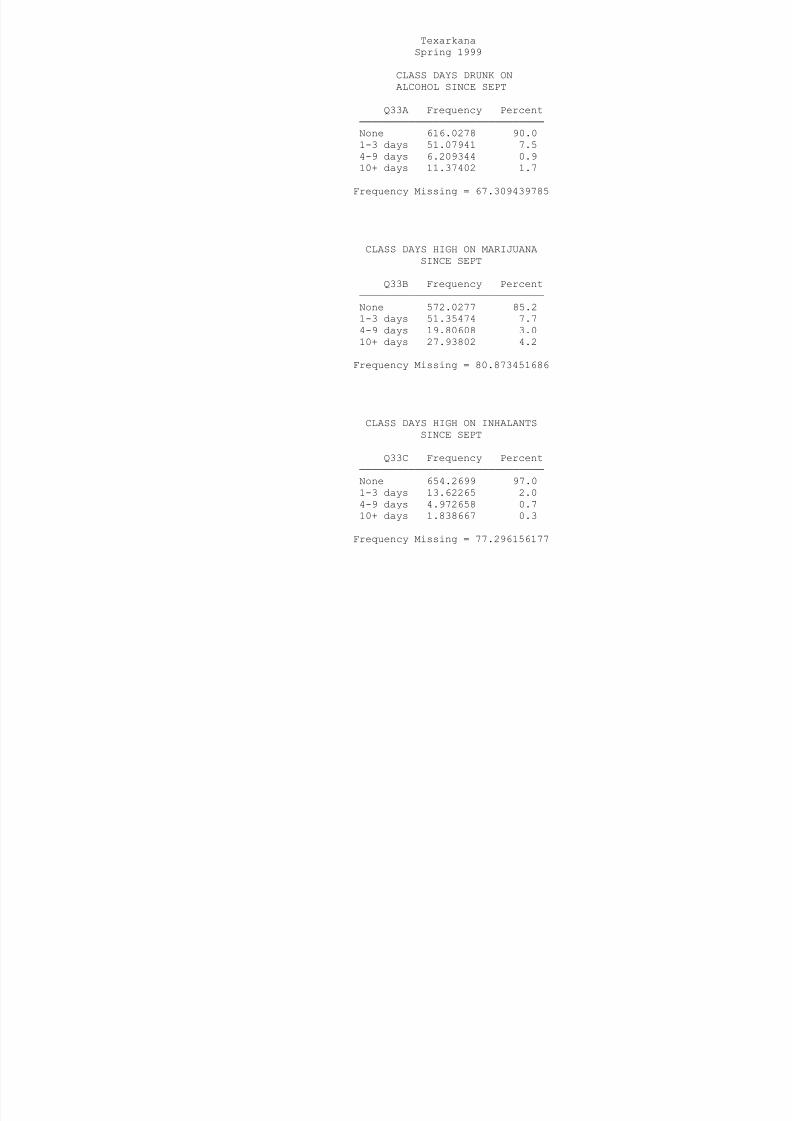
8/14/2019 BOWIE COUNTY - Texarkana ISD - 1999 Texas School Survey of Drug and Alcohol Use
http://slidepdf.com/reader/full/bowie-county-texarkana-isd-1999-texas-school-survey-of-drug-and-alcohol 174/185
None 616.0278 90.0
1-3 days 51.07941 7.5
4-9 days 6.209344 0.9
10+ days 11.37402 1.7
Frequency Missing = 67.309439785
CLASS DAYS HIGH ON MARIJUANA
SINCE SEPT
Q33B Frequency Percent
──────────────────────────────None 572.0277 85.2
1-3 days 51.35474 7.7
4-9 days 19.80608 3.0
10+ days 27.93802 4.2
Frequency Missing = 80.873451686
CLASS DAYS HIGH ON INHALANTS
SINCE SEPT
Q33C Frequency Percent
──────────────────────────────
None 654.2699 97.0
1-3 days 13.62265 2.0
4-9 days 4.972658 0.7
10+ days 1.838667 0.3
Frequency Missing = 77.296156177
CLASS DAYS HIGH
ON OTHER DRUG(S)
Q33D Frequency Percent
──────────────────────────────
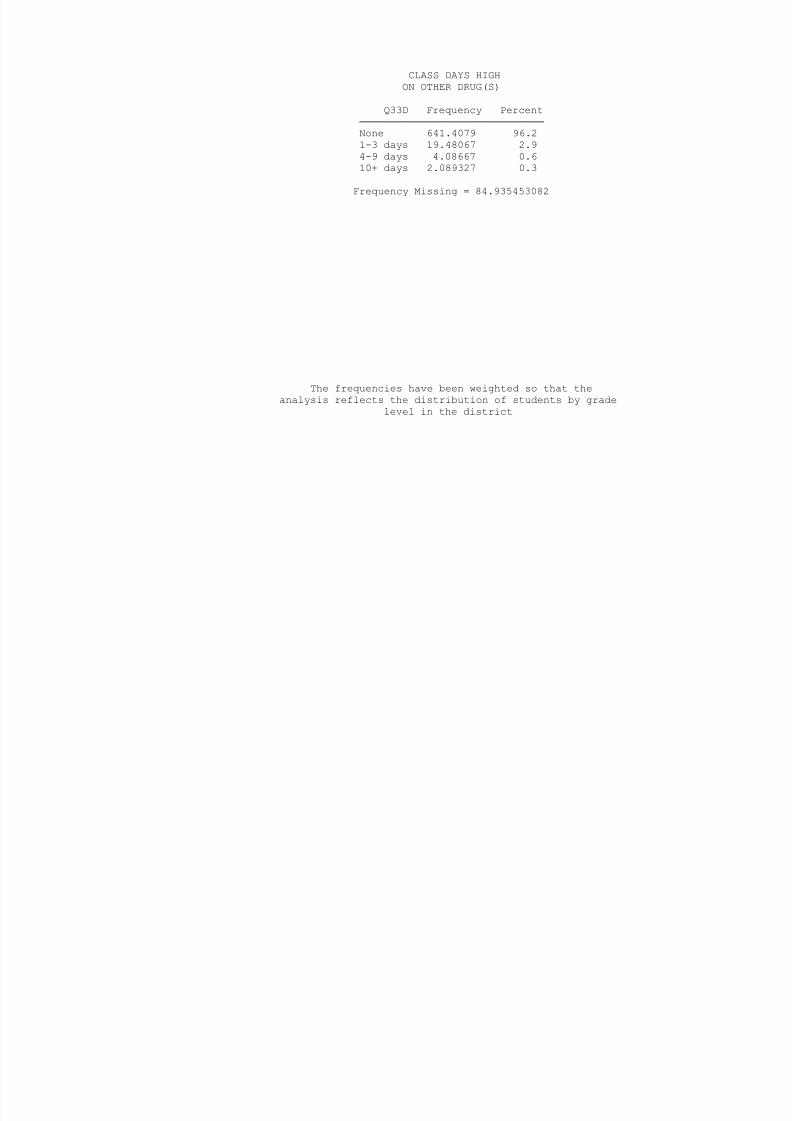
8/14/2019 BOWIE COUNTY - Texarkana ISD - 1999 Texas School Survey of Drug and Alcohol Use
http://slidepdf.com/reader/full/bowie-county-texarkana-isd-1999-texas-school-survey-of-drug-and-alcohol 175/185
None 641.4079 96.2
1-3 days 19.48067 2.9
4-9 days 4.08667 0.6
10+ days 2.089327 0.3
Frequency Missing = 84.935453082
The frequencies have been weighted so that the
analysis reflects the distribution of students by grade
level in the district
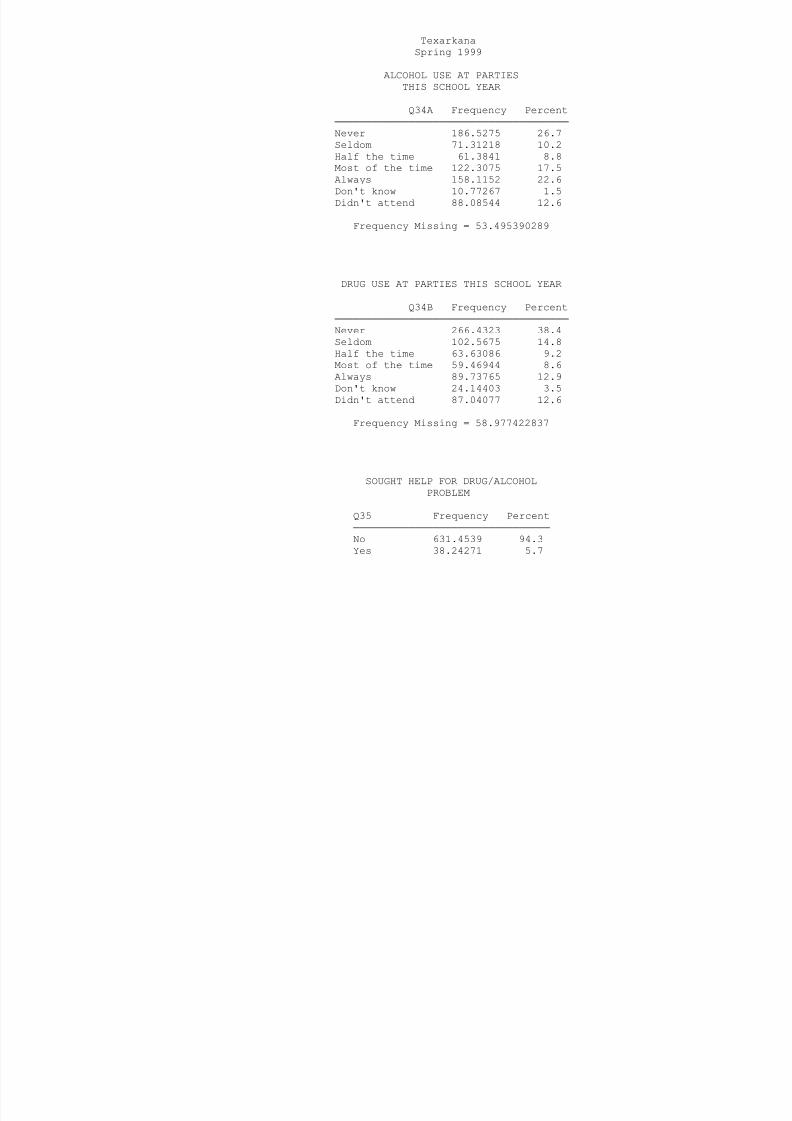
8/14/2019 BOWIE COUNTY - Texarkana ISD - 1999 Texas School Survey of Drug and Alcohol Use
http://slidepdf.com/reader/full/bowie-county-texarkana-isd-1999-texas-school-survey-of-drug-and-alcohol 176/185
Frequency Missing = 82.303404934
WOULD SEEK HELP FROM
SCHOOL COUNSELOR

8/14/2019 BOWIE COUNTY - Texarkana ISD - 1999 Texas School Survey of Drug and Alcohol Use
http://slidepdf.com/reader/full/bowie-county-texarkana-isd-1999-texas-school-survey-of-drug-and-alcohol 177/185
Q36A Frequency Percent
────────────────────────────────
No 416.7396 62.0Yes 255.1804 38.0
Frequency Missing = 80.080070598
WOULD SEEK HELP OUTSIDE
OF SCHOOL
Q36B Frequency Percent
────────────────────────────────
No 435.7782 66.0
Yes 224.701 34.0
Frequency Missing = 91.520786777
The frequencies have been weighted so that the
analysis reflects the distribution of students by grade
level in the district
Texarkana
Spring 1999
WOULD SEEK HELP FROM
OTHER COUNSELOR
Q36C Frequency Percent
────────────────────────────────
No 360 4213 56 1
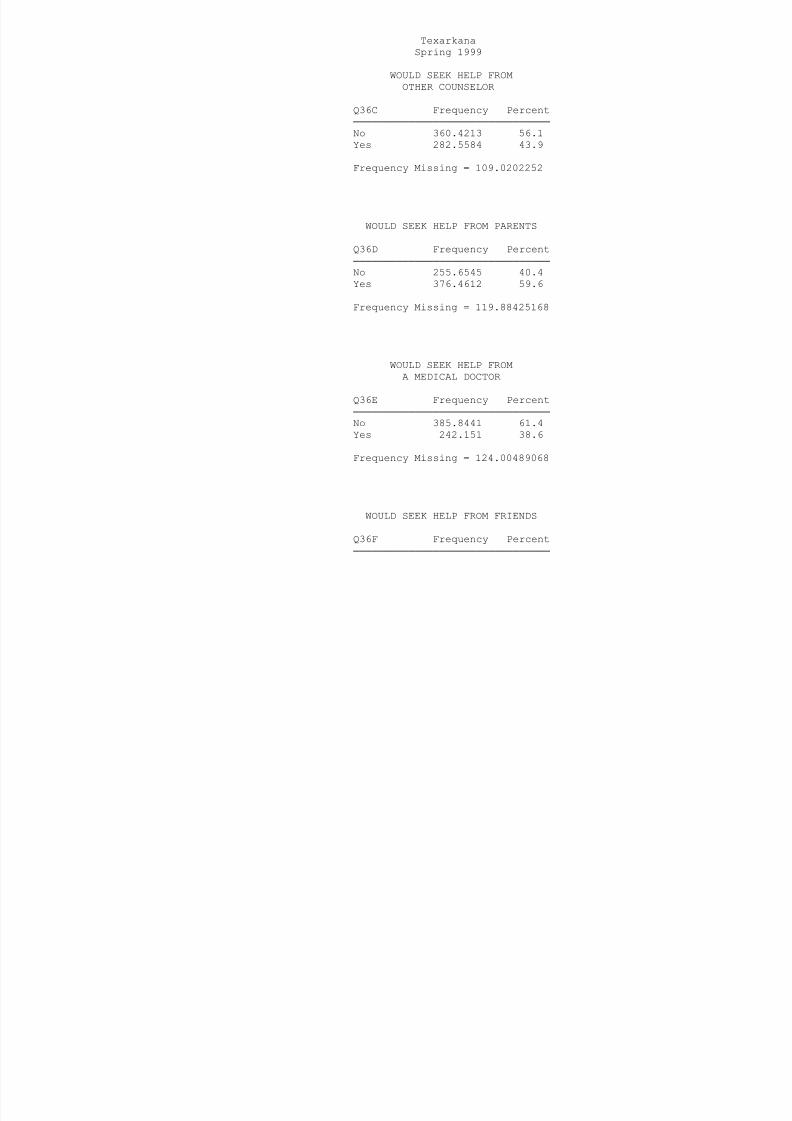
8/14/2019 BOWIE COUNTY - Texarkana ISD - 1999 Texas School Survey of Drug and Alcohol Use
http://slidepdf.com/reader/full/bowie-county-texarkana-isd-1999-texas-school-survey-of-drug-and-alcohol 178/185
No 360.4213 56.1
Yes 282.5584 43.9
Frequency Missing = 109.0202252
WOULD SEEK HELP FROM PARENTS
Q36D Frequency Percent
────────────────────────────────
No 255.6545 40.4
Yes 376.4612 59.6
Frequency Missing = 119.88425168
WOULD SEEK HELP FROM
A MEDICAL DOCTOR
Q36E Frequency Percent
────────────────────────────────
No 385.8441 61.4
Yes 242.151 38.6
Frequency Missing = 124.00489068
WOULD SEEK HELP FROM FRIENDS
Q36F Frequency Percent
────────────────────────────────
No 147.6315 22.9
Yes 496.9357 77.1
Frequency Missing = 107.4328406
WOULD SEEK HELP FROM
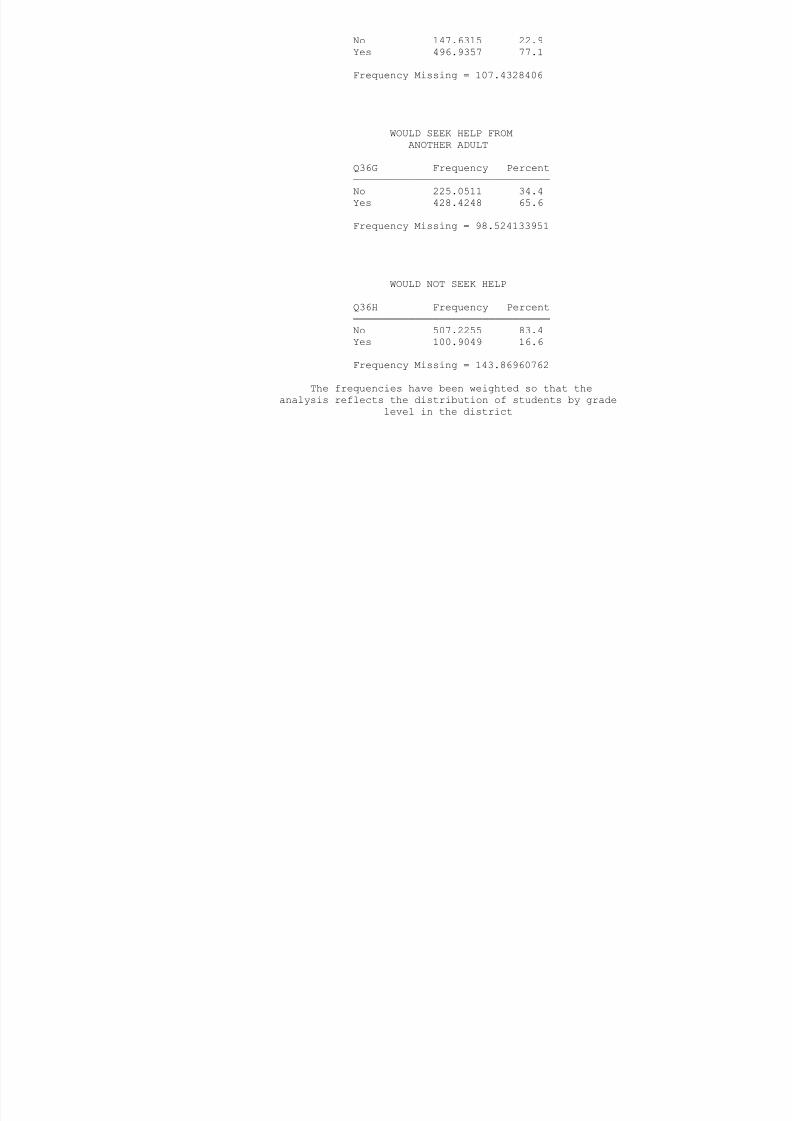
8/14/2019 BOWIE COUNTY - Texarkana ISD - 1999 Texas School Survey of Drug and Alcohol Use
http://slidepdf.com/reader/full/bowie-county-texarkana-isd-1999-texas-school-survey-of-drug-and-alcohol 179/185
WOULD SEEK HELP FROM
ANOTHER ADULT
Q36G Frequency Percent────────────────────────────────
No 225.0511 34.4
Yes 428.4248 65.6
Frequency Missing = 98.524133951
WOULD NOT SEEK HELP
Q36H Frequency Percent
────────────────────────────────
No 507.2255 83.4
Yes 100.9049 16.6
Frequency Missing = 143.86960762
The frequencies have been weighted so that the
analysis reflects the distribution of students by grade
level in the district
Texarkana
Spring 1999
DRUG/ALCOHOL INFO--HEALTH CLASS
Q37A Frequency Percent
────────────────────────────────
No 275.6826 47.4
Yes 306 0118 52 6
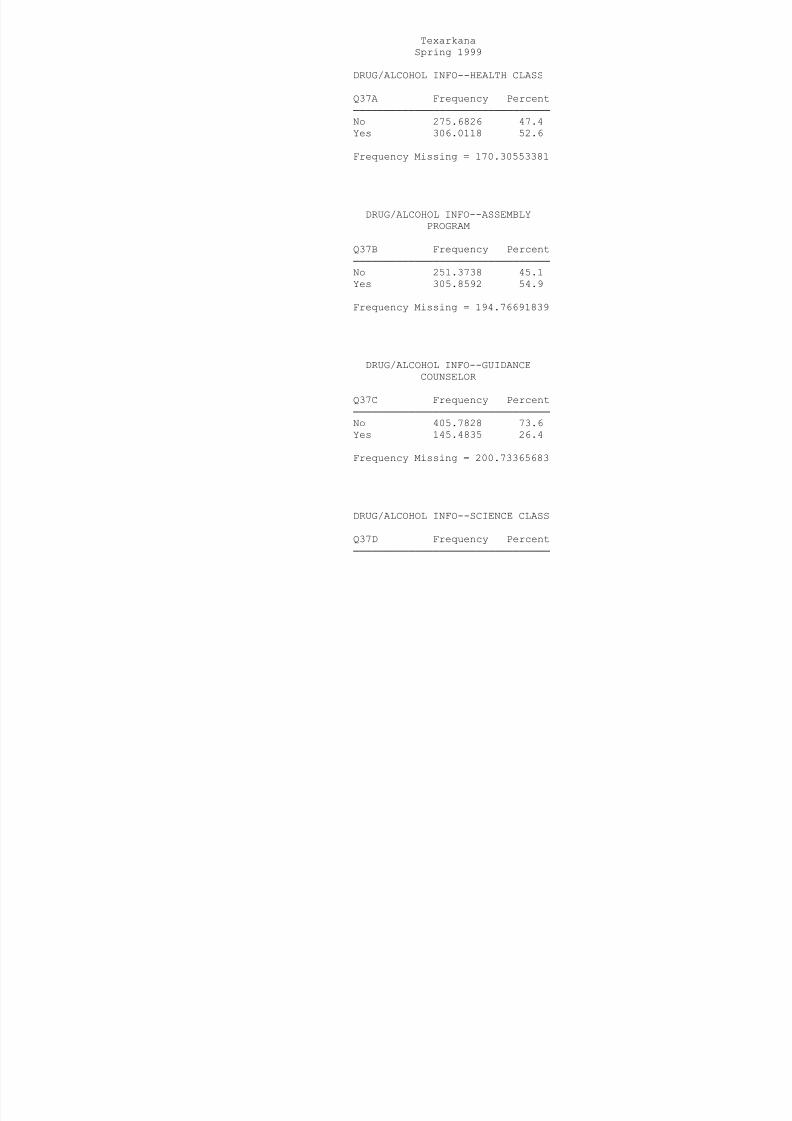
8/14/2019 BOWIE COUNTY - Texarkana ISD - 1999 Texas School Survey of Drug and Alcohol Use
http://slidepdf.com/reader/full/bowie-county-texarkana-isd-1999-texas-school-survey-of-drug-and-alcohol 180/185
Yes 306.0118 52.6
Frequency Missing = 170.30553381
DRUG/ALCOHOL INFO--ASSEMBLY
PROGRAM
Q37B Frequency Percent
────────────────────────────────
No 251.3738 45.1
Yes 305.8592 54.9
Frequency Missing = 194.76691839
DRUG/ALCOHOL INFO--GUIDANCE
COUNSELOR
Q37C Frequency Percent
────────────────────────────────
No 405.7828 73.6
Yes 145.4835 26.4
Frequency Missing = 200.73365683
DRUG/ALCOHOL INFO--SCIENCE CLASS
Q37D Frequency Percent
────────────────────────────────
No 380.793 70.9
Yes 156.4748 29.1
Frequency Missing = 214.73229637
DRUG/ALCOHOL INFO--SOCIAL
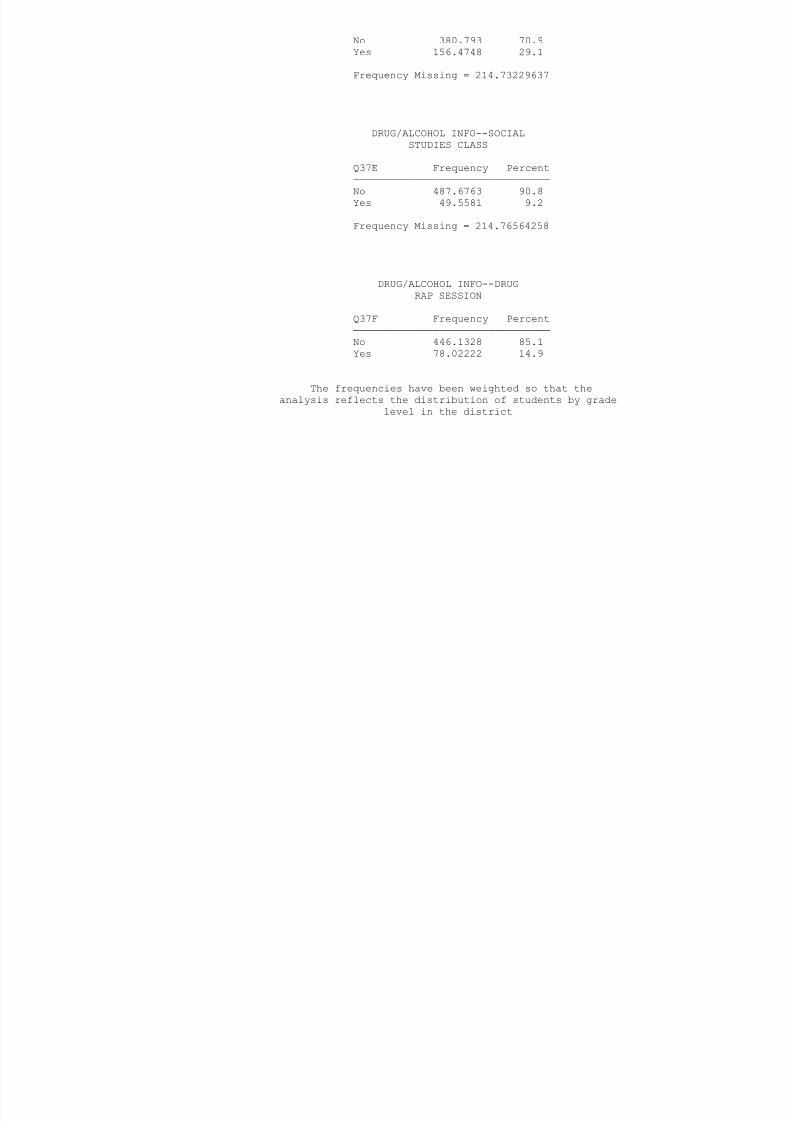
8/14/2019 BOWIE COUNTY - Texarkana ISD - 1999 Texas School Survey of Drug and Alcohol Use
http://slidepdf.com/reader/full/bowie-county-texarkana-isd-1999-texas-school-survey-of-drug-and-alcohol 181/185
DRUG/ALCOHOL INFO SOCIAL
STUDIES CLASS
Q37E Frequency Percent────────────────────────────────
No 487.6763 90.8
Yes 49.5581 9.2
Frequency Missing = 214.76564258
DRUG/ALCOHOL INFO--DRUG
RAP SESSION
Q37F Frequency Percent
────────────────────────────────
No 446.1328 85.1
Yes 78.02222 14.9
The frequencies have been weighted so that the
analysis reflects the distribution of students by grade
level in the district
Texarkana
Spring 1999
Frequency Missing = 227.84494859
DRUG/ALCOHOL INFO--INVITED
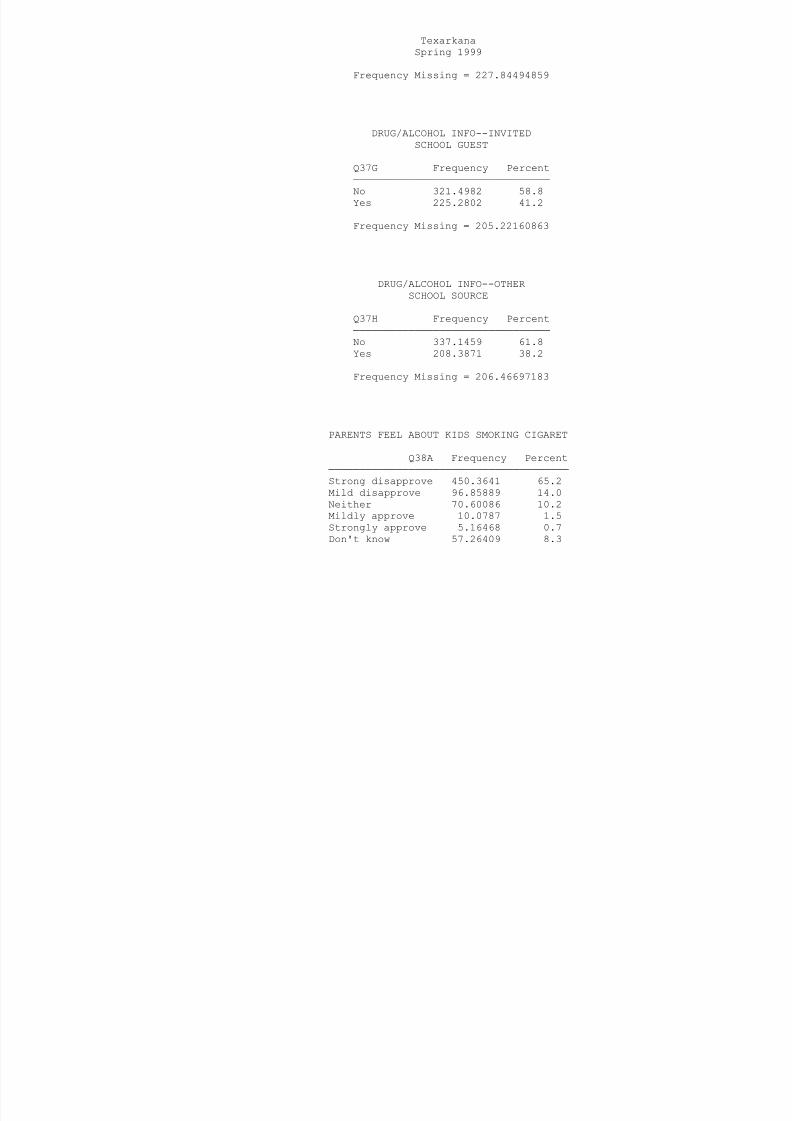
8/14/2019 BOWIE COUNTY - Texarkana ISD - 1999 Texas School Survey of Drug and Alcohol Use
http://slidepdf.com/reader/full/bowie-county-texarkana-isd-1999-texas-school-survey-of-drug-and-alcohol 182/185
DRUG/ALCOHOL INFO INVITED
SCHOOL GUEST
Q37G Frequency Percent────────────────────────────────
No 321.4982 58.8
Yes 225.2802 41.2
Frequency Missing = 205.22160863
DRUG/ALCOHOL INFO--OTHER
SCHOOL SOURCE
Q37H Frequency Percent
────────────────────────────────
No 337.1459 61.8
Yes 208.3871 38.2
Frequency Missing = 206.46697183
PARENTS FEEL ABOUT KIDS SMOKING CIGARET
Q38A Frequency Percent
───────────────────────────────────────
Strong disapprove 450.3641 65.2
Mild disapprove 96.85889 14.0
Neither 70.60086 10.2
Mildly approve 10.0787 1.5
Strongly approve 5.16468 0.7
Don't know 57.26409 8.3
Frequency Missing = 61.66873102
PARENTS FEEL ABOUT KIDS DRINKING BEER
Q38B Frequency Percent
───────────────────────────────────────
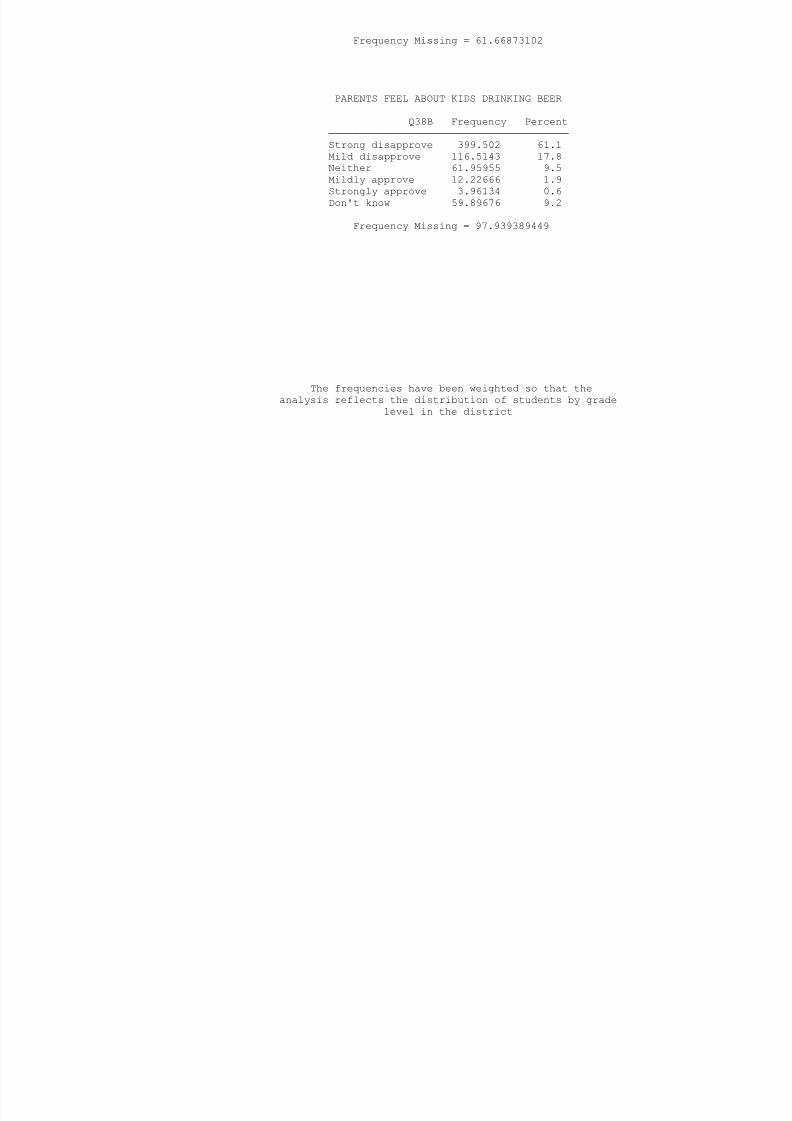
8/14/2019 BOWIE COUNTY - Texarkana ISD - 1999 Texas School Survey of Drug and Alcohol Use
http://slidepdf.com/reader/full/bowie-county-texarkana-isd-1999-texas-school-survey-of-drug-and-alcohol 183/185
Strong disapprove 399.502 61.1
Mild disapprove 116.5143 17.8
Neither 61.95955 9.5Mildly approve 12.22666 1.9
Strongly approve 3.96134 0.6
Don't know 59.89676 9.2
Frequency Missing = 97.939389449
The frequencies have been weighted so that the
analysis reflects the distribution of students by grade
level in the district
Texarkana
Spring 1999
PARENTS FEEL ABOUT KIDS USING MARIJUANA
Q38C Frequency Percent
───────────────────────────────────────
Strong disapprove 533.3082 79.9
Mild disapprove 41.41748 6.2
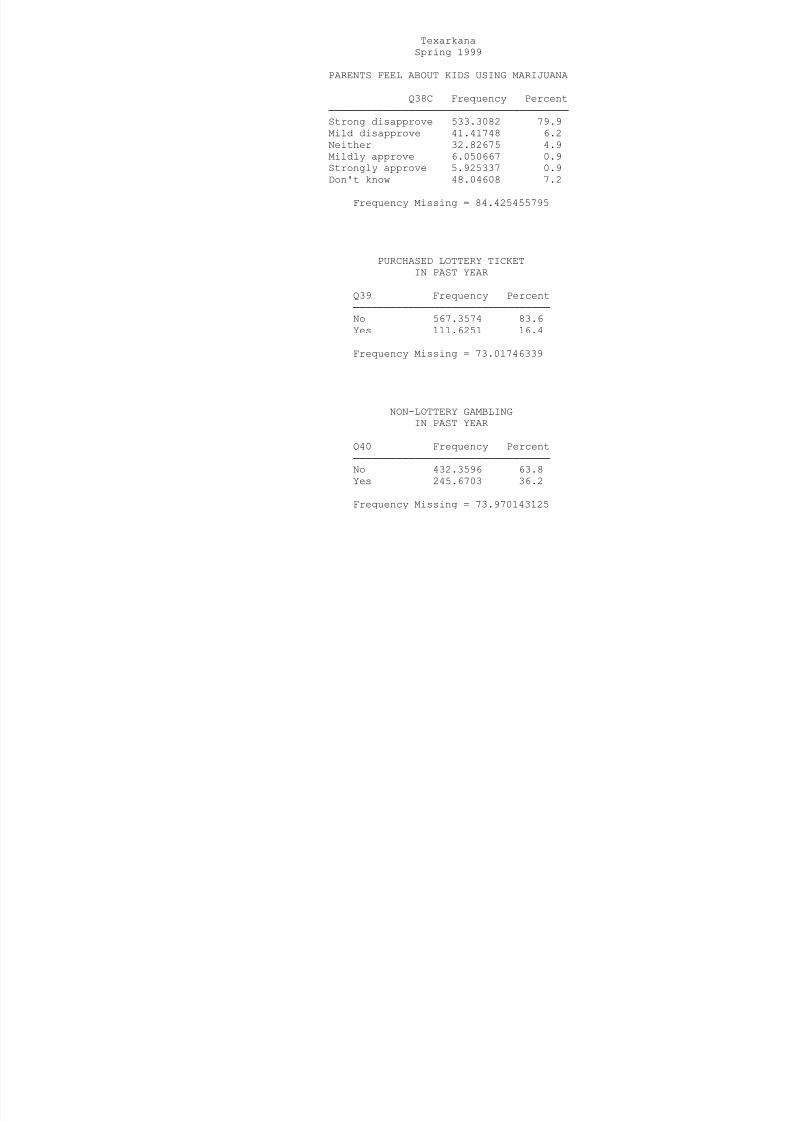
8/14/2019 BOWIE COUNTY - Texarkana ISD - 1999 Texas School Survey of Drug and Alcohol Use
http://slidepdf.com/reader/full/bowie-county-texarkana-isd-1999-texas-school-survey-of-drug-and-alcohol 184/185
pp
Neither 32.82675 4.9
Mildly approve 6.050667 0.9
Strongly approve 5.925337 0.9Don't know 48.04608 7.2
Frequency Missing = 84.425455795
PURCHASED LOTTERY TICKET
IN PAST YEAR
Q39 Frequency Percent
────────────────────────────────
No 567.3574 83.6
Yes 111.6251 16.4
Frequency Missing = 73.01746339
NON-LOTTERY GAMBLING
IN PAST YEAR
Q40 Frequency Percent
────────────────────────────────
No 432.3596 63.8
Yes 245.6703 36.2
Frequency Missing = 73.970143125
MONEY SPENT ON GAMBLING
IN PAST YEAR
Q41 Frequency Percent
────────────────────────────────
$0 389.7054 56.7
$1 - $10 190.5369 27.7
$11 - $50 57.45611 8.4
$51 - $100 27.72876 4.0
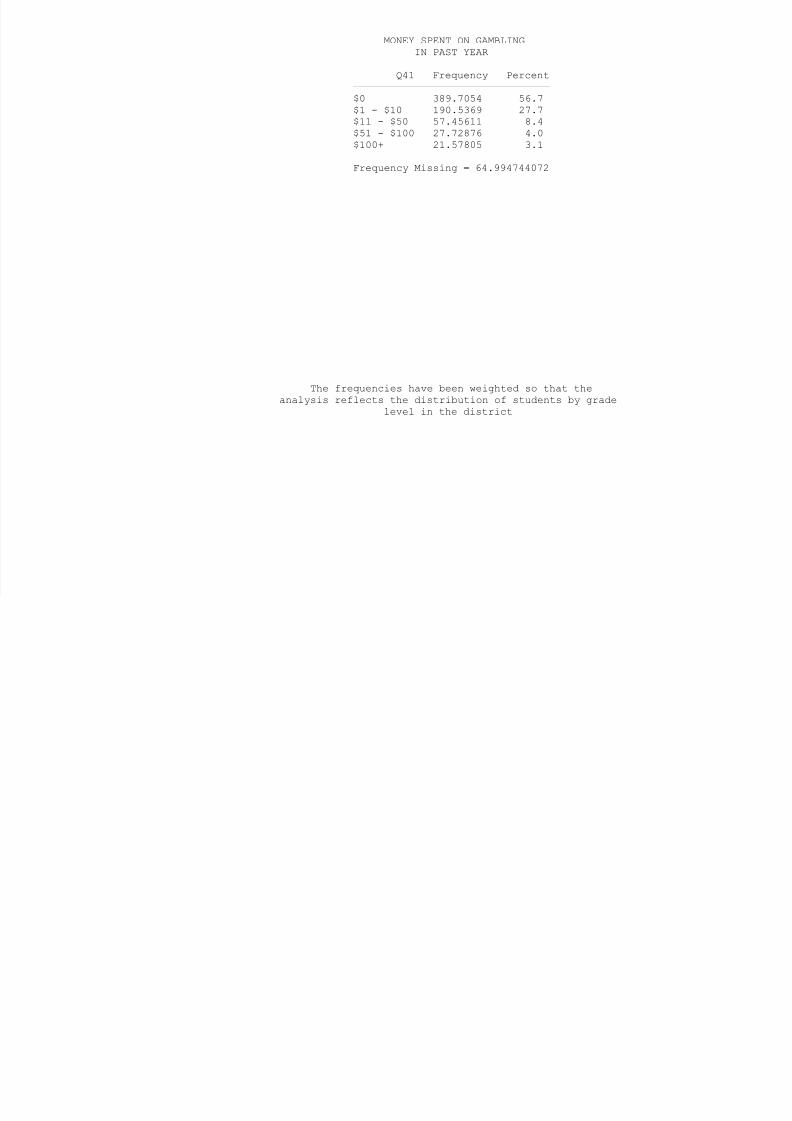
8/14/2019 BOWIE COUNTY - Texarkana ISD - 1999 Texas School Survey of Drug and Alcohol Use
http://slidepdf.com/reader/full/bowie-county-texarkana-isd-1999-texas-school-survey-of-drug-and-alcohol 185/185
$100+ 21.57805 3.1
Frequency Missing = 64.994744072
The frequencies have been weighted so that the
analysis reflects the distribution of students by grade
level in the district