Embed Size (px)
Citation preview
BOX-BEHNKEN DESIGN FOR SEQUESTRATION OF
DYE: STATISTICAL OPTIMIZATION AND
MECHANISM STUDIES
Sivahankar Raja1, Sathya. A. Bose
2, Kanimozhi Jayaram
3, Sivasubramanian
Velmurugan4*
1Department of Chemical Engineering, Hindustan Institute of Technology and Science, Chennai,
India-603103
2Department of Biotechnology, Aarupadai Veedu Institute of Technology, Paiyanoor, India-
603104
3Department of Biotechnology, Kalasalingam Academy of Research and Education, Krishnankoil,
India- 626128.
4Department of Chemical Engineering, National Institute of Technology, Calicut, India-673601.
*Corresponding mail id: [email protected]
Abstract: The wastewater treatment containing dyes are challenging due to their recalcitrant properties.
Sequestration of dyes via adsorption principle seems to be promising. The purpose of this study was to
optimize the operational condition and enhance the adsorption of MY dye using response surface modeling.
Aquatic macrophyte (Salvinia molesta), iron oxide synthesized via chemical co-precipitation, and iron oxide
modified aquatic macrophyte have been successfully exploited for the sequestration of dye from aqueous
solution. For the investigation of effects of major operational variables and optimization conditions, response
surface modeling based three factors, three levels Box-Behnken experimental design associated with
quadratic programming has been utilized for maximizing the sequestration processes. Initial dye
concentration (10 to 100 mg/L), adsorbent dosage concentration (0.5 to 1 g), and initial solution pH (2.0 to
12.0) are the three independent variables were studied from 17 experimental run in a batch system. For
analysis of variation with 95 % confidence limit, the significance of the model terms contained in the
Regression equations have been assessed using the F - and P - test. The adsorbent dosage concentration of
1.0 mg/100 ml, pH of 2, and initial dye concentration of 10 mg/L were found to be the economical operating
conditions for maximum removal efficiency of 96.42, 97.25 and 98.51 using aquatic macrophyte, iron oxide
and iron oxide modified aquatic macrophyte, respectively. As a result, Box-behnken design was suggested as
a virtuous statistical tool for optimal design of dye sequestration that provides appropriate results for the
maximum percentage decolorization.
Keywords: Box-behnken design, optimization, sequestration, dye.
1. INTRODUCTION Dyes are substances that provide color by a process that alters temporarily or
permanently. The chemicals applied for producing dyes are frequently highly toxic,
carcinogenic, or even explosive. About 10,000 different dyes and pigments are
industrially used, with annual global production of more than 7x10⁵ tons of synthetic
dyes [1]. Industries such as textile, cosmetics, paper, pharmaceutical, leather, plastics, and
food are the major users of these synthetic dyes. Azo dyes that consist of one or more (–
N=N–) azo bonds are the most significant class of synthetic organic dyes. These azo dyes
contribute to more than 60% of all used synthetic dyes and are difficult to degrade
because of their complex structure and synthetic nature [2]. Many azo dyes are thought to
be recalcitrant and toxic contaminants prevent photosynthetic activity and harmful to
aquatic organisms. It is a renowned fact that exposure to these dyes results in aesthetic
problems and sometimes mutagenic and carcinogenic effect in human beings. Further,
degradation of these azo dyes gives rise to the formation of toxic amines [3]. Hence,
sequestration of these dyes from aqueous solution is desirable. Adsorption is an easy and
cost-effective wastewater processing technique, among several techniques available for
the removal of dyes from effluent, such as flocculation, oxidation and electrolysis [4].
Generally, it is difficult to separate the used adsorbents after saturation adsorption. In
these circumstances, magnetic separation of used adsorbents would be one of the
successful strategies for wastewater treatment due to its advantages such as zero
flocculants formation and substantial quantities of wastewater can be processed over short
time [5].
In this study, the possibility of aquatic macrophyte (Salvinia molesta), iron oxide, and its
combination (iron oxide modified Salvinia molesta) as an inexpensive eco-friendly
adsorbent for the sequestration of MY dye from aqueous solution have been studied. For
this purpose, the Box–Behnken model (BBD) of experimental design in response surface
modeling (RSM) was identified to be a useful tool for optimizing the experimental
conditions and evaluating the multiple analytical factors and their interactions. In the
event of complex interactions of process variables (initial solution pH, adsorbent dosage
concentration, and initial dye concentration), RSM is a fusion of mathematical and
statistical techniques used to develop, enhance and optimize processes and to determine
the relative value of some of these parameter. Further, RSM offers a mathematical model
for accomplishing maximum percentage yield, minimizing process uncertainty, superior
output response validation to nominal target attainment, and reduced treatment time with
minimum cost. In light of these important characteristics, the objective of this research is
to develop magnetically modified biosorbents as alternatives and environmentally friendly
adsorbents for removal of dyes from aqueous solution.
2. MATERIALS AND METHODS
2.1. Chemicals Metanil Yellow (MY) dye (70% dyes) from Sigma Aldrich, was employed in this study as
an adsorbate. The stock solution was prepared at a concentration of 1g/L. The dilution of
stock solution in distilled water was used to develop dye solutions of the desired
concentration. Diluted HCl and NaOH were used to adjust each dye solution to its pH. An
UV-visible spectrophotometer, which operates in the visible absorbance range, used for
the determination the optical density of the color solution.
2.2. Preparation of adsorbents The adsorbents used for the present experiments are Salvinia molesta (SM), iron oxide
(IO) and iron oxide modified SM (MBC). The dried SM was prepared as reported in the
literature [6]. The collected SM was thoroughly cleaned in warm water and dried. The
dried particles were pulverized for fine powder (approximately 88µm). The iron oxide
particles (γ-Fe2O3) were prepared by chemical co-precipitation method using ferric and
ferrous salts under the presence of N2 gas [7]. Similarly the iron oxide modified SM used
in this study was also synthesized by co-precipitation method with MnCl2.4H2O and
FeCl3.6H2O as reported in the literature [5]. 0.1 M of MnCl2.4H2O and 0.3 M of
FeCl3.6H2O were blended in 100 ml distilled water under constant stirring. To the
mixture, 1.0 g of aquatic weed was added and followed by 10% NaOH until the solution
pH reaches 10. The precipitated particles were separated using magnetic field and dried
for further experimental employment.
2.3. Batch adsorption studies Adsorption of MY dye was investigated in a batch system at different pH values,
temperature, agitation and adsorbent dosage to determine the rate constant and extent of
dye uptake by the adsorbent. These studies were carried out for SM, IO and MBC
separately. Three significant factors such as initial dye concentration, initial solution pH
and adsorbent dosage concentration were selected for batch adsorption processes based
on one variable at a time (OVAT) method (results not shown). The absorption spectra of
the clear supernatant were recorded at λmax (430 nm) using UV-visible
spectrophotometer [8]. The quantity of dye adsorbed per adsorbent unit (mg dye per g
adsorbent) was computed from below Eq. (1).
The quantity of dye adsorbed on to adsorbent at time t,
(1)
where, the solution concentrations at t= 0 and t= t are C0, Ct (mg/l), respectively, V is
referred to be volume of the solution (L) and m is the mass of adsorbent. The dye removal
efficiency was computed from below Eq. (2),
(2)
2.4. Box-Behnken design for process parameter optimization Design of experiments is a technique for systematically applying statistics to experiments.
BBD based RSM has been employed to optimize process parameters that affect dye
sequestration. Optimization was carried out involving three factors such as amount of
adsorbent, initial dye concentration and initial solution pH. All factors were examined at
low and high range of rates. Based on preliminary tests the actual values of the system
parameters and their range have been chosen. Seventeen experimental runs have been
performed to investigate adsorbent & adsorbate interactions and the cumulative effects of
all process parameters. The statistical software employed for the design of 17 experiments
is Design Expert (Version 10.0.3, Stat-Ease, Inc., Minneapolis, U.S.A.) Further, by
solving the regression equations and by analyzing the 3D surface plots, the optimum
conditions for all adsorbents were obtained. The regression analyzes were conducted for
the response functions, i.e. dye decolorization %. The developed regression model is a
response based on adsorbent dosage concentration, initial dye concentration and pH of the
solution. The three independent variables chosen were designated as A (adsorbent
dosage), B (initial dye concentration), and C (initial solution pH). The number of
experimental was computed from the following Eq. (3)
(3)
where k and cp represent the factor number and replicate number of the central point,
respectively.
Similarly, the coded values of process parameters have been accessed from Eq. (4):
(4)
where X0 is the value of Xi at the center point, the real value of an independent variable is
Xi , step change is represented by ΔX and xi represent the dimensionless factor of a
process variable.
In order to compare the dependent and independent variables, the second order equation
response was employed. A higher-order polynomial, such as quadratic model may be
expressed as Eq.(5),
(5)
where Y is the predicted response, the constant coefficient, the linear coefficients, the
quadratic coefficients, the interaction coefficients and Xi, Xj are the coded values of the
independent process variables and e is the residual error. By setting up of constraints of
variables, analysing the surface of counter response surface plot, and solving the
regression equation, the optimum values of the factors were obtained [9]. The extreme
values of the variables were determined from preliminary experiments conducted. In
order to obtain the correlating regression coefficients, linear, two factor interaction (2FI),
cubic and quadratic equations have been used to interpret the experimental results. The
sequential model sum of squares and the model summary statistics have been carried out
to assess the adequacy of models depicting removal of dye by adsorbents. Coefficient of
determination (R2) determined the fitness of the model and its statistical significance was
assessed by an F-test. In the analysis of variance (ANOVA), the significances of the
coded variables of the regression equation have been assessed by the F-test [9].
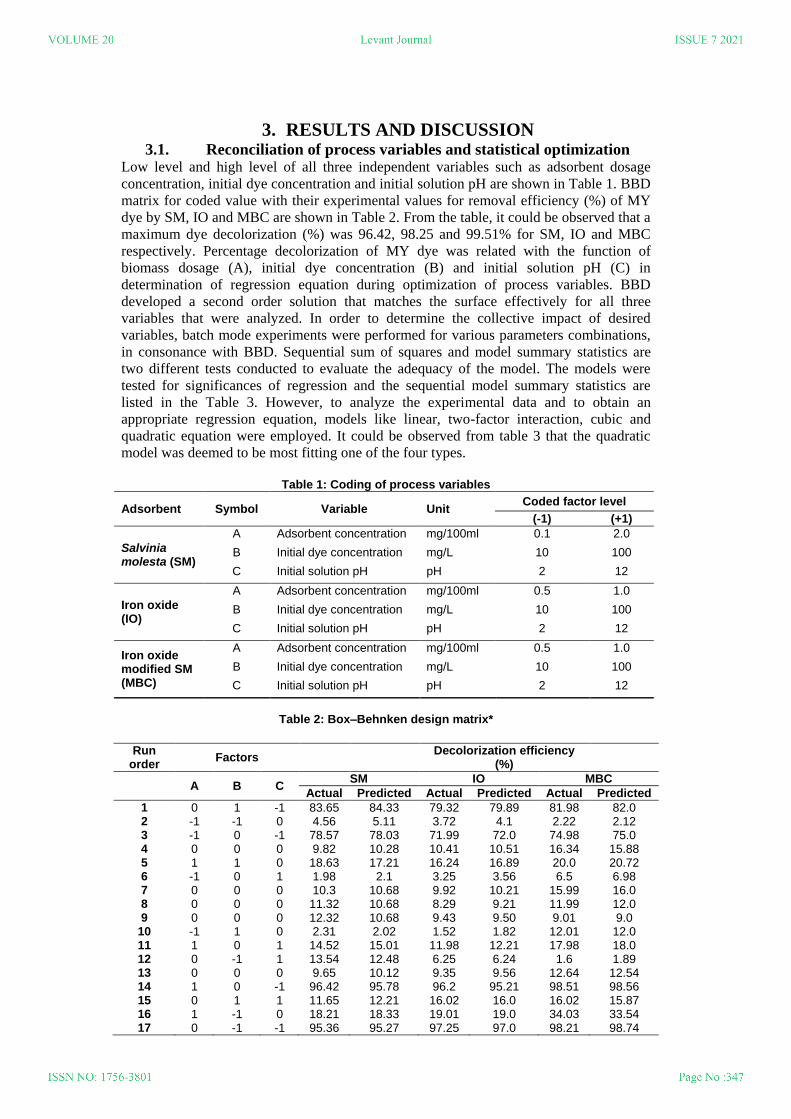
3. RESULTS AND DISCUSSION 3.1. Reconciliation of process variables and statistical optimization
Low level and high level of all three independent variables such as adsorbent dosage
concentration, initial dye concentration and initial solution pH are shown in Table 1. BBD
matrix for coded value with their experimental values for removal efficiency (%) of MY
dye by SM, IO and MBC are shown in Table 2. From the table, it could be observed that a
maximum dye decolorization (%) was 96.42, 98.25 and 99.51% for SM, IO and MBC
respectively. Percentage decolorization of MY dye was related with the function of
biomass dosage (A), initial dye concentration (B) and initial solution pH (C) in
determination of regression equation during optimization of process variables. BBD
developed a second order solution that matches the surface effectively for all three
variables that were analyzed. In order to determine the collective impact of desired
variables, batch mode experiments were performed for various parameters combinations,
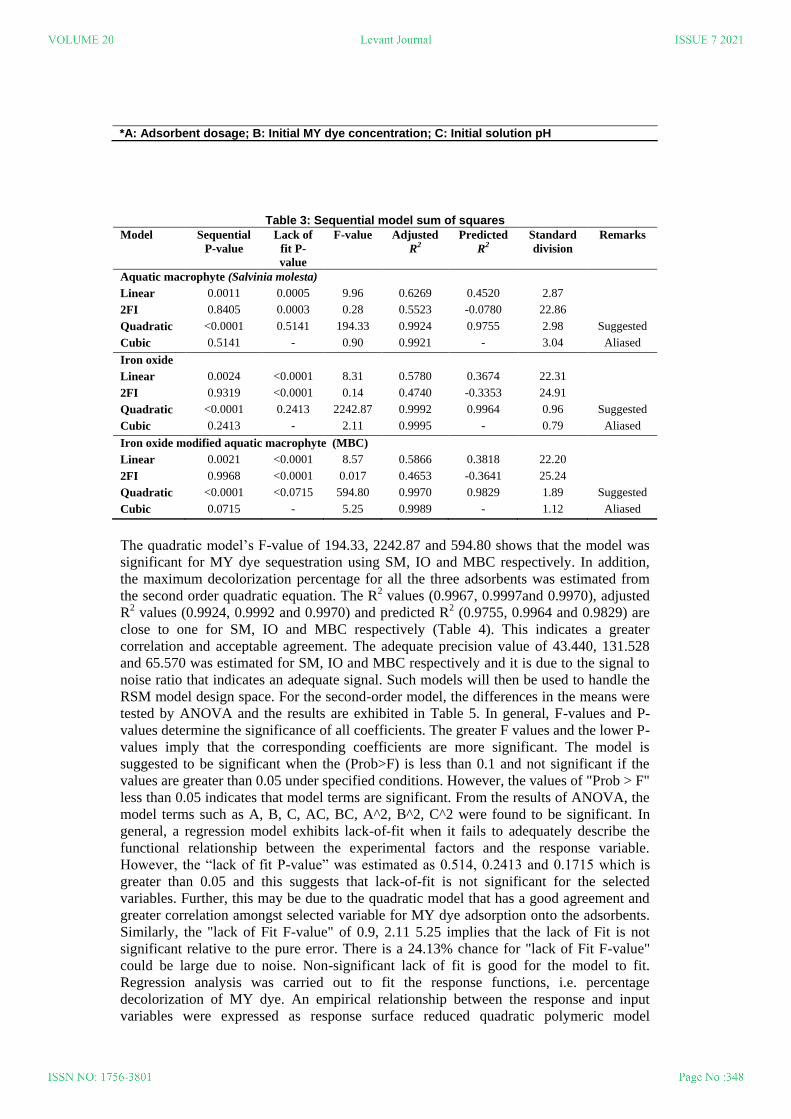
in consonance with BBD. Sequential sum of squares and model summary statistics are
two different tests conducted to evaluate the adequacy of the model. The models were
tested for significances of regression and the sequential model summary statistics are
listed in the Table 3. However, to analyze the experimental data and to obtain an
appropriate regression equation, models like linear, two-factor interaction, cubic and
quadratic equation were employed. It could be observed from table 3 that the quadratic
model was deemed to be most fitting one of the four types.
Table 1: Coding of process variables
Adsorbent Symbol Variable Unit Coded factor level
(-1) (+1)
Salvinia molesta (SM)
A Adsorbent concentration mg/100ml 0.1 2.0
B Initial dye concentration mg/L 10 100
C Initial solution pH pH 2 12
Iron oxide (IO)
A Adsorbent concentration mg/100ml 0.5 1.0
B Initial dye concentration mg/L 10 100
C Initial solution pH pH 2 12
Iron oxide modified SM (MBC)
A Adsorbent concentration mg/100ml 0.5 1.0
B Initial dye concentration mg/L 10 100
C Initial solution pH pH 2 12
Table 2: Box–Behnken design matrix*
Run
order Factors
Decolorization efficiency (%)
A B C SM IO MBC
Actual Predicted Actual Predicted Actual Predicted
1 0 1 -1 83.65 84.33 79.32 79.89 81.98 82.0 2 -1 -1 0 4.56 5.11 3.72 4.1 2.22 2.12 3 -1 0 -1 78.57 78.03 71.99 72.0 74.98 75.0 4 0 0 0 9.82 10.28 10.41 10.51 16.34 15.88 5 1 1 0 18.63 17.21 16.24 16.89 20.0 20.72 6 -1 0 1 1.98 2.1 3.25 3.56 6.5 6.98 7 0 0 0 10.3 10.68 9.92 10.21 15.99 16.0 8 0 0 0 11.32 10.68 8.29 9.21 11.99 12.0 9 0 0 0 12.32 10.68 9.43 9.50 9.01 9.0
10 -1 1 0 2.31 2.02 1.52 1.82 12.01 12.0 11 1 0 1 14.52 15.01 11.98 12.21 17.98 18.0 12 0 -1 1 13.54 12.48 6.25 6.24 1.6 1.89 13 0 0 0 9.65 10.12 9.35 9.56 12.64 12.54 14 1 0 -1 96.42 95.78 96.2 95.21 98.51 98.56 15 0 1 1 11.65 12.21 16.02 16.0 16.02 15.87 16 1 -1 0 18.21 18.33 19.01 19.0 34.03 33.54 17 0 -1 -1 95.36 95.27 97.25 97.0 98.21 98.74
*A: Adsorbent dosage; B: Initial MY dye concentration; C: Initial solution pH
Table 3: Sequential model sum of squares
Model Sequential
P-value
Lack of
fit P-
value
F-value Adjusted
R2
Predicted
R2
Standard
division
Remarks
Aquatic macrophyte (Salvinia molesta)
Linear 0.0011 0.0005 9.96 0.6269 0.4520 2.87
2FI 0.8405 0.0003 0.28 0.5523 -0.0780 22.86
Quadratic <0.0001 0.5141 194.33 0.9924 0.9755 2.98 Suggested
Cubic 0.5141 - 0.90 0.9921 - 3.04 Aliased
Iron oxide
Linear 0.0024 <0.0001 8.31 0.5780 0.3674 22.31
2FI 0.9319 <0.0001 0.14 0.4740 -0.3353 24.91
Quadratic <0.0001 0.2413 2242.87 0.9992 0.9964 0.96 Suggested
Cubic 0.2413 - 2.11 0.9995 - 0.79 Aliased
Iron oxide modified aquatic macrophyte (MBC)
Linear 0.0021 <0.0001 8.57 0.5866 0.3818 22.20
2FI 0.9968 <0.0001 0.017 0.4653 -0.3641 25.24
Quadratic <0.0001 <0.0715 594.80 0.9970 0.9829 1.89 Suggested
Cubic 0.0715 - 5.25 0.9989 - 1.12 Aliased
The quadratic model‟s F-value of 194.33, 2242.87 and 594.80 shows that the model was
significant for MY dye sequestration using SM, IO and MBC respectively. In addition,
the maximum decolorization percentage for all the three adsorbents was estimated from
the second order quadratic equation. The R2 values (0.9967, 0.9997and 0.9970), adjusted
R2 values (0.9924, 0.9992 and 0.9970) and predicted R2 (0.9755, 0.9964 and 0.9829) are
close to one for SM, IO and MBC respectively (Table 4). This indicates a greater
correlation and acceptable agreement. The adequate precision value of 43.440, 131.528
and 65.570 was estimated for SM, IO and MBC respectively and it is due to the signal to
noise ratio that indicates an adequate signal. Such models will then be used to handle the
RSM model design space. For the second-order model, the differences in the means were
tested by ANOVA and the results are exhibited in Table 5. In general, F-values and P-
values determine the significance of all coefficients. The greater F values and the lower P-
values imply that the corresponding coefficients are more significant. The model is
suggested to be significant when the (Prob>F) is less than 0.1 and not significant if the
values are greater than 0.05 under specified conditions. However, the values of "Prob > F"
less than 0.05 indicates that model terms are significant. From the results of ANOVA, the
model terms such as A, B, C, AC, BC, A^2, B^2, C^2 were found to be significant. In
general, a regression model exhibits lack-of-fit when it fails to adequately describe the
functional relationship between the experimental factors and the response variable.
However, the “lack of fit P-value” was estimated as 0.514, 0.2413 and 0.1715 which is
greater than 0.05 and this suggests that lack-of-fit is not significant for the selected
variables. Further, this may be due to the quadratic model that has a good agreement and
greater correlation amongst selected variable for MY dye adsorption onto the adsorbents.
Similarly, the "lack of Fit F-value" of 0.9, 2.11 5.25 implies that the lack of Fit is not
significant relative to the pure error. There is a 24.13% chance for "lack of Fit F-value"
could be large due to noise. Non-significant lack of fit is good for the model to fit.
Regression analysis was carried out to fit the response functions, i.e. percentage
decolorization of MY dye. An empirical relationship between the response and input
variables were expressed as response surface reduced quadratic polymeric model
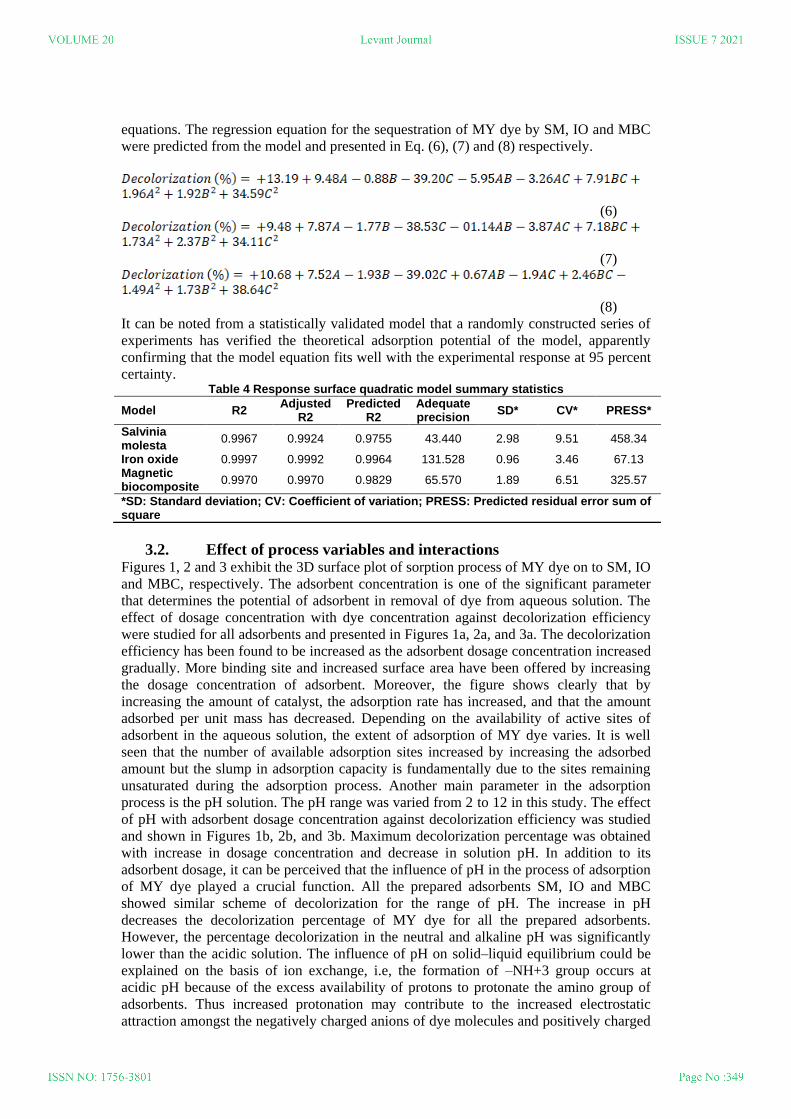
equations. The regression equation for the sequestration of MY dye by SM, IO and MBC
were predicted from the model and presented in Eq. (6), (7) and (8) respectively.
(6)
(7)
(8)
It can be noted from a statistically validated model that a randomly constructed series of
experiments has verified the theoretical adsorption potential of the model, apparently
confirming that the model equation fits well with the experimental response at 95 percent
certainty. Table 4 Response surface quadratic model summary statistics
Model R2 Adjusted
R2 Predicted
R2 Adequate precision
SD* CV* PRESS*
Salvinia molesta
0.9967 0.9924 0.9755 43.440 2.98 9.51 458.34
Iron oxide 0.9997 0.9992 0.9964 131.528 0.96 3.46 67.13 Magnetic biocomposite
0.9970 0.9970 0.9829 65.570 1.89 6.51 325.57
*SD: Standard deviation; CV: Coefficient of variation; PRESS: Predicted residual error sum of square
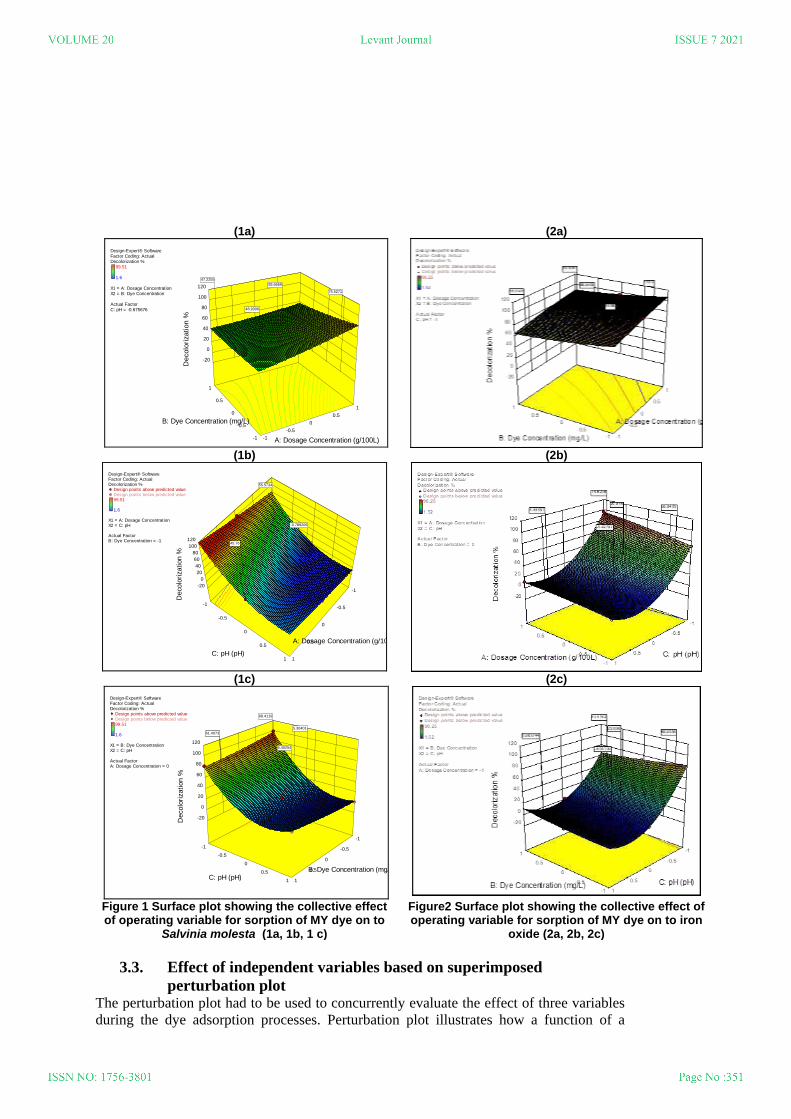
3.2. Effect of process variables and interactions Figures 1, 2 and 3 exhibit the 3D surface plot of sorption process of MY dye on to SM, IO
and MBC, respectively. The adsorbent concentration is one of the significant parameter
that determines the potential of adsorbent in removal of dye from aqueous solution. The
effect of dosage concentration with dye concentration against decolorization efficiency
were studied for all adsorbents and presented in Figures 1a, 2a, and 3a. The decolorization
efficiency has been found to be increased as the adsorbent dosage concentration increased
gradually. More binding site and increased surface area have been offered by increasing
the dosage concentration of adsorbent. Moreover, the figure shows clearly that by
increasing the amount of catalyst, the adsorption rate has increased, and that the amount
adsorbed per unit mass has decreased. Depending on the availability of active sites of
adsorbent in the aqueous solution, the extent of adsorption of MY dye varies. It is well
seen that the number of available adsorption sites increased by increasing the adsorbed
amount but the slump in adsorption capacity is fundamentally due to the sites remaining
unsaturated during the adsorption process. Another main parameter in the adsorption
process is the pH solution. The pH range was varied from 2 to 12 in this study. The effect
of pH with adsorbent dosage concentration against decolorization efficiency was studied
and shown in Figures 1b, 2b, and 3b. Maximum decolorization percentage was obtained
with increase in dosage concentration and decrease in solution pH. In addition to its
adsorbent dosage, it can be perceived that the influence of pH in the process of adsorption
of MY dye played a crucial function. All the prepared adsorbents SM, IO and MBC
showed similar scheme of decolorization for the range of pH. The increase in pH
decreases the decolorization percentage of MY dye for all the prepared adsorbents.
However, the percentage decolorization in the neutral and alkaline pH was significantly
lower than the acidic solution. The influence of pH on solid–liquid equilibrium could be
explained on the basis of ion exchange, i.e, the formation of –NH+3 group occurs at
acidic pH because of the excess availability of protons to protonate the amino group of
adsorbents. Thus increased protonation may contribute to the increased electrostatic
attraction amongst the negatively charged anions of dye molecules and positively charged
active sites of adsorbents which results in the greater percentage decolorization. In
addition, the rise in the solution pH from acidic to neutral or alkaline condition lead to the
engagement of negatively charged OH- ions on the surface of adsorbents and this results
in the decreases in adsorption efficiency due to the formation of repulsive force with
anionic dye at neutral and alkaline condition. Therefore, the dye decolorization decreases
since the external surface of the adsorbent does not produce exchangeable anions at
higher pH. As shown in Figures 1c, 2c, and 3c, decolorization efficiency of MY dye on to
all the prepared adsorbents decreased with increase in initial solution pH. A maximum
decolorization percentage of 96.42, 97.25 and 98.51 were obtained for SM, IO and MBC,
respectively. However, dye decolorization percentage increases with increase in adsorbent
concentration and decrease in solution pH.
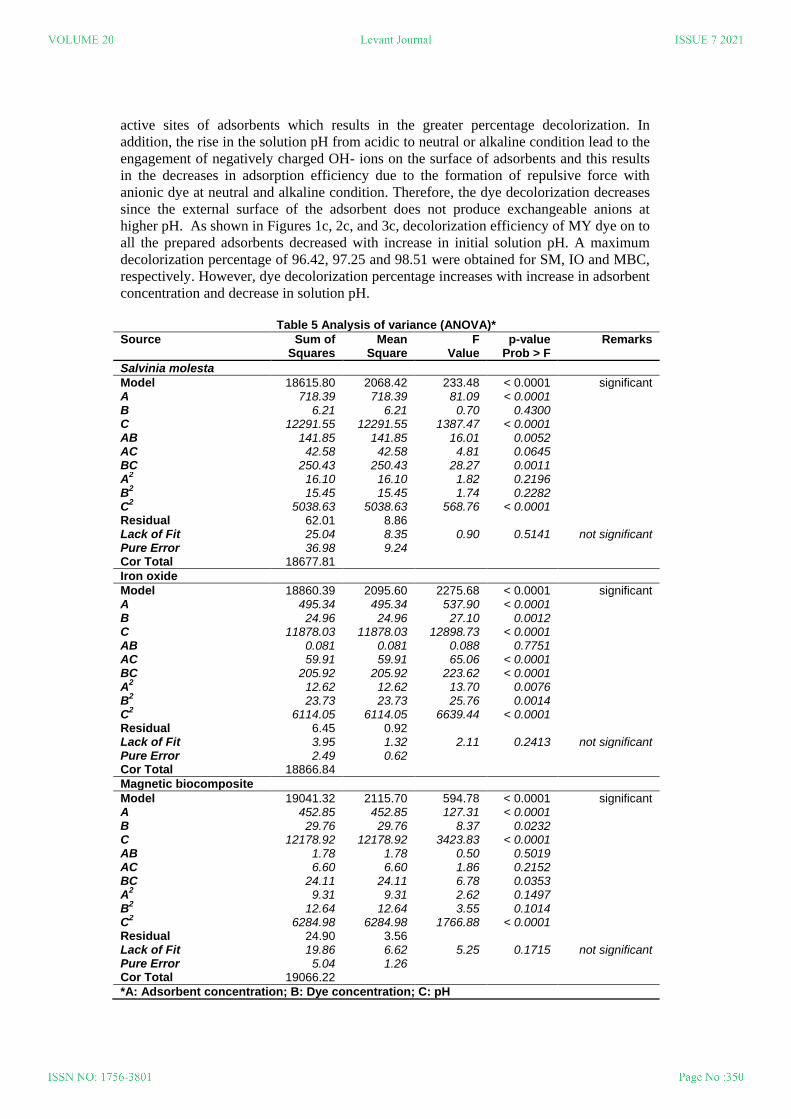
Table 5 Analysis of variance (ANOVA)*
Source Sum of Squares
Mean Square
F Value
p-value Prob > F
Remarks
Salvinia molesta
Model 18615.80 2068.42 233.48 < 0.0001 significant A 718.39 718.39 81.09 < 0.0001 B 6.21 6.21 0.70 0.4300 C 12291.55 12291.55 1387.47 < 0.0001 AB 141.85 141.85 16.01 0.0052 AC 42.58 42.58 4.81 0.0645 BC 250.43 250.43 28.27 0.0011 A
2 16.10 16.10 1.82 0.2196
B2 15.45 15.45 1.74 0.2282
C2 5038.63 5038.63 568.76 < 0.0001
Residual 62.01 8.86 Lack of Fit 25.04 8.35 0.90 0.5141 not significant Pure Error 36.98 9.24 Cor Total 18677.81
Iron oxide
Model 18860.39 2095.60 2275.68 < 0.0001 significant A 495.34 495.34 537.90 < 0.0001 B 24.96 24.96 27.10 0.0012 C 11878.03 11878.03 12898.73 < 0.0001 AB 0.081 0.081 0.088 0.7751 AC 59.91 59.91 65.06 < 0.0001 BC 205.92 205.92 223.62 < 0.0001 A
2 12.62 12.62 13.70 0.0076
B2 23.73 23.73 25.76 0.0014
C2 6114.05 6114.05 6639.44 < 0.0001
Residual 6.45 0.92 Lack of Fit 3.95 1.32 2.11 0.2413 not significant Pure Error 2.49 0.62 Cor Total 18866.84
Magnetic biocomposite
Model 19041.32 2115.70 594.78 < 0.0001 significant A 452.85 452.85 127.31 < 0.0001 B 29.76 29.76 8.37 0.0232 C 12178.92 12178.92 3423.83 < 0.0001 AB 1.78 1.78 0.50 0.5019 AC 6.60 6.60 1.86 0.2152 BC 24.11 24.11 6.78 0.0353 A
2 9.31 9.31 2.62 0.1497
B2 12.64 12.64 3.55 0.1014
C2 6284.98 6284.98 1766.88 < 0.0001
Residual 24.90 3.56 Lack of Fit 19.86 6.62 5.25 0.1715 not significant Pure Error 5.04 1.26 Cor Total 19066.22
*A: Adsorbent concentration; B: Dye concentration; C: pH
3.3. Effect of independent variables based on superimposed
perturbation plot The perturbation plot had to be used to concurrently evaluate the effect of three variables
during the dye adsorption processes. Perturbation plot illustrates how a function of a
(1a)
Design-Expert® SoftwareFactor Coding: ActualDecolorization %
99.51
1.6
X1 = A: Dosage ConcentrationX2 = B: Dye Concentration
Actual FactorC: pH = -0.675676
-1
-0.5
0
0.5
1
-1
-0.5
0
0.5
1
-20
0
20
40
60
80
100
120
Decolo
rization %
A: Dosage Concentration (g/100L)
B: Dye Concentration (mg/L)
47.2255
55.6669
48.9306
75.5271
(2a)
(1b)
Design-Expert® SoftwareFactor Coding: ActualDecolorization %
Design points above predicted valueDesign points below predicted value99.51
1.6
X1 = A: Dosage ConcentrationX2 = C: pH
Actual FactorB: Dye Concentration = -1
-1
-0.5
0
0.5
1
-1
-0.5
0
0.5
1
-20
0
20
40
60
80
100
120
Decolo
rization %
A: Dosage Concentration (g/100L)
C: pH (pH)
45.7645.76
55.5734
-0.789206
(2b)
(1c)
Design-Expert® SoftwareFactor Coding: ActualDecolorization %
Design points above predicted valueDesign points below predicted value99.51
1.6
X1 = B: Dye ConcentrationX2 = C: pH
Actual FactorA: Dosage Concentration = 0
-1
-0.5
0
0.5
1
-1
-0.5
0
0.5
1
-20
0
20
40
60
80
100
120
Decolo
rization %
B: Dye Concentration (mg/L)C: pH (pH)
61.407361.4073
68.4119
5.30401
6.40254
(2c)
Figure 1 Surface plot showing the collective effect of operating variable for sorption of MY dye on to
Salvinia molesta (1a, 1b, 1 c)
Figure2 Surface plot showing the collective effect of operating variable for sorption of MY dye on to iron
oxide (2a, 2b, 2c)
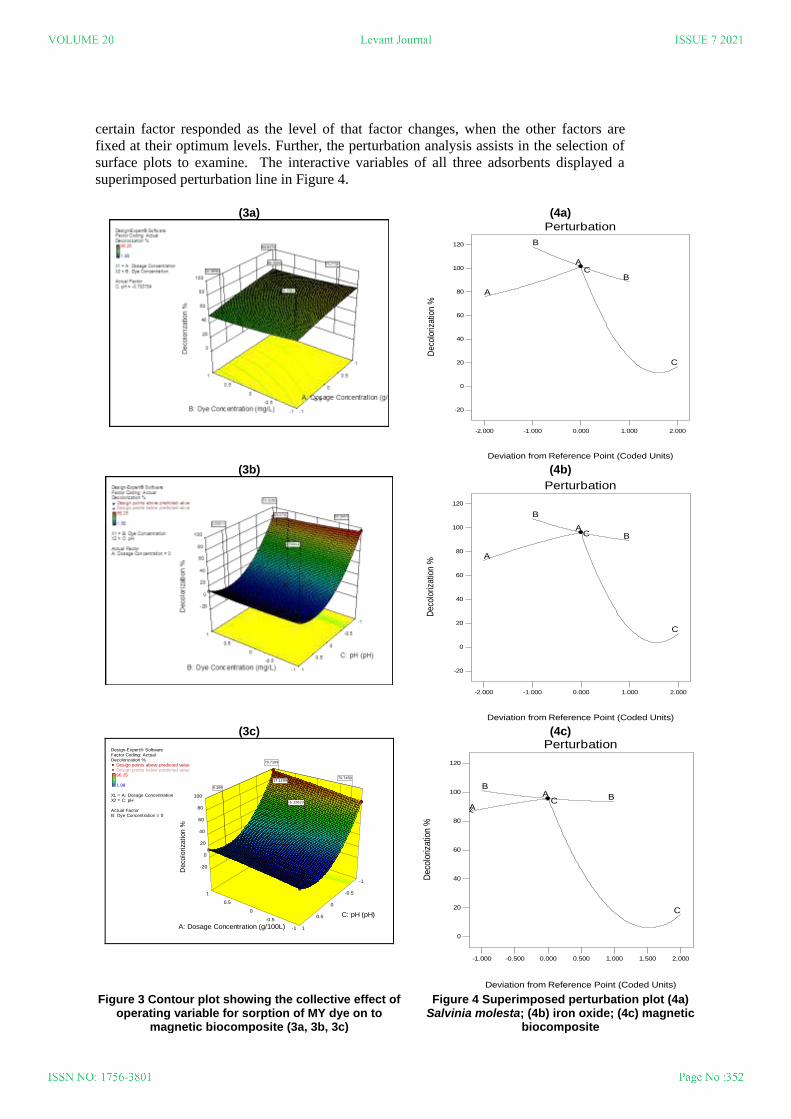
certain factor responded as the level of that factor changes, when the other factors are
fixed at their optimum levels. Further, the perturbation analysis assists in the selection of
surface plots to examine. The interactive variables of all three adsorbents displayed a
superimposed perturbation line in Figure 4.
(3a)
(4a)Design-Expert® SoftwareFactor Coding: ActualDecolorization %
Actual FactorsA: Dosage Concentration = 1B: Dye Concentration = 0C: pH = -1
-2.000 -1.000 0.000 1.000 2.000
-20
0
20
40
60
80
100
120
A
A
B
BC
C
Perturbation
Deviation from Reference Point (Coded Units)
Dec
olo
riza
tion
%
(3b)
(4b)Design-Expert® SoftwareFactor Coding: ActualDecolorization %
Actual FactorsA: Dosage Concentration = 1B: Dye Concentration = 0C: pH = -1
-2.000 -1.000 0.000 1.000 2.000
-20
0
20
40
60
80
100
120
A
A
B
BC
C
Perturbation
Deviation from Reference Point (Coded Units)
Deco
loriza
tion %
(3c)
Design-Expert® SoftwareFactor Coding: ActualDecolorization %
Design points above predicted valueDesign points below predicted value96.25
1.98
X1 = A: Dosage ConcentrationX2 = C: pH
Actual FactorB: Dye Concentration = 0
-1
-0.5
0
0.5
1-1
-0.5
0
0.5
1
-20
0
20
40
60
80
100
Deco
lori
zation %
A: Dosage Concentration (g/100L)
C: pH (pH)
8.169
79.7169
70.7459
-5.12623
17.1299
(4c)Design-Expert® SoftwareFactor Coding: ActualDecolorization %
Actual FactorsA: Dosage Concentration = 1B: Dye Concentration = 0C: pH = -1
-1.000 -0.500 0.000 0.500 1.000 1.500 2.000
0
20
40
60
80
100
120
A
AB
BC
C
Perturbation
Deviation from Reference Point (Coded Units)
Deco
loriza
tion %
Figure 3 Contour plot showing the collective effect of
operating variable for sorption of MY dye on to magnetic biocomposite (3a, 3b, 3c)
Figure 4 Superimposed perturbation plot (4a) Salvinia molesta; (4b) iron oxide; (4c) magnetic
biocomposite
The perturbation plot demonstrates that the decolorization efficiency shift from its desired
benchmark while all other variables remains constant at the coded „0‟ level. Therefore, the
perturbation plots exhibit the divergence from the adjusted reference point of factorial
level of all the variables. Further, the adsorbent dosage concentration (A) and pH solution
(C) can be observed as regulatory variabilities for achieving the maximum dye
decolorization efficiency. Consequently, the model was found to be sensitive to these
parameters these parameter (adsorbent concentration and solution pH) by the indication of
sharp curvature. The flat curves of the dye concentration shows that the effect of this
factor was less on the dye adsorption. The effect of adsorbent dosage was showed by
neither sharp curve nor flat line which implies that it has minimal effect compared to
solution pH on the dye removal. The steep curvature of pH (C) for SM, IO and MBC
indicate that MY dye adsorption is highly affected by the operating parameter pH
compared to other two parameters dosage concentration (A) and dye concentration (B).
3.4. Model validation The experiments were conducted to verify the predicted optimal conditions. The obtained
experimental values have been closely associated with the Box-behnken predicted values.
As a result, the experiments have been demonstrated that the optimization of process
variable using response surface methodology significantly enhanced the dye
sequestration. Therefore, with 95 percent accuracy, the predicted regression model is in
line with the test results. The findings ensured that the observed and forecast groups
agreed reasonably.
4. CONCLUSION The purpose of this research is to determine the optimum values of process parameters for
sequestration of dyes from the quadratic model obtained using experimental data. RSM
based BBD was employed to optimize the process parameters such as initial dye
concentration, adsorbent dosage concentration and initial solution pH during adorption of
MY dye using SM, IO and MBC. From the results of ANOVA, the decolorization
percentage is more sensitive to adsorbent dosage and pH of the solution. The R2 values
(0.9967, 0.9997and 0.9970), adjusted R2 values (0.9924, 0.9992 and 0.9970) and
predicted R2 (0.9755, 0.9964 and 0.9829) are close to 1 for SM, IO and MBC
respectively. This indicates a high correlation and acceptable agreement with
experimental data. Finally, RSM based Box-behnken design was identified as a good
statistical tool for optimal design of dye sequestration that provides appropriate results for
the maximum percentage decolorization.
Acknowledgments The authors are thankful to National Institute of Technology Calicut, India.
REFERENCES [1]. Ghaly A.E, Ananthashankar R, Alhattab, M, Ramakrishnan V. V, “Chemical
Engineering & Process Technology Production, Characterization and Treatment of
Textile Effluents: A Critical Review”. J Chem Eng Process Technol., vol. 5, pp. 1–
19, (2014). DOI: 10.4172/2157-7048.1000182.
[2]. Tayeb, Aghareed M., Maha A. Tony, and Ehsan K. Ismaeel. "Engineered
nanostructured ZnO for water remediation: operational parameters effect, Box–
Behnken design optimization and kinetic determinations." Applied Water Science.,
vol. 9, no. 3,pp. 43, (2019). DOI: https://doi.org/10.1007/s13201-019-0921-0.
[3]. Pal, Harinder. "Environmental Issues in Textiles: Global Regulations, Restrictions
and Research." In Detox Fashion, pp. 27-45. Springer, Singapore, (2017). DOI:
https://doi.org/10.1007/978-981-10-4777-0_2.
[4]. Sathiyavimal, S., Vasantharaj, S., Kaliannan, T. and Pugazhendhi, A.,. Eco-
biocompatibility of chitosan coated biosynthesized copper oxide nanocomposite for
enhanced industrial (Azo) dye removal from aqueous solution and antibacterial
properties. Carbohydrate Polymers, vol. 241, pp.116243, (2020). DOI:
https://doi.org/10.1016/j.carbpol.2020.116243.
[5]. Mohammed M.A, Shitu A, Ibrahim A, “Removal of methylene blue using low cost
adsorbent: A review, Research Journal of Chemical Sciences, vol. 4, pp. 91–102,
(2014).
[6]. Solomon, D., Kiflie, Z. & Van Hulle, S. Using Box–Behnken experimental design to
optimize the degradation of Basic Blue 41 dye by Fenton reaction. Int J Ind Chem
vol. 11, pp. 43–53, (2020). https://doi.org/10.1007/s40090-020-00201-5
[7]. Karthik V, Saravanan K, Nadu T, “An overview of treatments for the removal of
textile dyes”, Journal of Chemical and Pharmaceutical Sciences, vol. 7, pp. 301–
307, (2014).
[8]. Sivashankar, R., Sathya, A. B., & Sivasubramanian, V. Synthesis of magnetic
biocomposite for efficient adsorption of azo dye from aqueous solution.
Ecotoxicology and environmental safety, vol. 121, pp. 149-153. (2015). DOI:
https://doi.org/10.1016/j.ecoenv.2015.04.037
[9]. Sivashankar, R., Sathya, A. B., Vasantharaj, K., & Sivasubramanian, V. Reduction
of azo dye from aqueous solution using acid treated aquatic macrophytes. J.
Environ. Nanotechnol, vol. 3, no. 2, pp. 50-61. (2014). DOI:
10.13074/jent.2014.03.142068.
[10]. Fu and Ravindra, “Magnetic iron oxide nanoparticles: synthesis and applications”,
Bioinspired, Biomimetic and Nano biomaterials, vol. 1, no. 4, pp.229-244. (2012).
DOI: https://doi.org/10.1680/bbn.12.00014
[11]. O. Anjaneyaa, S. Yogesh Souche b, M. Santoshkumar a, T.B. Karegoudar,
“Decolorization of sulfonated azo dye Metanil Yellow by newly isolated bacterial
strains: Bacillus sp. strain AK1 and Lysinibacillus sp. strain AK2”, Journal of
Hazardous Materials, vol. 190, pp. 351–358, (2011). DOI:
https://doi.org/10.1016/j.jhazmat.2011.03.044
[12]. Masoud Kousha, Ehsan Daneshvar, Hakimeh Dopeikar, Delaram Taghavi, Amit
Bhatnagar., “Box–Behnken design optimization of Acid Black 1 dye biosorption by

different brown macroalgae”., Chemical Engineering Journal, vol. 179, pp. 158–
168, (2012). DOI: https://doi.org/10.1016/j.cej.2011.10.073