Embed Size (px)
Citation preview
1/11/2020
1
Overview of Dairy Risk Management Programs
January 9, 2019Dr. Marin Bozic
Wisconsin, 7.9%
Minnesota, 9.4%
0%
1%
2%
3%
4%
5%
6%
7%
8%
9%
10%
Upper Midwest Dairy Farm Exit Rates, Year-on-Year %
1
2
© Mari
n Boz
ic
1/11/2020
2
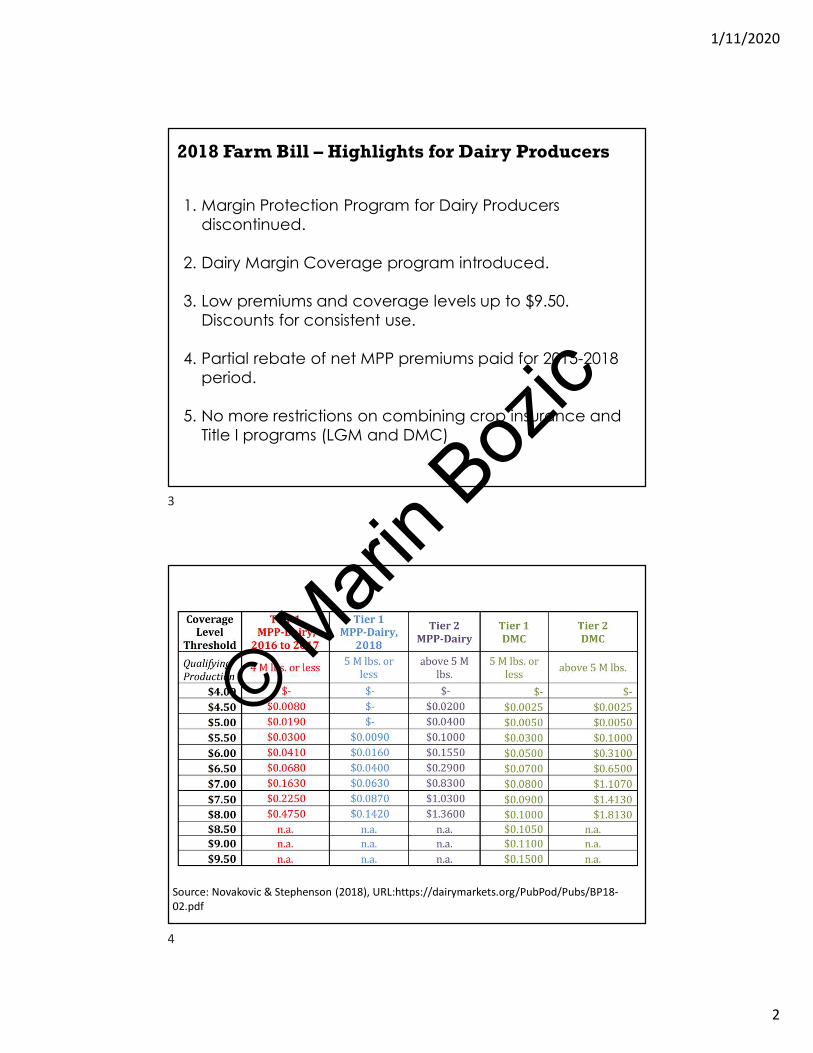
1. Margin Protection Program for Dairy Producers discontinued.
2. Dairy Margin Coverage program introduced.
3. Low premiums and coverage levels up to $9.50. Discounts for consistent use.
4. Partial rebate of net MPP premiums paid for 2015-2018 period.
5. No more restrictions on combining crop insurance and Title I programs (LGM and DMC)
2018 Farm Bill – Highlights for Dairy Producers
Source: Novakovic & Stephenson (2018), URL:https://dairymarkets.org/PubPod/Pubs/BP18-02.pdf
3
4
© Mari
n Boz
ic
1/11/2020
3
-$0.50
$0.00
$0.50
$1.00
$1.50
$2.00
$2.50
$3.00
$3.50
$4.00
2015 2016 2017 2018
Ne
t Pa
yme
nt
Per C
wt
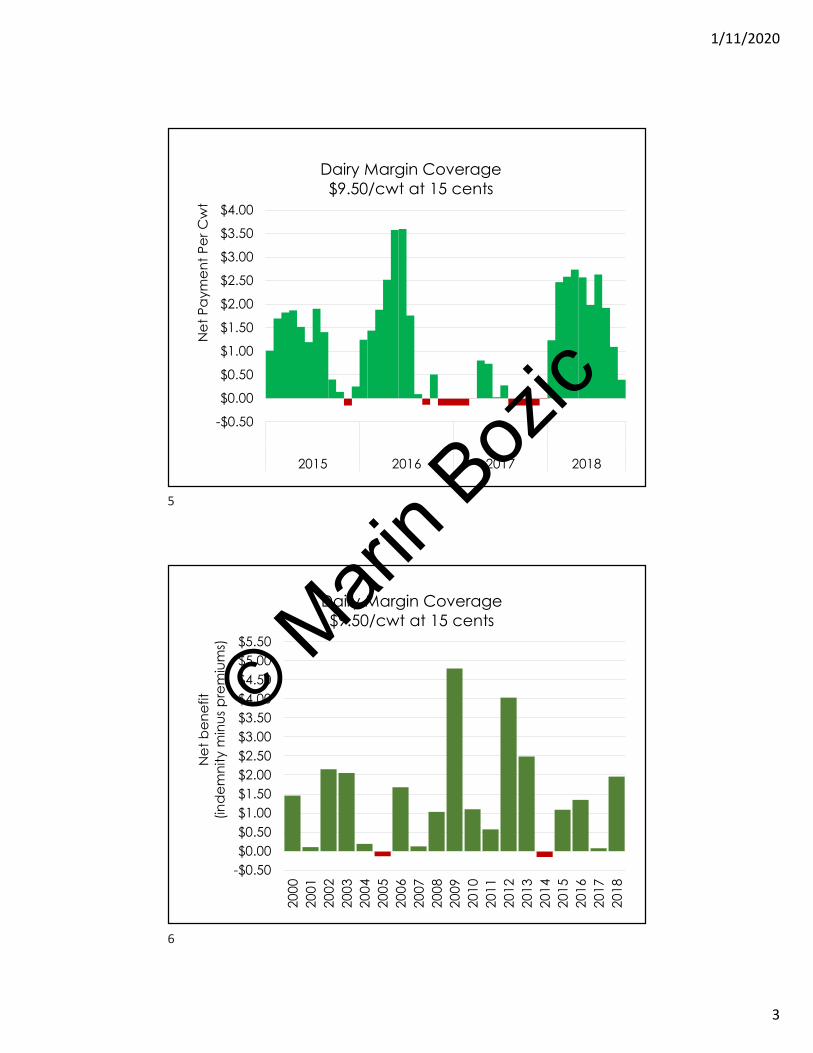
Dairy Margin Coverage$9.50/cwt at 15 cents
-$0.50$0.00$0.50$1.00$1.50$2.00$2.50$3.00$3.50$4.00$4.50$5.00$5.50
2000
2001
2002
2003
2004
2005
2006
2007
2008
2009
2010
2011
2012
2013
2014
2015
2016
2017
2018
Ne
t b
en
efit
(in
de
mn
ity m
inu
s p
rem
ium
s)
Dairy Margin Coverage$9.50/cwt at 15 cents
5
6
© Mari
n Boz
ic
1/11/2020
4
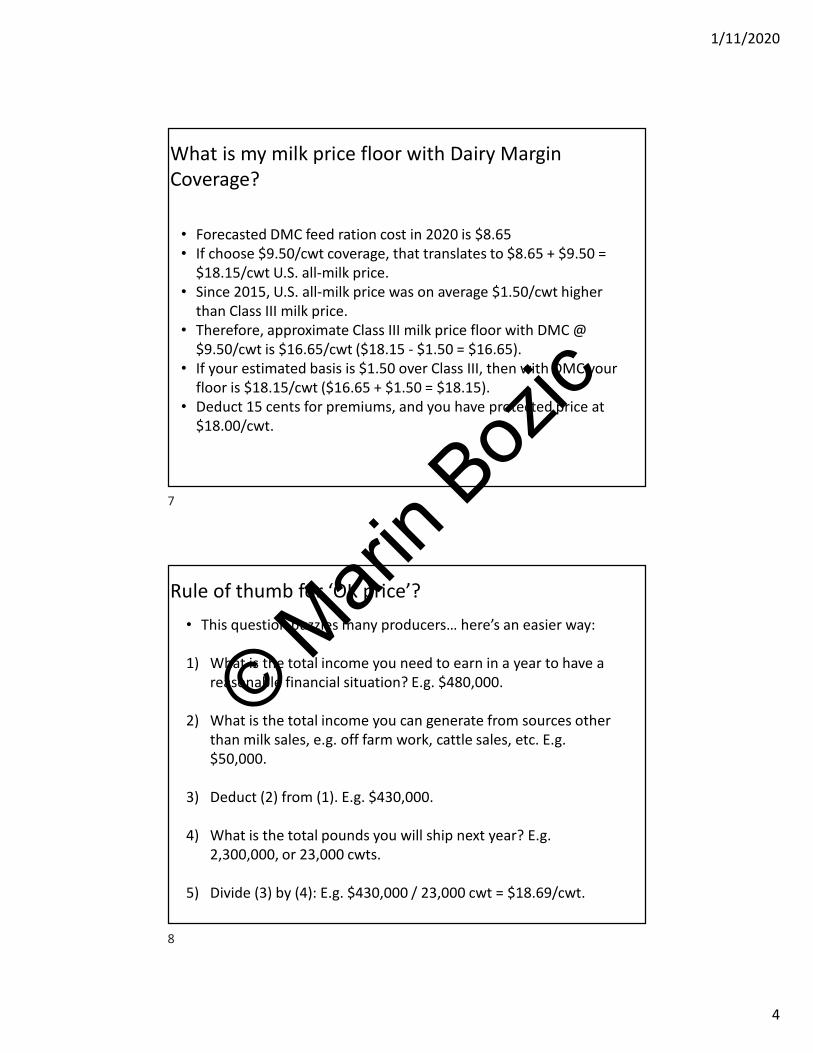
What is my milk price floor with Dairy Margin Coverage?
• Forecasted DMC feed ration cost in 2020 is $8.65• If choose $9.50/cwt coverage, that translates to $8.65 + $9.50 =
$18.15/cwt U.S. all-milk price.• Since 2015, U.S. all-milk price was on average $1.50/cwt higher
than Class III milk price.• Therefore, approximate Class III milk price floor with DMC @
$9.50/cwt is $16.65/cwt ($18.15 - $1.50 = $16.65). • If your estimated basis is $1.50 over Class III, then with DMC your
floor is $18.15/cwt ($16.65 + $1.50 = $18.15).• Deduct 15 cents for premiums, and you have protected price at
$18.00/cwt.
Rule of thumb for ‘OK price’? • This question puzzles many producers… here’s an easier way:
1) What is the total income you need to earn in a year to have a reasonable financial situation? E.g. $480,000.
2) What is the total income you can generate from sources other than milk sales, e.g. off farm work, cattle sales, etc. E.g. $50,000.
3) Deduct (2) from (1). E.g. $430,000.
4) What is the total pounds you will ship next year? E.g. 2,300,000, or 23,000 cwts.
5) Divide (3) by (4): E.g. $430,000 / 23,000 cwt = $18.69/cwt.
7
8
© Mari
n Boz
ic
1/11/2020
5
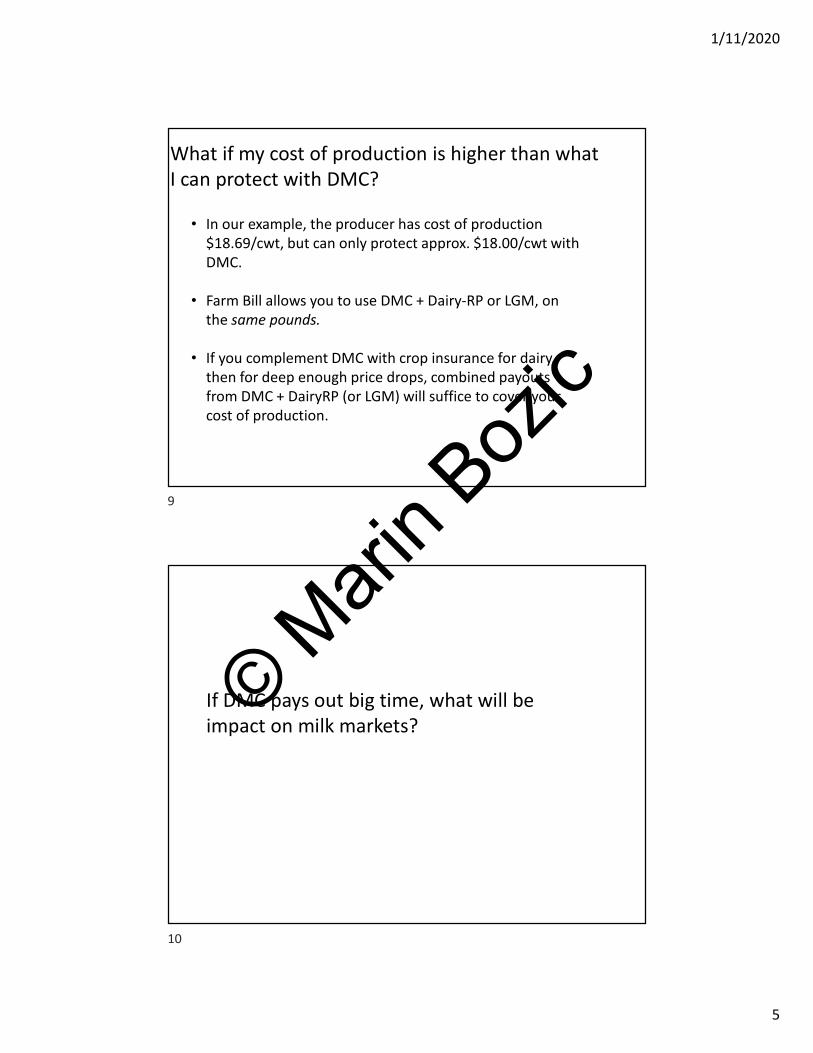
What if my cost of production is higher than what I can protect with DMC?
• In our example, the producer has cost of production $18.69/cwt, but can only protect approx. $18.00/cwt with DMC.
• Farm Bill allows you to use DMC + Dairy-RP or LGM, on the same pounds.
• If you complement DMC with crop insurance for dairy, then for deep enough price drops, combined payouts from DMC + DairyRP (or LGM) will suffice to cover your cost of production.
If DMC pays out big time, what will be impact on milk markets?
9
10
© Mari
n Boz
ic
1/11/2020
6
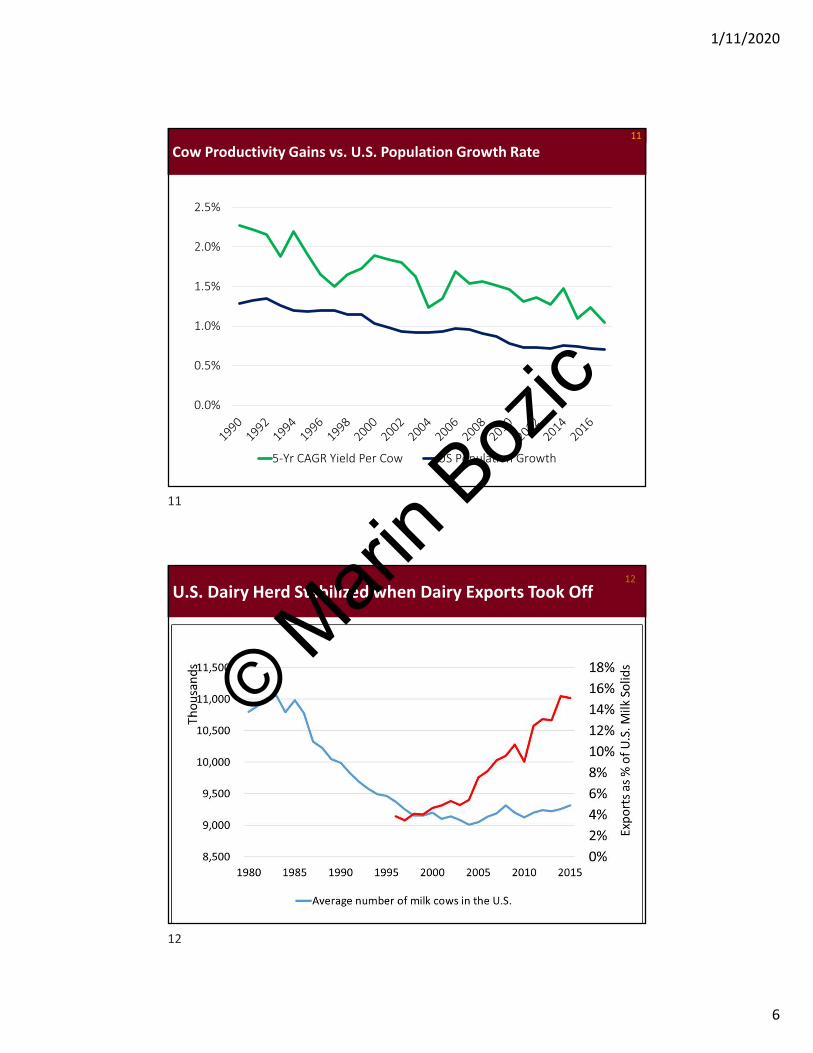
Cow Productivity Gains vs. U.S. Population Growth Rate11
0.0%
0.5%
1.0%
1.5%
2.0%
2.5%
5-Yr CAGR Yield Per Cow US Population Growth
U.S. Dairy Herd Stabilized when Dairy Exports Took Off12
11
12
© Mari
n Boz
ic
1/11/2020
7
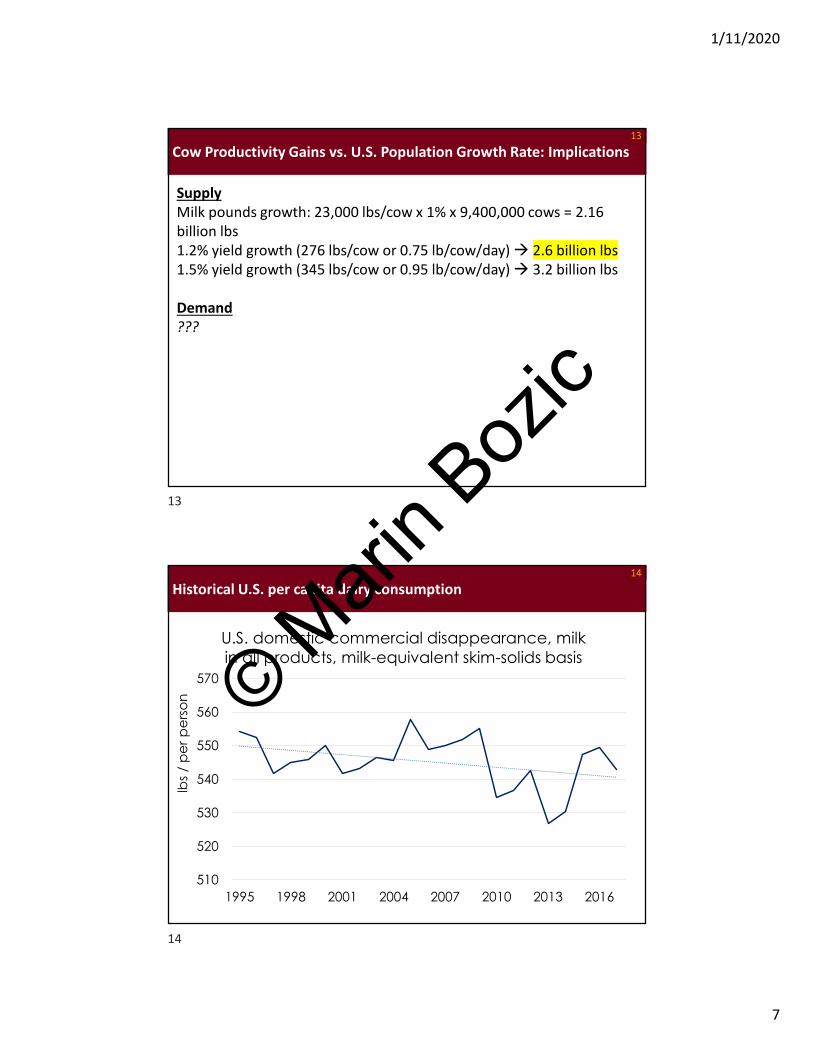
Cow Productivity Gains vs. U.S. Population Growth Rate: Implications13
SupplyMilk pounds growth: 23,000 lbs/cow x 1% x 9,400,000 cows = 2.16 billion lbs1.2% yield growth (276 lbs/cow or 0.75 lb/cow/day) 2.6 billion lbs1.5% yield growth (345 lbs/cow or 0.95 lb/cow/day) 3.2 billion lbs
Demand???
Historical U.S. per capita dairy consumption14
510
520
530
540
550
560
570
1995 1998 2001 2004 2007 2010 2013 2016
lbs
/ p
er p
ers
on
U.S. domestic commercial disappearance, milk in all products, milk-equivalent skim-solids basis
13
14
© Mari
n Boz
ic
1/11/2020
8
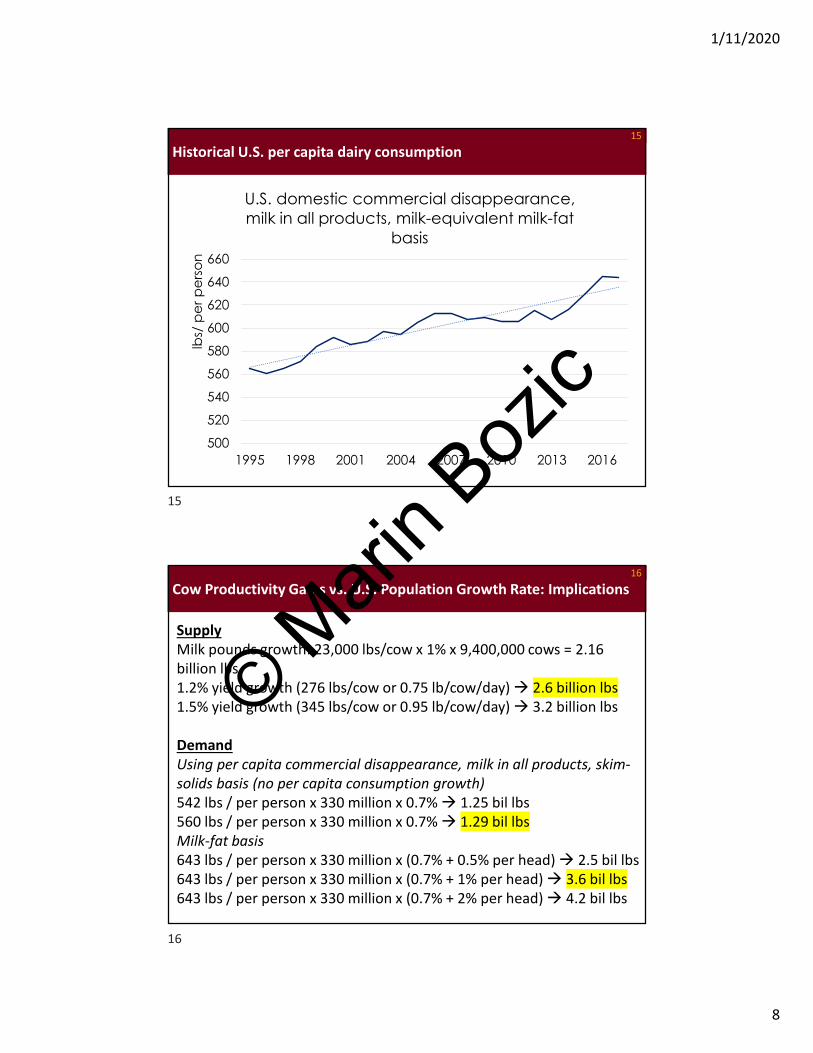
Historical U.S. per capita dairy consumption15
500
520
540
560
580
600
620
640
660
1995 1998 2001 2004 2007 2010 2013 2016
lbs/
pe
r pe
rso
nU.S. domestic commercial disappearance, milk in all products, milk-equivalent milk-fat
basis
Cow Productivity Gains vs. U.S. Population Growth Rate: Implications16
SupplyMilk pounds growth: 23,000 lbs/cow x 1% x 9,400,000 cows = 2.16 billion lbs1.2% yield growth (276 lbs/cow or 0.75 lb/cow/day) 2.6 billion lbs1.5% yield growth (345 lbs/cow or 0.95 lb/cow/day) 3.2 billion lbs
DemandUsing per capita commercial disappearance, milk in all products, skim-solids basis (no per capita consumption growth)542 lbs / per person x 330 million x 0.7% 1.25 bil lbs560 lbs / per person x 330 million x 0.7% 1.29 bil lbsMilk-fat basis643 lbs / per person x 330 million x (0.7% + 0.5% per head) 2.5 bil lbs643 lbs / per person x 330 million x (0.7% + 1% per head) 3.6 bil lbs643 lbs / per person x 330 million x (0.7% + 2% per head) 4.2 bil lbs
15
16
© Mari
n Boz
ic
1/11/2020
9
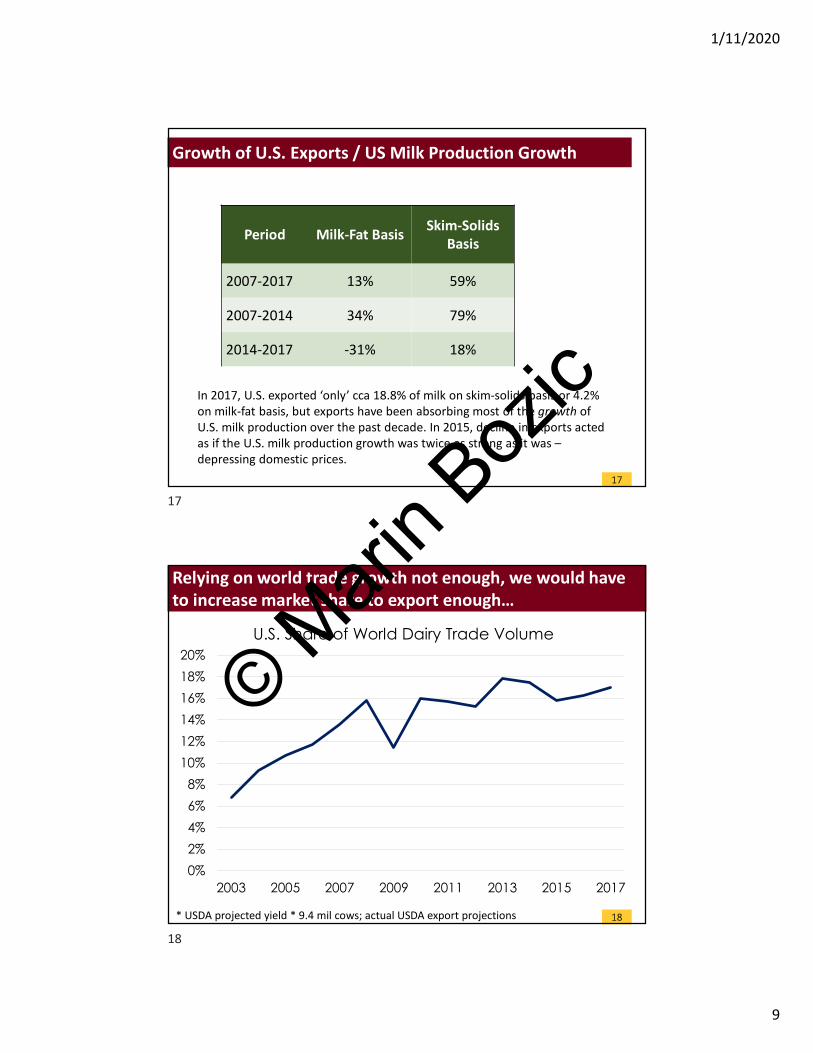
Growth of U.S. Exports / US Milk Production Growth
17
Period Milk-Fat Basis Skim-Solids Basis
2007-2017 13% 59%
2007-2014 34% 79%
2014-2017 -31% 18%
In 2017, U.S. exported ‘only’ cca 18.8% of milk on skim-solids basis or 4.2% on milk-fat basis, but exports have been absorbing most of the growth of U.S. milk production over the past decade. In 2015, decline in exports acted as if the U.S. milk production growth was twice as strong as it was –depressing domestic prices.
Relying on world trade growth not enough, we would have to increase market share to export enough…
18* USDA projected yield * 9.4 mil cows; actual USDA export projections
0%
2%
4%
6%
8%
10%
12%
14%
16%
18%
20%
2003 2005 2007 2009 2011 2013 2015 2017
U.S. Share of World Dairy Trade Volume
17
18
© Mari
n Boz
ic
1/11/2020
10
If DMC pays out big time, what will be impact on milk markets?
• Many producers which would otherwise have to exit will be able to stay in business.
• My estimate is that in a year like 2018, DMC payouts could be $800 million - $1 billion.
• Will that result in more milk on the market? It depends. Where plant capacity is a constraint, coops may not allow some producers to expand, even if they want.
• Some planned new dairies may not be built, anticipating milk oversupply.
• All things considered, more pressure on mid-size and large dairies to balance supply and demand.
• That’s why it’s important right now to put in risk management for 2020 and 2021.
DAIRY REVENUE PROTECTION POLICY
19
20
© Mari
n Boz
ic
1/11/2020
11
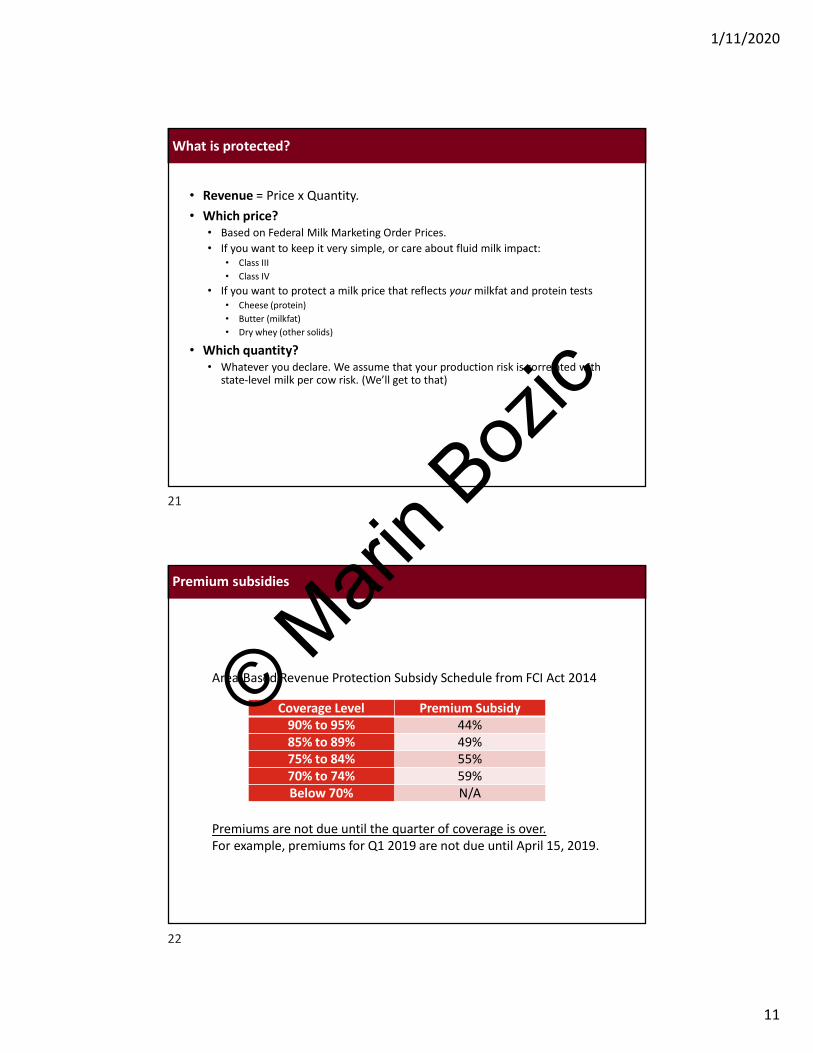
What is protected?
• Revenue = Price x Quantity.• Which price?
• Based on Federal Milk Marketing Order Prices.• If you want to keep it very simple, or care about fluid milk impact:
• Class III• Class IV
• If you want to protect a milk price that reflects your milkfat and protein tests• Cheese (protein)• Butter (milkfat)• Dry whey (other solids)
• Which quantity?• Whatever you declare. We assume that your production risk is correlated with
state-level milk per cow risk. (We’ll get to that)
Premium subsidies
Coverage Level Premium Subsidy90% to 95% 44%85% to 89% 49%75% to 84% 55%70% to 74% 59%Below 70% N/A
Area-Based Revenue Protection Subsidy Schedule from FCI Act 2014
Premiums are not due until the quarter of coverage is over.For example, premiums for Q1 2019 are not due until April 15, 2019.
21
22
© Mari
n Boz
ic
1/11/2020
12
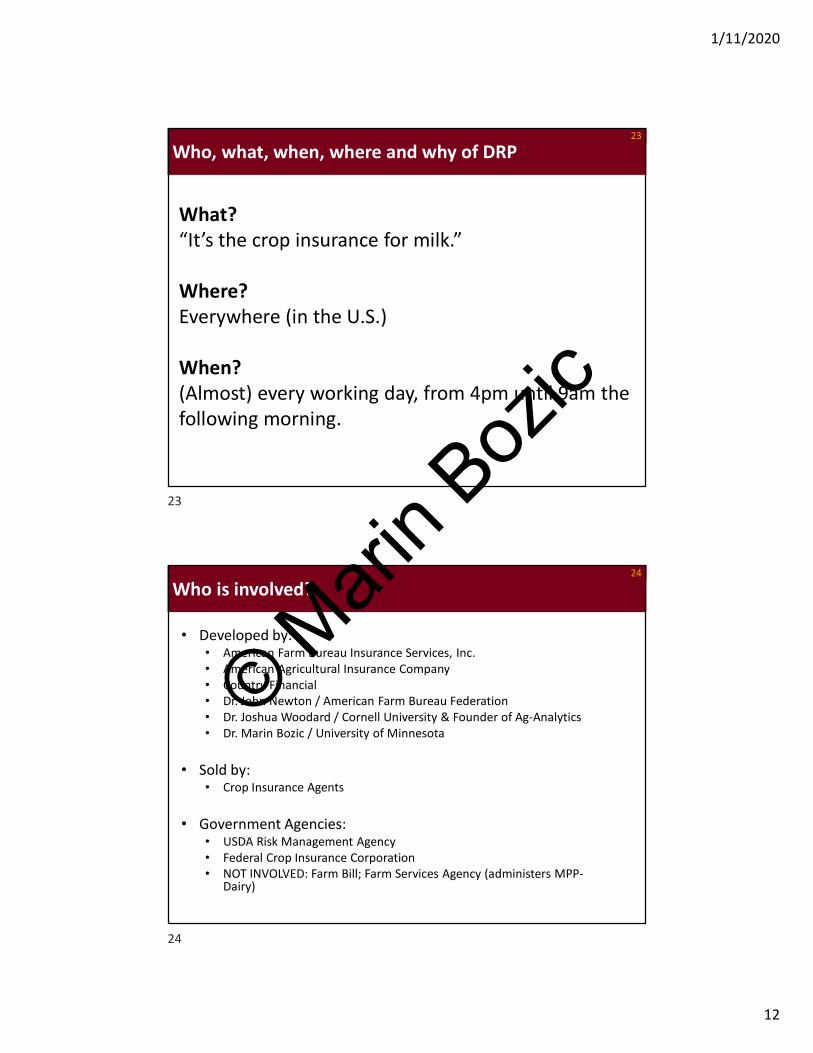
Who, what, when, where and why of DRP23
What? “It’s the crop insurance for milk.”
Where?Everywhere (in the U.S.)
When?(Almost) every working day, from 4pm until 9am the following morning.
Who is involved? 24
• Developed by:• American Farm Bureau Insurance Services, Inc.• American Agricultural Insurance Company• Country Financial• Dr. John Newton / American Farm Bureau Federation• Dr. Joshua Woodard / Cornell University & Founder of Ag-Analytics• Dr. Marin Bozic / University of Minnesota
• Sold by:• Crop Insurance Agents
• Government Agencies:• USDA Risk Management Agency• Federal Crop Insurance Corporation• NOT INVOLVED: Farm Bill; Farm Services Agency (administers MPP-
Dairy)
23
24
© Mari
n Boz
ic
1/11/2020
13
What is protected? 25
• Revenue = Price x Quantity.• Which price?
• Based on Federal Milk Marketing Order Prices.• If you want to keep it very simple, or care about fluid milk impact:
• Class III• Class IV
• If you want to protect a milk price that reflects your milkfat and protein tests• Cheese (protein)• Butter (milkfat)• Dry whey (other solids)
• Which quantity?• Whatever you declare. We assume that your production risk is
correlated with state-level milk per cow risk. (We’ll get to that)
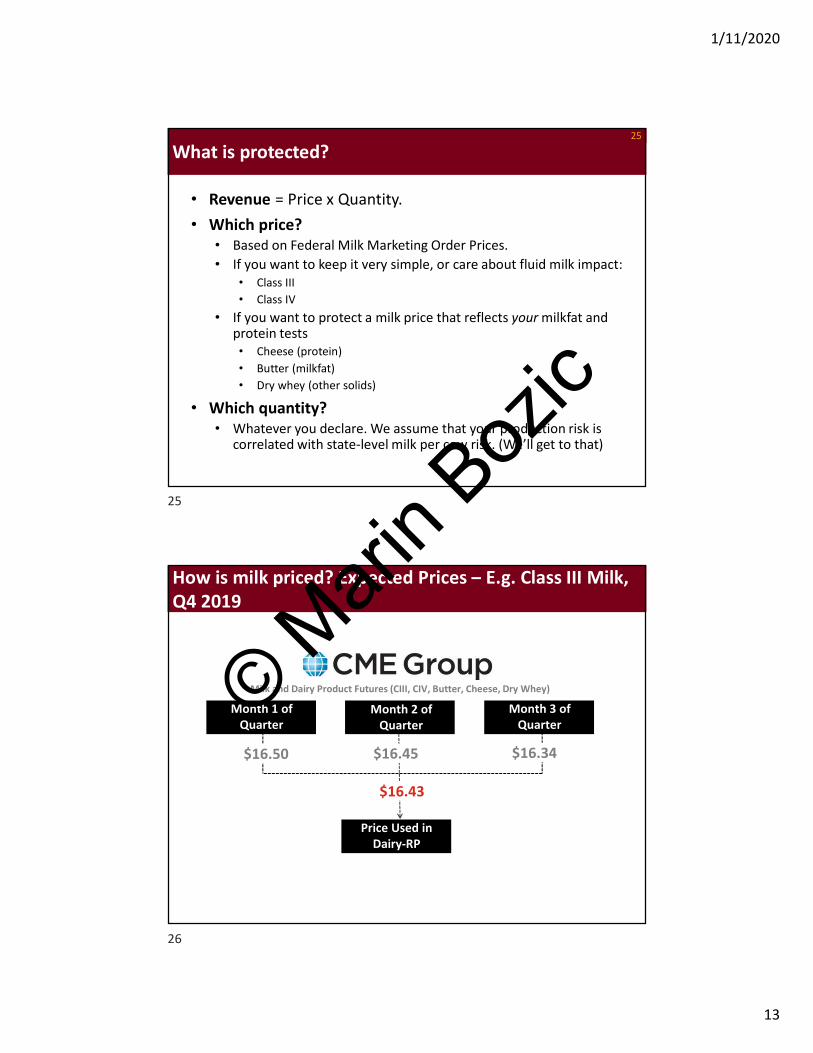
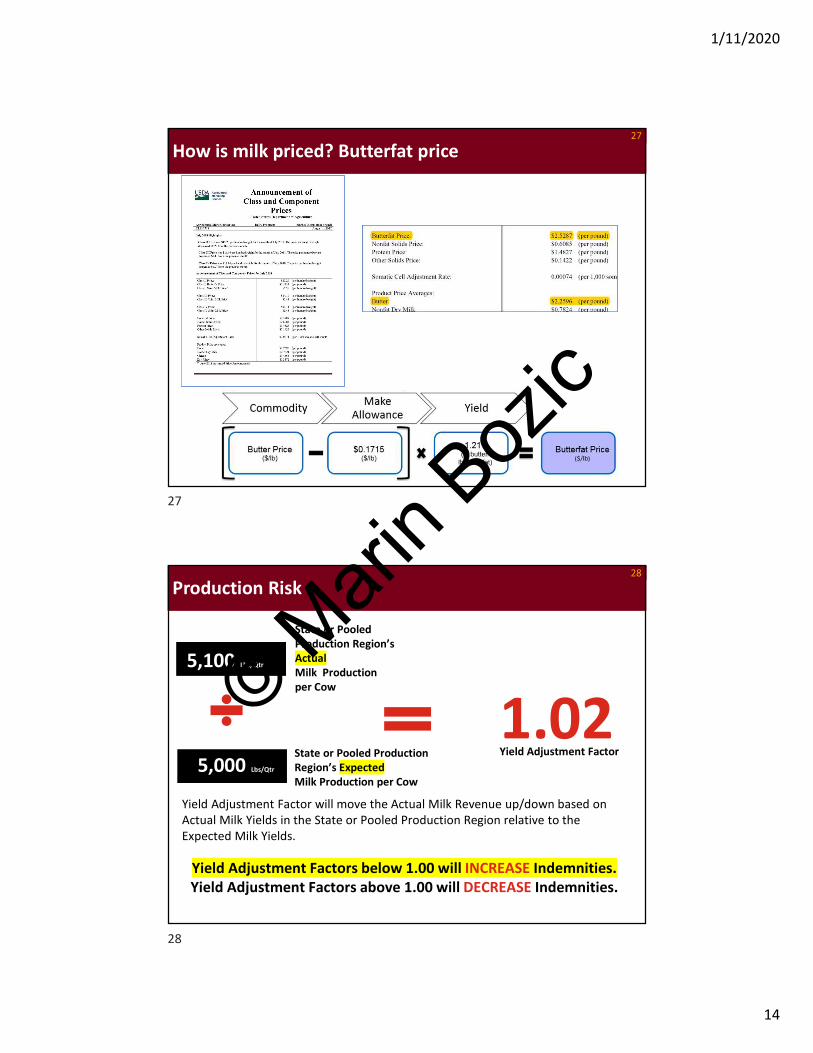
How is milk priced? Expected Prices – E.g. Class III Milk, Q4 2019
Month 1 of Quarter
Price Used in Dairy-RP
Month 2 of Quarter
Month 3 of Quarter
$16.50 $16.45 $16.34
$16.43
Milk and Dairy Product Futures (CIII, CIV, Butter, Cheese, Dry Whey)
25
26
© Mari
n Boz
ic
1/11/2020
14
How is milk priced? Butterfat price27
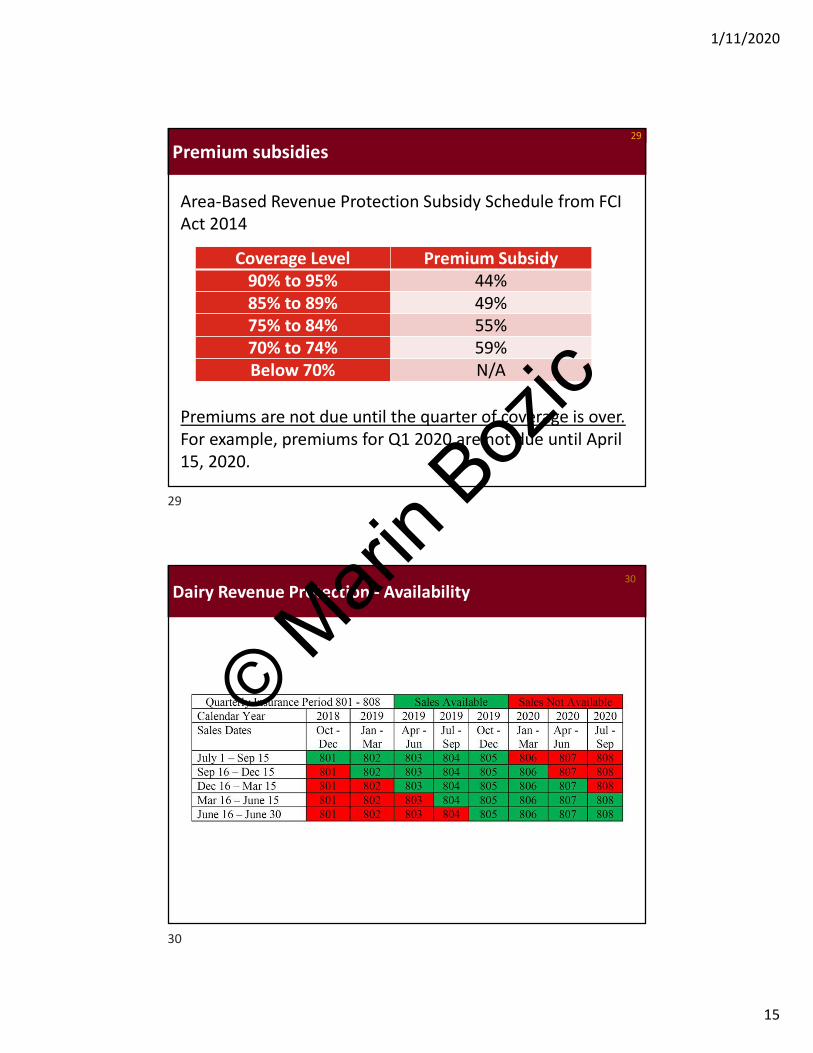
Production Risk28
5,000 Lbs/Qtr
State or Pooled Production Region’s ExpectedMilk Production per Cow
5,100 Lbs/Qtr
State or Pooled Production Region’s ActualMilk Production per Cow
1.02Yield Adjustment Factor
Yield Adjustment Factor will move the Actual Milk Revenue up/down based on Actual Milk Yields in the State or Pooled Production Region relative to the Expected Milk Yields.
Yield Adjustment Factors below 1.00 will INCREASE Indemnities.Yield Adjustment Factors above 1.00 will DECREASE Indemnities.
27
28
© Mari
n Boz
ic
1/11/2020
15
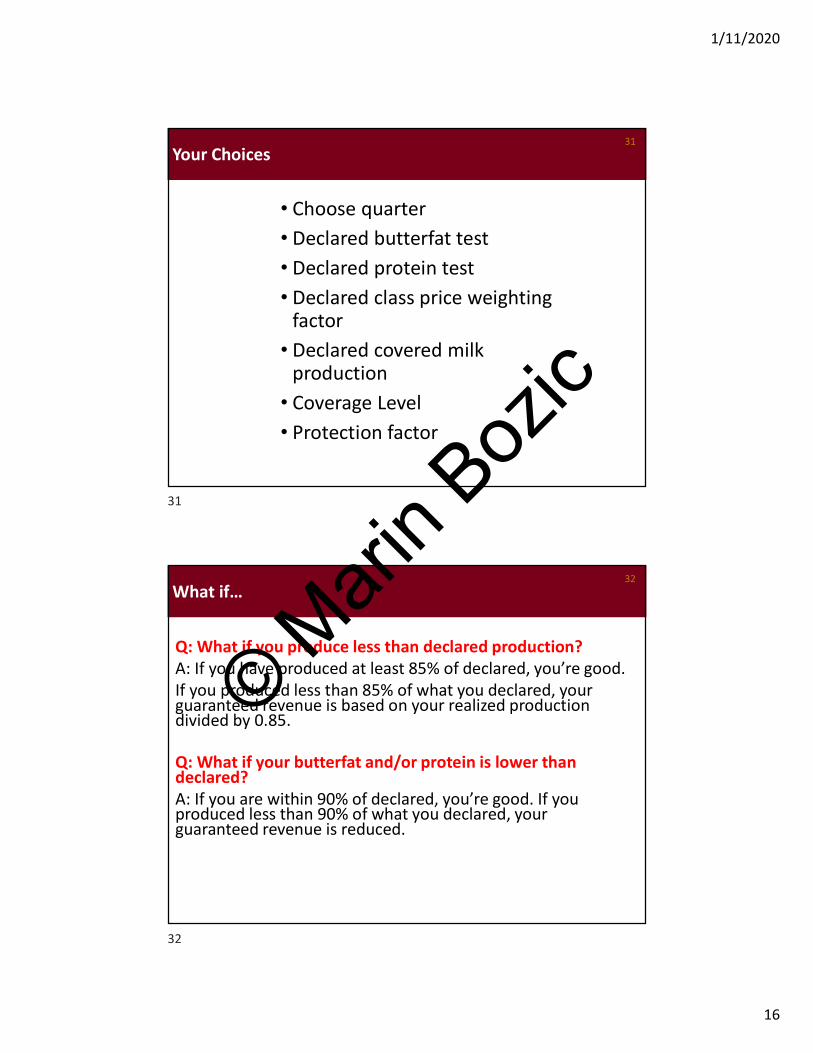
Premium subsidies29
Coverage Level Premium Subsidy90% to 95% 44%85% to 89% 49%75% to 84% 55%70% to 74% 59%Below 70% N/A
Area-Based Revenue Protection Subsidy Schedule from FCI Act 2014
Premiums are not due until the quarter of coverage is over.For example, premiums for Q1 2020 are not due until April 15, 2020.
Dairy Revenue Protection - Availability30
29
30
© Mari
n Boz
ic
1/11/2020
16
Your Choices31
• Choose quarter• Declared butterfat test• Declared protein test• Declared class price weighting
factor• Declared covered milk
production• Coverage Level• Protection factor
What if…32
Q: What if you produce less than declared production?A: If you have produced at least 85% of declared, you’re good. If you produced less than 85% of what you declared, your guaranteed revenue is based on your realized production divided by 0.85.
Q: What if your butterfat and/or protein is lower than declared? A: If you are within 90% of declared, you’re good. If you produced less than 90% of what you declared, your guaranteed revenue is reduced.
31
32
© Mari
n Boz
ic
1/11/2020
17
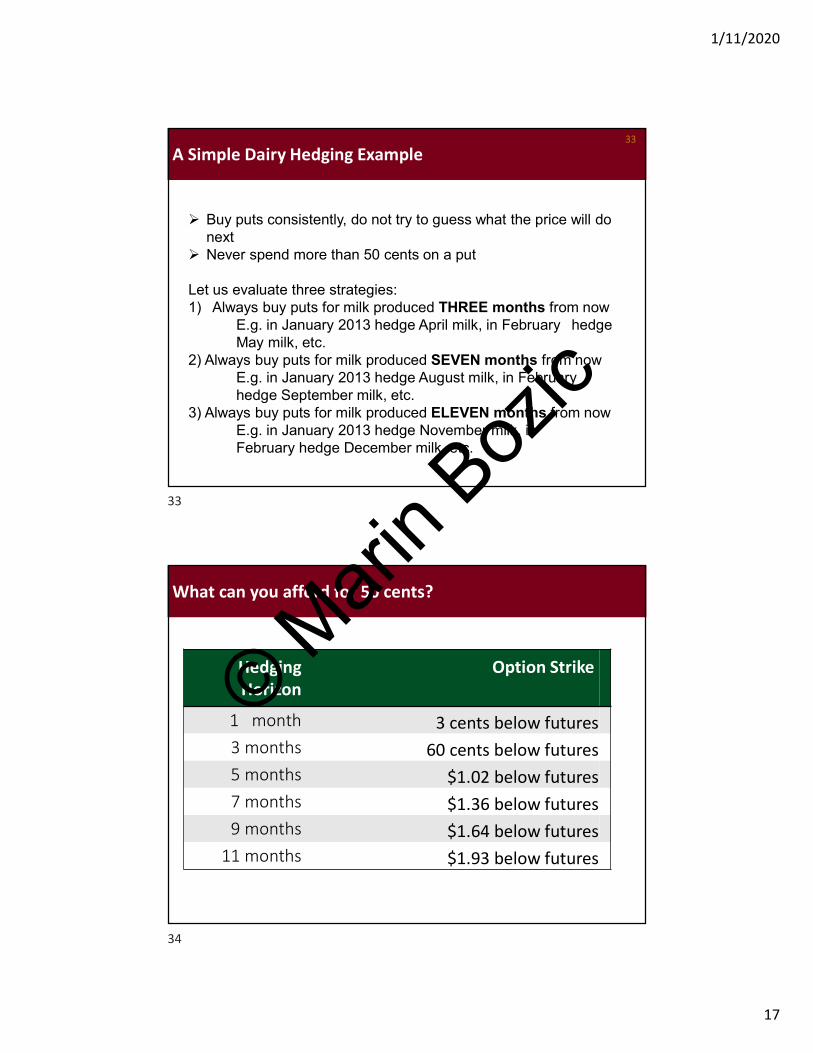
A Simple Dairy Hedging Example33
Buy puts consistently, do not try to guess what the price will do next
Never spend more than 50 cents on a put
Let us evaluate three strategies:1) Always buy puts for milk produced THREE months from now
E.g. in January 2013 hedge April milk, in February hedge May milk, etc.
2) Always buy puts for milk produced SEVEN months from nowE.g. in January 2013 hedge August milk, in February hedge September milk, etc.
3) Always buy puts for milk produced ELEVEN months from nowE.g. in January 2013 hedge November milk, in February hedge December milk, etc.
What can you afford for 50 cents?
Hedging Horizon
Option Strike
1 month 3 cents below futures3 months 60 cents below futures5 months $1.02 below futures7 months $1.36 below futures9 months $1.64 below futures
11 months $1.93 below futures
33
34
© Mari
n Boz
ic
1/11/2020
18
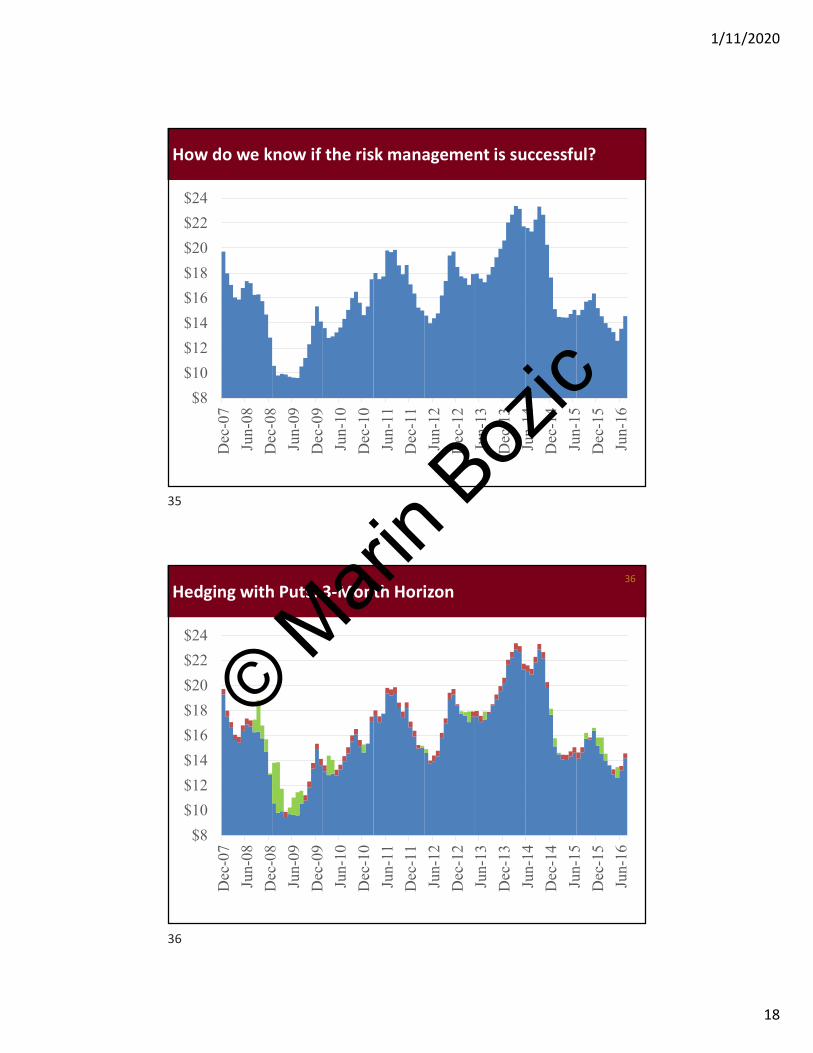
How do we know if the risk management is successful?
$8
$10
$12
$14
$16
$18
$20
$22
$24
Dec-07
Jun-08
Dec-08
Jun-09
Dec-09
Jun-10
Dec-10
Jun-11
Dec-11
Jun-12
Dec-12
Jun-13
Dec-13
Jun-14
Dec-14
Jun-15
Dec-15
Jun-16
Hedging with Puts: 3-Month Horizon36
$8
$10
$12
$14
$16
$18
$20
$22
$24
Dec-07
Jun-08
Dec-08
Jun-09
Dec-09
Jun-10
Dec-10
Jun-11
Dec-11
Jun-12
Dec-12
Jun-13
Dec-13
Jun-14
Dec-14
Jun-15
Dec-15
Jun-16
35
36
© Mari
n Boz
ic
1/11/2020
19
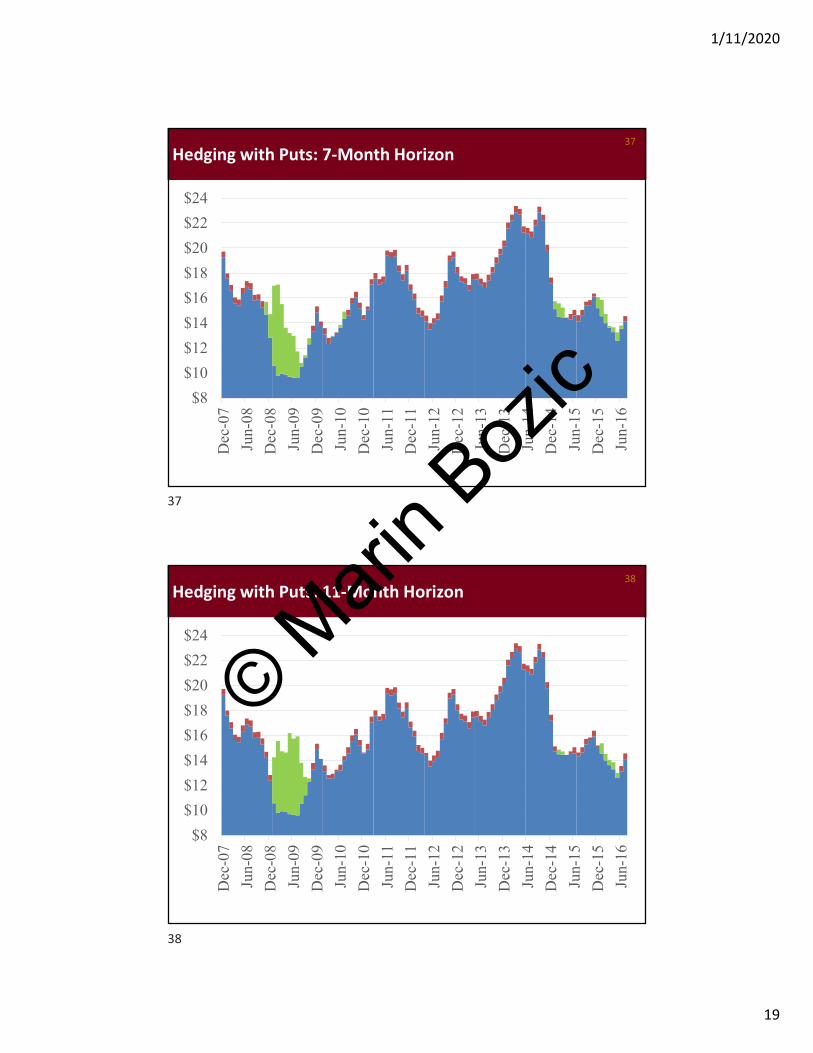
Hedging with Puts: 7-Month Horizon37
$8
$10
$12
$14
$16
$18
$20
$22
$24
Dec-07
Jun-08
Dec-08
Jun-09
Dec-09
Jun-10
Dec-10
Jun-11
Dec-11
Jun-12
Dec-12
Jun-13
Dec-13
Jun-14
Dec-14
Jun-15
Dec-15
Jun-16
Hedging with Puts: 11-Month Horizon38
$8
$10
$12
$14
$16
$18
$20
$22
$24
Dec-07
Jun-08
Dec-08
Jun-09
Dec-09
Jun-10
Dec-10
Jun-11
Dec-11
Jun-12
Dec-12
Jun-13
Dec-13
Jun-14
Dec-14
Jun-15
Dec-15
Jun-16
37
38
© Mari
n Boz
ic
1/11/2020
20
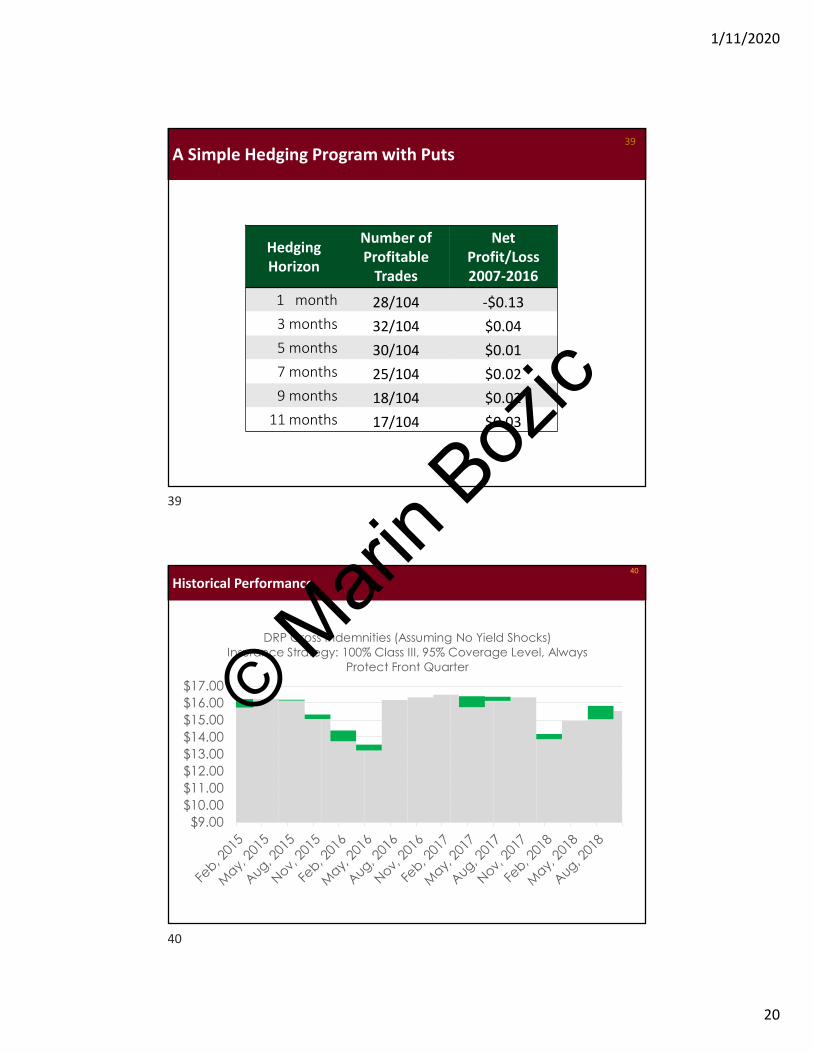
A Simple Hedging Program with Puts39
Hedging Horizon
Number ofProfitable
Trades
Net Profit/Loss2007-2016
1 month 28/104 -$0.133 months 32/104 $0.045 months 30/104 $0.017 months 25/104 $0.029 months 18/104 $0.02
11 months 17/104 $0.03
Historical Performance40
$9.00$10.00$11.00$12.00$13.00$14.00$15.00$16.00$17.00
DRP Gross Indemnities (Assuming No Yield Shocks)Insurance Strategy: 100% Class III, 95% Coverage Level, Always
Protect Front Quarter
39
40
© Mari
n Boz
ic
1/11/2020
21
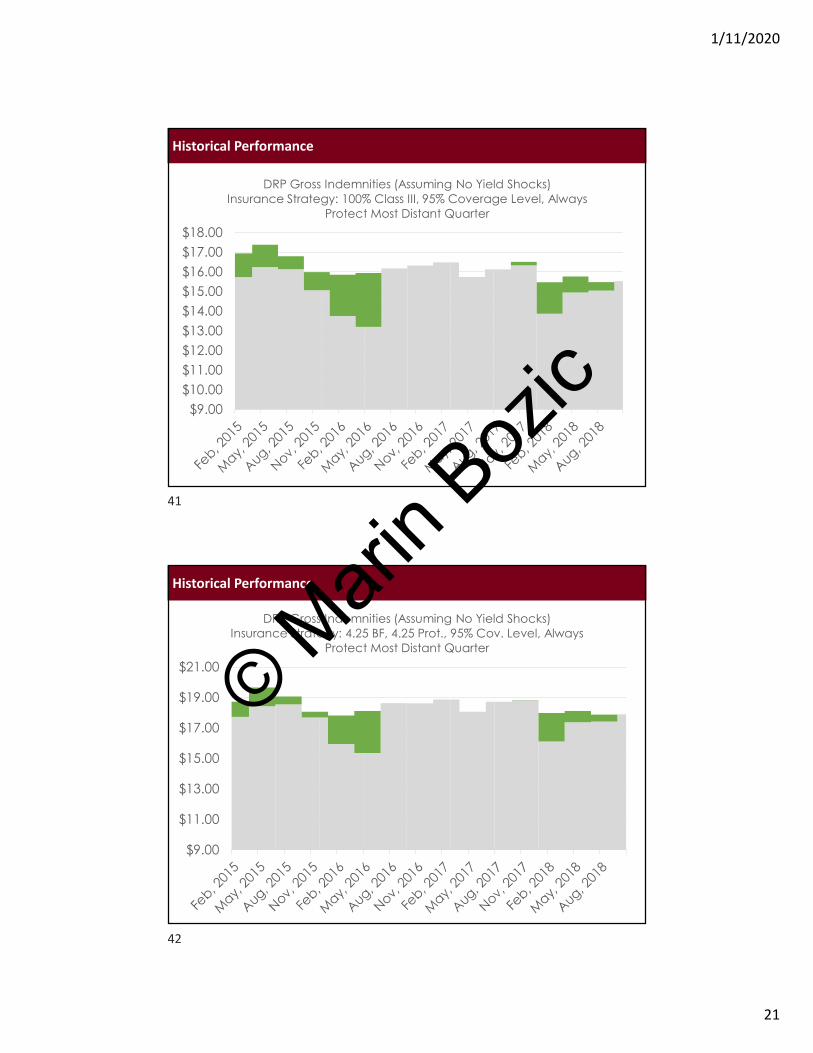
Historical Performance
$9.00$10.00$11.00$12.00$13.00
$14.00$15.00$16.00$17.00$18.00
DRP Gross Indemnities (Assuming No Yield Shocks)Insurance Strategy: 100% Class III, 95% Coverage Level, Always
Protect Most Distant Quarter
Historical Performance
$9.00
$11.00
$13.00
$15.00
$17.00
$19.00
$21.00
DRP Gross Indemnities (Assuming No Yield Shocks)Insurance Strategy: 4.25 BF, 4.25 Prot., 95% Cov. Level, Always
Protect Most Distant Quarter
41
42
© Mari
n Boz
ic
1/11/2020
22
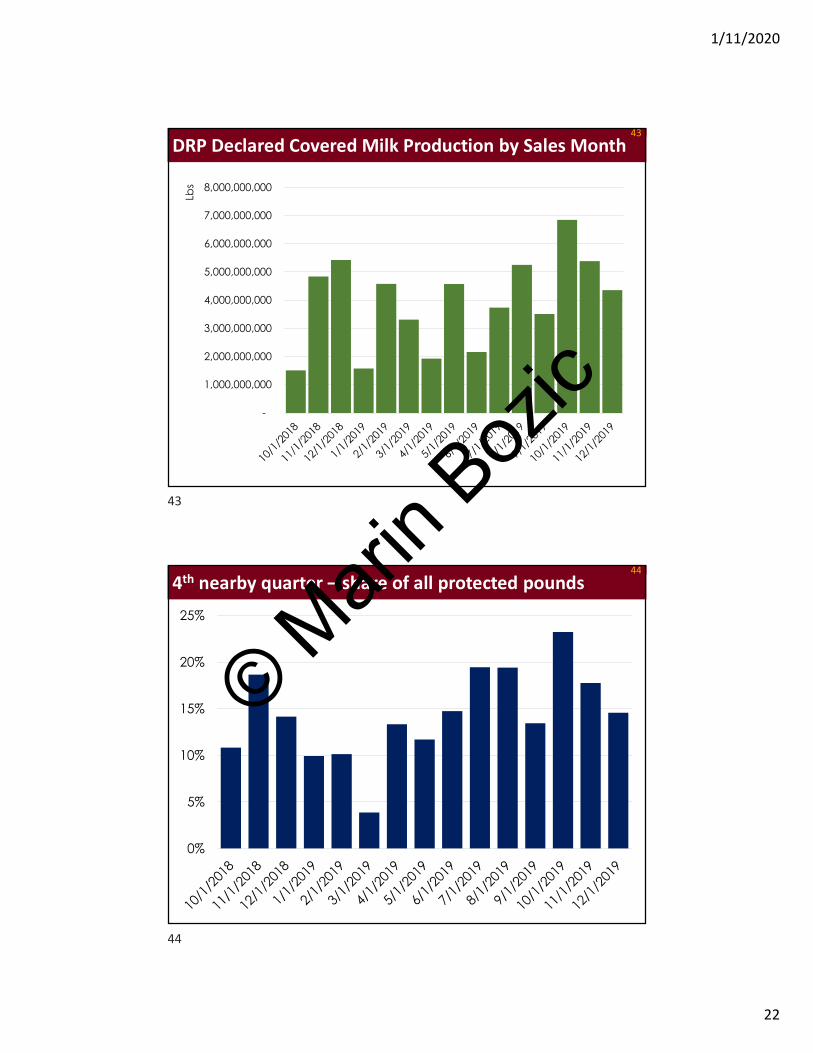
DRP Declared Covered Milk Production by Sales Month43
-
1,000,000,000
2,000,000,000
3,000,000,000
4,000,000,000
5,000,000,000
6,000,000,000
7,000,000,000
8,000,000,000Lb
s
4th nearby quarter – share of all protected pounds44
0%
5%
10%
15%
20%
25%
43
44
© Mari
n Boz
ic
1/11/2020
23
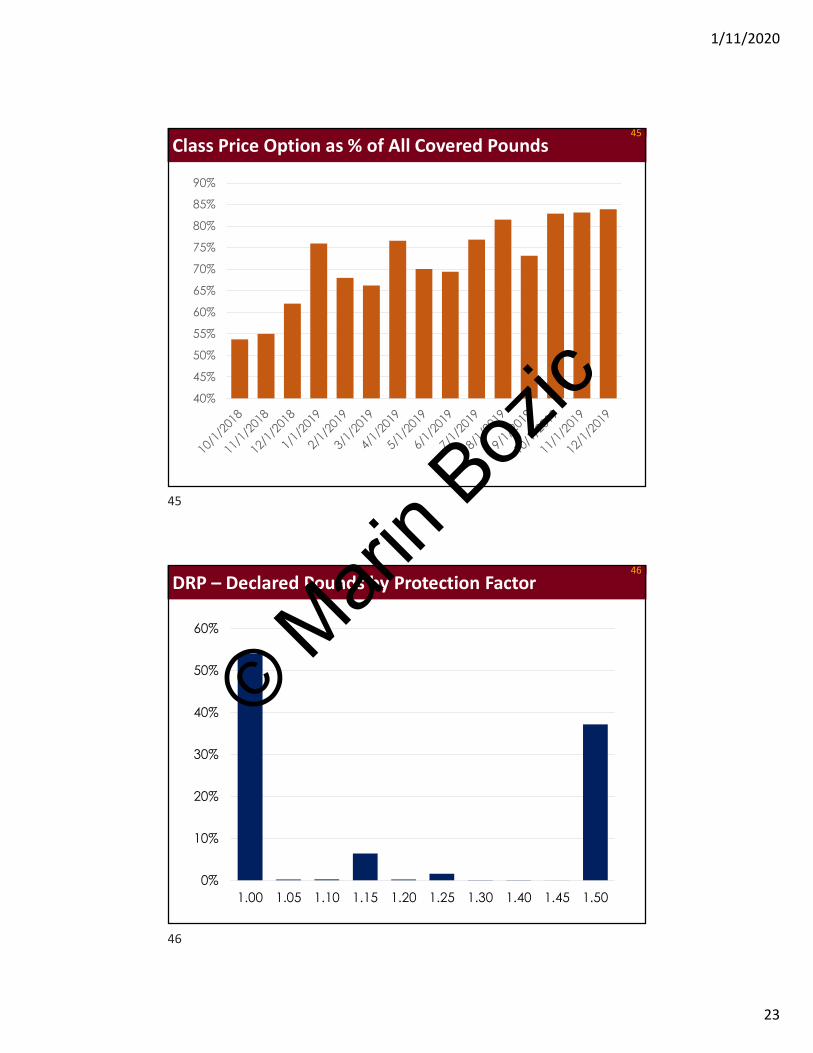
Class Price Option as % of All Covered Pounds45
40%
45%
50%
55%
60%
65%
70%
75%
80%
85%
90%
DRP – Declared Pounds by Protection Factor46
0%
10%
20%
30%
40%
50%
60%
1.00 1.05 1.10 1.15 1.20 1.25 1.30 1.40 1.45 1.50
45
46
© Mari
n Boz
ic
1/11/2020
24
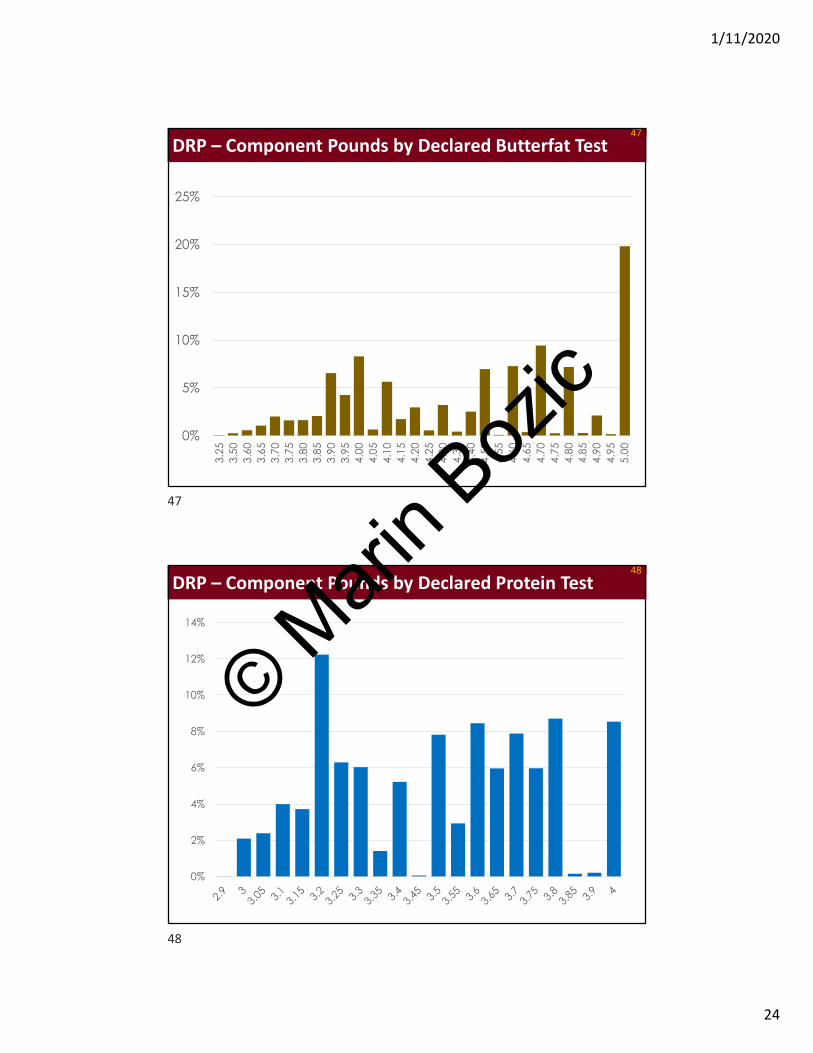
DRP – Component Pounds by Declared Butterfat Test47
0%
5%
10%
15%
20%
25%
3.25
3.50
3.60
3.65
3.70
3.75
3.80
3.85
3.90
3.95
4.00
4.05
4.10
4.15
4.20
4.25
4.30
4.35
4.40
4.50
4.55
4.60
4.65
4.70
4.75
4.80
4.85
4.90
4.95
5.00
DRP – Component Pounds by Declared Protein Test48
0%
2%
4%
6%
8%
10%
12%
14%
47
48
© Mari
n Boz
ic
1/11/2020
25
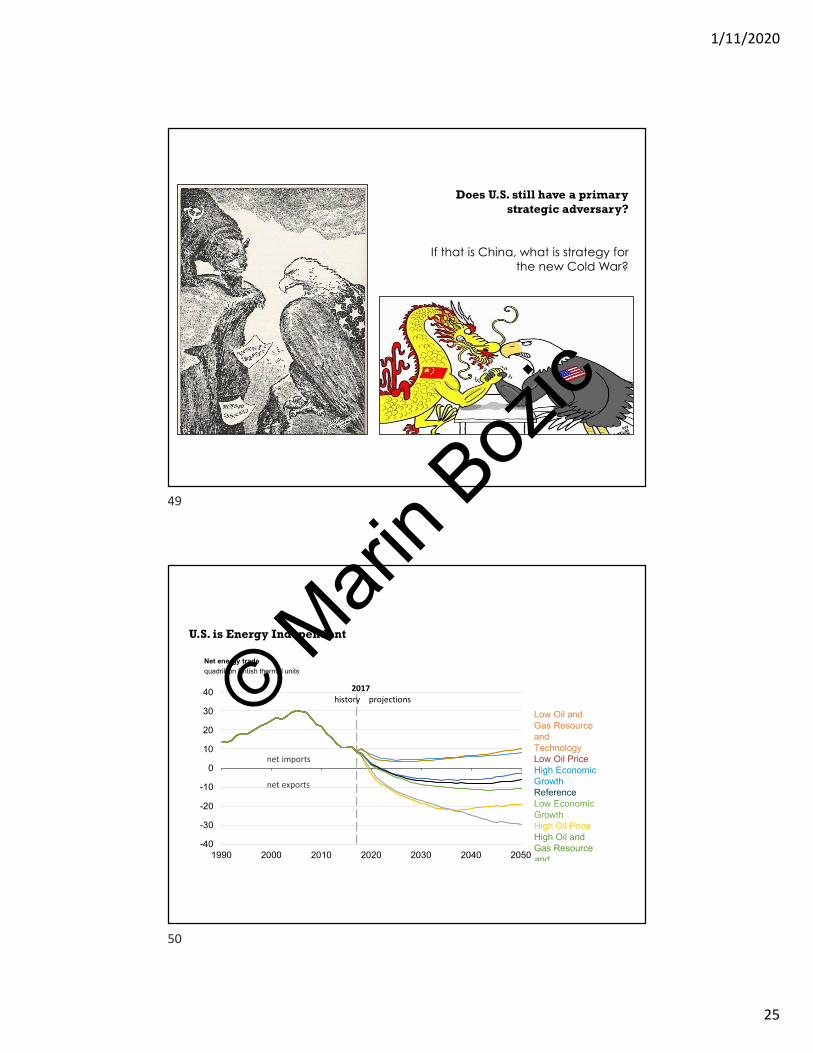
Does U.S. still have a primary strategic adversary?
If that is China, what is strategy for the new Cold War?
Net energy trade
quadrillion British thermal units
-40
-30
-20
-10
0
10
20
30
40
1990 2000 2010 2020 2030 2040 2050
2017history projections
Low Oil and Gas Resource and Technology Low Oil PriceHigh Economic GrowthReference Low Economic GrowthHigh Oil PriceHigh Oil and Gas Resource and
net imports
net exports
U.S. is Energy Independent
49
50
© Mari
n Boz
ic
1/11/2020
26
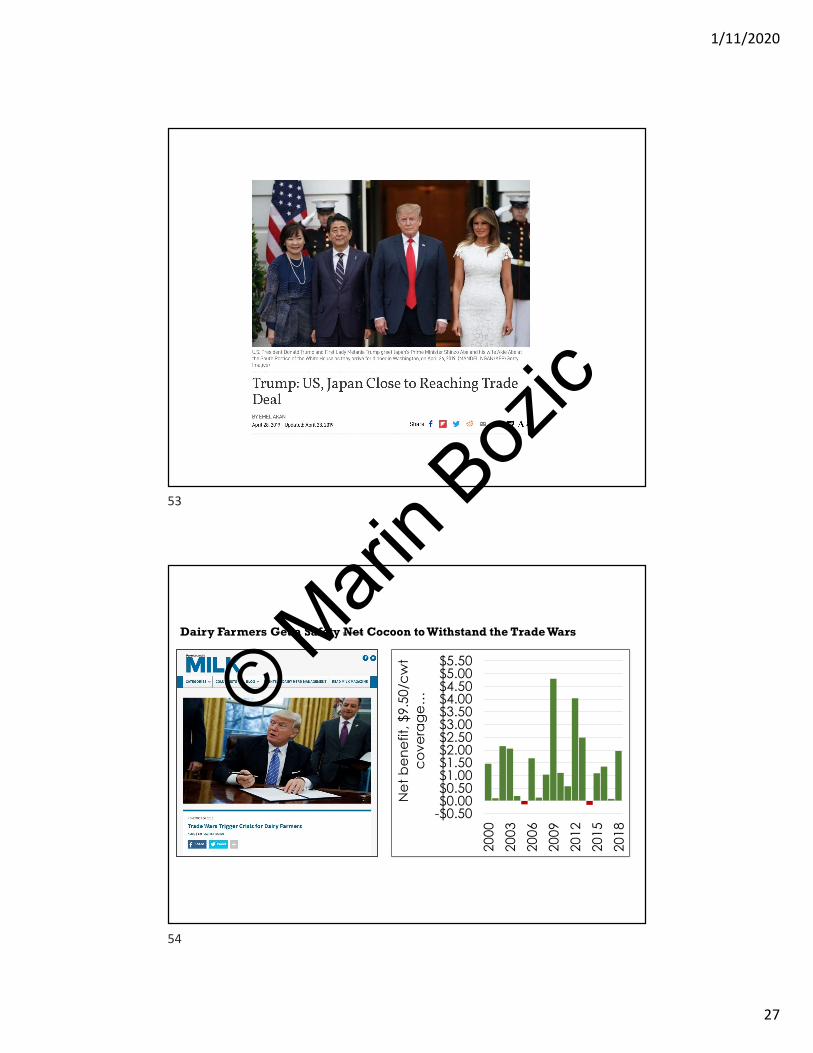
World is graying…
51
52
© Mari
n Boz
ic
1/11/2020
27
-$0.50$0.00$0.50$1.00$1.50$2.00$2.50$3.00$3.50$4.00$4.50$5.00$5.50
2000
2003
2006
2009
2012
2015
2018
Ne
t b
en
efit
, $9.
50/c
wt
co
vera
ge
…
Dairy Farmers Get a Safety Net Cocoon to Withstand the Trade Wars
53
54
© Mari
n Boz
ic
1/11/2020
28
In Conclusion55
• DMC + DRP = the most generous dairy safety net we had in decades
• Dairy safety net reform strongly influenced by the need to protect US agriculture in
• Chaotic period where the world order is being radically reshaped
• Optimal strategy: • Small farms
• use DMC @ $9.50/cwt + overhedge with DRP to cover high cost of production
• Medium-size and large farms:• Use DRP distant contracts + CME for more dynamic
marketing
55
© Mari
n Boz
ic


![UW Presentation v05.ppt - Compatibility Mode · 2018-10-30 · &rqwlqxrxv ,fh &uhdp )uhh]huv l î 7kh 'dlu\ ,qgxvwu\ lq $phulfd 5dosk 6how]hu 0djd]lqhv iru ,qgxvwu\ ,qf sdjh](https://img.pdfslide.net/doc/110x75/5e5bbe2b676246692e6ac789/uw-presentation-v05ppt-compatibility-mode-2018-10-30-rqwlqxrxv-fh-uhdp.jpg)