Embed Size (px)
Citation preview

Identification of Tablets Through their Blister Packaging by Near-infrared Spectroscopy
S. Assi. R. A. Watt and A.C. MoffatThe School of Pharmacy29/39 Brunswick Square, [email protected]
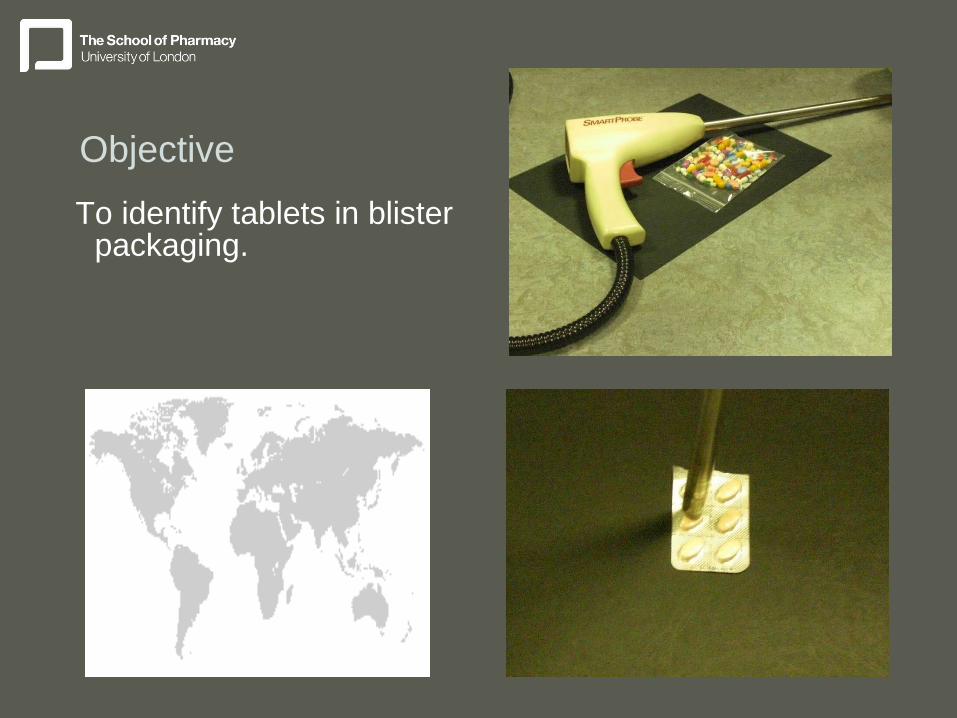
Objective
To identify tablets in blister packaging.
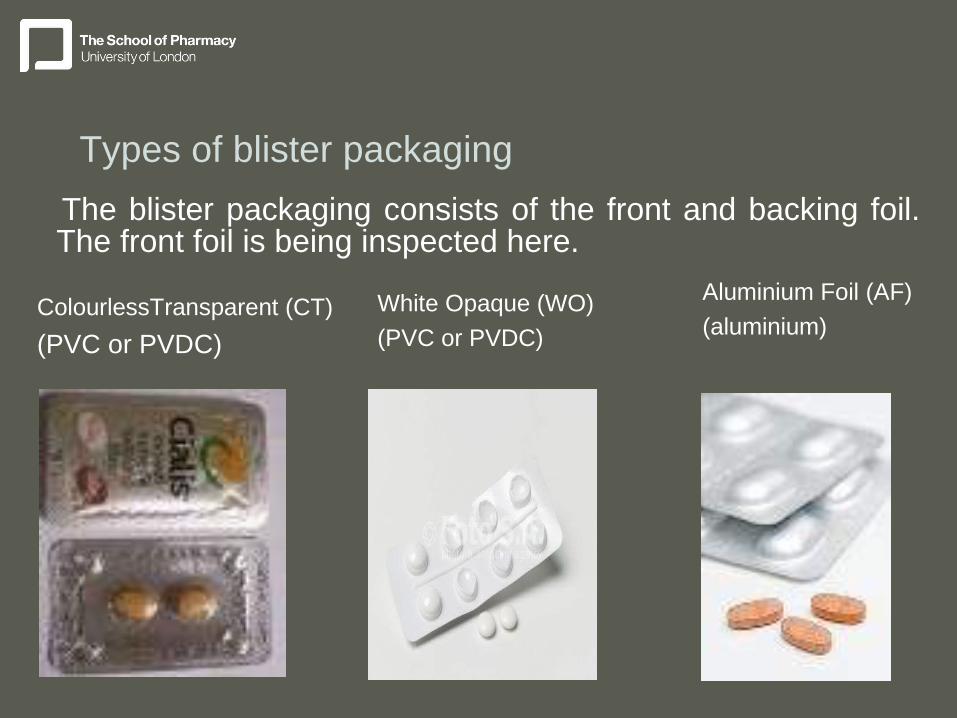
Types of blister packaging
The blister packaging consists of the front and backing foil. The front foil is being inspected here.
ColourlessTransparent (CT)
(PVC or PVDC)
White Opaque (WO)
(PVC or PVDC)
Aluminium Foil (AF)
(aluminium)

Experimental
A total of 20 different products in CT blisters were used.
The spectra were measured using a FOSS 6500 NIR spectrometer equipped with a Smart Probe.
Spectra were processed using SNV-D2 excluding the regions 1666-1796 and 2200-2500 nm and correlation in wavelength space method (CWS) and principal component analysis (PCA) were used.

Results (1): Background Selection
Top left: The Smart Probe measuring the tablet in blister on top of a Spectralon 20% reflectance standard.
Top right: SNV-D2 NIR spectra of Ciproxin tablet alone and in its blister with ceramic reference as a background.
Bottom right: SNV-D2 NIR spectra of Ciproxin tablet alone and in its blister with a reference scan as a blister on top of a Spectralon 20% reference as a background.
r2=0.94
r2=0.98

Results (2):Change of correlation coefficients using different Spectralon reflectance standards 2 to 99 %.

Results(3): Inter-blister packaging variation
Upper right: The position of the tablet was changed inside the blister packaging to see the effect of changing position.
Lower right: The value of the correlation coefficient against the same Ciproxin tablet put in different positions of the blister packaging .

Results (4): Intra-batch and Inter-batch variation
Intra-batch: 10 tablets of the same batch. r2 (minimum)=0.98.
Inter-batch:
8 batches of the same product.
r2 (minimum)=0.94.

Results (5): Discrimination of products
Upper right: SNV-D2 NIR spectra of the 20 products measured.
Lower left: Correlation map of the 20 products measured.
Wrongly matching products: Lipitor, Risperidal,Singulair and Zyprexa.

Results (6) List of excipients in the four wrongly matching products.

PCA score plot of the SNV-D2 NIR spectra of the 4 wrongly matching products.
Results (7): Discrimination of products
Conclusion
The use of an NIRS FOSS 6500 probe using a reference of a closed CT blister packaging on top of a 20 % NIST standard could identify tablets inside CT blisters and discriminate them from substitutes.
The method could identify the 20 products examined by combination of CWS with a threshold of 0.94 and PCA.

Acknowledgement
FOSS NIRSystem for the FOSS 6500 instrument.The School of Pharmacy for the Overseas Student
Research (ORS) Award.Lebanese National Council for Scientific Research for
their Scholarship.