Embed Size (px)
Citation preview

1
The pan-European Distributor
Brammer plc

Agenda• Financials• About Brammer• Growth
– Market Segmentation– Key Accounts– Insites™– Product Range Extension– Strategy
• The Future• Questions
2

3
Half Year Results6m to 30th June 2011• Turnover up £45.2m, up 19.7%. At constant currency,
turnover increased £42.0m (18.8%). There were no acquisitions
• Profit before tax up £4.6m from £9.7m to £14.3m*• New banking facilities for €100m in place to 2016• Interest covered 13.45x (June 2010 8.4x)• Net debt to EBITDA ratio 1.27x (June 2010 1.56x)• Net borrowings compared to H1 2010 is up £0.4m to
£40.6m after absorbing £4.7m adverse currency impact
* before amortisation of acquired intangibles

4
Half Year Results6m to 30th June 2011
• Turnover higher by 19.7%• Profit before tax of £14.3m – up 47%*• Basic eps up from 6.4p* to 10.0p (up 56%)• Dividend: 2.7p per share up from 2.1p (up
28.6%)
* all stated before amortisation of acquired intangibles
5
Working Capital
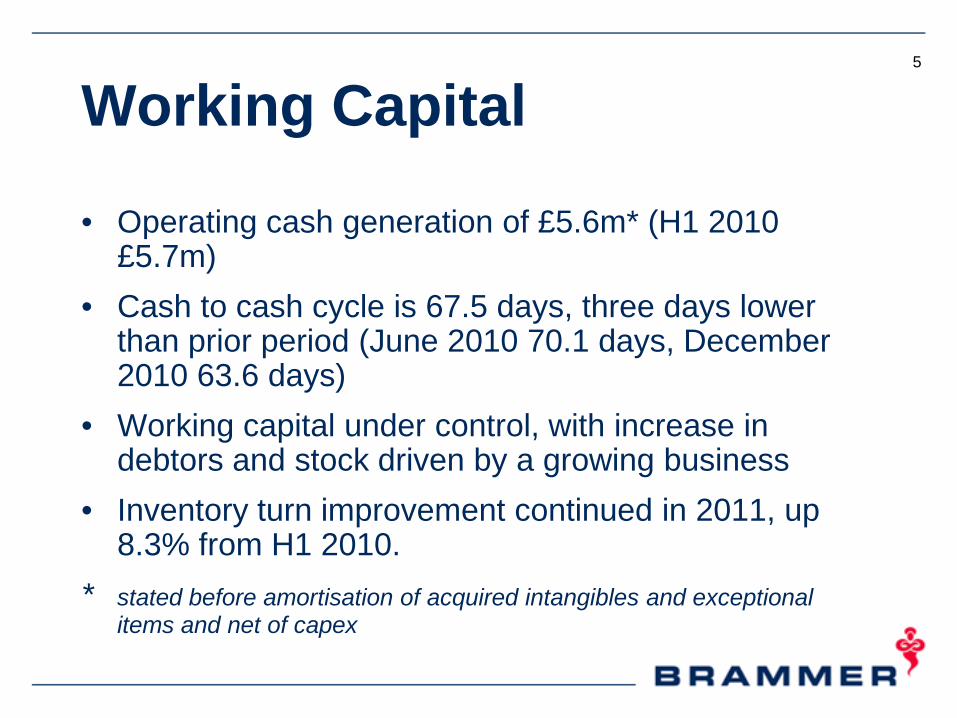
• Operating cash generation of £5.6m* (H1 2010 £5.7m)
• Cash to cash cycle is 67.5 days, three days lower than prior period (June 2010 70.1 days, December 2010 63.6 days)
• Working capital under control, with increase in debtors and stock driven by a growing business
• Inventory turn improvement continued in 2011, up 8.3% from H1 2010.
* stated before amortisation of acquired intangibles and exceptional items and net of capex

6
Half Year Results6m to 30th June 2011

7
Half Year Results6m to 30th June 2011

8
Half Year Results: Ratios6m to 30th June 2011
* Segmental assets including goodwill less liabilities, before current & deferred tax, dividends, cash, loans, deferred consideration & pension liability
** Underlying operating profit as a percentage of operating capital as defined in * but excluding goodwill & acquired intangibles
*** Underlying operating profit as a percentage of operating capital as defined in *

9
Half Year Results:6m to 30th June 2011
£m H12009 2010 2011
Underlying operating profit - as reported* 8.8 11.0 15.4
Excluding effect of Bonus - 2.3 3.8Share option related charges (0.1) - 1.7
Adjusted operating profit 8.7 13.3 20.9
Return on sales (adjusted) 4.0% 5.8% 7.6%
*stated pre amortisation and exceptionals items

10
Cash Flow6m to 30th June 2011

11
Working Capitalat 30th June - Actual Rates

12
Working Capitalat 30th June 2011
Cash to cash cycle

13
Balance Sheetat 30th June – Actual Rates

14
Half Year Results: RatiosSegments: 6m to 30th June 2011
£m UK DE FR ES Blux Eeu Other Fx Total
Turnover 79.6 58.9 42.6 22.4 24.8 28.7 9.0 9.2 275.2
Turnover growth/(decline) (SPWD) 16.5% 21.9% 15.4% 14.4% 14.6% 26.0% 16.1% 18.1%
Underlying operating profit 4.2 3.6 1.9 1.8 1.5 2.0 0.0 0.4 15.4
Return on sales 5.3% 6.1% 4.5% 8.0% 6.0% 7.0% 0.0% 5.6%
Return on sales H1 2010 4.2% 5.2% 4.2% 7.5% 5.0% 5.2% 1.2% 4.8%
Capital employed * 15.1 15.2 9.1 5.0 11.4 16.7 12.6 5.3 90.4
Return on capital employed 55.6% 47.4% 41.8% 72.0% 26.3% 24.0% 0.0% 34.2%
Return on capital employed H1 2010
40.0% 31.9% 36.0% 65.2% 19.5% 15.2% 1.8% 27.8%
* Segmental assets excluding goodwill and acquired intangibles less liabilities, before exceptional provisions, current & deferred tax, dividends, cash, loans, deferred consideration & pension liability

15
Exchange Rates
Jun-11 Dec-10 Jun-10
Average € 1.146 € 1.165 € 1.153
Closing € 1.107 € 1.167 € 1.221

16
Brammer plc
2011

17
Brammer plc
The European Leader in Mechanical MRO Supplies
and Services

Agenda• Financials
• About Brammer• Growth
– Market Segmentation– Key Accounts– Insites™– Product Range Extension– Strategy
• The Future• Questions
18

About Brammer• European market leader – <3%
market share
• Focused product range in mechanical MRO components - a €25 billion market• Bearings• Mechanical Power Transmission• Fluid Power• Tools and General Maintenance• Added value services
19

About Brammer• Leading the process of consolidation
in a highly fragmented market
• Diverse customer base of over 100,000 customers
• Customer risk is low
• Top 10 customers in any one country typically account for less than 10% of sales
• Largest European customer of our main strategic suppliers
20

• 2,559 people
About Brammer21

• 2,559 people• Over 300 locations
About Brammer22

• 2,559 people• Over 300 locations• In 15 countries
across Europe
About Brammer23

• 2,559 people• Over 300 locations• In 15 countries
across Europe• With over 4,300,000
products from the world’s leading suppliers
About Brammer24

• 2,559 people• Over 300 locations• In 15 countries
across Europe• With over 4,300,000
products from the world’s leading suppliers
• Working in your industry
About Brammer25

Brammer – Our Strategy
Growth Capability Costs SynergiesCountry organic growth
People Development
Supplier Rationalisation
Business Best Practice
Key Accounts Business Skills Development European Buying Systems
Integration
Insites
Distributed Learning Programme Development
IT and Other Cost Reductions
Brand Development
Product range extension
Internal Communications and Involvement
Capital Employed Management
Supplier Relationship Management
Geographical development
26

Growth ObjectiveThe Market Opportunity
Bearings2.0bn
Seals0.5bn
MPT 5.0bn
Tools and Gen. Maintenance
10.0bn
Fluid Power10.0bn
27
28
Growth
Market Segmentation

Market SegmentationCurrent Segments
• Food & Drink• Pulp, Paper & Packaging• Construction & Aggregates• Utilities• Recycling• Automotive• Refining• Metals
29

Market Segmentation• H1 2011 continued focus on
implementing material over the last 7 years
• Training programme developed including online and face-to-face learning
• Building on success
• Customer testimonials leading to segment leadership
30

Market Segmentation• Sales to targeted segments have
continued to deliver strong growth
• Food & Drink grew by £8.8 million, or 35.9%, to £33.3 million
– UK up by 60.3% to £15.1 million– DE up by 29.4% to £2.6 million– NL up by 57.8% to £1 million– ES up by 21.2% to £3.6 million
• Automotive grew by 46.2% to £24.7 million
• Metals grew by 33.6% to £33.4 million
31

32
Growth
Key Accounts

33
Key Accounts Sales Performance 2011
YTD June 2011 Total
Multi-Site Status Scope Year variance TotalYTD 2010 € Value 32.580.107YTD 2011 € Value 43.729.003
YTD 2010 € Value 36.757.092YTD 2011 € Value 42.726.367
YTD 2010 € Value 9.050.058YTD 2011 € Value 11.538.562
YTD 2010 € Value 20.158.715YTD 2011 € Value 24.373.326
YTD Total 2010 € Value 98.545.972YTD Total 2011 € Value 122.367.258
Tier 4
Tier 3
Tier 2
Tier 1
National ContractNational Group
No Contract Part EU Group
EU Contract 34,2%Part EU Group
16,2%
20,9%
27,5%
24,2%
National Contract Part EU Group
Brammer

Key Accounts• 6 new contracts won
– Beckton & Dickinson– Delphi– Georgia-Pacific– Johnson Controls– Rockwool– Whirlpool
• 24.2% growth overall • 2,279 documented customer cost savings
yielding €23m (£19.2m) for our customers• “turbo boost” contract implementation to
achieve Brammer guaranteed savings a continuing theme
34
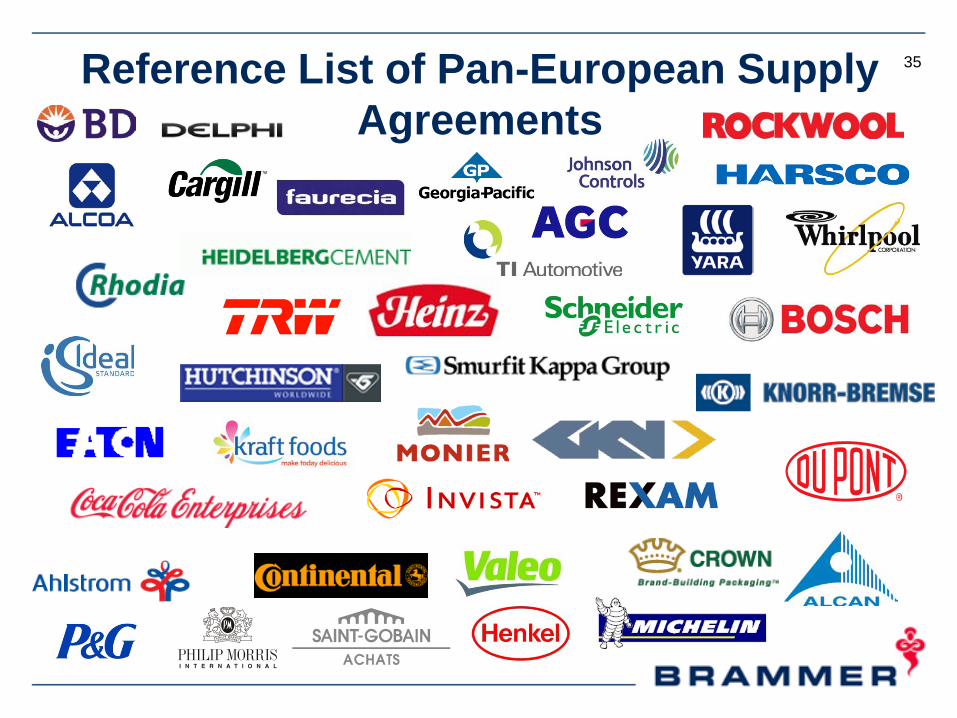
Reference List of Pan-European Supply Agreements
35

Key Accounts
• New Key Account Toolkit implemented– Latest best practice gathered
to update toolkit– Processes and tools defined
in a procedures manual -mandatory approach developed
36

Key Accounts– Particular emphasis on those
tools and processes which will accelerate contract implementation – “turbo boosting”
– Regular review and consistent approach across Europe
37

Key Accounts• Continued focus on key sectors
of expertise
– Food & Drink up 20.3% to €30.3 million
– Automotive up 42.7% to €21 million
– FMCG up 46% to €4.7 million– Chemical up 7.6% to €3.6 million– Packaging up 29.1% to €6.6
million
38

39
Growth
Insites™

What is an Insite™?Definition• A self contained Brammer
office on a customer’s site• Provided by the customer• With a direct link to the
Brammer ERP systems and stock
• With agreed menu of services
40

Definition of Insites™ Full Time• One or more BRAMMER
personnel working within their own clearly established workspaces
• Minimum of 4 hours a day, 5 days a week
• Services provided can be a combination of:
– Creation of stock profile– Purchasing management– Technical advice– Sales visits– Delivery services
41

Definition of Insites™ Part time• One or more BRAMMER
personnel working within their own clearly established workspaces
• Minimum of 3 hours a day, 2 days a week
• Services provided can be a combination of:
– Any of the activities offered by a full-time Insite– Creation of stock profile– Purchasing management– Technical advice– Sales visits– Delivery services
42

Insites™
• Insite™ Development– 22 new Insites™ (11 FT/11 PT)
16 Full-Time53 Part-Time(47 closed due to factory closures)
– 244 Insites™ across the Group94 Full-Time150 Part-Time
– Increase of 28.4% to £43.2 million
43

44
Growth
Product Range Extension

BearingsLinear MotionSealsBelts and PulleysChains and SprocketsHealth and SafetyTools and MaintenanceGearboxesMotorsFluid Power
Mechanical Power Transmission –Chains & Sprockets
Seals
Tools &Maintenance
Product Range ExtensionHealth andSafety
Gearboxes
Linear Motion -Industrial AutomationMotors
BearingsFluid Power
Mechanical Power Transmission -Belts & Pulleys
45

Product Range Extension• New product range introduction
continues on the continent
• At constant rates Bearings are up 16.5%, Non-bearings are up 20%
• Continued focus on Fluid Power and Tools & Maintenance throughout continental Europe
• New European Product Group Manager – Fluid Power
• New European Product Group Manager - Tools & Maintenance
46

Product Range Extension• Catalogue supporting Tools and General
Maintenance and Fluid Power launched in France, Spain, Germany & Austria
– Mechanical Power Transmission up 12.1% to £37.1 million
– Fluid Power up 24.8% to £44.6 million
– Tools & General Maintenance up 28.3% to £17.6 million
• Huge opportunity for further growth through cross-selling
– 0.7% market share in Tools and General Maintenance
– 1% share in Fluid Power compared with 10% share in Bearings.
47

Product range Extension• Cross-selling continuing
to benefit base business
• Overall first half growth of 19.7%
– 24.2% in Key Accounts– 15.6% growth in base
business
48

Product Range Extension• Base business growth
of 15.6% driven by
– 21.2% growth in Fluid Power
– 22.1% growth in Tools & General Maintenance
– 25.2% growth in Fasteners and Standard Parts
49

50
Growth
Strategy

The results of our Growth Strategy
Sales per Working Day - Growth
% 2007 2008 Q1-09 Q2-09 Q3-09 Q4-09 Q1-10 Q2-10 Q3-10 Q4-10 Q1-11 Q2-11 YTD-11
UK 12.5% 8.3% 3.4% -1.8% -3.6% 0.9% 5.4% 6.1% 11.7% 9.0% 15.6% 17.4% 16.5%
Germany 17.4% 8.1% -22.9% -37.9% -35.1% -26.3% -6.5% 18.1% 24.5% 22.7% 22.8% 21.1% 21.9%
France 8.6% 9.4% -14.7% -21.8% -15.8% -4.9% 4.1% 14.9% 13.2% 12.7% 12.8% 18.0% 15.4%
Spain 6.7% 8.3% -24.7% -24.7% -26.9% -10.8% 0.3% 14.0% 9.4% 15.1% 14.6% 14.2% 14.4%
Netherlands 18.5% 11.4% -12.8% -23.2% -13.8% -16.1% 3.5% 13.8% 8.5% 15.7% 16.9% 19.5% 18.2%
Poland - - 9.3% 0.7% 7.5% -0.7% -1.2% 27.7% 24.9% 27.4% 32.9% 17.8% 24.6%
Total 20.3% 12.0% -10.8% -21.7% -19.8% -11.4% -0.1% 14.3% 18.0% 15.7% 17.8% 18.3% 18.1%
51

Acquired Businesses
• No new businesses acquired in 2011• Selective bolt-ons being considered• No new territories planned at this stage• We would look to fund acquisitive
growth by free cash flow
52
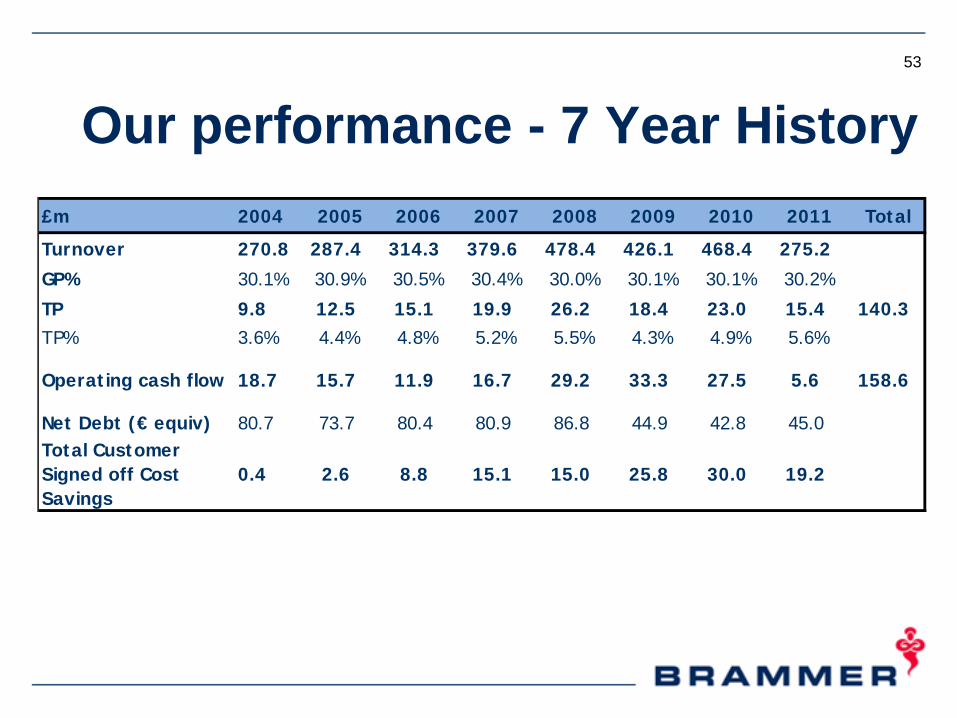
Our performance - 7 Year History
£m 2004 2005 2006 2007 2008 2009 2010 2011 Total
Turnover 270.8 287.4 314.3 379.6 478.4 426.1 468.4 275.2
GP% 30.1% 30.9% 30.5% 30.4% 30.0% 30.1% 30.1% 30.2%
TP 9.8 12.5 15.1 19.9 26.2 18.4 23.0 15.4 140.3TP% 3.6% 4.4% 4.8% 5.2% 5.5% 4.3% 4.9% 5.6%
Operating cash flow 18.7 15.7 11.9 16.7 29.2 33.3 27.5 5.6 158.6
Net Debt (€ equiv) 80.7 73.7 80.4 80.9 86.8 44.9 42.8 45.0Total Customer Signed off Cost Savings
0.4 2.6 8.8 15.1 15.0 25.8 30.0 19.2
53

SPWD Overview
25 consecutive months of growth
54

55
Growth
The Future

The Future• 25 months of sequential growth
• Market share gains evident, driven by Key Accounts, Insites™, and Product Range Extension
• June YTD sales up 19.7%. Good growth continues in July
• Gross margins holding steady (for 8th year)
56

The Future
• Good cash flow, driven by continued improved working capital ratios
• Bank facilities secure through to 2016
• Significant reduction in cost base maintained
57

The Future
• Continued improvement in working capital management, particularly inventory
• Providing the ability to take advantage of growth opportunities
• To drive further consolidation in a fragmented market
58

59
2011
Brammer plc

Visit us online: www.brammer.biz
60