Embed Size (px)
Citation preview

C H A P T E R
9-1WAN and Application Optimization Solution Guide
9Branch Design Considerations
In today’s global economy, companies are rapidly expanding their presence throughout the world. As they grow, so do their networks. Their branch offices must have effective and reliable network connectivity to their corporate HQs (and between branch offices) in support of business applications. For any branch network, the designer must consider the following key requirements:
• Resiliency
• Security
• Network and application performance
• Load sharing
This chapter considers different technologies that can address these requirements, and introduces sample branch designs.
9.1 Resiliency/High AvailabilityProviding uninterrupted network connectivity between branches and headquarters, and among branches, is critical to any network design. It is essential to avoid single points of failure.
The cost of business interruption caused by network failure, the probability of component or network device failure, and other factors must be carefully analyzed. Designers should consider the cost-benefit ratio of resiliency and plan for appropriate resiliency. In very small branch offices, the cost of providing resiliency may not provide adequate cost benefits.
9.2 SecuritySecurity is a critical factor in any network design. Typically, data transfer between branches and corporate headquarters happens over a service provider (SP) network or over the Internet. Data that traverses the Internet is highly susceptible to snooping.
To protect against snooping and provide business confidentiality, some form of data encryption should be deployed. Additionally, many government regulations, such as Health Insurance Portability and Accountability Act (HIPAA) and Sarbanes-Oxley (SOX) mandate securing traffic.

9-2WAN and Application Optimization Solution Guide
Chapter 9 Branch Design ConsiderationsNetwork and Application Performance
9.3 Network and Application PerformanceAs global businesses evolve, some deploy more and more business critical applications that can provide split-second decisions. Network performance is a key consideration for such applications, which need fast connectivity and bandwidth.
9.4 Load SharingA good branch design also provides resources for scaling and growth. Load sharing can provide both improved availability and scalability to the network. In a branch network, load sharing can be implemented by having multiple WAN exit routers to share the load. In addition, branch routers can have multiple exit interfaces connected to the WAN for load sharing. These methods can improve both availability and scaling.
9.5 Common Branch TopologiesAlthough in many cases a branch might have overlapping features from the following profiles, a typical branch with WAN optimization can be categorized into one of the most widely deployed topologies.
9.5.1 Single Tier BranchesThese branches typically have one branch router with a WAE (either internal or external) for optimizing traffic. This router typically has an inbuilt switching module so that multiple same subnet end hosts and IP phones can be connected without requiring an external switch.
In a typical small-enterprise/SOHO deployment, the branch routers are usually single-homed, as shown in Figure 9-1 (a). In small enterprise branches with few users, shown in Figure 9-1 (b), the branch router is often dual-homed to two SPs (or to the same SP), providing resiliency for the WAN connection. A variation of this design, shown in Figure 9-1 (c), adds another WAE to add WAE resiliency. The second WAE can be used to share bandwidth and application optimization loads.

9-3WAN and Application Optimization Solution Guide
Chapter 9 Branch Design ConsiderationsCommon Branch Topologies
Figure 9-1 SOHO and Single Tier Branches
9.5.2 Dual Tier BranchesDual tier branches employ multiple (usually two) branch routers and an external Ethernet bridge providing connectivity to the two routers. Typically, both routers are homed to different SPs to provide more resilient WAN connectivity.
A router dual homed to WAN, or a dual branch router design enables efficient link utilization with load sharing, but can also increase the possibility of asymmetric routing and associated challenges. Asymmetric routing is explained in the following section.
The routers can share one WAE for optimization, as shown in Figure 9-2 (a). Alternatively, the routers can use multiple WAEs in a load-shared and redundant manner as shown in The routers can share one WAE for optimization, as shown in Figure 9-2 (b). WCCP can locally correct asymmetry issues and keep optimized session on a consistent WAE.
Single Homed SOHO Branch Dual Homed Single TierBranch with one WAE
Dual Homed Single TierBranch with two WAEs
SP-WAN
Branchrouter/switch
WAE
Clients
A
SP1-WAN SP2-WAN SP1-WAN SP2-WAN
Branchrouter/switch
WAE
Clients
B
Branchrouter/switch
WAE
WAE
Clients
C
1876
07

9-4WAN and Application Optimization Solution Guide
Chapter 9 Branch Design ConsiderationsCommon Branch Topologies
Figure 9-2 Dual Tier Branches
9.5.3 Asymmetric RoutingIn hop-by-hop packet routing systems (the vast majority of IP routing systems), each router independently selects the outgoing path. While routing protocols ensure that loops are avoided, the symmetry of bidirectional traffic flows cannot be guaranteed when destination prefixes are reachable by multiple paths.
Asymmetric routing occurs when traffic does not traverse the same path in both directions of a conversation. A branch site that has multiple WAN connections, with either a single router or multiple routers, is always prone to asymmetric routing. This can occur because the routing protocol on each end selects a different path, by load or session balancing, or even by path optimization mechanisms.
Consider a simple branch network with one router dual-homed to the WAN, as shown in Figure 9-3, with a bidirectional traffic session between a client on the branch LAN and a headquarters server. As Figure 9-3 shows, traffic from the branch to headquarters can exit through one WAN link on the branch router (in this case, Link l). However, the server-side routers calculated the best path for the client network to be over the WAN2 link. This is the asymmetric routing case: server-sourced traffic arrives on Link 2 of the branch router.
Dual Homed Dual tier brancheswtih one WAE
Dual Homed Dual tier brancheswtih two WAEs
WAE
Clients
A
SP1-WAN SP2-WAN
1876
08
BR1 BR2
WAE
WAE
Clients
B
SP1-WAN SP2-WAN
BR1 BR2

9-5WAN and Application Optimization Solution Guide
Chapter 9 Branch Design ConsiderationsCommon Branch Topologies
Figure 9-3 Asymmetric Routing
Without proper design and placement of network services, asymmetric routing can create challenges in networks. For example, asymmetric routing results in suboptimal TCP performance; TCP assumes that the SYN from one end and the ACK from other end traverse the same path. Because data does not traverse the same physical path in both directions, suboptimal TCP performance results.
If state is built into network services for transiting traffic, full flow information might not be available to a network device. Network services that need to act on (or simply see) both directions of a conversation include firewalls, NAT devices, and stateful identification in some applications. Some monitoring tools also rely on bidirectional traffic flows.
Such tools have potential issues when traffic exits through one router and ingresses through the other. Challenges caused by asymmetric routing in a network with a multi-homed single router are a little easier to mitigate than designs where two routers are being used, because conversation state for both directions still transits the same router in the single router case.
Clients ServersWAN 1
WAN 2
Traffic from Brancjh client to HQ server
Traffic from HQ client to Branch server 1876
09

9-6WAN and Application Optimization Solution Guide
Chapter 9 Branch Design ConsiderationsCommon Branch Topologies
9.5.4 Branch LAN-Side High Availability When using two branch routers, Gateway Load Balancing Protocol (GLBP), Hot Standby Routing Protocol (HSRP), or Virtual Router Redundancy Protocol (VRRP) can be configured on the LAN interfaces of the routers to provide high availability for the default gateway of an end host. Table 9-1 lists the advantages of HSRP and GLBP.
9.5.5 Branch WAN-Side High AvailabilityTo ensure business continuity, it is essential to provide high availability on the WAN side. Therefore, branch routers are typically dual-homed to the SP network on the WAN side. In such cases, one path serves as the primary path, and the other is a secondary or backup path.
In other words, traffic normally takes the primary path. If the primary path fails, traffic can move to the secondary path. Routing protocols deployed over the WAN network provide reachability information that enables the branch routers to decide on the path to be taken.
However, when a path fails, it takes some time for routing protocols to converge and point to the alternate path, causing packet loss. Although routing protocol timers can be tweaked to alleviate some of these effects, this is not always fully effective. Additionally, some types of failures (brownouts, black holes, path congestion, and so on) are not captured by the routing protocol reachability information. Performance Routing (PfR), detailed in 9.6.4 Path Optimization Using PfR, can be deployed to provide faster, efficient, more granular optimization per application path.
Table 9-1 HSRP and GLBP Advantages
RoutingProtocol Advantages
HSRP Higher availability: Enhanced redundancy can eliminate single point of failure of the first-hop gateway. Enhanced object-tracking can be used with HSRP/GLBP to help ensure the redundant implementation mirrors network capabilities. Enhanced object tracking enables multiple technologies such as HSRP, GLBP, and Virtual Router Redundancy Protocol (VRRP) to track the same object and each take different actions.
Simpler access-layer design: More efficient use if resources is possible without configuring additional VLANs and subnets.
GLBP Automatic load balancing: Off-net traffic is shared among available gateways on a per-host basis, according to the defined load-balancing algorithm.
Lower administration costs: Because all hosts on a subnet can use a common default gateway while load balancing is still achieved, administering multiple groups and gateways is unnecessary.
Efficient use of network resources: Multiple paths upstream from the gateways can be used simultaneously.

9-7WAN and Application Optimization Solution Guide
Chapter 9 Branch Design ConsiderationsOptimization Tools
Figure 9-4 depicts a typical GLBP/HSRP implementation on the LAN side and dual homing on the WAN side on branch networks.
Figure 9-4 Typical Branch LAN/WAN High Availability
9.6 Optimization ToolsThis section describes the major tools used in the Cisco WAN and application optimization solution:
• NBAR
• QoS
• NetFlow
• PfR
• Web Cache Communication Protocol (WCCP) and WAEs
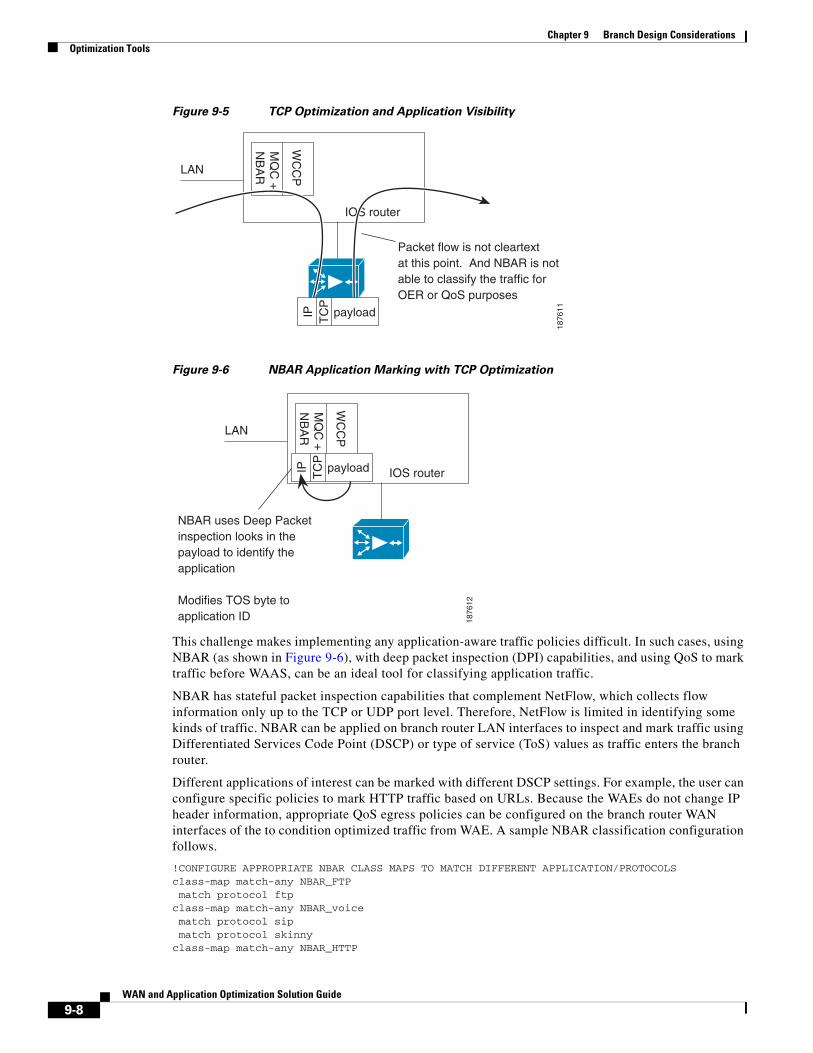
9.6.1 Application Visibility Using NBARTo use WAN bandwidth efficiently, the user should be able to implement appropriate application-aware traffic policies. When using WAEs for TCP optimization, the user faces challenges; for example, L5 through L7 details are no longer visible after packets are optimized (especially with compression). This is shown in Figure 9-5.
Clients WAN
WAN
1876
10
HSRP/GLBP
HSRP/GLBP
WAE WAE
9-8WAN and Application Optimization Solution Guide
Chapter 9 Branch Design ConsiderationsOptimization Tools
Figure 9-5 TCP Optimization and Application Visibility
Figure 9-6 NBAR Application Marking with TCP Optimization
This challenge makes implementing any application-aware traffic policies difficult. In such cases, using NBAR (as shown in Figure 9-6), with deep packet inspection (DPI) capabilities, and using QoS to mark traffic before WAAS, can be an ideal tool for classifying application traffic.
NBAR has stateful packet inspection capabilities that complement NetFlow, which collects flow information only up to the TCP or UDP port level. Therefore, NetFlow is limited in identifying some kinds of traffic. NBAR can be applied on branch router LAN interfaces to inspect and mark traffic using Differentiated Services Code Point (DSCP) or type of service (ToS) values as traffic enters the branch router.
Different applications of interest can be marked with different DSCP settings. For example, the user can configure specific policies to mark HTTP traffic based on URLs. Because the WAEs do not change IP header information, appropriate QoS egress policies can be configured on the branch router WAN interfaces of the to condition optimized traffic from WAE. A sample NBAR classification configuration follows.
!CONFIGURE APPROPRIATE NBAR CLASS MAPS TO MATCH DIFFERENT APPLICATION/PROTOCOLS class-map match-any NBAR_FTP match protocol ftpclass-map match-any NBAR_voice match protocol sip match protocol skinnyclass-map match-any NBAR_HTTP
WC
CP
MQ
C +
NB
AR
IOS router
LAN
Packet flow is not cleartextat this point. And NBAR is notable to classify the traffic forOER or QoS purposes
IP TC
Ppayload
1876
11
WC
CP
MQ
C +
NB
AR
IOS router
LAN
NBAR uses Deep Packetinspection looks in the payload to identify theapplication
Modifies TOS byte to application ID
IP TC
P
payload18
7612

9-9WAN and Application Optimization Solution Guide
Chapter 9 Branch Design ConsiderationsOptimization Tools
match protocol secure-http match protocol http url "*cisco.htm*" match protocol http url "*ba_HN.jpg*"
9.6.2 Congestion Management Using QoSCongestion management using QoS can play a key role in regulating WAN traffic. In a branch, WAN traffic might comprise real-time traffic, Web traffic, and other application traffic. Each traffic patterns requires different handling for delay, packet loss, and so on. For example, real-time traffic such as voice requires low latency and jitter, and appropriate low latency queues should be configured to provide priority for this traffic.
Other traffic types, such as TCP traffic, can have huge packet sizes that can delay other queued traffic, especially on slow links, such as T1. These traffic types require configuration with some link efficiency mechanism, such as fragmentation interleaving, to help minimize the effect. Even with optimization by WAE, congestion can occur and the user must configure appropriate QoS mechanisms to help ensure that different traffic classes are guaranteed appropriate bandwidth.
Similarly, traffic to and from the WAE can be prioritized. If necessary, traffic policing and shaping can be applied on the WAN/LAN interfaces to ensure adherence to traffic limits. For more information, refer to Enterprise QoS Solution Reference Network Design Guide:
http://www.cisco.com/en/US/docs/solutions/Enterprise/WAN_and_MAN/QoS_SRND/QoS-SRND-Book.html
9.6.3 NetFlowNetFlow supports accounting of IP flows traversing and terminating on the router. This data can be exported to a NetFlow collector and analyzer, which can generate reports, ranging from departmental usage and capacity planning to understanding, which applications are running on the network. NetFlow can also support early detection of security threats, such as denial of service (DoS) attacks. On the router itself, the NetFlow data can be a powerful troubleshooting tool.
Figure 9-7 illustrates some charting examples from a specific product (NetQoS ReporterAnalyzer). This product is described in more detail in 9.3 Network and Application Performance.
Seven unique fields (called key fields) identify a NetFlow flow: router source interface, source IP address, destination IP address, type of service (ToS) byte, IP protocol, L4 source port, and L4 destination port.
Additional fields are collected, such as destination interface (where the flow was forwarded), bytes sent, and number of packets sent. Because the deepest flow accounting is based on the L4 ports (in TCP, the source and destination ports), in certain cases it is impossible to identify the end application in use.
To address this problem in many cases, identify an L4 port range and IP addresses to help in identify the application. For example, voice traffic might use UDP port numbers between 16384 and 32767, and IP phones might be restricted to a certain IP address range. The identification data can be represented in the NetFlow collector, which can then use this information to name the application “voice.”

9-10WAN and Application Optimization Solution Guide
Chapter 9 Branch Design ConsiderationsOptimization Tools
Figure 9-7 NetQoS NetFlow Analysis
Figure 9-8 shows these technologies and where they are applied.
Figure 9-8 NetFlow, NBAR, QoS at a Branch Router
9.6.4 Path Optimization Using PfRIn any WAN design, the challenge is to provide application-specific bandwidth and resiliency while making efficient use of WAN bandwidth. While resiliency and some load sharing of WAN links can be ensured with routing protocols, traditional routing protocols do not provide best path selection based on link utilization or many of the other path characteristics. Therefore, the branch network might not be able to respond to dynamic network emergencies like intermittent congestion or a link failure upstream that does not cause a routing protocol transition. Even if the routing protocol does respond, it might take quite some time for the network to re-converge. In such cases, Cisco PfR can be used to respond to such failures dynamically.
WAN
WAN
2712
29
QOSNBAR
Netflow
QOSNetflow
QOSNetflow
BranchRouter
BranchSwtich
9-11WAN and Application Optimization Solution Guide
Chapter 9 Branch Design ConsiderationsOptimization Tools
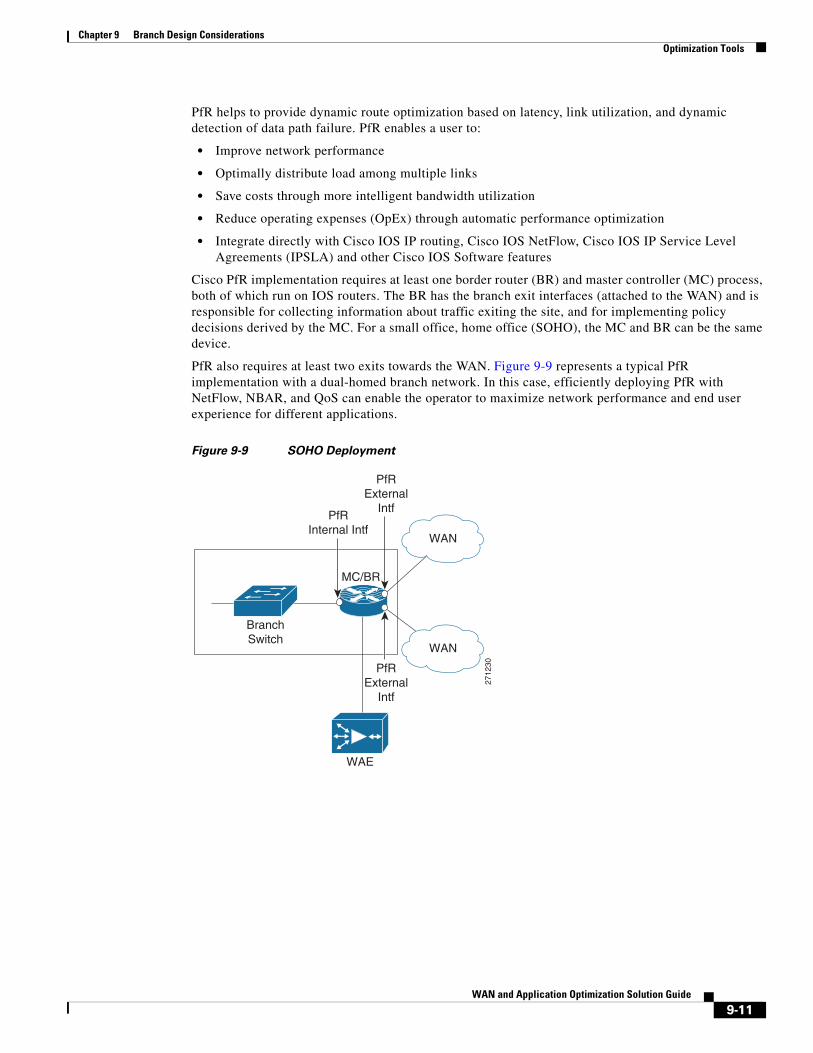
PfR helps to provide dynamic route optimization based on latency, link utilization, and dynamic detection of data path failure. PfR enables a user to:
• Improve network performance
• Optimally distribute load among multiple links
• Save costs through more intelligent bandwidth utilization
• Reduce operating expenses (OpEx) through automatic performance optimization
• Integrate directly with Cisco IOS IP routing, Cisco IOS NetFlow, Cisco IOS IP Service Level Agreements (IPSLA) and other Cisco IOS Software features
Cisco PfR implementation requires at least one border router (BR) and master controller (MC) process, both of which run on IOS routers. The BR has the branch exit interfaces (attached to the WAN) and is responsible for collecting information about traffic exiting the site, and for implementing policy decisions derived by the MC. For a small office, home office (SOHO), the MC and BR can be the same device.
PfR also requires at least two exits towards the WAN. Figure 9-9 represents a typical PfR implementation with a dual-homed branch network. In this case, efficiently deploying PfR with NetFlow, NBAR, and QoS can enable the operator to maximize network performance and end user experience for different applications.
Figure 9-9 SOHO Deployment
WAN
WAN
2712
30PfRExternal
Intf
PfRExternal
IntfPfR
Internal Intf
MC/BR
BranchSwitch
WAE

9-12WAN and Application Optimization Solution Guide
Chapter 9 Branch Design ConsiderationsHow PfR Works
However, most deployments have two BRs and one MC. Note that Cisco Express Forwarding (CEF) must be enabled on PfR routers. Figure 9-10 depicts such a deployment.
Figure 9-10 PfR Deployment with dual Branch Routers
9.7 How PfR WorksThe BR on a PfR-enabled network monitors the performance of the traffic going out to the WAN and relays this information to the MC. The MC verifies whether the current performance conforms to the configured policy for each traffic class. If not, the MC instructs the BRs to change the route for that particular prefix.
To perform route control, a route is injected. The injected route can be a static route, a BGP route (if BGP is used), or a Policy Based Routing (PBR) policy (if the forwarding decision is based on something more than the IP destination). Support for other routing protocols, such as Enhanced Interior Gateway Routing Protocol (EIGRP), is under development. Note that the injected routes are local and should not be advertised.
A typical PfR MC/BR configuration geared toward load balancing traffic between two serial links follows:
!CONFIGURE THE OER KEY TO BE USED FOR MASTER-BORDER AUTHENTICATIONkey chain oer-key key 1 key-string WANOPT!!CONFIGURE PfR MASTERoer master max-range-utilization percent 10 logging !!POINT TO THE BORDER ROUTER AND OER KEY TO USE FOR AUTHENTICATION border 10.0.0.173 key-chain oer-key!DEFINE THE INTERNAL AND EXTERNAL INTERFACES ON THE BORDER ROUTER interface FastEthernet3/1 internal interface Serial6/1:0 external max-xmit-utilization percentage 50
WAN
WAN
2712
31
PfR BorderRouters (BR)
PfR BorderRouters (BR)
BranchSwitch
PfR MasterController (MC)
WAE

9-13WAN and Application Optimization Solution Guide
Chapter 9 Branch Design ConsiderationsHow PfR Works
interface Serial6/0:0 external max-xmit-utilization percentage 50 ! !CONFIGURE THE PfR MASTER TO LEARN TRAFFIC CLASS OR PREFIXESlearn!CONFIGURE THE PfR TO LEARN TOP PREFIXES BASED ON THROUGHPUT Throughput!CONFIGURE THE PfR TIMERS periodic-interval 0 monitor-period 1!CONFIGURE THE NUMBER OF PREFIXES TO LEARN prefixes 500 traffic-class keys dscp !CONFIGURE THE TYPE OF PREFIXES TO AGGREGATE aggregation-type prefix-length 32 no max range receive backoff 90 90!CONFIGURE THE PfR MODE mode route control mode select-exit best periodic 180 resolve range priority 1 resolve utilization priority 2 variance 10 no resolve delay!CONFIGURE PfR BORDER oer border!ENABLE LOGGING logging local Loopback0!POINT TO THE MASTER ROUTER AND OER KEY TO USE FOR AUTHENTICATION master 10.0.0.173 key-chain oer-key
9.7.1 PfR-Based Load BalancingPfR can also track flows based on destination prefixes and link utilization. By intelligently combining destination prefixes into different groups, appropriate policy maps can be defined in PfR for different kinds of traffic. These different flows can then be appropriately routed and optimized for bandwidth. For example, consider the setup shown in Figure 9-11.
Figure 9-11 Dual-Homed SOHO Branch
Internet
MPLSWAN
2712
32
Traffictowards DC
BranchSwitch
Clients
WAE

9-14WAN and Application Optimization Solution Guide
Chapter 9 Branch Design ConsiderationsHow PfR Works
This setup has a dual homed branch router with one link over an MPLS WAN and the other over the Internet. Although the available bandwidth for each path is the same, delay and jitter are not. With normal routing protocols, the path through the MPLS WAN is the preferred exit and all traffic flows through that interface. The entire bandwidth available through the Internet exit is unused and wasted.
Using PfR to route all critical and delay sensitive traffic over the primary exit and all entertainment and non-critical traffic over Internet is probably a better solution. Thus, PfR can be used for efficient load balancing to ensure better bandwidth utilization. Section 9.7 How PfR Works provides sample configurations.
9.7.2 PfR Link/Path Congestion/FailureNormal routing protocols are primarily limited because they are based primarily on reachability. Although some routing protocols include cost as a metric for route calculations, cost is typically based on the theoretical link bandwidth and is a static value. This seriously impedes their routing path decisions because they do not track dynamically changing metrics such as delay or jitter.
For example, if there is congestion along a path and data packets are dropped or delay increases, normal routing protocols cannot effect a change in the routing path. A failure of this kind can affect all critical and real time user traffic. Because PfR can track metrics such as delay, jitter, and true reachability, it provides a potential solution for such situations. For example, consider the setup shown in Figure 9-12.
This setup has a dual homed branch router with two exit links. The path over Link1 provides a 30ms delay and the path over Link2 provides a delay of 60ms. The router is configured with PfR to track delay, send real time traffic over the path with the least delay, and send all other traffic over the alternate path.
Figure 9-12 Dual-Homed SOHO Branch with Multiple Exit Links
Internet
MPLSWAN
2712
33
30msDelay
60msDelay
BranchSwitch
Clients
WAE

9-15WAN and Application Optimization Solution Guide
Chapter 9 Branch Design ConsiderationsHow PfR Works
9.7.2.1 Case 1: Normal Conditions: No Congestion
PfR is active and is tracking delay and reachability. Because path 1 provides the lowest delay, all delay sensitive traffic is routed over path 1. As can be seen using show commands, PfR introduces a static route through path1 for delay sensitive traffic. All other traffic is routed over path 2 because of the default route. This is shown in Figure 9-13.
Figure 9-13 SOHO Branch with No Congestion
9.7.2.2 Case 2: Sudden Congestion in Downstream Path 1
A sudden congestion occurs downstream on path 1. Because of this, the delay over path 1 increases to more than 100ms. PfR senses this delay and effects a route change, diverting all real time traffic through path 2. Other traffic is not affected and continues to flow through path 2. See Figure 9-14 and Figure 9-5. Also, see 9.7 How PfR Works for sample configurations.
Figure 9-14 SOHO Branch with Congestion
Internet
MPLSWAN
2712
34
Business Critical/Real Time
traffic
Non Critical/Entertainment
traffic
BranchSwitch
Clients
WAE
Internet
MPLSWAN
2712
35
Business Critical/Real Time
traffic
Non Critical/Entertainment
traffic
MC/BR
Clients
WAE
PfR
Congestion
To DC
To DC

9-16WAN and Application Optimization Solution Guide
Chapter 9 Branch Design ConsiderationsHow PfR Works
Figure 9-15 SOHO Branch Path Congestion with PfR Path Optimization
9.7.2.3 Case 3: Path Failure in Downstream Path 1
A link on a router within the WAN cloud fails, but the routing protocol does not relay this failure, possibly because of static routes or summarization, or possibly because data traffic is failing but the routing protocol remains up. Because of the failure, user traffic does not reach the other end of enterprise network. PfR observes increasing packet retransmissions and failures of its own probes. In response to the failure, PfR can direct all traffic to the alternate WAN path. As in the preceding case, traffic continues to flow unhindered over path 2. This is shown in Figure 9-16.
Figure 9-16 SOHO Branch Path Failure with PfR Path Optimization
For more information about PfR and its deployment, refer to Transport Diversity: PfR Design Guide:
http://www.cisco.com/application/pdf/en/us/guest/netsol/ns483/c649/ccmigration_09186a008094e673.pdf
Internet
MPLSWAN
2714
44
MC/BR
Clients
WAE
PfR
Congestion
To DC
To DC
All traffic
Internet
MPLSWAN
2712
36All traffic
MC/BR
Clients
WAE
PfR
Path Failure
To DC
To DC

9-17WAN and Application Optimization Solution Guide
Chapter 9 Branch Design ConsiderationsWCCP WAEs
9.8 WCCP WAEsWCCP was introduced in content routing to redirect web traffic to content cache engines. The idea was that with intelligent cache engines, network web traffic could be reduced; conversely, access speed could increase to improve the user experience. WCCP v1, introduced in 1997, was superseded by WCCP v2.
Cisco WAEs are devices used with Cisco IOS routers running WCCP to provide TCP optimization. WCCP is a common deployment tool used to intercept TCP traffic. WCCP redirects selected TCP traffic to the WAE, which can perform TCP optimization and compression, and which has data redundancy elimination (DRE) cache to help optimize the TCP traffic.
Figure 9-17 shows a typical WCCP and WAE deployment in a branch network.
Figure 9-17 WCCP and WAE in a Branch Network
9.9 WANsWANs are networks that cover a wide area. Typically, they interconnect LANs located in different areas. WANs imply a path of higher latency (generally 10s of milliseconds to several hundred milliseconds), relative lower bandwidth (therefore leading to more congestion), and a higher possibility of intermittent packet loss and path failures.
9.9.1 MPLS WANsEnabling MPLS over the WANs provides multiple advantages to an enterprise network:
• MPLS provides convergence of both L2 and L3 VPNs over the WAN.
• MPLS WANs retain extensive QoS capabilities and traffic engineering tunnels to provide real-time and mission-critical traffic with assured bandwidth and resiliency.
• Enterprises need not maintain any more specific WAN infrastructure.
• Enterprise network designs involving hub-and-spoke topologies are simpler. Hubs do not need to maintain individual adjacencies with the spokes, and interspoke traffic does not need to go through the hub. Routing becomes much simpler because spoke routers need not maintain a full routing table.
• All packet switching happens based on the labels the packets carry with less cumbersome route lookups.
2712
37
WAE
WANWCCP
BranchRouter
BranchSwtich
9-18WAN and Application Optimization Solution Guide
Chapter 9 Branch Design ConsiderationsSecurity
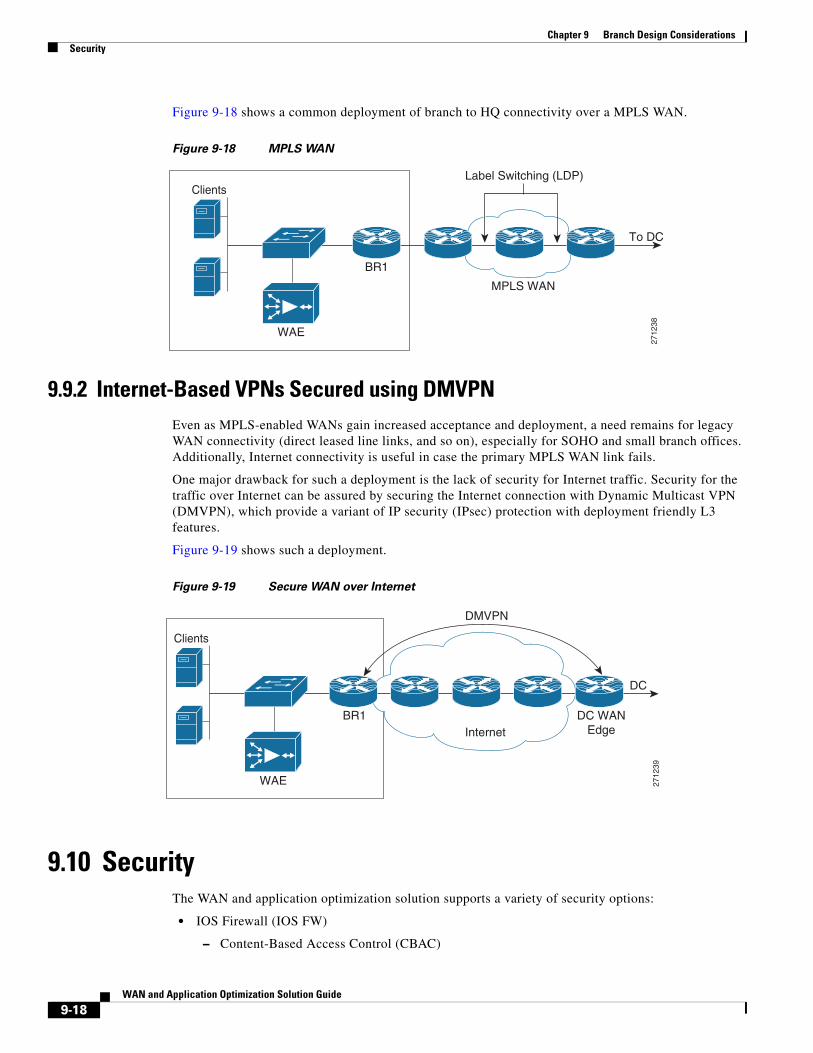
Figure 9-18 shows a common deployment of branch to HQ connectivity over a MPLS WAN.
Figure 9-18 MPLS WAN
9.9.2 Internet-Based VPNs Secured using DMVPNEven as MPLS-enabled WANs gain increased acceptance and deployment, a need remains for legacy WAN connectivity (direct leased line links, and so on), especially for SOHO and small branch offices. Additionally, Internet connectivity is useful in case the primary MPLS WAN link fails.
One major drawback for such a deployment is the lack of security for Internet traffic. Security for the traffic over Internet can be assured by securing the Internet connection with Dynamic Multicast VPN (DMVPN), which provide a variant of IP security (IPsec) protection with deployment friendly L3 features.
Figure 9-19 shows such a deployment.
Figure 9-19 Secure WAN over Internet
9.10 SecurityThe WAN and application optimization solution supports a variety of security options:
• IOS Firewall (IOS FW)
– Content-Based Access Control (CBAC)
To DC
MPLS WAN
2712
38
Clients
WAE
BR1
Label Switching (LDP)
DC
Internet
2712
39
Clients
WAE
DC WANEdge
BR1
DMVPN

9-19WAN and Application Optimization Solution Guide
Chapter 9 Branch Design ConsiderationsSecurity
– Zone-based firewall
– Intrusion Detection System (IDS)
• DMVPN
9.10.1 IOS Firewall IOS Firewall (IOS FW) provides users with a feature-rich and cost-effective way to implement security. IOS FW is particularly suited for branch networks where dedicated firewall boxes are not justified because of their complexity and cost. IOS FW provides users with protection along with seamless integration of other IOS features.
The Cisco IOS Firewall feature set has the following components:
• Context-Based Access Control (CBAC)
• Cisco Zone-Based Firewall
• Intrusion Detection
9.10.1.1 Content-Based Access Control (CBAC)
CBAC inspects all TCP and UDP packets and can dynamically create temporary openings for outbound traffic at the firewall interface. Return traffic is supported only for established sessions. CBAC maintains state information for every session. CBAC is interface based and is configured using ACLs.
9.10.1.2 Zone-Based Firewall
Zone-based firewall, as the name implies, is based on zones. Interfaces are usually associated with zones, and a zone can have multiple interfaces. Typically, on a Cisco router, LAN interfaces on the corporate network are configured to be in the trusted or inside zone; WAN interfaces are placed in the untrusted or outside zone. Zone-based firewalls are simpler to deploy. A class-based policy language is used to configure policies. Figure 9-20 shows a typical zone-based Firewall deployment.
Figure 9-20 Zone-Based Firewall
9.10.1.3 Intrusion Detection
The Firewall's Intrusion Detection system (IDS) contains most common attack signatures to detect intrusion. When IDS detects suspicious activity, IDS logs the event and can either shut down the port or send an alarm before network security is compromised.
2712
40
LAN
TrustedZone
BranchRouter Un-trusted
Zone
WAN
9-20WAN and Application Optimization Solution Guide
Chapter 9 Branch Design ConsiderationsSecurity
For a more detailed explanation of these features and their use, see http://www.cisco.com/en/US/products/ps6586/products_ios_technology_home.html
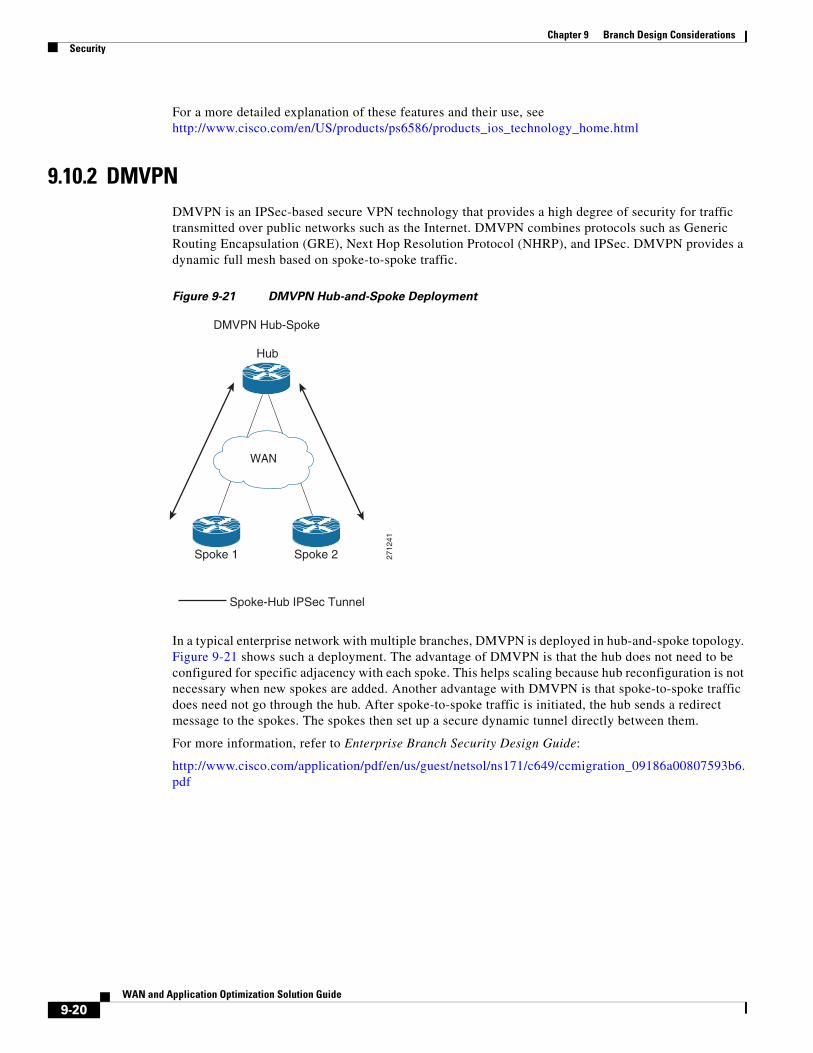
9.10.2 DMVPNDMVPN is an IPSec-based secure VPN technology that provides a high degree of security for traffic transmitted over public networks such as the Internet. DMVPN combines protocols such as Generic Routing Encapsulation (GRE), Next Hop Resolution Protocol (NHRP), and IPSec. DMVPN provides a dynamic full mesh based on spoke-to-spoke traffic.
Figure 9-21 DMVPN Hub-and-Spoke Deployment
In a typical enterprise network with multiple branches, DMVPN is deployed in hub-and-spoke topology. Figure 9-21 shows such a deployment. The advantage of DMVPN is that the hub does not need to be configured for specific adjacency with each spoke. This helps scaling because hub reconfiguration is not necessary when new spokes are added. Another advantage with DMVPN is that spoke-to-spoke traffic does need not go through the hub. After spoke-to-spoke traffic is initiated, the hub sends a redirect message to the spokes. The spokes then set up a secure dynamic tunnel directly between them.
For more information, refer to Enterprise Branch Security Design Guide:
http://www.cisco.com/application/pdf/en/us/guest/netsol/ns171/c649/ccmigration_09186a00807593b6.pdf
2712
41
DMVPN Hub-Spoke
WAN
Hub
Spoke 1 Spoke 2
Spoke-Hub IPSec Tunnel
9-21WAN and Application Optimization Solution Guide
Chapter 9 Branch Design ConsiderationsInteroperability Considerations
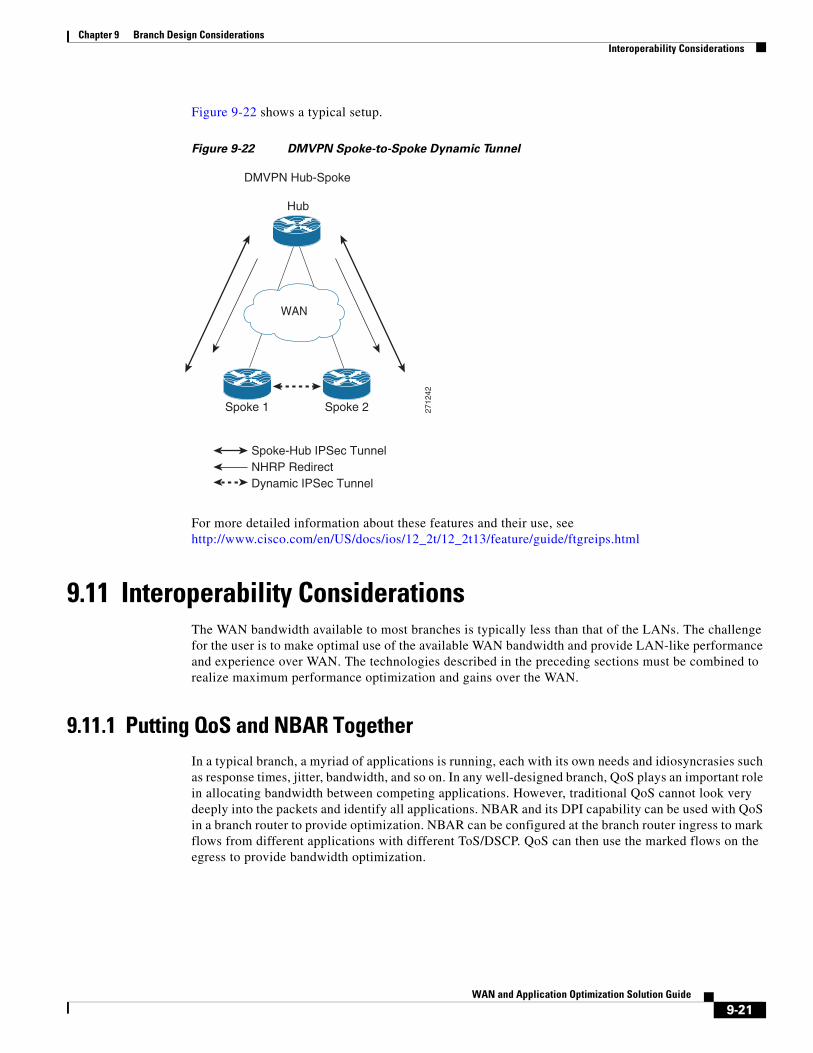
Figure 9-22 shows a typical setup.
Figure 9-22 DMVPN Spoke-to-Spoke Dynamic Tunnel
For more detailed information about these features and their use, see http://www.cisco.com/en/US/docs/ios/12_2t/12_2t13/feature/guide/ftgreips.html
9.11 Interoperability ConsiderationsThe WAN bandwidth available to most branches is typically less than that of the LANs. The challenge for the user is to make optimal use of the available WAN bandwidth and provide LAN-like performance and experience over WAN. The technologies described in the preceding sections must be combined to realize maximum performance optimization and gains over the WAN.
9.11.1 Putting QoS and NBAR TogetherIn a typical branch, a myriad of applications is running, each with its own needs and idiosyncrasies such as response times, jitter, bandwidth, and so on. In any well-designed branch, QoS plays an important role in allocating bandwidth between competing applications. However, traditional QoS cannot look very deeply into the packets and identify all applications. NBAR and its DPI capability can be used with QoS in a branch router to provide optimization. NBAR can be configured at the branch router ingress to mark flows from different applications with different ToS/DSCP. QoS can then use the marked flows on the egress to provide bandwidth optimization.
2712
42
DMVPN Hub-Spoke
WAN
Hub
Spoke 1 Spoke 2
Spoke-Hub IPSec TunnelNHRP RedirectDynamic IPSec Tunnel

9-22WAN and Application Optimization Solution Guide
Chapter 9 Branch Design ConsiderationsInteroperability Considerations
9.11.2 QoS, NBAR, NetFlow, and Path Optimization with PfRNetFlow provides detailed tracking and statistics for each flow through the router. PfR uses NetFlow to track and monitor the prefixes that need to be controlled. Additionally, PfR can use DSCP values or L4 ports, and so on, to recognize flows based on different traffic classes.
A user can combine the DPI capability of NBAR and DSCP marking with the ability of PfR to track application classes based on those markings to provide resilience and route path optimization. Adding QoS to these provides bandwidth optimization. Figure 9-23 depicts a typical deployment scenario, and relevant sample configurations follow.
Figure 9-23 NBAR/NetFlow/PfR/QoS Interoperability
9.11.2.1 NBAR Configlets
!CONFIGURE APPROPRIATE NBAR CLASS MAPS TO MATCH DIFFERENT APPLICATION/PROTOCOLS class-map match-all NBAR_UDP match access-group name UDPclass-map match-any NBAR_FTP match protocol ftpclass-map match-any NBAR_voice match protocol sip match protocol skinnyclass-map match-any NBAR_HTTP match protocol http match protocol secure-http
!CONFIGURE APPROPRIATE POLICY MAPS TO SET THE IP DSCP VALUES FOR EACH APPLICATION/PROTOCOL policy-map NBAR class NBAR_HTTP set dscp cs2 class NBAR_UDP set dscp cs5 class NBAR_voice set dscp cs6 class NBAR_FTP set dscp cs4 class class-default set ip precedence 3
9.11.2.2 QoS Configlets
!CONFIGURE APPROPRIATE QoS CLASS MAPS TO MAP TO THE IP DSCP VALUES IN THE PACKETS class-map match-all QoS_HTTP
WAN
WAN
2712
43
BranchRouter
BranchSwtich
QOSNetflow
PfRExit i/f
PfRInput i/f
PfRExit i/fNBAR
Netflow

9-23WAN and Application Optimization Solution Guide
Chapter 9 Branch Design ConsiderationsInteroperability Considerations
match ip precedence 2class-map match-all QoS_FTP match ip precedence 4class-map match-all QoS_UDP match ip precedence 5class-map match-all QoS_voice match ip precedence 6
!CONFIGURE APPROPRIATE POLICY MAPS TO ALLOT BANDWIDTH TO DIFFERENT TRAFFIC WHEN CONGESTEDpolicy-map QoS class QoS_HTTP bandwidth percent 25 class QoS_UDP bandwidth percent 15 class QoS_voice priority percent 10 class QoS_FTP bandwidth percent 10 class class-default bandwidth percent 15
9.11.2.3 PfR Configlets
!CONFIGURE THE OER KEY TO BE USED FOR MASTER-BORDER AUTHENTICATIONkey chain oer-key key 1 key-string WANOPT!CONFIGURE PfR MASTERoer master!ASSIGN THE POLICY MAP TO BE USED FOR PATH-OPTIMIZATION (OPTIONAL) policy-rules delayPolicy logging !!POINT TO THE BORDER ROUTER AND OER KEY TO USE FOR AUTHENTICATION border 10.0.0.172 key-chain oer-key!DEFINE THE INTERNAL AND EXTERNAL INTERFACES ON THE BORDER ROUTER interface Serial6/1:0 external interface FastEthernet3/1 internal interface Serial6/0:0.1 external !!CONFIGURE THE PfR MASTER TO LEARN TRAFFIC CLASS OR PREFIXES learn!CONFIGURE THE PfR TO LEARN PREFIXES BASED ON DELAY delay!CONFIGURE THE PfR TIMERS periodic-interval 0 monitor-period 1!CONFIGURE THE NUMBER OF PREFIXES TO LEARN prefixes 1000!CONFIGURE THE TYPE OF PREFIXES TO AGGREGATE aggregation-type prefix-length 32 no max range receive!CONFIGURE THE PfR MODE mode monitor fast no resolve delay no resolve utilization !!CONFIGURE AN ACTIVE PROBE TO ONE OF THE PREFIXES active-probe echo 60.1.1.100!!CONFIGURE PfR BORDER

9-24WAN and Application Optimization Solution Guide
Chapter 9 Branch Design ConsiderationsInteroperability Considerations
oer border!ENABLE LOGGING logging local Loopback0!POINT TO THE MASTER ROUTER AND OER KEY TO USE FOR AUTHENTICATION master 10.0.0.172 key-chain oer-key
Note This configuration does not work as intended in IOS release 12.4(15)T2. See 9.12 Caveats for more details. However, for TCP traffic that is intercepted by WCCP, the preceding configuration and policy does work, as packets would then exit and reenter the router over the interface connected to WAE. NetFlow can then recognize those markings and PfR can act on them. Applications can still be recognized based on L4 information. As a workaround, an upstream router, rather than the WAN edge branch router, can mark packets with the required DSCP.
9.11.3 WAAS InteroperabilityWCCP can be deployed with all of the preceding IOS features to further enhance performance and optimization. Figure 9-24 depicts such a deployment. WAE provides TCP optimization only so other traffic, such as voice (over UDP) flows, is not affected by WAE. The following sections detail interoperability considerations when using WCCP with other features.
Figure 9-24 WCCP/NBAR/NetFlow/PfR/QoS Interoperability
9.11.3.1 WAAS and Firewalls
Introducing WAAS sets up three TCP segments along the data path, as shown in Figure 9-25. They include sessions between:
1. The client on the branch and the branch WAE
2. The branch WAE and the HQ/DC WAE, and
3. The HQ/DC WAE and the server
WAN
WAN
2712
44
BranchRouter
BranchSwtich
QOSNetflow
PfRExit i/f
PfRInput i/f
PfRExit i/fNBAR
Netflow
WAE
QOSNetflow

9-25WAN and Application Optimization Solution Guide
Chapter 9 Branch Design ConsiderationsInteroperability Considerations
Figure 9-25 TCP Optimization with WAAS
In the second session, the segment between the two WAEs initially uses a TCP sequence to match the original client, but on confirmation of a remote WAE willing to perform optimization, the TCP sequence number jumps to greater than 2 million for the leg between the WAEs. This jump provides a different TCP window for the optimized leg to help differentiate it from the unoptimized leg that the client and server actually see.
TCP options are used in the WAE-WAE TCP segment. This behavior causes the firewall, if it is deployed anywhere along the path in the middle segment, to treat the traffic as suspicious and drop it. Table 9-2 lists the various operating systems and the versions in which firewall drop behavior was fixed.
9.11.3.2 WCCP and NetFlow
NetFlow, which helps track different flows as they traverse routers and networks, has become indispensable for network operators. PfR depends on NetFlow to track and work with flows. However, when enabling NetFlow along with WCCP on the branch router, note the following:
• With both WCCP and NetFlow ingress enabled on the ingress interface of the branch router, a redirected flow cache entry has the output interface as “unknown,” as shown in Figure 9-26.
• When 61 WCCP in and 62 WCCP out are both configured on the branch router LAN interface, the router looks up some packets twice. This causes duplicate counts in the NetFlow statistics.
2712
45
Clients Servers
Branch WAE HQ/DC WAE
TCP Session 1(Un-optimized)
TCP Session 2(Optimized)
TCP Session 3(Un-optimized)
Table 9-2 Firewall Fixes
Operating System Version Command
IOS 12.4(11)T2 inspect waas enableFWSM 3.2.1 inspect waasPIX 7.2(3) inspect waas

9-26WAN and Application Optimization Solution Guide
Chapter 9 Branch Design ConsiderationsInteroperability Considerations
Figure 9-26 NetFlow and WCCP (NetFlow, WCCP, IP return (12.4T))
9.11.3.3 WCCP and PfR
When configuring PfR, interfaces must be explicitly labeled as “internal” and “external” so that outgoing WAN traffic can be identified. Because of the NetFlow-WCCP “Unknown” issue, the GRE return feature in WAAS must be enabled so that an explicit internal to external NetFlow cache entry is seen. Additionally, because there are cases where WAAS itself originates traffic (for example, CIFS tunnel traffic), the WAAS-facing interface should labeled as PfR “internal.”
9.11.3.4 High Availability and WCCP
9.11.3.4.1 Branch WAE High Availability and Load Sharing
Consider a typical branch network with one branch router and one WAE. The WAE can become a single point of failure, disrupting branch activities. A WAE failure can be a complete failure (for example, power outage, software error, and so on) or a case in which the WAE single box performance limit is reached.
Although these failure possibilities are remote, deploying multiple WAEs at the branch can help minimize the effects of such failures. Using WCCP automatic load distribution features, the WAEs can work as a cluster and can share the load, and potentially protect against a single point of failure by providing backup if one WAE fails.
To help protect against branch router failure and improve availability, a user can set up two branch routers in the network. This also provides load sharing by the routers. In such cases, it is customary to implement HSRP or GLBP on the branch LANs. These two branch routers can share either one WAE or multiple WAEs.
2712
46
http server10.17.102.180
client10.17.102.2
WAE-7
LX-7301-10
Client to ServerClient to Server (optimized)Server to Client Server to Client (optimized)
Gig0/1
Fa1/1
Fa1/0
d
a
c
l
mn
o
b

9-27WAN and Application Optimization Solution Guide
Chapter 9 Branch Design ConsiderationsInteroperability Considerations
9.11.3.4.2 Branch LAN High Availability with One Shared WAE
A typical network is shown in Figure 9-27.
Figure 9-27 Branch LAN High Availability - One WAN
Configuring GLBP on the Branch LAN is more advantageous in such situations because GLBP provides load sharing. On the WAE side, the routers can be configured with HSRP and the WAE default gateway can be pointed toward the HSRP address. This, however, can result in inefficient routing.
Assume that branch routers BR1 and BR2 run a routing protocol between them and with the WAN routers. Let BR1 be the preferred exit to network X over the WAN. Let BR2 be the higher priority router for HSRP on the WAE VLAN. With this setup, let us look at a packet flow from branch to network X:
1. The client on the branch and the branch WAE.
2. WCCP intercepts the packet on BR1 and sends them to the WAE.
3. The WAE processes the packet and returns it to its default gateway, which is BR2.
4. BR2 does a lookup for the packet, realizes that BR1 is the preferred exit, and sends the packet to BR1.
5. BR1 forwards the packet through the WAN.
As can be easily seen, if the WAE could have returned the packet to BR1 instead of to BR2, the extra hop and the consequent delay could have been avoided. A workaround for such issues is to add static routes to pointing to the standby address of the preferred branch router on the WAE. The same problem can happen on the reverse path with asymmetric routing. The problem might be worse in that case, because it might involve unoptimized traffic flowing between the two branch routers. Therefore, there should be adequate bandwidth between the branch routers.
Starting with version 4.0.13, WAEs support negotiated GRE return for optimized packets. With GRE return, the WAE returns the packet directly to the router that sent it. Note that on the routers, HSRP on the WAE side and on the WAE pointing the default gateway to the HSRP address is still recommended. This provides higher availability for WAE connectivity to the network and Central Manager.
9.11.3.4.3 Branch LAN High Availability with Two Shared WAEs
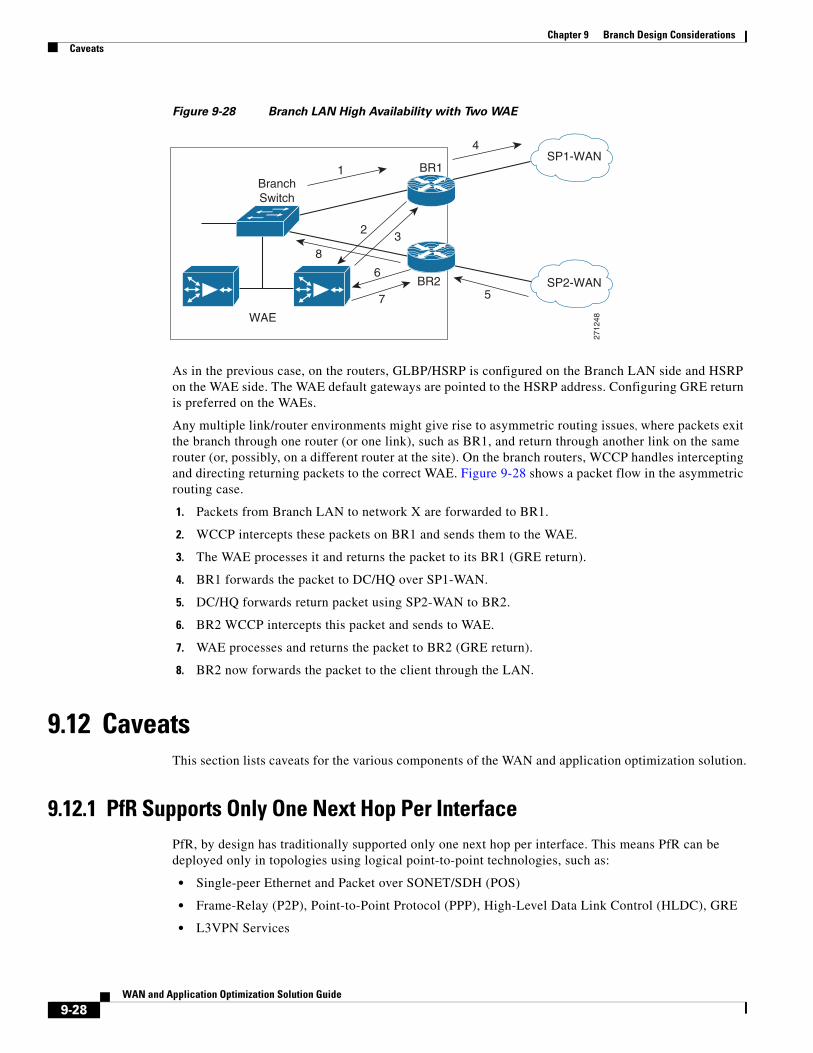
Figure 9-28 shows this implementation.
2712
47
BR1BranchSwitch
WAE
BR2
WAN
WAN
1
3
4
5
2
9-28WAN and Application Optimization Solution Guide
Chapter 9 Branch Design ConsiderationsCaveats
Figure 9-28 Branch LAN High Availability with Two WAE
As in the previous case, on the routers, GLBP/HSRP is configured on the Branch LAN side and HSRP on the WAE side. The WAE default gateways are pointed to the HSRP address. Configuring GRE return is preferred on the WAEs.
Any multiple link/router environments might give rise to asymmetric routing issues, where packets exit the branch through one router (or one link), such as BR1, and return through another link on the same router (or, possibly, on a different router at the site). On the branch routers, WCCP handles intercepting and directing returning packets to the correct WAE. Figure 9-28 shows a packet flow in the asymmetric routing case.
1. Packets from Branch LAN to network X are forwarded to BR1.
2. WCCP intercepts these packets on BR1 and sends them to the WAE.
3. The WAE processes it and returns the packet to its BR1 (GRE return).
4. BR1 forwards the packet to DC/HQ over SP1-WAN.
5. DC/HQ forwards return packet using SP2-WAN to BR2.
6. BR2 WCCP intercepts this packet and sends to WAE.
7. WAE processes and returns the packet to BR2 (GRE return).
8. BR2 now forwards the packet to the client through the LAN.
9.12 CaveatsThis section lists caveats for the various components of the WAN and application optimization solution.
9.12.1 PfR Supports Only One Next Hop Per InterfacePfR, by design has traditionally supported only one next hop per interface. This means PfR can be deployed only in topologies using logical point-to-point technologies, such as:
• Single-peer Ethernet and Packet over SONET/SDH (POS)
• Frame-Relay (P2P), Point-to-Point Protocol (PPP), High-Level Data Link Control (HLDC), GRE
• L3VPN Services
2712
48
BR1BranchSwitch
WAE
BR2
SP1-WAN
SP2-WAN
1
4
3
57
6
8
2

9-29WAN and Application Optimization Solution Guide
Chapter 9 Branch Design ConsiderationsCaveats
PfR cannot be deployed in topologies using:
• ISP peering exchanges (generally, common Ethernet VLAN, or SONET ring)
• VPLS
• DMVPN (mGRE)
However, PfR can work with DMVPN solution using point-to-point GRE tunnels. PfR support for multipoint interfaces is under development.
9.12.2 PfR Supports only BGP or Static Routes for Path OptimizationFor path optimization in a router, PfR uses static routes or BGP routes as parent routes. PfR cannot control routes learned using other protocols. However, many WAN deployments use EIGRP or Open Shortest Path First (OSPF). In such cases, the workaround is to use static summary routes and use PfR for route unreachability mitigation.
Support for EIGRP in PfR is under development.
9.12.3 PfR Might Break WAAS TCP Optimization if the WAAS Network Path Changes
PfR tracks various traffic parameters and, based on those parameters, shifts the network path of an application from one link to another to perform path optimization. While doing so, if WAAS is inside the PfR domain as shown in Figure 9-29, the WAAS TCP optimization will be broken. To avoid this, always place outer WAEs outside the PfR domain.

9-30WAN and Application Optimization Solution Guide
Chapter 9 Branch Design ConsiderationsCaveats
Figure 9-29 PfR-WAAS Network Path
9.12.4 PfR Interface Mapping and WAASPfR tracks traffic that enters and exits the router. PfR tags interfaces through which traffic flows as external interfaces or internal interfaces. Typically, the interface through which the traffic enters into the router from the LAN network is tagged as internal and the interfaces through which the traffic exits the router (the WAN) are tagged as external. PfR terms traffic that flows from internal to external interfaces as interesting. PfR needs the traffic in the reverse direction, from external to internal, for verification. Figure 9-30 shows this tagging.
If a router is doing TCP optimization with WAAS, the interface connecting the router to the WAAS cannot be clearly distinguished as internal or external. This is because it acts as the exit interface for traffic that is intercepted by WCCP on the router and as an ingress interface for optimized or un-optimized traffic. The workaround is to configure the WAE to do GRE return.
Additionally, if there is CIFS traffic, the CIFS traffic is not returned using GRE. Therefore, for CIFS traffic, the WAE interface on the router should be tagged as PfR internal.
Another option is to disable the return traffic verification of PfR by using the command no mode verify bidirectional. This, however, exposes PfR to self-created black holes.
9.12.5 PfR Cannot Recognize MQC Marking Done by the Same RouterIf the branch router running PfR is doing DSCP or ToS marking on ingress traffic, PfR cannot recognize these remarkings. PfR uses ingress NetFlow to learn and verify traffic. Ingress NetFlow records the original received ToS marking when the packet entered the router and does not record the remarked value. Therefore, PfR cannot match locally remarked flows based on DSCP or ToS. Figure 9-30 illustrates this issue.
2712
49
Branch LAN
WAE
MC/BR
WAE
MC
BR
BR
MPLSWAN
Campus Data Center
WAAS Optimized)
PfR Optimized From Branch
PfR Optimized From Data Center
Internet

9-31WAN and Application Optimization Solution Guide
Chapter 9 Branch Design ConsiderationsCaveats
Figure 9-30 PfR and Modular QoS CLI (MQC) Mappings
This, however, does not affect TCP traffic redirected to WAAS because the markings on the packets on reentry are recorded by NetFlow, which PfR can then use. The workaround is to use upstream devices to mark the traffic. DDTS CSCsk99096 tracks this issue.
9.12.6 PFR Interface Mapping and NetFlow SamplingWhen NetFlow sampling is enabled on an interface, that interface cannot be used as an internal or external PfR interface. A solution for this issue is under development.
9.12.7 CIFS tunneling on WAE and Network visibilityIn Windows operating system environments, CIFS (also known as Windows file sharing) is predominantly used for file sharing. With CIFS application acceleration enabled on such networks with WAAS, WAEs tunnel CIFS traffic across the network over TCP port 4050 and the IP addresses of the WAEs involved.
QoS
/MQ
C
PfR
NetF
low
IOS router
LAN WAN
NetFlow Ingresscaptures ToS value QoS rewrites TOS
value, but NetFlowkeeps original value
2712
50
PfR uses ingressNetFlow for accounting traffic.Only sees original ToS

9-32WAN and Application Optimization Solution Guide
Chapter 9 Branch Design ConsiderationsCaveats
This affects the visibility of technologies such as NetFlow and QoS, because they are no longer aware of the actual endpoints. Tunneled traffic affects the ability of PfR to granularly path optimize the optimized CIFS traffic because PfR relies on NetFlow. This issue will be resolved in the upcoming release of WAE software in late 2008.
Figure 9-31 illustrates CIFS tunneling with WAE.
Figure 9-31 WAE CIFS Tunneling
9.12.8 WAAS and FirewallIntroducing WAAS creates three different TCP segments: one between the client and the client side WAE, the second between the client side WAE and server side WAE, and the third between the server side WAE and the server.
The WAEs use TCP options (0x21) for autodiscovery and jump up the sequence number to more than 2 million in the WAE-WAE TCP session. Any firewall deployed in between the WAEs might view these activities as suspicious and might drop the packets. This behavior is fixed in the IOS versions detailed in 9.11.3.1 WAAS and Firewalls.
9.12.9 WCCP and NHRP RedirectNext Hop Routing Protocol (NHRP) is part of DMVPN technology. In a typical hub-and-spoke DMVPN deployment, when spoke-to-spoke traffic hits the hub, it sends a NHRP redirect to the spokes (as shown in Figure 9-32) to enable the spokes to establish a direct secure tunnel between them. For NHRP on the hub to send the redirect, it should see the same packet enter and exit the same tunnel interface. This breaks when WCCP is enabled on the DMVPN hub.
2712
51
Branch LAN
WAE CIFS Server
MC
BR
BR
WAN 1
Campus Data Center
WAN 2
TCP 4050 usingWAE IP addresses
WAE
MC/BR

9-33WAN and Application Optimization Solution Guide
Chapter 9 Branch Design ConsiderationsCaveats
Figure 9-32 DMVPN-NHRP Redirect
In DMVPN deployments with WCCP, WCCP intercept is configured on the tunnels. Therefore, any packet traveling from spoke-to-spoke, on reaching the tunnel, is intercepted by WCCP and sent to the WAE. Assuming that the WAE is doing L3 return, the return packet from the WAE is then sent out the hub. This breaks the NHRP condition to send the redirect. Therefore, no redirect is sent to the spokes and no direct tunnels are established between them. With WAE doing GRE return, NHRP incorrectly sends the redirect to the WAE instead of the spokes, and no spoke-to-spoke tunnels can be established.
Note that this affects only spoke-to-spoke traffic and optimization, and does not affect spoke-to-hub or hub-to-spoke traffic. The workaround is to remove the WCCP intercept on the tunnel interface on the hub and configure it on its LAN interface. The LAN interface on the hub will have WCCP intercept for both in and out directions. This has some performance implications on the hub, as the hub router must do two route lookups for spoke-to-hub traffic.
9.12.10 WAAS Might Not Intercept IP SLA Probes Configured on the Branch Router
In any network, IP SLAs are an essential component for monitoring network performance parameters such as round-trip-time (RTT). On a branch network, it is typical to configure IP SLAs on the branch router connected to the WAN to measure performance. This is shown in Figure 9-33.
Current IOS code does not perform WCCP intercept of any IP SLA probes configured on the branch router. However, WCCP intercepts all regular TCP traffic that passes through the branch router. This can create monitoring issues because parameters, such as network RTT, reported by such SLAs on the branch router do not represent the actual user experience. WCCP does not intercept SLA probes, so WAAS does not optimize them. The workaround is to configure such SLA probes on an upstream router, where WCCP will intercept them on the branch router.
2712
52
DMVPN Hub-Spoke
WAN
Hub
Spoke 1 Spoke 2
Spoke-Spoke TrafficNHRP Redirect
9-34WAN and Application Optimization Solution Guide
Chapter 9 Branch Design ConsiderationsCaveats
Figure 9-33 IP SLA and WCCP
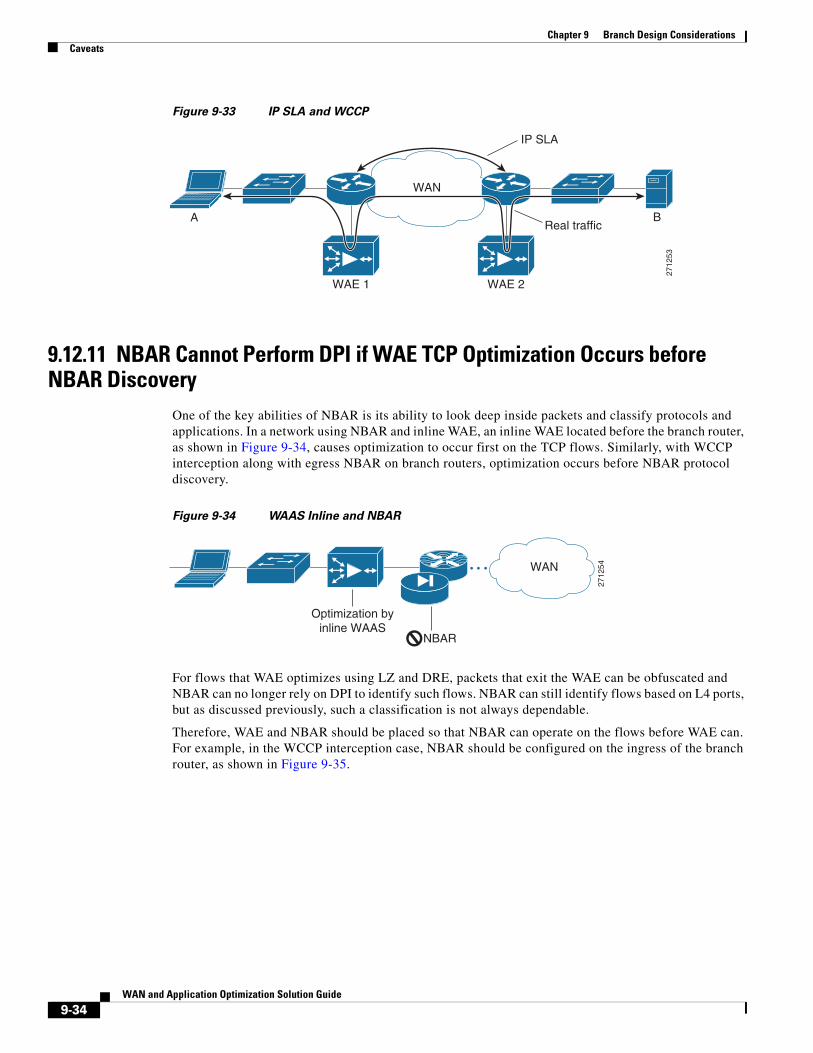
9.12.11 NBAR Cannot Perform DPI if WAE TCP Optimization Occurs before NBAR Discovery
One of the key abilities of NBAR is its ability to look deep inside packets and classify protocols and applications. In a network using NBAR and inline WAE, an inline WAE located before the branch router, as shown in Figure 9-34, causes optimization to occur first on the TCP flows. Similarly, with WCCP interception along with egress NBAR on branch routers, optimization occurs before NBAR protocol discovery.
Figure 9-34 WAAS Inline and NBAR
For flows that WAE optimizes using LZ and DRE, packets that exit the WAE can be obfuscated and NBAR can no longer rely on DPI to identify such flows. NBAR can still identify flows based on L4 ports, but as discussed previously, such a classification is not always dependable.
Therefore, WAE and NBAR should be placed so that NBAR can operate on the flows before WAE can. For example, in the WCCP interception case, NBAR should be configured on the ingress of the branch router, as shown in Figure 9-35.
WAN
2712
53
Real traffic
IP SLA
WAE 1 WAE 2
A B
WAN
2712
54
Optimization byinline WAAS
NBAR

9-35WAN and Application Optimization Solution Guide
Chapter 9 Branch Design ConsiderationsExample Deployment Models
Figure 9-35 WCCP and Egress NBAR
9.13 Example Deployment ModelsThis section describes a variety of branch office deployment models, varying in size and optimization technologies.
Enterprise Branch Architecture Design Overview provides detailed information about the different types of branches and their deployments:
http://www.cisco.com/application/pdf/en/us/guest/netsol/ns171/c649/ccmigration_09186a00807593b7.pdf
9.13.1 Small Branch Office with Single-Homed SOHO Branch RouterThis model, shown in Figure 9-36, is commonly deployed in SOHO branches. It is simple to configure and maintain.
Figure 9-36 Small Branch Office with Single-Homed Branch Router
In this deployment, the branch router is single homed, and has one interface connected to Corporate HQ over Internet. The branch router is configured with the following:
• Packets arriving on the LAN interface on the branch router are classified using DPI and the DSCP field is marked accordingly.
WC
CP
MQ
C +
NB
AR
IOS router
LAN
Packet flow is not cleartextat this point. And NBAR is notable to classify the traffic forOER or QoS purposes
IP TC
P
payload
2712
55
DC
2712
56
WAE
BranchRouter
WanEdgeRouter
DMVPN
Internet
WCCP
QOSWCCP
BranchSwitch

9-36WAN and Application Optimization Solution Guide
Chapter 9 Branch Design ConsiderationsExample Deployment Models
• TCP packets are redirected to the WAE using WCCP.
• The TCP flows are optimized by WAE and returned to the branch IOS router.
• The WAE preserves the DSCP markings originally done by NBAR (using DPI) on the branch IOS router ingress interface.
• Low latency traffic such as voice is not sent to the WAE, but directly to the WAN interface, which is connected through a DMVPN tunnel to the corporate HQ.
• Return traffic from the WAE is mixed with the non-WAE optimized traffic and outbound QoS gives relative priority to the application that needs it, based on DSCP.
9.13.1.1 Sample Branch Router Configuration
A sample branch router configuration for this deployment model follows:
Current configuration: 8884 bytes!! Last configuration change at 19:37:45 EST Tue Jan 29 2008! NVRAM config last updated at 19:27:30 EST Tue Jan 29 2008!version 12.4service timestamps debug datetime msecservice timestamps log datetime msecno service password-encryptionservice internal!hostname WANOPT-3845-BR1!boot-start-markerboot system flash:c3845-adventerprisek9-mz.124-15.T2.fc3boot-end-marker!logging buffered 16000000enable password lab!no aaa new-modelclock timezone EST -5clock summer-time EDT recurringno network-clock-participate wic 1!!crypto isakmp policy 10 encr 3des authentication pre-share group 2crypto isakmp key cisco address 0.0.0.0 0.0.0.0crypto isakmp keepalive 30!!crypto ipsec transform-set gre_set esp-3des esp-sha-hmac mode transport!crypto ipsec profile gre_prof set transform-set gre_set!!ip wccp 61ip wccp 62ip cef!ip domain list wanopt4.cisco.com

9-37WAN and Application Optimization Solution Guide
Chapter 9 Branch Design ConsiderationsExample Deployment Models
ip domain name wanopt4.cisco.comip host www.cisco.com 60.1.1.100ip name-server 52.1.1.100ip inspect WAAS enable!multilink bundle-name authenticated!voice-card 0 no dspfarm!username cisco privilege 15 secret 5 $1$D.pS$pRcbUNacHbYzs9.BnwDeP0username lab privilege 15 password 0 labarchive log config hidekeys!!controller T1 0/1/0 framing esf linecode b8zs!controller T1 0/1/1 framing esf linecode b8zs channel-group 0 timeslots 1-24vlan internal allocation policy ascending!ip ftp source-interface FastEthernet1/15ip ftp username anonymousip ftp password [email protected]!class-map match-all NBAR_UDP match access-group name UDPclass-map match-any NBAR_FTP match protocol ftpclass-map match-all QoS_HTTP match ip precedence 2class-map type inspect match-any wanopt match protocol tcp match protocol udp match protocol icmpclass-map match-any NBAR_voice match protocol sip match protocol skinnyclass-map match-all QoS_FTP match ip precedence 4class-map match-all QoS_UDP match ip precedence 5class-map match-any NBAR_HTTP match protocol http match protocol secure-httpclass-map match-all QoS_voice match ip precedence 6!!policy-map NBAR class NBAR_HTTP set dscp cs2 class NBAR_UDP set dscp cs5 class NBAR_voice set dscp cs6 class NBAR_FTP set dscp cs4

9-38WAN and Application Optimization Solution Guide
Chapter 9 Branch Design ConsiderationsExample Deployment Models
class class-default set ip precedence 3policy-map type inspect fromOutside class type inspect wanopt inspect class class-defaultpolicy-map QoS class QoS_HTTP bandwidth percent 25 class QoS_UDP bandwidth percent 15 class QoS_voice priority percent 10 class QoS_FTP bandwidth percent 10 class class-default bandwidth percent 15policy-map type inspect toOutside class type inspect wanopt inspect class class-default!!interface Loopback0 ip address 10.0.0.161 255.255.255.255!interface Tunnel1 ip address 172.20.1.2 255.255.255.0 no ip redirects ip mtu 1400 ip wccp 62 redirect in ip flow ingress ip nhrp authentication nsite ip nhrp map 172.20.1.254 10.18.101.2 ip nhrp map multicast 10.18.101.2 ip nhrp network-id 101 ip nhrp holdtime 300 ip nhrp nhs 172.20.1.254 ip nhrp cache non-authoritative ip nhrp shortcut zone-member security outside ip tcp adjust-mss 1360 tunnel source Serial0/0/0 tunnel mode gre multipoint tunnel protection ipsec profile gre_prof!interface GigabitEthernet0/0 description To AGILENT via WANOPT-6500-MAIN1:G1/25 ip address 10.19.1.1 255.255.255.0 ip wccp 61 redirect inip flow ingressload-interval 30 duplex full speed 1000 media-type rj45 service-policy input NBAR!interface GigabitEthernet0/1 description To CAT35k-BrMAN-1:F0/1 ip address 100.1.1.161 255.255.255.0 duplex full speed 100 media-type rj45 ntp broadcast client

9-39WAN and Application Optimization Solution Guide
Chapter 9 Branch Design ConsiderationsExample Deployment Models
!interface Serial0/0/0 description To WANOPT-7206-INTERNET:S5/0:0 ip address 10.18.1.2 255.255.255.0 ip flow ingress load-interval 30 service-policy output QoS!interface Serial0/1/1:0 no ip address shutdown!interface FastEthernet1/0 duplex full speed 100!interface FastEthernet1/1 duplex full speed 100!interface FastEthernet1/2 duplex full speed 100!interface FastEthernet1/3 duplex full speed 100!interface FastEthernet1/4 duplex full speed 100!interface FastEthernet1/5 duplex full speed 100!interface FastEthernet1/6 duplex full speed 100!interface FastEthernet1/7 duplex full speed 100!interface FastEthernet1/8 duplex full speed 100!interface FastEthernet1/9 duplex full speed 100!interface FastEthernet1/10 duplex full speed 100!interface FastEthernet1/11 duplex full speed 100!interface FastEthernet1/12 description To CAT6K-MAIN:G1/20 no switchport no ip address

9-40WAN and Application Optimization Solution Guide
Chapter 9 Branch Design ConsiderationsExample Deployment Models
shutdown duplex full speed 100!interface FastEthernet1/13 description To CAT6K-MAIN:G1/18 no switchport no ip address shutdown duplex full speed 100!interface FastEthernet1/14 description To CAT6K-MAIN:G1/16 no switchport no ip address duplex full speed 100!interface FastEthernet1/15 no switchport no ip address ip tcp adjust-mss 1260 load-interval 30 duplex full speed 100!interface GigabitEthernet1/0!interface Integrated-Service-Engine4/0 ip address 10.18.51.1 255.255.255.0 ip flow ingress service-module ip address 10.18.51.2 255.255.255.0 service-module ip default-gateway 10.18.51.1 no keepalive!interface Vlan1 no ip address!router eigrp 10 passive-interface default no passive-interface Tunnel1 network 10.0.0.161 0.0.0.0 network 10.19.1.0 0.0.0.255 network 172.20.1.0 0.0.0.255 no auto-summary!router bgp 171 no synchronization bgp log-neighbor-changes network 10.0.0.161 mask 255.255.255.255 network 10.17.1.0 mask 255.255.255.0 network 10.18.51.0 mask 255.255.255.0 network 10.19.1.0 mask 255.255.255.0 neighbor 10.17.1.1 remote-as 103 no auto-summary!ip route 0.0.0.0 0.0.0.0 10.18.1.1ip route 100.1.1.22 255.255.255.255 10.18.1.1!ip flow-cache timeout active 1ip flow-export source GigabitEthernet0/0ip flow-export version 9ip flow-export destination 52.1.1.22 9995

9-41WAN and Application Optimization Solution Guide
Chapter 9 Branch Design ConsiderationsExample Deployment Models
ip flow-top-talkers top 10 sort-by bytes!ip http serverip http authentication localip http secure-serverip http timeout-policy idle 60 life 86400 requests 10000!ip sla 1 http get http://www.cisco.com timeout 5000 owner HTTP - 100.1.1.161 tag WANOPT HTTP ECHOip sla schedule 1 life forever start-time now ageout 3600ip sla 3 icmp-echo 60.1.1.100 owner ICMP Echo - 100.1.1.161 - 60.1.1.100 tag WANOPT ICMP ECHOip sla schedule 3 life forever start-time now ageout 3600ip sla 4 dns www.cisco.com name-server 52.1.1.100 timeout 5000 owner DNS - 100.1.1.161 tag WANOPT DNS SLAip sla schedule 4 life forever start-time now ageout 3600logging 100.1.1.104snmp-server community closed RWsnmp-server community open ROsnmp-server community public ROsnmp-server community private RWsnmp-server ifindex persistsnmp-server trap-source GigabitEthernet0/1snmp-server enable traps cnpdsnmp-server host 100.1.1.21 version 2c public!tftp-server flash:c3845-adventerprisek9-mz.124-11.T2!control-plane!!banner login ^C-----------------------------------------------------------------------Cisco Router and Security Device Manager (SDM) is installed on this device.This feature requires the one-time use of the username "cisco"with the password "cisco". The default username and password have a privilege level
Please change these publicly known initial credentials using SDM or the IOS CLI.Here are the Cisco IOS commands.
username <myuser> privilege 15 secret 0 <mypassword>no username cisco
Replace <myuser> and <mypassword> with the username and password you want to use.
For more information about SDM please follow the instructions in the QUICK STARTGUIDE for your router or go to http://www.cisco.com/go/sdm-----------------------------------------------------------------------^C!line con 0 login localline aux 0line 258
9-42WAN and Application Optimization Solution Guide
Chapter 9 Branch Design ConsiderationsExample Deployment Models
no activation-character no exec transport preferred none transport input all transport output pad telnet rlogin lapb-ta mop udptn v120 sshline vty 0 4 exec-timeout 0 0 privilege level 15 password lab login transport input telnet sshline vty 5 15 exec-timeout 0 0 privilege level 15 password lab login transport input telnet sshline vty 16 20 password lab loginline vty 21 30 password cisco login!scheduler allocate 20000 1000ntp clock-period 17179694
!webvpn cef!end
9.13.2 Small Branch Office with Dual-Homed, Single-Tier Branch RouterThis deployment model (shown in Figure 9-37) is similar to the previous one. In this model, the branch router is dual-homed. One branch router exit interfaces is connected to the SP WAN, and the other is connected to the Internet.

9-43WAN and Application Optimization Solution Guide
Chapter 9 Branch Design ConsiderationsExample Deployment Models
Figure 9-37 Small Branch Office with Dual-Homed Router
The following protocols are deployed on the branch router:
• QoS on the exit interface to do congestion avoidance and management
• WCCP on the router to do TCP optimization
• NetFlow on all LAN/WAN links
• PfR on the router to do path optimization
• DMVPN tunnel over Internet to the Corporate HQ to provide security
9.13.2.1 Sample Branch Router Configuration
Current configuration: 8234 bytes!! Last configuration change at 10:49:16 EST Wed Jan 30 2008! NVRAM config last updated at 10:49:38 EST Wed Jan 30 2008!upgrade fpd autoversion 12.4no service padservice timestamps debug datetime msec localtimeservice timestamps log datetime localtimeno service password-encryption!hostname WANOPT-7206-BR6!boot-start-markerboot system flash disk0:c7200-adventerprisek9-mz.124-15.T2.fc3boot-end-marker!logging buffered 16000000no logging consoleenable secret 5 $1$qmlj$FYkMGt1ksVs.eWxvzphXM1enable password cisco!no aaa new-modelclock timezone EST -5clock summer-time EDT recurring
2712
57
DC
WAE
BranchRouter
WanEdgeRouter
DMVPN
Internet
SP-WAN DC
WanEdgeRouter
PfRWCCP
NetFlow
NetFlow
PfRQOS
WCCPNetFlow
BranchSwitch

9-44WAN and Application Optimization Solution Guide
Chapter 9 Branch Design ConsiderationsExample Deployment Models
ip wccp 61ip wccp 62ip cef!!ip domain list wanopt4.cisco.comip domain name wanopt4.cisco.comip name-server 52.1.1.100!multilink bundle-name authenticated!!key chain oer-key
key 1 key-string WANOPT!!oer master policy-rules delayPolicy logging ! border 10.0.0.172 key-chain oer-key interface Tunnel1 external interface Serial6/1:0 external interface FastEthernet3/1 internal no max range receive mode monitor fast no resolve delay no resolve utilization ! active-probe echo 60.1.1.101!oer border logging local Loopback0 master 10.0.0.172 key-chain oer-key!!!!crypto isakmp policy 10 encr 3des authentication pre-share group 2crypto isakmp key cisco address 0.0.0.0 0.0.0.0crypto isakmp keepalive 30!!crypto ipsec transform-set gre_set esp-3des esp-sha-hmac mode transport!crypto ipsec profile gre_prof set transform-set gre_set
!!username lab privilege 15 password 0 labarchive log config hidekeys!!controller T1 6/0 framing esf linecode b8zs

9-45WAN and Application Optimization Solution Guide
Chapter 9 Branch Design ConsiderationsExample Deployment Models
channel-group 0 timeslots 1-24!controller T1 6/1 framing esf linecode b8zs channel-group 0 timeslots 1-24!ip ftp username anonymousip ftp password [email protected]!class-map match-all NBAR_UDP match access-group name UDPclass-map match-any NBAR_FTP match protocol ftpclass-map match-all QoS_HTTP match ip precedence 2class-map match-any NBAR_voice match protocol sip match protocol skinnyclass-map match-all QoS_FTP match ip precedence 4class-map match-all QoS_UDP match ip precedence 5class-map match-any NBAR_HTTP match protocol http match protocol secure-httpclass-map match-all QoS_voice match ip precedence 6!!policy-map QoS class QoS_HTTP bandwidth percent 25 class QoS_UDP bandwidth percent 15 class QoS_voice priority percent 10 class QoS_FTP bandwidth percent 10 class class-default bandwidth percent 15policy-map tunnel class class-default shape average percent 75 service-policy QoSpolicy-map NBAR class NBAR_HTTP set dscp cs2 class NBAR_UDP set dscp cs5 class NBAR_voice set dscp cs6 class NBAR_FTP set dscp cs4 class class-default set dscp cs3policy-map fromWAE class QoS_HTTP class QoS_UDP class class-default!!!interface Loopback0

9-46WAN and Application Optimization Solution Guide
Chapter 9 Branch Design ConsiderationsExample Deployment Models
ip address 10.0.0.172 255.255.255.255!interface Tunnel1 ip address 172.20.1.1 255.255.255.0 no ip redirects ip mtu 1400 ip flow ingress ip nhrp authentication nsite ip nhrp map 172.20.1.254 10.18.101.2 ip nhrp map multicast 10.18.101.2 ip nhrp network-id 101 ip nhrp holdtime 300 ip nhrp nhs 172.20.1.254 ip nhrp cache non-authoritative ip nhrp shortcut ip tcp adjust-mss 1360 load-interval 30 QoS pre-classify tunnel source Serial6/0:0.1 tunnel mode gre multipoint tunnel protection ipsec profile gre_prof!interface FastEthernet0/0 description To CAT6K-MAIN:G1/31 no ip address no ip route-cache cef shutdown duplex full!interface FastEthernet2/0 no ip address shutdown duplex half!interface FastEthernet3/0 description To WANOPT-WAE512-BR6 via WANOPT-6500-MAIN1:G1/5 ip address 10.18.56.1 255.255.255.0 ip flow ingress load-interval 30 duplex full speed 100!interface FastEthernet3/1 description To WANOPT-6500-MAIN1:G1/31 ip address 10.19.6.1 255.255.255.0 ip wccp 61 redirect in ip nbar protocol-discovery ip flow ingress load-interval 30 duplex full speed 100 service-policy input NBAR!interface Ethernet5/0 description To CAT35k-BrMAN-1:F0/7 ip address 100.1.1.172 255.255.255.0 duplex full ntp broadcast client!interface Ethernet5/1 no ip address no ip route-cache cef no ip route-cache shutdown

9-47WAN and Application Optimization Solution Guide
Chapter 9 Branch Design ConsiderationsExample Deployment Models
duplex half!interface Ethernet5/2 no ip address no ip route-cache cef no ip route-cache shutdown duplex half!interface Ethernet5/3 no ip address no ip route-cache cef no ip route-cache shutdown duplex half!interface Ethernet5/4 no ip address no ip route-cache cef no ip route-cache shutdown duplex half!interface Ethernet5/5 no ip address no ip route-cache cef no ip route-cache shutdown duplex half!interface Ethernet5/6 no ip address no ip route-cache cef no ip route-cache shutdown duplex half!interface Ethernet5/7 no ip address no ip route-cache cef no ip route-cache shutdown duplex half!interface Serial6/0:0 description To WANOPT-7206-INTERNET-PE:S3/1:0 no ip address encapsulation frame-relay load-interval 30 no keepalive!interface Serial6/0:0.1 point-to-point ip address 10.18.6.2 255.255.255.0 ip wccp 62 redirect in ip flow ingress snmp trap link-status frame-relay interface-dlci 101 service-policy output tunnel!interface Serial6/1:0 description To WANOPT-7206-MPLS-PE:S3/1:0 ip address 10.17.6.2 255.255.255.0 ip wccp 62 redirect in ip flow ingress

9-48WAN and Application Optimization Solution Guide
Chapter 9 Branch Design ConsiderationsExample Deployment Models
load-interval 30 service-policy output QoS!router eigrp 10 passive-interface default no passive-interface Tunnel1 network 10.0.0.172 0.0.0.0 network 10.18.56.0 0.0.0.255 network 10.19.6.0 0.0.0.255 network 172.20.1.0 0.0.0.255 no auto-summary!router bgp 176 no synchronization bgp log-neighbor-changes network 10.17.6.0 mask 255.255.255.0 network 10.18.56.0 mask 255.255.255.0 network 10.19.6.0 mask 255.255.255.0 neighbor 10.17.6.1 remote-as 103 no auto-summary!ip route 0.0.0.0 0.0.0.0 10.18.6.1ip route 0.0.0.0 0.0.0.0 10.17.6.1 100no ip http serverno ip http secure-server!ip flow-cache timeout active 1ip flow-export source FastEthernet3/1ip flow-export version 5ip flow-export destination 52.1.1.22 9995!!ip access-list extended UDP permit udp any any deny ip any anyip access-list extended noHTTP permit ip any any dscp cs3 permit ip any any dscp cs5 deny ip any anyip access-list extended onlyHTTP_ip permit ip any host 60.1.1.100 log permit ip host 60.1.1.100 any log deny ip any anyip access-list extended onlyRT permit ip 10.19.0.0 0.0.255.255 60.1.1.0 0.0.0.255 dscp cs5ip access-list extended onlyRealTime permit ip any any dscp cs5ip access-list extended onlyTCP permit ip any any dscp cs2ip access-list extended others permit ip any any dscp cs3 permit ip any any dscp cs5ip access-list extended permitList1 permit ip any any dscp cs3!!ip prefix-list onlyHTTP seq 5 permit 60.1.1.100/32ip sla logging trapsip sla 275 http get http://www.cisco.com timeout 5000 owner HTTP - 100.1.1.172 tag WANOPT HTTP ECHOip sla schedule 275 life forever start-time now ageout 3600

9-49WAN and Application Optimization Solution Guide
Chapter 9 Branch Design ConsiderationsExample Deployment Models
ip sla 277 icmp-echo 60.1.1.100 owner ICMP Echo - 100.1.1.172 - 60.1.1.100 tag WANOPT ICMP ECHOip sla schedule 277 life forever start-time now ageout 3600ip sla 278 dns www.cisco.com name-server 52.1.1.100 timeout 5000 owner DNS - 100.1.1.172 tag WANOPT DNS Echoip sla schedule 278 life forever start-time now ageout 3600logging alarm informationallogging 100.1.1.104snmp-server community closed RWsnmp-server community open ROsnmp-server community public ROsnmp-server community private RWsnmp-server ifindex persistsnmp-server host 100.1.1.21 version 2c public!!!!!ttycap detected \at '^' marker.!oer-map delayPolicy 10 match traffic-class prefix-list onlyHTTP set mode select-exit best set delay threshold 55 set mode route control set mode monitor fast set resolve delay priority 1 variance 5 no set resolve utilization set probe frequency 2!control-plane!!gatekeeper shutdown!!line con 0 exec-timeout 0 0 stopbits 1line aux 0 stopbits 1line vty 0 4 exec-timeout 0 0 password lab loginline vty 5 20 password lab loginline vty 21 30 password cisco login!exception data-corruption buffer truncatentp clock-period 17179708
!

9-50WAN and Application Optimization Solution Guide
Chapter 9 Branch Design ConsiderationsExample Deployment Models
webvpn cef!end
9.13.3 Medium Branch Office with Dual-Homed, Dual-Tiered Branch RoutersA typical medium Branch Office has a number of users on the LAN. To allow for resiliency and scaling, the branch network is designed with two branch routers. Each router is dual homed, with one link connected to SP-WAN and the other is connected to Internet. Such a deployment is shown in Figure 9-38.
Figure 9-38 Typical Medium Branch Office
The branch routers have the following protocols deployed:
• NetFlow on all LAN/WAN links
• NBAR to do protocol discovery and QoS to perform marking
• QoS on the exit interface to perform congestion avoidance and management
• WCCP on the router to perform TCP optimization
• PfR on the routers to perform path optimization. One branch router doubles as both Master Controller and Border Router
• (Optional) DMVPN tunnel over Internet to the corporate HQ to provide security
9.13.3.1 Sample Branch Router Configuration (PfR-Master Controller/Border Router)
Current configuration: 7977 bytes!! Last configuration change at 13:14:35 EST Wed Jan 30 2008! NVRAM config last updated at 13:17:03 EST Wed Jan 30 2008!upgrade fpd autoversion 12.4
2712
58
To DC
To DC
BR2
MC/BR1 WanEdgeRouter
WanEdgeRouter
WAE
PfR, QOSWCCP
NetFlow
BranchSwitch
SP-WAN
PfR, QOSWCCP
NetFlow
PfR, QOSNBAR, WCCP
NetFlow
Internet

9-51WAN and Application Optimization Solution Guide
Chapter 9 Branch Design ConsiderationsExample Deployment Models
no service padservice timestamps debug datetime msecservice timestamps log datetime msecno service password-encryption!hostname WANOPT-7206-BR5!boot-start-markerboot system flash disk0:c7200-adventerprisek9-mz.124-15.T2.fc3boot-end-marker!logging buffered 16000000no logging consoleenable password lab!no aaa new-modelclock timezone EST -5clock summer-time EDT recurringip wccp 61ip wccp 62ip cef!ip domain list wanopt4.cisco.comip domain name wanopt4.cisco.comip name-server 52.1.1.100!multilink bundle-name authenticated!!key chain oer-key key 1 key-string WANOPT!!oer master policy-rules delayPolicy logging ! border 10.0.0.171 key-chain oer-key interface Serial6/1:0 external interface Serial6/0:0 external interface FastEthernet3/1.3051 internal interface FastEthernet3/1.4051 internal ! border 10.0.0.165 key-chain oer-key interface Serial0/2/1:0 external interface Serial0/2/0:0 external interface GigabitEthernet0/0.4051 internal interface GigabitEthernet0/0.3051 internal ! learn delay periodic-interval 0 monitor-period 1 prefixes 1000 aggregation-type prefix-length 32 no max range receive mode monitor fast no resolve delay no resolve utilization ! active-probe echo 60.1.1.100!oer border

9-52WAN and Application Optimization Solution Guide
Chapter 9 Branch Design ConsiderationsExample Deployment Models
logging local Loopback0 master 10.0.0.171 key-chain oer-key!!username lab privilege 15 password 0 labarchive log config hidekeys!!controller T1 6/0 framing esf linecode b8zs channel-group 0 timeslots 1-24!controller T1 6/1 framing esf linecode b8zs channel-group 0 timeslots 1-24!controller T1 6/2 framing esf linecode b8zs channel-group 0 timeslots 1-24!controller T1 6/3 framing esf linecode b8zs channel-group 0 timeslots 1-24!ip ftp source-interface Ethernet5/2ip ftp username anonymousip ftp password [email protected]!class-map match-all NBAR_UDP match access-group name UDPclass-map match-any NBAR_FTP match protocol ftpclass-map match-all QoS_HTTP match ip precedence 2class-map match-any NBAR_voice match protocol sip match protocol skinnyclass-map match-all QoS_FTP match ip precedence 4class-map match-all QoS_UDP match ip precedence 5class-map match-any NBAR_HTTP match protocol http match protocol secure-httpclass-map match-all QoS_voice match ip precedence 6class-map match-all ramki!!policy-map NBAR class NBAR_HTTP set dscp cs2 class NBAR_UDP set dscp cs5 class NBAR_voice set dscp cs6 class NBAR_FTP

9-53WAN and Application Optimization Solution Guide
Chapter 9 Branch Design ConsiderationsExample Deployment Models
set dscp cs4 class class-default set dscp cs3policy-map QoS class QoS_HTTP bandwidth percent 25 class QoS_UDP bandwidth percent 15 class QoS_voice priority percent 10 class QoS_FTP bandwidth percent 10 class class-default bandwidth percent 15!!interface Loopback0 ip address 10.0.0.171 255.255.255.255 no ip route-cache cef no ip route-cache!interface FastEthernet0/0 description To CAT6K-MAIN:g1/43 no ip address no ip route-cache cef no ip route-cache shutdown duplex full!interface FastEthernet3/0 description To WANOPT-WAE512-BR5 via WANOPT-6500-MAIN1:G1/3 ip address 10.18.55.65 255.255.255.192 ip flow ingress duplex full speed 100!interface FastEthernet3/1 description To AGILENT via WANOPT-6500-MAIN1:G1/30 no ip address load-interval 30 duplex full speed 100!interface FastEthernet3/1.3051 encapsulation dot1Q 3051 ip address 10.19.5.2 255.255.255.0 ip wccp 61 redirect in ip flow ingress glbp 1 ip 10.19.5.1 glbp 1 weighting 80 glbp 1 load-balancing weighted!interface FastEthernet3/1.4051 encapsulation dot1Q 4051 ip address 110.19.19.1 255.255.255.0 ip wccp 61 redirect in ip flow ingress shutdown service-policy input NBAR!interface Ethernet5/0 description To CAT35k-BrMAN-1:F0/6 ip address 100.1.1.171 255.255.255.0 no ip route-cache cef

9-54WAN and Application Optimization Solution Guide
Chapter 9 Branch Design ConsiderationsExample Deployment Models
no ip route-cache duplex full ntp broadcast client!interface Ethernet5/1 description To WANOPT-6500-MAIN1:G1/34 ip address 10.55.55.2 255.255.255.252 duplex full!interface Ethernet5/2 description To CAT6K-MAIN:g1/39 no ip address no ip route-cache cef shutdown duplex full!interface Ethernet5/3 description To CAT6K-MAIN:g1/41 no ip address no ip route-cache cef no ip route-cache shutdown duplex full!interface Serial6/0:0 description To WANOPT-7206-INTERNET-PE:S3/0:0 ip address 10.18.5.66 255.255.255.192 ip wccp 62 redirect in ip flow ingress load-interval 30 service-policy output QoS!interface Serial6/1:0 description To WANOPT-7206-MPLS-PE:S3/0:0 ip address 10.17.5.66 255.255.255.192 ip wccp 62 redirect in ip flow ingress load-interval 30 service-policy output QoS!interface Serial6/2:0 no ip address no ip route-cache cef no ip route-cache!interface Serial6/3:0 no ip address no ip route-cache cef no ip route-cache!!router bgp 175 no synchronization bgp log-neighbor-changes network 10.0.0.171 mask 255.255.255.255 network 10.17.5.64 mask 255.255.255.192 network 10.18.55.64 mask 255.255.255.192 network 10.19.5.0 mask 255.255.255.0 network 10.55.55.0 mask 255.255.255.0 network 110.19.19.0 mask 255.255.255.0 neighbor 10.17.5.65 remote-as 103 neighbor 10.55.55.1 remote-as 175 no auto-summary!

9-55WAN and Application Optimization Solution Guide
Chapter 9 Branch Design ConsiderationsExample Deployment Models
ip route 0.0.0.0 0.0.0.0 10.18.5.65ip route 0.0.0.0 0.0.0.0 10.17.5.65 50no ip http serverno ip http secure-server!ip flow-cache timeout active 1ip flow-export source FastEthernet3/1.3051ip flow-export version 5ip flow-export destination 52.1.1.22 9995!!ip access-list extended UDP permit udp any any deny ip any anyip access-list extended noHTTP permit ip any any dscp cs3 permit ip any any dscp cs5 deny ip any anyip access-list extended only35 permit ip any any precedence critical log permit ip any any precedence flash log permit ip any any precedence immediate log permit ip any any logip access-list extended onlyRealTime permit ip any any dscp cs5ip access-list extended ramki!!ip prefix-list onlyHTTP seq 5 permit 60.1.1.100/32ip sla 1 http get http://www.cisco.com timeout 5000 owner HTTP - 100.1.1.171 tag WANOPT HTTP ECHOip sla schedule 1 life forever start-time now ageout 3600ip sla 3 icmp-echo 60.1.1.100 owner ICMP Echo - 100.1.1.171 - 60.1.1.100 tag WANOPT ICMP ECHOip sla schedule 3 life forever start-time now ageout 3600ip sla 4 dns www.cisco.com name-server 52.1.1.100 timeout 5000 owner DNS - 100.1.1.171 tag WANOPT DNSip sla schedule 4 life forever start-time now ageout 3600logging alarm informationallogging 100.1.1.104access-list 1 permit 10.19.5.0 0.0.0.255 logaccess-list 1 permit 110.19.5.0 0.0.0.255 logaccess-list 1 permit any logaccess-list 2 permit 10.19.5.0 0.0.0.255access-list 2 deny anyaccess-list 10 permit 110.19.5.0 0.0.0.255access-list 10 permit 10.18.55.0 0.0.0.255access-list 101 permit ip any 10.19.5.0 0.0.0.255 logaccess-list 101 permit ip any 110.19.5.0 0.0.0.255 logaccess-list 101 permit ip any any logsnmp-server community closed RWsnmp-server community open ROsnmp-server community public ROsnmp-server community private RWsnmp-server ifindex persistsnmp-server host 100.1.1.21 version 2c public

9-56WAN and Application Optimization Solution Guide
Chapter 9 Branch Design ConsiderationsExample Deployment Models
!!oer-map delayPolicy 10 match traffic-class prefix-list onlyHTTP set mode select-exit best set delay threshold 55 set mode route control set mode monitor fast set resolve delay priority 1 variance 20 set probe frequency 10!control-plane!!gatekeeper shutdown!!line con 0 exec-timeout 0 0 stopbits 1line aux 0 stopbits 1line vty 0 4 exec-timeout 0 0 password lab loginline vty 5 20 password lab loginline vty 21 30 password cisco login!ntp clock-period 17180110
!webvpn cef!end
9.13.3.2 Sample Configuration of Branch Router (PfR-Border Router)
Current configuration: 5321 bytes!! Last configuration change at 13:14:52 EST Wed Jan 30 2008! NVRAM config last updated at 13:12:12 EST Wed Jan 30 2008!version 12.4service timestamps debug datetime msec localtimeservice timestamps log datetime msec localtimeno service password-encryption!hostname WANOPT-3825-BR5!boot-start-markerboot system flash:c3825-adventerprisek9-mz.124-15.T2.fc3boot-end-marker!enable password lab!no aaa new-model

9-57WAN and Application Optimization Solution Guide
Chapter 9 Branch Design ConsiderationsExample Deployment Models
clock timezone EST -5clock summer-time edt recurringno network-clock-participate wic 2!!ip wccp 61ip wccp 62ip cef!!no ip domain lookupip host aswan 24.1.1.1!multilink bundle-name authenticated!voice-card 0 no dspfarm!!key chain oer-key key 1 key-string WANOPT!!oer border logging local Loopback0 master 10.0.0.171 key-chain oer-key!!archive log config hidekeys!!controller T1 0/2/0 framing esf linecode b8zs channel-group 0 timeslots 1-24!controller T1 0/2/1 framing esf linecode b8zs channel-group 0 timeslots 1-24!!class-map match-all NBAR_UDP match access-group name UDPclass-map match-any NBAR_FTP match protocol ftpclass-map match-all QoS_HTTP match ip precedence 2class-map match-any QCLASS_COS1 match dscp 47 match dscp efclass-map match-any NBAR_voice match protocol sip match protocol skinnyclass-map match-all QoS_FTP match ip precedence 4class-map match-all QoS_UDP match ip precedence 5class-map match-any NBAR_HTTP match protocol http

9-58WAN and Application Optimization Solution Guide
Chapter 9 Branch Design ConsiderationsExample Deployment Models
match protocol secure-httpclass-map match-all QoS_voice match ip precedence 6!!policy-map NBAR class NBAR_HTTP set dscp cs2 class NBAR_UDP set dscp cs5 class NBAR_voice set dscp cs6 class NBAR_FTP set dscp cs4 class class-default set dscp cs3policy-map QoS class QoS_HTTP bandwidth percent 25 class QoS_UDP bandwidth percent 15 class QoS_voice priority percent 10 class QoS_FTP bandwidth percent 10 class class-default bandwidth percent 15!!interface Loopback0 ip address 10.0.0.165 255.255.255.255!interface GigabitEthernet0/0 description To AGILENT via WANOPT-6500-MAIN1:G1/29 no ip address load-interval 30 duplex full speed 1000 media-type rj45!interface GigabitEthernet0/0.3051 encapsulation dot1Q 3051 ip address 10.19.5.3 255.255.255.0 ip flow ingress glbp 1 ip 10.19.5.1 glbp 1 weighting 20 glbp 1 load-balancing weighted!interface GigabitEthernet0/0.3053 encapsulation dot1Q 3053 ip address 10.18.55.68 255.255.255.192!interface GigabitEthernet0/0.3055 encapsulation dot1Q 3055 ip address 10.55.55.1 255.255.255.252!interface GigabitEthernet0/0.4051 encapsulation dot1Q 4051 ip address 110.19.5.3 255.255.255.0 ip wccp 61 redirect in ip flow ingress shutdown glbp 2 ip 110.19.5.1 glbp 2 load-balancing weighted

9-59WAN and Application Optimization Solution Guide
Chapter 9 Branch Design ConsiderationsExample Deployment Models
service-policy input NBAR!interface GigabitEthernet0/1 description To CAT35k-BrMAN-1:F0/5 ip address 100.1.1.165 255.255.255.0 load-interval 30 duplex full speed 100 media-type rj45 ntp broadcast client no keepalive!interface Serial0/2/0:0 description To WANOPT-7206-INTERNET-PE:S5/4:0 ip address 10.18.5.2 255.255.255.192 ip wccp 62 redirect in ip flow ingress encapsulation frame-relay frame-relay map ip 10.18.5.1 101 broadcast service-policy output QoS!interface Serial0/2/1:0 description To WANOPT-7206-MPLS-PE:S5/4:0 ip address 10.17.5.2 255.255.255.192 ip wccp 62 redirect in ip flow ingress service-policy output QoS!interface Integrated-Service-Engine2/0 ip address 10.18.55.1 255.255.255.192 shutdown service-module external ip address 10.18.55.67 255.255.255.192 service-module ip address 10.18.55.2 255.255.255.192 service-module ip default-gateway 10.18.55.65 no keepalive!router bgp 175 no synchronization bgp log-neighbor-changes network 10.0.0.165 mask 255.255.255.255 network 10.17.5.0 mask 255.255.255.192 network 10.18.55.64 mask 255.255.255.192 network 10.19.5.0 mask 255.255.255.0 network 10.55.55.0 mask 255.255.255.0 neighbor 10.17.5.1 remote-as 103 neighbor 10.55.55.2 remote-as 175 no auto-summary!ip route 0.0.0.0 0.0.0.0 10.18.5.1ip route 0.0.0.0 0.0.0.0 10.17.5.1 50!!no ip http serverno ip http secure-server!ip access-list extended UDP permit udp any any deny ip any any!!ip prefix-list only110 seq 5 permit 110.19.19.2/32ip sla 1 http get http://www.cisco.com timeout 5000

9-60WAN and Application Optimization Solution Guide
Chapter 9 Branch Design ConsiderationsExample Deployment Models
owner http - 60.1.1.100 tag Ciscoip sla schedule 1 life forever start-time now ageout 3600logging 100.1.1.104access-list 102 permit ip 10.19.5.0 0.0.0.255 60.1.1.0 0.0.0.255access-list 102 deny ip any anysnmp-server community closed RWsnmp-server community open ROsnmp-server community public ROsnmp-server community private RWsnmp-server ifindex persistsnmp-server host 100.1.1.21 version 2c public!!!control-plane!!!alias exec sib show ip interface briefprivilege exec level 0 terminal monitorprivilege exec level 0 terminal!line con 0 exec-timeout 0 0line aux 0line 130 no activation-character no exec transport preferred none transport input all transport output lat pad telnet rlogin lapb-ta mop udptn v120 sshline vty 0 4 exec-timeout 0 0 password lab login autocommand term mon autocommand-options nohangup!scheduler allocate 20000 1000ntp clock-period 17179645
!webvpn cef!end
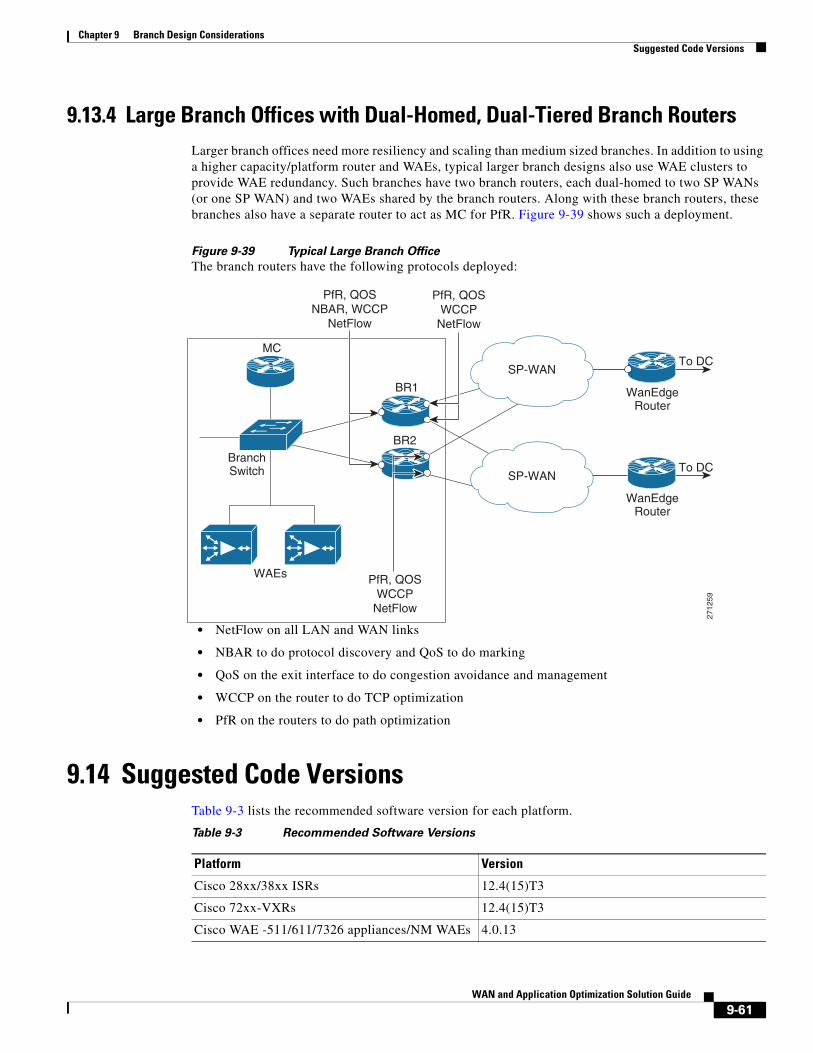
9-61WAN and Application Optimization Solution Guide
Chapter 9 Branch Design ConsiderationsSuggested Code Versions
9.13.4 Large Branch Offices with Dual-Homed, Dual-Tiered Branch RoutersLarger branch offices need more resiliency and scaling than medium sized branches. In addition to using a higher capacity/platform router and WAEs, typical larger branch designs also use WAE clusters to provide WAE redundancy. Such branches have two branch routers, each dual-homed to two SP WANs (or one SP WAN) and two WAEs shared by the branch routers. Along with these branch routers, these branches also have a separate router to act as MC for PfR. Figure 9-39 shows such a deployment.
Figure 9-39 Typical Large Branch Office
The branch routers have the following protocols deployed:
• NetFlow on all LAN and WAN links
• NBAR to do protocol discovery and QoS to do marking
• QoS on the exit interface to do congestion avoidance and management
• WCCP on the router to do TCP optimization
• PfR on the routers to do path optimization
9.14 Suggested Code VersionsTable 9-3 lists the recommended software version for each platform.
2712
59
To DC
To DC
BR2
BR1 WanEdgeRouter
WanEdgeRouter
MC
WAEs PfR, QOSWCCP
NetFlow
BranchSwitch SP-WAN
PfR, QOSWCCP
NetFlow
PfR, QOSNBAR, WCCP
NetFlow
SP-WAN
Table 9-3 Recommended Software Versions
Platform Version
Cisco 28xx/38xx ISRs 12.4(15)T3
Cisco 72xx-VXRs 12.4(15)T3
Cisco WAE -511/611/7326 appliances/NM WAEs 4.0.13

9-62WAN and Application Optimization Solution Guide
Chapter 9 Branch Design ConsiderationsData Center Design
9.15 Data Center DesignContent is consolidated for user access in the data center. A typical data center design, shown in Figure 9-40) comprises a core, aggregation, and access layer.
• The Core/WAN focuses on bringing the packets into the data center reliably and quickly.
• The aggregation layer, where the network services are located, often includes firewall, load balancing, and SSL offload.
• The access layer typically includes web servers, databases, and middleware.
Figure 9-40 Typical Data Center Design
When it comes to the specific insertion of WAN optimization components, the WAAS cluster is placed at the WAN edge/core or the aggregation layer. This WAAS cluster placement can determine which servers traffic can be optimized for or affect the network services.
If the WAAS cluster is located closer to the WAN, the cluster can offer optimized content from many servers. On the other hand, if the WAAS cluster is located at the aggregation layer, it can only optimize content from the servers in its aggregation module.
As far as network services, the DC traffic could be optimized. This could affect how firewalls or other network services at the edge of the DC inspect traffic. These services might require code changes or configuration changes. Network services that only see unoptimized traffic would not require changes.
9.15.1 FWSMThe Firewall Services Module (FWSM) is a high-speed, integrated firewall module for Cisco Catalyst 6500 switches. FWSM can be deployed in pairs to provide intrachassis or interchassis stateful failover services to help ensure resilient network protection for the data center.
DC Core
Aggregation
Access
2712
60

9-63WAN and Application Optimization Solution Guide
Chapter 9 Branch Design ConsiderationsData Center Design
9.15.1.1 FWSM Deployment Options
The FWSM deployment options are:
• Downstream of the DC WAAS
– Unoptimized traffic - inspects L4 and L7
• Upstream of the DC WAAS
– Inspects optimized and non-optimized traffic
– Optimized traffic - inspects only TCP at L4
– Unoptimized traffic - inspects L4 and L7
WAAS alters the original TCP session through Transport Flow Optimization (TFO) and application data though DRE. DRE helps to improve efficiency and reduces unnecessary bandwidth consumption. On the other hand, TFO optimizes TCP to enable better performance and efficiency in WAN environments. FWSM introduced enhancements in 3.2(1) to handle TCP traffic optimized by WAAS. With these enhancements, L4 inspection can now be performed on a WAAS optimized TCP session. However, FWSM features that proxy the TCP connection stop WAAS from optimizing flows.
9.15.1.2 TCP Options
The WAAS implementation can decide which TCP connection to optimize on a TCP port basis. WAAS typically does not optimize TCP control channels (FTP control channel, for example). Any session it does optimize has the 0x21 option. When the option is seen, FWSM inspects at L4. Connections that are not optimized do not have option 0x21. Therefore, FWSM can apply all inspections to the connections.
9.15.1.3 Sequence Number Change
The initial SYN packet from the client is forwarded to the server with no changes in sequence number. The branch WAAS device intercepts this session and attaches TCP option 0x21 to the SYN. The DC WAAS device later intercepts this session and responds to the branch WAAS after the DC WAAS sees a SYN-ACK from the server side.
The branch WAAS device bumps up the TCP sequence number by 2^31 when it sends the final ACK of the TCP handshake to the server side. This ACK also contains option 0x21. FWSM then knows that the session will be optimized.
9.15.1.4 Configuration
FWSM uses Modular Policy Framework (MPF) to configure which class of traffic must be inspected. MPF uses class maps to identify traffic and policy maps are used to apply actions. MPF policy map actions include TCP connection limits/timeouts and application inspection.
The following configuration includes a default class map that the FWSM uses in the default global policy. It is called inspection_default and matches the default inspection traffic. To enable WAAS application inspection, use the inspect waas command.
class-map inspection_default match default-inspection-traffic!policy-map global_policy class inspection_default inspect waas!

9-64WAN and Application Optimization Solution Guide
Chapter 9 Branch Design ConsiderationsData Center Design
service-policy global_policy global
The inspect waas command, when applied to the default inspection class, checks all TCP traffic for option 0x21 and handles the 2G Sequence Space Bump. TCP option SACK, timestamp and window scale are also allowed even if TCP SYN/SYN-ACK did not contain those options. For WAAS optimized flows, FWSM uses a window scale of 7.
9.15.1.5 Show Commands
The show conn command displays the connection state for the designated connection type. A W indicates that the TCP flow is a WAAS Session.
wanopt-fwsm1/NSITE# show conn79 in use, 130 most used Network Processor 1 connectionsTCP out 10.19.7.140:62645 in 60.1.1.100:80 idle 0:00:00 Bytes 2647 FLAGS - UBfOIW Network Processor 2 connectionsTCP out 10.19.7.140:62646 in 60.1.1.100:80 idle 0:00:00 Bytes 4623 FLAGS - UBOIWTCP out 10.19.7.140:62647 in 60.1.1.100:80 idle 0:00:00 Bytes 2340 FLAGS - FRdUBfrOIWTCP out 10.19.7.140:62648 in 60.1.1.100:80 idle 0:00:00 Bytes 5844 FLAGS – UBOIW
9.15.2 WAAS Catalyst 6500 Load BalancingWCCPv2 is a protocol used in the data center to send relevant TCP traffic to the Core WAAS cluster. The WAAS cluster is positioned on a common VLAN at either the WAN edge or the at the distribution switch layer.
WCCPv2 introduced several concepts to improve traffic forwarding:
• WCCP routers and clients were bundled together in service groups with multiple routers per service group being supported
• Protocol messages were allowed to use multicast
• Return traffic by clients was supported as well as the negotiation of forwarding, assignment, and return methods between the router and WCCP
• Mask assignment with L2 forwarding and return were introduced allowing hardware forwarding of traffic packets
WAAS service groups 61 and 62:
• Service group 61—Redirects TCP packets to a WAE device and distributes load based on the source IP address of the flow
• Service group 62—Redirects packets to a WAE device and distributes load based on the IP destination address of the flow.
WCCP WAE devices leverage a combination of both groups so all traffic is redirected to the WAEs.
Refer to Enterprise Data Center Wide Area Application Services Design Guide for design guidance and best practices for WAAS implementations in enterprise data centers:
http://www.cisco.com/application/pdf/en/us/guest/netsol/ns377/c649/ccmigration_09186a008081c7da.pdf

9-65WAN and Application Optimization Solution Guide
Chapter 9 Branch Design ConsiderationsData Center Design
9.15.2.1 WCCP Components
WCCP has three components: the Assignment method, the Redirection method, and the Return method. The Assignment method determines which WCCP appliance receives redirected traffic; the Redirection method refers to how traffic is sent to the WCCP appliance; the Return method determines how WCCP bypass traffic is handled.
9.15.2.1.1 Assignment Method
The Assignment method determines how traffic is load balanced across multiple WCCP appliances. The introduction of WCCPv2 enabled the negotiation of Mask Assignment per service group.
Mask-based assignment, as an ingress feature, can use an ACL redirect-adjacency entry in the ACL table. The mask, which is programmed in ACL Ternary Content Addressable Memory (TCAM) before packet forwarding, does not require the NetFlow table or software processing. The WCCP-designated appliance chooses several hash-buckets and assigns an address mask and WCCP appliance to each bucket.
After the assignments are done, the Supervisor programs one TCAM entry and one adjacency for each bucket. This enables the redirection of packets that match the address mask to the associated WCCP appliance through an L2 rewrite. If WCCP is configured as an egress feature, ACL redirect-adjacencies are not hardware supported, and the first packet of a flow is sent to software for processing. Once the proper redirect-adjacency is determined, it is programmed into the NetFlow hardware, where the entry points to an adjacency that performs either an L2 rewrite or GRE encapsulation.
9.15.2.1.2 Redirection Method
Redirection handles how traffic is sent to the WCCP appliance. Using L3 redirection, each WCCP packet is encapsulated in a GRE header marked with a protocol type of 0x883E followed by a four-octet WCCP redirect header. The WCCP packets are subsequently sent to the WCCP appliance.
With WCCP v2, “accelerated WCCP” or L2 redirection was added to take advantage of hardware switching platforms. With L2 redirection, the WCCP appliance must be L2 adjacent (on the same L2 VLAN); redirected traffic is forwarded through normal switching with a rewritten MAC destination address.
9.15.2.1.3 L2 Forwarding Method Detail
With L2 forwarding, WCCP appliances within a service group are part of the same subnet and L2 adjacent to the supporting switch. This supports higher throughput and low latency deployment. The packet is rewritten with the source MAC set to the router and the destination MAC set to the WCCP device.
L2 Forwarding Breakdown
Ingress – L2 redirection + Mask Assignment (Full Hardware Processing)
Mask assignments further enhance the performance of L2 redirection. When configured on ingress, L2 Redirection and Mask assignment is the most efficient WCCP method on the Catalyst 6500. All packet traffic, including the first packet, is switched in hardware and no software processing is needed.
The current Catalyst platform supports a 7-bit mask, with default mask of 0x1741 on the source IP address. Fine-tuning of the mask can yield better traffic distribution to the WAEs. For example, if a network uses only 191.x.x.x address space, the most significant bit can be reused on the last three octets, such as 0x0751, because the leading octet (191) is always the same.

9-66WAN and Application Optimization Solution Guide
Chapter 9 Branch Design ConsiderationsData Center Design
The following example is a show output from show ip wccp 61 detail with a mask of 0x1000.
The WAE and Catalyst negotiate which redirect and return method to use when the service group is formed. There can be many access VLANs on the aggregation switches and redirection is configured on all VLANs that need optimization. L2 switching ports, including trunk ports, are not eligible for redirection.
L3 Forwarding Method Detail
WCCP L3 operation involves the use of GRE as the encapsulation method. Redirected packets are encapsulated in a GRE header with a protocol type of 0x883e, along with a 4-byte WCCP Redirection header that includes a service ID and hash bucket matched. Using GRE enables the WCCP client to be separated from the WCCP switch over multiple L3 hops.

9-67WAN and Application Optimization Solution Guide
Chapter 9 Branch Design ConsiderationsData Center Design
Figure 9-41 L3 Forwarding Method Detail
L3 Forwarding Method Breakdown
Ingress – L3 (GRE) redirection + Mask Assignment (Full Hardware Processing -Sup32/Sup720 only)
When using the mask assignment method on the ingress, the initial and subsequent packets are both forwarded in hardware. Normally, the WCCP appliance returns traffic directly to the client, but if the WCCP device is unable to process the request, then it is encapsulated in GRE and returned to the Catalyst 6500. PFC 3 cannot process GRE protocol type 0x833E in hardware causing it to be processed in software instead.
Method Summary
While WCCP on the Catalyst 6500 offers many options, hardware acceleration is available only with ingress L2 redirection with mask assignment and ingress L3 (GRE) redirection with mask assignment. From a hardware perspective, all egress WCCP configurations require some software processing and have CPU utilization impact. Software processing is also required on the ingress when using the hash assignment method. Note that L2 redirection with mask assignments is the recommended deployment for Catalyst 6500 WCCP.
9.15.2.2 Configuring L2 Redirection with Catalyst 6500
On Catalyst 6500:switch(config)# interface Vlan76 ! Dedicated VLAN for WAAS clusterswitch(config)# ip address 30.30.9.1 255.255.255.0switch(config)# load-interval 120
switch(config)# int GigabitEthernet 0/1switch(config-if)# switchportswitch(config-if)# switchport mode access
1. Client HTTP Request2. WCCP+GRE Header Appended CE3. CE Cache Hit direct return to client4. Route to client
WCCP Appliances
ServerClient
C6500
VLAN 30VLAN 10
WCCP
2712
62
41
2
3
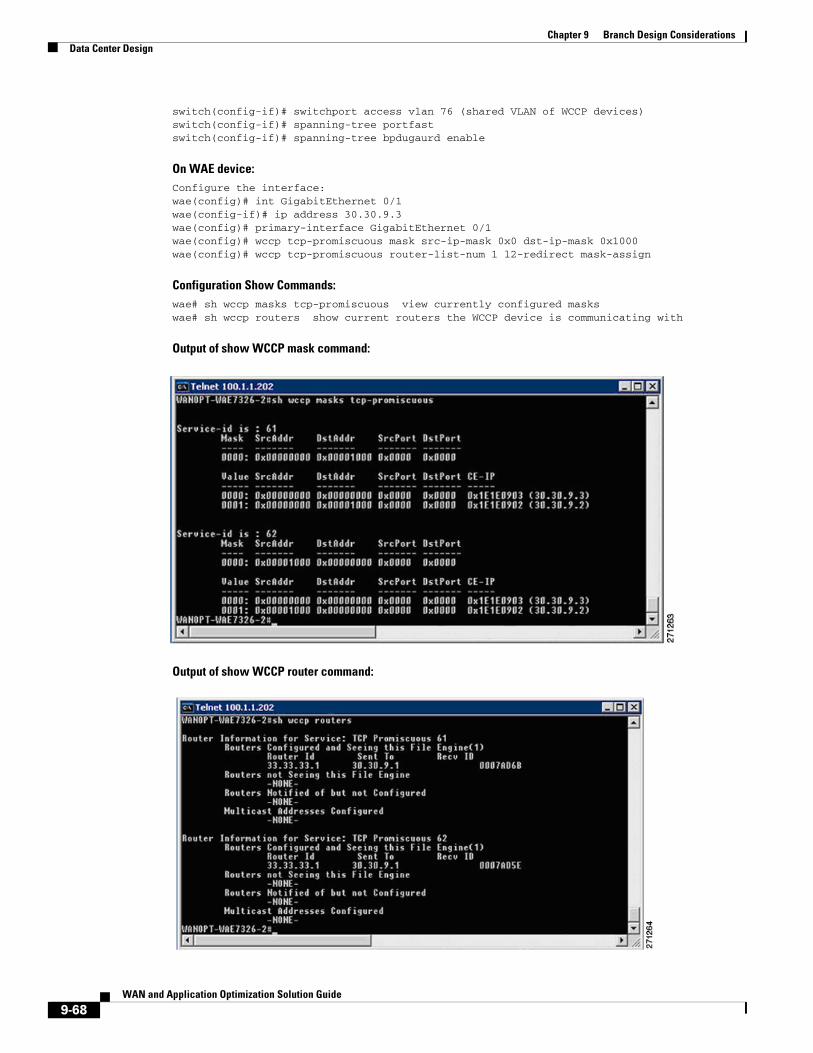
9-68WAN and Application Optimization Solution Guide
Chapter 9 Branch Design ConsiderationsData Center Design
switch(config-if)# switchport access vlan 76 (shared VLAN of WCCP devices)switch(config-if)# spanning-tree portfastswitch(config-if)# spanning-tree bpdugaurd enable
On WAE device:Configure the interface:wae(config)# int GigabitEthernet 0/1wae(config-if)# ip address 30.30.9.3wae(config)# primary-interface GigabitEthernet 0/1wae(config)# wccp tcp-promiscuous mask src-ip-mask 0x0 dst-ip-mask 0x1000wae(config)# wccp tcp-promiscuous router-list-num 1 l2-redirect mask-assign
Configuration Show Commands:wae# sh wccp masks tcp-promiscuous view currently configured maskswae# sh wccp routers show current routers the WCCP device is communicating with
Output of show WCCP mask command:
Output of show WCCP router command:

9-69WAN and Application Optimization Solution Guide
Chapter 9 Branch Design ConsiderationsData Center Design
9.15.3 ACE SSLSecure Sockets Layer (SSL) provides a secure transport for HTTP applications. The SSL layer is logically situated between the application layer and TCP. The purpose of an SSL connection is to securely exchange information between two endpoints.
SSL provides the following security elements:
• Confidentiality: encryption of traffic using ciphers
• Authentication: verification of identity using certificates
• Integrity: An optional Message Authentication Code (MAC) prevents data tampering
9.15.3.1 SSL Offload
SSL is used to secure many web transactions. The Application Control Engine (ACE) can encrypt and decrypt SSL traffic. For SSL offload, the ACE operates as a virtual SSL server where all inbound SSL traffic from a client terminates at the ACE. After the connection is terminated, the ACE decrypts the ciphertext from the client and sends the data as cleartext to an HTTP server.
The ACE module supports SSL version 3 and Transport Layer Security (TLS) version 1. A typical SSL session with the ACE requires encryption ciphers to establish and maintain the secure connection. Cipher suites provide the cryptographic algorithms required by the ACE to perform key exchange, authentication, and MAC.
The client and server use the SSL handshake protocol to establish an SSL session between the two devices. During the handshake process, the client and server negotiate the SSL parameters that they will use during the secure session. These sessions are fully proxied throughout the life of the connection, as every packet must be processed by the full TCP and SSL stacks.
• Maximum number of SSL connections: 100 K
• Maximum number of SSL TPS: 1000 with default license.
• Maximum amount of SSL bandwidth: 2Gb/s
9.15.3.2 SSL PKI
SSL features on the ACE support both certificates and public key infrastructure (PKI). Digital certificates contain the following identification attributes: name of the CA, CA digital signature, serial number, name of the server, the subject's public key, and expiration date. The key pair refers to a public key and its corresponding private (secret) key. During the handshake, the RSA key pairs are used to encrypt the session key that both devices will use to encrypt the data that follows the handshake.
The ACE supports the creation of the public/private keys using the crypto generate key command. While the ACE does not support certificate generation, it does support configuring Certificate Signing Request (CSR) parameters as shown:
WANOPT-ACE1/NSITE-WAAS(config)# crypto csr-params CISCO-WANOPTWANOPT-ACE1/NSITE-WAAS(config-csr-params)# ?
Configure CSR Parameterscommon-name Configure organization's common namecountry Configure country nameemail Configure email addresslocality Configure locality nameorganization-name Configure organization nameorganization-unit Configure organization unit's name

9-70WAN and Application Optimization Solution Guide
Chapter 9 Branch Design ConsiderationsNetwork Performance Management
serial-number Configure serial numberstate Configure state name
The CSR generated using the crypto generate csr command is sent to another system for processing into a certificate. The ACE can import PEM, DER, and PKCS12 certificates and the ACE supports 512, 1024, and 1536 length keys. In a HA environment, the same keys and certificates should be configured on both ACE modules.
WANOPT-ACE1/NSITE-WAAS# show crypto certificate all All Certificate Files Loaded:ciscocert:Subject: /C=US/ST=North Carolina/L=RTP/O=Cisco/OU=NSITE/CN=www.cisco.com/[email protected]: /C=RM/ST=RMSTATE/L=RMCITY/O=RMCOMPANY/OU=RMUNIT/CN=RMNAME/[email protected] Before: Sep 14 19:46:04 2007 GMTNot After: Sep 13 19:46:04 2008 GMTCA Cert: FALSE
9.15.3.3 SSL Configuration
Before configuring your ACE for SSL operation, it must be configured for server load balancing (SLB). After configuring SLB, the SSL proxy server service is added to the existing SLB policy maps and class maps. The SSL proxy server service defines the handshake parameters that the ACE.
serverfarm host HTTPS-FARM probe CHECK rserver APACHE1 80 inservice rserver APACHE3 80 inservicessl-proxy service SSLPROXY key ciscokey cert ciscocertpolicy-map multi-match L4_LB_WAAS class L4_HTTPS_VIP_ADDRESS loadbalance vip inservice loadbalance policy WAAS_HTTPS_POLICY loadbalance vip icmp-reply ssl-proxy server SSLPROXY
9.16 Network Performance ManagementThis section describes how the network performance management tools introduced in Chapter Network Management XREF TBD can be deployed and utilized to support the WAN and application optimization solution. After a brief overview of the needs for performance monitoring in this environment, each network performance management tool is presented.
9.17 Performance Monitoring for WAN and Application Optimization presents the NetQoS performance monitoring products and 9.20 Cisco NAM Use Cases for WAN and Application Optimization presents the Cisco Network Analysis Module (NAM). Each section contains an overview of the product support features relevant to each phase of the WAN and application optimization solution, deployment considerations, and use cases. The use cases illustrate how enterprise users can use these tools to support the WAN and application optimization solution. 9.23.5 NAM-2 Deployment Caveats presents common deployment caveats for both products.
9-71WAN and Application Optimization Solution Guide
Chapter 9 Branch Design ConsiderationsPerformance Monitoring for WAN and Application Optimization
9.17 Performance Monitoring for WAN and Application Optimization
Performance monitoring tools should be used in all phases of a WAN and application optimization initiative to help ensure a successful deployment.
• During predeployment testing and baselining, network performance monitoring validates that the selected WAN and application optimization strategies will have the intended impact on the business critical applications and protocols. This enables proper prioritization of sites for WAN and application optimization based on usage and performance trends.
• During deployment, monitoring validates the effectiveness of the WAN and application optimization strategy for the selected sites and applications.
• After deployment, performance monitoring ensures the ongoing effectiveness of the WAN and application optimization strategy as network, datacenter, and usage conditions change and by maintaining the visibility necessary to enable efficient troubleshooting. Performance monitoring also helps in identifying new opportunities for WAN and application optimization.
9.17.1 NetQoS Support for WAN and Application Optimizationdescribes how to use NetQoS to support deployed WAN and application initiatives. 9.20.1 NAM-2 Support for WAN and Application Optimization describes how to use Cisco NAM 3.6 to support such initiatives; in this case, the focus is on troubleshooting and conversation specific WAN and application optimization validation.
9.17.1 NetQoS Support for WAN and Application Optimization NetQoS performance monitoring supports all phases of WAN and application optimization: predeployment, deployment, and postdeployment. The following sections describe each phase.
9.17.1.1 Predeployment Support
When developing a WAN and application optimization strategy, a first step is to profile traffic patterns and resource bottlenecks and establish a baseline of the performance of links, servers, and applications. Profiling involves identifying the applications running on the network, and understanding the consumption of WAN resources by different types of business and nonbusiness traffic.
NetQoS NetVoyant leverages NBAR to produce reports such as the one shown in Figure 9-42. Using NBAR statistics, IT staff can identify the applications running on the network.
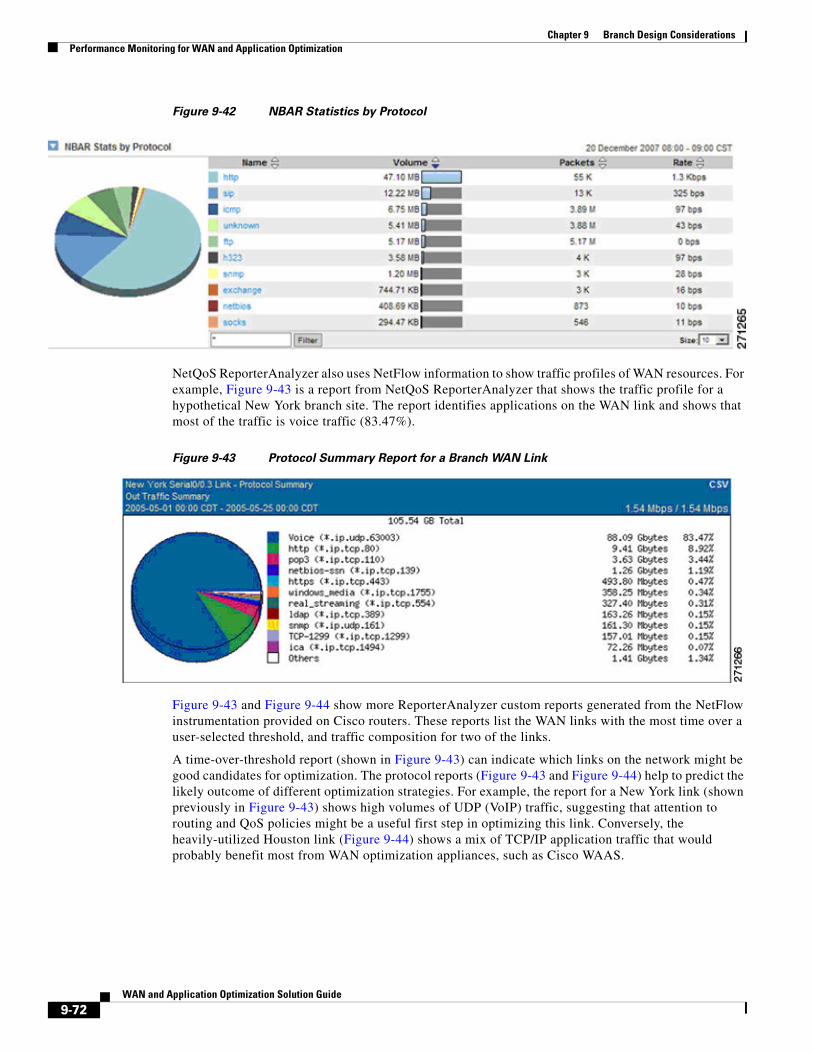
9-72WAN and Application Optimization Solution Guide
Chapter 9 Branch Design ConsiderationsPerformance Monitoring for WAN and Application Optimization
Figure 9-42 NBAR Statistics by Protocol
NetQoS ReporterAnalyzer also uses NetFlow information to show traffic profiles of WAN resources. For example, Figure 9-43 is a report from NetQoS ReporterAnalyzer that shows the traffic profile for a hypothetical New York branch site. The report identifies applications on the WAN link and shows that most of the traffic is voice traffic (83.47%).
Figure 9-43 Protocol Summary Report for a Branch WAN Link
Figure 9-43 and Figure 9-44 show more ReporterAnalyzer custom reports generated from the NetFlow instrumentation provided on Cisco routers. These reports list the WAN links with the most time over a user-selected threshold, and traffic composition for two of the links.
A time-over-threshold report (shown in Figure 9-43) can indicate which links on the network might be good candidates for optimization. The protocol reports (Figure 9-43 and Figure 9-44) help to predict the likely outcome of different optimization strategies. For example, the report for a New York link (shown previously in Figure 9-43) shows high volumes of UDP (VoIP) traffic, suggesting that attention to routing and QoS policies might be a useful first step in optimizing this link. Conversely, the heavily-utilized Houston link (Figure 9-44) shows a mix of TCP/IP application traffic that would probably benefit most from WAN optimization appliances, such as Cisco WAAS.
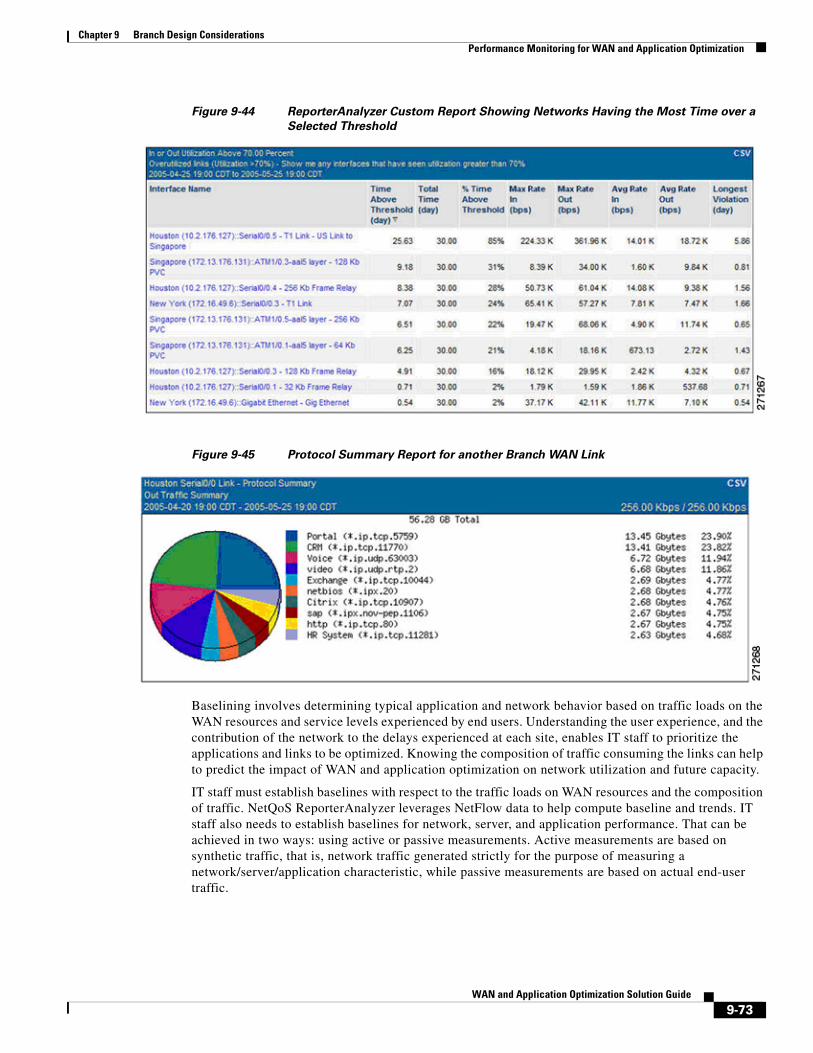
9-73WAN and Application Optimization Solution Guide
Chapter 9 Branch Design ConsiderationsPerformance Monitoring for WAN and Application Optimization
Figure 9-44 ReporterAnalyzer Custom Report Showing Networks Having the Most Time over a
Selected Threshold
Figure 9-45 Protocol Summary Report for another Branch WAN Link
Baselining involves determining typical application and network behavior based on traffic loads on the WAN resources and service levels experienced by end users. Understanding the user experience, and the contribution of the network to the delays experienced at each site, enables IT staff to prioritize the applications and links to be optimized. Knowing the composition of traffic consuming the links can help to predict the impact of WAN and application optimization on network utilization and future capacity.
IT staff must establish baselines with respect to the traffic loads on WAN resources and the composition of traffic. NetQoS ReporterAnalyzer leverages NetFlow data to help compute baseline and trends. IT staff also needs to establish baselines for network, server, and application performance. That can be achieved in two ways: using active or passive measurements. Active measurements are based on synthetic traffic, that is, network traffic generated strictly for the purpose of measuring a network/server/application characteristic, while passive measurements are based on actual end-user traffic.

9-74WAN and Application Optimization Solution Guide
Chapter 9 Branch Design ConsiderationsPerformance Monitoring for WAN and Application Optimization
Each measurement approach has advantages and disadvantages. The best practice is to use both active and passive measurements. Passive measurement is the most accurate approach for the end-user application traffic. However, passive measurement is limited to measuring the performance of existing traffic types (which may not be present on the network at all times) and existing traffic patterns (which may not reflect patterns for new and future applications).
Active measurements have the advantage of being more controllable; performance can be measured between any two points in the network, the type, frequency and traffic class can be specified for the generated traffic. On the other hand, active measurements are only an approximation for the performance of actual traffic. An additional disadvantage is that in order to perform active measurements, some traffic is injected in the network.
To establish baselines using active measurements, NetVoyant uses Cisco IP SLA to report performance metrics, and uses IP SLA synthetic traffic to compute SLA baselines. Figure 9-45 shows an example of a VoIP performance report where the current performance (98.7ms) is compared to the baseline (108.8ms).
Figure 9-46 VoIP Performance Report Example
To establish baselines using passive measurements, NetQoS SuperAgent provides reports based on actual network traffic. SuperAgent product calculates baseline information for applications, networks, and servers each hour to indicate when performance conditions are normal for that hour of the day, factoring in the previous week, day of the week, and day of the month.
Figure 9-47 shows application response time performance maps from NetQoS SuperAgent. These reports list remote sites sorted by worst overall performance (as experienced by end users) for a selected application, and the contribution of network latency to the delay at each site. SuperAgent performance maps can serve as guides for prioritizing sites and applications for WAN and application optimization. Users in the Durham office experience the longest transaction time and the longest network latency, so the Durham site might be considered a top candidate for WAN and application optimization.
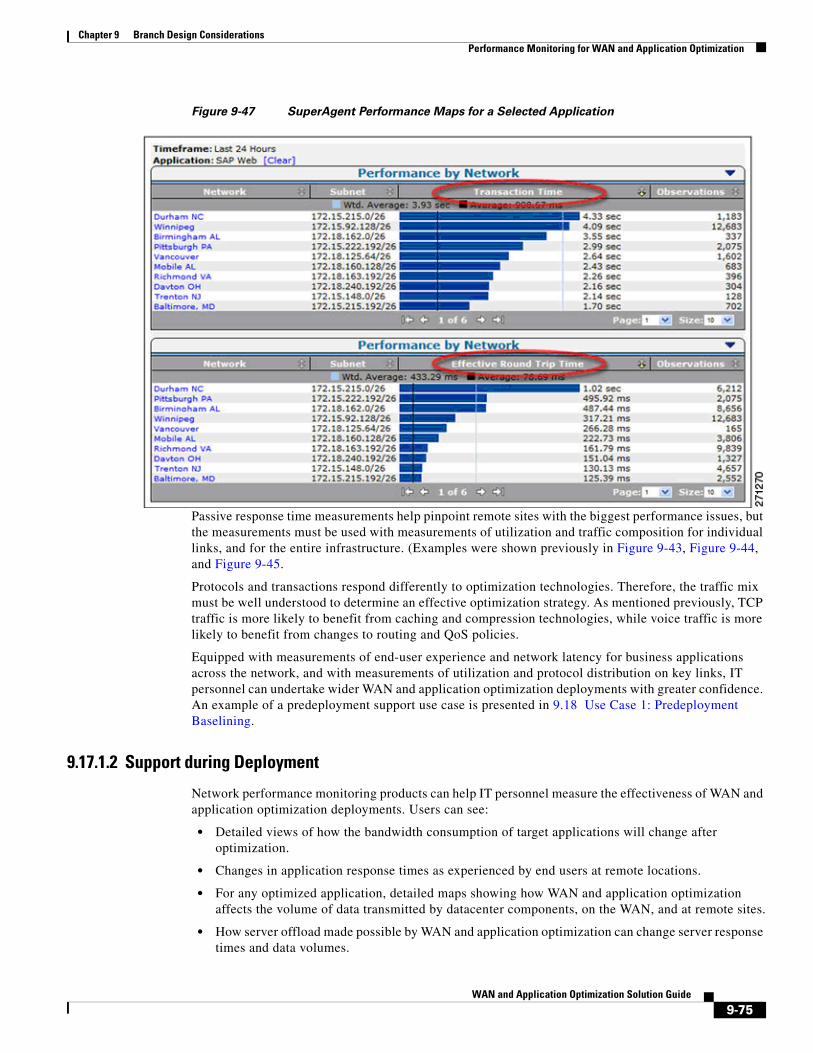
9-75WAN and Application Optimization Solution Guide
Chapter 9 Branch Design ConsiderationsPerformance Monitoring for WAN and Application Optimization
Figure 9-47 SuperAgent Performance Maps for a Selected Application
Passive response time measurements help pinpoint remote sites with the biggest performance issues, but the measurements must be used with measurements of utilization and traffic composition for individual links, and for the entire infrastructure. (Examples were shown previously in Figure 9-43, Figure 9-44, and Figure 9-45.
Protocols and transactions respond differently to optimization technologies. Therefore, the traffic mix must be well understood to determine an effective optimization strategy. As mentioned previously, TCP traffic is more likely to benefit from caching and compression technologies, while voice traffic is more likely to benefit from changes to routing and QoS policies.
Equipped with measurements of end-user experience and network latency for business applications across the network, and with measurements of utilization and protocol distribution on key links, IT personnel can undertake wider WAN and application optimization deployments with greater confidence. An example of a predeployment support use case is presented in 9.18 Use Case 1: Predeployment Baselining.
9.17.1.2 Support during Deployment
Network performance monitoring products can help IT personnel measure the effectiveness of WAN and application optimization deployments. Users can see:
• Detailed views of how the bandwidth consumption of target applications will change after optimization.
• Changes in application response times as experienced by end users at remote locations.
• For any optimized application, detailed maps showing how WAN and application optimization affects the volume of data transmitted by datacenter components, on the WAN, and at remote sites.
• How server offload made possible by WAN and application optimization can change server response times and data volumes.

9-76WAN and Application Optimization Solution Guide
Chapter 9 Branch Design ConsiderationsPerformance Monitoring for WAN and Application Optimization
This section focuses mainly on validating Cisco WAAS, but some graphs and reports apply to validating other WAN and application optimization initiatives, such as changing QoS policies or deploying PfR.
Figure 9-48 shows how Cisco WAAS reduced the bandwidth usage of NetBIOS from a custom application on a WAN link. NetQoS ReporterAnalyzer shows the data rate before and after WAAS deployment. It also shows how the data rate relates to a baseline of data for the same period collected before deployment– the baseline is shown in light gray. Similar reports can be generated to show in detail how WAN and application optimization lowers individual application bandwidth consumption and overall link utilization.
Figure 9-48 ReporterAnalyzer Displaying a Predeployment Baseline
Figure 9-49 shows the impact of Cisco WAAS on application response times experienced by users of an interactive web application at a particular site. Note the pattern of daily transaction delays before WAAS deployment. Users are likely to be dissatisfied and unproductive, since transaction delays are highly variable and last up to 3 seconds.
While the observed number of transactions (represented by the light gray “Observations” line) shows a consistent daily pattern, the average response time for users of the application at this location drops from 562 milliseconds before WAAS deployment to 205 milliseconds after, as indicated by SuperAgent response-time reports (not shown here). Furthermore, the WAAS deployment resulted in far more consistent application delivery to this remote site – with no transactions approaching the three-second delays seen before deployment – and is therefore likely to make a significant, positive impact on user satisfaction and productivity.

9-77WAN and Application Optimization Solution Guide
Chapter 9 Branch Design ConsiderationsPerformance Monitoring for WAN and Application Optimization
Figure 9-49 SuperAgent Reporting that WAAS Improves Application Performance
Figure 9-50 shows how network latency for the application dropped significantly after WAAS deployment because of reduced congestion on the optimized link.
Figure 9-50 SuperAgent Reporting Reduced WAN Segment Latency after WAAS Optimization
Application delays caused by network retransmission, shown in Figure 9-51, were also significantly reduced by the WAAS deployment.

9-78WAN and Application Optimization Solution Guide
Chapter 9 Branch Design ConsiderationsPerformance Monitoring for WAN and Application Optimization
Figure 9-51 SuperAgent Reporting Decreased Network Retransmission Delay after WAAS
Optimization
The effect of server offload made possible by Cisco WAAS can be observed in several ways. Figure 9-52 shows improved response time for a server hosting this CIFS (NetBIOS) intensive application after WAAS deployment.
Figure 9-52 SuperAgent Reporting Faster, More Consistent Server Response Times after Server
Offload

9-79WAN and Application Optimization Solution Guide
Chapter 9 Branch Design ConsiderationsPerformance Monitoring for WAN and Application Optimization
Figure 9-53 shows data volume reduction for a bandwidth-hungry email application. This SuperAgent performance map, configured to report email traffic over a single optimized link, shows that advanced data reduction and compression features of Cisco WAAS have reduced 180 MB of server data volume to only 99 MB of volume over the WAN.
Figure 9-53 SuperAgent Performance Map Showing Reduced WAN Data Volumes after WAAS Optimization
Detailed documentation of the performance improvements experienced by end-users after WAN and application optimization deployment – in combination with performance metrics that show how data volume and network latency improvements can lead to better overall performance – help to prove the effectiveness of each WAN and application optimization initiative and can help to justify and fine-tune future efforts.
9.17.1.3 Postdeployment Support
NetQoS performance monitoring products, in combination with Cisco WAN and application optimization technologies, help IT professionals maintain the visibility necessary to ensure efficient application delivery regardless of how network, datacenter, and usage conditions change. Effective network performance monitoring also makes possible more efficient troubleshooting and capacity planning to meet the organization's future needs.
The NetQoS Performance Center can alert IT staff to performance problems no matter where they may occur in an overall transaction. The following example illustrates some of the performance reports used to support troubleshooting in the example network shown in Figure 9-54. The figure shows the following appliances: NetQoS Super Agent Collector (SA-CO), Super Agent Aggregator (SA-AG), Super Agent Management Console (SA-MC), NetVoyant (NQ-NV), and Reporter Analyzer (NQ-RA). In this example, the NetQoS appliances are connected to the distribution layer switch (DS1).
Figure 9-54 Post-Deployment Support Network Example
2712
77
Client
Branch Office
Data Center
Client
WAE-Edge WAE-Core
ISRRouter CR1
SA-AG
SA-CO SA-MC
NQ-NV
NQ-RA
WAN
Peoplesoft
SAP Web
LDAP
SCCP
NetQoS
DS1 AS1

9-80WAN and Application Optimization Solution Guide
Chapter 9 Branch Design ConsiderationsPerformance Monitoring for WAN and Application Optimization
Figure 9-55 is a performance view, sorted by worst performing application, which highlights an application tier responsible for a recent slowdown.
Figure 9-55 NetQoS Performance Center Report: Performance by Application
Users can navigate to an Engineering view, shown in Figure 9-56, to see response-time metrics for a server in the data center that appears to be responsible for the slowdown. In this example, a response time composition graph reveals an increase in SRT (shown in red) without corresponding delays in application data transfer time (shown in yellow). This condition is associated with server resource issues caused by background processes, memory leaks, faulty configuration changes, and so on.
Figure 9-56 A SuperAgent Engineering View
SuperAgent can be configured to automatically investigate server and network performance issues. In this case, SuperAgent reports the presence of a backup process consuming significant CPU during the slowdown.

9-81WAN and Application Optimization Solution Guide
Chapter 9 Branch Design ConsiderationsPerformance Monitoring for WAN and Application Optimization
Figure 9-57 FA NetVoyant Device Performance View
NetVoyant generates a detailed CPU utilization report, shown in Figure 9-57, and server process list, shown in Figure 9-58, and presents them in the NetQoS Performance Center. These document that a backup process, mistakenly configured to run during business hours, is responsible for the slowdown.
In the example, a combination of application response time monitoring, automated SuperAgent investigations, and SNMP device statistics help IT staff quickly and easily find the root cause of the performance problem. The data made it possible to quickly correct the backup schedule and help prevent the problem from recurring.
Figure 9-58 Process List Showing the Presence of a Backup Application
The presentation of comprehensive performance data in a single interface, including application response times, link traffic analysis, and SNMP device performance statistics, supports faster troubleshooting and better management decisions.
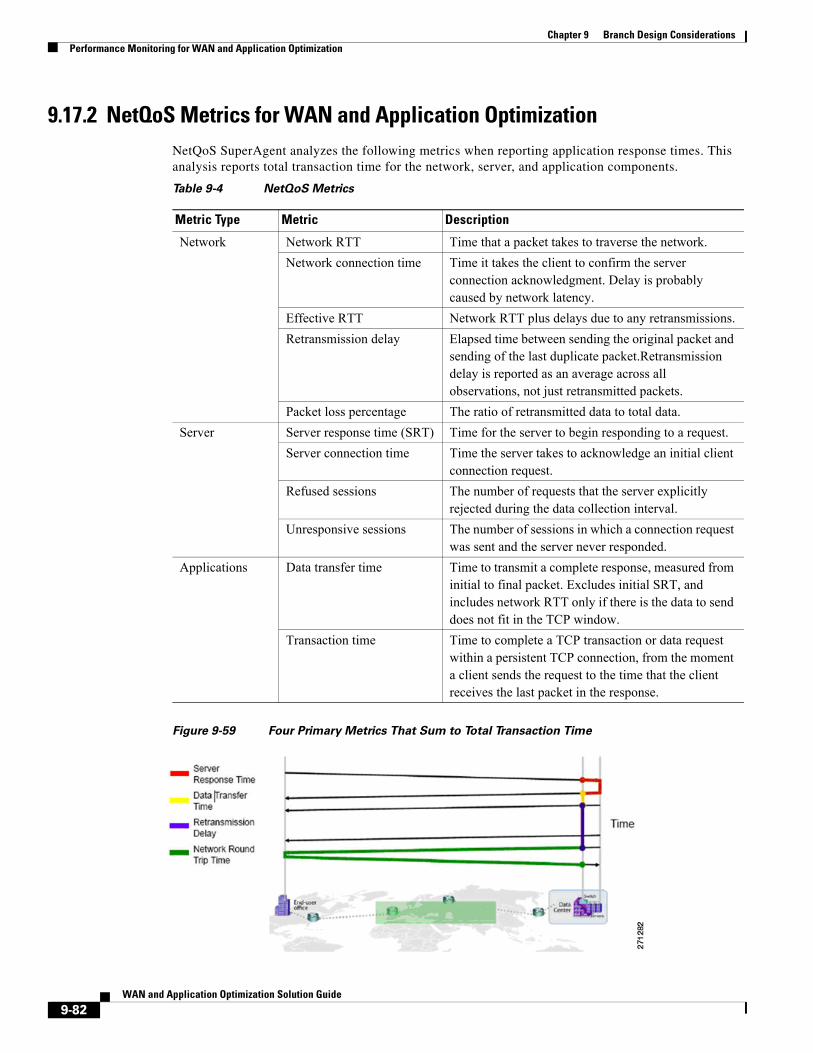
9-82WAN and Application Optimization Solution Guide
Chapter 9 Branch Design ConsiderationsPerformance Monitoring for WAN and Application Optimization
9.17.2 NetQoS Metrics for WAN and Application OptimizationNetQoS SuperAgent analyzes the following metrics when reporting application response times. This analysis reports total transaction time for the network, server, and application components.
Figure 9-59 Four Primary Metrics That Sum to Total Transaction Time
Table 9-4 NetQoS Metrics
Metric Type Metric Description
Network Network RTT Time that a packet takes to traverse the network.Network connection time Time it takes the client to confirm the server
connection acknowledgment. Delay is probably caused by network latency.
Effective RTT Network RTT plus delays due to any retransmissions.Retransmission delay Elapsed time between sending the original packet and
sending of the last duplicate packet.Retransmission delay is reported as an average across all observations, not just retransmitted packets.
Packet loss percentage The ratio of retransmitted data to total data. Server Server response time (SRT) Time for the server to begin responding to a request.
Server connection time Time the server takes to acknowledge an initial client connection request.
Refused sessions The number of requests that the server explicitly rejected during the data collection interval.
Unresponsive sessions The number of sessions in which a connection request was sent and the server never responded.
Applications Data transfer time Time to transmit a complete response, measured from initial to final packet. Excludes initial SRT, and includes network RTT only if there is the data to send does not fit in the TCP window.
Transaction time Time to complete a TCP transaction or data request within a persistent TCP connection, from the moment a client sends the request to the time that the client receives the last packet in the response.

9-83WAN and Application Optimization Solution Guide
Chapter 9 Branch Design ConsiderationsPerformance Monitoring for WAN and Application Optimization
9.17.3 NetQoS Deployment ConsiderationsFigure 9-60 shows NetQoS deployed in the data center. The NetQoS appliances (shown in a light gray box) are deployed in the distribution layer of the Data Center. The figure shows the following appliances: NetQoS Super Agent Collector (SA-CO), Super Agent Aggregator (SA-AG), Super Agent Management Console (SA-MC), NetVoyant (NQ-NV) and Reporter Analyzer (NQ-RA). In this example, the NetQoS appliances are connected to the distribution layer switch (DS1). For redundancy, they can also be connected to the secondary distribution layer switch, DS2, which is not shown in the figure.
Figure 9-60 NetQoS Placement in the Data Center
2712
83
Data Center
Access Layer
Distribution Layer
Core Layer
L3
L2
CR1 CR2
SA-AG
SA-CO
NQ-NV
SA-MC NQ-RA
WAN
Servers
NetQoS
AS1 AS2
DS1 DS2

9-84WAN and Application Optimization Solution Guide
Chapter 9 Branch Design ConsiderationsPerformance Monitoring for WAN and Application Optimization
9.17.4 Application Response Time Analysis with NetQoS SuperAgentA SuperAgent deployment comprises a SuperAgent Management Console and some combination of one or more Aggregators for collecting Flow Agent instrumentation from Cisco Wide Area Application Engine (WAE) devices, and Collectors for monitoring Switched Port Analyzer (SPAN) data from data center switches.
In a standalone configuration, a SuperAgent Management Console and one Collector or Aggregator reside on one server. In a distributed configuration, multiple Collectors and Aggregators are associated with one SuperAgent Management Console, and each component is installed on a separate server. Figure 9-61 illustrates a distributed configuration using a collector (SA-CO) and an aggregator (SA-AG) with a separate server Management Console (SA-MC).
Figure 9-61 SuperAgent Distributed Configuration Example
9.17.4.1 SuperAgent Data Feeds
When installing a SuperAgent Collector, IOS commands are executed on a distribution-layer switch (DS1) to configure SPAN settings. Advanced spanning techniques such as Remote SPAN (RSPAN)/ Encapsulated Remote SPAN (ERSPAN) and controls such as VLAN ACLs (VACLs) can be configured to direct only traffic of interest to the SuperAgent Collector. The SuperAgent Collector capacity is limited to 1Gb/s, so only business critical traffic should be monitored.
When installing a SuperAgent Aggregator, FlowAgent export is enabled on all deployed WAE devices. Configuration is through a CLI on individual WAE devices or GUI-enabled commands for an entire device group of WAE devices on the Devices tab of the WAAS Central Manager. Once enabled, WAE devices periodically poll a configuration file on the SuperAgent Management Console that specifies the set of data to be exported to the SuperAgent Aggregator.
Figure 9-61 illustrates data feeds for the different segments. Core WAE devices, such as WAE-Core, measure the WAN segment. Branch WAE devices, such as WAE-Edge, measure Client segments. There are two ways to get the data for the Server segment: use SPAN/VACL data from the SuperAgent Collector (SA-CO), or use FlowAgent data from the core WAE (WAE-Core).
2712
84
SA-AG
SA-CO
SA-MC
WAE-Edge
ISRRouter CR1 AS1
WAN
ServerClient
WAE-Core
FlowAgentData Feed
FlowAgentData Feed
SPAN/VACL
Client Segment
WANSegment
ServerSegment
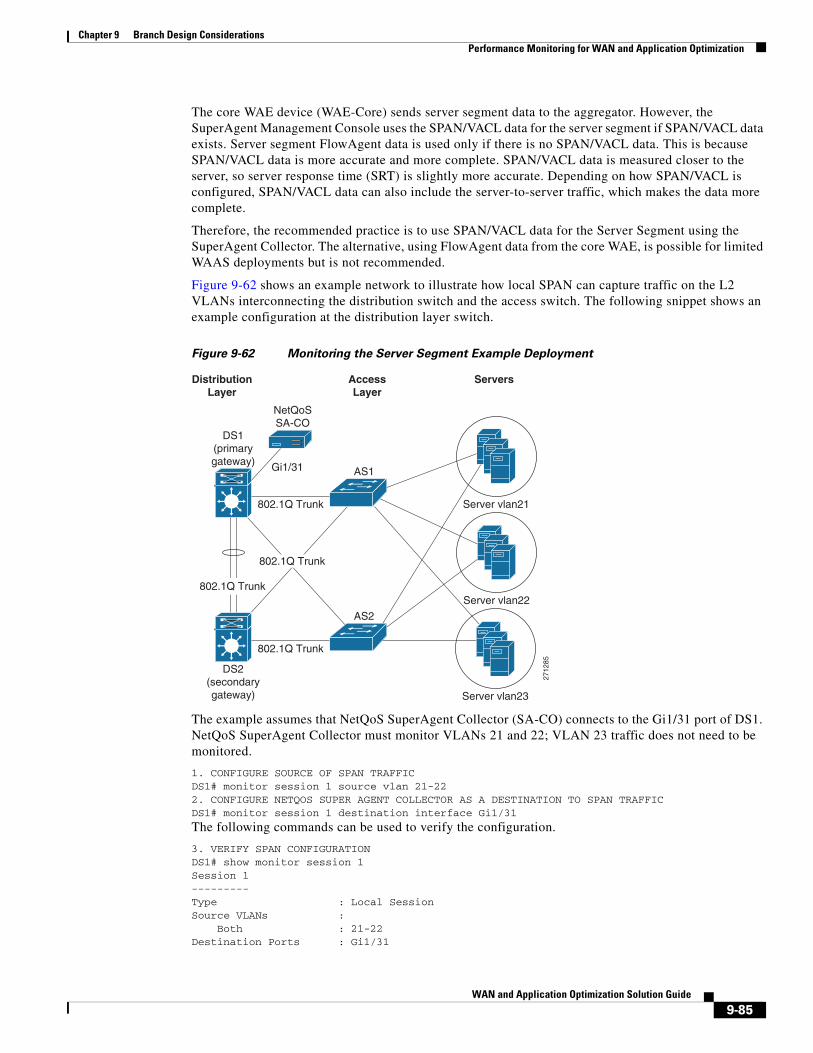
9-85WAN and Application Optimization Solution Guide
Chapter 9 Branch Design ConsiderationsPerformance Monitoring for WAN and Application Optimization
The core WAE device (WAE-Core) sends server segment data to the aggregator. However, the SuperAgent Management Console uses the SPAN/VACL data for the server segment if SPAN/VACL data exists. Server segment FlowAgent data is used only if there is no SPAN/VACL data. This is because SPAN/VACL data is more accurate and more complete. SPAN/VACL data is measured closer to the server, so server response time (SRT) is slightly more accurate. Depending on how SPAN/VACL is configured, SPAN/VACL data can also include the server-to-server traffic, which makes the data more complete.
Therefore, the recommended practice is to use SPAN/VACL data for the Server Segment using the SuperAgent Collector. The alternative, using FlowAgent data from the core WAE, is possible for limited WAAS deployments but is not recommended.
Figure 9-62 shows an example network to illustrate how local SPAN can capture traffic on the L2 VLANs interconnecting the distribution switch and the access switch. The following snippet shows an example configuration at the distribution layer switch.
Figure 9-62 Monitoring the Server Segment Example Deployment
The example assumes that NetQoS SuperAgent Collector (SA-CO) connects to the Gi1/31 port of DS1. NetQoS SuperAgent Collector must monitor VLANs 21 and 22; VLAN 23 traffic does not need to be monitored.
1. CONFIGURE SOURCE OF SPAN TRAFFICDS1# monitor session 1 source vlan 21-222. CONFIGURE NETQOS SUPER AGENT COLLECTOR AS A DESTINATION TO SPAN TRAFFICDS1# monitor session 1 destination interface Gi1/31
The following commands can be used to verify the configuration.
3. VERIFY SPAN CONFIGURATIONDS1# show monitor session 1Session 1---------Type : Local SessionSource VLANs : Both : 21-22Destination Ports : Gi1/31
DS1(primarygateway)
DS2(secondarygateway)
802.1Q Trunk
802.1Q Trunk
802.1Q Trunk
AS2
AS1
2712
85
NetQoSSA-CO
Server vlan21
Server vlan22
Server vlan23
802.1Q Trunk
Gi1/31
DistributionLayer
AccessLayer
Servers
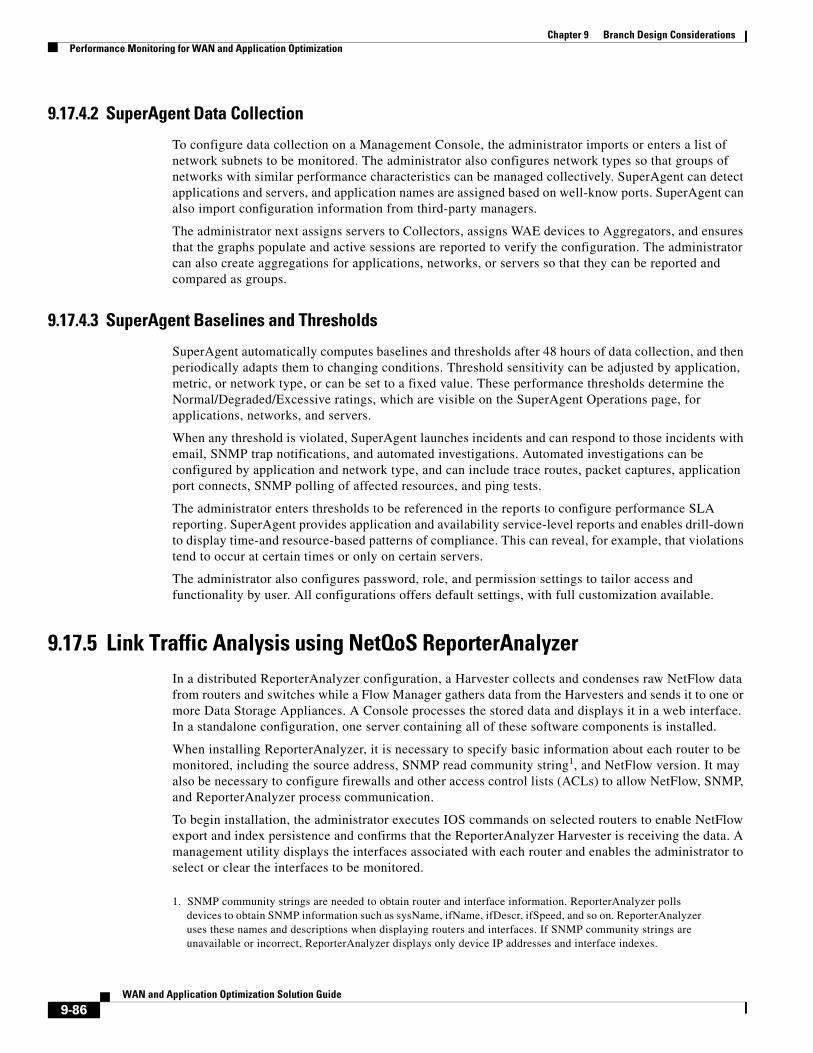
9-86WAN and Application Optimization Solution Guide
Chapter 9 Branch Design ConsiderationsPerformance Monitoring for WAN and Application Optimization
9.17.4.2 SuperAgent Data Collection
To configure data collection on a Management Console, the administrator imports or enters a list of network subnets to be monitored. The administrator also configures network types so that groups of networks with similar performance characteristics can be managed collectively. SuperAgent can detect applications and servers, and application names are assigned based on well-know ports. SuperAgent can also import configuration information from third-party managers.
The administrator next assigns servers to Collectors, assigns WAE devices to Aggregators, and ensures that the graphs populate and active sessions are reported to verify the configuration. The administrator can also create aggregations for applications, networks, or servers so that they can be reported and compared as groups.
9.17.4.3 SuperAgent Baselines and Thresholds
SuperAgent automatically computes baselines and thresholds after 48 hours of data collection, and then periodically adapts them to changing conditions. Threshold sensitivity can be adjusted by application, metric, or network type, or can be set to a fixed value. These performance thresholds determine the Normal/Degraded/Excessive ratings, which are visible on the SuperAgent Operations page, for applications, networks, and servers.
When any threshold is violated, SuperAgent launches incidents and can respond to those incidents with email, SNMP trap notifications, and automated investigations. Automated investigations can be configured by application and network type, and can include trace routes, packet captures, application port connects, SNMP polling of affected resources, and ping tests.
The administrator enters thresholds to be referenced in the reports to configure performance SLA reporting. SuperAgent provides application and availability service-level reports and enables drill-down to display time-and resource-based patterns of compliance. This can reveal, for example, that violations tend to occur at certain times or only on certain servers.
The administrator also configures password, role, and permission settings to tailor access and functionality by user. All configurations offers default settings, with full customization available.
9.17.5 Link Traffic Analysis using NetQoS ReporterAnalyzerIn a distributed ReporterAnalyzer configuration, a Harvester collects and condenses raw NetFlow data from routers and switches while a Flow Manager gathers data from the Harvesters and sends it to one or more Data Storage Appliances. A Console processes the stored data and displays it in a web interface. In a standalone configuration, one server containing all of these software components is installed.
When installing ReporterAnalyzer, it is necessary to specify basic information about each router to be monitored, including the source address, SNMP read community string1, and NetFlow version. It may also be necessary to configure firewalls and other access control lists (ACLs) to allow NetFlow, SNMP, and ReporterAnalyzer process communication.
To begin installation, the administrator executes IOS commands on selected routers to enable NetFlow export and index persistence and confirms that the ReporterAnalyzer Harvester is receiving the data. A management utility displays the interfaces associated with each router and enables the administrator to select or clear the interfaces to be monitored.
1. SNMP community strings are needed to obtain router and interface information. ReporterAnalyzer polls devices to obtain SNMP information such as sysName, ifName, ifDescr, ifSpeed, and so on. ReporterAnalyzer uses these names and descriptions when displaying routers and interfaces. If SNMP community strings are unavailable or incorrect, ReporterAnalyzer displays only device IP addresses and interface indexes.

9-87WAN and Application Optimization Solution Guide
Chapter 9 Branch Design ConsiderationsUse Case 1: Predeployment Baselining
The administrator then modifies or confirms report settings that control the frequency of DNS host name resolution, reported interface speeds, router name resolution rules, and the inclusion of router-generated traffic. The administrator also defines roles and user accounts for any users who do not have full administrative privileges for ReporterAnalyzer.
After initial setup, communication settings for third-party applications are configured as required to automatically emailing reports and send SNMP traps. ReporterAnalyzer sends notifications if routers cease to send NetFlow data, or if product components are unavailable or exceed performance thresholds.
The administrator then configures additional features to make reports easy to understand. For example, interfaces can be grouped based on geography, speed, or other attributes for easier selection and comparative reporting. Interfaces can be aggregated so that they can appear together in reports. User-defined protocol groups can be configured so that protocol ranges for each custom application can be reported together. Type of Service (ToS) values are also labeled and grouped for reporting application classes.
9.17.6 Device Performance Analysis using NetQoS NetVoyantNetVoyant uses SNMP management information bases (MIBs) to define the types of data to be collected. Users can view the MIBs to create event notifications or assist in other administrative tasks, and can compile new MIBs to add functionality to NetVoyant.
NetVoyant creates events and alarms to alert users to issues with NetVoyant services, missed SNMP polls, exceeded utilization, and other configurable thresholds. Administrators can set thresholds, create notifications that NetVoyant triggers in response to events, and view event and alarm logs.
NetVoyant provides a wizard for configuring Cisco IP SLA operations for supported devices. These operations provide data for IP SLA reports in the NetVoyant Reporting Interface.
In a standalone configuration, a NetVoyant Master Console performs administrative, reporting, and polling tasks. In a distributed configuration, the Master Console performs administrative and reporting tasks. Remote servers, called Polling Stations, discover and poll devices on the network.
During initial configuration, a wizard guides the process of discovering network devices. The configuration wizard prompts the user for read community strings of the devices to be polled; both read and write community strings are required for devices that NetVoyant configures to run IP SLA tests.
The configuration wizard prompts the administrator to enter or import the network address ranges of the devices to be discovered. If gateway or backbone routers, or other connectivity devices, are not discoverable (for example, because they are separated from NetVoyant by a public network), it might be necessary to provide the names or addresses of these devices. During setup, a user can also select device classes (for example, printers or workstations) and models to be excluded from automatic polling after discovery.
It might be necessary to configure access lists for routers and other network devices to accept SNMP polls from NetVoyant. Access to a naming service, such as DNS, is also required to present device names in NetVoyant reports.
After the configuration wizard performs initial discovery, NetVoyant performs rediscovery each Midnight by default to update device information. Rediscovery settings can be changed after setup, and rediscovery can also be initiated manually.
9.18 Use Case 1: Predeployment BaseliningUse case 1 illustrates the process of network baselining during the predeployment phase.

9-88WAN and Application Optimization Solution Guide
Chapter 9 Branch Design ConsiderationsUse Case 1: Predeployment Baselining
The following use case describes an implementation that was deployed in a test lab. The use case provides an example of how the WAN and application optimization solution might work in an real-world scenario. However, the use case is not intended to reflect actual performance or behavior in any environment.
The following use case example illustrates NetQoS capabilities and features that are useful for identifying candidate sites for WAN and application optimization.
9.18.1 ObjectivesIdentify candidate sites for WAN and application optimization.
9.18.2 Assumptions1. WAAS and QoS Policies are not deployed.
2. NetQoS SuperAgent is deployed at the data center Catalyst 6000 Series distribution switch.
3. NetQoS SuperAgent Collector uses SPAN to monitor the DC links and VLANs.
4. NetFlow Data Export is configured on WAN routers to send data to NetQoS ReporterAnalyzer.
5. NetQoS SuperAgent has been deployed for more than 48 hours and has established a baseline.
9.18.3 Use Case ExampleA multinational enterprise is considering WAN and application optimization and wants to identify the sites that would benefit most from WAN and application optimization. NetQoS has been deployed, and a baseline has been established.
9.18.4 Use Case Workflow
Step 1 Identify worst performing sites and use NetQoS Performance Center to create a customized report.
1. Create a new page containing the following information (see Figure 9-63).
2. Add Router/Switch | Interfaces Over Threshold.
3. Add Network | Bytes by Network
4. Add Network | Incident Count by Network.
5. Add Network | Network Round Trip Time by Network.
6. Add Network | Packet Loss by Network
7. Add Network | Performance by Network
Save and view the report (see Figure 9-63).
Note The Interfaces Over Threshold view shows that the Singapore and New York interfaces have average daily utilizations above 95%. Performance reports from SuperAgent indicate that these subnets have high data volumes, high latency, and high packet loss. The Performance by Network view shows excessively poor performance with several network incidents.

9-89WAN and Application Optimization Solution Guide
Chapter 9 Branch Design ConsiderationsUse Case 1: Predeployment Baselining
We must also ensure that the protocols on these links will benefit from WAN and application optimization.
Step 2 Use ReporterAnalyzer to identify the protocols on the interfaces with performance issues:
1. In the On Interfaces Over Threshold view, click on most utilized interface to get the protocol distribution and volumes optimization, similar to Figure 9-43, Figure 9-44, and Figure 9-45.
2. Repeat for each interface over threshold.
Note Protocol distribution on interface shows whether WAN and application optimization will be effective on an interface. Protocol distribution also shows what type of WAN and application optimization is most suitable. The Singapore and New York links both appear to be good candidates for WAAS optimization.
The customer chooses New York for the initial WAAS evaluation, without optimizing the Singapore link.
Figure 9-63 NetQoS Performance Center Identifying Candidate Sites for Optimization

9-90WAN and Application Optimization Solution Guide
Chapter 9 Branch Design ConsiderationsUse Case 2: Validating WAAS Effectiveness
9.19 Use Case 2: Validating WAAS EffectivenessUse case 2 illustrates the process of demonstrating that deploying WAAS helps to optimize WAN and application performance.
The following use case describes an implementation that was deployed in a test lab. The use case provides an example of how the WAN and application optimization solution might work in an real-world scenario. However, the use case is not intended to reflect actual performance or behavior in any environment.
9.19.1 ObjectivesValidate performance improvements made possible by WAN and application optimization initiatives.
9.19.2 Assumptions1. WAAS and QoS policies are deployed.
2. NetQoS SuperAgent is deployed at the data center Catalyst 6000 Series distribution switch.
3. NetQoS SuperAgent Collector monitors the DC links/VLANs using SPAN.
4. NetFlow Data Export is configured to send data to NetQoS ReporterAnalyzer.
5. NetQoS has been deployed for more than 48 hours and has established a baseline.
The following example use case shows how the NetQoS Performance Center was used to validate performance improvements made possible by Cisco WAAS.
9.19.3 Use Case ExampleThe multinational enterprise in the previous use case has started a pilot WAN and application optimization deployment. During the pilot, WAAS was deployed at 12:00 PM on June 15 to optimize a remote site (New York) that has experienced poor performance. The customer uses NetQoS Performance Center to demonstrate to senior management that Cisco WAAS improves application service delivery, thereby justifying further deployments at other remote sites.

9-91WAN and Application Optimization Solution Guide
Chapter 9 Branch Design ConsiderationsUse Case 2: Validating WAAS Effectiveness
9.19.4 Use Case Workflow
Step 1 Check performance by network; use the customized report from the previous use case in NetQoS Performance Center.
As shown in 9.19 Use Case 2: Validating WAAS Effectiveness, users in New York experience improved network performance as soon as WAAS and QoS policies are implemented. Latency and packet loss for New York show immediate improvement, while the unoptimized Singapore branch network continues to have serious performance issues.
Figure 9-64 NetQoS Performance Center Showing Improved Behavior

9-92WAN and Application Optimization Solution Guide
Chapter 9 Branch Design ConsiderationsUse Case 2: Validating WAAS Effectiveness
Step 2 Examine the impact of optimization on New York traffic.
Click on the New York link in the Performance by Network view (see the pointer in 9.19 Use Case 2: Validating WAAS Effectiveness). This opens the SuperAgent Operations page (Figure 9-63), which shows four network metrics with Degraded or Excessive behavior before the WAAS rollout. The autogenerated performance thresholds, which exist for all Application, Network, Server, and Metric combinations, reveal the operational status (Normal, Excessive, or Degraded).In this example, (New York Network, Network Round Trip Time, CRM Server) shows Excessive status until WAAS is activated at 12:00PM.
Figure 9-65 Operations Page Showing Dramatic Improvement
Step 3 View reports of optimized transaction performance as experienced by users in New York.
1. Click on the Optimization tab (see 9.19 Use Case 2: Validating WAAS Effectiveness) to open the Client Experience for Optimized Transactions view, which shows transaction times for each application (not shown).
2. Click the CRM application to open a Components Report, which includes several views for the application: Response Time (Figure 9-66), SRT (Figure 9-67), RTT (Figure 9-68), Retransmission Delay (Figure 9-69), Data Rate (Figure 9-70) and Data Volume (Figure 9-71).
3. Repeat for other key applications.

9-93WAN and Application Optimization Solution Guide
Chapter 9 Branch Design ConsiderationsUse Case 2: Validating WAAS Effectiveness
Figure 9-66 shows a view of response time for users of a CRM application. Although the number of CRM transactions (as represented by the light gray Observations line) remains relatively constant, response time for these transactions drops significantly. These measurements, showing true user experience, are from data collected at the New York branch office WAE device.
Figure 9-66 Response Time View Showing a Five-Fold Performance Improvement
On the same page, an SRT graph, measured from the data center WAE (Figure 9-67) shows how much WAAS improves server performance. This specific CRM application uses Windows file servers running CIFS in the data center. While Figure 9-66 shows that the observation count remains constant on the client, the observation count measured at the server declines dramatically because of the server offload made possible by CIFS optimization. With less load on the server after WAAS activation, SRT decreases and performance improves.
Figure 9-67 SRT Showing Server Offload Provided by WAAS

9-94WAN and Application Optimization Solution Guide
Chapter 9 Branch Design ConsiderationsUse Case 2: Validating WAAS Effectiveness
A Network RTT graph (Figure 9-68) shows how WAN latency and the number of transactions observed on the link decrease after WAAS deployment. WAN latency is reduced because of optimizing a previously congested link. The use of WAAS optimization techniques such as DRE, LZ, Transport Flow Optimization (TFO), and caching not only reduces WAN bandwidth, but also decreases the number of TCP transactions on the WAN.
Figure 9-68 Network RTT Showing the Effect of TFO on Network Latency
Retransmission delay, shown in Figure 9-69, disappears when WAAS is enabled. This is a typical result. After WAAS is deployed, fewer packets are be retransmitted (the bandwidth reduction causes less congestion), and less time is spent retransmitting packets.
Figure 9-69 Retransmission Delay Virtually Disappears after WAAS Deployment

9-95WAN and Application Optimization Solution Guide
Chapter 9 Branch Design ConsiderationsUse Case 2: Validating WAAS Effectiveness
On the same page, the Data Rate graph (Figure 9-70) and Data Volume graph (Figure 9-71) show the impact of WAAS data compression and suppression on WAN traffic. The reduced WAN bandwidth consumption shown in the graphs is the result of Cisco WAAS data redundancy elimination (DRE) and LZ compression. To document the impact of WAAS the user can access similar views for every critical TCP/IP application and every network.
Figure 9-70 Data Rate over the WAN Showing a Decrease after WAAS Deployment
Figure 9-71 Data Volume over the WAN Decreasing Because of WAAS DRE and LZ Compression
Step 4 View the overall effect of Cisco WAAS on the New York interface.
Click a link to return to the NetQoS Performance Center, and then click the New York interface in the Interfaces Over Threshold view to see stacked protocol trend plots (Figure 9-72).

9-96WAN and Application Optimization Solution Guide
Chapter 9 Branch Design ConsiderationsUse Case 2: Validating WAAS Effectiveness
Note All but one protocol is reduced significantly by the WAAS deployment. The KM protocol is a pass-through application that is not optimized by WAAS. The volume of KM traffic increases because the lower overall link utilization made possible by WAAS frees capacity for this application.
This result suggests that valid QoS policies should be implemented with WAN and application optimization devices to avoid having newly-freed bandwidth consumed by non-business traffic, such as Internet radio and recreational streaming video. Effective QoS policies can ensure that freed bandwidth is first allocated to business-critical applications.
Figure 9-72 A Stacked Protocol Trend Report Showing Reduced Bandwidth Consumption
Step 5 View the effect of Cisco WAAS on the New York interface on the second day of the WAAS pilot deployment.
Open the customized troubleshooting page in the NetQoS Performance Center (Figure 9-73).
Note The page shows no further application incidents and no packet loss for New York. Because it is not among the worst performing networks, New York no longer appears in the Performance by Network view.
After WAAS deployment, the NetQoS Performance Center continues to baseline performance so that any deviation from new, faster norms triggers incidents and automatic investigations. The NetQoS Performance Center continues to isolate problems, regardless of whether they occur on optimized links, on unoptimized links, or in the datacenter.
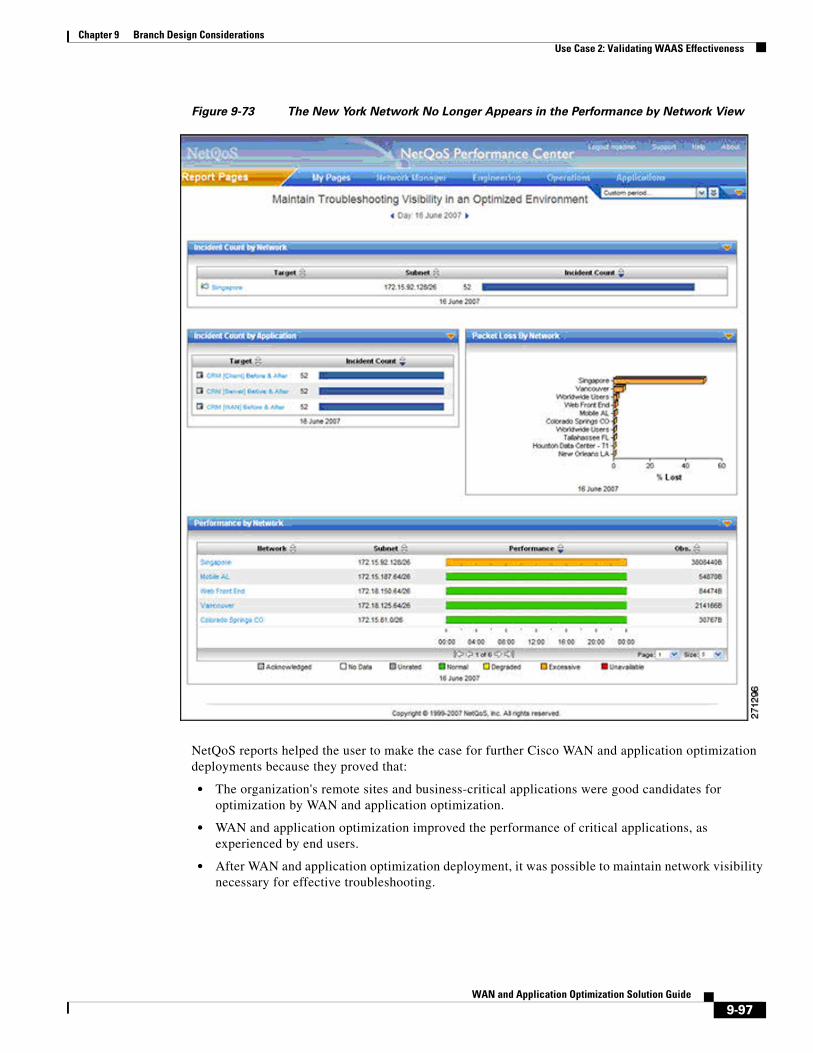
9-97WAN and Application Optimization Solution Guide
Chapter 9 Branch Design ConsiderationsUse Case 2: Validating WAAS Effectiveness
Figure 9-73 The New York Network No Longer Appears in the Performance by Network View
NetQoS reports helped the user to make the case for further Cisco WAN and application optimization deployments because they proved that:
• The organization's remote sites and business-critical applications were good candidates for optimization by WAN and application optimization.
• WAN and application optimization improved the performance of critical applications, as experienced by end users.
• After WAN and application optimization deployment, it was possible to maintain network visibility necessary for effective troubleshooting.

9-98WAN and Application Optimization Solution Guide
Chapter 9 Branch Design ConsiderationsCisco NAM Use Cases for WAN and Application Optimization
9.20 Cisco NAM Use Cases for WAN and Application Optimization
This section focuses on use cases that are based on the deployment of NAM-2 running NAM 3.6 software in the data center. Using NME-NAMs in branch sites to support this solution is not covered in this guide.
The following use cases describes an implementation that was deployed in a test lab. The use case provides an example of how the WAN and application optimization solution might work in an real-world scenario. However, the use case is not intended to reflect actual performance or behavior in any environment.
9.20.1 NAM-2 Support for WAN and Application OptimizationLike NetQoS, NAM can be used to support the different phases of WAN and application optimization deployment. However, there are some differences in how the tools should be used. NAM is not a comprehensive monitoring solution like NetQoS. Instead, NAM is a versatile network tool that provides detailed packet data from the network for conversation-level traffic and response-time analysis. NAM is easy to deploy and configure through a Web graphical user interface.
9.20.1.1 Predeployment support
After NAM-2 is deployed in the data center, users can quickly generate TopN reports and real time charts that identify the application host pairs having the most traffic or the worst performance. This information helps to identify applications and branch sites for WAN and application optimization initiatives (see Figure 9-74).
Figure 9-74 NAM-2 Top Conversations
Unlike NetQoS, NAM-2 reporting shows specific conversation metrics and does not aggregate the information by site pair. The user must manually map host IP addresses to their site subnets to see the global site-to-site traffic pattern and its composition.
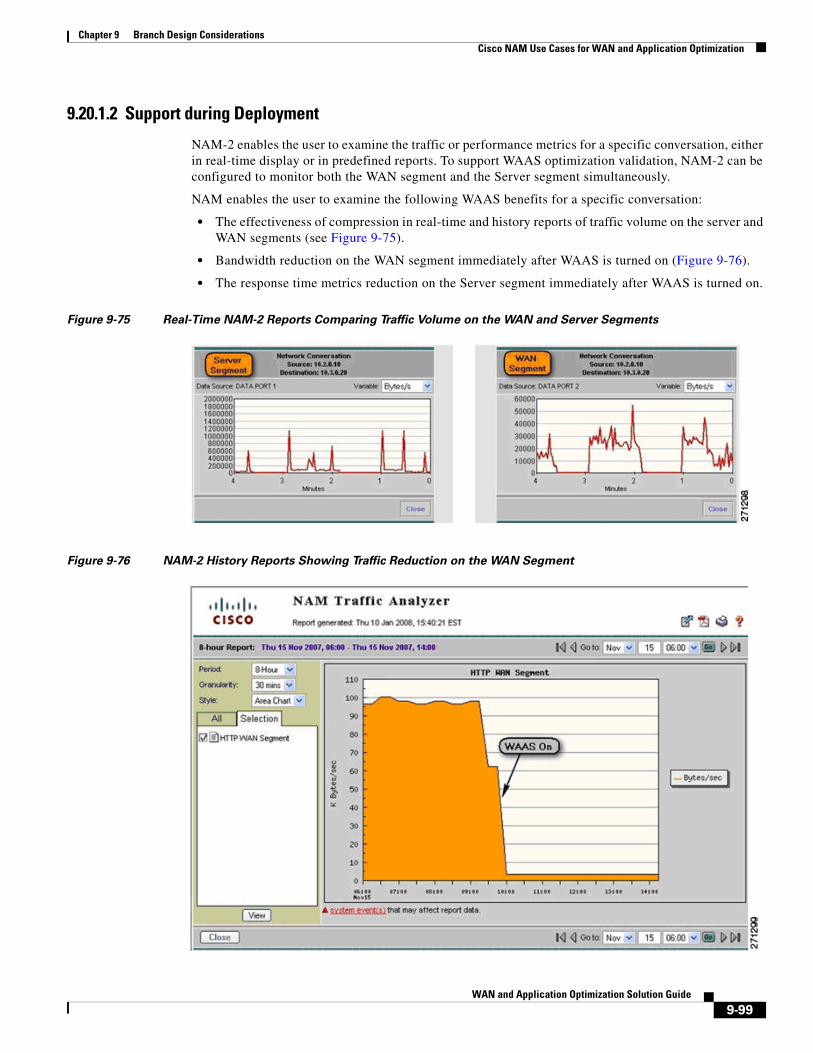
9-99WAN and Application Optimization Solution Guide
Chapter 9 Branch Design ConsiderationsCisco NAM Use Cases for WAN and Application Optimization
9.20.1.2 Support during Deployment
NAM-2 enables the user to examine the traffic or performance metrics for a specific conversation, either in real-time display or in predefined reports. To support WAAS optimization validation, NAM-2 can be configured to monitor both the WAN segment and the Server segment simultaneously.
NAM enables the user to examine the following WAAS benefits for a specific conversation:
• The effectiveness of compression in real-time and history reports of traffic volume on the server and WAN segments (see Figure 9-75).
• Bandwidth reduction on the WAN segment immediately after WAAS is turned on (Figure 9-76).
• The response time metrics reduction on the Server segment immediately after WAAS is turned on.
Figure 9-75 Real-Time NAM-2 Reports Comparing Traffic Volume on the WAN and Server Segments
Figure 9-76 NAM-2 History Reports Showing Traffic Reduction on the WAN Segment

9-100WAN and Application Optimization Solution Guide
Chapter 9 Branch Design ConsiderationsCisco NAM Use Cases for WAN and Application Optimization
9.20.1.3 Postdeployment Support
NAM is particularly useful for troubleshooting performance problems, whether or not WAAS is deployed. Because NAM can obtain traffic flow information from different points of the network using SPAN, RSPAN/ERSPAN, VACL, or NetFlow, NAM can be used to isolate problems and help determine whether a problem is with an application server, the DC server network, the WAN access links, or the service provider (SP) WAN.
If WAAS is deployed in the data center, the troubleshooting procedure also includes a step to check whether WAAS is optimizing the target applications. When WAAS is deployed, the user must consider that the original client/server TCP session will now be split into three separate, interrelated segments: client, WAN, and server. NAM-2 can monitor and analyze traffic and performance on the server and WAN segments.
Figure 9-77 shows some questions that are useful to ask when troubleshooting performance problems.
Figure 9-77 Troubleshooting Performance Problems Using NAM-2
Client segment WAN segment Server segment
Webserver
10.3.1.10
WAE-Core
NAM-2
WAN
WAE-edge
Client10.0.1.10
WAN link WAN link
IT Support
2713
00
User complains about slow application response time
• Is it the server or the network that has caused the problem?• Is WAAS performing optimization as it is supposed to?• Is the WAN link congested at either branch site or data center?• Is the service provider network meeting its SLA?• Is QoS and classed-based routing configured properly?
Branch Office Data Center

9-101WAN and Application Optimization Solution Guide
Chapter 9 Branch Design ConsiderationsNAM 3.6 Metrics for WAN and Application Optimization
9.21 NAM 3.6 Metrics for WAN and Application OptimizationNAM-2 provides several ways to capture, measure, and report on application traffic and performance that are relevant to the WAN and application optimization solution. Two categories of reported metrics are useful for this solution: traffic metrics and response-time metrics.
Traffic metrics, such as volume and rate, can be monitored or reported along different aggregation dimensions (for example, application, host, conversation). Top N Charts based on traffic metrics can also be generated, as shown in Figure 9-74.
Response time metrics can be monitored and reported along different aggregation dimensions. Table 9-5 shows some key NAM-2 response time metrics relevant to WAN and application optimization.
Figure 9-78 illustrates segments monitored by NAM-2 after WAAS is deployed. WAAS creates three network segments: client, WAN, and server. NAM-2 can monitor WAN and server segments.
In the server segment, NAM-2 monitors traffic between the WAE-Core and the server. Transaction time in this segment measures the time for a server to complete an application transaction. This time reflects the server experience, not the client experience.
In the WAN segment, NAM-2 monitors traffic between the WAE-Core and the WAE-Edge. The structure of the transactions is different from in the server segment because the WAAS devices exchange additional control traffic. Monitoring the WAN segment is useful to show WAAS benefits, such as bandwidth reduction on the WAN.
Table 9-5 Key NAM-2 Response Time Metrics
Metric Type Metric Description
Network Network Delay (ND) The client-server round-trip delay during TCP connection setup.
Client Network Delay (CND) RTT between NAM and client during TCP connection setup.
Server Application Delay (AD) Time f the application server to start responding to a request from the client.
Server Network Delay (SND) RTT between NAM and server during TCP connection setup.
# of clients Number of branch office clients connecting to a server in the data center.
# of connections Number of TCP connections connecting to a server in the data center.
Application Transaction Time (TT) Time it takes to complete a client-server application transaction.
Number of transactions Number of client-server application transactions seen by the NAM.
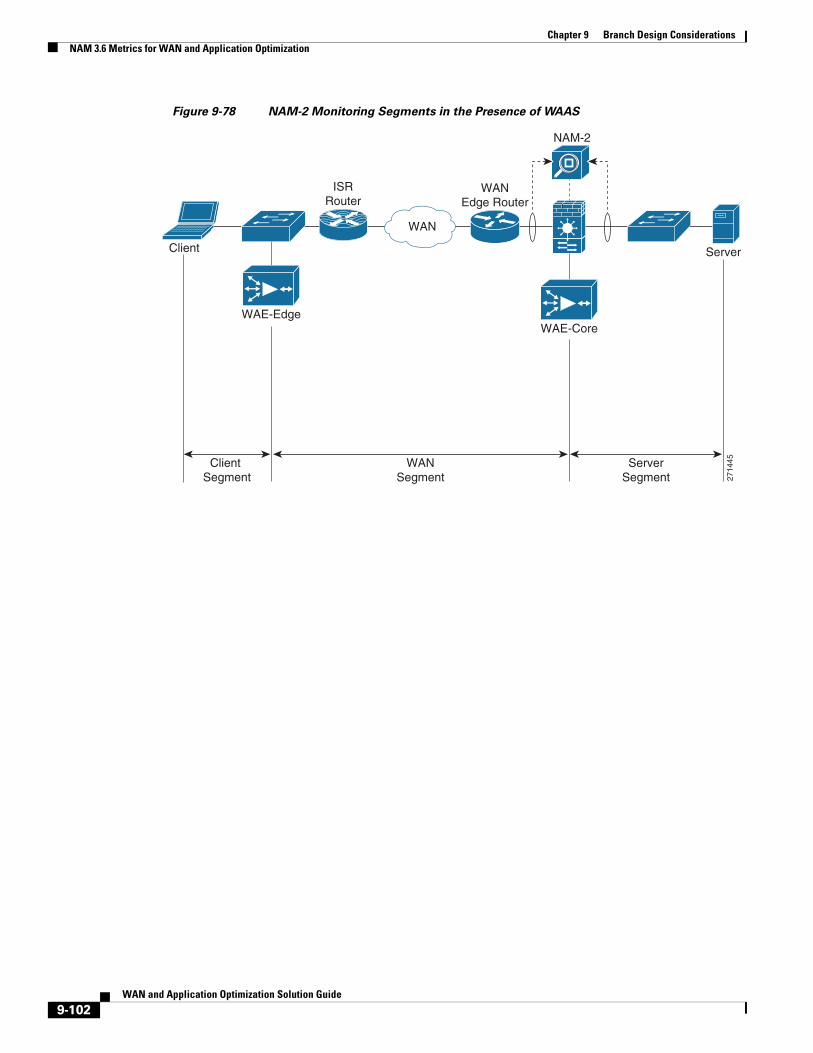
9-102WAN and Application Optimization Solution Guide
Chapter 9 Branch Design ConsiderationsNAM 3.6 Metrics for WAN and Application Optimization
Figure 9-78 NAM-2 Monitoring Segments in the Presence of WAAS
2714
45
WAE-Edge
ISRRouter
WANEdge Router
WAN
ServerClient
WAE-Core
Client Segment
WANSegment
ServerSegment
NAM-2
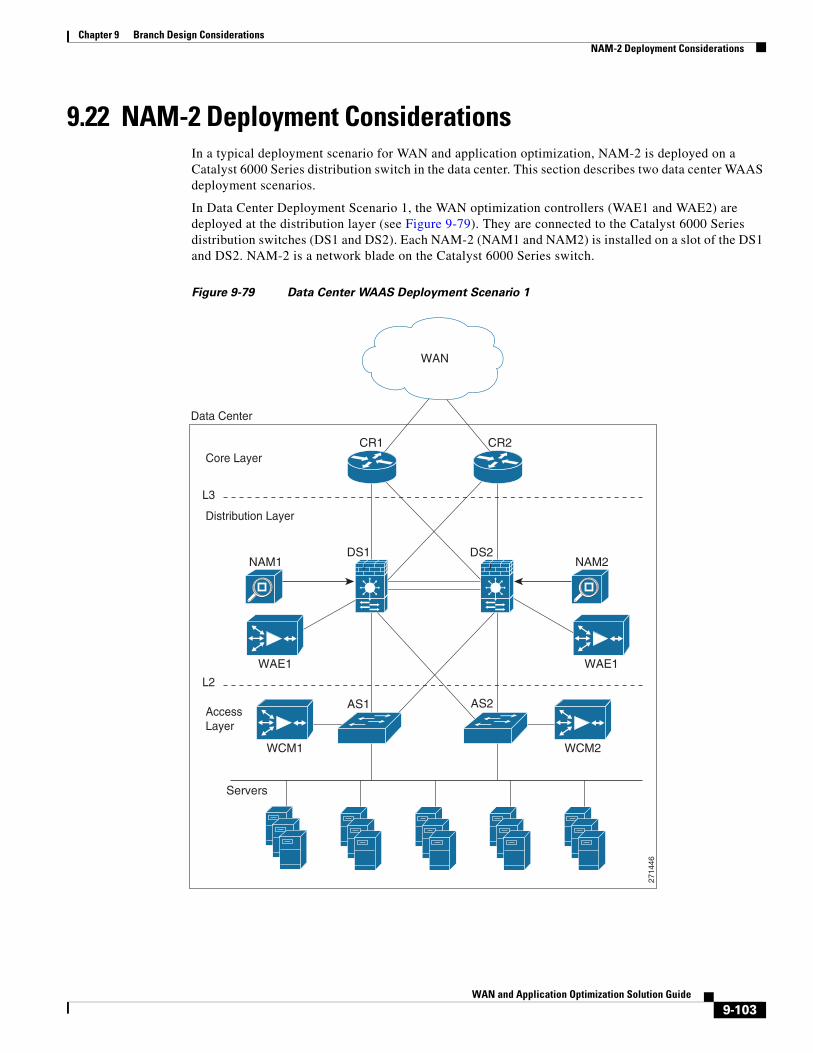
9-103WAN and Application Optimization Solution Guide
Chapter 9 Branch Design ConsiderationsNAM-2 Deployment Considerations
9.22 NAM-2 Deployment ConsiderationsIn a typical deployment scenario for WAN and application optimization, NAM-2 is deployed on a Catalyst 6000 Series distribution switch in the data center. This section describes two data center WAAS deployment scenarios.
In Data Center Deployment Scenario 1, the WAN optimization controllers (WAE1 and WAE2) are deployed at the distribution layer (see Figure 9-79). They are connected to the Catalyst 6000 Series distribution switches (DS1 and DS2). Each NAM-2 (NAM1 and NAM2) is installed on a slot of the DS1 and DS2. NAM-2 is a network blade on the Catalyst 6000 Series switch.
Figure 9-79 Data Center WAAS Deployment Scenario 1
2714
46
Data Center
AccessLayer
Distribution Layer
Core Layer
L3
L2
CR1 CR2
WAN
Servers
AS1 AS2
DS1 DS2
WAE1
WCM2WCM1
NAM1
WAE1
NAM2

9-104WAN and Application Optimization Solution Guide
Chapter 9 Branch Design ConsiderationsNAM-2 Deployment Considerations
In Data Center Deployment Scenario 2, the WAN optimization controllers (WAE1 and WAE2) are deployed at the core layer, as shown in Figure 9-80, and are connected to the core routers (CR1 and CR2). The core routers can be Cisco 7200 or 7600 Series routers or Catalyst 6000 Series switches.
Figure 9-80 Data Center WAAS Deployment Scenario 2
2714
47
Data Center
AccessLayer
Distribution Layer
Core Layer
L3
L2
WAN
Servers
AS1 AS2
DS1 DS2
CR1 CR2
WCM2WCM1
NAM2
WAE1
WAE2
NAM1

9-105WAN and Application Optimization Solution Guide
Chapter 9 Branch Design ConsiderationsNAM-2 Data Collection for WAN and Application Optimization
9.23 NAM-2 Data Collection for WAN and Application Optimization
NAM-2 enables the user to select data sources for computing the metrics. For NAM-2, the available data sources follow:
• Local SPAN by VLANs, with visibility for each individual VLAN
• Local SPAN by ports, aggregated by the destination NAM data port
• RSPAN/ERSPAN from another switch by VLANs, with each individual VLAN visible
• RSPAN/ERSPAN from another switch by ports, aggregated by destination data port
• NetFlow data sources either local or remote
Because NAM-2 has only a 1Gb/s capacity, only business critical applications should be monitored.
9.23.1 Data Center Deployment Scenario 1Figure 9-81 illustrates how the NAM monitors data center traffic for data center deployment scenario 2. In this scenario, WCCP redirects traffic to WAAS (WAE-Core). A NAM-2 monitors both nonintercepted and intercepted traffic. For intercepted traffic, NAM-2 use can use its two data-ports to simultaneously monitor the WAN segment (WAN-WAE traffic) and the server segment (LAN-WAE traffic).
Figure 9-81 NAM-2 Monitoring Configuration for Data Center Deployment Scenario 1
Either local SPAN or VACLs can be used to monitor the server segment. Local SPAN is easier to configure, but is limited to capturing either VLANs or ports. For more granular traffic analysis, VACLs can be used on specified VLANs to match traffic based on source IP address, destination IP address, L4 protocol type, source and destination L4 ports, and other information. VACLs are very useful for granular traffic identification and filtering.
Note that the optimized TCP traffic (WAN-WAE traffic and LAN-WAE traffic) is copied to the NAM-2, using SPAN or VACL, before the traffic is redirected to the WAAS device using Web Cache Coordination Protocol (WCCP).
WAN
1876
13
Non-integrated traffic
WAN-WAE traffic(WAN segment)
WAN-WAE traffic(Client segment)
AS1Servers
Access LayerCoreLayer
Data CenterDistribution Layer
NAM-2
CR1
WCCP WCCP
Netflow
SPAN DS1
SPAN or
VACL
Layer 2VLANS
WAN segment Server segment

9-106WAN and Application Optimization Solution Guide
Chapter 9 Branch Design ConsiderationsNAM-2 Data Collection for WAN and Application Optimization
To monitor the WAN segment, NetFlow Data Export on the WAN router can be configured using NAM-2 as a destination. Another option is to use SPAN on the uplinks to the core router; these are typically L3 links, and therefore it is possible to only SPAN the ports of the L3 links.
Note, however, that there is a limit of two local SPAN sessions on the Catalyst 6000 Series switch. This can become an issue if a Firewall Services Module (FWSM) is used on the distribution Catalyst 6500: FWSM uses by default a SPAN session. For more details, refer to Cisco Data Center Infrastructure Design Guide 2.1 Release Notes.
Possible workarounds to this issue follow:
1. Use VACLs for the server segment and SPAN for the WAN segment.
2. Use the no monitor session service module command to disable the FWSM SPAN session. In this case, care must be taken so that multicast sources are not placed behind the FWSM.
3. Use RSPAN on the access switch for the server segment.
9.23.1.1 Monitoring the Server Segment
To monitor the server segment, the recommended method is to use local SPAN to capture traffic on the L2 VLANs interconnecting the distribution Catalyst 6000 Series switch (see Figure 9-82) and the access switch.
Figure 9-82 illustrates how the NAM should monitor data center traffic for data center deployment scenario 2.
Figure 9-82 Monitoring the Server Segment Example Deployment
1876
14
AS2
AS1
802.1Q trunk
802.1Q trunk802.1Q trunk
802.1Q trunk
DS2(secondary
gateway)
DS1(priary
gateway)
NetQoSSA-CO
NAM1
NAM2
Gi1/31
ServerVLAN21
ServerVLAN22
ServerVLAN23

9-107WAN and Application Optimization Solution Guide
Chapter 9 Branch Design ConsiderationsNAM-2 Data Collection for WAN and Application Optimization
The following snippet shows an example configuration at the distribution layer switch. The example assumes that NAM-2 (NAM1) is installed on slot 9 of the Catalyst 6000 Series switch DS1. Here, VLANs 21 and 22 are monitored on NAM-2 data port 1. NAM does not monitor VLAN 23. The example also shows how to monitor the same VLANs using NetQoS SuperAgent Collector (SA-CO) connected at Gi1/31.
1. CONFIGURE SOURCE OF SPAN TRAFFICDS1# monitor session 1 source vlan 21-22
2. CONFIGURE NAM DATA PORT AS A DESTINATION TO SPAN TRAFFICDS1# monitor session 1 destination analysis-module 9 data-port 1
3. OPTIONAL : CONFIGURE NETQOS SUPER AGENT COLLECTORDS1# monitor session 1 destination interface Gi1/31
The following commands can be used to verify the configuration.
4. VERIFY SPAN CONFIGURATIONDS1# show monitor session 1Session 1---------Type : Local SessionSource VLANs : Both : 21-22Destination Ports : Gi1/31analysis-module 9 data-port 1
An alternative option is to use VACLs. The following snippet shows an example configuration at the distribution layer switch. As before, the example assumes that NAM-2 is installed on slot 9 of the switch. Here only TCP traffic on VLANs 21, 22 and 23 is captured on data port 1 of NAM-2.
1. CONFIGURE NAM DATA PORT TO CAPTURE TRAFFICanalysis module 9 data-port 1 captureanalysis module 9 data-port 1 capture allowed-vlan 1-4094
2. CONFIGURE ACCESS LISTS TO CAPTURE TRAFFIC – TCP TRAFFIC IN THIS CASEaccess-list 110 permit ip any anyaccess-list 120 permit tcp any any
3. CONFIGURE VLAN ACCESS MAP - which packets to capture, which to forward onvlan access-map LAN 100 match ip address 120 action forward capture exitvlan access-map LAN 200 match ip address 110 action forward exit
4.APPLY ACCESS MAP TO VLANsvlan filter LAN vlan-list 21-22
The following commands can be used to verify the configuration.
5. VERIFY VLAN FILTER CONFIGURATIONDS1# show vlan filterVLAN Map LAN: Configured on VLANs: 21-22 Active on VLANs: 21-22
6. VERIFY ACCESS-MAP CONFIGURATIONDS1# show vlan access-map LANVlan access-map "LAN" 100

9-108WAN and Application Optimization Solution Guide
Chapter 9 Branch Design ConsiderationsNAM-2 Data Collection for WAN and Application Optimization
match: ip address 120 action: forward captureVlan access-map "LAN" 200 match: ip address 110 action: forward
7. VERIFY NAM PORT CONFIGURATIONDS1# show analysis module 9 data-port 1 stateAnalysis module 9 data-port 1:
Switchport: EnabledAdministrative Mode: trunkOperational Mode: captureAdministrative Trunking Encapsulation: dot1qNegotiation of Trunking: OffAccess Mode VLAN: 1 (default)Trunking Native Mode VLAN: 1 (default)Trunking VLANs Enabled: NONEPruning VLANs Enabled: 2-1001Capture Mode EnabledCapture VLANs Allowed: ALLVlans allowed on trunk: noneVlans allowed and active in management domain: noneVlans in spanning tree forwarding state and not pruned: noneAdministrative Capture Mode: EnabledAdministrative Capture Allowed-vlans: 1-4094
9.23.1.2 Monitoring the WAN Segment
The recommended option for monitoring the WAN segment is to export NetFlow Data from the core router WAN interface link to the NAM-2 at the distribution layer switch.
The following snippet shows an example configuration on the core router CR1 based on the network shown in Figure 9-83. The example assumes that the IP address for NAM-2 is 10.10.0.2.

9-109WAN and Application Optimization Solution Guide
Chapter 9 Branch Design ConsiderationsNAM-2 Data Collection for WAN and Application Optimization
Figure 9-83 NetFlow Data Export to NAM Example
1. CONFIGURE CORE ROUTER CR-1 NETFLOW DATA EXPORTip flow-export version 9interface GigabitEthernet0/2 description Interface to WAN ip address 10.0.3.1 255.255.255.252 ip flow ingress ip flow egress ip route-cache flowinterface GigabitEthernet0/3 description Interface to WAN ip address 10.0.3.5 255.255.255.252 ip flow ingress ip flow egress ip route-cache flow
2. CONFIGURE NAM AS A DESTINATION FOR NETFLOW DATA EXPORTip flow-export destination 10.10.0.2 3000
The user can then use the Web GUI to configure NAM-2 to monitor traffic from that NetFlow data source.
Note NetFlow Data export supports traffic metrics in NAM-2, but does not support response time metrics.
SPAN on the uplinks to the core router can also be configured on the distribution layer Catalyst 6000 Series switch (DS1). As before, the example assumes that NAM-2 is installed on slot 9 of the switch. Here, traffic on the core uplink interfaces (Gi2/4 and Gi2/5) is captured on data port 2 of NAM-2.
1. CONFIGURE SOURCE OF SPAN TRAFFIC
1876
15
Internet
WANEdge
Router
WANEdge
Router
10.0.3.1Gi0/2
10.0.4.1Gi0/2
10.0.4.5Gi0/3
10.0.3.5Gi0/3
Gi2/4
Gi2/5
Gi2/5
Gi2/4
CR1
CR2
NAM1
NAM2
10.10.1.2
DS2
DS1
WAE110.10.2.2
10.10.0.2NetFlow data export
NetFlow data export
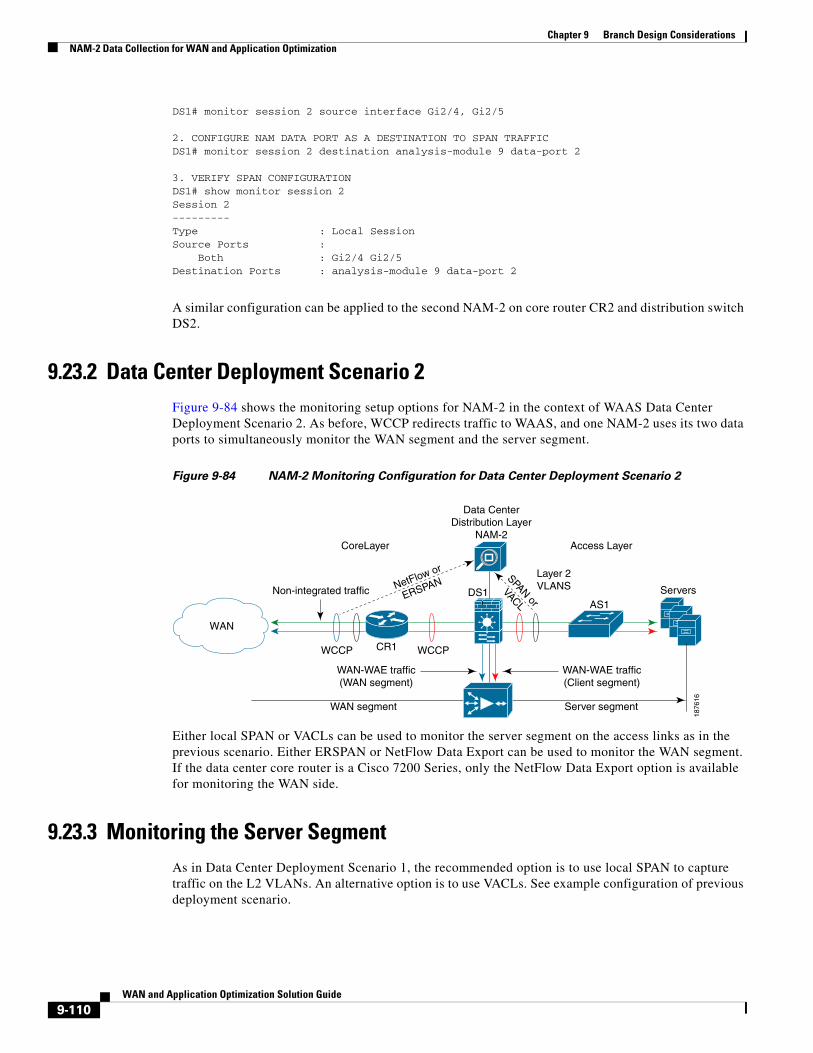
9-110WAN and Application Optimization Solution Guide
Chapter 9 Branch Design ConsiderationsNAM-2 Data Collection for WAN and Application Optimization
DS1# monitor session 2 source interface Gi2/4, Gi2/5
2. CONFIGURE NAM DATA PORT AS A DESTINATION TO SPAN TRAFFICDS1# monitor session 2 destination analysis-module 9 data-port 2
3. VERIFY SPAN CONFIGURATIONDS1# show monitor session 2Session 2---------Type : Local SessionSource Ports : Both : Gi2/4 Gi2/5Destination Ports : analysis-module 9 data-port 2
A similar configuration can be applied to the second NAM-2 on core router CR2 and distribution switch DS2.
9.23.2 Data Center Deployment Scenario 2Figure 9-84 shows the monitoring setup options for NAM-2 in the context of WAAS Data Center Deployment Scenario 2. As before, WCCP redirects traffic to WAAS, and one NAM-2 uses its two data ports to simultaneously monitor the WAN segment and the server segment.
Figure 9-84 NAM-2 Monitoring Configuration for Data Center Deployment Scenario 2
Either local SPAN or VACLs can be used to monitor the server segment on the access links as in the previous scenario. Either ERSPAN or NetFlow Data Export can be used to monitor the WAN segment. If the data center core router is a Cisco 7200 Series, only the NetFlow Data Export option is available for monitoring the WAN side.
9.23.3 Monitoring the Server SegmentAs in Data Center Deployment Scenario 1, the recommended option is to use local SPAN to capture traffic on the L2 VLANs. An alternative option is to use VACLs. See example configuration of previous deployment scenario.
1876
16
WAN
Non-integrated traffic
WAN-WAE traffic(WAN segment)
WAN-WAE traffic(Client segment)
AS1Servers
Access LayerCoreLayer
Data CenterDistribution Layer
NAM-2
CR1 WCCPWCCP
DS1
SPAN or
VACL
Layer 2VLANS
WAN segment Server segment
NetFlow or
ERSPAN

9-111WAN and Application Optimization Solution Guide
Chapter 9 Branch Design ConsiderationsNAM-2 Data Collection for WAN and Application Optimization
9.23.4 Monitoring the WAN SegmentAs in Data Center Deployment Scenario 1, the recommended option for monitoring the WAN segment is to export NetFlow Data from the core router to the NAM-2 at the distribution layer Catalyst 6000 Series switch. See example configuration of previous deployment scenario.
In this particular deployment scenario, an alternative option is to use ERSPAN. ERSPAN is only available on Catalyst 6000 Series switches and Cisco 7600 series routers on IOS Release 12.2(18)SXE and later. The disadvantage of ERSPAN is that it creates additional traffic between the core layer router and the distribution layer switch.
The following snippets show example configurations on the core router and the distribution switch. Figure 9-85 shows the network used in the configurations. First, the ERSPAN traffic source must be configured on the core router 7200-1.
Figure 9-85 ERSPAN Configuration Example
1. CONFIGURE SOURCE OF SPAN TRAFFIC ON CORE ROUTER CR1monitor session 3 type erspan-source source interface Gi0/2 source interface Gi0/3 destination erspan-id 101 ip address 10.0.3.10 origin ip address 10.0.3.20!
After the ERSPAN traffic source is configured, ERSPAN traffic must be redirected to the NAM-2 on the distribution switch. Note that the same erspan-id is used at the distribution switch DS1.
2. CONFIGURE DESTINATION OF ERSPAN TRAFFIC ON DISTRIBUTION CAT6K SWITCH DS1monitor session 3 type erspan-destination
1876
17
Internet
WANEdge
Router
WANEdge
Router
Gi0/2
Gi0/2
Gi0/3
Gi0/3
CR1
CR2
NAM1
NAM2
DS2Lo010.0.4.13
DS1Lo010.0.3.13
WAE1
ERSPAN
ERSPAN
Lo010.0.3.20
Lo010.0.4.20

9-112WAN and Application Optimization Solution Guide
Chapter 9 Branch Design ConsiderationsUse Case 1: Troubleshooting
destination analysis-module 9 data-port 2 source erspan-id 101 ip address 10.0.3.10!
A similar configuration can be applied to the second NAM-2 on core router CR2 and distribution switch DS2.
9.23.5 NAM-2 Deployment Caveats• A NAM-2 data port cannot be used for two different SPAN sessions.
• A NAM-2 data port can be used as either a SPAN or VACL destination.
• NAM-2 can separate and report measurements by VLAN in the same SPAN session. However, NAM-2 cannot separate measurements by ports in the same SPAN session.
• NetFlow Data Export to NAM-2 does not support response time metrics. Only traffic metrics are available.
9.24 Use Case 1: TroubleshootingThis use case focuses on using NAM-2 in the data center to troubleshoot performance problems related to WAN and application optimization.
The following use case describes an implementation that was deployed in a test lab. The use case provides an example of how the WAN and application optimization solution might work in an real-world scenario. However, the use case is not intended to reflect actual performance or behavior in any environment.
9.24.1 ObjectivesUse NAM-2 in the data center to troubleshoot performance problems related to WAN and application optimization.
9.24.2 Assumptions1. WAAS and new QoS policies are deployed.
2. NAM-2 is deployed at the data center Catalyst 6000 Series distribution switch.
3. NAM-2 monitors the server segment using SPAN or VACL on DATA PORT 1.
4. NAM-2 monitors the WAN segment using SPAN on DATA PORT 2.
5. NAM-2 monitors the WAN links of the Data Center using NetFlow Data Export.

9-113WAN and Application Optimization Solution Guide
Chapter 9 Branch Design ConsiderationsUse Case 1: Troubleshooting
9.24.3 Use Case ExampleThe following use case example illustrates the NAM capabilities and features useful for troubleshooting application performance problems related to WAN and application optimization.
A multinational enterprise recently consolidated IT services and applications into fewer data centers to reduce costs. To ensure that remote branch offices can use critical business applications with good performance, the company deployed WAAS to perform WAN and application optimization. After the WAAS deployment WAN traffic from the branch offices was reduced by more than 60%, and application performance is no longer affected by long latencies and limited bandwidth.
Two months after the deployment, IT Support received a call from a user in a remote branch office who complained about the slow response time of an important web-based business application. Because NAM was also deployed in the company data centers, IT Support has an invaluable tool for potential real-time traffic visibility and performance problem isolation and resolution.
The data center and the remote branch office are multihomed to two SP networks (SP-A and SP-B). The SP-A network is for business critical applications and has a strict SLA, while the SP-B network is for best-effort traffic with no SLA. Therefore, critical business applications run on the SP-A network, which the enterprise monitors using Cisco IP SLA.
9.24.4 Use Case WorkflowIT Support first identifies the client IP address (10.0.1.10), and then uses NAM-2 to troubleshoot the problem as follows.
Step 1 Use NAM to focus on user conversations and identify which application and server the user at the remote branch is using.
1. Go to Monitor > Conversations > Application Hosts.
2. Filter conversations using User IP Address to identify the application (HTTP) and the Server IP address (10.3.1.10).
The user application and server are identified.

9-114WAN and Application Optimization Solution Guide
Chapter 9 Branch Design ConsiderationsUse Case 1: Troubleshooting
Figure 9-86 Identifying User Conversations at the Remote Branch
The next step is to isolate the problem. Is it in the server segment or in the WAN segment?
Step 2 [Server Segment] Check for conversation-specific application delay (that is, SRT) metrics in Real Time monitor mode to see if the server application is slow to respond.
1. Go to Monitor > Conversations > Application Hosts.
2. Filter conversations using User IP Address in order to identify the application (HTTP) and the Server IP address (10.3.1.10).
Application delay as shown in Figure 9-87 appears normal, so server problems can be ruled out. The next step is to investigate network problems.
Figure 9-87 Checking Application Delay for a Specific Conversation
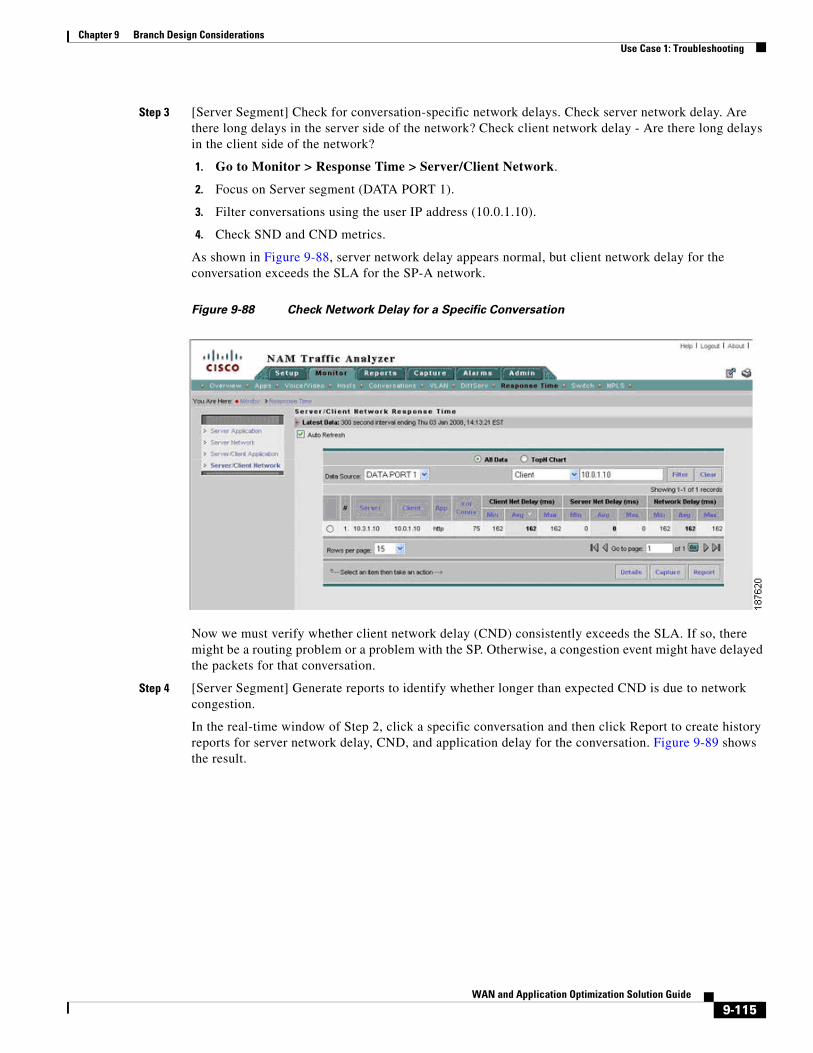
9-115WAN and Application Optimization Solution Guide
Chapter 9 Branch Design ConsiderationsUse Case 1: Troubleshooting
Step 3 [Server Segment] Check for conversation-specific network delays. Check server network delay. Are there long delays in the server side of the network? Check client network delay - Are there long delays in the client side of the network?
1. Go to Monitor > Response Time > Server/Client Network.
2. Focus on Server segment (DATA PORT 1).
3. Filter conversations using the user IP address (10.0.1.10).
4. Check SND and CND metrics.
As shown in Figure 9-88, server network delay appears normal, but client network delay for the conversation exceeds the SLA for the SP-A network.
Figure 9-88 Check Network Delay for a Specific Conversation
Now we must verify whether client network delay (CND) consistently exceeds the SLA. If so, there might be a routing problem or a problem with the SP. Otherwise, a congestion event might have delayed the packets for that conversation.
Step 4 [Server Segment] Generate reports to identify whether longer than expected CND is due to network congestion.
In the real-time window of Step 2, click a specific conversation and then click Report to create history reports for server network delay, CND, and application delay for the conversation. Figure 9-89 shows the result.

9-116WAN and Application Optimization Solution Guide
Chapter 9 Branch Design ConsiderationsUse Case 1: Troubleshooting
Figure 9-89 Create History Report for Specific Conversation
We must also check whether WAAS optimized the conversation.
Step 5 [Server and WAN Segment] Use real-time reports to check whether WAAS is optimizing the conversation. Compare traffic volume in the WAN and server segments and check whether there is a reduction of traffic in the WAN segment.
1. Go to Monitor > Conversations > Network Hosts...
2. Change the data source to focus on the server segment (DATA PORT 1).
3. Use the user IP address (10.0.1.10) to filter conversations.
4. Click a specific conversation and then click Real-Time (do not close window).
5. In Monitor > Conversations > Network Hosts, change the data source to focus on the WAN segment (DATA PORT 2).
6. Use the user IP address (10.0.1.10) to filter conversations.
7. Select a conversation and then click Real-Time (do not close window).
8. Compare WAN segment and server segment traffic volumes in the real-time windows from the preceding steps. Check whether traffic is reduced on the WAN segment.
In this case, there is a reduction of bandwidth at the WAN segment, as shown in Figure 9-90, so it appears that WAAS is optimizing the conversation.

9-117WAN and Application Optimization Solution Guide
Chapter 9 Branch Design ConsiderationsUse Case 1: Troubleshooting
Figure 9-90 Checking whether WAAS Reduces WAN Traffic
To confirm WAAS optimization, we can configure history reports for this conversation and determine whether it is being optimized by WAAS.
Step 6 [Server and WAN Segment] Configure reports to monitor WAAS traffic volume for the conversation.
1. Go to Monitor > Conversations > Network Hosts.
2. Change the data source to focus on the server segment (DATA PORT 1).
3. Use the user IP address (10.0.1.10) to filter conversations.
4. Click a specific conversation and then click Report.
5. In Monitor > Conversations > Network Hosts, change the data source to focus on the WAN Segment (DATA PORT 2).
6. Use the user IP address (10.0.1.10) to filter conversations.
7. Select a conversation and then click Report.
The reports generated in Step 6 are used to confirm the real-time view conclusions reached in Step 5.

9-118WAN and Application Optimization Solution Guide
Chapter 9 Branch Design ConsiderationsUse Case 1: Troubleshooting
Step 7 Ask the user to access the application a few more times.
The traffic generated by the user will be captured on historic reports set up in Steps 4 and 6.
Next, check for congestion on WAN links at the data center and branch site).
Step 8 [WAN Segment] While reports collect data, check whether WAN links at data center site are congested.
1. Go to Monitor > DiffServ > Traffic Stats.
2. Change the data source profile to focus on the SP-A data center WAN link NetFlow Data Export (NDE-DC-WANLinkIn/NDE-DC-WANLinkOut).
3. Check traffic by aggregation class.
As shown in Figure 9-91, there is no congestion on the SP-A data center WAN link.
Figure 9-91 Checking for Congestion on the Data Center WAN Link
Step 9 [WAN Segment] Check whether the SP-A WAN link at the branch office site is congested.
Either check the router using CLI, use a third-party tool, or configure NetFlow Export to NAM-2 at DC and follow these steps:
1. Go to Monitor > DiffServ > Traffic Stats.
2. Change the data source profile to focus on the branch office WAN link NetFlow Data Export (NDE-DC-WANLinkIn/NDE-DC-WANLinkOut).
3. Check traffic by aggregation class.

9-119WAN and Application Optimization Solution Guide
Chapter 9 Branch Design ConsiderationsUse Case 1: Troubleshooting
As shown in Figure 9-92, there is no congestion on the SP-A branch site WAN link.
Figure 9-92 Checking for Congestion at the Remote Site WAN Link
Review the history reports to confirm real-time view metrics.
Step 10 [Server Segment] Review the conversation-specific history reports that were set up in Steps 4 and 6. Compare Network Delay (SND and CND) with IP SLA reports for the SP-A network.
1. Go to Reports > Basic Reports.
2. Select Type: Response Type and Source (DATA PORT 1).
3. Use the user IP address (10.0.1.10) to filter conversations.
4. Click Application Delay, Server Network Delay, and Client Network Delay Reports for the user conversation.
Figure 9-93 shows that CND and SND (160ms) is much longer than the IP SLA reported value (80ms) for the SP-A network. This suggests that the conversation is probably routed onto the wrong WAN link.

9-120WAN and Application Optimization Solution Guide
Chapter 9 Branch Design ConsiderationsUse Case 1: Troubleshooting
Figure 9-93 Network Delay History Report for a Specific Conversation
Next, compare bandwidth for the specific conversation on the server and WAN segments.
1. Go to Reports > Basic Reports.
2. Select Type: Conversation and filter by Source: Server Segment (DATA PORT 1).
3. Click on reports for the user conversation.
4. Select Type: Conversation and filter by Source: WAN Segment (DATA PORT 2).
5. Click on reports for the user conversation.
6. Compare conversation reports for server and WAN segments.
The reports in Figure 9-94 and Figure 9-95 show that conversation traffic on the server segment (18KB/s) is significantly greater than traffic on the WAN segment (5KB/s). This confirms that WAAS is optimizing conversation traffic.
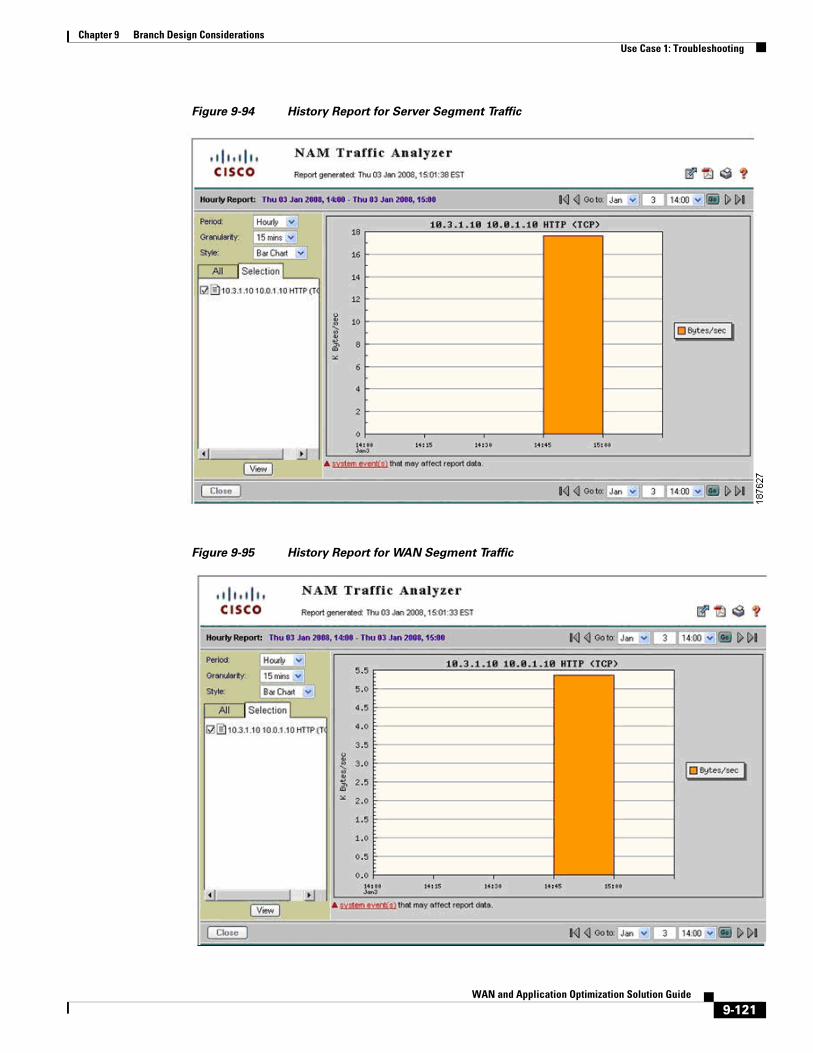
9-121WAN and Application Optimization Solution Guide
Chapter 9 Branch Design ConsiderationsUse Case 1: Troubleshooting
Figure 9-94 History Report for Server Segment Traffic
Figure 9-95 History Report for WAN Segment Traffic
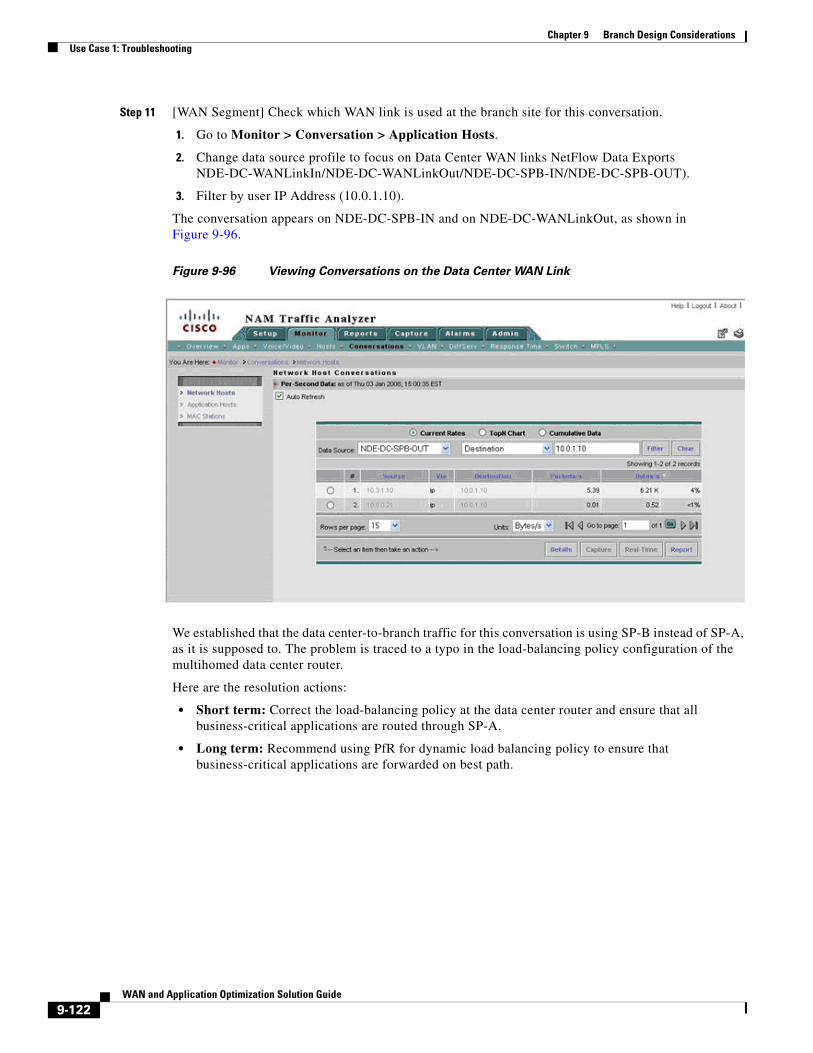
9-122WAN and Application Optimization Solution Guide
Chapter 9 Branch Design ConsiderationsUse Case 1: Troubleshooting
Step 11 [WAN Segment] Check which WAN link is used at the branch site for this conversation.
1. Go to Monitor > Conversation > Application Hosts.
2. Change data source profile to focus on Data Center WAN links NetFlow Data ExportsNDE-DC-WANLinkIn/NDE-DC-WANLinkOut/NDE-DC-SPB-IN/NDE-DC-SPB-OUT).
3. Filter by user IP Address (10.0.1.10).
The conversation appears on NDE-DC-SPB-IN and on NDE-DC-WANLinkOut, as shown in Figure 9-96.
Figure 9-96 Viewing Conversations on the Data Center WAN Link
We established that the data center-to-branch traffic for this conversation is using SP-B instead of SP-A, as it is supposed to. The problem is traced to a typo in the load-balancing policy configuration of the multihomed data center router.
Here are the resolution actions:
• Short term: Correct the load-balancing policy at the data center router and ensure that all business-critical applications are routed through SP-A.
• Long term: Recommend using PfR for dynamic load balancing policy to ensure that business-critical applications are forwarded on best path.

9-123WAN and Application Optimization Solution Guide
Chapter 9 Branch Design ConsiderationsUse Case 2: Conversation Analysis
9.25 Use Case 2: Conversation AnalysisThis use case describes how to use NAM traffic volume, response time history reports, real-time monitoring to decide where to deploy WAAS and QoS and to validate WAN and application optimization benefits.
The use case describes an implementation that was deployed in a test lab. The use case provides an example of how the WAN and application optimization solution might work in an real-world scenario. However, the use case is not intended to reflect actual performance or behavior in any environment.
9.25.1 ObjectivesUse NAM traffic volume and response time history reports and real-time monitoring to:
• Make decisions where to deploy WAAS and QoS policies (before WAN and application optimization deployment – Scenario A)
• Validate WAN and application optimization benefits (during deployment – Scenario B)
NAM TopN reports are used to target specific conversations and generate history reports for the required analysis.
Scenario A assumes that WAAS is not deployed yet while Scenario B assumes that WAAS is deployed.
9.25.2 Assumptions 1. NAM-2 is deployed at the data center Catalyst 6000 Series distribution switch.
2. NAM-2 uses SPAN or VACL to monitor the server segment on DATA PORT 1.
3. NAM-2 uses SPAN to monitor the WAN segment on DATA PORT 2
9.25.3 Use Case ExampleScenario A: A multinational enterprise is thinking about deploying WAN and application optimization and needs to identify the sites that would benefit most from WAN and application optimization.
Scenario B: The multinational enterprise in Scenario A started a pilot WAN and application optimization deployment. During the pilot, WAAS was deployed at 09:45 AM on November 15 to optimize a remote site that was experiencing poor performance. The customer uses NAM to demonstrate that WAAS improves application service delivery, thereby justifying WAAS deployments in other remote sites.

9-124WAN and Application Optimization Solution Guide
Chapter 9 Branch Design ConsiderationsUse Case 2: Conversation Analysis
9.25.4 Use Case Workflow
9.25.4.1 Scenario A
Step 1 [Scenario A] Create a history report for top applications, as shown in Figure 9-97. This will identify the top applications running on the network. Even though this does not provide a breakdown per branch site, one can see if there is scope for improvement using WAN and application optimization.
Figure 9-97 Top Applications
Step 2 [Scenario A] Create a history report for top conversations (including application layer (see Figure 9-98). This will help identify top application conversations and show the traffic volume (see Figure 9-99). Top application conversations will show up to the top 50 conversations. Based on this information, the user can deduce the most active branch sites and applications in terms of volume.
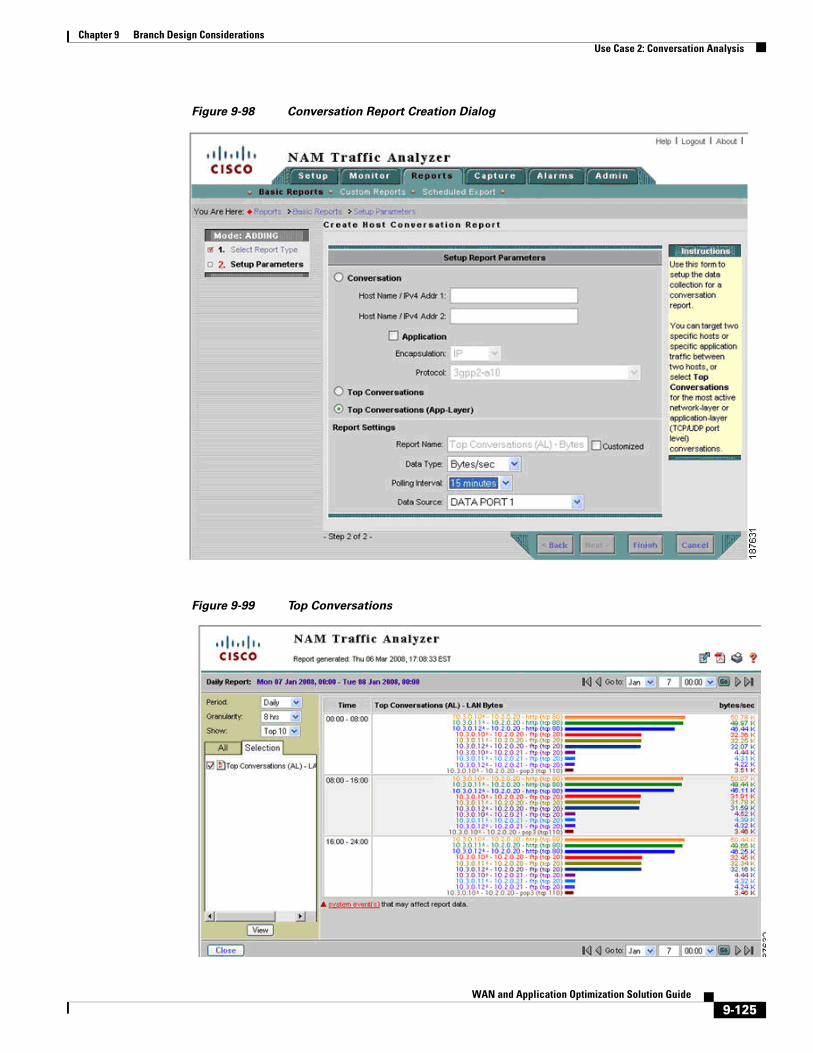
9-125WAN and Application Optimization Solution Guide
Chapter 9 Branch Design ConsiderationsUse Case 2: Conversation Analysis
Figure 9-98 Conversation Report Creation Dialog
Figure 9-99 Top Conversations
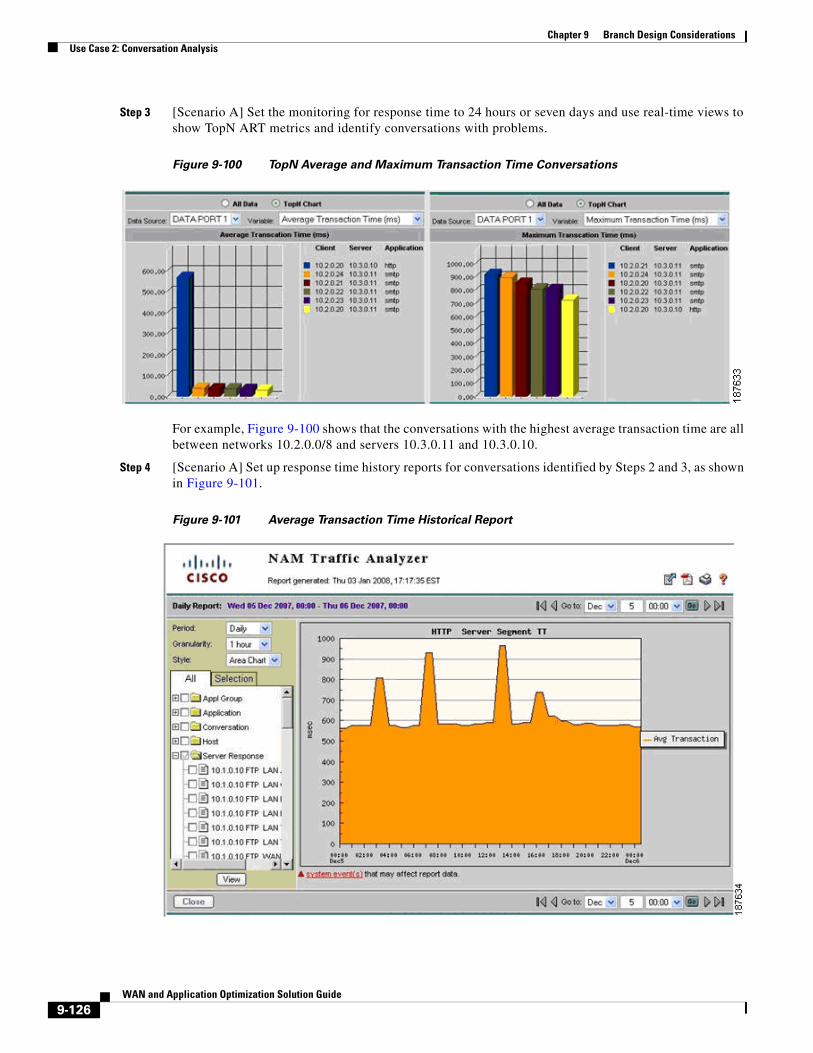
9-126WAN and Application Optimization Solution Guide
Chapter 9 Branch Design ConsiderationsUse Case 2: Conversation Analysis
Step 3 [Scenario A] Set the monitoring for response time to 24 hours or seven days and use real-time views to show TopN ART metrics and identify conversations with problems.
Figure 9-100 TopN Average and Maximum Transaction Time Conversations
For example, Figure 9-100 shows that the conversations with the highest average transaction time are all between networks 10.2.0.0/8 and servers 10.3.0.11 and 10.3.0.10.
Step 4 [Scenario A] Set up response time history reports for conversations identified by Steps 2 and 3, as shown in Figure 9-101.
Figure 9-101 Average Transaction Time Historical Report

9-127WAN and Application Optimization Solution Guide
Chapter 9 Branch Design ConsiderationsUse Case 2: Conversation Analysis
Step 5 [Scenario A] Set up conversation volume history reports for conversations identified by Steps 2 and 3 monitoring the server segment (DATA PORT 1).
After setting up the reports, data is collected for a specific period (for example, one week) before it is examined by the IT department. Based on the generated reports, applications and branch sites that experience long response times can be identified and a decision can be reached where to deploy WAAS.
9.25.4.2 Scenario B
During WAAS deployment, the benefits of WAAS can be validated by NAM as follows:
Before WAAS is turned on:
Step 1 [Scenario B] Set up conversation volume history reports for conversations in step 5 but this time monitoring the WAN segment (DATA PORT 2).
Both sides of WAAS are now being monitored by NAM-2.
After WAAS is turned on:
Step 2 [Scenario B] Review response time history reports for conversations set up in step 4. Applications optimized by WAAS should experience improved response times (See Figure 9-102).
Figure 9-102 Conversation Transaction Time Before and After WAAS

9-128WAN and Application Optimization Solution Guide
Chapter 9 Branch Design ConsiderationsUse Case 2: Conversation Analysis
Step 3 [Scenario B] Review conversation volume history reports for conversations set up in step 5 and 6. Applications optimized by WAAS should experience reduced traffic volume on the WAN Segment (see Figure 9-103).
Figure 9-103 WAN Segment Conversation Traffic Volume
9.25.5 Deployment CaveatsThe following deployment caveats apply to NetQoS and Cisco NAM.
• If server load balancing (SLB) or SSL offloading takes place at the distribution layer (for example, using ACE), traffic seen at the WAN Segment shows the virtual IP address (VIP) of the SLB/SSL offloader. On the other hand, traffic in the server segment shows the real IP address of the server being used. This makes it difficult to correlate traffic on the WAN segment with traffic on the server segment.
• If a FWSM is present at the distribution layer, the WAN segment accounts DC incoming traffic before the FWSM blocks it. Similarly, the LAN segment accounts DC outgoing traffic before FWSM blocks it. This can result in discrepancies in the volume of traffic in the LAN and WAN segments.
• The Catalyst 6000 Series has a limit of two SPAN sessions. However, each session can have multiple sources and destinations. For example, both NetQoS and NAM-2 can share a single SPAN session on the server segment.
• On PFC3, IOS Release 12.2(18) SXE and later releases support 128 sources in each local SPAN/RSPAN/ERSPAN session; 64 destinations per session are supported for local SPAN. See Configuring Local SPAN, Remote SPAN (RSPAN), and Encapsulated RSPAN section of Catalyst 6500 Release 12.2SXF Software Configuration Guide.

9-129WAN and Application Optimization Solution Guide
Chapter 9 Branch Design ConsiderationsReferences
• A SPAN session can have VLANs or ports as data sources, but not both in the same session. Therefore, one SPAN session cannot monitor both the WAN and server segments. An additional SPAN or VACL session is required.
• Only two NetFlow Data Export destinations are supported. If NetFlow data is exported to NAM-2 and NetQoS Reporter Analyzer, NetFlow data cannot be exported to other destinations. To work around this limitation, use of a flow replicator.
• NAM-2 and NetQoS have a 1Gb/s capacity limitation.
9.26 References1. Enterprise Branch Wide Area Application Services Design Guide:
http://www.cisco.com/application/pdf/en/us/guest/netsol/ns377/c649/ccmigration_09186a008081c7da.pdf
2. Enterprise QoS Solution Reference Network Design Guide:
http://www.cisco.com/en/US/docs/solutions/Enterprise/WAN_and_MAN/QoS_SRND/QoS-SRND-Book.html
3. Transport Diversity: PfR Design Guide:
http://www.cisco.com/application/pdf/en/us/guest/netsol/ns483/c649/ccmigration_09186a008094e673.pdf
4. Enterprise Branch Security Design Guide:
http://www.cisco.com/application/pdf/en/us/guest/netsol/ns171/c649/ccmigration_09186a00807593b6.pdf

9-130WAN and Application Optimization Solution Guide
Chapter 9 Branch Design ConsiderationsReferences


![Reliability demonstration test for load-sharing systems with exponential … · load-sharing systems are studied in [21–23]. Though load-sharing plays an important role in system](https://img.pdfslide.net/doc/110x75/61277d39a5fd5c5284375127/reliability-demonstration-test-for-load-sharing-systems-with-exponential-load-sharing.jpg)