Embed Size (px)
Citation preview
HAL Id: hal-01100647https://hal.inria.fr/hal-01100647
Submitted on 8 Jan 2015
HAL is a multi-disciplinary open accessarchive for the deposit and dissemination of sci-entific research documents, whether they are pub-lished or not. The documents may come fromteaching and research institutions in France orabroad, or from public or private research centers.
L’archive ouverte pluridisciplinaire HAL, estdestinée au dépôt et à la diffusion de documentsscientifiques de niveau recherche, publiés ou non,émanant des établissements d’enseignement et derecherche français ou étrangers, des laboratoirespublics ou privés.
Branch Prediction and the Performance of Interpreters -Don’t Trust Folklore
Erven Rohou, Bharath Narasimha Swamy, André Seznec
To cite this version:Erven Rohou, Bharath Narasimha Swamy, André Seznec. Branch Prediction and the Performance ofInterpreters - Don’t Trust Folklore. International Symposium on Code Generation and Optimization,Feb 2015, Burlingame, United States. �hal-01100647�
Branch Prediction and the Performanceof Interpreters – Don’t Trust Folklore
Erven ROHOU Bharath NARASIMHA SWAMY Andre SEZNEC
Inria, [email protected]
AbstractInterpreters have been used in many contexts. They provideportability and ease of development at the expense of per-formance. The literature of the past decade covers analysisof why interpreters are slow, and many software techniquesto improve them. A large proportion of these works focuseson the dispatch loop, and in particular on the implementa-tion of the switch statement: typically an indirect branchinstruction. Folklore attributes a significant penalty to thisbranch, due to its high misprediction rate. We revisit this as-sumption, considering state-of-the-art branch predictors andthe three most recent Intel processor generations on currentinterpreters. Using both hardware counters on Haswell, thelatest Intel processor generation, and simulation of the IT-TAGE, we show that the accuracy of indirect branch predic-tion is no longer critical for interpreters. We further comparethe characteristics of these interpreters and analyze why theindirect branch is less important than before.
1. IntroductionInterpreters go back to the infancy of computer science.At some point, just-in-time (JIT) compilation technologymatured enough to deliver better performance, and was madepopular by Java [6]. Writing a JIT compiler, though, is acomplicated task. Conversely, interpreters provide ease ofimplementation, and portability, at the expense of speed.
Interpreters are still widely used. They are much easierto develop, maintain, and port applications on new architec-tures. Some languages used by domain scientists are exe-cuted mainly through interpreters, e.g. R, Python, Matlab...Some properties of widely adopted languages, such as dy-namic typing, also make it more difficult to develop efficientJIT compilers. These dynamic features turn out to be heavilyused in real applications [25]. On lower-end systems, whereshort time-to-market is key, JIT compilers may also not becommercially viable, and they rely on interpreters.
Scientists from both CERN and Fermilab report [23] that“many of LHC experiments’ algorithms are both designedand used in interpreters”. As another example, the need foran interpreter is also one of the three reasons motivatingthe choice of Jython for the data analysis software of the
Herschel Space Observatory [36]. Scientists at CERN alsodeveloped an interpreter for C/C++ [7].
Although they are designed for portability, interpretersare often large and complex codes. Part of this is due to theneed for performance. The core of an interpreter is an infi-nite loop that reads the next bytecode, decodes it, and per-forms the appropriate action. Naive decoding implementedin C consists in a large switch statement (see Figure 1 (a)),that gets translated into a jump table and an indirect jump.Conventional wisdom states that this indirect jump incurs amajor performance degradation on deeply pipelined archi-tectures because it is hardly predictable (see Section 6 forrelated work).
The contributions of this paper are the following.
• We revisit the performance of switch-based interpreters,focusing on the impact the indirect branch instruction,on the most recent Intel processor generations(Nehalem,Sandy Bridge and Haswell) and current interpreted lan-guages (Python, Javascript, CLI). Our experiments andmeasures show that on the latest processor generation,the performance of the predictors and the characteristicsof interpreters make the indirect branch much less criti-cal than before. The global branch misprediction rate ob-served when executing interpreters drops from a dramatic12-20 MPKI range on Nehalem to a only 0.5-2 MPKIrange on Haswell.
• We evaluate the performance of a state-of-the-art indirectbranch predictor, ITTAGE [31], proposed in the literatureon the same interpreters, and we show that, when execut-ing interpreters, the branch prediction accuracy observedon Haswell and on ITTAGE are in the same range.
The rest of this paper is organized as follows. Section2 motivates our work: it analyzes in more details the per-formance of switch-based interpreters, it introduces jumpthreading, and measures its impact using current inter-preters. Section 3 reviews the evolution of branch predictionover the last decades, and presents the state-of-the-art branchpredictors TAGE for conditional branches and ITTAGE [31]for indirect branches. Section 4 presents experimental setup.In Section 5, we present our experimental results and ourfindings on branch prediction impact on interpreter perfor-mance. Section 6 reviews related work. Section 7 concludes.
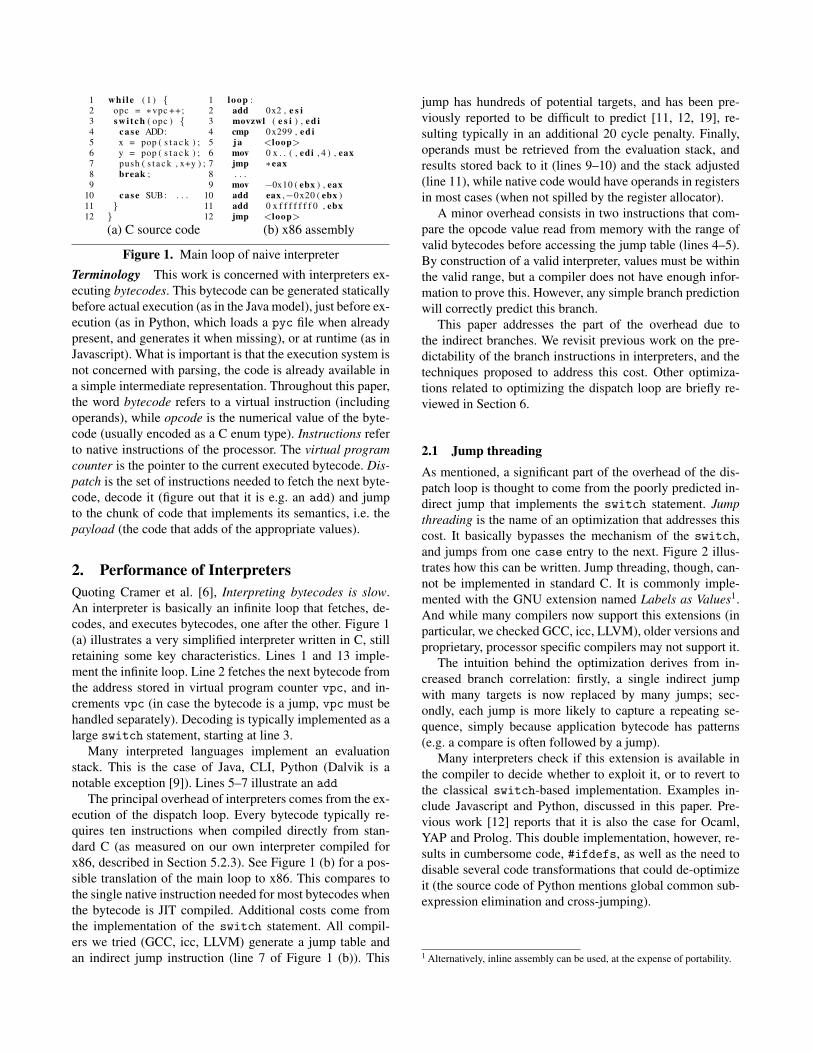
1 whi le ( 1 ) {2 opc = ∗vpc ++;3 sw i t ch ( opc ) {4 case ADD:5 x = pop ( s t a c k ) ;6 y = pop ( s t a c k ) ;7 push ( s t a c k , x+y ) ;8 break ;9
10 case SUB: . . .11 }12 }
1 loop :2 add 0x2 , e s i3 movzwl ( e s i ) , e d i4 cmp 0x299 , e d i5 ja <loop>6 mov 0 x . . ( , edi , 4 ) , eax7 jmp ∗eax8 . . .9 mov −0x10 ( ebx ) , eax
10 add eax ,−0x20 ( ebx )11 add 0 x f f f f f f f 0 , ebx12 jmp <loop>
(a) C source code (b) x86 assembly
Figure 1. Main loop of naive interpreter
Terminology This work is concerned with interpreters ex-ecuting bytecodes. This bytecode can be generated staticallybefore actual execution (as in the Java model), just before ex-ecution (as in Python, which loads a pyc file when alreadypresent, and generates it when missing), or at runtime (as inJavascript). What is important is that the execution system isnot concerned with parsing, the code is already available ina simple intermediate representation. Throughout this paper,the word bytecode refers to a virtual instruction (includingoperands), while opcode is the numerical value of the byte-code (usually encoded as a C enum type). Instructions referto native instructions of the processor. The virtual programcounter is the pointer to the current executed bytecode. Dis-patch is the set of instructions needed to fetch the next byte-code, decode it (figure out that it is e.g. an add) and jumpto the chunk of code that implements its semantics, i.e. thepayload (the code that adds of the appropriate values).
2. Performance of InterpretersQuoting Cramer et al. [6], Interpreting bytecodes is slow.An interpreter is basically an infinite loop that fetches, de-codes, and executes bytecodes, one after the other. Figure 1(a) illustrates a very simplified interpreter written in C, stillretaining some key characteristics. Lines 1 and 13 imple-ment the infinite loop. Line 2 fetches the next bytecode fromthe address stored in virtual program counter vpc, and in-crements vpc (in case the bytecode is a jump, vpc must behandled separately). Decoding is typically implemented as alarge switch statement, starting at line 3.
Many interpreted languages implement an evaluationstack. This is the case of Java, CLI, Python (Dalvik is anotable exception [9]). Lines 5–7 illustrate an add
The principal overhead of interpreters comes from the ex-ecution of the dispatch loop. Every bytecode typically re-quires ten instructions when compiled directly from stan-dard C (as measured on our own interpreter compiled forx86, described in Section 5.2.3). See Figure 1 (b) for a pos-sible translation of the main loop to x86. This compares tothe single native instruction needed for most bytecodes whenthe bytecode is JIT compiled. Additional costs come fromthe implementation of the switch statement. All compil-ers we tried (GCC, icc, LLVM) generate a jump table andan indirect jump instruction (line 7 of Figure 1 (b)). This
jump has hundreds of potential targets, and has been pre-viously reported to be difficult to predict [11, 12, 19], re-sulting typically in an additional 20 cycle penalty. Finally,operands must be retrieved from the evaluation stack, andresults stored back to it (lines 9–10) and the stack adjusted(line 11), while native code would have operands in registersin most cases (when not spilled by the register allocator).
A minor overhead consists in two instructions that com-pare the opcode value read from memory with the range ofvalid bytecodes before accessing the jump table (lines 4–5).By construction of a valid interpreter, values must be withinthe valid range, but a compiler does not have enough infor-mation to prove this. However, any simple branch predictionwill correctly predict this branch.
This paper addresses the part of the overhead due tothe indirect branches. We revisit previous work on the pre-dictability of the branch instructions in interpreters, and thetechniques proposed to address this cost. Other optimiza-tions related to optimizing the dispatch loop are briefly re-viewed in Section 6.
2.1 Jump threadingAs mentioned, a significant part of the overhead of the dis-patch loop is thought to come from the poorly predicted in-direct jump that implements the switch statement. Jumpthreading is the name of an optimization that addresses thiscost. It basically bypasses the mechanism of the switch,and jumps from one case entry to the next. Figure 2 illus-trates how this can be written. Jump threading, though, can-not be implemented in standard C. It is commonly imple-mented with the GNU extension named Labels as Values1.And while many compilers now support this extensions (inparticular, we checked GCC, icc, LLVM), older versions andproprietary, processor specific compilers may not support it.
The intuition behind the optimization derives from in-creased branch correlation: firstly, a single indirect jumpwith many targets is now replaced by many jumps; sec-ondly, each jump is more likely to capture a repeating se-quence, simply because application bytecode has patterns(e.g. a compare is often followed by a jump).
Many interpreters check if this extension is available inthe compiler to decide whether to exploit it, or to revert tothe classical switch-based implementation. Examples in-clude Javascript and Python, discussed in this paper. Pre-vious work [12] reports that it is also the case for Ocaml,YAP and Prolog. This double implementation, however, re-sults in cumbersome code, #ifdefs, as well as the need todisable several code transformations that could de-optimizeit (the source code of Python mentions global common sub-expression elimination and cross-jumping).
1 Alternatively, inline assembly can be used, at the expense of portability.
void∗ l a b e l s [ ] = { &&ADD, &&SUB . . . } ;. . .goto ∗ l a b e l s [∗ vpc + + ] ;
ADD:x = pop ( s t a c k ) ;y = pop ( s t a c k ) ;push ( s t a c k , x+y ) ;goto ∗ l a b e l s [∗ vpc + + ] ;
SUB: . . .goto ∗ l a b e l s [∗ vpc + + ] ;
Figure 2. Token threading, using a GNU extension
2.2 Motivation ExampleCurrent versions of Python-3 and Javascript automaticallytake advantage of threaded code when supported by thecompiler. The implementation consists in two versions (plainswitch and threaded code), one of them being selectedat compile time, based on compiler support for the Labelsas Values extension. Threaded code can be easily disabledthough the configure script or a #define.
In 2001, Ertl and Gregg [11] observed that:
“for current branch predictors, threaded code inter-preters cause fewer mispredictions, and are almosttwice as fast as switch based interpreters on modernsuperscalar architectures”.
The current source code of Python-3 also says:
“At the time of this writing, the threaded code versionis up to 15-20% faster than the normal switch version,depending on the compiler and the CPU architecture.”
We tracked this comment back to January 2009.We experimented with Python-3.3.2, both with and with-
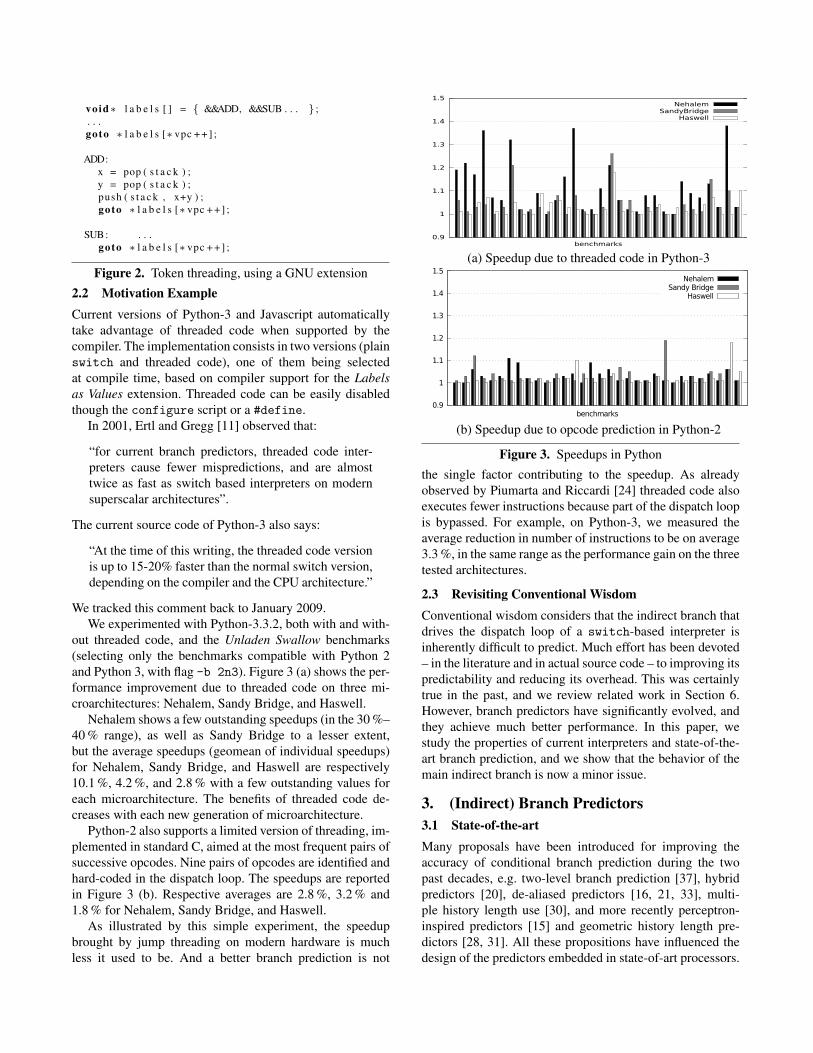
out threaded code, and the Unladen Swallow benchmarks(selecting only the benchmarks compatible with Python 2and Python 3, with flag -b 2n3). Figure 3 (a) shows the per-formance improvement due to threaded code on three mi-croarchitectures: Nehalem, Sandy Bridge, and Haswell.
Nehalem shows a few outstanding speedups (in the 30 %–40 % range), as well as Sandy Bridge to a lesser extent,but the average speedups (geomean of individual speedups)for Nehalem, Sandy Bridge, and Haswell are respectively10.1 %, 4.2 %, and 2.8 % with a few outstanding values foreach microarchitecture. The benefits of threaded code de-creases with each new generation of microarchitecture.
Python-2 also supports a limited version of threading, im-plemented in standard C, aimed at the most frequent pairs ofsuccessive opcodes. Nine pairs of opcodes are identified andhard-coded in the dispatch loop. The speedups are reportedin Figure 3 (b). Respective averages are 2.8 %, 3.2 % and1.8 % for Nehalem, Sandy Bridge, and Haswell.
As illustrated by this simple experiment, the speedupbrought by jump threading on modern hardware is muchless it used to be. And a better branch prediction is not
0.9
1
1.1
1.2
1.3
1.4
1.5
benchmarks
NehalemSandyBridge
Haswell
(a) Speedup due to threaded code in Python-3
0.9
1
1.1
1.2
1.3
1.4
1.5
benchmarks
NehalemSandy Bridge
Haswell
(b) Speedup due to opcode prediction in Python-2
Figure 3. Speedups in Python
the single factor contributing to the speedup. As alreadyobserved by Piumarta and Riccardi [24] threaded code alsoexecutes fewer instructions because part of the dispatch loopis bypassed. For example, on Python-3, we measured theaverage reduction in number of instructions to be on average3.3 %, in the same range as the performance gain on the threetested architectures.
2.3 Revisiting Conventional WisdomConventional wisdom considers that the indirect branch thatdrives the dispatch loop of a switch-based interpreter isinherently difficult to predict. Much effort has been devoted– in the literature and in actual source code – to improving itspredictability and reducing its overhead. This was certainlytrue in the past, and we review related work in Section 6.However, branch predictors have significantly evolved, andthey achieve much better performance. In this paper, westudy the properties of current interpreters and state-of-the-art branch prediction, and we show that the behavior of themain indirect branch is now a minor issue.
3. (Indirect) Branch Predictors3.1 State-of-the-artMany proposals have been introduced for improving theaccuracy of conditional branch prediction during the twopast decades, e.g. two-level branch prediction [37], hybridpredictors [20], de-aliased predictors [16, 21, 33], multi-ple history length use [30], and more recently perceptron-inspired predictors [15] and geometric history length pre-dictors [28, 31]. All these propositions have influenced thedesign of the predictors embedded in state-of-art processors.
While effective hardware predictors probably combineseveral prediction schemes (a global history component, aloop predictor and maybe a local history predictor), TAGE[29, 31] is generally considered as the state-of-the-art inglobal history based conditional branch prediction. TAGEfeatures several (partially) tagged predictor tables. The ta-bles are indexed with increasing global history length, theset of history lengths forming a geometric series. The pre-diction is given by the longest hitting table. TAGE predic-tors featuring maximum history length of several hundredsof bits can be implemented in real hardware at an affordablestorage cost. Therefore TAGE is able to capture correlationbetween branches distant by several hundreds or even thou-sands of instructions.
For a long time, indirect branch targets were naively pre-dicted by the branch target buffer, i.e. the target of the lastoccurrence of the branch was predicted. However the accu-racy of conditional branch predictors is becoming higher andhigher. The penalties for a misprediction on a conditionalbranch or on an indirect branch are in the same range. There-fore even on an application featuring a moderate amountof indirect branches, the misprediction penalty contributionof indirect branches may be very significant if one neglectsthe indirect branch prediction. Particularly on applicationsfeaturing switches with many case statements, e.g. inter-preters, the accuracy of this naive prediction is quite low. Tolimit indirect branch mispredictions, Chang et al. [4] pro-pose to leverage the global (conditional) branch history topredict the indirect branch targets, i.e. a gshare-like indexedtable is used to store the indirect branch targets. HoweverDriesen and Holzle [8] point out that many indirect branchesare correctly predicted by a simple PC-based table, since atexecution time they feature a single dynamic target. Theyproposed the cascaded indirect branch predictor to associatea PC-based table (might be the branch target buffer) with atagged (PC+global branch history) indexed table.
More recently, Seznec and Michaud [31] derived IT-TAGE from their TAGE predictor. Instead of simple con-ditional branch directions, ITTAGE stores the complete tar-get in tagged tables indexed with increasing history lengthswhich form a geometric series. As for TAGE, the hitting ta-ble featuring the longest history length provides the predic-tion. At the recent 3rd championship on branch prediction in20112, TAGE-based (resp. ITTAGE-based) predictors wereshown to outperform other conditional branch predictors(resp. indirect predictors).
3.2 Intuition of ITTAGE on interpretersTAGE performs very well at predicting the behavior of con-ditional branches that exhibit repetitive patterns and verylong patterns. Typically when a given (maybe very long)sequence of length L branches before the current programcounter was always biased in a direction in the past, then
2 http://www.jilp.org/jwac-2/
TAGE – provided it features sufficient number of entries –will correctly predict the branch, independently of the mini-mum history le needed to discriminate between the effectivebiased path and another path. This minimum path is cap-tured by one of the tables indexed with history longer thanle. With TAGE, the outcomes of branches correlated withclose branches are captured by short history length tables,and the outcomes of branches correlated with very distantbranches are captured by long history length tables. This op-timizes the application footprint on the predictor. The sameapplies for indirect branches.
When considering interpreters, the executed path is es-sentially the main loop around the execution of each byte-code. When running on the succession of basic block byte-codes, the execution pattern seen by the switch reflects thecontrol path in the interpreted application: in practice thehistory of the recent targets of the jump is the history of op-codes. For instance, if this history is –load load add load mulstore add– and if this sequence is unique, then the next op-code is also uniquely determined. This history is in somesense a signature of the virtual program counter, it deter-mines the next virtual program counter.
When running interpreters, ITTAGE is able to capturesuch patterns and even very long patterns spanning over sev-eral bytecode basic blocks, i.e. to “predict” the virtual pro-gram counter. Branches bytecodes present the particularityto feature several possible successors. However, if the in-terpreted application is control-flow predictable, the historyalso captures the control-flow history of the interpreted ap-plication. Therefore ITTAGE will even predict correctly thesuccessor of the branch bytecodes.
4. Experimental SetupThis section details our interpreters and benchmarks. We dis-cuss how we collect data for actual hardware and simulation,and we make sure that both approaches are consistent.
4.1 Interpreters and BenchmarksWe experimented with switch-based (no threading) in-terpreters for three different input languages: Javascript,Python, and the Common Language Infrastructure (CLI, aka.NET), and several inputs for each interpreter. Javascriptbenchmarks consist in Google’s octane suite3 as of Feb2014, and Mozilla’s kraken4. For Python, we used the Un-laden Swallow Benchmarks. Finally, we used a subset ofSPEC 2000 (train input set) for CLI. All benchmarks arerun to completion (including hundreds of hours of CPU forthe simulation). See Table 1 for an exhaustive list.
We used Python 3.3.2. The motivation example of Sec-tion 2 also uses Python 2.7.5. Unladen Swallow bench-marks were run with the flag --rigorous. We excludediterative_count, spectral_norm and threaded_count
3 http://code.google.com/p/octane-benchmark4 http://krakenbenchmark.mozilla.org/kraken-1.1/
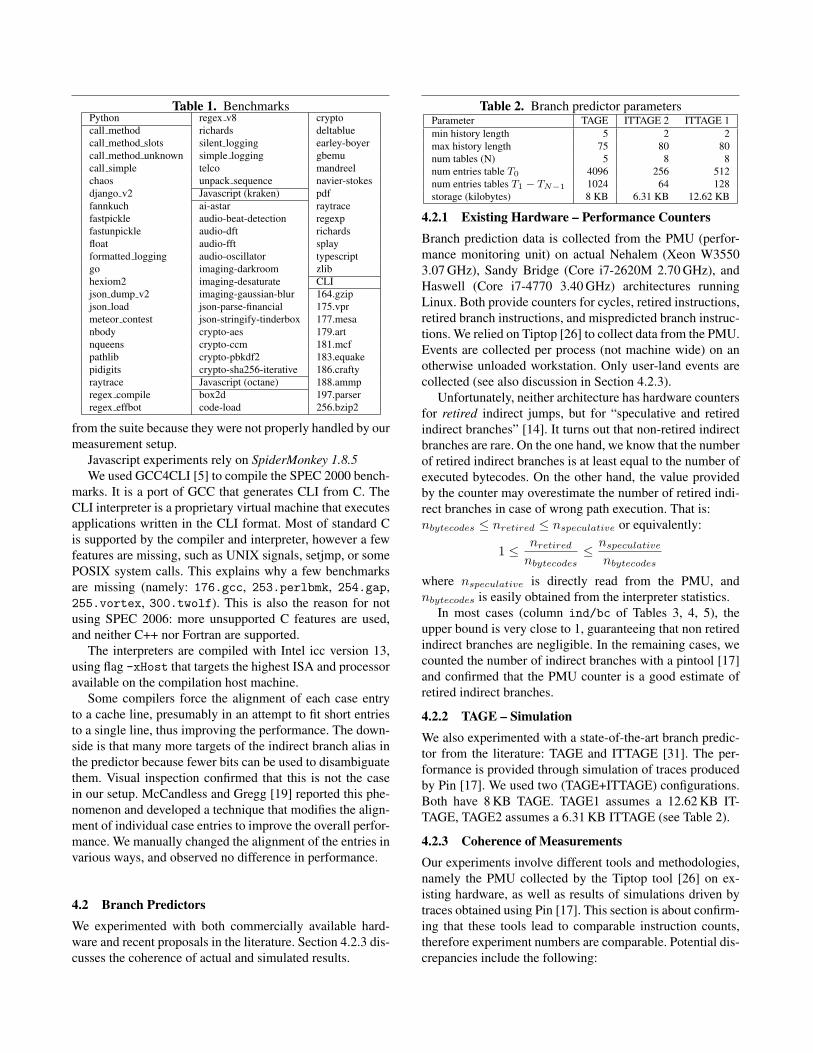
Table 1. BenchmarksPython regex v8 cryptocall method richards deltabluecall method slots silent logging earley-boyercall method unknown simple logging gbemucall simple telco mandreelchaos unpack sequence navier-stokesdjango v2 Javascript (kraken) pdffannkuch ai-astar raytracefastpickle audio-beat-detection regexpfastunpickle audio-dft richardsfloat audio-fft splayformatted logging audio-oscillator typescriptgo imaging-darkroom zlibhexiom2 imaging-desaturate CLIjson dump v2 imaging-gaussian-blur 164.gzipjson load json-parse-financial 175.vprmeteor contest json-stringify-tinderbox 177.mesanbody crypto-aes 179.artnqueens crypto-ccm 181.mcfpathlib crypto-pbkdf2 183.equakepidigits crypto-sha256-iterative 186.craftyraytrace Javascript (octane) 188.ammpregex compile box2d 197.parserregex effbot code-load 256.bzip2
from the suite because they were not properly handled by ourmeasurement setup.
Javascript experiments rely on SpiderMonkey 1.8.5We used GCC4CLI [5] to compile the SPEC 2000 bench-
marks. It is a port of GCC that generates CLI from C. TheCLI interpreter is a proprietary virtual machine that executesapplications written in the CLI format. Most of standard Cis supported by the compiler and interpreter, however a fewfeatures are missing, such as UNIX signals, setjmp, or somePOSIX system calls. This explains why a few benchmarksare missing (namely: 176.gcc, 253.perlbmk, 254.gap,255.vortex, 300.twolf). This is also the reason for notusing SPEC 2006: more unsupported C features are used,and neither C++ nor Fortran are supported.
The interpreters are compiled with Intel icc version 13,using flag -xHost that targets the highest ISA and processoravailable on the compilation host machine.
Some compilers force the alignment of each case entryto a cache line, presumably in an attempt to fit short entriesto a single line, thus improving the performance. The down-side is that many more targets of the indirect branch alias inthe predictor because fewer bits can be used to disambiguatethem. Visual inspection confirmed that this is not the casein our setup. McCandless and Gregg [19] reported this phe-nomenon and developed a technique that modifies the align-ment of individual case entries to improve the overall perfor-mance. We manually changed the alignment of the entries invarious ways, and observed no difference in performance.
4.2 Branch PredictorsWe experimented with both commercially available hard-ware and recent proposals in the literature. Section 4.2.3 dis-cusses the coherence of actual and simulated results.
Table 2. Branch predictor parametersParameter TAGE ITTAGE 2 ITTAGE 1min history length 5 2 2max history length 75 80 80num tables (N) 5 8 8num entries table T0 4096 256 512num entries tables T1 − TN−1 1024 64 128storage (kilobytes) 8 KB 6.31 KB 12.62 KB
4.2.1 Existing Hardware – Performance CountersBranch prediction data is collected from the PMU (perfor-mance monitoring unit) on actual Nehalem (Xeon W35503.07 GHz), Sandy Bridge (Core i7-2620M 2.70 GHz), andHaswell (Core i7-4770 3.40 GHz) architectures runningLinux. Both provide counters for cycles, retired instructions,retired branch instructions, and mispredicted branch instruc-tions. We relied on Tiptop [26] to collect data from the PMU.Events are collected per process (not machine wide) on anotherwise unloaded workstation. Only user-land events arecollected (see also discussion in Section 4.2.3).
Unfortunately, neither architecture has hardware countersfor retired indirect jumps, but for “speculative and retiredindirect branches” [14]. It turns out that non-retired indirectbranches are rare. On the one hand, we know that the numberof retired indirect branches is at least equal to the number ofexecuted bytecodes. On the other hand, the value providedby the counter may overestimate the number of retired indi-rect branches in case of wrong path execution. That is:nbytecodes ≤ nretired ≤ nspeculative or equivalently:
1 ≤ nretired
nbytecodes≤ nspeculative
nbytecodes
where nspeculative is directly read from the PMU, andnbytecodes is easily obtained from the interpreter statistics.
In most cases (column ind/bc of Tables 3, 4, 5), theupper bound is very close to 1, guaranteeing that non retiredindirect branches are negligible. In the remaining cases, wecounted the number of indirect branches with a pintool [17]and confirmed that the PMU counter is a good estimate ofretired indirect branches.
4.2.2 TAGE – SimulationWe also experimented with a state-of-the-art branch predic-tor from the literature: TAGE and ITTAGE [31]. The per-formance is provided through simulation of traces producedby Pin [17]. We used two (TAGE+ITTAGE) configurations.Both have 8 KB TAGE. TAGE1 assumes a 12.62 KB IT-TAGE, TAGE2 assumes a 6.31 KB ITTAGE (see Table 2).
4.2.3 Coherence of MeasurementsOur experiments involve different tools and methodologies,namely the PMU collected by the Tiptop tool [26] on ex-isting hardware, as well as results of simulations driven bytraces obtained using Pin [17]. This section is about confirm-ing that these tools lead to comparable instruction counts,therefore experiment numbers are comparable. Potential dis-crepancies include the following:
• non determinism inherent to the PMU [35] or the sys-tem/software stack [22];
• the x86 instruction set provides a rep prefix. The PMUcounts prefixed instructions as one (made of many mi-croops), while pintools may count each separately;
• Pin can only capture events in user mode, while the PMUhas the capability to monitor also kernel mode events;
• tiptop starts counting a bit earlier than Pin: the formerstarts right before the execvp system call, while thelatter starts when the loader is invoked. This difference isconstant and negligible in respect of our running times;
• applications under the control of Pin sometimes executemore instructions in the function dl_relocate_symbol.Because Pin links with the application, more symbols ex-ist in the executable, and the resolution may require morework. This happens only once for each executed symbol,and is also negligible for our benchmarks.
Since Pin only traces user mode events, we configuredthe PMU correspondingly. To quantify the impact of ker-nel events, we ran the benchmarks in both modes and wemeasured the number of retired instructions as well as theinstruction mix (loads, stores, and jumps). Not surprisinglyfor an interpreter, the difference remains under one percent-age point. For jumps, it is even below 0.05 percentage point.
The main loop of interpreters is identical on all architec-tures, even though we instructed the compiler to generatespecialized code. The average variation of the number of ex-ecuted instructions, due to slightly different releases of theoperating system and libraries, is also on the order of 1 %.Finally, PMU and Pin also report counts within 1 %.
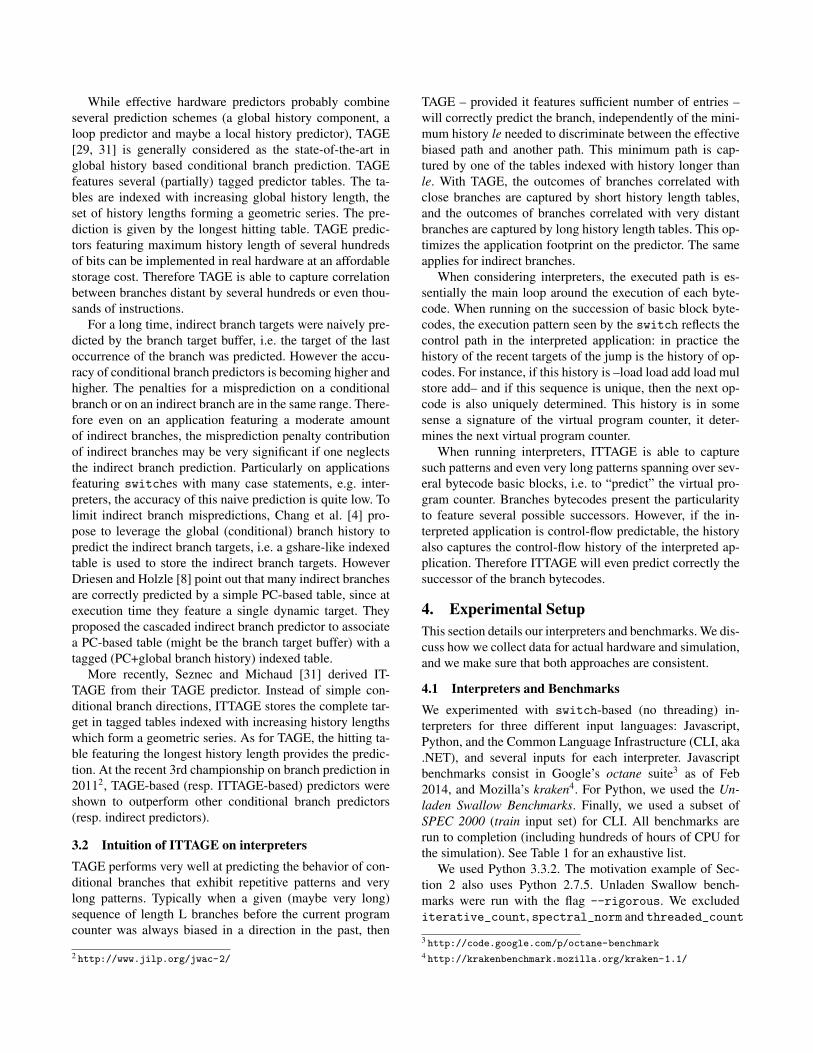
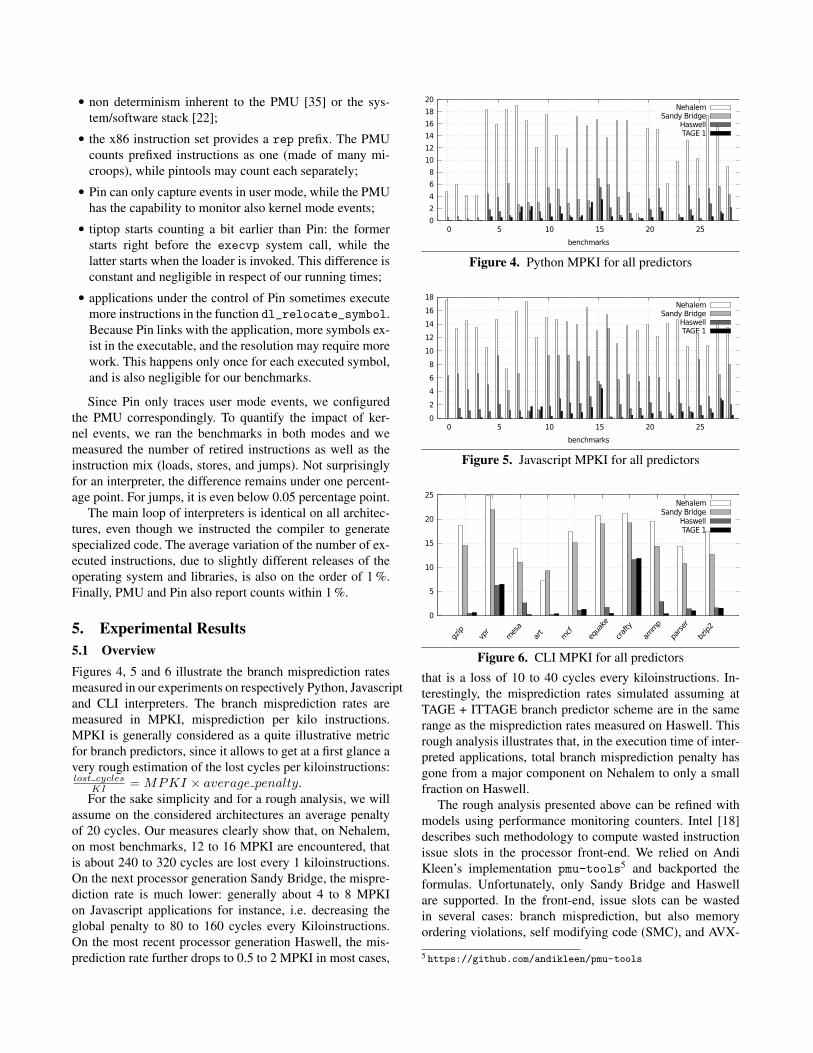
5. Experimental Results5.1 OverviewFigures 4, 5 and 6 illustrate the branch misprediction ratesmeasured in our experiments on respectively Python, Javascriptand CLI interpreters. The branch misprediction rates aremeasured in MPKI, misprediction per kilo instructions.MPKI is generally considered as a quite illustrative metricfor branch predictors, since it allows to get at a first glance avery rough estimation of the lost cycles per kiloinstructions:lost cycles
KI = MPKI × average penalty.For the sake simplicity and for a rough analysis, we will
assume on the considered architectures an average penaltyof 20 cycles. Our measures clearly show that, on Nehalem,on most benchmarks, 12 to 16 MPKI are encountered, thatis about 240 to 320 cycles are lost every 1 kiloinstructions.On the next processor generation Sandy Bridge, the mispre-diction rate is much lower: generally about 4 to 8 MPKIon Javascript applications for instance, i.e. decreasing theglobal penalty to 80 to 160 cycles every Kiloinstructions.On the most recent processor generation Haswell, the mis-prediction rate further drops to 0.5 to 2 MPKI in most cases,
0
2
4
6
8
10
12
14
16
18
20
0 5 10 15 20 25
benchmarks
NehalemSandy Bridge
HaswellTAGE 1
Figure 4. Python MPKI for all predictors
0
2
4
6
8
10
12
14
16
18
0 5 10 15 20 25
benchmarks
NehalemSandy Bridge
HaswellTAGE 1
Figure 5. Javascript MPKI for all predictors
0
5
10
15
20
25
gzip
vpr
mes
aar
tmcf
equa
ke
crafty
ammp
parser
bzip2
NehalemSandy Bridge
HaswellTAGE 1
Figure 6. CLI MPKI for all predictors
that is a loss of 10 to 40 cycles every kiloinstructions. In-terestingly, the misprediction rates simulated assuming atTAGE + ITTAGE branch predictor scheme are in the samerange as the misprediction rates measured on Haswell. Thisrough analysis illustrates that, in the execution time of inter-preted applications, total branch misprediction penalty hasgone from a major component on Nehalem to only a smallfraction on Haswell.
The rough analysis presented above can be refined withmodels using performance monitoring counters. Intel [18]describes such methodology to compute wasted instructionissue slots in the processor front-end. We relied on AndiKleen’s implementation pmu-tools5 and backported theformulas. Unfortunately, only Sandy Bridge and Haswellare supported. In the front-end, issue slots can be wastedin several cases: branch misprediction, but also memoryordering violations, self modifying code (SMC), and AVX-
5 https://github.com/andikleen/pmu-tools
0
5
10
15
20
25
0 5 10 15 20 25 30 35 40
MPKI
wasted slots (%)
HaswellSandy Bridge
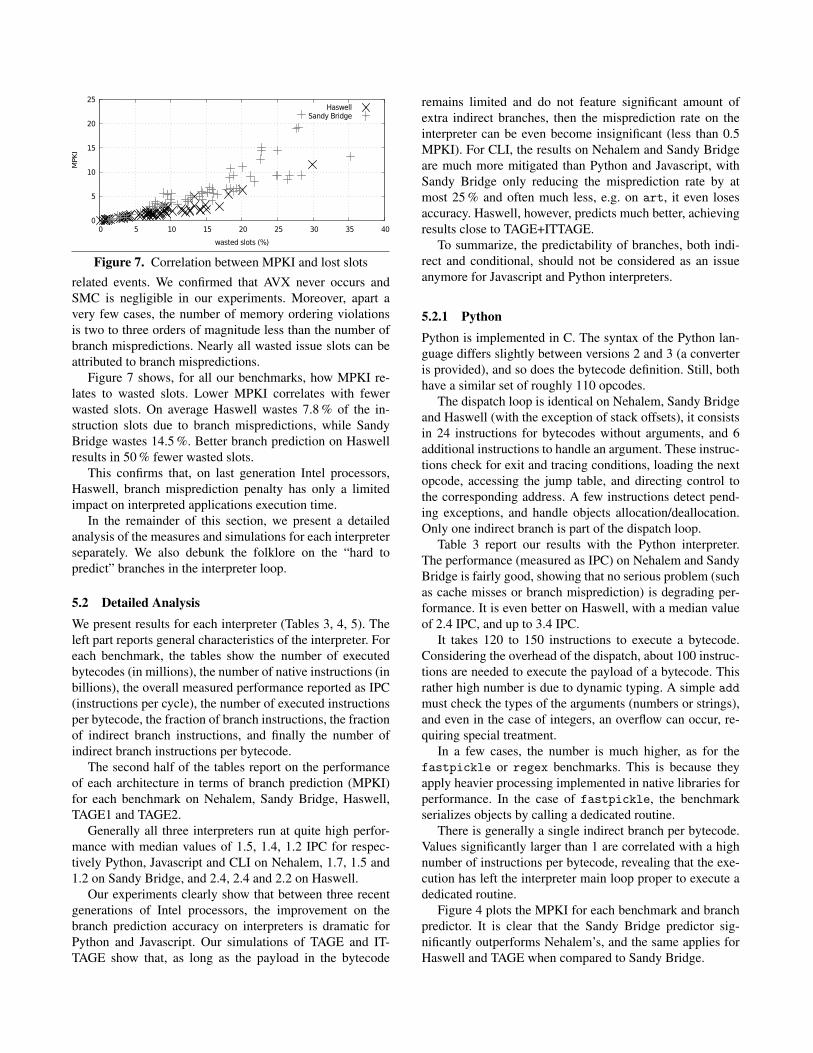
Figure 7. Correlation between MPKI and lost slotsrelated events. We confirmed that AVX never occurs andSMC is negligible in our experiments. Moreover, apart avery few cases, the number of memory ordering violationsis two to three orders of magnitude less than the number ofbranch mispredictions. Nearly all wasted issue slots can beattributed to branch mispredictions.
Figure 7 shows, for all our benchmarks, how MPKI re-lates to wasted slots. Lower MPKI correlates with fewerwasted slots. On average Haswell wastes 7.8 % of the in-struction slots due to branch mispredictions, while SandyBridge wastes 14.5 %. Better branch prediction on Haswellresults in 50 % fewer wasted slots.
This confirms that, on last generation Intel processors,Haswell, branch misprediction penalty has only a limitedimpact on interpreted applications execution time.
In the remainder of this section, we present a detailedanalysis of the measures and simulations for each interpreterseparately. We also debunk the folklore on the “hard topredict” branches in the interpreter loop.
5.2 Detailed AnalysisWe present results for each interpreter (Tables 3, 4, 5). Theleft part reports general characteristics of the interpreter. Foreach benchmark, the tables show the number of executedbytecodes (in millions), the number of native instructions (inbillions), the overall measured performance reported as IPC(instructions per cycle), the number of executed instructionsper bytecode, the fraction of branch instructions, the fractionof indirect branch instructions, and finally the number ofindirect branch instructions per bytecode.
The second half of the tables report on the performanceof each architecture in terms of branch prediction (MPKI)for each benchmark on Nehalem, Sandy Bridge, Haswell,TAGE1 and TAGE2.
Generally all three interpreters run at quite high perfor-mance with median values of 1.5, 1.4, 1.2 IPC for respec-tively Python, Javascript and CLI on Nehalem, 1.7, 1.5 and1.2 on Sandy Bridge, and 2.4, 2.4 and 2.2 on Haswell.
Our experiments clearly show that between three recentgenerations of Intel processors, the improvement on thebranch prediction accuracy on interpreters is dramatic forPython and Javascript. Our simulations of TAGE and IT-TAGE show that, as long as the payload in the bytecode
remains limited and do not feature significant amount ofextra indirect branches, then the misprediction rate on theinterpreter can be even become insignificant (less than 0.5MPKI). For CLI, the results on Nehalem and Sandy Bridgeare much more mitigated than Python and Javascript, withSandy Bridge only reducing the misprediction rate by atmost 25 % and often much less, e.g. on art, it even losesaccuracy. Haswell, however, predicts much better, achievingresults close to TAGE+ITTAGE.
To summarize, the predictability of branches, both indi-rect and conditional, should not be considered as an issueanymore for Javascript and Python interpreters.
5.2.1 PythonPython is implemented in C. The syntax of the Python lan-guage differs slightly between versions 2 and 3 (a converteris provided), and so does the bytecode definition. Still, bothhave a similar set of roughly 110 opcodes.
The dispatch loop is identical on Nehalem, Sandy Bridgeand Haswell (with the exception of stack offsets), it consistsin 24 instructions for bytecodes without arguments, and 6additional instructions to handle an argument. These instruc-tions check for exit and tracing conditions, loading the nextopcode, accessing the jump table, and directing control tothe corresponding address. A few instructions detect pend-ing exceptions, and handle objects allocation/deallocation.Only one indirect branch is part of the dispatch loop.
Table 3 report our results with the Python interpreter.The performance (measured as IPC) on Nehalem and SandyBridge is fairly good, showing that no serious problem (suchas cache misses or branch misprediction) is degrading per-formance. It is even better on Haswell, with a median valueof 2.4 IPC, and up to 3.4 IPC.
It takes 120 to 150 instructions to execute a bytecode.Considering the overhead of the dispatch, about 100 instruc-tions are needed to execute the payload of a bytecode. Thisrather high number is due to dynamic typing. A simple addmust check the types of the arguments (numbers or strings),and even in the case of integers, an overflow can occur, re-quiring special treatment.
In a few cases, the number is much higher, as for thefastpickle or regex benchmarks. This is because theyapply heavier processing implemented in native libraries forperformance. In the case of fastpickle, the benchmarkserializes objects by calling a dedicated routine.
There is generally a single indirect branch per bytecode.Values significantly larger than 1 are correlated with a highnumber of instructions per bytecode, revealing that the exe-cution has left the interpreter main loop proper to execute adedicated routine.
Figure 4 plots the MPKI for each benchmark and branchpredictor. It is clear that the Sandy Bridge predictor sig-nificantly outperforms Nehalem’s, and the same applies forHaswell and TAGE when compared to Sandy Bridge.
In practice, one can note that when the average payloadis around 120 to 150 instructions and there are no (or veryfew) indirect branches apart the main switch, i.e., ind
bc ≤1.02, then TAGE+ITTAGE predicts the interpreter quasi-perfectly. When the average payload is larger or some extraindirect branches are encountered then misprediction rateof TAGE+ITTAGE becomes higher and may become in thesame order as the one of Haswell.
5.2.2 JavascriptSpiderMonkey Javascript is implemented in C++. We com-piled it without JIT support, and we manually removed thedetection of Labels as Values. The bytecode consists in 244entries. The dispatch loop consists in 16 instructions, signif-icantly shorter that Python.
Table 4 reports the characteristics of the Javascript in-terpreter. With the exception of code-load in octane, andparse-financial and stringify-tinderbox in kraken,indirect branches come from the switch statement. Thesebenchmarks also have a outstanding number of instructionsper bytecode. Excluding them, it takes on average in the or-der of 60 instructions per bytecode.
Table 4 also reports on the performance of the branchpredictors, and Figure 5 illustrates the respective MPKI.As for Python, Haswell and TAGE consistently outperformSandy Bridge, which also outperforms Nehalem.
As for the Python interpreters, with the exception of threeoutliers, TAGE predict quasi perfectly the interpreter.
5.2.3 CLIThe CLI interpreter is written in standard C, hence dispatchis implemented with a switch statement. The internal IRconsists in 478 opcodes. This IR resembles the CLI byte-code from which it is derived. CLI operators are not typed,the same add (for example) applies to all integer and float-ing point types. The standard, though, requires that types canbe statically derived to prove the correctness of the programbefore execution. The interpreter IR specializes the opera-tors with the computed types to remove some burden fromthe interpreter execute loop. This explains the rather largenumber of different opcodes. As per Brunthaler’s definition[3], the CLI interpreter is a low abstraction level interpreter.
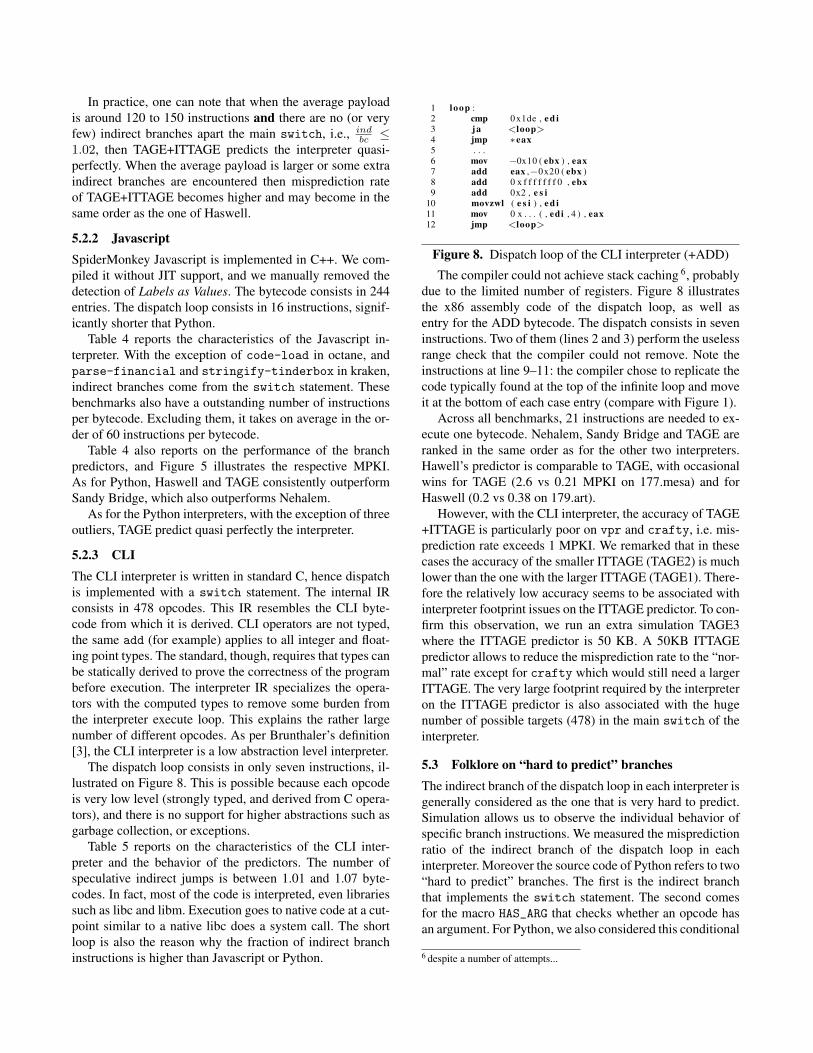
The dispatch loop consists in only seven instructions, il-lustrated on Figure 8. This is possible because each opcodeis very low level (strongly typed, and derived from C opera-tors), and there is no support for higher abstractions such asgarbage collection, or exceptions.
Table 5 reports on the characteristics of the CLI inter-preter and the behavior of the predictors. The number ofspeculative indirect jumps is between 1.01 and 1.07 byte-codes. In fact, most of the code is interpreted, even librariessuch as libc and libm. Execution goes to native code at a cut-point similar to a native libc does a system call. The shortloop is also the reason why the fraction of indirect branchinstructions is higher than Javascript or Python.
1 loop :2 cmp 0 x1de , e d i3 ja <loop>4 jmp ∗eax5 . . .6 mov −0x10 ( ebx ) , eax7 add eax ,−0x20 ( ebx )8 add 0 x f f f f f f f 0 , ebx9 add 0x2 , e s i
10 movzwl ( e s i ) , e d i11 mov 0 x . . . ( , edi , 4 ) , eax12 jmp <loop>
Figure 8. Dispatch loop of the CLI interpreter (+ADD)
The compiler could not achieve stack caching 6, probablydue to the limited number of registers. Figure 8 illustratesthe x86 assembly code of the dispatch loop, as well asentry for the ADD bytecode. The dispatch consists in seveninstructions. Two of them (lines 2 and 3) perform the uselessrange check that the compiler could not remove. Note theinstructions at line 9–11: the compiler chose to replicate thecode typically found at the top of the infinite loop and moveit at the bottom of each case entry (compare with Figure 1).
Across all benchmarks, 21 instructions are needed to ex-ecute one bytecode. Nehalem, Sandy Bridge and TAGE areranked in the same order as for the other two interpreters.Hawell’s predictor is comparable to TAGE, with occasionalwins for TAGE (2.6 vs 0.21 MPKI on 177.mesa) and forHaswell (0.2 vs 0.38 on 179.art).
However, with the CLI interpreter, the accuracy of TAGE+ITTAGE is particularly poor on vpr and crafty, i.e. mis-prediction rate exceeds 1 MPKI. We remarked that in thesecases the accuracy of the smaller ITTAGE (TAGE2) is muchlower than the one with the larger ITTAGE (TAGE1). There-fore the relatively low accuracy seems to be associated withinterpreter footprint issues on the ITTAGE predictor. To con-firm this observation, we run an extra simulation TAGE3where the ITTAGE predictor is 50 KB. A 50KB ITTAGEpredictor allows to reduce the misprediction rate to the “nor-mal” rate except for crafty which would still need a largerITTAGE. The very large footprint required by the interpreteron the ITTAGE predictor is also associated with the hugenumber of possible targets (478) in the main switch of theinterpreter.
5.3 Folklore on “hard to predict” branchesThe indirect branch of the dispatch loop in each interpreter isgenerally considered as the one that is very hard to predict.Simulation allows us to observe the individual behavior ofspecific branch instructions. We measured the mispredictionratio of the indirect branch of the dispatch loop in eachinterpreter. Moreover the source code of Python refers to two“hard to predict” branches. The first is the indirect branchthat implements the switch statement. The second comesfor the macro HAS_ARG that checks whether an opcode hasan argument. For Python, we also considered this conditional
6 despite a number of attempts...
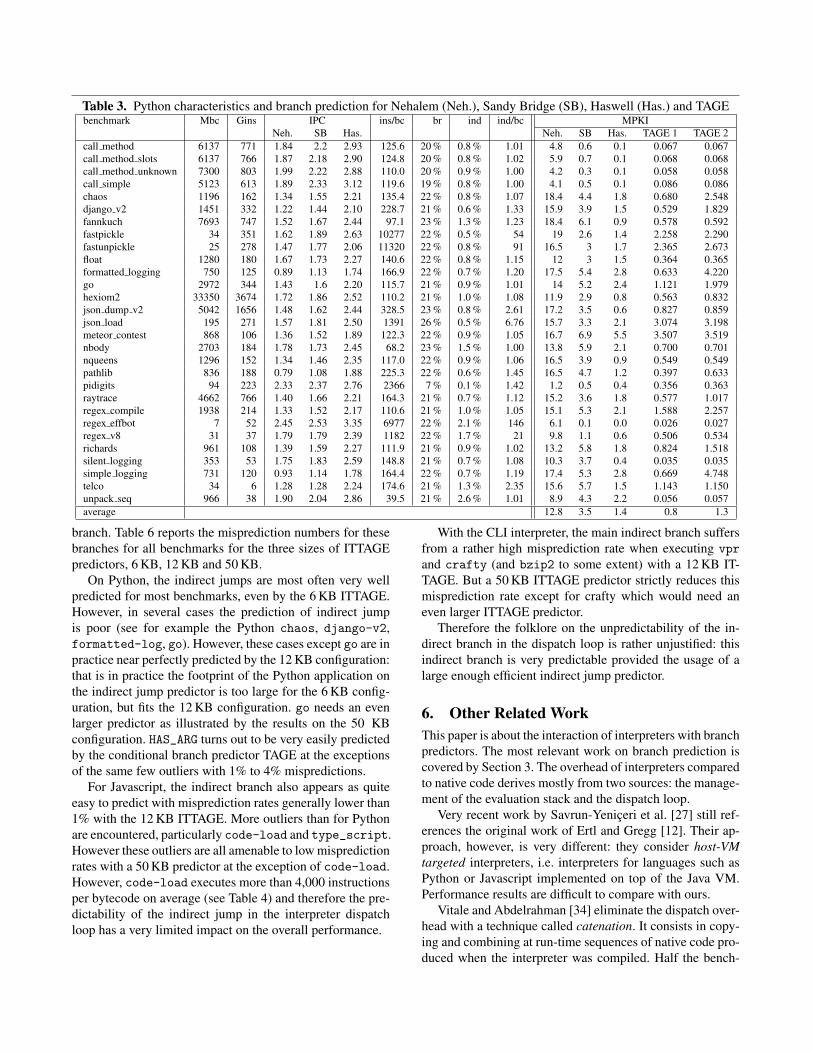
Table 3. Python characteristics and branch prediction for Nehalem (Neh.), Sandy Bridge (SB), Haswell (Has.) and TAGEbenchmark Mbc Gins IPC ins/bc br ind ind/bc MPKI
Neh. SB Has. Neh. SB Has. TAGE 1 TAGE 2call method 6137 771 1.84 2.2 2.93 125.6 20 % 0.8 % 1.01 4.8 0.6 0.1 0.067 0.067call method slots 6137 766 1.87 2.18 2.90 124.8 20 % 0.8 % 1.02 5.9 0.7 0.1 0.068 0.068call method unknown 7300 803 1.99 2.22 2.88 110.0 20 % 0.9 % 1.00 4.2 0.3 0.1 0.058 0.058call simple 5123 613 1.89 2.33 3.12 119.6 19 % 0.8 % 1.00 4.1 0.5 0.1 0.086 0.086chaos 1196 162 1.34 1.55 2.21 135.4 22 % 0.8 % 1.07 18.4 4.4 1.8 0.680 2.548django v2 1451 332 1.22 1.44 2.10 228.7 21 % 0.6 % 1.33 15.9 3.9 1.5 0.529 1.829fannkuch 7693 747 1.52 1.67 2.44 97.1 23 % 1.3 % 1.23 18.4 6.1 0.9 0.578 0.592fastpickle 34 351 1.62 1.89 2.63 10277 22 % 0.5 % 54 19 2.6 1.4 2.258 2.290fastunpickle 25 278 1.47 1.77 2.06 11320 22 % 0.8 % 91 16.5 3 1.7 2.365 2.673float 1280 180 1.67 1.73 2.27 140.6 22 % 0.8 % 1.15 12 3 1.5 0.364 0.365formatted logging 750 125 0.89 1.13 1.74 166.9 22 % 0.7 % 1.20 17.5 5.4 2.8 0.633 4.220go 2972 344 1.43 1.6 2.20 115.7 21 % 0.9 % 1.01 14 5.2 2.4 1.121 1.979hexiom2 33350 3674 1.72 1.86 2.52 110.2 21 % 1.0 % 1.08 11.9 2.9 0.8 0.563 0.832json dump v2 5042 1656 1.48 1.62 2.44 328.5 23 % 0.8 % 2.61 17.2 3.5 0.6 0.827 0.859json load 195 271 1.57 1.81 2.50 1391 26 % 0.5 % 6.76 15.7 3.3 2.1 3.074 3.198meteor contest 868 106 1.36 1.52 1.89 122.3 22 % 0.9 % 1.05 16.7 6.9 5.5 3.507 3.519nbody 2703 184 1.78 1.73 2.45 68.2 23 % 1.5 % 1.00 13.8 5.9 2.1 0.700 0.701nqueens 1296 152 1.34 1.46 2.35 117.0 22 % 0.9 % 1.06 16.5 3.9 0.9 0.549 0.549pathlib 836 188 0.79 1.08 1.88 225.3 22 % 0.6 % 1.45 16.5 4.7 1.2 0.397 0.633pidigits 94 223 2.33 2.37 2.76 2366 7 % 0.1 % 1.42 1.2 0.5 0.4 0.356 0.363raytrace 4662 766 1.40 1.66 2.21 164.3 21 % 0.7 % 1.12 15.2 3.6 1.8 0.577 1.017regex compile 1938 214 1.33 1.52 2.17 110.6 21 % 1.0 % 1.05 15.1 5.3 2.1 1.588 2.257regex effbot 7 52 2.45 2.53 3.35 6977 22 % 2.1 % 146 6.1 0.1 0.0 0.026 0.027regex v8 31 37 1.79 1.79 2.39 1182 22 % 1.7 % 21 9.8 1.1 0.6 0.506 0.534richards 961 108 1.39 1.59 2.27 111.9 21 % 0.9 % 1.02 13.2 5.8 1.8 0.824 1.518silent logging 353 53 1.75 1.83 2.59 148.8 21 % 0.7 % 1.08 10.3 3.7 0.4 0.035 0.035simple logging 731 120 0.93 1.14 1.78 164.4 22 % 0.7 % 1.19 17.4 5.3 2.8 0.669 4.748telco 34 6 1.28 1.28 2.24 174.6 21 % 1.3 % 2.35 15.6 5.7 1.5 1.143 1.150unpack seq 966 38 1.90 2.04 2.86 39.5 21 % 2.6 % 1.01 8.9 4.3 2.2 0.056 0.057average 12.8 3.5 1.4 0.8 1.3
branch. Table 6 reports the misprediction numbers for thesebranches for all benchmarks for the three sizes of ITTAGEpredictors, 6 KB, 12 KB and 50 KB.
On Python, the indirect jumps are most often very wellpredicted for most benchmarks, even by the 6 KB ITTAGE.However, in several cases the prediction of indirect jumpis poor (see for example the Python chaos, django-v2,formatted-log, go). However, these cases except go are inpractice near perfectly predicted by the 12 KB configuration:that is in practice the footprint of the Python application onthe indirect jump predictor is too large for the 6 KB config-uration, but fits the 12 KB configuration. go needs an evenlarger predictor as illustrated by the results on the 50 KBconfiguration. HAS_ARG turns out to be very easily predictedby the conditional branch predictor TAGE at the exceptionsof the same few outliers with 1% to 4% mispredictions.
For Javascript, the indirect branch also appears as quiteeasy to predict with misprediction rates generally lower than1% with the 12 KB ITTAGE. More outliers than for Pythonare encountered, particularly code-load and type_script.However these outliers are all amenable to low mispredictionrates with a 50 KB predictor at the exception of code-load.However, code-load executes more than 4,000 instructionsper bytecode on average (see Table 4) and therefore the pre-dictability of the indirect jump in the interpreter dispatchloop has a very limited impact on the overall performance.
With the CLI interpreter, the main indirect branch suffersfrom a rather high misprediction rate when executing vprand crafty (and bzip2 to some extent) with a 12 KB IT-TAGE. But a 50 KB ITTAGE predictor strictly reduces thismisprediction rate except for crafty which would need aneven larger ITTAGE predictor.
Therefore the folklore on the unpredictability of the in-direct branch in the dispatch loop is rather unjustified: thisindirect branch is very predictable provided the usage of alarge enough efficient indirect jump predictor.
6. Other Related WorkThis paper is about the interaction of interpreters with branchpredictors. The most relevant work on branch prediction iscovered by Section 3. The overhead of interpreters comparedto native code derives mostly from two sources: the manage-ment of the evaluation stack and the dispatch loop.
Very recent work by Savrun-Yeniceri et al. [27] still ref-erences the original work of Ertl and Gregg [12]. Their ap-proach, however, is very different: they consider host-VMtargeted interpreters, i.e. interpreters for languages such asPython or Javascript implemented on top of the Java VM.Performance results are difficult to compare with ours.
Vitale and Abdelrahman [34] eliminate the dispatch over-head with a technique called catenation. It consists in copy-ing and combining at run-time sequences of native code pro-duced when the interpreter was compiled. Half the bench-
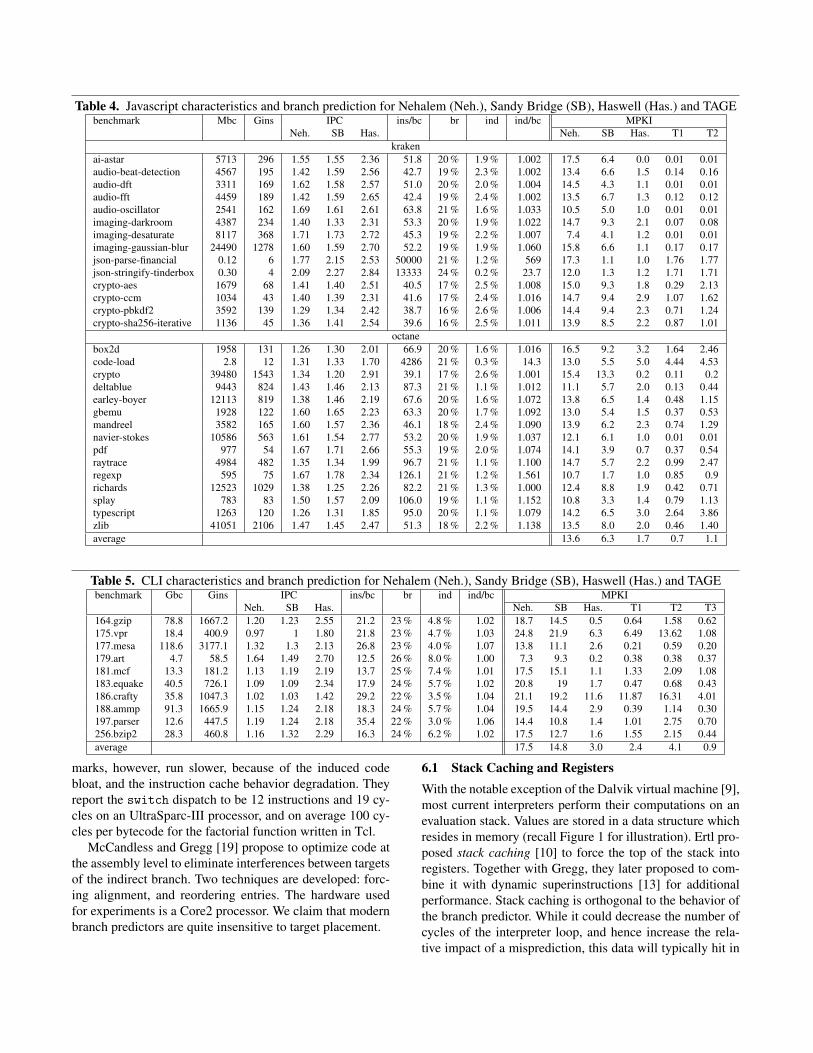
Table 4. Javascript characteristics and branch prediction for Nehalem (Neh.), Sandy Bridge (SB), Haswell (Has.) and TAGEbenchmark Mbc Gins IPC ins/bc br ind ind/bc MPKI
Neh. SB Has. Neh. SB Has. T1 T2kraken
ai-astar 5713 296 1.55 1.55 2.36 51.8 20 % 1.9 % 1.002 17.5 6.4 0.0 0.01 0.01audio-beat-detection 4567 195 1.42 1.59 2.56 42.7 19 % 2.3 % 1.002 13.4 6.6 1.5 0.14 0.16audio-dft 3311 169 1.62 1.58 2.57 51.0 20 % 2.0 % 1.004 14.5 4.3 1.1 0.01 0.01audio-fft 4459 189 1.42 1.59 2.65 42.4 19 % 2.4 % 1.002 13.5 6.7 1.3 0.12 0.12audio-oscillator 2541 162 1.69 1.61 2.61 63.8 21 % 1.6 % 1.033 10.5 5.0 1.0 0.01 0.01imaging-darkroom 4387 234 1.40 1.33 2.31 53.3 20 % 1.9 % 1.022 14.7 9.3 2.1 0.07 0.08imaging-desaturate 8117 368 1.71 1.73 2.72 45.3 19 % 2.2 % 1.007 7.4 4.1 1.2 0.01 0.01imaging-gaussian-blur 24490 1278 1.60 1.59 2.70 52.2 19 % 1.9 % 1.060 15.8 6.6 1.1 0.17 0.17json-parse-financial 0.12 6 1.77 2.15 2.53 50000 21 % 1.2 % 569 17.3 1.1 1.0 1.76 1.77json-stringify-tinderbox 0.30 4 2.09 2.27 2.84 13333 24 % 0.2 % 23.7 12.0 1.3 1.2 1.71 1.71crypto-aes 1679 68 1.41 1.40 2.51 40.5 17 % 2.5 % 1.008 15.0 9.3 1.8 0.29 2.13crypto-ccm 1034 43 1.40 1.39 2.31 41.6 17 % 2.4 % 1.016 14.7 9.4 2.9 1.07 1.62crypto-pbkdf2 3592 139 1.29 1.34 2.42 38.7 16 % 2.6 % 1.006 14.4 9.4 2.3 0.71 1.24crypto-sha256-iterative 1136 45 1.36 1.41 2.54 39.6 16 % 2.5 % 1.011 13.9 8.5 2.2 0.87 1.01
octanebox2d 1958 131 1.26 1.30 2.01 66.9 20 % 1.6 % 1.016 16.5 9.2 3.2 1.64 2.46code-load 2.8 12 1.31 1.33 1.70 4286 21 % 0.3 % 14.3 13.0 5.5 5.0 4.44 4.53crypto 39480 1543 1.34 1.20 2.91 39.1 17 % 2.6 % 1.001 15.4 13.3 0.2 0.11 0.2deltablue 9443 824 1.43 1.46 2.13 87.3 21 % 1.1 % 1.012 11.1 5.7 2.0 0.13 0.44earley-boyer 12113 819 1.38 1.46 2.19 67.6 20 % 1.6 % 1.072 13.8 6.5 1.4 0.48 1.15gbemu 1928 122 1.60 1.65 2.23 63.3 20 % 1.7 % 1.092 13.0 5.4 1.5 0.37 0.53mandreel 3582 165 1.60 1.57 2.36 46.1 18 % 2.4 % 1.090 13.9 6.2 2.3 0.74 1.29navier-stokes 10586 563 1.61 1.54 2.77 53.2 20 % 1.9 % 1.037 12.1 6.1 1.0 0.01 0.01pdf 977 54 1.67 1.71 2.66 55.3 19 % 2.0 % 1.074 14.1 3.9 0.7 0.37 0.54raytrace 4984 482 1.35 1.34 1.99 96.7 21 % 1.1 % 1.100 14.7 5.7 2.2 0.99 2.47regexp 595 75 1.67 1.78 2.34 126.1 21 % 1.2 % 1.561 10.7 1.7 1.0 0.85 0.9richards 12523 1029 1.38 1.25 2.26 82.2 21 % 1.3 % 1.000 12.4 8.8 1.9 0.42 0.71splay 783 83 1.50 1.57 2.09 106.0 19 % 1.1 % 1.152 10.8 3.3 1.4 0.79 1.13typescript 1263 120 1.26 1.31 1.85 95.0 20 % 1.1 % 1.079 14.2 6.5 3.0 2.64 3.86zlib 41051 2106 1.47 1.45 2.47 51.3 18 % 2.2 % 1.138 13.5 8.0 2.0 0.46 1.40average 13.6 6.3 1.7 0.7 1.1
Table 5. CLI characteristics and branch prediction for Nehalem (Neh.), Sandy Bridge (SB), Haswell (Has.) and TAGEbenchmark Gbc Gins IPC ins/bc br ind ind/bc MPKI
Neh. SB Has. Neh. SB Has. T1 T2 T3164.gzip 78.8 1667.2 1.20 1.23 2.55 21.2 23 % 4.8 % 1.02 18.7 14.5 0.5 0.64 1.58 0.62175.vpr 18.4 400.9 0.97 1 1.80 21.8 23 % 4.7 % 1.03 24.8 21.9 6.3 6.49 13.62 1.08177.mesa 118.6 3177.1 1.32 1.3 2.13 26.8 23 % 4.0 % 1.07 13.8 11.1 2.6 0.21 0.59 0.20179.art 4.7 58.5 1.64 1.49 2.70 12.5 26 % 8.0 % 1.00 7.3 9.3 0.2 0.38 0.38 0.37181.mcf 13.3 181.2 1.13 1.19 2.19 13.7 25 % 7.4 % 1.01 17.5 15.1 1.1 1.33 2.09 1.08183.equake 40.5 726.1 1.09 1.09 2.34 17.9 24 % 5.7 % 1.02 20.8 19 1.7 0.47 0.68 0.43186.crafty 35.8 1047.3 1.02 1.03 1.42 29.2 22 % 3.5 % 1.04 21.1 19.2 11.6 11.87 16.31 4.01188.ammp 91.3 1665.9 1.15 1.24 2.18 18.3 24 % 5.7 % 1.04 19.5 14.4 2.9 0.39 1.14 0.30197.parser 12.6 447.5 1.19 1.24 2.18 35.4 22 % 3.0 % 1.06 14.4 10.8 1.4 1.01 2.75 0.70256.bzip2 28.3 460.8 1.16 1.32 2.29 16.3 24 % 6.2 % 1.02 17.5 12.7 1.6 1.55 2.15 0.44average 17.5 14.8 3.0 2.4 4.1 0.9
marks, however, run slower, because of the induced codebloat, and the instruction cache behavior degradation. Theyreport the switch dispatch to be 12 instructions and 19 cy-cles on an UltraSparc-III processor, and on average 100 cy-cles per bytecode for the factorial function written in Tcl.
McCandless and Gregg [19] propose to optimize code atthe assembly level to eliminate interferences between targetsof the indirect branch. Two techniques are developed: forc-ing alignment, and reordering entries. The hardware usedfor experiments is a Core2 processor. We claim that modernbranch predictors are quite insensitive to target placement.
6.1 Stack Caching and RegistersWith the notable exception of the Dalvik virtual machine [9],most current interpreters perform their computations on anevaluation stack. Values are stored in a data structure whichresides in memory (recall Figure 1 for illustration). Ertl pro-posed stack caching [10] to force the top of the stack intoregisters. Together with Gregg, they later proposed to com-bine it with dynamic superinstructions [13] for additionalperformance. Stack caching is orthogonal to the behavior ofthe branch predictor. While it could decrease the number ofcycles of the interpreter loop, and hence increase the rela-tive impact of a misprediction, this data will typically hit in
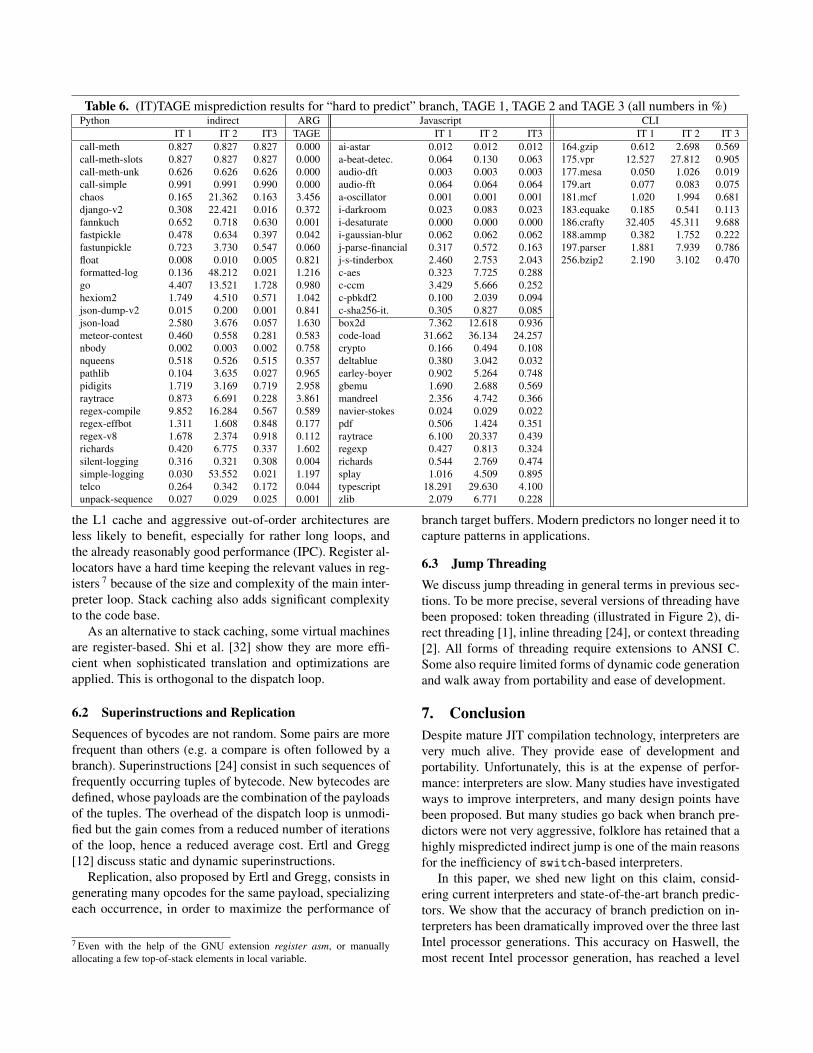
Table 6. (IT)TAGE misprediction results for “hard to predict” branch, TAGE 1, TAGE 2 and TAGE 3 (all numbers in %)Python indirect ARG Javascript CLI
IT 1 IT 2 IT3 TAGE IT 1 IT 2 IT3 IT 1 IT 2 IT 3call-meth 0.827 0.827 0.827 0.000 ai-astar 0.012 0.012 0.012 164.gzip 0.612 2.698 0.569call-meth-slots 0.827 0.827 0.827 0.000 a-beat-detec. 0.064 0.130 0.063 175.vpr 12.527 27.812 0.905call-meth-unk 0.626 0.626 0.626 0.000 audio-dft 0.003 0.003 0.003 177.mesa 0.050 1.026 0.019call-simple 0.991 0.991 0.990 0.000 audio-fft 0.064 0.064 0.064 179.art 0.077 0.083 0.075chaos 0.165 21.362 0.163 3.456 a-oscillator 0.001 0.001 0.001 181.mcf 1.020 1.994 0.681django-v2 0.308 22.421 0.016 0.372 i-darkroom 0.023 0.083 0.023 183.equake 0.185 0.541 0.113fannkuch 0.652 0.718 0.630 0.001 i-desaturate 0.000 0.000 0.000 186.crafty 32.405 45.311 9.688fastpickle 0.478 0.634 0.397 0.042 i-gaussian-blur 0.062 0.062 0.062 188.ammp 0.382 1.752 0.222fastunpickle 0.723 3.730 0.547 0.060 j-parse-financial 0.317 0.572 0.163 197.parser 1.881 7.939 0.786float 0.008 0.010 0.005 0.821 j-s-tinderbox 2.460 2.753 2.043 256.bzip2 2.190 3.102 0.470formatted-log 0.136 48.212 0.021 1.216 c-aes 0.323 7.725 0.288go 4.407 13.521 1.728 0.980 c-ccm 3.429 5.666 0.252hexiom2 1.749 4.510 0.571 1.042 c-pbkdf2 0.100 2.039 0.094json-dump-v2 0.015 0.200 0.001 0.841 c-sha256-it. 0.305 0.827 0.085json-load 2.580 3.676 0.057 1.630 box2d 7.362 12.618 0.936meteor-contest 0.460 0.558 0.281 0.583 code-load 31.662 36.134 24.257nbody 0.002 0.003 0.002 0.758 crypto 0.166 0.494 0.108nqueens 0.518 0.526 0.515 0.357 deltablue 0.380 3.042 0.032pathlib 0.104 3.635 0.027 0.965 earley-boyer 0.902 5.264 0.748pidigits 1.719 3.169 0.719 2.958 gbemu 1.690 2.688 0.569raytrace 0.873 6.691 0.228 3.861 mandreel 2.356 4.742 0.366regex-compile 9.852 16.284 0.567 0.589 navier-stokes 0.024 0.029 0.022regex-effbot 1.311 1.608 0.848 0.177 pdf 0.506 1.424 0.351regex-v8 1.678 2.374 0.918 0.112 raytrace 6.100 20.337 0.439richards 0.420 6.775 0.337 1.602 regexp 0.427 0.813 0.324silent-logging 0.316 0.321 0.308 0.004 richards 0.544 2.769 0.474simple-logging 0.030 53.552 0.021 1.197 splay 1.016 4.509 0.895telco 0.264 0.342 0.172 0.044 typescript 18.291 29.630 4.100unpack-sequence 0.027 0.029 0.025 0.001 zlib 2.079 6.771 0.228
the L1 cache and aggressive out-of-order architectures areless likely to benefit, especially for rather long loops, andthe already reasonably good performance (IPC). Register al-locators have a hard time keeping the relevant values in reg-isters 7 because of the size and complexity of the main inter-preter loop. Stack caching also adds significant complexityto the code base.
As an alternative to stack caching, some virtual machinesare register-based. Shi et al. [32] show they are more effi-cient when sophisticated translation and optimizations areapplied. This is orthogonal to the dispatch loop.
6.2 Superinstructions and ReplicationSequences of bycodes are not random. Some pairs are morefrequent than others (e.g. a compare is often followed by abranch). Superinstructions [24] consist in such sequences offrequently occurring tuples of bytecode. New bytecodes aredefined, whose payloads are the combination of the payloadsof the tuples. The overhead of the dispatch loop is unmodi-fied but the gain comes from a reduced number of iterationsof the loop, hence a reduced average cost. Ertl and Gregg[12] discuss static and dynamic superinstructions.
Replication, also proposed by Ertl and Gregg, consists ingenerating many opcodes for the same payload, specializingeach occurrence, in order to maximize the performance of
7 Even with the help of the GNU extension register asm, or manuallyallocating a few top-of-stack elements in local variable.
branch target buffers. Modern predictors no longer need it tocapture patterns in applications.
6.3 Jump ThreadingWe discuss jump threading in general terms in previous sec-tions. To be more precise, several versions of threading havebeen proposed: token threading (illustrated in Figure 2), di-rect threading [1], inline threading [24], or context threading[2]. All forms of threading require extensions to ANSI C.Some also require limited forms of dynamic code generationand walk away from portability and ease of development.
7. ConclusionDespite mature JIT compilation technology, interpreters arevery much alive. They provide ease of development andportability. Unfortunately, this is at the expense of perfor-mance: interpreters are slow. Many studies have investigatedways to improve interpreters, and many design points havebeen proposed. But many studies go back when branch pre-dictors were not very aggressive, folklore has retained that ahighly mispredicted indirect jump is one of the main reasonsfor the inefficiency of switch-based interpreters.
In this paper, we shed new light on this claim, consid-ering current interpreters and state-of-the-art branch predic-tors. We show that the accuracy of branch prediction on in-terpreters has been dramatically improved over the three lastIntel processor generations. This accuracy on Haswell, themost recent Intel processor generation, has reached a level
where it can not be considered as an obstacle for perfor-mance anymore. We have also shown that this accuracy ison par with the one of the literature state-of-the-art ITTAGE.While the structure of the Haswell indirect jump predictor isundisclosed, we were able to confirm with simulations ofITTAGE that the few cases where the prediction accuracy isrelatively poor are due to footprint issues on the predictorand not inherent to the prediction scheme.
AcknowledgmentThis work was partially supported by the European ResearchCouncil Advanced Grant DAL No 267175.
References[1] J. R. Bell. Threaded code. CACM, 16(6), 1973.
[2] M. Berndl, B. Vitale, M. Zaleski, and A. D. Brown. Contextthreading: A flexible and efficient dispatch technique for vir-tual machine interpreters. In CGO, 2005.
[3] S. Brunthaler. Virtual-machine abstraction and optimizationtechniques. Electronic Notes in Theoretical Computer Sci-ence, 253(5):3–14, 2009.
[4] P.-Y. Chang, E. Hao, and Y. N. Patt. Target prediction forindirect jumps. In ISCA, 1997.
[5] R. Costa, A. C. Ornstein, and E. Rohou. CLI back-end inGCC. In GCC Developers’ Summit, 2007.
[6] T. Cramer, R. Friedman, T. Miller, D. Seberger, R. Wilson,and M. Wolczko. Compiling Java just in time. Micro, IEEE,17(3), 1997.
[7] J. W. Davidson and J. V. Gresh. Cint: a RISC interpreter forthe C programming language. In Symposium on Interpretersand interpretive techniques, 1987.
[8] K. Driesen and U. Holzle. Accurate indirect branch predic-tion. In ISCA, 1998.
[9] D. Ehringer. The Dalvik virtual machine architecture, 2010.
[10] M. A. Ertl. Stack caching for interpreters. In PLDI, 1995.
[11] M. A. Ertl and D. Gregg. The behavior of efficient virtualmachine interpreters on modern architectures. In EuroPar.2001.
[12] M. A. Ertl and D. Gregg. Optimizing indirect branch predic-tion accuracy in virtual machine interpreters. In PLDI, 2003.
[13] M. A. Ertl and D. Gregg. Combining stack caching with dy-namic superinstructions. In Workshop on Interpreters, VirtualMachines and Emulators, 2004.
[14] Intel. Intel 64 and IA-32 Architectures Software Developer’sManual, 2013.
[15] D. A. Jimenez and C. Lin. Dynamic branch prediction withperceptrons. In HPCA, 2001.
[16] C.-C. Lee, I.-C. K. Chen, and T. N. Mudge. The bi-modebranch predictor. In MICRO, 1997.
[17] C.-K. Luk et al. Pin: building customized program analysistools with dynamic instrumentation. In PLDI, 2005.
[18] J. Marusarz, S. Cepeda, and A. Yasin. How to tune applica-tions using a top-down characterization of microarchitecturalissues. Technical report, Intel.
[19] J. McCandless and D. Gregg. Compiler techniques to improvedynamic branch prediction for indirect jump and call instruc-tions. ACM TACO, 8(4), 2012.
[20] S. McFarling. Combining branch predictors. Technical ReportTN-36, Digital Western Research Laboratory, 1993.
[21] P. Michaud, A. Seznec, and R. Uhlig. Trading conflict andcapacity aliasing in conditional branch predictors. SIGARCHComput. Archit. News, 25(2), 1997.
[22] T. Mytkowicz, A. Diwan, M. Hauswirth, and P. F. Sweeney.Producing wrong data without doing anything obviouslywrong! In ASPLOS, 2009.
[23] A. Naumann and P. Canal. The role of interpreters in highperformance computing. In ACAT in Physics Research, 2008.
[24] I. Piumarta and F. Riccardi. Optimizing direct threaded codeby selective inlining. SIGPLAN Not., 33(5), 1998.
[25] G. Richards, S. Lebresne, B. Burg, and J. Vitek. An analysisof the dynamic behavior of JavaScript programs. In PLDI,2010.
[26] E. Rohou. Tiptop: Hardware Performance Counters for theMasses. Technical Report RR-7789, INRIA, 2011.
[27] G. Savrun-Yeniceri et al. Efficient interpreter optimizationsfor the JVM. In PPPJ, 2013.
[28] A. Seznec. Analysis of the O-GEometric History LengthBranch Predictor. In ISCA, 2005.
[29] A. Seznec. A new case for the TAGE branch predictor. InMICRO, 2011.
[30] A. Seznec, S. Felix, V. Krishnan, and Y. Sazeides. Designtradeoffs for the Alpha EV8 conditional branch predictor. InISCA, 2002.
[31] A. Seznec and P. Michaud. A case for (partially) TAggedGEometric history length branch prediction. JILP, 8, 2006.
[32] Y. Shi, K. Casey, M. A. Ertl, and D. Gregg. Virtual machineshowdown: Stack versus registers. ACM TACO, 4(4), 2008.
[33] E. Sprangle, R. S. Chappell, M. Alsup, and Y. N. Patt. Theagree predictor: A mechanism for reducing negative branchhistory interference. In ISCA, 1997.
[34] B. Vitale and T. S. Abdelrahman. Catenation and specializa-tion for Tcl virtual machine performance. In Workshop onInterpreters, virtual machines and emulators, 2004.
[35] V. M. Weaver and J. Dongarra. Can hardware performancecounters produce expected, deterministic results? In FHPM,2010.
[36] E. Wieprecht et al. The HERSCHEL/PACS Common Soft-ware System as Data Reduction System. ADASS XIII, 2004.
[37] T.-Y. Yeh and Y. N. Patt. Two-level adaptive training branchprediction. In MICRO, 1991.