Embed Size (px)
Citation preview
Master Thesis
Brand Equity for E-recruitment companies
A quantitative research on individuals’ intention to
use e-recruitment websites
Authors: Mathias Guselin, Joakim
Jörgensen, Sebastian Johansson
Supervisor: Setayesh Sattari
Examiner: Anders Pehrsson
Date: 2016-05-27
Subject: Marketing
Level: Graduate Level
Course code: 4FE15E

II
III
Acknowledgements
This master thesis was conducted in the spring semester 2016. The thesis aimed to contribute
to the understanding of the determinants of brand equity of e-recruitment websites and how
they affect individuals’ intention to use such websites. Conducting the thesis has been a great
challenge, however the execution was dependent on support and feedback from several
individuals. Therefore, we would like to take this moment to show our gratefulness towards
these individuals.
We would like to express our gratefulness to our tutor, Dr. Setayesh Sattari, who has provided
us with valuable feedback and expertise during the whole process; we admire your
helpfulness and commitment. Also, we would like to thank our examiner, Prof. Anders
Pehrsson, who made it possible for us to improve the thesis by providing us with valuable
feedback and guidelines. Furthermore, we also would like to show our gratefulness to the
individuals that answered the online questionnaire. Finally, we would like to thank our
opponents and fellow students for giving us valuable feedback and recommendation during
the whole process of this thesis.
Växjö 2016-05-27
Mathias Guselin Joakim Jörgensen Sebastian Johansson
IV
Abstract
Course/Level: 4FE15E/ Graduate Level
Authors: Mathias Guselin, Joakim Jörgensen, Sebastian Johansson
Tutor: Dr. Setayesh Sattari
Examiner: Prof. Anders Pehrsson
Background: Internet has brought radical changes in the recruitment industry where
individuals are increasingly turning to the Internet when seeking jobs. The
increased use of e-recruitment is partly because it is considered to be the
most effective way to reach the target group of applicants, and partly
because of the cost savings and competitive pressure in the market.
Therefore, is the brand a crucial factor for online companies such as e-
recruitment websites thus having a strong brand can lead to competitive
advantage in the market. The role of branding in e-marketing is increasingly
getting more important. Previous research has used intention to purchase as
an outcome of brand equity. However, this research studies brand equity
towards intention to use as most e-recruitment websites offer free services.
Purpose: To describe the determinants of brand equity of e-recruitment websites and
how they affect individuals’ intention to use such websites.
Methodology: A quantitative research was chosen to collect the data using an online
questionnaire to be able to describe the variables relationship in this
research.
Conclusion: The findings of this research suggests that brand equity as a whole increases
individuals’ intention to use an e-recruitment website. The determinant of
brand equity; brand awareness, perceived quality and brand loyalty gave a
positive and significant relationship towards individuals’ intention to use.
The findings involving the moderator were found to be significant when
using brand equity as whole, while being rejected when involving the
determinants of brand equity.
Keywords: Brand equity, Brand awareness, Brand association, Perceived quality, Brand
loyalty, Intention to use, E-recruitment
V
Table of content
1. Introduction .......................................................................................................................... 1
1.1 Background ..................................................................................................................... 1
1.2 Problem Discussion ........................................................................................................ 2
1.3 Purpose ............................................................................................................................ 4
1.4 Research Questions ........................................................................................................ 4
1.5 Outline of The Paper ...................................................................................................... 4
2. Theoretical Framework ....................................................................................................... 5
2.1 Brand Equity .................................................................................................................. 5
2.1.1 Service Brand Equity ................................................................................................ 6
2.1.2 Online Service Brad Equity ....................................................................................... 6
2.2 Brand Awareness ............................................................................................................ 7
2.3 Brand Association .......................................................................................................... 8
2.4 Perceived Quality ........................................................................................................... 9
2.5 Brand Loyalty ................................................................................................................. 9
2.6 Intention to Use ............................................................................................................. 10
2.7 Hypothesis Formulation .............................................................................................. 11
3. Conceptual Framework ..................................................................................................... 13
3.1 Research Model ............................................................................................................ 13
4. Methodology ....................................................................................................................... 15
4.1 Research Approach and Research Design ................................................................. 15
4.2 Data Sources ................................................................................................................. 15
4.3 Data Collection Method ............................................................................................... 15
4.4 Operationalization and Data Collection Instrument ................................................ 16
4.5 Pre-test ........................................................................................................................... 17
4.6 Sample ........................................................................................................................... 18
4.7 Data Analysis Method .................................................................................................. 18
4.8 Quality Criteria ............................................................................................................ 20
4.8.1 Validity .................................................................................................................... 20
4.8.2 Reliability ................................................................................................................ 21
4.8.3 Quality Data Control ............................................................................................... 21
4.9 Methodology Summary ................................................................................................ 22

VI
5. Results ................................................................................................................................. 23
5.1 Descriptive Statistics .................................................................................................... 23
5.3 Hypothesis Testing ....................................................................................................... 25
5.4 Moderated Regression Analysis .................................................................................. 27
5.5 Summary of Hypothesis Testing ................................................................................. 31
6. Discussion ............................................................................................................................ 32
6.1 Brand Equity ................................................................................................................ 32
6.2 The Determinants of Brand Equity ............................................................................ 32
6.2.1 Brand Awareness ..................................................................................................... 32
6.2.2 Brand Association ................................................................................................... 33
6.2.3 Perceived Quality .................................................................................................... 34
6.2.4 Brand Loyalty .......................................................................................................... 34
6.3 Moderating Effect ........................................................................................................ 35
7. Conclusion ........................................................................................................................... 36
8. Research Implications ........................................................................................................ 37
8.1 Theoretical Implications .............................................................................................. 37
8.2 Managerial Implications .............................................................................................. 37
8.3 Limitations and Future Research ............................................................................... 38
List of References ................................................................................................................... 39
Appendix 1 - Descriptive of the constructs items ................................................................ 47
Appendix 2 – Online Questionnaire ..................................................................................... 48
1
1. Introduction
This chapter provides an introduction of e-recruitment and brand equity. The chapter also
includes a problem discussion that problematizes the area and importance of brand equity for
e-recruitment companies, which leads to the purpose of the study.
1.1 Background
The way individuals gather information and resources on the Internet has been revolutionized
due to the rise of globalization (Selden & Orenstein, 2011). The increased role of Internet and
the number of individuals using it has developed new markets and in line with this, businesses
have moved to the online environment (Ngai & Gunasekaran 2007; Rafiq et al., 2013). In
accordance with this, Internet has brought radical changes in the recruitment industry where
individuals are increasingly turning to the Internet when seeking jobs. At the same time,
companies use commercial recruiting websites seeking for qualified applicants to conduct
their recruiting procedure online (Singh & Narang, 2008; Sylva et al., 2009; Selden &
Orenstein, 2011). This phenomenon is called e-recruitment, which is defined as “...a hiring
process that utilizes a variety of electronic means and technologies with the primary purpose
of identifying, attracting, and selecting potential employees” (Lee, 2011, pp. 231). The
increased use of e-recruitment is partly because it is considered to be the most effective way
to reach the target group of applicants, and partly because of the cost savings and competitive
pressure in the market (Pfieffelmann et al., 2010; Thielsch et al., 2012). Firms that manage to
recruit the most qualified individuals have higher potential to get a better position in the
market (Thielsch et al., 2012). Accordingly, research shows that e-recruitment websites can
play a crucial role in determining if companies attract qualified applicants (Allen et al., 2007;
Dineen et al., 2007). In line with the advance of the technology within the e-recruitment
business, new features and modern systems has been created to achieve strategic advantage
within the market (Lee, 2007).
The brand is a crucial factor for online companies such as e-recruitment websites and having
a strong brand can lead to competitive advantage in the market (Christodoulides et al., 2006;
Kim and Hyun, 2011). In order to measure how strong a brand is the concept brand equity is
used (Rios & Riquelme, 2010). Brand equity is defined by Aaker (1991, p. 15) as “...a set of
assets and liabilities linked to a brand, its name and symbol, that add to or subtract from the
value provided by a product or service to a firm and/or that firm’s customers”. Previous

2
research suggests that there are two different perspectives of brand equity, which are;
consumer-based brand equity, focusing on the consumer's perception of the brand and firm-
based brand equity, focusing on the financial value to the brand asset (Simon & Sullivan,
1993; Christodoulides et al., 2015). However, most marketing research regarding brand equity
has focused on consumer-based brand equity (Aaker, 1991; Keller, 1993).
1.2 Problem Discussion
The number of Internet users around the world is steadily increasing and this has created an
opportunity for companies to conduct their business transactions online (Japhet & Usman,
2010). However, this has resulted in a highly competitive marketplace for online companies
to be in (Zhilin et al., 2004). A big challenge for online companies is that customers now with
the use of Internet seek, evaluate and compare information about products and services by
themselves (Kucuk & Krishnamurthy, 2007; Chen, 2001). Bhatti et al. (2000) explains that
because the customer can gather their own information on the Internet and that there exist
many brands that offer the same type of service and products on their websites, is it difficult
for online companies to retain and attract customers to their specific website. Therefore, it has
become important for online companies to differentiate their brand from the competitors since
a brand is vital for a company to be successful (Kim et al., 2002). Differentiating a brand
against competitors can be a difficult task due to the fact that the services or products that are
offered can be identical between different brands (Kim et al., 2002). However, brand equity
can function as a powerful differentiator for companies and as a decision making tool for
individuals (Aaker, 1991; Aaker, 1996; Keller & Lehmann, 2006; Keller, 2013). Researchers
have focused attention to this as they have realized that building strong brand equity can give
a competitive advantage in the form of being the brand that gives the customer most value
(Biedenbach et al., 2015).
Most of the research conducted concerning brand equity has focused on traditional firms, and
little on how it affects online companies (Christodoulides & de Chernatony, 2010; Rios &
Riquelme, 2008). This is in accordance with Alwi and Ismail (2013) given the increasing
number of Internet users around the world, the role of branding in e-marketing is increasingly
getting more important, still it is scarce attempts to measure brand equity in an online context.
Rios and Riquelme (2008) explains that online companies need to think of brand equity in a
different way since an online business context can differ from an offline business context as
consumers may experience a brand differently when interacting with technology rather than
3
with people as it is intangible. Therefore, it is important for online companies through their
websites to know what factors the consumers value the most in order to attract and
differentiate themselves from the crowd (Hong-Youl, 2004). Especially, this has become a
challenge for e-recruitment websites as it is one of the most widely practiced e-business areas
(Lee, 2011) and the online service those companies provide for the users are similar (Kim et
al., 2002). Hence, brand equity for these types of companies is a good measurement as it
explains the added value for a brand, which a customer would evaluate his or hers preferences
on which website to use (Aaker, 1991; Keller, 2003).
Brand equity can be seen as a vital factor for being able to be associated with good
performance in the customer’s mind, thereby the companies should focus to look on what the
customers base their values on, to strengthen customer loyalty and relationships in order to
optimise pricing (Aaker, 1991). In the branding literature, consumer-based brand equity is
traditionally recognized with four different determinants; brand awareness, brand association,
perceived quality and brand loyalty (Aaker, 1996; Biedenbach et al., 2015; Cobb-Walgren et
al., 1995; Yoo & Donthu, 2001). According to Christodoulides et al. (2015) one of the most
recognized and adopted model of consumer-based brand equity stems from Aaker (1991).
Aaker (1991) argues that brand equity can be seen as a set of assets that is conceptualized into
multidimensional concepts, which are the determinants mentioned above. Previous research
has used intention to purchase as an outcome of brand equity (Agarwal & Rao, 1996; Cobb-
Walgren et al., 1995). However, in this study, intention to purchase is referred to as intention
to use as most e-recruitment websites offer free service in which the users do not actually
purchase anything (Galanaki, 2002). In the context of e-commerce, previous research shows
that individuals’ earlier experience with a website and fulfillment of the service delivery has
an influence on individuals’ intention to use the website in the future (Cho, 2015; Chen et al.,
2009; Wang et al., 2006). Therefore, in this study brand equity and its determinants will be
used to measure individuals’ intention to use e-recruitment websites, since it is important to
understand how the brand value is formed in the mind of the users and how it translates into
choice behavior in the future (Cobb-Walgren et al., 1995). Research in the e-recruitment area
is still called for since it has not been widely explored (Lee, 2011). By combining the lack of
research regarding how brand equity and its determinants affects online service companies
(Agiwal, 2013) and the research on e-recruitment businesses (Lee, 2011) will this study try to
fill this gap.

4
1.3 Purpose
The purpose of this study is to examine the determinants of brand equity of e-recruitment
websites and how they affect individuals’ intention to use such websites.
1.4 Research Questions
How are brand equity and its determinants related to individuals’ intention to use e-
recruitment websites?
How does the relationship of brand equity and its determinants to individuals’
intention to use e-recruitment websites change if individuals have acquired a job via
an e-recruitment website?
1.5 Outline of The Paper
Chapter 2 presents existing theory that has been utilized for this research and ends with the
formulations of hypotheses. In chapter 3 a conceptual framework is presented with a
conceptual model. Further, chapter 4 explains how the research was conducted and presents
different methodology sections of how the researchers have followed through this research.
Chapter 5 presents the results from the data collection, which further is discussed in chapter 6.
Chapter 7 presents a conclusion, where the purpose of the study is answered and finally
chapter 8 brings up theoretical and managerial implications, limitations and future research.
5
2. Theoretical Framework
This chapter presents existing theory that has been utilized for this study. The theory consists
of the following parts; Brand equity, brand awareness, brand association, perceived quality,
brand loyalty and intention to use. To finalize the chapter, the formulations of hypotheses are
presented.
2.1 Brand Equity
A brand is a name and a symbol that is unique to the producer, which identifies the services or
products of the producer. The brand signals the source of the product and distinguishes it from
other competitors (Aaker, 1991). Having loyal customers for a company is essential to
maintain a good customer base of returning customers since they are willing to pay more and
are also less costly to serve (Zhang et al., 2014). Thus, showing commitment to customers and
establish a satisfied customer base is a valuable asset which far exceeds the value of a single
transaction as the values of a lifetime customer and the customers’ opinions will bring more
business in future periods (Ambler, 1994; Shugan, 2005). In order to measure a brand’s value,
the term brand equity is used (Aaker, 1991). The most common definition of what brand
equity conceptualizes is the added value to the product or service once the brand is presented
(Farquhar, 1989; Aaker, 1991; Park & Srinivasan, 1994; Keller, 1993). A product offers a
functional benefit, but the brand asset enhances its value beyond its functional use (Farquhar,
1989). There are two perspectives of brand equity, firm-based brand equity and customer-
based brand equity. For firms, strong brand equity increases cash flow to the company and
have even been accountable as an intangible financial value on firm’s balance sheets
(Christodoulides & de Chernatony, 2010; Simon & Sullivan, 1993; Pike et al., 2010). The
benefit of strong customer-based brand equity is how customer values one product over the
other despite the same product utility, due to the favorable brand association the customers
holds in mind towards the brand or trademark (Keller, 2003). Consumer-based brand equity is
accepted to many being measured in four key constructs, which is brand awareness, brand
association, perceived quality, brand loyalty (Aaker, 1996; Yoo et al., 2000; Pike et al., 2010;
Kim & Hyun, 2011; Buil et al., 2013).
6
2.1.1 Service Brand Equity
Brands play an important role to customers when buying or selecting between different
services, since the brand can help the customer to better visualize and understand the service
before a purchase (Berry, 2000). Services lack tangibility, which makes the company and the
brand in focus, different from products the service interaction is more representative of the
brand (Berry, 2000). Trust in terms of being able to live up to promises, can both enhance or
kill a brand (Keller, 2003). Therefore, the experiences of the service is vital for the brand, if
the marketing does not live up to the customers expectations the brand cannot save the
service, as the brand itself is the promise of a good service (Berry, 2000; Kimpakorn &
Tocquer, 2010). According to He and Li (2011) the main focus of brand equity for service
brands is the overall service quality, as investments in service quality will positively affect
customers’ perception and the service experience, which in turn would strengthen the brand
associations. Kimpakorn and Tocquer (2010) explains that service brands have to rely more
on the employees as the brand is formulated internal, then forwarded by the staff as they are
the foundation of the brand. Reaching high brand equity for services is about delivering
consistent and compelling experiences, which the customer will hold favourable (Kimpakorn
& Tocquer, 2010). However, the context of the service may differ as new ways of delivering
services has emerged through technology, e.g. self service systems online where an
interpersonal service system can take place, does not create brand equity through the
interaction between customer and employees (Meuter et al., 2000).
2.1.2 Online Service Brad Equity
Online service brand equity differs from traditional consumers’ perspective on good’s brand
equity (Rios & Riquelme, 2008). In accordance to how Berry (2000) explains that a product
represents the brand, online services differ, as the derived experience is the actual brand
formation. In an online environment the service is delivered without an interaction between an
employee and customer, which differs from traditional services (Meuter et al., 2000; Rios &
Riquelme, 2008). Hence, for web-based brands the brand equity is argued for being formed
on some additional antecedents as security, navigation and accessibility (Rios & Riquelme,
2008). Page and Lepowska-White (2002) has from traditional brand equity theories (Keller,
2003; Aaker, 1991), conceptualised web equity. Web equity is a framework for how online
companies can build or create added value online (Page & Lepkowska-White, 2002). Since
there are several different e-recruitment websites online (monster.se, criutway.se, mycarer.se,
linkedin.com, framtiden.se ect.), an important goal for such companies would be to enhance
the likelihood the potential customer would think of their website first (Page & Lepkowska-

7
White, 2002). This is in line with Keller (2003) and Aaker’s (1991) traditional theory about
brand equity, that having strong brand equity will lead to customers choosing one product or
service over the other once the brand is introduced. But also that it will bring increased
financial value in future periods (Ambler, 1994; Shugan, 2005), in this case traffic to the
company’s website. Therefore, brand equity will be measured in the four different
dimensions, brand awareness, brand association, brand loyalty and perceived quality.
2.2 Brand Awareness
According to previous research brand awareness is a factor affecting brand equity for online
companies (Kim et al., 2002; Rios & Riquelme, 2010). Brand awareness takes place when an
individual is familiar with a specific brand and the likelihood that the brand will come to the
individual’s mind. Berry (2000) states that brand awareness is an individual’s ability to think
of a firm when a certain product category is recalled. Brand awareness is divided into two
different parts; Brand recognition and brand recall (Keller, 1993; Aaker, 1991). Brand
recognition is when an individual can verify a prior exposure to a specific brand when a cue is
given to the brand (Keller, 1993). Further, brand recognition requires that the individual
correctly separate the brand as having been heard or seen earlier (Keller, 1993). Brand recall
is an individual’s capability to retrieve a brand when it is being mentioned (Rosenbaum-
Elliott et al., 2011).
Brand awareness is a crucial first step for consumers when selecting to purchase from a
certain brand and can have a crucial impact on individuals’ consideration in the purchase
phase of a product or service (Konecnik & Gartner, 2007; Page & Lepkowska-White, 2002).
Lin et al. (2014) argue that brand awareness has a significant importance in individuals’
decision-making process when being exposed to new situations. When an individual chose a
product the choice could be based on perceptions about the brand such as popularity of the
brand, how strong reputation the brand has and how well known the brand is (Lin et al.,
2014). According to Page and Lepkowska-White (2002) brand awareness can be built upon
two different perspectives; communication from the firm itself or external communication
without support from the company. The communication by the firm itself refers to when the
company communicates their message by online channels such as banner ads and offline
channels such as advisement in newspapers. The external communication is communication
without help from the firm itself such as word of mouth, which have been found to be a
8
powerful tool in order to leading individuals to visiting web sites (Page & Lepkowska-White,
2002).
2.3 Brand Association
Brand association has according to previous research an impact on brand equity (Aaker, 1996;
Biedenbach et al., 2015; Cobb-Walgren et al., 2005; Yoo & Donthu, 2001). Aaker (1991, p.
109) defines brand association as ”anything linked in memory to a brand”. Balaji (2011)
argues that brand association is a factor that differentiates the brand in individuals’ minds and
can give individuals a reason for purchasing a specific product or service. In the aspect of
brand association, the information connected in the memory for individuals is a crucial part
for brand equity and are considered to include the meaning of the brand for individuals
(Keller, 1993; Balaji, 2011).
According to previous research trust is a crucial factor for online companies in order to create
positive brand association (Rios & Riquelme, 2008; Page & Lepkowska-White, 2002).
According to Delgado-Balleste et al. (2003, p.11) trust is defined as “feeling of security held
by the consumer in his/her interaction with the brand, that is based on the perceptions that the
brand is reliable and responsible for the interests and welfare of the consumer”. The main
reason why trust must be created is because online businesses are intangible and therefore it is
difficult for individuals to judge the companies from intangible cues (Berry, 2000).
Individual’s inability to trust online companies has been a barrier for online transactions due
to that individuals want to feel safe when making a purchase from an online business (Rios &
Riquelme, 2008; Rios & Riquelme, 2010).
Another factor affecting individuals’ brand association is customer service support. However,
this factor is argued to not directly influence brand equity (Rios & Riquelme, 2010). On the
other hand, the factor customer service is probably the most crucial characteristic for online
businesses and can be a key determinant in order to differentiate the company from
competitors in the market (Chaffey, 2000; Kim et al., 2002; Lennon & Harris, 2002;
Christodoulides et al., 2006). If it is easy to come in contact with the online business, the
customer’s trust and confidence towards the firm will increase (Page & Lepkowska-White,
2002).
9
2.4 Perceived Quality
Perceived quality is according to Aaker (1996) a key dimension used when measuring brand
equity. Previous research within the brand equity context has found that there is a relationship
between perceived quality and brand equity (Buil et al., 2013; Kim & Hyun, 2011; Pinar et
al., 2014; Yoo et al., 2000). Perceived quality can be defined as the superiority or excellence
of a product based on the consumer’s judgement (Zeithaml, 1988). Having brand superiority
is vital aspect to consider when building relationship with the customers as it relates to the
extent customers think of the brand as better and more unique than other brands (Keller,
1993). Parasuraman et al. (1985) argue that it is difficult for consumers to evaluate the quality
of a service compared to products or goods, as there are no tangible comparisons that can be
made. This is in accordance with Berry (2000) and Kim et al. (2002) who explain that service
companies needs to deliver better visualization and make it easy for customers to understand
the intangible products (e.g., website quality). Kim et al. (2002) argue that this is important
for online service companies and that the brand is reflected upon its website. Most of the
interaction between an online company and customer is through the website and therefore it is
important for the brand to have a high quality website. According to Kim et al. (2002) and
Gommans et al. (2001) there are three underlying factors that assist in order to build a high
quality website; web usability, design and information architecture. The meaning of these
factors are that it should be easy to navigate on the website, easy to use and that the
information on the website is accurate (Kim et al., 2002). This is in accordance with Yang and
Fang (2004) who argue that ease of use and easy of navigation of a website is key to attract
both experienced and new customers. If the perceived quality of a website is lacking it can
hinder the success of an online business (Yang & Fang, 2004; Jiang et al., 2015).
As mentioned above, perceived quality is seen as a key dimension when creating brand equity
(Aaker, 1996). This is consistent with Pinar et al. (2014) who argue when measuring the
dimension towards brand equity in an university context, perceived quality is seen as the most
important dimension. This is contradictory with Yoo et al. (2000) who find that brand loyalty
is the dimension that has the strongest relationship with brand equity.
2.5 Brand Loyalty
Brand loyalty is another dimension that researchers have acknowledged impact brand equity
(Aaker, 1996). According to Rios and Riquelme (2008) brand loyalty is by far the most
influential among the different determinants of brand equity. Brand loyalty can be defined as
10
how likely it is for a customer to switch to another brand, especially in situation when a brand
is making changes within the company (e.g., product features or price) (Aaker, 1996).
Gommans et al. (2001) describe it in a more traditional view that loyalty is when a consumer
repeats their buying behavior towards a specific brand. Creating customers into loyal
customers is important for companies as it can give several strategic advantages such as
higher market share, reducing marketing costs (less expensive to retain customers than attract
new), gaining new customers and minimize the risk of competitive threats (Atilgan et al.,
2005). Keller (2001) argues that a company has gained loyal customers when they are willing
to invest time, energy, or money into a specific brand. This could be that the customers join a
community that is representing the brand, receive updates or visit websites that is related to
the brand (Keller, 2001). For online brands it is important that the website is of high quality in
order to attract loyal customers (Gommans et al., 2001). The information, design, and fast
page loading are important factors to build a loyal customer base. Further, Gommans et al.
(2001) argue that online consumers nowadays expect that websites are efficient and not time
consuming. Hence, it is important to have a good quality website in order for the customer to
not switch to another brand’s website (Gommans et al., 2001).
Previous research has found that brand loyalty has a direct relationship to brand equity (Yoo
& Donthu, 2001; Buil et al., 2013; Pinar et al., 2015). However, there have been discussions
among brand equity literature if brand equity is an outcome of brand loyalty (Aaker, 1996) or
if brand loyalty is an outcome of brand equity (Rios & Riquelme, 2008; Page & Lepkowska,
2002). Rios and Riquelme (2008) argue that there is no evidence that brand loyalty is an
outcome of brand equity and that this is just an assumption.
2.6 Intention to Use
In order to be able to gain understanding of certain behavior, one has to identify intentions to
perform that behavior (Ajzen & Fishbein, 1980). Behavioral intention could be the likelihood
that an individual repeats a purchase and the intention to continue to be a customer of a
company (Wang et al., 2006; Cho, 2015). Favorable behavioral intentions show that
individuals have established a bond with the firm, which is considered as an outcome
influenced by individual’s emotions (Zeithaml et al., 1996; Kuo et al., 2012). Ajzen (1991)
and Zeithaml (1988) argue for the importance of intention to use and its connection to
attitude, where the intention representing an individual’s decision-making process and
behavior. In the context of e-commerce, previous research shows that customers’ earlier
11
experience with a website and fulfillment of the service delivery has an influence on the
consumer’s intention to use the website in the future (Cho, 2015; Chen et al., 2009). Further,
they have found that if a online service can establish perceived usefulness (relevant jobs) and
perceived ease of use (quality and navigation) the satisfaction of the online service will lead
to a continuous usage (Chen et al., 2009). This is in line with Park et al. (2007) who finds that
for online service companies, website quality is an important factor for making individuals
willing to use a website. The factors within website quality were, ease of use, information
quality, responsiveness and security/privacy which all had a positive relationship towards
individuals’ intention to use (Park et al., 2007).
2.7 Hypothesis Formulation
Previous research have found that brand equity positively affect a consumer's intention
to purchase (Berry, 2000; Buil et al., 2013; Cobb-Walgren et al., 1995; Yoo & Donthu, 2001).
Buil et al. (2013) argue that firms who possess a high level of brand equity has the ability to
easier capture consumers’ intention to use their products or services. With this in
consideration the following hypothesis was formulated:
H1 - Brand equity has a positive relationship on individuals’ intention to use e-recruitment
websites. Also, if that relationship is moderated by a usage of an e-recruitment website which
had lead to a job in the past, as an earlier experience of the service delivery influence
individuals’ intention to use (Cho, 2015; Chen et al., 2009), thereby:
H1a - Acquired a job via an e-recruitment website moderates the relationship between brand
equity and individuals’ intention to use e-recruitment websites.
The determinants that measures brand equity has also been investigated in how it relates to
intention to use. Hutter et al. (2013) suggests that brand awareness has a positive relationship
to individuals’ intention to use in an online context. Therefore, this study test if it exists in the
context of e-recruitment websites:
H2 - Brand awareness has a positive relationship on individuals’ intention to use e-
recruitment websites. Also, if that relation affected by the usage of an e-recruitment website
had lead to a job in the past (Cho, 2015; Chen et al., 2009), thereby:
H2a - Acquired a job via an e-recruitment website moderates the relationship between brand
awareness and individuals’ intention to use e-recruitment websites.
12
Another dimension that have been investigated towards individuals’ intention to use is brand
association (O’Gass & Grace, 2004). Previous research has found that brand association has a
positive effect on individuals’ intention to use (O’Gass & Grace, 2004). With this in
consideration the following hypothesis was established:
H3 - Brand association has a positive relationship on individuals’ intention to use e-
recruitment websites. Also, if that affected by the usage of an e-recruitment website had lead
to a job in the past (Cho, 2015; Chen et al., 2009), thereby:
H3a - Acquired a job via an e-recruitment website moderates the relationship between brand
association and individuals’ intention to use e-recruitment websites.
Perceived quality has also been researched towards intention to use. Netemeyer et al. (2004)
mentions that perceived quality has been associated with intention to purchase and that it is a
core construct within brand among the determinants of brand equity. It has been found that
there is a positive relationship between perceived quality and intention to purchase (Tsiotsou,
2006) and therefore is the following hypothesis considered in this study:
H4 - Perceived quality has a positive relationship on individuals’ intention to use e-
recruitment websites. Also, if that relation is affected by the usage of an e-recruitment website
had lead to a job in the past (Cho, 2015; Chen et al., 2009), thereby:
H4a - Acquired a job via an e-recruitment website moderates the relationship between
perceived quality and individuals’ intention to use e-recruitment websites.
Brand loyalty is also considered to have an effect on individuals’ intention to use. According
to Shukla (2009) brand loyalty has a positive impact on use intention. This will this be tested
in the context of e-recruitment website which generates this hypothesis:
H5 - Brand loyalty has a positive relationship on individuals’ intention to use e-recruitment
websites. Also, if that relation is affected by the usage of an e-recruitment website had lead to
a job in the past (Cho, 2015; Chen et al., 2009), thereby:
H5a - Acquired a job via an e-recruitment website moderates the relationship between brand
loyalty and individuals’ intention to use e-recruitment websites.
The relationships are further explained and motivated in the next chapter where a conceptual
model of the framework is displayed.
13
3. Conceptual Framework
Based on the theoretical framework, the conceptual model is developed which presents how
the research will be conducted.
3.1 Research Model
It is known among the branding literature that brand equity is affected by four dimensions;
brand awareness, brand association, perceived quality and brand loyalty (Aaker, 1991, 1996;
Pinar et al., 2014; Yoo et al., 2000). However, there is scarce research that has investigated
brand equity and its determinants in an online service context (Alwi & Ismail, 2013), which
this study aims to investigate. The model that the authors of this study were influenced by
stems from the model that (Aaker, 1991) developed. This model is widely referred to and one
of the most recognized when measuring consumer-based brand equity (Christodoulides et al.,
2015). In this study brand equity and its determinants will function as independent variables
and have intention to use as the dependent variable. Usually brand equity is measured to
intention to purchase (Agarwal & Rao, 1996; Cobb-Walgren et al., 1995). Despite this,
intention to purchase is in this study referred to as intention to use because of the free service
of e-recruitment websites (Galanaki, 2002). However, as Park et al. (2007) and Chen et al.
(2009) explains that the factors leading to intention to use websites are similar to those of
brand equity online. Therefore, the model assisted and explained how this research intends to
measure brand equity and its dimensions to intention to use within the context of e-
recruitment websites. Further, if the relationships are moderated by if a respondent have
acquired a job via an e-recruitment website.
14
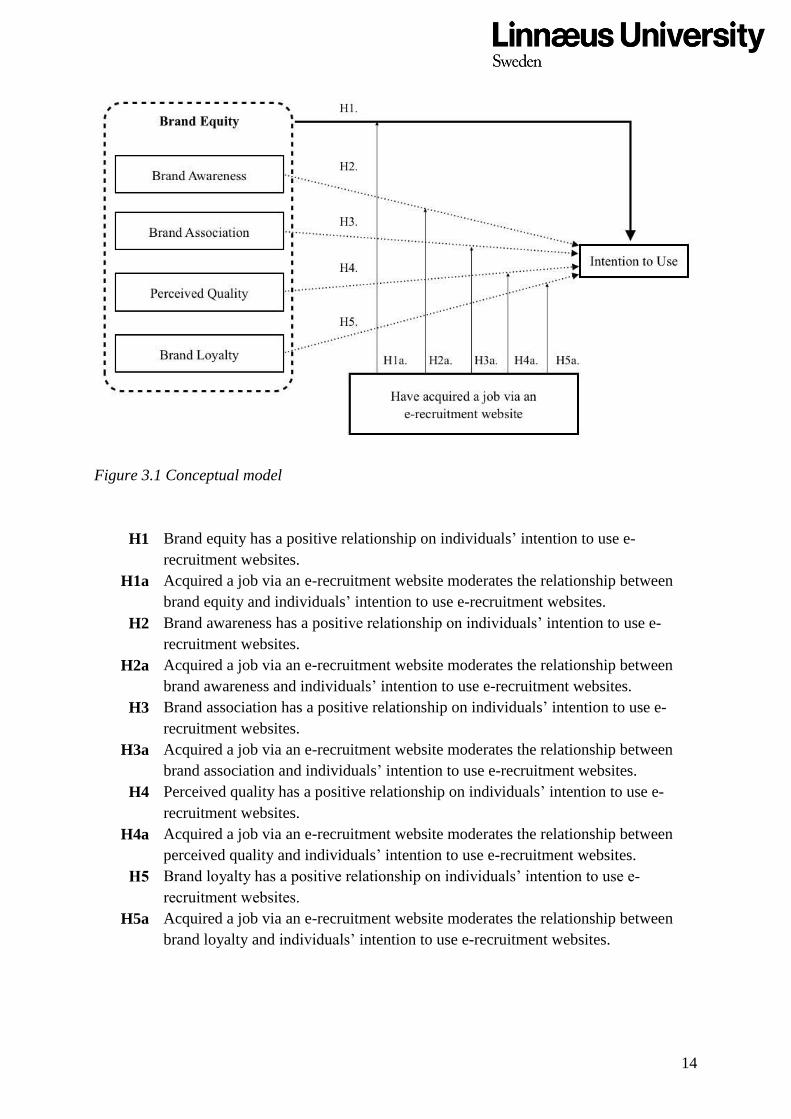
Figure 3.1 Conceptual model
H1
Brand equity has a positive relationship on individuals’ intention to use e-
recruitment websites.
H1a Acquired a job via an e-recruitment website moderates the relationship between
brand equity and individuals’ intention to use e-recruitment websites.
H2 Brand awareness has a positive relationship on individuals’ intention to use e-
recruitment websites.
H2a Acquired a job via an e-recruitment website moderates the relationship between
brand awareness and individuals’ intention to use e-recruitment websites.
H3 Brand association has a positive relationship on individuals’ intention to use e-
recruitment websites.
H3a Acquired a job via an e-recruitment website moderates the relationship between
brand association and individuals’ intention to use e-recruitment websites.
H4 Perceived quality has a positive relationship on individuals’ intention to use e-
recruitment websites.
H4a Acquired a job via an e-recruitment website moderates the relationship between
perceived quality and individuals’ intention to use e-recruitment websites.
H5 Brand loyalty has a positive relationship on individuals’ intention to use e-
recruitment websites.
H5a Acquired a job via an e-recruitment website moderates the relationship between
brand loyalty and individuals’ intention to use e-recruitment websites.

15
4. Methodology
This chapter explains how the research was conducted and presents different methodology
sections of how the researchers have followed through this research. The chapter describes
both theoretical and practical implementations of how it was performed.
4.1 Research Approach and Research Design
A descriptive design of the research was used to describe the different concepts in relation to
each other, it allowed to answer and analyze the data on how, what and why concerning a
specific situation (Aaker et al., 2010). Already established research within the field of brand
equity and its constructs together with intention to use was studied and interpreted towards the
collected data. This gave the research a deductive approach (Hyde, 2000; Creswell, 2014), to
which a quantitative approach was adopted to collect data as it helps to draw a large sample of
the population to draw general conclusions of the characteristics of the population (Hyde,
2000). As for the research design, a social survey research was appointed. A social survey
research implies that the information is gathered from multiple cases at one specific time
(Bryman & Bell, 2011). This is followed in order to make it possible to make associations and
patterns between different variables (Bryman & Bell, 2011).
4.2 Data Sources
This study chose to make use of primary data. The use of primary data gives the opportunity
to more specifically answer the purpose regarding the particular problem within the research
since it contains the accurate information of the investigated subject (Bryman & Bell, 2011;
Saunders et al., 2009). Since there is scarce research of brand equity in a e-recruitment
context towards intention to use, collecting primary data was more accurate and reliable to
answer the purpose.
4.3 Data Collection Method
This research aimed to generalize the result from a larger population and therefore an online
questionnaire was used as data collection method (Hyde, 2000). The online questionnaire was
posted on the social media Facebook during a period of seven days in order to collect the data
in different days of the week. Further, a mail with a link to the online questionnaire was sent
out to students at Linnaeus University. The first part of the online questionnaire consisted of a
short explanation of e-recruitment and examples of e-recruitment websites. In addition, the
16
first part consisted of a question regarding if the respondents had used e-recruitment websites
before. In addition, the respondents was given the possibility to write the e-recruitment
website they were most active on in order to have this e-recruitment website in mind during
the online questionnaire. The second part of the questionnaire consisted of questions
regarding the constructs brand awareness, brand association, perceived quality, brand loyalty
and intention to use. In order to measure the different items within each construct a likert
scale was used. The labels were conducted as follow; 1 Strongly disagree, 2 Disagree, 3
Somewhat disagree, 4 Neither agree or disagree, 5 Somewhat agree, 6 Agree, 7 Strongly
agree. In the end of the questionnaire a moderator question was asked regarding if the
respondents ever had got an employment via an e-recruitment website followed by four
questions about the respondents’ demographics, which were gender, age, occupation and level
of education.
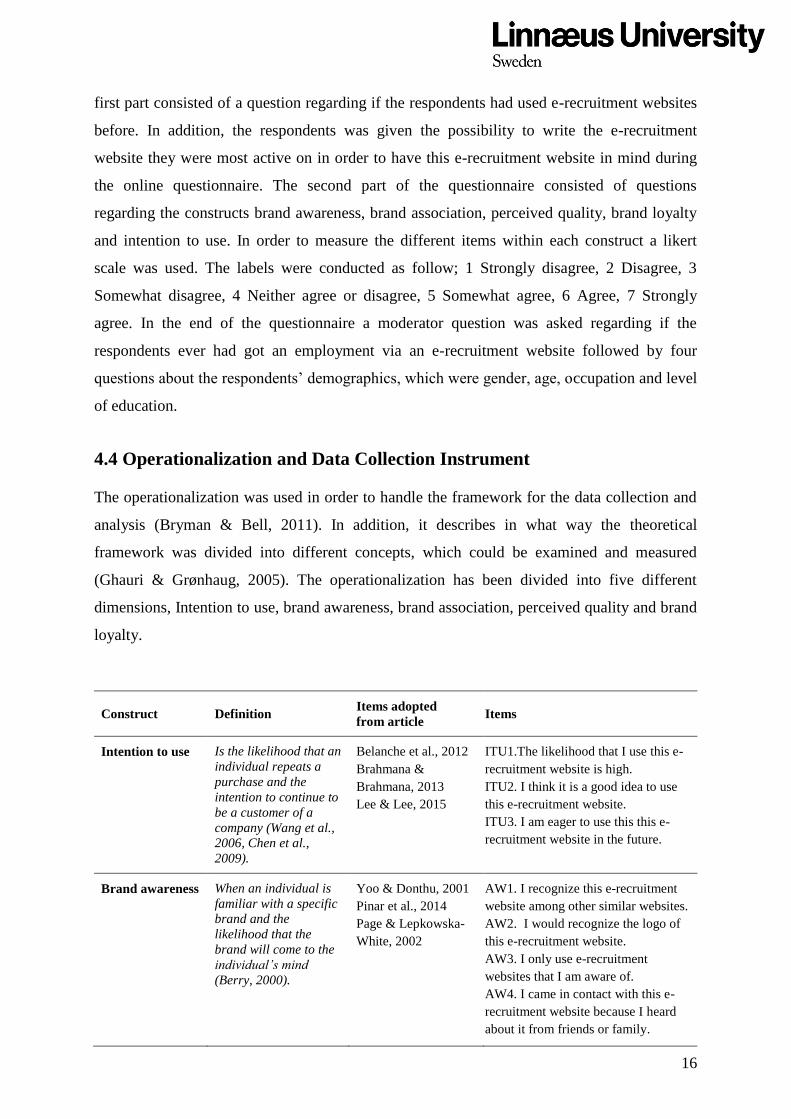
4.4 Operationalization and Data Collection Instrument
The operationalization was used in order to handle the framework for the data collection and
analysis (Bryman & Bell, 2011). In addition, it describes in what way the theoretical
framework was divided into different concepts, which could be examined and measured
(Ghauri & Grønhaug, 2005). The operationalization has been divided into five different
dimensions, Intention to use, brand awareness, brand association, perceived quality and brand
loyalty.
Construct Definition Items adopted
from article Items
Intention to use Is the likelihood that an
individual repeats a
purchase and the
intention to continue to
be a customer of a
company (Wang et al.,
2006, Chen et al.,
2009).
Belanche et al., 2012
Brahmana &
Brahmana, 2013
Lee & Lee, 2015
ITU1.The likelihood that I use this e-
recruitment website is high.
ITU2. I think it is a good idea to use
this e-recruitment website.
ITU3. I am eager to use this this e-
recruitment website in the future.
Brand awareness When an individual is
familiar with a specific
brand and the
likelihood that the
brand will come to the
individual’s mind
(Berry, 2000).
Yoo & Donthu, 2001
Pinar et al., 2014
Page & Lepkowska-
White, 2002
AW1. I recognize this e-recruitment
website among other similar websites.
AW2. I would recognize the logo of
this e-recruitment website.
AW3. I only use e-recruitment
websites that I am aware of.
AW4. I came in contact with this e-
recruitment website because I heard
about it from friends or family.
17
Brand awareness Anything linked in
memory to a brand and
a factor that
differentiates the brand
in individuals’ minds
and can give
individuals a reason for
selecting a specific
product or service
(Aaker, 1991; Balaji,
2011)
Balaji, 2011
Aaker, 1996
Rios & Riquelme,
2008
Rios & Riquelme,
2010
Nath & Bawa, 2011
Wang et al., 2004
AS1. I trust this e-recruitment website.
AS2. I trust that this e-recruitment
website keeps my personal information
safe.
AS3. It feels safe to disclose personal
information on this e-recruitment
website.
AS4. The customer service is easy to
contact on this e-recruitment website.
AS5. The customer service can be
contacted in different ways on this e-
recruitment website.
Perceived quality The superiority or
excellence of a product
based on the
consumer's judgments
(Zeithaml, 1988).
He & Li, 2011
Kao & Lin., 2016
Pinar et al., 2014
Rios & Riquelme,
2008
Yoo & Donthu, 2001
Yoo et al., 2000
PQ1. This e-recruitment website has
high quality.
PQ2. It is easy to navigate on this e-
recruitment website.
PQ3. The information is easy to
understand on this e-recruitment
website.
PQ4. This e-recruitment website has an
appealing design.
PQ5. This e-recruitment website offers
jobs that is of good quality
PQ6. This e-recruitment website has a
wide variety of job offers.
Brand loyalty When a consumer
repeat their buying
behavior toward a
specific brand
(Gommans et al.,
2001).
Keller, 2001
Yoo et al., 2000
Yoo & Donthu, 2001
BL1. I consider myself to be loyal to
this e-recruitment website.
BL2. This e-recruitment website would
be my first choice.
BL3. I will not choose other e-
recruitment websites if this e-
recruitment website is available.
Table 4.1 Operationalization
4.5 Pre-test
A pre-test was conducted in order to generate valuable information of how the study should
be designed and to make the questions in the questionnaire as relevant as possible (Ghauri &
Grønhaug, 2005). It is crucial to conduct a pre-test when conducting a self-completing
questionnaire since there is no moderator available to answer potential questions from the
participants. In addition, it helps to improve potential deficit in the research (Bryman & Bell,
2011). In order to assure that the questions were correctly formulated and to see if there was
any questions, which could be excluded or added the questionnaire was presented to two
lectures at Linnaeus University, Växjö, Sweden. In addition, a pre-test was conducted by
18
randomly selecting 10 representatives of the sample that answered the questionnaire in order
to get feedback and avoid potential misunderstandings.
4.6 Sample
The study was aimed towards individuals who had used e-recruitment websites before. A non-
probability sample technique with convenience sampling method was used since it was the
most suitable for the time frame (Bryman & Bell, 2011). However, the convenience sampling
method can be criticized due to the lack of randomness of the sampling process, which is
needed to be able to generalize the results to a whole population (Bryman & Bell, 2011).
Nevertheless, collecting the data during a longer period and different times during the week
gives more credibility since the diversity of the population increases. Therefore, the results
can be generalized to a greater extent (Malhotra & Birks, 2010; Aczel & Sounderpandian,
2009). The only criteria to submit the questionnaire was to have experience of a e-recruitment
website before, since the study is aimed towards users of these types of websites. Therefore, a
question concerning if the individual had used an e-recruitment website before opened the
questionnaire. If the respondent did not have any past experience they were not allowed to
complete the questionnaire to avoid misleading and not influencing the data with ignorance to
get as much reliable data as possible. To be able to quantify data and make generalizations
from it, the study needed an appropriate sample size (Green, 1991; Ghauri & Grønhaug, 2005;
Hair et al., 2010; Malhotra & Birks, 2010). A questionnaire should have the foundation of 50
respondents, adding eight times the number of independent variables, N > 50+8 x m, while m
being the number of independent variables (Green, 1991; Pallant, 2010). Therefore, the
questionnaire was continuously spread until it achieved a minimum of 90 completed
questionnaires, in excess of the samples, which have no past experience with e-recruitment
websites. After the data was collected, there were 128 out of 175, which could be used for
further analysis.
4.7 Data Analysis Method
This study used the statistical program SPSS to analyze the results that was collected from the
online questionnaire. This program helped the researchers to organize and calculate the data
in order to answer this study’s hypothesis. According to Bryman and Bell (2011) SPSS is a
software that is widely used among research which conducts quantitative studies. It gives the
user precise data when performing analysis (Bryman & Bell, 2011). The following parts that
are presented below were taken into consideration when performing the SPSS analysis.
19
Descriptive statistics
Firstly, before running the descriptive statistics was the data from the questionnaire coded and
categorized in numbers in order to make calculations in the SPSS. According to Gravetter and
Wallnau (2008) descriptive statistics are usually conducted in order to summarize and
describe each of the participants’ score to simplify the data gathered, which then can be
organized and presented in graphs or tables to make it easy for the researcher. By doing this
gave a clear understanding of how each participant within the sample answered the questions
and how the characteristic distribution of the population was. Therefore, to simplify the data
collected in this research the authors displayed and categorized the descriptive data into
gender, age, occupation and level of education in order to summarize the data in a simple
manner to show the reader what sample the study based it findings on. These four different
demographic aspects were also used as control variables in the regression analysis presented
below to see if these additional variables might have had an influence of the relationships
between this study’s independent variables towards the dependent variable (Bryman & Bell,
2011).
Regression analysis
To test the hypothesis of this study a multiple linear regression was included. The data was
analyzed in order to test the relationship between this study’s independent variables; brand
awareness, brand association, perceived quality and brand loyalty, towards the dependent
variable intention to use. In order for the relationships to be statistically significant it had to
display a p< 0.05 (Richardson, 2011). Moreover, by conducting a regression analysis one can
see how much one variable affects another variable by looking at the beta value. The beta
value shows if the relationship between the two variables indicates a positive or a negative
relationship and how relatively strong that relationship is (Pallant, 2010). Another factor to
consider in this type of analysis is the adjusted R2, which suggests how much of the
dependent variable can be predicted by an independent variable (Pallant, 2010).
Interaction variable
A moderator analysis of the variables brand equity, brand awareness, brand association,
perceived quality and brand loyalty was conducted to see if the relationship between the
independent variables and the dependent variable was moderated by if the use of an e-
recruitment website had lead to a job. By dividing the sample into two groups to calculate an
interaction variable, could determine an effect on intention to use e-recruitment websites if an
individual had acquired a job via an e-recruitment website. The participants who previously
20
had acquired a job via an e-recruitment website was coded 1 where respondents which had
not acquired a job via an e-recruitment sites was coded 0. A moderator being an interaction
variable, (group independent variable), tests if the relationship of a independent variable to
the dependent variable is affected by a third variable (Baron et al., 1986; Pallant, 2010). To
avoid multicollinearity in the interaction variables and accounting for the different scales of
measure (1-7 and 0-1), they were computed by using the variables standardized values.
Therefore, moderator was calculated by computing a new variable in SPSS, by calculating the
-values from the independent variables and multiplying each of them with the -value of
the moderator separately. This gave a specific interaction variable for each corresponding
relationship between an independent variable and the dependent variable. These were used for
hypothesis H1a, H2a, H3a, H4a and H5a.
Interaction variable Construct
Brand awareness -value of Brand awareness -value of acquired job
Brand association -value of Perceived quality -value of acquired job
Perceived quality -value of Perceived quality -value of acquired job
Brand loyalty -value of Brand loyalty -value of acquired job
Table 4.2 Interaction variable
4.8 Quality Criteria
4.8.1 Validity
Validity and reliability is considered as the most crucial quality criteria when conducting
measurements of a study (Hair et al., 2010; Bryman & Bell, 2011). There are according to
Bryman and Bell (2011) several types of measurements to assure validity, such as face
validity and construct validity. Face validity test if the measurement reflects the investigated
concepts, which in this study was done by the previous mentioned pre-tests. The construct
validity has the aim to assure that the operationalization measures the concepts it is aimed to
measure (Bryman & Bell, 2011). The construct validity is accomplished when the conducted
hypotheses are derived from relevant theories and has a connection to the concepts (Aaker et
al., 2011; Bryman & Bell, 2011). In order to assure the construct validity in this study the
different constructs in the operationalization was deducted from relevant theories and from
previous research. To further ensure the construct validity, the constructs were measured in a
correlation analysis. In the SPSS the correlation analysis is called Pearson’s r correlation
coefficient, which makes it possible to see the strength and direction of the relationship
21
between different constructs (Richardson, 2011). Therefore, in this study brand equity, brand
awareness, brand association, perceived quality, brand loyalty and intention to use were tested
against each other. According to Richardson (2011) the value in a Pearson’s r correlation
analysis varies between a value of -1 (perfectly negative correlation) and 1 (perfectly positive
correlation) with 0 in between that indicates that there is no correlation. A value between 0
and 0.3 is seen as a weak correlation. It should be noted that the value should not exceed the
value of 0.9 in any direction as it can indicate that the different constructs measure the same
thing (Hair et al., 2010; Nolan and Heinzen, 2008).
4.8.2 Reliability
According to Gray (2009) external reliability has the aim to make it possible for other
researchers to replicate the study. The choices in the methodology chapter were carefully and
clearly presented and described. When a measure can assure the same result with the same
measurement on different occasions it is considered to have external reliability (Bryman &
Bell, 2011; Nardi, 2003; Saunders et al., 2009). Hence, the authors of this study present all the
steps that were conducted when measuring the variables, for other studies to have the chance
to replicate. Further, this research was inspired by questions from previous research (See
operationalization) as Saunders et al. (2009) argue that both the reliability and validity is
strengthened when using questions from other researchers since the questions already has
been used and accepted by previous research.
To ensure the quality and strength of the collected data the authors of this study also
performed a reliability test. A reliability test is performed to test if the statements around one
variable investigate the same area (Bryman & Bell, 2011). To be able to test this, the authors
used a statistical tool, which is called Cronbach’s alpha to ensure the internal reliability.
According to Bryman and Bell (2011) can the alpha score vary between 1 to 0, meaning that 1
indicates a perfect internal reliability and 0 indicates no internal reliability. For the score to be
significant it has to have a score of at least 0.6 otherwise it cannot be seen as reliable
(Malhotra et al., 2012). Therefore, if a construct did not reach an alpha score of 0.6, the items
of the construct would be evaluated to be deleted to achieve a valid value.
4.8.3 Quality Data Control
Since regressions are very sensitive to extreme low or high values, preliminary analyses were
conducted before the to ensure no violation of normality, linearity, multicollinearity and
homoscedasticity (Pallant, 2010). This was observed using regression analysis with residuals
scatterplot. To further look for inconveniences regarding multicollinearity the coefficients for
22
tolerance and variance inflation factors was observed, which all the independent variables;
brand awareness, brand association, perceived quality and brand loyalty showed a tolerance
value of >0.1, respectively <10 for variance inflation factor, therefore the multicollinearity
assumption has not been violated (Pallant, 2010). However, the independent variable brand
equity which is a variable built of all the same items as the other independent variables was
not included in the same regression analysis as brand awareness, brand association, perceived
quality and brand loyalty to avoid singularity in the regression (Pallant, 2010). However,
when looking at the Mahalanobis distance, one of the respondents scored an extreme value of
32.221, which exceeds the critical value of 20.52 when using 5 independent variables
(Pallant, 2010). Therefore, respondent 7 was excluded for the analysis.
4.9 Methodology Summary
All the different methodological approaches that the authors chose to include in this study are
summarized in table 4.3.
Research Methodology
Research approach Deductive and quantitative
Research design Descriptive, social survey research
Data sources Primary
Data collection method Online questionnaire
Sample Non-probability sampling
Convenience sampling
Data analysis method Data coding
Descriptive statistics
Correlation analysis
Regression analysis
Moderator analysis
Quality criteria Validity
Reliability
Quality data control
Table 4.3 Methodology summary
23
5. Results
This chapter presents the collected data and results. It will outline the descriptive statistics,
reliability and validity analysis, correlation analysis, multiple regression analysis and the
moderated regression analysis. To conclude the chapter, a table of the hypotheses is
summarized and presented with its significance level.
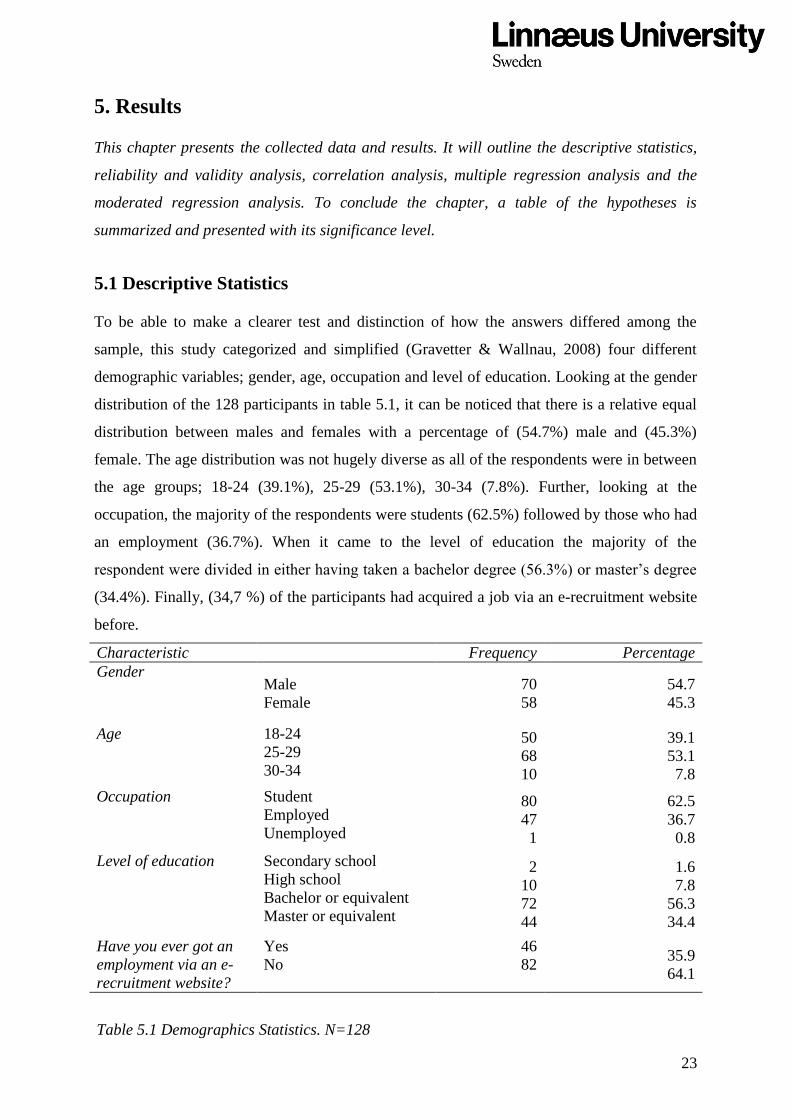
5.1 Descriptive Statistics
To be able to make a clearer test and distinction of how the answers differed among the
sample, this study categorized and simplified (Gravetter & Wallnau, 2008) four different
demographic variables; gender, age, occupation and level of education. Looking at the gender
distribution of the 128 participants in table 5.1, it can be noticed that there is a relative equal
distribution between males and females with a percentage of (54.7%) male and (45.3%)
female. The age distribution was not hugely diverse as all of the respondents were in between
the age groups; 18-24 (39.1%), 25-29 (53.1%), 30-34 (7.8%). Further, looking at the
occupation, the majority of the respondents were students (62.5%) followed by those who had
an employment (36.7%). When it came to the level of education the majority of the
respondent were divided in either having taken a bachelor degree (56.3%) or master’s degree
(34.4%). Finally, (34,7 %) of the participants had acquired a job via an e-recruitment website
before.
Characteristic Frequency Percentage
Gender Male
Female
70
58
54.7
45.3
Age 18-24
25-29
30-34
50
68
10
39.1
53.1
7.8
Occupation Student
Employed
Unemployed
80
47
1
62.5
36.7
0.8
Level of education Secondary school
High school
Bachelor or equivalent
Master or equivalent
2
10
72
44
1.6
7.8
56.3
34.4
Have you ever got an
employment via an e-
recruitment website?
Yes
No
46
82 35.9
64.1
Table 5.1 Demographics Statistics. N=128
24
5.2 Reliability and Validity
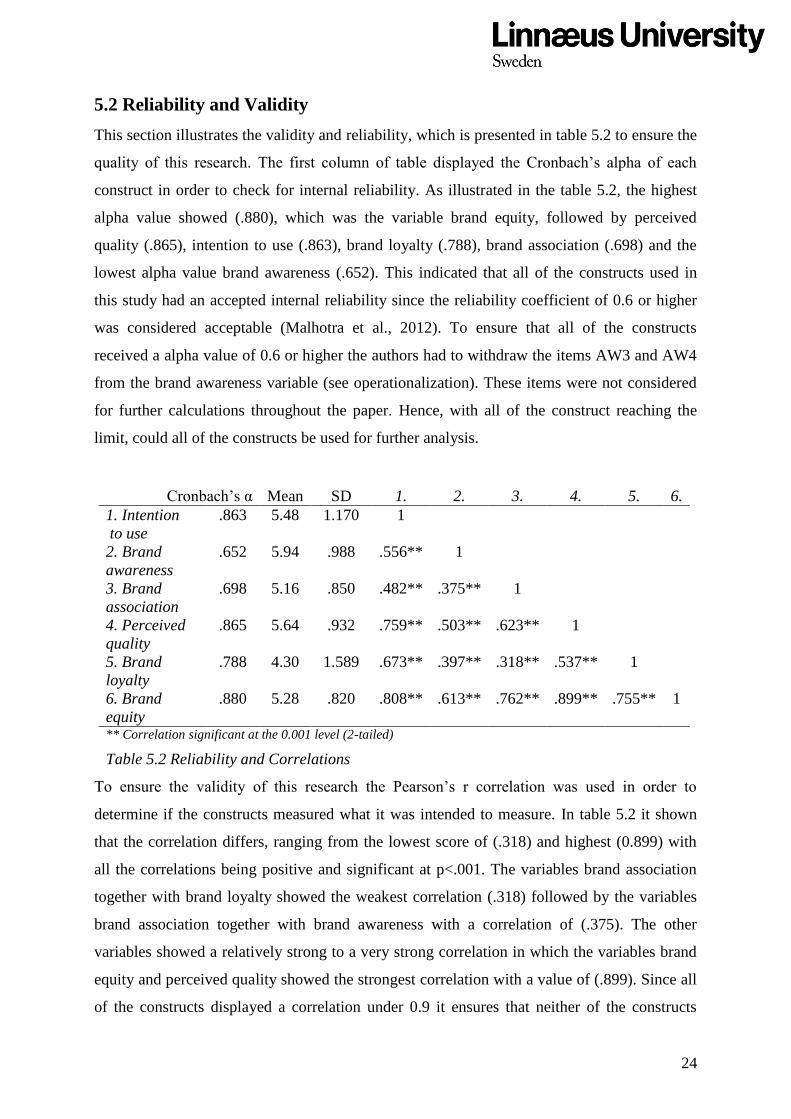
This section illustrates the validity and reliability, which is presented in table 5.2 to ensure the
quality of this research. The first column of table displayed the Cronbach’s alpha of each
construct in order to check for internal reliability. As illustrated in the table 5.2, the highest
alpha value showed (.880), which was the variable brand equity, followed by perceived
quality (.865), intention to use (.863), brand loyalty (.788), brand association (.698) and the
lowest alpha value brand awareness (.652). This indicated that all of the constructs used in
this study had an accepted internal reliability since the reliability coefficient of 0.6 or higher
was considered acceptable (Malhotra et al., 2012). To ensure that all of the constructs
received a alpha value of 0.6 or higher the authors had to withdraw the items AW3 and AW4
from the brand awareness variable (see operationalization). These items were not considered
for further calculations throughout the paper. Hence, with all of the construct reaching the
limit, could all of the constructs be used for further analysis.
To ensure the validity of this research the Pearson’s r correlation was used in order to
determine if the constructs measured what it was intended to measure. In table 5.2 it shown
that the correlation differs, ranging from the lowest score of (.318) and highest (0.899) with
all the correlations being positive and significant at p<.001. The variables brand association
together with brand loyalty showed the weakest correlation (.318) followed by the variables
brand association together with brand awareness with a correlation of (.375). The other
variables showed a relatively strong to a very strong correlation in which the variables brand
equity and perceived quality showed the strongest correlation with a value of (.899). Since all
of the constructs displayed a correlation under 0.9 it ensures that neither of the constructs
Cronbach’s α Mean SD 1. 2. 3. 4. 5. 6.
1. Intention
to use
.863 5.48 1.170 1
2. Brand
awareness
.652 5.94 .988 .556** 1
3. Brand
association
.698 5.16 .850 .482** .375** 1
4. Perceived
quality
.865 5.64 .932 .759** .503** .623** 1
5. Brand
loyalty
.788 4.30 1.589 .673** .397** .318** .537** 1
6. Brand
equity
.880 5.28 .820 .808** .613** .762** .899** .755** 1
** Correlation significant at the 0.001 level (2-tailed)
Table 5.2 Reliability and Correlations
25
measured the same area, which tells that the construct validity was intact (Hair et al., 2010;
Nolan and Heinzen, 2008).
5.3 Hypothesis Testing
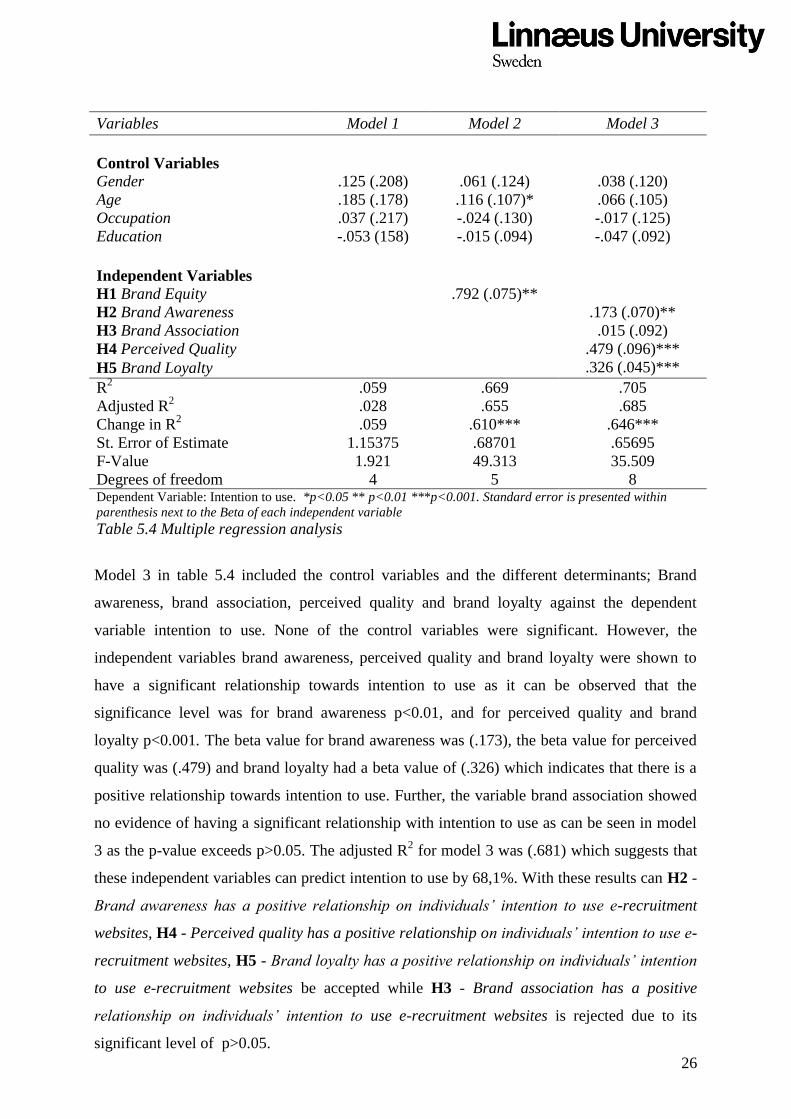
Table 5.4 illustrate the findings resulting from the multiple regression analysis, the table is
divided into three models. Firstly, the control variables; gender, age, occupation and
education were checked against the dependent variable intention to use, which are displayed
in model 1. Looking at the results in model 1, neither of the control variables displayed a
significant relationship meaning that the control variables do not have any direct relationship
to individuals’ intention to use. This suggests that the independent variables used in model 2
and 3 may be more suitable predictors of intention to use, as the adjusted R2
in model 1 only
measure (.029).
Model 2 in table 5.4 include the control variables together with the independent variable
brand equity against the dependent variable intention to use. It can be observed that the
control variable age has a significant relationship to intention to use. This indicates that if the
standard deviation in age variable increases by one would lead to an increase by (.114) for
intention to use. Looking at hypothesis one, can it be observed that it is has a p<0.001 and that
the relationship is positive due to the beta being (.791). This means that if the brand equity’s
standard deviation increases by one would lead to an increase in intention to use by (.791).
Moreover, the adjusted R2
shows a value of (.654) which suggests that brand equity can be
interpreted to predict 65.4 % of the dependent variable. Hence, hypothesis 1; Brand equity
has a positive relationship on individuals’ intention to use e-recruitment websites is accepted.
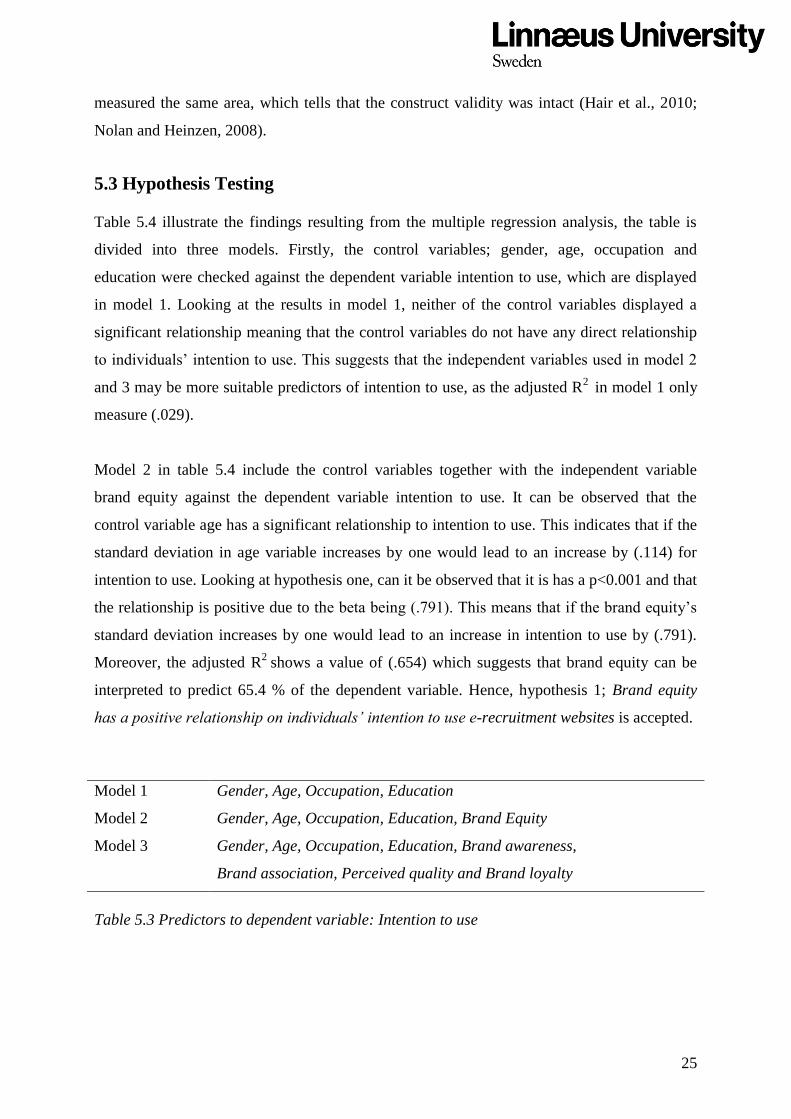
Model 1 Gender, Age, Occupation, Education
Model 2 Gender, Age, Occupation, Education, Brand Equity
Model 3 Gender, Age, Occupation, Education, Brand awareness,
Brand association, Perceived quality and Brand loyalty
Table 5.3 Predictors to dependent variable: Intention to use
26
Model 3 in table 5.4 included the control variables and the different determinants; Brand
awareness, brand association, perceived quality and brand loyalty against the dependent
variable intention to use. None of the control variables were significant. However, the
independent variables brand awareness, perceived quality and brand loyalty were shown to
have a significant relationship towards intention to use as it can be observed that the
significance level was for brand awareness p<0.01, and for perceived quality and brand
loyalty p<0.001. The beta value for brand awareness was (.173), the beta value for perceived
quality was (.479) and brand loyalty had a beta value of (.326) which indicates that there is a
positive relationship towards intention to use. Further, the variable brand association showed
no evidence of having a significant relationship with intention to use as can be seen in model
3 as the p-value exceeds p>0.05. The adjusted R2 for model 3 was (.681) which suggests that
these independent variables can predict intention to use by 68,1%. With these results can H2 -
Brand awareness has a positive relationship on individuals’ intention to use e-recruitment
websites, H4 - Perceived quality has a positive relationship on individuals’ intention to use e-
recruitment websites, H5 - Brand loyalty has a positive relationship on individuals’ intention
to use e-recruitment websites be accepted while H3 - Brand association has a positive
relationship on individuals’ intention to use e-recruitment websites is rejected due to its
significant level of p>0.05.
Variables Model 1 Model 2 Model 3
Control Variables
Gender .125 (.208) .061 (.124) .038 (.120)
Age .185 (.178) .116 (.107)* .066 (.105)
Occupation .037 (.217) -.024 (.130) -.017 (.125)
Education -.053 (158) -.015 (.094) -.047 (.092)
Independent Variables
H1 Brand Equity .792 (.075)**
H2 Brand Awareness .173 (.070)**
H3 Brand Association .015 (.092)
H4 Perceived Quality .479 (.096)***
H5 Brand Loyalty .326 (.045)***
R2 .059 .669 .705
Adjusted R2 .028 .655 .685
Change in R2 .059 .610*** .646***
St. Error of Estimate 1.15375 .68701 .65695
F-Value 1.921 49.313 35.509
Degrees of freedom 4 5 8 Dependent Variable: Intention to use. *p<0.05 ** p<0.01 ***p<0.001. Standard error is presented within
parenthesis next to the Beta of each independent variable
Table 5.4 Multiple regression analysis

27
5.4 Moderated Regression Analysis
For model 2, the variable brand equity is calculated as one variable containing all the
constructs connected to brand equity as whole. Therefore, in the moderating regression
analysis the variable brand equity is not run with the other independent variables as it already
is explained by its dimensions. Nevertheless, from model 2 to model 6, each independent
variable was exchanged with its corresponding interaction variable, one at a time for each test.
In model 7, each of the determinants of brand equity is calculated together.
Model 1 Gender, Age, Occupation, Education
Model 2 Gender, Age, Occupation, Education, Interaction: Brand equity
Model 3 Gender, Age, Occupation, Education, Brand Association, Perceived
quality, Brand loyalty, Interaction: Brand awareness
Model 4 Gender, Age, Occupation, Education, Brand awareness, Perceived quality,
Brand loyalty, Interaction: Brand association
Model 5 Gender, Age, Occupation, Education, Brand awareness, Brand association,
Brand loyalty, Interaction: Perceived quality
Model 6 Gender, Age, Occupation, Education, Brand awareness, Brand association,
Perceived quality and Interaction: Brand loyalty
Model 7 Gender, Age, Occupation, Education, Interaction: Brand awareness,
Interaction: Brand association, Interaction: Perceived quality and
Interaction: Brand loyalty
Table 5.5 Predictors to dependent variable: Intention to use.
Model 2 in table 5.6, shows the result if the independent variable brand equity is moderated if
the individual had acquired a job via an e- recruitment website. Two variables which showed
a statistical significant level was the interaction variable between brand equity and if the
individual had acquired a job via an e-recruitment website, also the control variable age. Both
possess a p <0.05. The interaction variable brand equity showed a beta equal to (-.182) with a
st. error of (.106). The control variable age showed a beta equal to (.203) with a st. error of
(.177). This generated an adjusted R2
of (.054) which suggests that it only predicts 5,4% of
intention to use. Since the moderating effect was statistically significant, the moderator is
accepted. Thus, H1a - Acquired a job via an e-recruitment website moderates the relationship
between brand equity and individuals’ intention to use e-recruitment websites, is accepted.

28
Variables Model 1 Model 2 Model 3 Model 4 Model 5 Model 6 Model 7
Control Variables
Gender .125 (.208) .130 (.205) .033 (.123) .049 (.120) .043 (.137) .071 (.133) .039 (.123)
Age .185 (.178) .203 (.177)* .085 (.108) .069 (.102) .137 (.118) .082 (.116) .084 (.106)
Occupation .037 (.217) .055 (.215) .003 (.127) -.014 (.124) -.039 (.142) .005 (.141) -.017 (.126)
Education -.053 (158) -.036 (.157) -.031 (.094) -.043 (.090) .010 (.104) -.073 (.102) -.037 (.092)
Independent variables
Brand awareness .165 (.069)** .258 (.077)*** .226 (.077)** .149 (.074)*
Brand association .027 (.093) .234 (.088)*** .001 (.102) .000 (.093)
Perceived quality .519 (.095)*** .478 (.080)*** .630 (.099)*** .484 (.097)***
Brand loyalty .371 (.046)*** .331 (.045)*** .472 (.047)*** .334 (.046)***
Interaction Variable
Moderator H1a
Brand equity
-.182(.106)*
Moderator H2a
Brand awareness
-.105 (.073)
-.030 (.088)
Moderator H3a
Brand association
-.073 (.061)
-.013 (.075)
Moderator H4a
Perceived quality
-.101 (.069)
-.116 (.085)
Moderator H5a
Brand loyalty
-.037 (.068) .046 (076)
R2 .059 .091 .694 .710 .617 .636 .718
Adjusted R2 .028 .054 .673 .690 .597 .611 .689
Change in R2
.059 .032* .635*** .651*** .558*** .577*** .013
St. Error of Estimate 1.15375 1.13849 .66910 .65160 .74813 .72979 .65286
F-Value 1.921 2.442 33.696 36.340 23.976 25.953 24.428
Degrees of freedom 4 5 8 8 8 8 12 Dependent Variable: Intention to use. Moderator: Acquired a job via an e-recruitment website. *p<0.05 ** p<0.01 ***p<0.001. Standard error is presented within parenthesis next
to the Beta of each independent variable.
Table 5.6 Moderated regression analysis
29
Model 3 in table 5.6, shows the result if the independent variable brand awareness is
moderated if the individual had acquired a job via an e-recruitment website. Two variables,
which showed a statistical significant level was the independent variables perceived quality
and brand loyalty. Both perceived quality and brand loyalty showed a significance level of
p<0.001. Perceived quality had a beta of (.519) and a st. error of (.095) and brand loyalty
showed a beta of (.371) and a st. error of (.046). The interaction variable of brand awareness
and if the individual had acquired a job via an e-recruitment website showed a beta equal to (-
.105) with a st. error of (.073). Model 3 generated an adjusted R2
of (.673) which suggests
that 67.3 % of the relationships can be explained. However, the moderating effect was not
statistically significant. Thereby, H2a - Acquired a job via an e-recruitment website
moderates the relationship between brand awareness and individuals’ intention to use e-
recruitment websites, is rejected.
Model 4 in table 5.6, shows the result if the independent variable brand association is
moderated if the individual had acquired a job via an e-recruitment website. Three variables
showed a statistical significant level, which was the independent variables brand awareness,
perceived quality and brand loyalty. All of them showed a strong significant level of p<0.001.
Brand awareness had a beta of (.165) and a st. error of (.069). Perceived quality had a beta of
(.478) and a st. error of (.080). Finally, brand loyalty possessed a beta of (.331) and a st. error
of (.045). The interaction variable brand association showed a beta equal to (-.073) with a st.
error of (.061). Model 4 generated an adjusted R2
of (.690). However, the moderating effect
was not statistically significant. Thereby, H3a - Acquired a job via an e-recruitment website
moderates the relationship between brand association and individuals’ intention to use e-
recruitment websites, is rejected.
Model 5 in table 5.6, shows the result if the independent variable perceived quality is
moderated if the individual had acquired a job via an e-recruitment website. Three variables
showed a statistical significant level, which were the independent variables brand awareness,
brand association and brand loyalty. It shows that all the three independent variables had a
very strong significant level of p<0.001. Brand awareness had a beta of (.258) and a st. error
of (.077). Brand association had a beta of (.234) and a st. error of (.088). Brand loyalty had a
beta of (.472) and a st. error of (.047). The interaction variable of perceived quality and if the
individual had acquired a job via an e-recruitment website showed a beta equal to (-.101) with
a st. error of (.069). Model 5 generated an adjusted R2 of (.597). However, the moderating
30
effect was not statistically significant. Thereby, H4a - Acquired a job via an e-recruitment
website moderates the relationship between perceived quality and individuals’ intention to
use e-recruitment websites, is rejected.
Model 6 in table 5.6, shows the result if the independent variable brand loyalty is moderated if
the individual had acquired a job via an e-recruitment website. Two variables showed a
statistical significant level, brand awareness p<0.01 and perceived quality p<0.001. Brand
awareness showed a beta of (.226) and a st. error of (.077). Perceived quality had a beta of
(.630) and a st. error of (.099). The moderating variable of brand loyalty and if the individual
had acquired a job via an e-recruitment website showed a beta equal to (-.037) with a st. error
of (.068). Model 6 generated an adjusted R2
of (.611). However, since the moderating effect
was not statistically significant, the hypothesis is rejected. Thereby, H5a - Acquired a job via
an e-recruitment website moderates the relationship between brand loyalty and individuals’
intention to use e-recruitment websites, is rejected.
Model 7 in table 5.6, shows the result if the independent variables brand awareness, brand
association, perceived quality and brand loyalty are moderated if the individual had acquired a
job via an e-recruitment website. However, as illustrated in model 7 it can be noticed that the
results of the different moderators together did not show any significance.
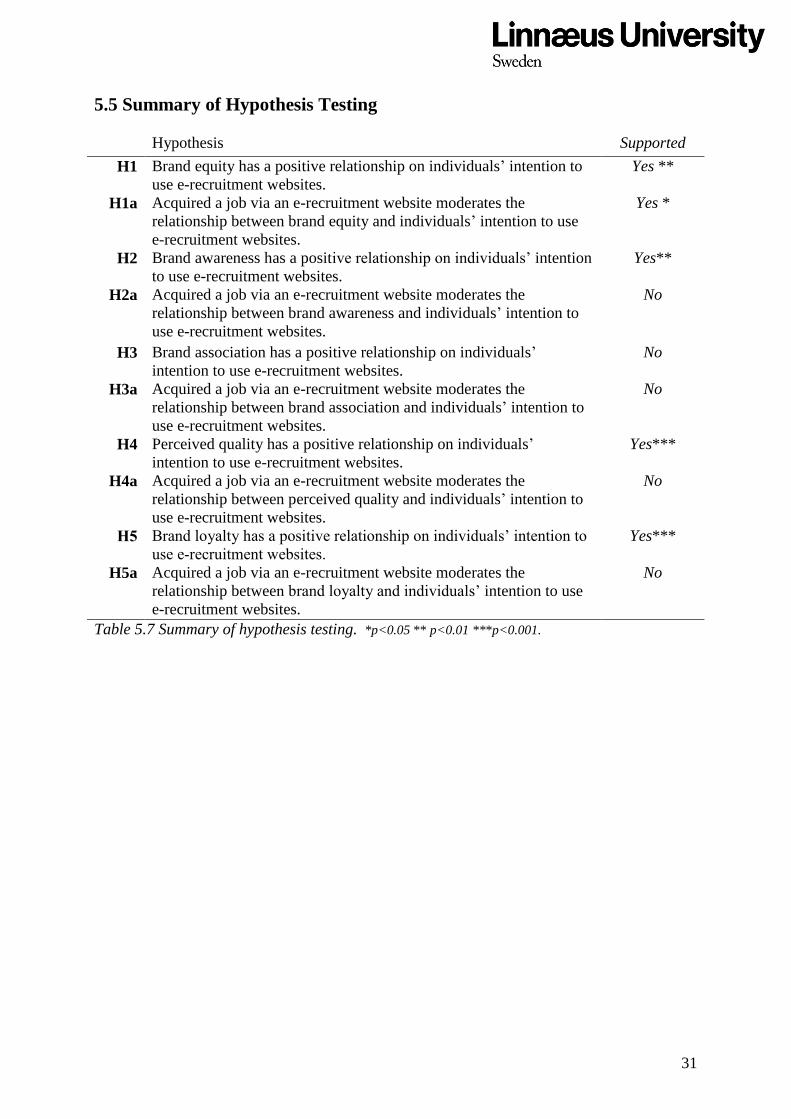
31
5.5 Summary of Hypothesis Testing
Hypothesis Supported
H1
Brand equity has a positive relationship on individuals’ intention to
use e-recruitment websites.
Yes **
H1a Acquired a job via an e-recruitment website moderates the
relationship between brand equity and individuals’ intention to use
e-recruitment websites.
Yes *
H2 Brand awareness has a positive relationship on individuals’ intention
to use e-recruitment websites.
Yes**
H2a Acquired a job via an e-recruitment website moderates the
relationship between brand awareness and individuals’ intention to
use e-recruitment websites.
No
H3 Brand association has a positive relationship on individuals’
intention to use e-recruitment websites.
No
H3a Acquired a job via an e-recruitment website moderates the
relationship between brand association and individuals’ intention to
use e-recruitment websites.
No
H4 Perceived quality has a positive relationship on individuals’
intention to use e-recruitment websites.
Yes***
H4a Acquired a job via an e-recruitment website moderates the
relationship between perceived quality and individuals’ intention to
use e-recruitment websites.
No
H5 Brand loyalty has a positive relationship on individuals’ intention to
use e-recruitment websites.
Yes***
H5a Acquired a job via an e-recruitment website moderates the
relationship between brand loyalty and individuals’ intention to use
e-recruitment websites.
No
Table 5.7 Summary of hypothesis testing. *p<0.05 ** p<0.01 ***p<0.001.
32
6. Discussion
This chapter presents a discussion regarding the results from the online questionnaire in
relation to the hypothesis. The discussion is connected to the research questions of the study
as well as the theory in the theoretical framework.
6.1 Brand Equity
Brand equity being what conceptualizes the added value to the brand (Keller, 2003) is
applicable to the results of this study of how brand equity affects the intention to use a e-
recruitment website. The results in table 5.4, model 2, confirmed the relationship of brand
equity as a whole would increase the intention to use for customers. This is in line with Berry
(2000), Buil et al. (2013), Cobb-Walgren et al. (1995) and Yoo and Donthu (2001), which
means brand equity leads to intention to purchase. This is in accordance with the findings
from Keller (2003) and Aaker (1991) who means that brand awareness, brand association,
perceived quality and brand loyalty affects one’s perception of a brand. Rios and Riquelme
(2008) and Park et al. (2007) also argue of how online brands should focus on security,
navigation and accessibility to build strong brand equity to achieve more traffic on the
website, which was included in the variables items. Thus, having high brand equity for e-
recruitment websites increases the intention to use, which according to Ambler (1994) and
Shugan (2005) could generate more profit in future periods. The high positive beta value of
(.792) describes that the relation between brand equity and intention to use is positive,
meaning brand equity has a positive effect on intention to use. This could be connected to if
the consumer’s emotions are positive towards the e-recruitment website based on the
dimensions of brand equity, would lead to a continuous usage (Zeithaml et al., 1996; Kuo et
al., 2012; Wang et al., 2006).
6.2 The Determinants of Brand Equity
6.2.1 Brand Awareness
Prior to this research there has been acknowledged that brand awareness has a positive
relationship towards intention to use in an online context (Hutter et al., 2013). The result of
this study is in accordance with the latter, and that brand awareness has a relationship with
individuals’ intention to use e-recruitment websites as the result indicated a significance level
of p<0.01. The beta value of brand awareness also indicates that each time the standard
deviation of brand awareness increases by one will lead to an increase in intention to use by
33
(.173) which indicates a positive relationship. However, among the determinants that were
significant was brand awareness relationship with intention to use is seen to have the weakest
influence. This result may indicate that brand awareness is seen as the crucial first step when
selecting to purchase or use a certain brand (Konecnik & Gartner, 2007; Page & Lepkowska-
White, 2002) and that other factors are more important when having the intention to use an e-
recruitment website.
The most important factor according to the result in this study within brand awareness was
brand recognition. This is when individuals can correctly separate the brand among other
similar brands when having seen or heard of the brand earlier (Keller, 1993). This result
indicates that individuals are more eager to use e-recruitment websites if having seen or heard
of the brand before which is in line with Konecnik and Gartner (2007) and Page and
Lepkowska-White (2002) who argue that this can have a crucial impact when considering to
use a product or service.
6.2.2 Brand Association
The result of the relationship between brand association and intention to use in this study
indicates that there is no significant relationship as the regression analysis displayed a
significance level of p>0.05. This is not in line with the findings from O’Gass and Grace
(2004) who concluded that brand association has a positive effect on individuals’ intention to
use when measured towards the banking service sector. The different results are interesting
since this study does not differ significantly from the latter as an e-recruitment business also
is within the service sector (Lee, 2011).
The items used to measure the construct brand association were connected to factors such as
security/privacy and responsiveness, which according to previous research are items that can
be used to measure brand association (Chaffey, 2000; Christodoulides et al., 2006; Kim et al.,
2002; Lennon & Harris, 2002; Page & Lepkowska-White, 2002; Rios & Riquelme, 2008).
According to Park et al. (2007) can these factors within an online context increase an
individual’s willingness to use a website. However, this seems not to be the circumstance
within an e-recruitment context as the items used did not contribute to an significant
relationship between brand association and intention to use.
34
6.2.3 Perceived Quality
The result of perceived quality and its relationship to individuals’ intention to use showed to
be significant at a level of p<0.001. This result is in line with Tsiotsou (2006) who concludes
in their findings that perceived quality has a positive effect on the intention to use. The
measurements predicts that if the standard deviation of perceived quality increases by one will
lead to an increase in intention to use by (.479). Further, this indicates that perceived quality
compared to the other determinants of brand equity has the strongest relationship towards
individuals’ intention to use. This is in accordance with Aaker (1996) who argues that
perceived quality is seen as a key dimension within brand equity, which also is supported by
Pinar et al. (2014) who finds that in the context of universities, perceived quality is the most
important factor. Looking at the means of the items concerning perceived quality (Appendix
1), it can be noted that all of the factors within perceived quality is important for e-
recruitment websites to consider as all of them received a relatively high mean.
However, the most important factors of perceived quality of an e-recruitment website were
that they should have a wide variety of job offers and that the information should be easy to
understand. This is in line with Kim et al. (2002) and Gommans et al. (2001) that describe that
the website is one of the most important aspects to consider for online companies. In order for
users to visit the website it is important that the website offers information that is easy for the
user to interpret (Kim et al., 2002). This is a key in order to attract customers to use the
website (Yang & Fang, 2004).
6.2.4 Brand Loyalty
The result of brand loyalty and individuals’ intention to use showed to have a significant
relationship as the significance level was p<0.001. This is in accordance with Shukla (2009)
who suggests based on their findings that there exists a positive relationship between brand
loyalty and individuals’ intention to purchase. The findings in this study also suggests that
there is a positive relationship as the beta value indicates that if brand loyalty increase by one
in standard deviation will lead to an increase in intention to use by (.326). This result indicates
that brand loyalty has the second highest impact among the determinants of brand equity on
individuals’ intention to use e-recruitment websites. The indication of the relationship being
positive can be argued that the e-recruitment websites that the participants used had a high
quality website which excluded a desire to switch to another brand or webpage (Gommans et
al., 2001). Meaning that the design and information was clear and that the websites had fast

35
loading pages which according to Gommans et al. (2001) are important factors for having
loyal customers.
6.3 Moderating Effect
However, when brand equity was tested with the moderator, it changed the relation
remarkably from a positive beta (.792) in table 5.3 to a negative effect of (-.182) in table 5.6,
model 2. Meaning that individuals who had acquired a job via an e-recruitment website would
have less intention to use compared to individuals who had not. One would suggest according
to theory, if the online service is capable of delivering a fulfillment of its service, which for an
e-recruitment website would be a job, the intention to further use the website would increase
(Chen et al., 2009; Cho, 2015). On the other hand, this may be the result of a saturated need
for job, as individuals would use e-recruitment websites to find jobs. Therefore, brand equity
generates a positive relation to intention to use, but if an individual's previous usage had lead
to a job, the need for job is satisfied. Hence, the relationship becomes negative when tested
with its moderator. However, this relationship is only explained by 5.4%, which means that
there are other factors that are better predictors.
When the determinants of brand equity were measured with the moderator none of variables
was significant. This suggests that the relationship between the independent variables; brand
awareness, brand association, perceived quality and brand loyalty and the dependent variable
intention to use had no effect when interacted with the third variable regarding if an
individual had acquired a job via an e-recruitment website before.
36
7. Conclusion
In this chapter the conclusion of the study is presented, where the purpose of the study is
answered.
This study aimed to describe brand equity and the determinants of brand equity on how it
affects individuals’ intention to use e-recruitment websites. The findings of this research
suggests that brand equity as a whole increases individuals’ intention to use an e-recruitment
website. When the determinant of brand equity are measured separately it can be observed
that brand awareness, perceived quality and brand loyalty are the three determinants, which
gave a positive and significant relationship towards individuals’ intention to use. Further,
according to the findings from this research it is suggested that perceived quality has the
highest impact on individuals’ intention to use an e-recruitment website followed by brand
loyalty and lastly brand awareness. Brand association is the only determinant of brand equity
that does not affects individuals’ intention to use e-recruitment websites. The results of a
positive relationship of brand equity towards intention to use is exchanged to a negative
relationship if the individual had acquired a job via an e-recruitment website before.
Although, when the determinants of brand equity was tested separately with the moderator it
had no effect.
37
8. Research Implications
This chapter presents implications, both theoretical and managerial, which were developed
from the findings in this study. Furthermore, the limitations of this study as well suggestions
for future research are presented.
8.1 Theoretical Implications
The topic brand equity has been widely explored in the branding literature (Farquhar, 1989;
Aaker, 1991; Park & Srinivasan, 1994; Keller, 1993). Although it has not been deeply
explored in a Swedish context of e-recruitment and how it affects individuals’ intention to
use. This research therefore tried to enlighten this relationship in order to contribute to the
branding literature.
This research aimed to describe brand equity and its determinants relationship to individuals’
intention to use e-recruitment websites. The result of this study suggests that the determinant
brand association should be used carefully since it did not have a significant value. However,
the findings should not falsify the theory, as the relation still may exist and instead the result
suggest that the aspect of brand association in the context of e-recruitment websites and
individuals’ intention to use should further be looked upon. However, this study contributes
by arguing that brand awareness, perceived quality and brand loyalty has a positive relation
towards intention to use which conforms with previous studies in similar areas (Hutter et al.,
2013; Netemeyer et al., 2004; Shukla, 2009). Therefore, in similar online contexts where self-
service systems are used, brand equity could be predictors of intention to use.
8.2 Managerial Implications
The result from this study has generated information about individuals’ intention to use e-
recruitment websites that can be valuable information for e-recruitment managers to obtain
into their marketing strategy. As the e-recruitment industry is one of the most widely
practiced e-business areas (Lee, 2011) this research can be of importance in order for e-
recruitment managers to know where to allocate resources in order for them to attract and
retain job seekers. Moreover, the findings of this research suggest that companies within the
e-recruitment industry should focus on building brand awareness, perceived quality and brand
loyalty in order to differentiate themselves from competitors in the market. Nevertheless, the
findings also showed that the main focus should be on the perceived quality as it had the
38
strongest relation towards intention to use. Regarding the aspect if the individual had acquired
a job gave diverse impact, it showed within brand equity’s relation to intention to use that
those who had acquired a job via an e-recruitment website were less likely to use an e-
recruitment website in the future. Given this information, e-recruitment managers should also
think of strategies that could make job seekers that already acquired a job via their e-
recruitment website to stay updated and make them follow the website in order to receive a
higher traffic on the e-recruitment website.
8.3 Limitations and Future Research
This research screened the data and made thoughtful measures to ensure a valid data to
provide for a relevant analysis on the hypothesis. However, since the data was collected on a
convenience sampling method there still might be some limitations to the research.
Firstly, collecting the data on random sampling method would perhaps create more diversity
in the data, which would be more generalizable. This study was made only on a Swedish
sample, which of 62.8% were students and 53.5% were in the age group of 25-29. The data
therefore could have been interesting if it would contain more of different age groups and
nationalities. Also, examine the data over borders could also give a different result as cultures
may have differed, as the research on brand equity by Aaker (1991) and Keller (2003), was
conducted on a different sample. Secondly, when asking if the respondents had a specific e-
recruitment website in mind when answering the questions made sure they were relating to a
specific e-recruitment website. However, it would also be interesting to see if groups who
searched for jobs in different sectors would perceive the e-recruitment websites differently,
and therefore showing different intentions to use depending on what type of job they are
looking for. This could give some insight for online companies of what sectors to explore
more on. Furthermore, research of brand equity on e-recruitment websites has been scarce and
the adopted measures to this context could have been more suitable for the context. Regarding
the aspect of intention to use and if the individual have acquired a job from an e-recruitment
website before gave a negative result. Meaning in a e-recruitment context, keeping satisfied
customers is a challenge, which could be further studied.

39
List of References
Aaker, D. A. 1991, Managing Brand Equity: Capitalizing the value of a brand name. New
York: THE FREE PRESS.
Aaker, D. A. 1996, “Measuring Brand Equity Across Products and Markets”, California
Management Review, Vol. 38, No. 3, pp. 102-120
Aaker, D.A., Kumar, V., George, D.S. and Robert, L.P. 2010, Marketing Research. (10th
edn). Asia: John Wiley and Sons.
Aczel, A. & Sounderpandian, J. 2009, Complete business statistics, McGraw-Hill, Boston,
Mass.
Agarwal, M.K. & Rao, R.V. 1996, “An Empirical Comparison of Consumer-Based Measures
of Brand Equity”, Marketing Letters, Vol. 7, No. 3, pp. 237-247
Ajzen, I. 1991, “The Theory of Planned Behavior”, Organizational Behavior and Human
Decision Processes, Vol. 50, Issue 2, pp. 179-211
Ajzen, I. and Fishbein, M. 1980, Understanding attitudes and predicting social behavior.
Englewood Cliffs, N.J.: Prentice-Hall.
Allen, D, Mahto, R, & Otondo, R. 2007, “Web-based recruitment: Effects of information,
organizational brand, and attitudes toward a Web site on applicant attraction”, Journal Of
Applied Psychology, Vol. 92, No. 6, pp. 1696-1708
Alwi, S, & Ismail, S. 2013, “A framework to attain brand promise in an online setting”,
Marketing Intelligence & Planning, Vol. 31, No. 5, pp. 557-578
Ambler, T. 1994, “Marketing's Third Paradigm: Guanxi”, Business Strategy Review, Vol. 5,
No. 4, p. 69
Atilgan, E, Aksoy, Ş, & Akinci, S. 2005, “Determinants of the brand equity: A verification
approach in the beverage industry in Turkey”, Marketing Intelligence & Planning, Vol. 23,
No. 3, pp. 237-248
Balaji, M. S. 2011, “Building Strong Service Brands: The Hierarchical Relationship Between
Brand Equity Dimensions”, IUP Journal Of Brand Management, Vol. 8, No, 3, pp. 7-24
Baron, R. M., & Kenny, D. A. 1986, “The moderator-mediator variable distinction in social
psychological research: Conceptual, strategic, and statistical considerations”, Journal of
Personality and Social Psychology, Vol. 51, No. 6, pp. 1173-1182
40
Belanche, D, Casaló, L, & Guinalíu, M. 2012, “Website usability, consumer satisfaction and
the intention to use a website: The moderating effect of perceived risk”, Journal Of Retailing
And Consumer Services, Vol. 19, Issue 1, pp. 124-132
Berry, L. 2000, “Cultivating service brand equity”, Journal of the Academy of marketing
Science, Vol. 28, No. 1 pp. 128-137
Bhatti, N, Bouch, A, & Kuchinsky, A. 2000, “Integrating user-perceived quality into Web
server design”, Computer Networks, Vol. 33, No. 1-6, pp. 1-16
Biedenbach, G. Bengtsson, M. & Marell, A. 2015, “Brand equity, satisfaction, and switching
costs: An examination of effects in the business-to-business setting”, Marketing Intelligence
& Planning, Vol. 33, No. 2, pp. 164-178
Brahmana, R, & Brahmana, R. 2013, “What factors drive job seekers attitude in using e-
recruitment?”, South East Asian Journal Of Management, Vol. 7, No. 2, pp. 123-134
Bryman, A. & Bell, E. 2011, Business Research Methods. 3rd ed. United States: Oxford
University Press Inc., New York.
Buil, I, Martínez, E, & de Chernatony, L. 2013, “The influence of brand equity on consumer
responses”, Journal Of Consumer Marketing, Vol. 30, No. 1, pp. 62-74
Chaffey, D. 2000, “Achieving Internet Marketing Success”, Marketing Review, Vol. 1, No.1,
pp. 35-59
Chen, S. 2001, “Assessing the impact of the Internet on brands”, Journal Of Brand
Management, Vol 8, Issue 4/5, pp. 288
Chen, Y, Shang, R, & Kao, C. 2009, “The effects of information overload on consumers”
subjective state towards buying decision in the internet shopping environment”, Electronic
Commerce Research And Applications, Vol. 8, pp. 48-58
Cho, Y. K. 2015, “Creating customer repurchase intention in Internet retailing: The effects of
multiple service events and product type”, Journal Of Retailing And Consumer Services, Vol.
22, pp. 213-222
Christodoulides, G, Cadogan, J, & Veloutsou, C. 2015, “Consumer-based brand equity
measurement: lessons learned from an international study”, International Marketing Review,
Vol. 32, No. 3/4, pp. 307-328
Christodoulides, G. & de Chernatony, L. 2010, “Consumer-based brand equity
conceptualisation and measurement”, International Journal Of Market Research, Vol. 52, No.
1, pp. 43-66

41
Christodoulides, G, de Chernatony, L, Furrer, O, Shiu, E, & Abimbola, T, 2006,
“Conceptualising and Measuring the Equity of Online Brands”, Journal Of Marketing
Management, Vol. 22, Issue 7/8, pp. 799-825
Cobb-Walgren, C .J. Ruble, C .A. & Donthu, N. 1995, “Brand equity, brand preferences, and
purchase intent”, Journal of Advertising, Vol. 24 No. 3, pp. 25-40
Creswell, J. W. 2014, Research design: qualitative, quantitative, and mixed methods
approaches. Fourth edition, international student edition. Los Angeles, Calif.: SAGE
Delgado-Ballester, E., Munuera-Aleman, J. L. & Yagoe-Guillin, M. J. 2003, “Development
and Validation of a Brand Trust Scale”, International Journal of Market Research, Vol. 45,
No, 1, pp. 35-53
Dineen, B, Ling, J, Ash, S, & DelVecchio, D. 2007, “Aesthetic properties and message
customization: Navigating the dark side of web recruitment”', Journal Of Applied Psychology,
Vol. 92, No. 2, pp. 356-372
Farquhar, P. H. 1989, “Managing Brand Equity”, Marketing Research, Vol. 1, No. 3, pp. 24-
33
Galanaki, E. 2002, “The decision to recruit online: a descriptive study”, Career Development
International, Vol. 7 No. 4, pp. 243-251
Ghauri, P. N. & Grønhaug, K. 2005, Research methods in business studies: A practical guide.
Harlow: Financial Times Prentice Hall.
Gommans, M. Krishman, K, & Scheffold, K. 2001, “From Brand Loyalty to E-Loyalty: A
Conceptual Framework”, Journal Of Economic & Social Research, Vol. 3, No. 1, pp. 43
Gravetter, F. J. & Wallnau L. B. 2008, Statistics for behavioural sciences, Cengage Learning,
Wadsworth, Belmont.
Gray, D. E. 2009, Doing Research in the Real World, 2nd ed., Sage Publications: London
Green, S. B. 1991, “How many subjects does it take to do a regression analysis?”,
Multivariate Behavioral Research, Vol. 26, No. 3, pp. 499‐510
Hair, J., Black, W., Babin, B. and Anderson, R. 2010, Multivariate Data Analysis, Upper
Saddle River: Pearson Education.
He, H, & Li, Y. 2011, “Key service drivers for high-tech service brand equity: The mediating
role of overall service quality and perceived value”, Journal Of Marketing Management, Vol.
27, No. 1/2, pp. 77-99
42
Hong-Youl, H. 2004, “Factors influencing consumer perceptions of brand trust online”,
Journal of Product & Brand Management, Vol. 13 Issue 5, pp. 329-342
Hutter, K, Hautz, J, Dennhardt, S, & Fuller, J. 2013, “The impact of user interactions in social
media on brand awareness and purchase intention: the case of MINI on Facebook”, Journal
Of Product & Brand Management, Vol. 22, No. 5, pp. 342-351
Hyde, F. K. 2000, “Recognising deductive processes in qualitative research”, Qualitative
Market Research: An International Journal, Vol. 3, Issue 2, pp. 82-90
Japhet, E, L. & Usman, A, T. 2010, “Barriers to ecommerce in developing countries”,
Information, Society and Justice, Vol. 3, No. 1, pp. 23-35
Jiang, L., Jun, M., & Yang, Z. 2015, “Customer-perceived value and loyalty: how do key
service quality dimensions matter in the context of B2C e-commerce?”, Service Business,
Vol. 25, No. 4, pp. 1-17
Kao, T, & Lin, W. 2016, “The relationship between perceived e-service quality and brand
equity: A simultaneous equations system approach”, Computers In Human Behavior, Vol. 57,
pp. 208-218
Keller, K. L. 1993, “Conceptualizing, measuring, and managing customer-based brand
equity”, The Journal of Marketing, Vol. 57, No. 1, pp. 1-22
Keller, K. L. 2001, “Building customer-based brand equity: A blueprint for creating strong
brands.”, Report number. 01-107, pp. 3-38.
Keller, K. L. 2003, Strategic Brand Management: Building, Measuring, and Managing Brand
Equity, 2nd ed., Upper Saddle River, NJ; Prentice Hall
Keller, K. L. 2013, Strategic Brand Management: Building, Measuring, and Managing Brand
Equity, 4th ed., Pearson, Boston, MA.
Keller, K. L. & Lehmann, D. 2006, “Brands and Branding: Research Findings and Future
Priorities”, Marketing Science, Vol. 25, Issue 6, pp. 740-759
Kim, J. Sharma, S. & Setzekorn, K. 2002, “A Framework for Building Brand Equity Online
for Pure-Play B2C Retailers and Services”, JMM: The International Journal On Media
Management, Vol. 4, No. 2, pp. 123-131
Kim, J. H. & Hyun, Y. J. 2011, “A model to investigate the influence of marketing-mix
efforts and corporate image on brand equity in the IT software sector”. Industrial Marketing
Management, Vol. 40, No. 3, pp. 424-438
43
Kimpakorn, N. & Tocquer, G. 2010, ”Service brand equity and employee brand
commitment”, Journal of Services Marketing, Vol. 24, Issue 5, pp. 378-388
Konecnik, M., & Gartner, W. C. 2007, ”Customer-based brand equity for a destination”,
Annals of Tourism Research, Vol. 34, Issue 2, pp. 400-421
Kuo, N, Chang, K, Chen, M, & Hsu, C. 2012, ”Investigating the Effect of Service Quality on
Customer Post-Purchasing Behaviors in the Hotel Sector: The Moderating Role of Service
Convenience”, Journal Of Quality Assurance In Hospitality & Tourism, Vol. 13, No. 3, pp.
212-234
Kucuk, U, S. & Krishnamurthy, S. 2007, “An analysis of consumer power on the Internet”,
Technovation, Vol. 27, No. 1, pp. 47-56
Lee, I. 2007, “An architecture for a next-generation holistic e-recruiting system”,
Communications Of The ACM, No. 50, Vol. 7, pp. 81-85
Lee, I. 2011, “Modeling the benefit of e-recruiting process integration”, Decision Support
Systems, Vol. 51, No.1, pp. 230-239
Lee, J. & Lee, J. 2015, ”How purchase intention consummates purchase behaviour: the
stochastic nature of product valuation in electronic commerce”, Behaviour & Information
Technology, Vol. 34, No. 1, pp. 57-68.
Lennon, R. & Harris, J. 2002, “Customer Service on the Web: A Cross Industry
Investigation”, Journal of Targeting, Measurement and Analysis for Marketing, Vol. 10, No.
4, pp. 325-338
Lin, Y., Lin, F. & Ryan, C. 2014, “Tourists' purchase intentions: impact of franchise brand
awareness”, Service Industries Journal, Vol. 34, No. 9/10, pp. 811-827
Malhotra, N. K. & Birks, D.F. 2010, Marketing Research: An Applied Orientation. London:
Pearson Education.
Malhotra, N. K., Birks, D. F. & Wills, P. 2012, “Marketing research: an applied approach”.
4. ed. Harlow: Pearson
Meuter, M. L., Ostrom, A. L., Roundtree, R. I., & Bitner, M. J. 2000, “Self-service
technologies: understanding customer satisfaction with technology-based service encounters”,
Journal of marketing, Vol. 64, No. 3, pp. 50-64
Nath, P. & Bawa, A, 2011, “Measurement of brand equity of services-scale construction and
validation”, Journal Of Services Research, Vol. 11, No. 2, pp. 135-154
44
Nardi, P. M. 2003, Doing Survey Research: A Guide To Quantitative Methods, Allyn and
Bacon, Boston
Netemeyer, R, Krishnan, B, Pullig, C, Wang, G, Yagci, M, Dean, D, Ricks, J, & Wirth, F.
2004, “Developing and validating measures of facets of customer-based brand equity”,
Journal Of Business Research, Vol. 57, Issue 2, pp. 209-224
Ngai, E. W. T. & Gunasekaran, A. 2007, “A Review for Mobile Commerce Research and
Applications”, Decision Support Systems, Vol. 43, No. 1, pp. 3-15
Nolan S., & Heinzen T. 2008, Statistics for the behavioural sciences, Worth publishers, 1st
edition
O'Gass, A, & Grace, D. 2004, “Exploring consumer experiences with a service brand”,
Journal Of Product & Brand Management, Vol. 13, No. 4, pp. 257-268
Page, C., & Lepkowska-White, E. 2002, “Web equity: a framework for building consumer
value in online companies”, Journal of Consumer Marketing, Vol. 19, No. 3, pp. 231-248
Pallant, J. 2010, “SPSS Survival Manual: A step by step guide to data analysis using SPSS”
4th Edition, Allen & Unwin, Australia
Parasuraman, A., Zeithaml, V., & Berry, L. 1985, “A Conceptual Model of Service Quality
and Its Implications for Future Research”, Journal of Marketing, Vol. 49, No. 4, pp. 41-50
Park, C., & Srinivasan, V. 1994, “A Survey-Based Method for Measuring and Understanding
Brand Equity and Its Extendibility”, Journal Of Marketing Research (JMR), Vol. 31, No. 2,
pp. 271-288
Park, Y, Gretzel, U, & Sirakaya-Turk, E. 2007, “Measuring Web Site Quality for Online
Travel Agencies”, Journal Of Travel & Tourism Marketing, Vol. 23, No. 1, pp. 15-30
Pfieffelmann, B., Wagner, S., & Libkuman, T. 2010, “Recruiting on Corporate Web Sites:
Perceptions of fit and attraction”, International Journal Of Selection & Assessment, Vol. 18,
No. 1, pp. 40-47
Pike, S., Bianchi, C., Kerr, G. & Patti, C. 2010, “Consumer-based brand equity for Australia
as a long-haul tourism destination in an emerging market”, International marketing review,
Vol. 27, No. 4, pp. 434-449
Pinar, M, Trapp, P, Girard, T, & Boyt, T. 2014, “University brand equity: an empirical
investigation of its dimensions”, International Journal Of Educational Management, Vol. 28,
No. 6, pp. 616-634
45
Rafiq, M., Fulford, H., & Lu, X. 2013, ”Building customer loyalty in online retailing: The
role of relationship quality”, Journal Of Marketing Management, Vol. 29, Issue 3/4, pp. 494-
517
Richardson, R. 2011, “Business Applications of Multiple Regression (Quantitative
Approaches to Decision Making Collection)” [Electronic resource]. Business Expert Press
Rios, R, & Riquelme, H. 2008, “Brand equity for online companies”, Marketing Intelligence
& Planning, Vol. 26, No. 7, pp. 719-742
Rios, R, & Riquelme, H. 2010, “Sources of brand equity for online companies”, Journal Of
Research In Interactive Marketing, Vol. 4, Issue. 3, pp. 214-240
Rosenbaum-Elliott, R, Percy, L, & Pervan, S., 2011, Strategic Brand Management, Oxford:
Oxford University Press
Saunders, M., Lewis, P. & Thornhill, A. 2009, Research methods for business students.
Harlow: Financial Times Prentice Hall
Selden, S, & Orenstein, J. 2011, “Government e‐recruiting web sites: The influence of
e‐recruitment content and usability on recruiting and hiring outcomes in US state
governments”, International Journal Of Selection And Assessment, Vol. 19, No. 1, pp. 31-40
Shugan, S. 2005, “Brand loyalty programs: Are they shams?” Marketing Science, Vol. 24,
No. 2, pp. 185-193.
Shukla, P. 2009, “Impact of contextual factors, brand loyalty and brand switching on purchase
decisions”, Journal of Consumer Marketing, Vol. 26 Issue 5, pp. 348-357
Simon, C. J. & Sullivan, M. W. 1993, “The measurement and determinants of brand equity: A
financial approach”, Marketing science, Vol. 12, No, 1, pp. 28-52
Singh, L, & Narang, L. 2008, “Behavioral Revelation Concerning E-Recruitments”, ICFAI
Journal Of Organizational Behavior, Vol. 7, No. 4, pp. 45-53
Sylva, H. & Mol, S. T. 2009, “E-Recruitment: A study into applicant perceptions of an online
application system”, International Journal of Selection and Assessment, Vol. 17, No. 3,
pp. 311–323
Thielsch, M, Träumer, L, & Pytlik, L. 2012, “E-recruiting and fairness: the applicant's point
of view”, Information Technology & Management, Vol. 13, No. 2, pp. 59-67
Tsiotsou, R. 2006, “The role of perceived product quality and overall satisfaction on purchase
intentions”, International Journal Of Consumer Studies, Vol. 30, No. 2, pp. 207-217
46
Wang, W., Liang, C., & Wu, Y. 2006, Relationship bonding tactics, relationship quality, and
customer behavioral loyalty-behavioral sequence in Taiwan’s information services industry”,
Journal of Services Research, Vol. 6, No. 1, pp. 31–57
Yang, Z., & Fang, X. 2004, “Online service quality dimensions and their relationships with
satisfaction: A content analysis of customer reviews of securities brokerage services”,
International Journal of Service Industry Management, Vol. 15, No. 3, pp. 302-326
Yoo, B. & Donthu, N. 2001, “Developing and validating a multidimensional consumer-based
brand equity scale”, Journal of Business Research, Vol. 52, No. 1, pp. 1-14
Yoo, B., Donthu, N. & Lee, S. 2000, “An examination of selected marketing mix elements
and brand equity”, Journal of the Academy of Marketing Science, Vol. 28, No. 2, pp. 195-211
Zeithaml, V, A. (1988), “Consumer Perceptions of Price, Quality, and Value: A Means-End
Model and Synthesis of Evidence”, Journal Of Marketing, Vol. 52, No. 3, pp. 2-22
Zeithaml, V, Berry, L, & Parasuraman, A. 1996, ”The Behavioral Consequences of Service
Quality”, Journal Of Marketing, Vol. 60, No. 2, pp. 31-46
Zhang, S., van Doorn, J., & Leeflang, P. 2014, “Does the importance of value, brand and
relationship equity for customer loyalty differ between Eastern and Western cultures?”,
International Business Review, Vol. 23, No. 1, pp. 284-292
Zhilin, Y., Minjoon, J., & Peterson, R. 2004, “Measuring customer perceived online service
quality”, International Journal Of Operations & Production Management, Vol. 24, No. 11,
pp. 1149-1174
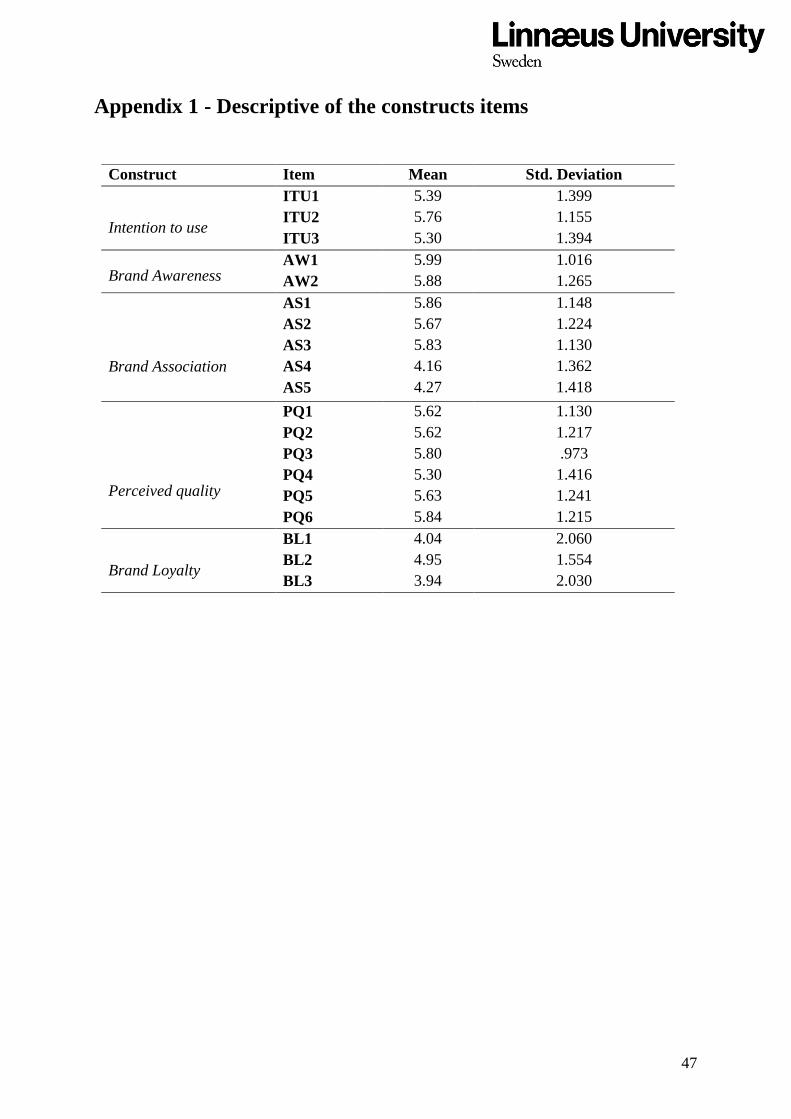
47
Appendix 1 - Descriptive of the constructs items
Construct Item Mean Std. Deviation
Intention to use
ITU1 5.39 1.399
ITU2 5.76 1.155
ITU3 5.30 1.394
Brand Awareness AW1 5.99 1.016
AW2 5.88 1.265
Brand Association
AS1 5.86 1.148
AS2 5.67 1.224
AS3 5.83 1.130
AS4 4.16 1.362
AS5 4.27 1.418
Perceived quality
PQ1 5.62 1.130
PQ2 5.62 1.217
PQ3 5.80 .973
PQ4 5.30 1.416
PQ5 5.63 1.241
PQ6 5.84 1.215
Brand Loyalty
BL1 4.04 2.060
BL2 4.95 1.554
BL3 3.94 2.030

48
Appendix 2 – Online Questionnaire
Dear participants,
We are three students at Linnaeus University within the field of marketing. We are currently
writing our Master's thesis and would appreciate if you could help us fill in this survey. The
survey will only take a couple of minutes to perform and your answers will be treated
anonymously.
E-recruitment websites are a link between the employer and the potential candidate. The
website advertises jobs that may be relevant based on a candidate's customized profile which
makes the job seeking process easier. Ex, Graduateland, MyCareer, Monster, Cruitway,
Student Consulting and Academic Work.
If you have any concerns regarding the questionnaire, please contact: [email protected]
Thanks in advance!
Joakim, Mathias & Sebastian
Part 1
Control questions
1. I have used e-recruitment websites before.
☐ Yes
☐ No
2. Which e-recruitment website are you most active on?
Please, type the e-recruitment website that you are most active on.
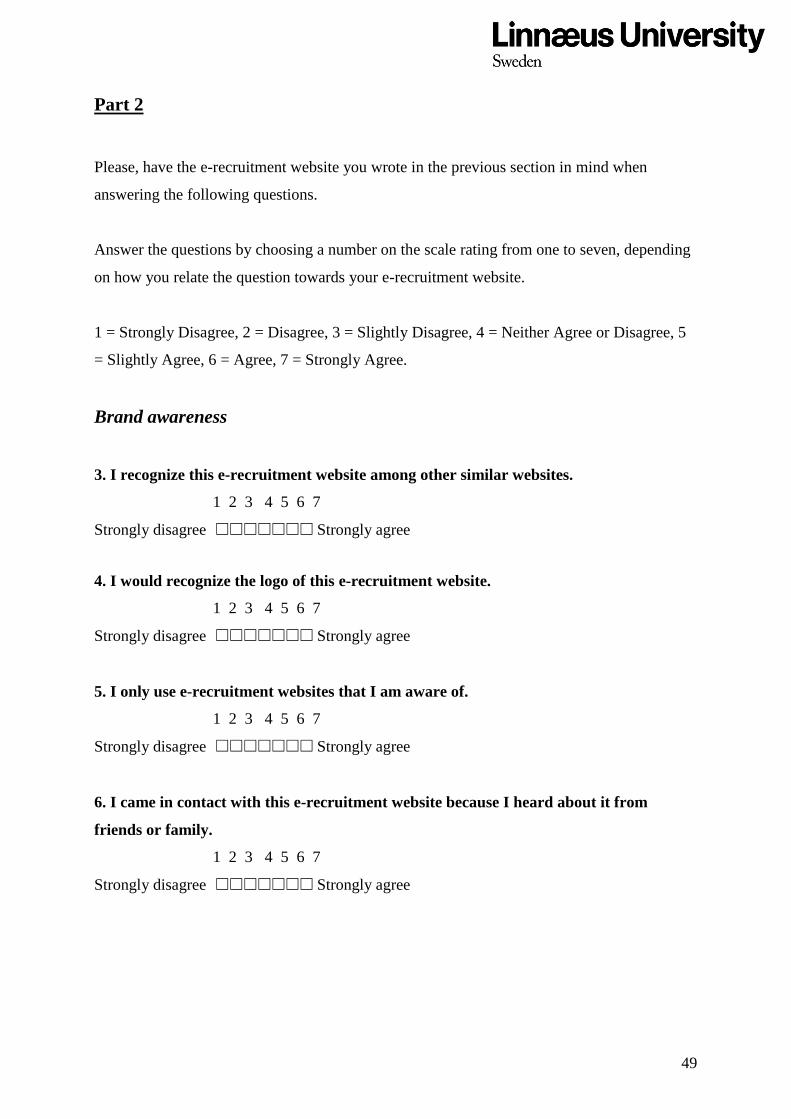
49
Part 2
Please, have the e-recruitment website you wrote in the previous section in mind when
answering the following questions.
Answer the questions by choosing a number on the scale rating from one to seven, depending
on how you relate the question towards your e-recruitment website.
1 = Strongly Disagree, 2 = Disagree, 3 = Slightly Disagree, 4 = Neither Agree or Disagree, 5
= Slightly Agree, 6 = Agree, 7 = Strongly Agree.
Brand awareness
3. I recognize this e-recruitment website among other similar websites.
1 2 3 4 5 6 7
Strongly disagree ☐ ☐ ☐ ☐ ☐ ☐ ☐ Strongly agree
4. I would recognize the logo of this e-recruitment website.
1 2 3 4 5 6 7
Strongly disagree ☐ ☐ ☐ ☐ ☐ ☐ ☐ Strongly agree
5. I only use e-recruitment websites that I am aware of.
1 2 3 4 5 6 7
Strongly disagree ☐ ☐ ☐ ☐ ☐ ☐ ☐ Strongly agree
6. I came in contact with this e-recruitment website because I heard about it from
friends or family.
1 2 3 4 5 6 7
Strongly disagree ☐ ☐ ☐ ☐ ☐ ☐ ☐ Strongly agree
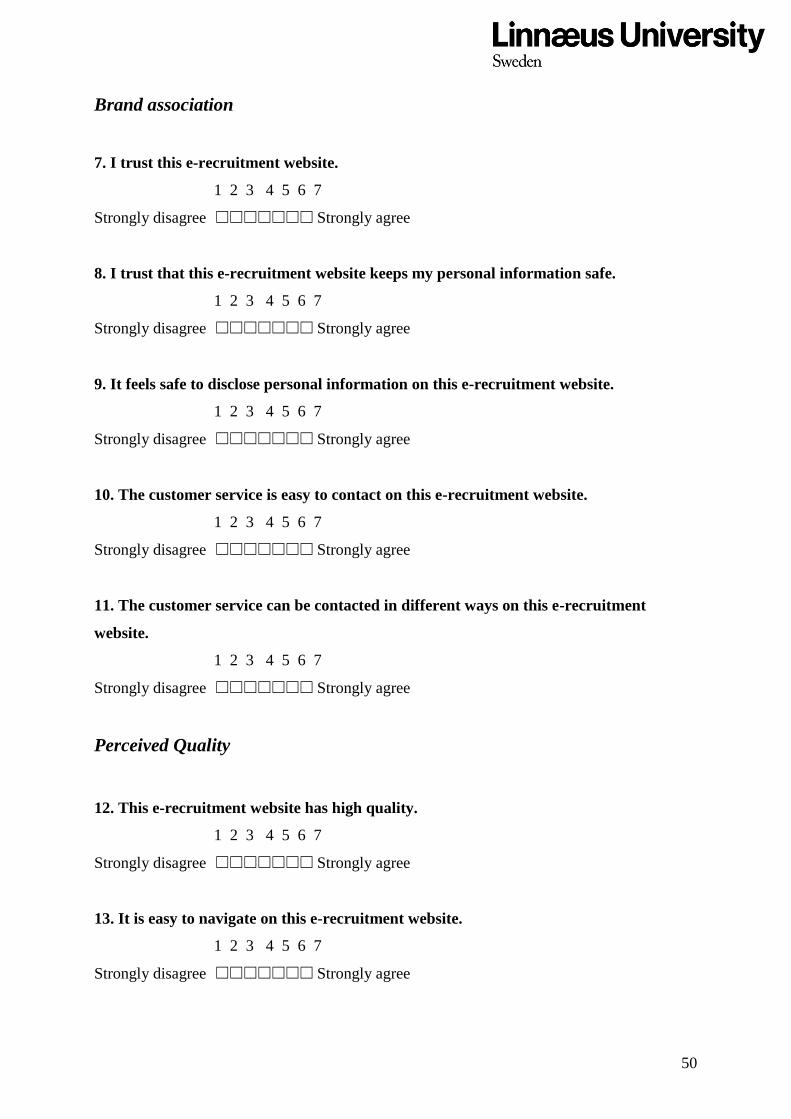
50
Brand association
7. I trust this e-recruitment website.
1 2 3 4 5 6 7
Strongly disagree ☐ ☐ ☐ ☐ ☐ ☐ ☐ Strongly agree
8. I trust that this e-recruitment website keeps my personal information safe.
1 2 3 4 5 6 7
Strongly disagree ☐ ☐ ☐ ☐ ☐ ☐ ☐ Strongly agree
9. It feels safe to disclose personal information on this e-recruitment website.
1 2 3 4 5 6 7
Strongly disagree ☐ ☐ ☐ ☐ ☐ ☐ ☐ Strongly agree
10. The customer service is easy to contact on this e-recruitment website.
1 2 3 4 5 6 7
Strongly disagree ☐ ☐ ☐ ☐ ☐ ☐ ☐ Strongly agree
11. The customer service can be contacted in different ways on this e-recruitment
website.
1 2 3 4 5 6 7
Strongly disagree ☐ ☐ ☐ ☐ ☐ ☐ ☐ Strongly agree
Perceived Quality
12. This e-recruitment website has high quality.
1 2 3 4 5 6 7
Strongly disagree ☐ ☐ ☐ ☐ ☐ ☐ ☐ Strongly agree
13. It is easy to navigate on this e-recruitment website.
1 2 3 4 5 6 7
Strongly disagree ☐ ☐ ☐ ☐ ☐ ☐ ☐ Strongly agree

51
14. The information is easy to understand on this e-recruitment website.
1 2 3 4 5 6 7
Strongly disagree ☐ ☐ ☐ ☐ ☐ ☐ ☐ Strongly agree
15. This e-recruitment website has an appealing design.
1 2 3 4 5 6 7
Strongly disagree ☐ ☐ ☐ ☐ ☐ ☐ ☐ Strongly agree
16. This e-recruitment website offer jobs that is of good quality.
1 2 3 4 5 6 7
Strongly disagree ☐ ☐ ☐ ☐ ☐ ☐ ☐ Strongly agree
17. This e-recruitment website has a wide variety of job offers.
1 2 3 4 5 6 7
Strongly disagree ☐ ☐ ☐ ☐ ☐ ☐ ☐ Strongly agree
Brand loyalty
18. I consider myself to be loyal to this e-recruitment website.
1 2 3 4 5 6 7
Strongly disagree ☐ ☐ ☐ ☐ ☐ ☐ ☐ Strongly agree
19. This e-recruitment website would be my first choice.
1 2 3 4 5 6 7
Strongly disagree ☐ ☐ ☐ ☐ ☐ ☐ ☐ Strongly agree
20. I will not choose other e-recruitment websites if this e-recruitment website is
available.
1 2 3 4 5 6 7
Strongly disagree ☐ ☐ ☐ ☐ ☐ ☐ ☐ Strongly agree
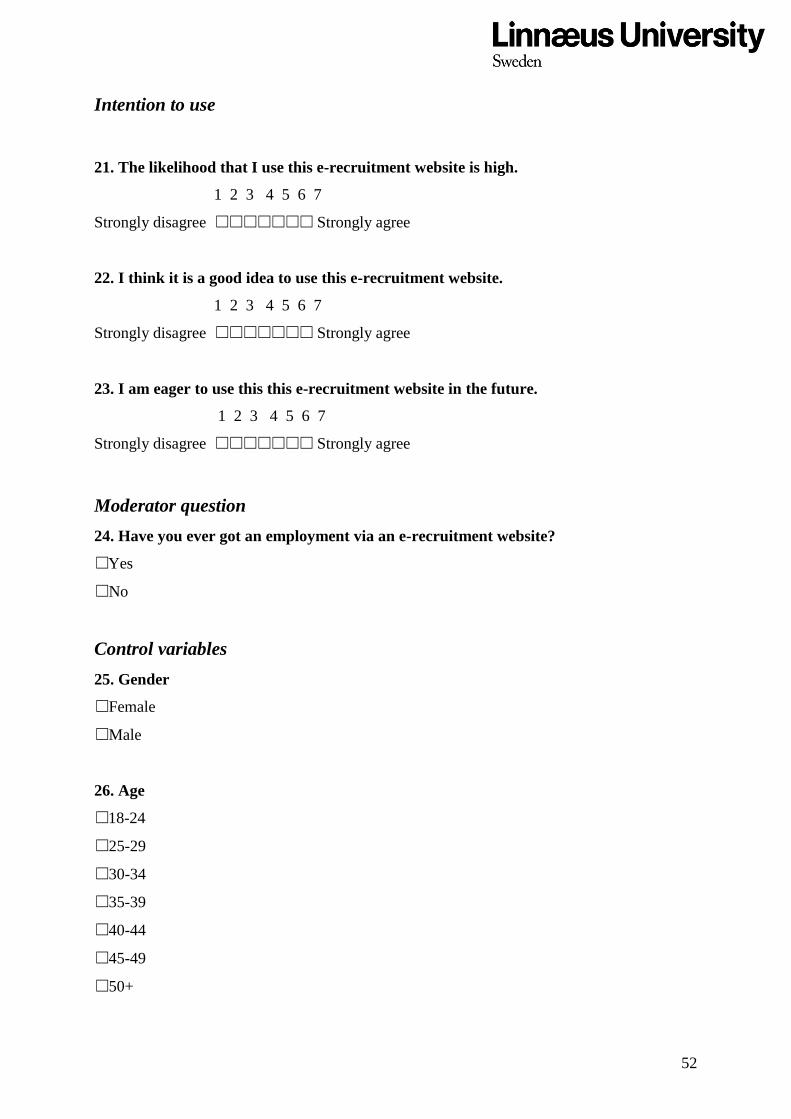
52
Intention to use
21. The likelihood that I use this e-recruitment website is high.
1 2 3 4 5 6 7
Strongly disagree ☐ ☐ ☐ ☐ ☐ ☐ ☐ Strongly agree
22. I think it is a good idea to use this e-recruitment website.
1 2 3 4 5 6 7
Strongly disagree ☐ ☐ ☐ ☐ ☐ ☐ ☐ Strongly agree
23. I am eager to use this this e-recruitment website in the future.
1 2 3 4 5 6 7
Strongly disagree ☐ ☐ ☐ ☐ ☐ ☐ ☐ Strongly agree
Moderator question
24. Have you ever got an employment via an e-recruitment website?
☐ Yes
☐ No
Control variables
25. Gender
☐ Female
☐ Male
26. Age
☐ 18-24
☐ 25-29
☐ 30-34
☐ 35-39
☐ 40-44
☐ 45-49
☐ 50+

53
27. Occupation
☐ Student
☐ Employed
☐ Unemployed
☐ Other
28. Level of education
☐ Secondary school
☐ High school
☐ Bachelor or equivalent
☐ Master or equivalent
☐ Other
If you answered "other" on the previous question, please type your education here.

54