Embed Size (px)
Citation preview
Brand-usage networks: a demand side approachto brand architecture
Kim B. Serota* and Mukesh Bhargava
Management and Marketing, School of Business Administration, Oakland University,Rochester, 48309, USA
(Received 13 March 2009; final version received 26 August 2010)
Brands represent the outcomes of marketing investment and are an importantcomponent of the market value of the firm. Managing a brand portfolio requires anunderstanding of the role or function of each brand; this critical analysis yields thebrand architecture. Typically this involves supply side analysis of a company’s ownedbrands. Using an approach modeled on market structure analysis, we proposesimultaneously capturing the interdependence of brands within the portfolio as well ascompetitive positioning. In this paper we advocate the use of network analysis toprovide metrics on brand relationships in the market place. This demand side approachexamines the interaction between brands and usage, and provides behavioral insightsinto the brand architecture that can be used to develop brand portfolio strategies. Anexample using data from the US car rental industry demonstrates brand-usageinteractions as separate and distinct entities in a relational structure. Strategic utility isdemonstrated by using network analysis to define the Dollar Thrifty Automotive Groupbrand architecture.
Keywords: brand-usage; brand architecture; brand portfolio; network analysis; marketstructure analysis; consumer behavior
Introduction
Many companies own multiple brands, some of which have been internally created or
externally acquired through mergers and acquisitions. Though some brands provide
diversification across unrelated businesses, other brands compete in the same or
overlapping product categories and may provide the company with multiple alternatives in
a single consumer segment. Since brands may represent a significant portion of the market
value or assets of the company (Madden, Fehle, & Fournier, 2006; also see Salinas &
Ambler, 2008), defining an architecture and managing the brand portfolio is of critical
concern for creating and executing a company’s business strategy.
Brand architecture is an ‘organizing structure of the brand portfolio that specifies
brand roles and the nature of relationships between brands’ (Aaker & Joachimsthaler,
2000b, p. 8). Much of the existing literature on managing the brand portfolio has focused
on brand architecture as a classification system for different types of portfolios (Aaker,
2004; Aaker & Joachimsthaler, 2000a; Strebringer, 2003). The spectrum of a ‘branded
house’ to a ‘house of brands’ prescribes architectures and identifies the organization and
management of multiple brands and the brand hierarchy (Keller, 2008). While this is an
ISSN 0965-254X print/ISSN 1466-4488 online
q 2010 Taylor & Francis
DOI: 10.1080/0965254X.2010.525248
http://www.informaworld.com
*Corresponding author. Email: [email protected]
Journal of Strategic Marketing
Vol. 18, No. 6, October 2010, 451–471
important contribution, it has been largely a supply side approach that stresses the
relationship of a company to its brands. But because brands also represent a relationship
between the company and consumers, it should be important to understand the brand
architecture from a customer’s perspective, an approach that requires demand side
analysis (Fournier, 1998).
In this article, we briefly examine the prevailing supply side approach to identifying
brand architecture, discuss the value of demand side analysis for improving the utility of
brand architecture, and propose the application of network analysis as an effective demand
side method that will enhance the use of brand architecture for strategy formation.
Brand architecture and portfolio management
Supply side perspective: prescriptive structure
Brand architecture is a strategic tool for achieving brand coherence (Balmer, 1998) and
creating rational marketing strategy. Most large companies (e.g. those included in the
Asiaweek 1000, the FT 500-Europe, and the Fortune 500) have portfolios with multiple
brands. For example, Morgan and Leotte do Rego’s (2006) sample of 149 Fortune
500 Companies found that each had over 18 brands, with the maximum being 400 brands.
Logically, prioritizing the relative ‘importance’ and identifying the strategic roles of these
brands is required for resource allocation.
Supply side analyses support management strategy and focus on how a firm competes.
Supply side methods may include qualitative case studies, brand audits, and key-informant
interviews as well as quantitative examination of company databases. For example, Kumar
(2003, p. 89) suggests the way to refine the role of the brand in the portfolio is a brand audit
listing a brand’s market share, geographic presence, percentage of sales and profits, and
noting whether each brand generates or uses up cash. These measures allowmanagement to
assign a strategic role for each brand – cost leadership, differentiation, or focus – and
allocate resources depending on industry attractiveness and each brand’s competitive
strength (Porter, 1980). The set of role relationships defines a company’s brand architecture.
To understand brand roles, Aaker (2004, p. 27) recommends relying on tools that can
show the brand groupings, hierarchies, and networks. Empirical supply side research on
brand portfolios reinforces a critical link between the portfolio and firm performance by
modeling and testing linkages using data gathered from a firm (Morgan & Leotte do Rego,
2006; Rao, Agarwal, & Dahlhoff, 2004; Simmons, Bickart, & Buchanan, 2000). An
important limitation in the literature is that this research essentially maps each brand
owned onto one of several prescribed portfolio structures such as Kapferer’s (1992)
hierarchy of brands or Aaker’s (1996) brand systems framework, which incorporates the
‘house of brands’ to ‘branded house’ spectrum.
As described by Rajagopal and Sanchez (2004), the supply side view of brand
architecture is, ‘a legacy of past management decisions’ and competitive realities that
result in brand baggage. Fundamentally, the supply side approach seems to eschew the
notion of marketing as an exchange process creating value for both the firm and the
consumer (Bagozzi, 1975). From this supply side perspective, management is encouraged
to treat competing brands as external factors, or ignore them altogether, when considering
a company’s own brand portfolio. Thus one key question usually left unasked is: how
do competitors’ brands interact with and influence owned brands? This shortcoming
of supply side analysis underscores the need for counter-balancing research on
brand architecture that looks at the structure (architecture) from a consumer demand
perspective.
K.B. Serota and M. Bhargava452

Demand side perspective: insights from marketing structure analysis
Demand side analysis focuses on where a brand competes – consumer segments,
locations, and product types – as well as on what the consumer wants or needs and how the
consumer will use the product (Grant, 2010). Aaker (2004) acknowledges the importance
of competition, noting that to complete an audit the analysis should consider competing
brands in the product category. However, from a supply side perspective, competition is
viewed as an attribute relative to each owned brand rather than as an element of market
structure that may have intrinsic influence on the strategic choices resulting from an
understanding of how consumers interact with the brand architecture.
Consumers do not always limit their choices to sets that are neatly defined in ways that
make sense to brand managers and marketing executives. Customer perceptions,
evaluations, and subsequent purchase behaviors often reflect a much messier market
reality. The demand side perspective brings to bear on marketing strategy perceived
relationships between brands and portfolios as well as competitive usage to satisfy
variable needs. The process of assessing these relationships is rooted in the analysis of
consumer data. For instance, a careful examination of data recording the selection and
patterns of usage of competing brands may reveal opportunities for co-opetition (Nalebuff
& Brandenburger, 1997) while most firm-based brand analyses only seek to identify the
presence of complements and substitutions (Leitch & Richardson, 2003).
Approaching brand architecture from a consumer perspective draws a parallel to
market structure analysis (MSA), a demand side approach to defining competitors and the
bases of competition (Day, Shocker, & Srivastava, 1979; Srivastava, Alpert, & Shocker,
1984). The Aaker and Joachimsthaler (2000b) definition of brand architecture can be
recast as a demand side concept that includes competitive brand relationships. Applying
insights from MSA we can enhance the creation of brand architecture by incorporating the
ways in which brands are used. Specifically, an analysis that includes both owned and
competitive brands, and multiple usage categories, allows management to better
understand its own brands. By isolating substitutes and complements from one brand to
another, and across usage situations, managers can more precisely assign brand roles
within the brand architecture.
Fully understanding brand architecture requires examining the market for competing
brands, some of which are external to the company and some that might be part of the
company’s portfolio. The sizable literature on competitive MSA provides a foundation for
this approach to brand architecture. MSA has examined the extent of competition between
firms in an industry, resulting in the concept of strategic groups as a way to define the real
set of competing firms (McGee, Thomas, & Pruett, 1995; Reger & Huff, 1993). MSA
creates the foundation for interpreting competitive structure by identifying the similarities
of product benefits and usage situations (Srivastava et al., 1984; Srivastava, Leone, &
Shocker, 1981). Firms often rationalize brand architecture on the basis of the market
segmentation of product and brand offerings in conjunction with the business objectives of
the firm (Dabic, Schweiger, & Strebinger, 2004; Petromilli, Morrison, & Million, 2002),
but ultimately the consumer by his or her purchasing and usage should be the arbiter of the
company’s brand architecture.
Brand architecture as a network of brands and usages
Brand architecture is predicated on deriving market structure by defining a set of
relationships among brands. While the key strength of MSA lies in its conceptualization of
markets as a set of products in different usage situations, branding gives added value to
Journal of Strategic Marketing 453

products and drives purchases, with some brands offering more competitive value than
others (Aaker & Joachimsthaler, 2000b). Similar to applying the MSA approach to products,
it is useful to think of brands in conjunction with their usage in order to examine consumers’
brand choice behavior. Toward this end, we demonstrate network analysis as an effective
way to measure consumer behavior, capture brand interrelationships at a given level of the
brand hierarchy, and derive a consumer-based view of each company’s brand architecture.
Network analysis is predicated on graph theory, which identifies relationships between
discrete objects. Networks have been applied to fields as diverse as physics, biology,
organizational behavior, telecommunications, information science, and energy grid
management (Barabasi, 2003; Freeman, 2004). The linked objects, or network nodes, may
be people, places, events, things, or ideas; theymay even be combinations of these concepts,
such as brands and usage situations. In social network analysis links between nodes are
often derived from relationships such as friendship, communication, and exchange
behavior. In typical marketing applications nodes may be organizational actors such as
corporate officers, lobbyists, or doctors (Burt & Janicik, 1996), producers, suppliers, and
consumers (Gulati, Nohria, & Zaheer, 2000; Martin & Clark, 1996), or brands (Henderson,
Iacobucci, & Calder, 1998). When brands at a given level of brand hierarchy are used as
nodes, the links between brands reflect some form of brand choice such as brand switching
(Henderson et al., 1998; Marcati, 1996) or co-occurrence of purchase.
Generally, network theoretical constructs are associated with patterns or relationships
such as the number of connections to an object or whether a pattern is repeated across the
network. In order to capture the complete set of relationships necessary for describing a brand
architecture we propose treating the set of owned (or controlled) and competing brands, and
their uses, as a network consisting of all brand-usage situations (e.g. Ford for commuting vs.
Ford for shopping vs. Toyota for shopping). The architecture for any given company and its
brands is embedded in the network structure and may include competitor brands.
Network analysis of brands
Researchers have previously noted the utility of network analysis for understanding brand
structures (Iacobucci, Henderson,Marcati,&Chang, 1996;Marcati, 1996).Henderson et al.
(1998) have developed schema for applying various network properties such as centrality,
cohesion, and position to the assessment of branding effects. By capturing the set of all
possible brand interactions within a brand set, this analytic approach offers a parsimonious
way of describing the competition between brands and provides an extensive set of derived
measures that can be used to explore brand relationships (Wasserman & Faust, 1994).
Henderson et al. (1998) propose that relationship variables and position characterizations
created in a network analysis can offer precise operationalizations of brand features such as
a driver brand (based on centrality), complement (based on cohesion), and cannibalization
(based on relative position). All brands are potentially connected to all other brands
through the processes of consumer evaluation, consideration, choice, purchase, and
primary use. The approach taken in this article extends Henderson et al. and is consistent
with MSA. That is, measure the pattern of brand purchases but include information about
usage in order to describe the brands and their roles as a structure viewed from the consumer
perspective.
Networks of brand-usage
The term brand-usage is used to describe nodes that represent brands conjoined to their
usage situations. A network of brand-usages crosses all brands with all usages so that the
K.B. Serota and M. Bhargava454
set of brands by usages represents all possible combinations that might occur in a market.
It may be useful to think of brand-usage situations as sub-brands. The brand name is the
same, but the context re-defines the brand in ways that are specific to the usage situation
and the context in which it is used. By identifying co-occurrences of brand-usage nodes in
individual consumers’ purchase sets and applying network analytic procedures, our
understanding of the complexity of brand architecture can be expanded. Network analysis
provides a broad palette of techniques and constructs (Wasserman & Faust, 1994). In this
application to brand architecture we have found three fundamentally useful ideas for
developing marketing strategy: (1) types of linkages are critical to identifying structural
relationships; (2) centrality identifies core brands and usage situations within the industry;
and (3) nodal clusters (cliques or neighborhoods) identify key linkages for each individual
brand-usage situation, which taken together give structure to a company’s brand
architecture.
Linkages and structural relationships
In a brand-usage network, each node contains two pieces of information, the brand used
and the purpose for which it was used. Each dyad represents one of three possible
situations: different brands with the same usage; the same brand with different usages; and
different brands with different usages. When a consumer has multiple occurrences of the
same brand with the same usage the result is a monadic rather than dyadic representation;
monads identify repeat usage and behavioral loyalty to the brand when specific needs are
addressed.
Dyads representing pairs of behaviors that occur with above average frequency
indicate structural reasons for consistent behavior. For example, when the dyad consists of
two nodes with the same brand but different usage behaviors, the pattern indicates
consumer willingness to use one brand to address different needs or solve different
problems. When the dyad consists of two nodes with different brands but the same
application of those brands, the pattern indicates the two brands are considered acceptable
substitutes for the usage situation. When neither the brand nor the usage is the same, but
the nodes are nonetheless connected in the network structure, we have evidence of two
brands being used to complement each other in order to address the multiple needs of
consumers (Shocker, Bayus, & Kim, 2004). When dyadic co-occurrence is infrequent, the
two brand-usage situations are not linked in the network and should be unrelated in the
brand architecture.
Finding network patterns can help the marketer focus on building loyalty and avoiding
specific competitive substitution. Attention to brand-usage dyads will identify when
complementary usage stays within the company’s portfolio or, alternatively, involves the use
of a competitor’s product. A company’s marketing strategy may create a comprehensive and
differentiated portfolio that covers all major segments of the market, or it may recognize that
co-opting a competing brand for certain purposes ismore advantageous than trying to build an
alliance within the portfolio. For example, it may make sense to send a customer to a specific
competitor when the cost of providing a product or service outweighs the benefits. This
approach is frequently used by airlineswhen the cost of operating a route is not justified by the
profit potential of the route.
Regardless of the intent or success of industry competitors to position their brands
according to some strategically advantageous architecture, it is the market which
determines how those brands are actually used. Thus the network of brand-usage patterns
provides a foundation for developing, refining, and correcting a firm’s brand strategy.
Journal of Strategic Marketing 455
Centrality
Centrality is among the most fundamental network analysis statistics and signifies the
position of one node relative to all others in the network. A brand-usage situation will tend
to be central to the network when its node is frequently and therefore closely connected to
other brand-usage situations. Nodes that are central to the overall network tend to be
dominant brands. Often, but not always, the nodes most central to the network will have
the greatest market share, be indicative of the company’s leader brand(s), or identify what
consumers perceive as the brand’s most customary usage. If they are not dominant, they
are likely to be a common link with two or more dominant brands. Using the network
approach, it is possible for competitor brands to be viewed as part of the brand
architecture, whether or not this is desirable. The appearance of a competitive brand-usage
node may indicate a substitution or complement. If the competitor node is peripheral (not
central), it is likely that consumers use the competitor brand to augment use of the
owned/controlled brand. If the competitor node is central, consumers may be using the
owned brand as an alternative to a dominant competitor. Brand centrality can change in
response to market forces. As a consequence, the roles of competing brands may also
change.
Nodal clusters
Observing clusters is also critical for the application of network analysis to brand
architecture. Brand and usage patterns do not have to be limited to dyads. An individual’s
personal network of brand-usages may be dyadic, triadic, or of any rank that is one less
than the number of brand-usage situations. At the individual level, we would not expect to
find overtly complex structures since the number of dyadic brand-usage situations grows
large quickly (with (n £ n 2 1)/2 possible combinations).1 The more brand-usage
situations an individual experiences the more likely combining dyads into triads or more
complex patterns will be idiosyncratic. But at the market level, frequently recurring
patterns of brand-usage across consumers may form groups of dyads and provide clues for
identifying important but more complex strategic brand interactions. For example, when
both nodes of a dyad are part of multiple dyads, then a chain of co-occurrences may be
formed. Thus the aggregation of dyads, chains, and other linkage arrangements found in
personal brand networks creates a map or portrait of the overall brand architecture from a
customer segment or total market perspective.
Cliques are groups of nodes that are completely inter-connected and form distinct
clusters within the larger network structure (Luce & Perry, 1949; Wasserman & Faust,
1994). In social network analysis (from which the concept originates), cliques describe
cohesive subgroups for which the linkages are relatively strong, direct, intense, frequent,
or positive. In brand-usage networks, cliques form when brands and usages have frequent
and persistent ties in the overall consumption framework. Most often, brand-usage cliques
form around a single brand or a single usage. When a brand has high loyalty and customers
choose that brand regardless of how they plan to use it, a brand clique is formed. When a
functional need is satisfied by many brands interchangeably, a usage clique is formed.
Network neighborhoods and cliques are similar, though the former is typically used to
describe patterns of regular equivalence. When two nodes have identical connections to a
set of other nodes, even if all of the nodes in the set are not completely connected, the
cluster may be more accurately described as a network neighborhood (Everett, Boyd, &
Borgatti, 1990). Neighborhoods (sometimes called n-cliques) are a set of nodes with a high
(but unlike cliques, less than 100%) interconnectedness (Wasserman & Faust, 1994).
K.B. Serota and M. Bhargava456
Typically, the network analysis will focus on direct linkages between nodes, but it may be
useful in some instances to consider indirect links; n-cliques allow for cliques to be
identified when n indirect links are accepted for defining the clique. For example, if node
A is connected to node B based on a common usage theme, the other connections to brand
B (which are indirect connects to A through B) may also be based on the same usage. In
this case, a likely interpretation is that B is the central node of a usage-based neighborhood
and brand A is also a substitute for brands C, D, and so on.
Summary of the network approach
Purchase and usage data can capture the co-occurrence of brands (and their usage
situations). Network analysis is a widely used tool for identifying and interpreting
structural relationships that may be applied to these data in order to find brand structure in
the market. Interpreting (1) the overall pattern of linkages, (2) central versus peripheral
positioning of brand-usage nodes in the network, and (3) the clustering of brand-usage
nodes yields information about how brands are related to each other within a portfolio or at
one level of a brand hierarchy and, importantly, how their interactions with competing
brands may influence the planning and adjustment of brand architecture. The following
example provides insight into how this concept works in practice.
Car rental industry study
In order to demonstrate network analysis of brand-usage and its strategic application to
brand architecture development, an analysis was conducted using data collected from car
rental industry customers in the United States. The car rental industry provides a
straightforward illustration because the number of major brands is limited and the number
of car rental brands within each portfolio is small. While marketing strategists may be
concerned with rationalizing their brand architecture across many product categories (as is
the case with conglomerates such as Proctor & Gamble or Siemens), in practice
diversification across unrelated industries will often provide the logic for major structural
decisions within the corporate framework. The difficult decisions involve brands that sell
overlapping goods and services. The car rental market provides a practical example of the
kind of sub-structure analysis required for larger companies with many brands, but it does
so by focusing on a situation comparable to those where only a few brands are likely to
interact within the brand architecture. Equally important, the car rental study provides a
clear illustration of how brands outside the strategist’s control, the competitor brands,
should be treated as structural elements and factored into the planning of a brand
architectural for company-owned brands.
Consumer data
To demonstrate the strategic application of network analysis for operationalizing the
brand-usage approach, this analysis focuses primarily on one company, Dollar Thrifty
Automotive Group, Inc. (DTAG) and its two car rental brands, Dollar Rent A Car and
Thrifty Car Rental. The choice of DTAG provides a useful illustration because its two
brands are similarly positioned and the DTAG corporate platform relies on a functional
structure rather than maintaining two separate brand marketing organizations within the
company. Both brands share field operations, technology, and management. While
transparent to customers who see Dollar and Thrifty operating as separate entities, the
functional organization creates cost savings and operational efficiencies (DTG History,
Journal of Strategic Marketing 457
2008). The decision to maintain two very similar brands supported by a common
infrastructure raises interesting questions about brand architecture and the efficacy of
DTAG marketing strategy.
In January 2004 a survey on car rental usage was sent to 75,000 US household members
of the Synovate consumer mail panel. Synovate uses the balanced panel approach to match
samples to the US Census demographics at the time of the survey. Matching is based on the
characteristics of age and income of head of household, household size and composition,
census region, and population density. A total of 40,602 completed surveys were returned
(54.1%); 7171 households (18.7% of the completed surveys) reported renting a car in the
prior 12 months and were included in the initial analysis. The 12-month period is used to
account for seasonality in the travel industry; package goods may utilize shorter periods
while durables may require longer duration for data aggregation.
The questionnaire was filled out by the household member with the most frequent car
rental experience. In addition to determining whether or not the respondent household had
rented a car in the prior 12 months, the core question of the survey asked respondents to fill
in a grid indicating the number of rentals for each combination of brand and usage situation.
The extent of rental activity was measured as the number of rentals (transactions), which
provides a simple representation of the brand use; other measures of activity, such as the
number of days rented or aggregate amount spent on car rentals in each brand-usage
situation could also be used. The brand axis of the grid consisted of the eight leading car
rental brands and an ‘other’ brand category. The usage axis of the grid consisted of five
major usages; in the car rental industry usage is defined as type and location situations and
includes rented for business purposes at/near an airport (BA), rented for business purposes
at other locations (BO), rented for leisure/personal purposes at/near an airport (LA), rented
for leisure/personal purposes at other locations (LO), and rented for insurance or
replacement purposes (IR). The last category was not location specific; subsequent research
has determined that insurance and replacement rentals (which are associated with the
maintenance and repair of owned vehicles) rarely occur at airport rental locations. The
resulting grid yields 45 brand and usage combinations; each respondent’s grid provides an
individual profile of annual car rental usage frequency for the 45 categories. Most renters
reported using only a small subset of the 45 brand-usage categories.
Market share
Results of the January 2004 survey indicated that in the US car rental industry Enterprise
(25.8% of transactions) and Hertz (18.9%) brands were the market leaders (Table 1). At
the time of the study, the eight major brands were owned by five companies. Enterprise
was a privately owned stand-alone brand. Hertz was a single car rental brand within the
portfolio of brands owned by Ford Motor Company. Avis (14.4%) and Budget (10.5%)
were both components of a travel and real estate portfolio owned by Cendant Corporation.
National (8.7%) and Alamo (5.1%) comprised a two brand portfolio which had emerged
from bankruptcy in 2003 as Vanguard Car Rental USA Inc. (owned by capital investment
firm Cerberus and subsequently sold to Enterprise in 2007). Dollar (4.0%) and Thrifty
(3.4%) formed the two brand portfolio of Dollar Thrifty Automotive Group Inc.
Collectively, minor car rental brands and independent/local operators accounted for 9.2%
of rental transactions.
Positioning strategies used by these firms were inferred from a supply side audit of the
contents of annual reports, website information, and industry analysts’ reports. These
positions were compared to the actual usage data reported from the consumer survey to
K.B. Serota and M. Bhargava458
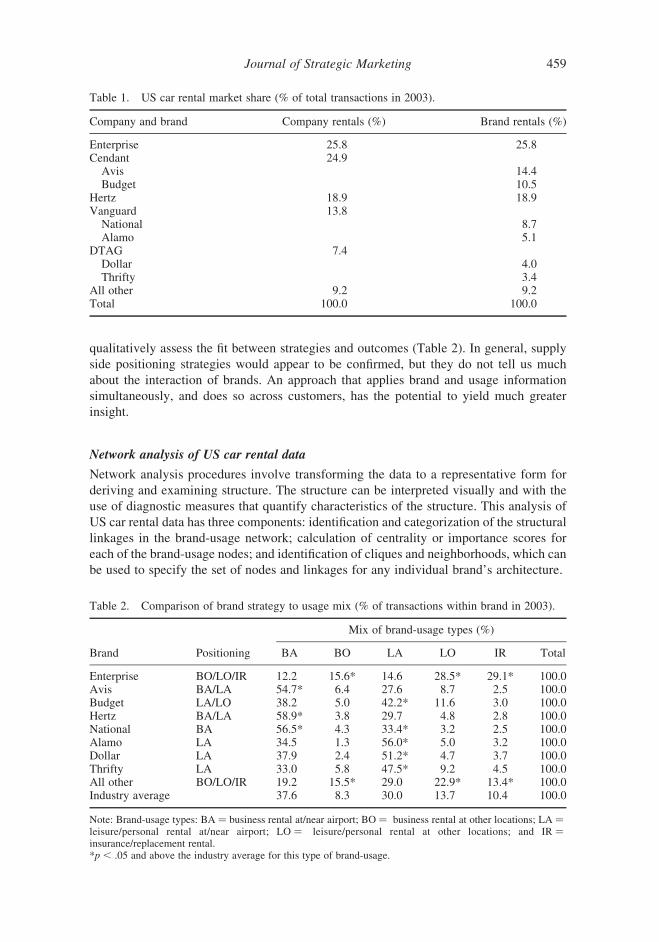
qualitatively assess the fit between strategies and outcomes (Table 2). In general, supply
side positioning strategies would appear to be confirmed, but they do not tell us much
about the interaction of brands. An approach that applies brand and usage information
simultaneously, and does so across customers, has the potential to yield much greater
insight.
Network analysis of US car rental data
Network analysis procedures involve transforming the data to a representative form for
deriving and examining structure. The structure can be interpreted visually and with the
use of diagnostic measures that quantify characteristics of the structure. This analysis of
US car rental data has three components: identification and categorization of the structural
linkages in the brand-usage network; calculation of centrality or importance scores for
each of the brand-usage nodes; and identification of cliques and neighborhoods, which can
be used to specify the set of nodes and linkages for any individual brand’s architecture.
Table 2. Comparison of brand strategy to usage mix (% of transactions within brand in 2003).
Mix of brand-usage types (%)
Brand Positioning BA BO LA LO IR Total
Enterprise BO/LO/IR 12.2 15.6* 14.6 28.5* 29.1* 100.0Avis BA/LA 54.7* 6.4 27.6 8.7 2.5 100.0Budget LA/LO 38.2 5.0 42.2* 11.6 3.0 100.0Hertz BA/LA 58.9* 3.8 29.7 4.8 2.8 100.0National BA 56.5* 4.3 33.4* 3.2 2.5 100.0Alamo LA 34.5 1.3 56.0* 5.0 3.2 100.0Dollar LA 37.9 2.4 51.2* 4.7 3.7 100.0Thrifty LA 33.0 5.8 47.5* 9.2 4.5 100.0All other BO/LO/IR 19.2 15.5* 29.0 22.9* 13.4* 100.0Industry average 37.6 8.3 30.0 13.7 10.4 100.0
Note: Brand-usage types: BA ¼ business rental at/near airport; BO ¼ business rental at other locations; LA ¼leisure/personal rental at/near airport; LO ¼ leisure/personal rental at other locations; and IR ¼insurance/replacement rental.*p , .05 and above the industry average for this type of brand-usage.
Table 1. US car rental market share (% of total transactions in 2003).
Company and brand Company rentals (%) Brand rentals (%)
Enterprise 25.8 25.8Cendant 24.9Avis 14.4Budget 10.5
Hertz 18.9 18.9Vanguard 13.8National 8.7Alamo 5.1
DTAG 7.4Dollar 4.0Thrifty 3.4
All other 9.2 9.2Total 100.0 100.0
Journal of Strategic Marketing 459
Data transformation
A high proportion of those renting a car in the past year (59.9%) rented two or more times
for any use. Of the 7171 respondents, 2878 had only one rental; by definition, these
respondents had no co-occurrences and for this analysis were eliminated from the data set.
Among the remaining respondents, 1025 had multiple rentals involving single-
brand/single-usage (unconnected) situations; these were also excluded.
Using the grid question, respondents not only indicated the brands used but their
purpose for renting the vehicle and whether that rental occurred at or near an airport or at
some other location not associated with air travel. This is a critical distinction because, as
Srivastava et al. (1984, p. 32, emphasis added) note, ‘over a period of time customers may
develop sets of products for consideration based upon the perceived appropriateness of
their functional attributes for the intended usage.’ Generically, car rental is a product that
has typical functional uses and occurs at typical locations; any of the brands could serve
any of these functions and be provided at any of these locations. However, the preferred
uses and locations that become associated with each brand define those brands’
appropriate functional attributes from a consumer perspective.
The combination of nine brands and five usage situations yields 45 nodes. Each node
can be considered a separate product alternative, the application of a brand to meeting a
specific consumer need or the solution to a specific consumer ‘problem’. The 45 nodes
have (n x n 2 1)/2 or 990 potential linkages; the links represent the co-occurrence of
brand-usage situations in each consumer’s purchase set.
The data yield a two-mode matrix of respondents by brand-usage nodes. The final data
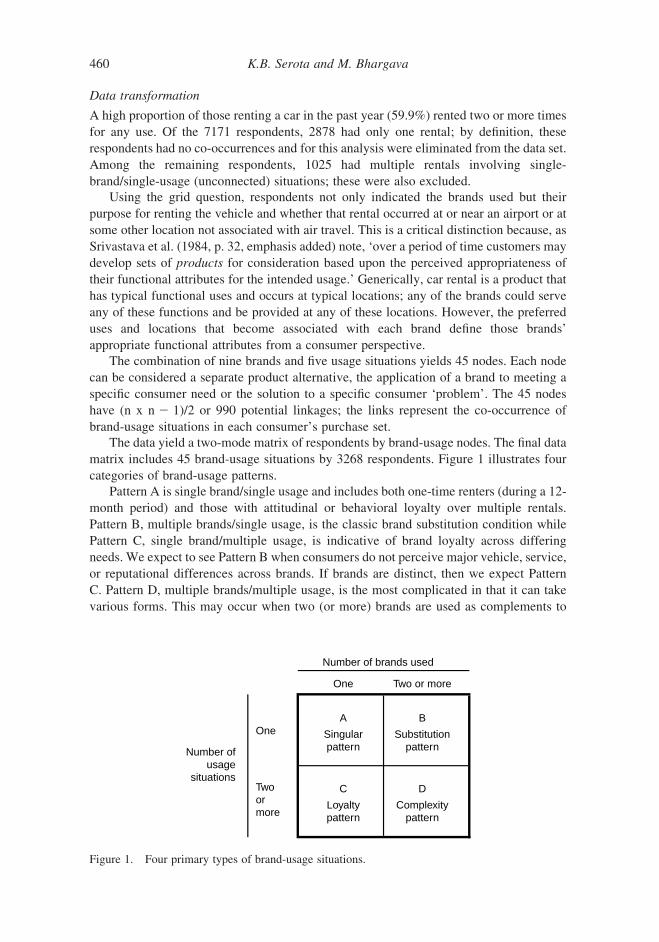
matrix includes 45 brand-usage situations by 3268 respondents. Figure 1 illustrates four
categories of brand-usage patterns.
Pattern A is single brand/single usage and includes both one-time renters (during a 12-
month period) and those with attitudinal or behavioral loyalty over multiple rentals.
Pattern B, multiple brands/single usage, is the classic brand substitution condition while
Pattern C, single brand/multiple usage, is indicative of brand loyalty across differing
needs. We expect to see Pattern B when consumers do not perceive major vehicle, service,
or reputational differences across brands. If brands are distinct, then we expect Pattern
C. Pattern D, multiple brands/multiple usage, is the most complicated in that it can take
various forms. This may occur when two (or more) brands are used as complements to
One Two or more
Number of brands used
Twoormore
One
Number ofusage
situations
A
Singularpattern
B
Substitutionpattern
C
Loyaltypattern
D
Complexitypattern
Figure 1. Four primary types of brand-usage situations.
K.B. Serota and M. Bhargava460
address different needs, but it may also mask a complex set of loyalty and substitution
issues that are impacted by market forces such as availability at a particular location, price
competition, or a company’s portfolio strategies (see Day et al., 1979 and Shocker et al.,
2004 for discussion).
In the two-mode affiliation matrix of brand-usage situations by respondents, each cell
represents an individual’s frequency of a brand-usage situation occurring in the past 12
months. In order to interpret market structure, the two-mode affiliation matrix was
transformed to a one-mode, square symmetrical brand-usage by brand-usage similarities
matrix of Pearson correlation coefficients (PCC). Market structure is defined by structural
equivalence, or the set of roles and positions represented by the brand-usage nodes. There
are many alternatives for determining structural equivalence; the proximity measure may
be dichotomous or valued, directional or non-directional, and including or excluding self-
ties from the matrix diagonal. In a valued structure such as the car rental data, proximity is
typically represented as Euclidean distance, covariance, or correlation (cf. Wasserman &
Faust, 1994). Since the presence or absence of relationships is based on dichotomizing the
valued data, we chose to use the standardized form of valued similarity data, the Pearson
correlation coefficient.
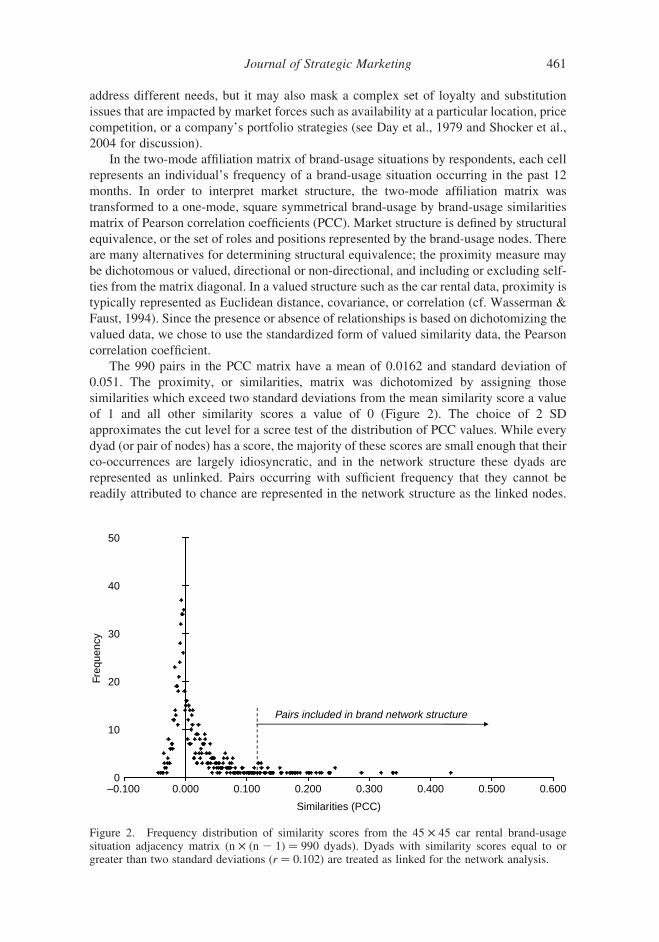
The 990 pairs in the PCC matrix have a mean of 0.0162 and standard deviation of
0.051. The proximity, or similarities, matrix was dichotomized by assigning those
similarities which exceed two standard deviations from the mean similarity score a value
of 1 and all other similarity scores a value of 0 (Figure 2). The choice of 2 SD
approximates the cut level for a scree test of the distribution of PCC values. While every
dyad (or pair of nodes) has a score, the majority of these scores are small enough that their
co-occurrences are largely idiosyncratic, and in the network structure these dyads are
represented as unlinked. Pairs occurring with sufficient frequency that they cannot be
readily attributed to chance are represented in the network structure as the linked nodes.
0
10
20
30
40
50
–0.100 0.000 0.100 0.200 0.300 0.400 0.500 0.600
Similarities (PCC)
Freq
uenc
y
Pairs included in brand network structure
Figure 2. Frequency distribution of similarity scores from the 45 £ 45 car rental brand-usagesituation adjacency matrix (n £ (n 2 1) ¼ 990 dyads). Dyads with similarity scores equal to orgreater than two standard deviations (r ¼ 0.102) are treated as linked for the network analysis.
Journal of Strategic Marketing 461
Network structure
The 45 nodes and 990 potential links in the car rental data, when constrained to similarity
levels of two standard deviations or more above the mean, yield 41 nodes connected by
53 links. Overall this is a relatively sparse network (density ¼ .0535 or 53 observed
links/990 potential links). Four nodes are classified as isolates; these are brand-usage
situations that tend not to occur in conjunction with other car renting behaviors and,
coincidently, have relatively low market share. The 53 links represent three kinds of rental
patterns; 31 links (58.5%) join nodes with a common brand (Pattern C), 15 links (28.3%)
join nodes with a common usage situation (Pattern B), and seven links (13.2%) join
complementary nodes (Pattern D, different brand and different usage situation). The
remaining 937 potential links had very small PCC values and were dichotomized with a
value of 0; although these small values can indicate some co-occurrence, the links are
considered to be idiosyncratic. Of the 53 linkages, only one joins nodes that are part of the
same firm’s brand portfolio; among airport renters, Dollar and Thrifty are substitutes for
each other when used for leisure/personal travel (shared usage link).
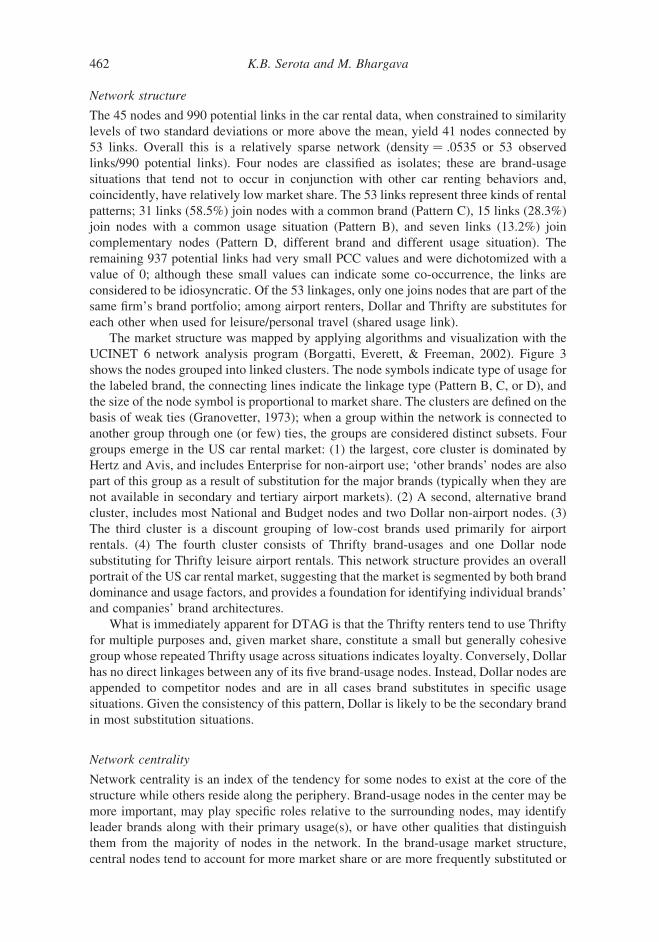
The market structure was mapped by applying algorithms and visualization with the
UCINET 6 network analysis program (Borgatti, Everett, & Freeman, 2002). Figure 3
shows the nodes grouped into linked clusters. The node symbols indicate type of usage for
the labeled brand, the connecting lines indicate the linkage type (Pattern B, C, or D), and
the size of the node symbol is proportional to market share. The clusters are defined on the
basis of weak ties (Granovetter, 1973); when a group within the network is connected to
another group through one (or few) ties, the groups are considered distinct subsets. Four
groups emerge in the US car rental market: (1) the largest, core cluster is dominated by
Hertz and Avis, and includes Enterprise for non-airport use; ‘other brands’ nodes are also
part of this group as a result of substitution for the major brands (typically when they are
not available in secondary and tertiary airport markets). (2) A second, alternative brand
cluster, includes most National and Budget nodes and two Dollar non-airport nodes. (3)
The third cluster is a discount grouping of low-cost brands used primarily for airport
rentals. (4) The fourth cluster consists of Thrifty brand-usages and one Dollar node
substituting for Thrifty leisure airport rentals. This network structure provides an overall
portrait of the US car rental market, suggesting that the market is segmented by both brand
dominance and usage factors, and provides a foundation for identifying individual brands’
and companies’ brand architectures.
What is immediately apparent for DTAG is that the Thrifty renters tend to use Thrifty
for multiple purposes and, given market share, constitute a small but generally cohesive
group whose repeated Thrifty usage across situations indicates loyalty. Conversely, Dollar
has no direct linkages between any of its five brand-usage nodes. Instead, Dollar nodes are
appended to competitor nodes and are in all cases brand substitutes in specific usage
situations. Given the consistency of this pattern, Dollar is likely to be the secondary brand
in most substitution situations.
Network centrality
Network centrality is an index of the tendency for some nodes to exist at the core of the
structure while others reside along the periphery. Brand-usage nodes in the center may be
more important, may play specific roles relative to the surrounding nodes, may identify
leader brands along with their primary usage(s), or have other qualities that distinguish
them from the majority of nodes in the network. In the brand-usage market structure,
central nodes tend to account for more market share or are more frequently substituted or
K.B. Serota and M. Bhargava462
Figure
3.
Brand-usagenetwork
structure
fortheUScarrentalindustry.
Notes:Thefirsttwolettersofeach
label
indicatebrand.Thesize
ofthenodesymbolisproportional
tomarket
shareforthebrand-usagesituation.Background
shadingindicates
majorandminorsub-divisionsofthenetwork
structure;thefourmajordivisionsindicateusageclustersthat
arerelativelydistinct
from
each
other.
AV
-BA
AV
-BO
AV
-LA
AV
-LO
AV
-IR
HZ
-BA
HZ
-BO
HZ
-LA
HZ
-LO
NT-
BA
NT-
BO
NT-
LAN
T-LO
NT-
IR
BG
-BO
BG
-LO B
G-I
R
DL-
LA
DL-
LO
DL-
IRE
T-B
O
ET-
LOE
T-IR
TH
-BA T
H-B
O
TH
-LA
TH
-LO
BG
-BA
BG
-LA
AL-
BA
AL-
LA
AL-
IRDL-
BA
ET-
BA E
T-LA
TH
-IR
OT-
BA
OT-
BO
OT-
LA
OT-
LO
OT-
IR
HZ
-IR
AL-
BO
AL-
LO
DL-
BO
Isol
ates
:
Com
mon
Situ
atio
n
Bus
ines
s/A
irpo
rt (
BA
)
Leis
ure/
Air
port
(LA
)
Bus
ines
s/O
ther
Loc
atio
n (B
O)
Leis
ure/
Oth
er L
ocat
ion
(LO
)
Insu
ranc
e/R
epla
cem
ent (
IR)
Com
mon
Bra
nd
Diff
eren
t Bra
nd a
nd S
ituat
ion
Journal of Strategic Marketing 463
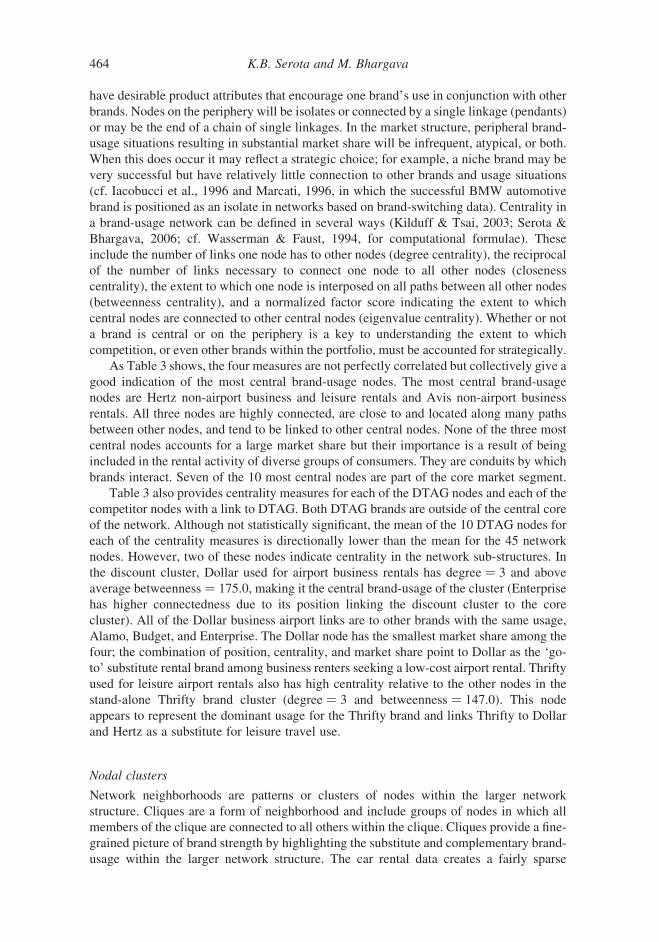
have desirable product attributes that encourage one brand’s use in conjunction with other
brands. Nodes on the periphery will be isolates or connected by a single linkage (pendants)
or may be the end of a chain of single linkages. In the market structure, peripheral brand-
usage situations resulting in substantial market share will be infrequent, atypical, or both.
When this does occur it may reflect a strategic choice; for example, a niche brand may be
very successful but have relatively little connection to other brands and usage situations
(cf. Iacobucci et al., 1996 and Marcati, 1996, in which the successful BMW automotive
brand is positioned as an isolate in networks based on brand-switching data). Centrality in
a brand-usage network can be defined in several ways (Kilduff & Tsai, 2003; Serota &
Bhargava, 2006; cf. Wasserman & Faust, 1994, for computational formulae). These
include the number of links one node has to other nodes (degree centrality), the reciprocal
of the number of links necessary to connect one node to all other nodes (closeness
centrality), the extent to which one node is interposed on all paths between all other nodes
(betweenness centrality), and a normalized factor score indicating the extent to which
central nodes are connected to other central nodes (eigenvalue centrality). Whether or not
a brand is central or on the periphery is a key to understanding the extent to which
competition, or even other brands within the portfolio, must be accounted for strategically.
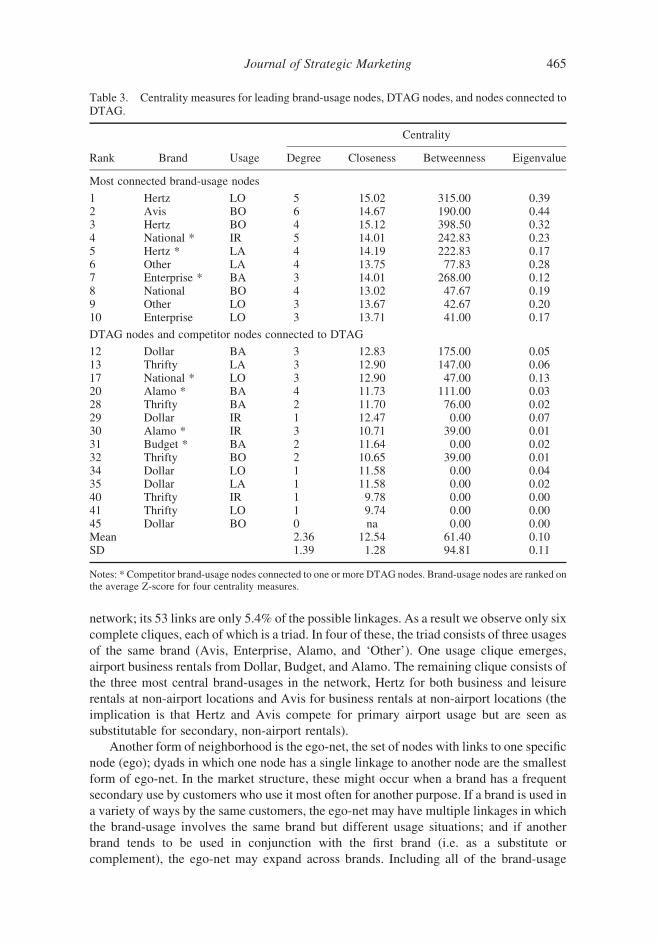
As Table 3 shows, the four measures are not perfectly correlated but collectively give a
good indication of the most central brand-usage nodes. The most central brand-usage
nodes are Hertz non-airport business and leisure rentals and Avis non-airport business
rentals. All three nodes are highly connected, are close to and located along many paths
between other nodes, and tend to be linked to other central nodes. None of the three most
central nodes accounts for a large market share but their importance is a result of being
included in the rental activity of diverse groups of consumers. They are conduits by which
brands interact. Seven of the 10 most central nodes are part of the core market segment.
Table 3 also provides centrality measures for each of the DTAG nodes and each of the
competitor nodes with a link to DTAG. Both DTAG brands are outside of the central core
of the network. Although not statistically significant, the mean of the 10 DTAG nodes for
each of the centrality measures is directionally lower than the mean for the 45 network
nodes. However, two of these nodes indicate centrality in the network sub-structures. In
the discount cluster, Dollar used for airport business rentals has degree ¼ 3 and above
average betweenness ¼ 175.0, making it the central brand-usage of the cluster (Enterprise
has higher connectedness due to its position linking the discount cluster to the core
cluster). All of the Dollar business airport links are to other brands with the same usage,
Alamo, Budget, and Enterprise. The Dollar node has the smallest market share among the
four; the combination of position, centrality, and market share point to Dollar as the ‘go-
to’ substitute rental brand among business renters seeking a low-cost airport rental. Thrifty
used for leisure airport rentals also has high centrality relative to the other nodes in the
stand-alone Thrifty brand cluster (degree ¼ 3 and betweenness ¼ 147.0). This node
appears to represent the dominant usage for the Thrifty brand and links Thrifty to Dollar
and Hertz as a substitute for leisure travel use.
Nodal clusters
Network neighborhoods are patterns or clusters of nodes within the larger network
structure. Cliques are a form of neighborhood and include groups of nodes in which all
members of the clique are connected to all others within the clique. Cliques provide a fine-
grained picture of brand strength by highlighting the substitute and complementary brand-
usage within the larger network structure. The car rental data creates a fairly sparse
K.B. Serota and M. Bhargava464
network; its 53 links are only 5.4% of the possible linkages. As a result we observe only six
complete cliques, each of which is a triad. In four of these, the triad consists of three usages
of the same brand (Avis, Enterprise, Alamo, and ‘Other’). One usage clique emerges,
airport business rentals from Dollar, Budget, and Alamo. The remaining clique consists of
the three most central brand-usages in the network, Hertz for both business and leisure
rentals at non-airport locations and Avis for business rentals at non-airport locations (the
implication is that Hertz and Avis compete for primary airport usage but are seen as
substitutable for secondary, non-airport rentals).
Another form of neighborhood is the ego-net, the set of nodes with links to one specific
node (ego); dyads in which one node has a single linkage to another node are the smallest
form of ego-net. In the market structure, these might occur when a brand has a frequent
secondary use by customers who use it most often for another purpose. If a brand is used in
a variety of ways by the same customers, the ego-net may have multiple linkages in which
the brand-usage involves the same brand but different usage situations; and if another
brand tends to be used in conjunction with the first brand (i.e. as a substitute or
complement), the ego-net may expand across brands. Including all of the brand-usage
Table 3. Centrality measures for leading brand-usage nodes, DTAG nodes, and nodes connected toDTAG.
Centrality
Rank Brand Usage Degree Closeness Betweenness Eigenvalue
Most connected brand-usage nodes
1 Hertz LO 5 15.02 315.00 0.392 Avis BO 6 14.67 190.00 0.443 Hertz BO 4 15.12 398.50 0.324 National * IR 5 14.01 242.83 0.235 Hertz * LA 4 14.19 222.83 0.176 Other LA 4 13.75 77.83 0.287 Enterprise * BA 3 14.01 268.00 0.128 National BO 4 13.02 47.67 0.199 Other LO 3 13.67 42.67 0.2010 Enterprise LO 3 13.71 41.00 0.17
DTAG nodes and competitor nodes connected to DTAG
12 Dollar BA 3 12.83 175.00 0.0513 Thrifty LA 3 12.90 147.00 0.0617 National * LO 3 12.90 47.00 0.1320 Alamo * BA 4 11.73 111.00 0.0328 Thrifty BA 2 11.70 76.00 0.0229 Dollar IR 1 12.47 0.00 0.0730 Alamo * IR 3 10.71 39.00 0.0131 Budget * BA 2 11.64 0.00 0.0232 Thrifty BO 2 10.65 39.00 0.0134 Dollar LO 1 11.58 0.00 0.0435 Dollar LA 1 11.58 0.00 0.0240 Thrifty IR 1 9.78 0.00 0.0041 Thrifty LO 1 9.74 0.00 0.0045 Dollar BO 0 na 0.00 0.00Mean 2.36 12.54 61.40 0.10SD 1.39 1.28 94.81 0.11
Notes: * Competitor brand-usage nodes connected to one or more DTAG nodes. Brand-usage nodes are ranked onthe average Z-score for four centrality measures.
Journal of Strategic Marketing 465
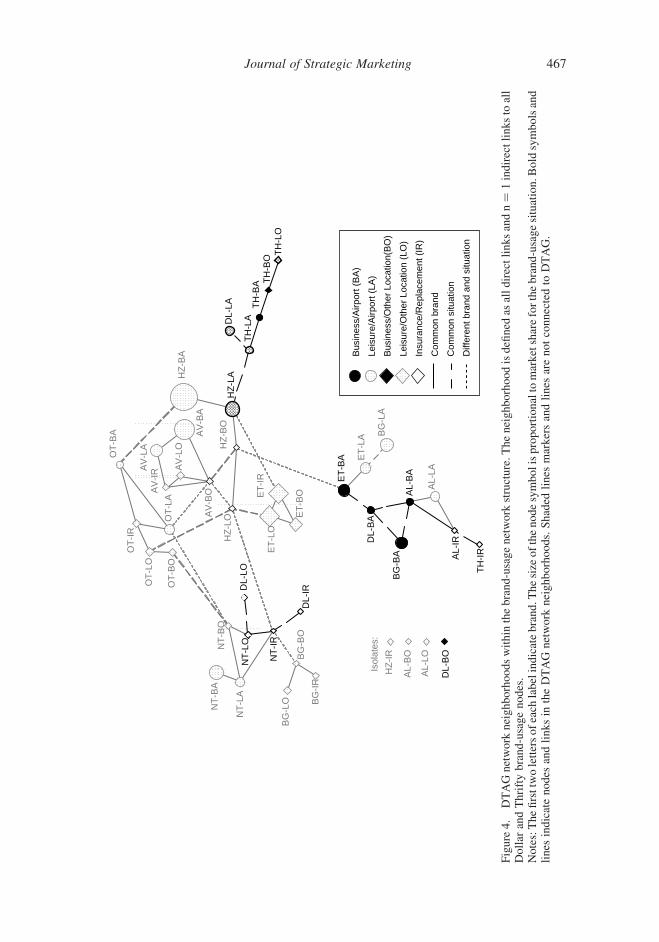
linkages for a single brand is another way to portray the network neighborhood. This
can result in meaningful patterns of competitive interaction. It may also result in
multiple neighborhoods when the network is analyzed at the brand, or even at the firm
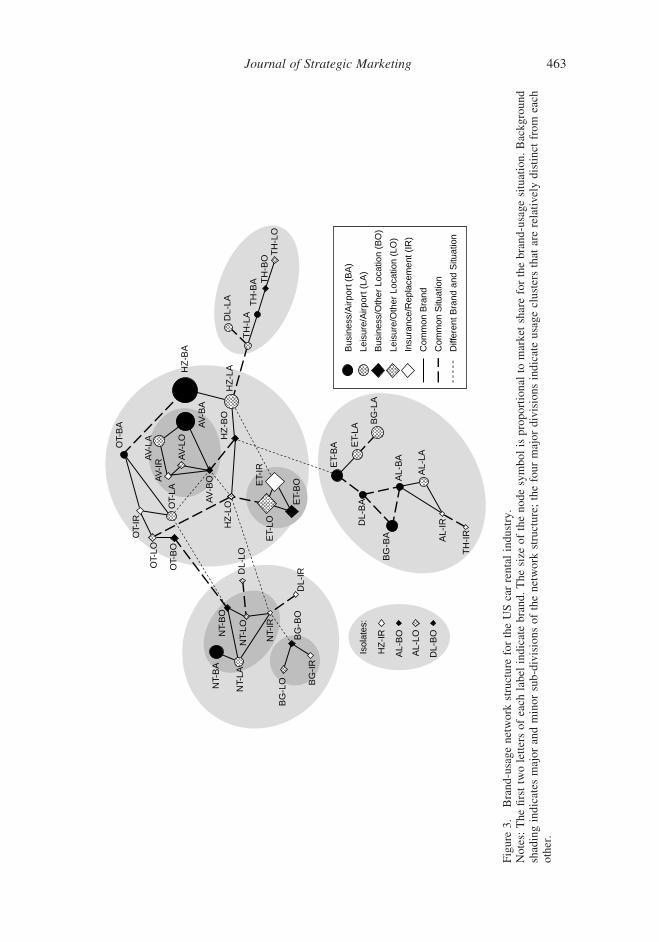
level. Figure 4 shows DTAG, which includes all uses of the Dollar and Thrifty brands,
consisting of three separate components or neighborhoods within the car rental market
structure (and one isolate). One component consists mainly of multiple usages of the
Thrifty brand; a second component consists primarily of Dollar linked to other low-price
brands competing for airport rentals, and the third group shows Dollar linked (and
competing with) National at non-airport locations.
Whether or not the identified DTAG linkages are the desired linkages is an issue for
DTAGmanagement; the structure informs brand management that the two-brand portfolio
has three key positions based on customer usage. Customer usage indicates that the Dollar
brand serves primarily as an alternate or substitution brand; the specific competitors
depend on the usage situation. These same data show that Thrifty customers use the brand
for multiple purposes; the pattern suggests a small but brand loyal customer base.
Demand-based brand architecture
The network examination of structural relationships and key diagnostics shows far more
complexity than might be found in the traditional organizational chart of brands. If the
network is reduced to the individual brands, the US car rental industry appears dominated
by companies employing a house of brands portfolio strategy (the exception at the time
these data were collected was Enterprise Rent-A-Car, which was a stand alone brand that
applied the company brand to all component products; Enterprise has subsequently
become a house of brands that includes National, Alamo, and the WeCar car sharing
service). Applying the brand-usage structure, the brand names may be the same, but the
brands fulfill different roles and interact with different competitive sets in ways that may
not be apparent from the brand-level definition of structure. Viewed as a house of brands,
DTAG appears to be a very simple structure with two poorly articulated brands that share a
single strategy. As part of a larger network that is defined on the basis of usage as well as
branding, the multi-brand strategy has logical differences (we make no judgment about the
correctness of this approach; but the network analysis demonstrates that it exists).
Visualizing the DTAG nodes and related network nodes as a hierarchy of sub-brands
shows clearly that the two brands are used differently, and in ways that are defined by the
competitor brand in each usage situation (Figure 5). Dollar, when considered in
conjunction with each of its usage situations, is positioned to provide a low-cost substitute
for other, higher volume brands. In general, customers who rent from Dollar for one
purpose do not rent from this brand for other purposes. Dollar has a small market share and
is positioned to be an available alternative when the preferred brand is not available in the
desired location, is out of cars to rent, or when Dollar’s rates are more attractive. The
apparent strategy is to be inexpensive and available.
Supply side auditing indicates that like Dollar, Thrifty also follows a low-cost strategy.
However, brand-usage data indicate that the brand is far more cohesive; Thrifty car renters
are likely to use Thrifty for multiple purposes. If not doing so already, DTAG brand
management could rationalize this brand architecture by focusing on the Dollar brand
purely from a price-advantage perspective while developing Thrifty as the strategic center
of the firm, combining favorable pricing with loyalty-building actions to achieve best-
cost/value positioning. This strategy is augmented by competitive positioning. Thrifty has
K.B. Serota and M. Bhargava466
Figure
4.
DTAGnetwork
neighborhoodswithin
thebrand-usagenetwork
structure.Theneighborhoodisdefined
asalldirectlinksandn¼
1indirectlinksto
all
Dollar
andThriftybrand-usagenodes.
Notes:Thefirsttwolettersofeach
labelindicatebrand.T
hesize
ofthenodesymbolisproportionaltomarketshareforthebrand-usagesituation.B
oldsymbolsand
lines
indicatenodes
andlinksin
theDTAG
network
neighborhoods.Shaded
lines
markersandlines
arenotconnectedto
DTAG.
AV
-BA
AV
-BO
AV
-LA
AV
-LO
AV
-IR
HZ
-BA
HZ
-BO
HZ
-LA
HZ
-LO
NT
-BA
NT
-BO
NT
-LA
NT
-LO
NT
-IR
BG
-BO
BG
-LO B
G-I
R
DL-
LA
DL-
LO
DL-
IRE
T-B
O
ET
-LO
ET
-IR
TH
-BA T
H-B
O
TH
-LA
TH
-LO
BG
-BA
BG
-LA
AL-
BA
AL-
LA
AL-
IRDL-
BA
ET
-BA E
T-L
A
TH
-IR
OT
-BA
OT
-BO
OT
-LA
OT
-LO
OT
-IR
HZ
-IR
AL-
BO
AL-
LO
DL-
BO
Isol
ates
:
Com
mon
situ
atio
n
Bus
ines
s/A
irpor
t (B
A)
Leis
ure/
Airp
ort (
LA)
Bus
ines
s/O
ther
Loc
atio
n(B
O)
Leis
ure/
Oth
er L
ocat
ion
(LO
)
Insu
ranc
e/R
epla
cem
ent (
IR)
Com
mon
bra
nd
Diff
eren
t bra
nd a
nd s
ituat
ion
Journal of Strategic Marketing 467
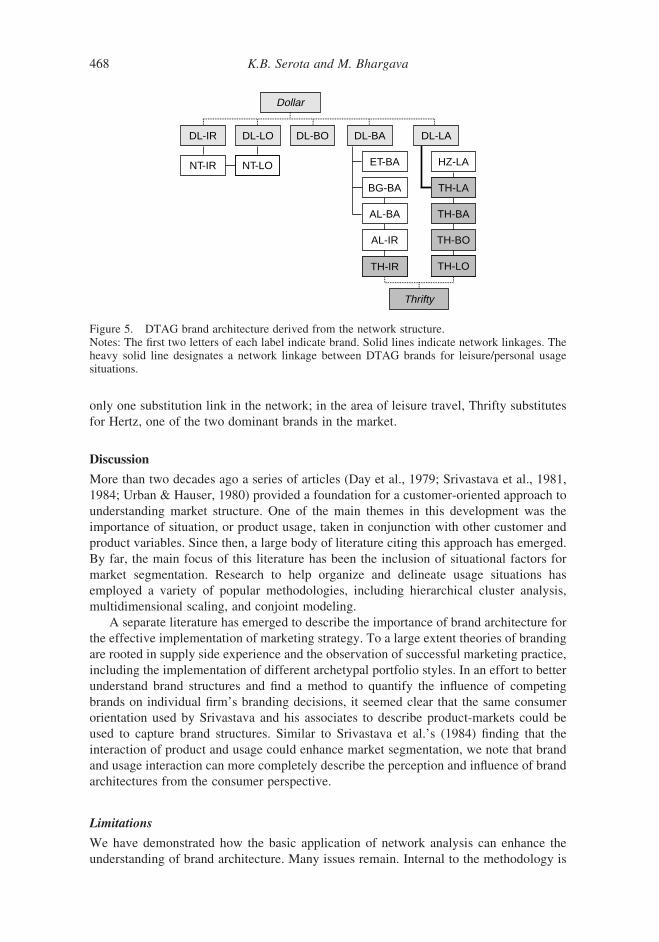
only one substitution link in the network; in the area of leisure travel, Thrifty substitutes
for Hertz, one of the two dominant brands in the market.
Discussion
More than two decades ago a series of articles (Day et al., 1979; Srivastava et al., 1981,
1984; Urban & Hauser, 1980) provided a foundation for a customer-oriented approach to
understanding market structure. One of the main themes in this development was the
importance of situation, or product usage, taken in conjunction with other customer and
product variables. Since then, a large body of literature citing this approach has emerged.
By far, the main focus of this literature has been the inclusion of situational factors for
market segmentation. Research to help organize and delineate usage situations has
employed a variety of popular methodologies, including hierarchical cluster analysis,
multidimensional scaling, and conjoint modeling.
A separate literature has emerged to describe the importance of brand architecture for
the effective implementation of marketing strategy. To a large extent theories of branding
are rooted in supply side experience and the observation of successful marketing practice,
including the implementation of different archetypal portfolio styles. In an effort to better
understand brand structures and find a method to quantify the influence of competing
brands on individual firm’s branding decisions, it seemed clear that the same consumer
orientation used by Srivastava and his associates to describe product-markets could be
used to capture brand structures. Similar to Srivastava et al.’s (1984) finding that the
interaction of product and usage could enhance market segmentation, we note that brand
and usage interaction can more completely describe the perception and influence of brand
architectures from the consumer perspective.
Limitations
We have demonstrated how the basic application of network analysis can enhance the
understanding of brand architecture. Many issues remain. Internal to the methodology is
NT-IR HZ-LA
AL-IR
AL-BA
BG-BA
ET-BA
TH-BO
TH-BA
Thrifty
Dollar
TH-LOTH-IR
DL-BODL-LODL-IR DL-BA DL-LA
TH-LA
NT-LO
Figure 5. DTAG brand architecture derived from the network structure.Notes: The first two letters of each label indicate brand. Solid lines indicate network linkages. Theheavy solid line designates a network linkage between DTAG brands for leisure/personal usagesituations.
K.B. Serota and M. Bhargava468
the exploration of different data and analytic forms. Our approach focuses on the presence
or absence of links, but network techniques can account for the value of link strength and
the presence of asymmetrical links (e.g. a primary brand’s links to subordinate or ‘backup’
brands). By observing the order in which purchase events occur, measuring brand
preferences, and identifying primary usage needs it would be possible to more
conclusively establish dominance in each of the brand-usage situations. Furthermore, we
have only hinted at the dynamic character of networks. We can hypothesize about how
markets change as brands erode, new brands are created, and mergers and acquisitions
alter brand portfolios. While the present article is illustrative, these hypotheses need to be
tested. Measuring causal influences, or inducing specific marketing actions, and observing
change in the network structure is the sine qua non for those in brand management to
accept the brand-usage conceptualization of brand architecture.
Future research should also look at traditional metrics in conjunction with brand-
usage. Measures of brand awareness can be constrained by usage situations in order to
better understand the formation of competitive sets. Measures of brand imagery, purchase
reasons, and evaluative priorities can also be constrained to individual usage situations.
Purchase intentions can provide a dependent measure for predicting future activity as a
consequence of individual usage behaviors.
Methodologically, it may be possible to refine brand-usage networks by making
different choices among the plethora of network techniques. As we noted in the
description of our analysis for this study, we chose to use correlations as our measure of
proximity and as the basis for dichotomizing the data and identifying structural linkages.
While the approach is parsimonious, we need to ask whether or not information would
have been preserved if we had chosen to use the covariance matrix rather than the
correlation matrix. These kinds of issues have been explored in depth in the application of
networks to social relationships but need to be revisited in the context of market structure
and brand architecture.
Conclusion
To capture brand architecture using a demand side approach, we wanted a technique that
would preserve and display the complexity of brand and usage interactions rather than
summarize or categorize them according to the methods employed by most segmentation
procedures. Iacobucci (1996) and her colleagues demonstrated the value of network analysis
to analyze consumer behavior in their examination of brand switching data. Furthermore,
they showed that the network approach was not only complexity-preserving; it also has the
capability to be adaptive and dynamic. Beyond this initial exploration of marketing
networks, the broader fields of physical and social network analysis provide an entire body of
structural constructs which can be meaningfully extended to the analysis of brand, situation,
and consumer interactions. While the previous applications of network analysis to market
structure have broadened the marketing lexicon, the application of network analysis to
brands in multiple usage situations suggests a rich new approach to quantifying brand
interactions, enhancing marketing strategy, and managing brand architecture.
This article reconceptualizes brand architecture as the set of brand and usage
relationships that can be derived by examining consumer purchase behavior. A clear
extension of this work would be to examine the changes in the brand architecture over time
to capture the effects of endogenous variables and identify exogenous influences. From this
perspective, brand architecture provides insights about the resilience of brands as well as
their flexibility when used in multiple situations. The categorization of brands in Figure 1
Journal of Strategic Marketing 469

provides a useful starting point. Clearly structural relationships among brand-usage situa-
tionswill migrate over the four cells, some because of repositioning and resource allocation,
others because of competitive situations or changing consumer needs. Such analyses will
not only be useful to marketing managers but also provide a bridge to addressing the
capabilities that strong brands represent. Used this way, brand-usage networks provide a
framework for making brand architecture quantitative, consumer-driven, dynamic, and
actionable.
Acknowledgements
The authors gratefully acknowledge Vanguard Car Rental USA and John MacDonald, VicePresident of Marketing, for permission to use and report data collected on their behalf by the firstauthor. The authors wish to thank colleagues George Barnett, Eddie Chang, James Danowski, andSerge Kruk for their useful suggestions and editor Carolyn Strong and two anonymous reviewerswhose valuable comments contributed focus and clarity to this work.
Note
1. There are exceptions. In some industries, especially package goods, where consumers makefrequent andmultiple purchases, triadic and higher order interactions can be common. For example,when people shop for cereal, certain complex patterns of brand-usage patterns might be expected:Quaker Oats formom and dad, Kellogg’s Frosted Flakes for the kids, andGeneralMills Rice, Corn,andWheat Chex tomakeChexmix for a party. At least among themost popular brands, itmight notbe unusual to find these combinations or minor variations (structural equivalents) recurring. Inindustries where purchasing is less frequent, such as appliances and other consumer durables,triadic and higher order interactions might be rare or, difficult to observe.
References
Aaker, D.A. (1996). Building strong brands. New York: Free Press.Aaker, D.A. (2004). Brand portfolio strategy. New York: Free Press.Aaker, D.A., & Joachimsthaler, E. (2000a). Brand leadership. New York: Free Press.Aaker, D.A., & Joachimsthaler, E. (2000b). The brand relationship spectrum: The key to the brand
architecture challenge. California Management Review, 42(4), 8–23.Bagozzi, R.P. (1975). Marketing as exchange. Journal of Marketing, 39(4), 32–39.Balmer, J.M.T. (1998). Corporate identity and the advent of corporate marketing. Journal of
Marketing Management, 14, 963–996.Barabasi, A.-L. (2003). Linked. New York: Plume.Borgatti, S.P., Everett, M.G., & Freeman, L.C. (2002). UCINET for Windows: Software for social
network analysis. Cambridge, MA: Analytic Technologies.Burt, R.S., & Janicik, G.A. (1996). Social contagion and social structure. In D. Iacobucci (Ed.),
Networks in marketing (pp. 32–49). Thousand Oaks, CA: Sage.Dabic, M., Schweiger, G., & Strebinger, A. (2004, June). Brand architecture: A view of practitioners.
Paper presented at the 2004 Marketing Science Conference, Rotterdam, The Netherlands.Day, G.S., Shocker, A.D., & Srivastava, R.K. (1979). Customer-oriented approaches to identifying
product-markets. Journal of Marketing, 43(Fall), 8–19.DTGHistory (2008).Down the street and around the world. Retrieved October 10, 2009, from http://
www.dtag.com/phoenix.zhtml?c¼71946&p¼irol-homeEverett, M.G., Boyd, J.P., & Borgatti, S.P. (1990). Ego-centered and local roles: A graph theoretical
approach. Journal of Mathematical Sociology, 15, 163–172.Fournier, S. (1998). Consumers and their brands: Developing relationship theory in consumer
research. Journal of Consumer Research, 24, 343–373.Freeman, L.C. (2004). The development of social network analysis. Vancouver, BC: Empirical Press.Granovetter, M. (1973). The strength of weak ties. American Journal of Sociology, 6, 1360–1380.Grant, R.M. (2010). Contemporary strategy analysis (7th ed.). Hoboken, NJ: Wiley.Gulati, R., Nohria, N., & Zaheer, A. (2000). Strategic networks. Strategic Management Journal, 21,
203–215.
K.B. Serota and M. Bhargava470
Henderson, G.R., Iacobucci, D., & Calder, B.J. (1998). Brand diagnostics: Mapping brand effectsusing consumer associative networks. European Journal of Operational Research, 111, 306–327.
Iacobucci, D. (Ed.). (1996). Networks in marketing. Thousand Oaks, CA: Sage.Iacobucci, D., Henderson, G., Marcati, A., & Chang, J.E. (1996). Networks analyses and brand-
switching behavior. In D. Iacobucci (Ed.), Networks in marketing (pp. 221–274). ThousandOaks, CA: Sage.
Kapferer, J.N. (1992). Strategic brand management: New approaches to creating and evaluatingbrand equity. London: Kogan Page.
Keller, K.L. (2008). Strategic brand management (3rd ed.). Upper Saddle, NJ: Prentice Hall.Kilduff, M., & Tsai, W. (2003). Social networks and organizations. London: Sage.Kumar, N. (2003). Kill a brand, keep a customer. Harvard Business Review, 81(12), 86–95, 126.Leitch, S., & Richardson, N. (2003). Corporate branding in the new economy. European Journal of
Marketing, 37, 1065–1079.Luce, R.D., & Perry, A.D. (1949). A method of matrix analysis of group structure. Psychometrika,
14, 95–116.Madden, T.J., Fehle, F., & Fournier, S. (2006). Brand matter: An empirical demonstration of the
creation of shareholder value through branding. Journal of the Academy of Marketing Science,34, 224–235.
Marcati, A. (1996). Brand switching and competition. In D. Iacobucci (Ed.), Networks in marketing(pp. 275–300). Thousand Oaks, CA: Sage.
Martin, C.L., & Clark, T. (1996). Networks of customer-to-customer relationships in marketing. InD. Iacobucci (Ed.), Networks in marketing (pp. 342–366). Thousand Oaks, CA: Sage.
McGee, J., Thomas, H., & Pruett, M. (1995). Strategic groups and the analysis of market structureand industry dynamics. British Journal of Management, 6, 257–270.
Morgan, N.A., & Leotte do Rego, L. (2006). Brand portfolio strategy and firm performance(Working Paper No. 06–101). Boston, MA: Marketing Sciences Institute.
Nalebuff, B.J., & Brandenburger, A.M. (1997). Co-opetition: Competitive and cooperative businessstrategies for the digital economy. Strategy & Leadership, 25(6), 28–35.
Petromilli, M., Morrison, D., & Million, M. (2002). Brand architecture: Building brand portfoliovalue. Strategy & Leadership, 30(5), 22–28.
Porter, M.E. (1980). Competitive strategy: Techniques for analyzing industries and competitors.New York: Free Press.
Rajagopal, & Sanchez, R. (2004). Conceptual analysis of brand architecture and relationships withinproduct categories. Journal of Brand Management, 11, 233–247.
Rao, V.R., Agarwal, M.K., & Dahlhoff, D. (2004). How is manifest branding strategy related to theintangible value of a corporation? Journal of Marketing, 68, 126–141.
Reger, R.K., & Huff, A.S. (1993). Strategic group: A cognitive perspective. Strategic ManagementJournal, 14, 103–124.
Salinas, G., & Ambler, T. (2008). A taxonomy of brand valuation methodologies: How differentkinds of methodologies can help to answer different kinds of questions (Working Paper 08–204).Boston, MA: Marketing Sciences Institute.
Serota, K.B., & Bhargava, M. (2006, June). Using network analysis to examine brand portfoliostrategies. Paper presented at the INFORMS Marketing Science Conference, Pittsburgh, PA.
Shocker, A.D., Bayus, B.L., & Kim, N. (2004). Product complements and substitutes in the realworld: The relevance of ‘other products’. Journal of Marketing, 68(January), 28–40.
Simmons, C.J., Bickart, B.A., & Buchanan, L. (2000). Leveraging equity across the brand portfolio.Marketing Letters, 11, 210–220.
Srivastava, R.K., Alpert, M.I., & Shocker, A.D. (1984). A customer-oriented approach fordetermining market structures. Journal of Marketing, 48(Spring), 32–45.
Srivastava, R.K., Leone, R.P., & Shocker, A.D. (1981). Market structure analysis: Hierarchicalclustering of product based on substitution-in-use. Journal of Marketing, 45(Summer), 38–48.
Strebringer, A. (2003). Strategic brand concept and brand architecture strategy: A proposed model.Advances in Consumer Research, 31, 656–664.
Urban, G.L., & Hauser, J.R. (1980). Design and marketing of new products. Englewood Cliffs, NJ:Prentice Hall.
Wasserman, S., & Faust, K. (1994). Social network analysis: Methods and applications. New York:Cambridge University Press.
Journal of Strategic Marketing 471