Embed Size (px)
Citation preview
MARKABLES 127
Trademark Comparables AG Bahnhofstrasse 48 CH-6430 Schwyz Switzerland +41 (41) 810 28 83 [email protected]
Brand Value Rankings – Are They Blessing or Curse?
Findings of a Comparative Analysis of Brand Values
White Paper #2
Schwyz, October 19, 2015
MARKABLES 227
Trademark Comparables AG Bahnhofstrasse 48 CH-6430 Schwyz Switzerland +41 (41) 810 28 83 [email protected]
Content
I. Preface II. Update of the comparative study based on 162 cases III. Arguments brought forward against purchase
accounting and accountants IV. Justifications of the brand value rankings V. Ramifications and conclusions Appendix - List of 141 brands included in the analysis
3
5
11
15
21
23
MARKABLES 327
Trademark Comparables AG Bahnhofstrasse 48 CH-6430 Schwyz Switzerland +41 (41) 810 28 83 [email protected]
Part I. Preface
Back in April 2015 we released a white paper titled “How accurate are the brand value rankings?”.1 The paper discussed the findings of a research on the accuracy of the various brand value league tables compiled and published by three specialized brand valuation consultancies - Interbrand, Millward Brown and Brand Finance. We found an average difference of +276% (overestimation) between brand values published in one of the league tables, and values of the same brands when they were acquired in a business combination. We also reported on differences between the three valuation consultancies, and between different industries. The research was based on a total of 82 data pairs.
The white paper created reactions from the firms in question, and some buzz from in the interested press and public, most notably the column of award-winning columnist and branding expert Mark Ritson in Marketing Week titled “What is the point of brand valuations if those doing the valuing are so off target?”2
Another noteworthy comment was written by Trevor Little, editor of World Trademark Review, a renowned magazine which occasionally publishes league tables and surveys its readers about their use of brand valuations:
“It’s important to separate the two central issues that are tackled in the white paper – brand valuation techniques and the publishing of ranking tables – as they are intrinsically different in nature and application.
For instance, brand valuation companies themselves would acknowledge that the values on ranking tables may be very different to the figure that is attached to a brand when a full valuation is undertaken or a transaction realised (so while a valuation company may say a brand is worth ‘X’ in a table, it may say it is worth ‘Y’ once the company commissions a full valuation based on an agreed formula and with resulting access to inside information). Ultimately, brand valuation rankings are not based on the same deep dive research that is undertaken when commissioned and are certainly not designed to be relied upon in transactions. Rather, they are designed to maximise awareness of the valuation company and appeal to journalists looking for brand-related content – and there is nothing wrong with that. The bigger issue is where such differing valuations on the respective lists cause confusion.” 3
Trevor Little clearly addresses the superficiality that is necessarily embedded in the ranking tables. He concludes that brand values on league tables may be very different from fully commissioned valuations, and that the brand valuation companies themselves would acknowledge such difference. On the other side, they create awareness for the valuation companies, and provide brand-related content to a large global audience. So, is there really nothing wrong with the rankings?
Blessing or curse? Encouraged by the extensive feedback to the April paper, MARKABLES extended its research to find out more about what the brand rankings are – a blessing or a curse? As of October, the number of brands in the research sample increased from 68 to 141, and the number of data pairs for comparison nearly doubled, from 82 to 162.4 We expect this number to increase in the future by ~25 cases every year. In this second paper we provide additional evidence and arguments that the league table approach does not match transactional values, and why. The results from this enlarged sample fully confirm the earlier findings, and there is no more room left to
1 For a better understanding of this paper it is helpful to read the forerunner version which is downloadable at
http://www.markables.net/how_accurate_are_brand_valuations 2 http://www.marketingweek.com/2015/04/22/what-is-the-point-of-brand-valuations-if-those-doing-the-valuing-are-so-off-
target/ 3 Trevor Little, New research sparks war of words on brand valuation approaches, see
http://www.worldtrademarkreview.com/Blog/detail.aspx?g=2a8ecb47-6f42-4339-8042-a82ae4264e71 4 A full list of all brands is available in the appendix beginning on page 23 of this paper.

MARKABLES 427
Trademark Comparables AG Bahnhofstrasse 48 CH-6430 Schwyz Switzerland +41 (41) 810 28 83 [email protected]
disqualify them as random results. It is time not only to take these findings seriously, but also to take action in order to progress and improve.
As a general remark, we would like to point out that the findings presented below relate only to valuations that are published in league tables. Thus, any criticism is related thereto. Such valuations are performed without client engagement and budget, without access to internal data, and without a specific purpose of the valuation. They are “pro bono”, or “pro PR”. We are positive that the brand valuation consultancies can do much better, under different circumstances and under a clear client mandate.
MARKABLES 527
Trademark Comparables AG Bahnhofstrasse 48 CH-6430 Schwyz Switzerland +41 (41) 810 28 83 [email protected]
Part II. Update of the comparative study based on 162 cases
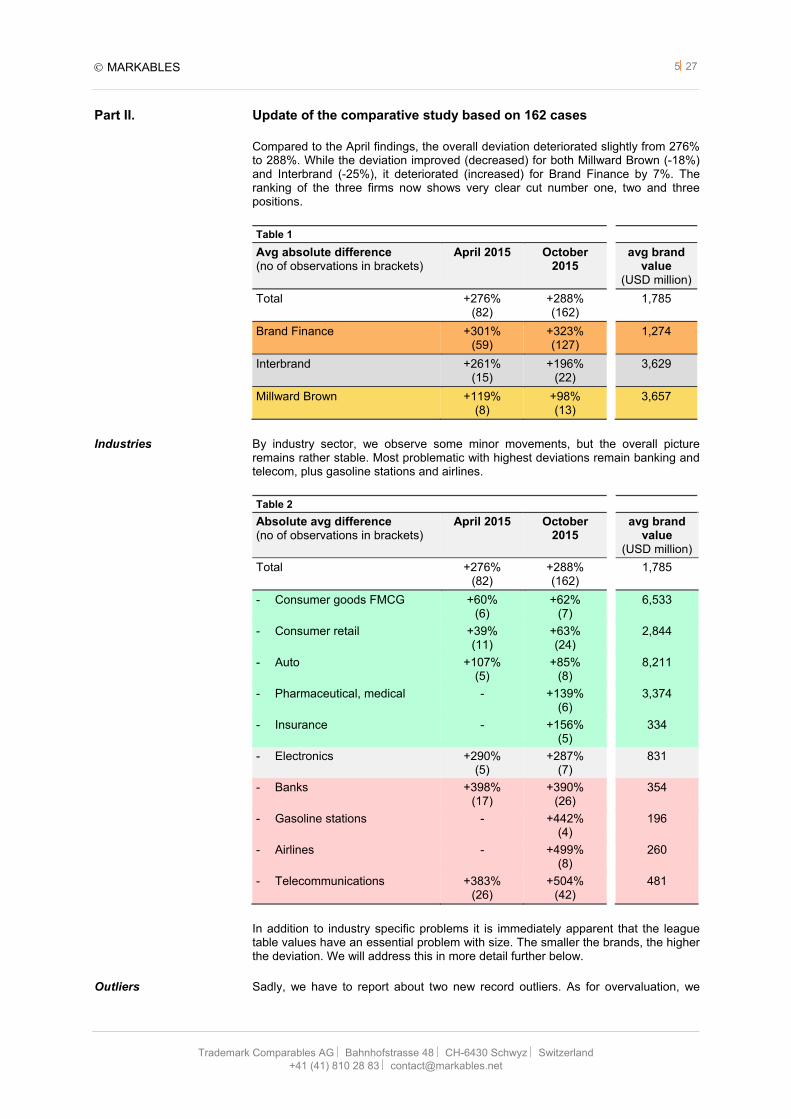
Compared to the April findings, the overall deviation deteriorated slightly from 276% to 288%. While the deviation improved (decreased) for both Millward Brown (-18%) and Interbrand (-25%), it deteriorated (increased) for Brand Finance by 7%. The ranking of the three firms now shows very clear cut number one, two and three positions.
Table 1
Avg absolute difference(no of observations in brackets)
April 2015 October 2015
avg brand value
(USD million)
Total +276% (82)
+288% (162)
1,785
Brand Finance +301% (59)
+323% (127)
1,274
Interbrand +261% (15)
+196% (22)
3,629
Millward Brown +119% (8)
+98% (13)
3,657
Industries By industry sector, we observe some minor movements, but the overall picture remains rather stable. Most problematic with highest deviations remain banking and telecom, plus gasoline stations and airlines.
Table 2 Absolute avg difference(no of observations in brackets)
April 2015 October 2015
avg brand value
(USD million)
Total +276% (82)
+288% (162)
1,785
- Consumer goods FMCG +60% (6)
+62% (7)
6,533
- Consumer retail +39% (11)
+63% (24)
2,844
- Auto +107% (5)
+85% (8)
8,211
- Pharmaceutical, medical - +139% (6)
3,374
- Insurance - +156% (5)
334
- Electronics +290% (5)
+287% (7)
831
- Banks +398% (17)
+390% (26)
354
- Gasoline stations - +442% (4)
196
- Airlines - +499% (8)
260
- Telecommunications +383% (26)
+504% (42)
481
In addition to industry specific problems it is immediately apparent that the league table values have an essential problem with size. The smaller the brands, the higher the deviation. We will address this in more detail further below.
Outliers Sadly, we have to report about two new record outliers. As for overvaluation, we
MARKABLES 627
Trademark Comparables AG Bahnhofstrasse 48 CH-6430 Schwyz Switzerland +41 (41) 810 28 83 [email protected]
refer to the case of SureWest. SureWest is a local fixed line telecom and internet service provider in the areas of Sacramento and Kansas5 which was acquired in 2012 by Consolidated Communications Holding, Inc. for an enterprise value of US$ 551 million or 2.2x annual revenues. The SureWest trademark was valued at US$ 0.9 million. In the 2012 Telecoms 500 ranking of Brand Finance, SureWest assumed position 400 with a trademark value of US$ 65 million and an enterprise value of US$ 361 million. This is a factor of 72x more. Effectively, the new owner replaced the SureWest trademark by CCI two years after the acquisition.
As for undervaluation, we refer to the case of CTM, or Companhia de Telecomunicações de Macau, which was acquired by CITIC Telecom in 2013 for an enterprise value of US$ 1.36 billion, and a revenue multiple of 2.3x. CTM provides wireless, fixed line and broadband services in Macau. Its trademark was valued at US$ 106.6 In contrast, the CTM brand was valued in Brand Finance’s Telecom Operators 500 2014 at only US$ 14 million, but based on an enterprise value of US$ 62 million only.7 This is a factor of 7.6x less. The differences in both cases are hard to explain under professional standards.
Precision landings On the other (positive) side of the spectrum, we can also report some additions to the list of “precision landings”. Brand Finance nearly matched the values of Reuters in 2008 and Reebok in 2006, and Interbrand came very close in the case of Shoppers Drug Mart in Canada in 2014. Altogether, 15 cases in the sample (9%) are within a range of 20% of the reported transaction value.
Before we proceed, we have to talk mathematics and percentages. Assume the reference value was 100, and the two observed values A and B were 500 and 20. A is 400 more, and B is 80 less than 100. What is that in percentages or multiples? It is obvious that A is 500% or 5 times more. B however is 20% of 100, thus 80% less. But at the same time, B is 5 times smaller than 100. While the absolute difference between the two pairs is different (400 and 80), the factor is equal. The figures presented both above and in the April paper follow the percentage approach based on absolute differences. This approach understates negative valuations (undervaluations). For correctness and comparison, we will now switch from the percentage approach to the factor or multiple approach which treats both over- and undervaluations the same way.
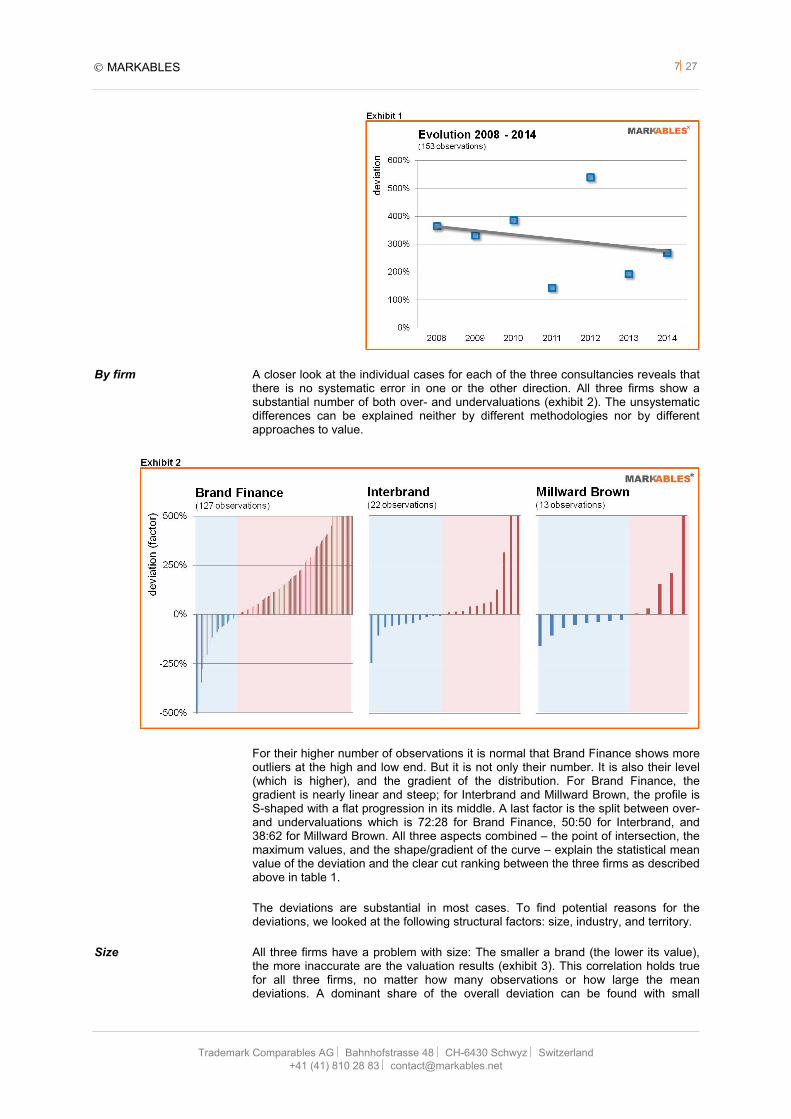
Time series Although the overall differences deteriorated slightly since last April, there is some hope for improvement. The trend line resulting from the yearly mean deviations suggests that the brand values from league tables converge to transaction values over time, although slowly (exhibit 1). The trend has and will have to cope with setbacks and there is still a very long way to go, but it seems to go into the right direction. Extrapolating the trend line into the future would mean that convergence will be reached in about 23 years. Quite long for all those who invest their money in brand transactions and brand-backed loans today.
It should be noted that the correlation of the trend line is not very strong. We observe higher deviations in the years 2008 to 2010 which could be a result of the financial crisis in 2008 and the subsequent dislocations of stock prices and enterprise values. Unfortunately, the figures in 2012 and 2014 are clear setbacks, and it will be interesting to see the 2015 figure which will come out next year.
5 SureWest used to be an ILEC business after the deregulation (incumbent local exchange carrier). 6 Adjusted from US$ 97.8 million for finite useful life of 27 years 7 Obviously, there seems to be an error in Brand Finance’s compilation of CTM’s enterprise value.
MARKABLES 727
Trademark Comparables AG Bahnhofstrasse 48 CH-6430 Schwyz Switzerland +41 (41) 810 28 83 [email protected]
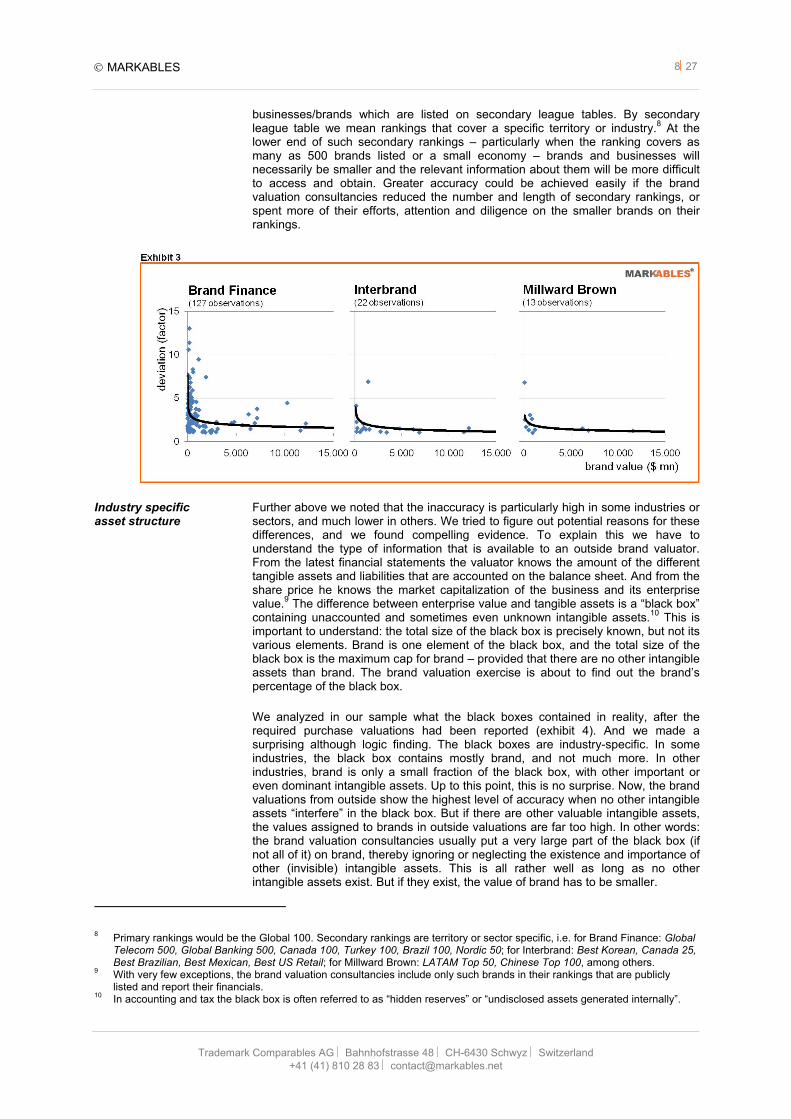
By firm A closer look at the individual cases for each of the three consultancies reveals that there is no systematic error in one or the other direction. All three firms show a substantial number of both over- and undervaluations (exhibit 2). The unsystematic differences can be explained neither by different methodologies nor by different approaches to value.
For their higher number of observations it is normal that Brand Finance shows more outliers at the high and low end. But it is not only their number. It is also their level (which is higher), and the gradient of the distribution. For Brand Finance, the gradient is nearly linear and steep; for Interbrand and Millward Brown, the profile is S-shaped with a flat progression in its middle. A last factor is the split between over- and undervaluations which is 72:28 for Brand Finance, 50:50 for Interbrand, and 38:62 for Millward Brown. All three aspects combined – the point of intersection, the maximum values, and the shape/gradient of the curve – explain the statistical mean value of the deviation and the clear cut ranking between the three firms as described above in table 1.
The deviations are substantial in most cases. To find potential reasons for the deviations, we looked at the following structural factors: size, industry, and territory.
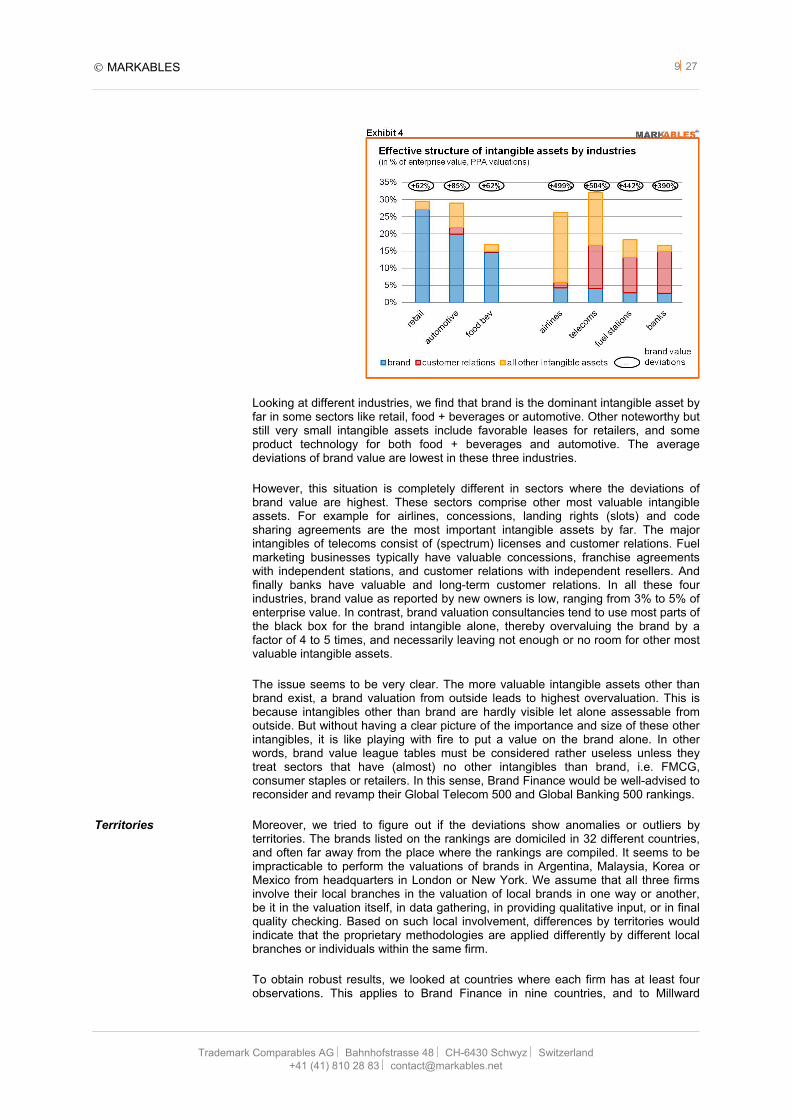
Size All three firms have a problem with size: The smaller a brand (the lower its value), the more inaccurate are the valuation results (exhibit 3). This correlation holds true for all three firms, no matter how many observations or how large the mean deviations. A dominant share of the overall deviation can be found with small
MARKABLES 827
Trademark Comparables AG Bahnhofstrasse 48 CH-6430 Schwyz Switzerland +41 (41) 810 28 83 [email protected]
businesses/brands which are listed on secondary league tables. By secondary league table we mean rankings that cover a specific territory or industry.8 At the lower end of such secondary rankings – particularly when the ranking covers as many as 500 brands listed or a small economy – brands and businesses will necessarily be smaller and the relevant information about them will be more difficult to access and obtain. Greater accuracy could be achieved easily if the brand valuation consultancies reduced the number and length of secondary rankings, or spent more of their efforts, attention and diligence on the smaller brands on their rankings.
Industry specific asset structure
Further above we noted that the inaccuracy is particularly high in some industries or sectors, and much lower in others. We tried to figure out potential reasons for these differences, and we found compelling evidence. To explain this we have to understand the type of information that is available to an outside brand valuator. From the latest financial statements the valuator knows the amount of the different tangible assets and liabilities that are accounted on the balance sheet. And from the share price he knows the market capitalization of the business and its enterprise value.9 The difference between enterprise value and tangible assets is a “black box” containing unaccounted and sometimes even unknown intangible assets.10 This is important to understand: the total size of the black box is precisely known, but not its various elements. Brand is one element of the black box, and the total size of the black box is the maximum cap for brand – provided that there are no other intangible assets than brand. The brand valuation exercise is about to find out the brand’s percentage of the black box.
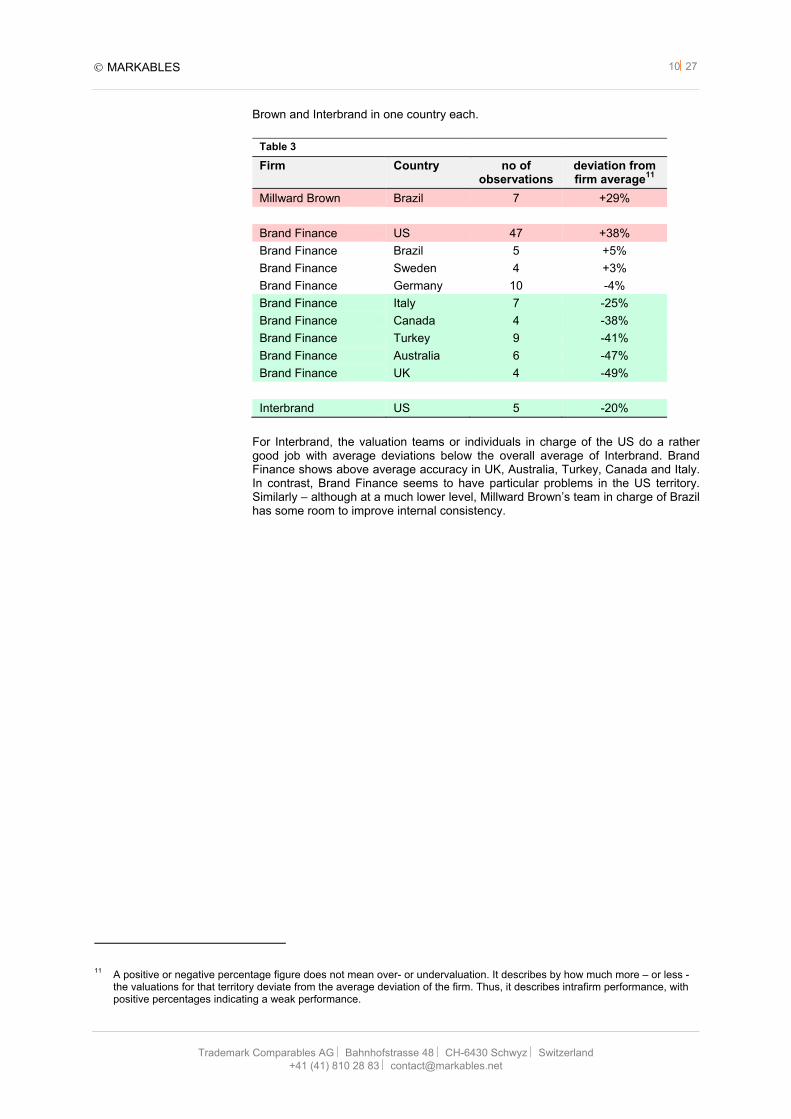
We analyzed in our sample what the black boxes contained in reality, after the required purchase valuations had been reported (exhibit 4). And we made a surprising although logic finding. The black boxes are industry-specific. In some industries, the black box contains mostly brand, and not much more. In other industries, brand is only a small fraction of the black box, with other important or even dominant intangible assets. Up to this point, this is no surprise. Now, the brand valuations from outside show the highest level of accuracy when no other intangible assets “interfere” in the black box. But if there are other valuable intangible assets, the values assigned to brands in outside valuations are far too high. In other words: the brand valuation consultancies usually put a very large part of the black box (if not all of it) on brand, thereby ignoring or neglecting the existence and importance of other (invisible) intangible assets. This is all rather well as long as no other intangible assets exist. But if they exist, the value of brand has to be smaller.
8 Primary rankings would be the Global 100. Secondary rankings are territory or sector specific, i.e. for Brand Finance: Global
Telecom 500, Global Banking 500, Canada 100, Turkey 100, Brazil 100, Nordic 50; for Interbrand: Best Korean, Canada 25, Best Brazilian, Best Mexican, Best US Retail; for Millward Brown: LATAM Top 50, Chinese Top 100, among others.
9 With very few exceptions, the brand valuation consultancies include only such brands in their rankings that are publicly listed and report their financials.
10 In accounting and tax the black box is often referred to as “hidden reserves” or “undisclosed assets generated internally”.
MARKABLES 927
Trademark Comparables AG Bahnhofstrasse 48 CH-6430 Schwyz Switzerland +41 (41) 810 28 83 [email protected]
Looking at different industries, we find that brand is the dominant intangible asset by far in some sectors like retail, food + beverages or automotive. Other noteworthy but still very small intangible assets include favorable leases for retailers, and some product technology for both food + beverages and automotive. The average deviations of brand value are lowest in these three industries.
However, this situation is completely different in sectors where the deviations of brand value are highest. These sectors comprise other most valuable intangible assets. For example for airlines, concessions, landing rights (slots) and code sharing agreements are the most important intangible assets by far. The major intangibles of telecoms consist of (spectrum) licenses and customer relations. Fuel marketing businesses typically have valuable concessions, franchise agreements with independent stations, and customer relations with independent resellers. And finally banks have valuable and long-term customer relations. In all these four industries, brand value as reported by new owners is low, ranging from 3% to 5% of enterprise value. In contrast, brand valuation consultancies tend to use most parts of the black box for the brand intangible alone, thereby overvaluing the brand by a factor of 4 to 5 times, and necessarily leaving not enough or no room for other most valuable intangible assets.
The issue seems to be very clear. The more valuable intangible assets other than brand exist, a brand valuation from outside leads to highest overvaluation. This is because intangibles other than brand are hardly visible let alone assessable from outside. But without having a clear picture of the importance and size of these other intangibles, it is like playing with fire to put a value on the brand alone. In other words, brand value league tables must be considered rather useless unless they treat sectors that have (almost) no other intangibles than brand, i.e. FMCG, consumer staples or retailers. In this sense, Brand Finance would be well-advised to reconsider and revamp their Global Telecom 500 and Global Banking 500 rankings.
Territories Moreover, we tried to figure out if the deviations show anomalies or outliers by territories. The brands listed on the rankings are domiciled in 32 different countries, and often far away from the place where the rankings are compiled. It seems to be impracticable to perform the valuations of brands in Argentina, Malaysia, Korea or Mexico from headquarters in London or New York. We assume that all three firms involve their local branches in the valuation of local brands in one way or another, be it in the valuation itself, in data gathering, in providing qualitative input, or in final quality checking. Based on such local involvement, differences by territories would indicate that the proprietary methodologies are applied differently by different local branches or individuals within the same firm.
To obtain robust results, we looked at countries where each firm has at least four observations. This applies to Brand Finance in nine countries, and to Millward
MARKABLES 1027
Trademark Comparables AG Bahnhofstrasse 48 CH-6430 Schwyz Switzerland +41 (41) 810 28 83 [email protected]
Brown and Interbrand in one country each.
Table 3
Firm Country no of observations
deviation from firm average11
Millward Brown Brazil 7 +29%
Brand Finance US 47 +38%
Brand Finance Brazil 5 +5%
Brand Finance Sweden 4 +3%
Brand Finance Germany 10 -4%
Brand Finance Italy 7 -25%
Brand Finance Canada 4 -38%
Brand Finance Turkey 9 -41%
Brand Finance Australia 6 -47%
Brand Finance UK 4 -49%
Interbrand US 5 -20%
For Interbrand, the valuation teams or individuals in charge of the US do a rather good job with average deviations below the overall average of Interbrand. Brand Finance shows above average accuracy in UK, Australia, Turkey, Canada and Italy. In contrast, Brand Finance seems to have particular problems in the US territory. Similarly – although at a much lower level, Millward Brown’s team in charge of Brazil has some room to improve internal consistency.
11 A positive or negative percentage figure does not mean over- or undervaluation. It describes by how much more – or less -
the valuations for that territory deviate from the average deviation of the firm. Thus, it describes intrafirm performance, with positive percentages indicating a weak performance.
MARKABLES 1127
Trademark Comparables AG Bahnhofstrasse 48 CH-6430 Schwyz Switzerland +41 (41) 810 28 83 [email protected]
Part III. Arguments brought forward against purchase accounting and accountants
In response to our first white paper, various questions and concerns have been raised with regard to the method of purchase accounting of brands, and to the cases we used in the comparative analysis. We will provide answers to these concerns to the best of our knowledge.
Internal transfers To start with, it was said that several brands that form part of our research had been transferred internally and thus did not represent true market value.12 Typically, internal transfers of assets are performed for tax reasons. It is true that any measure taken to optimize tax is tactical and biased to some extent. Depending on each particular case, companies may want to transfer a high (overvalued) or low (undervalued) asset value. So, the bias could be in both ways. Moreover, the tax authorities on each side of the transfer will do their best to avoid a shift of taxable income from their jurisdiction and to balance the contrasting interests. Their point of reference to agree with the taxpayer is the arm’s length principle which corresponds to market value in unrelated transactions.
To be precise, only two out of the 82 brands were transferred internally – IKEA and Schneider Electric. All other 80 cases are clean market transactions between independent parties with full change of ownership and control. Ironically, the values of both IKEA and Schneider Electric are clearly in favor of the brand value rankings, with a deviation far below the average deviation of the other 80 cases. Without these two brands, the overall deviation would have deteriorated for all three firms.13
Shorter lives Another concern is that in purchase price allocations accountants tend to assume very short useful economic lives.14 Tolerant of the term “very short”, this is certainly true. In any income or DCF based method, the expected income stream must be projected into the future. Such projection includes a determination of how long the income stream will persist, which is in compliance with international accounting standards.15 In PPAs, 50% of all valued trademark have a finite live with an average term of 11 years, while the other 50% have an indefinite live which has no foreseeable end at the date of the valuation.16 For the calculation itself, indefinite means that the income stream will not stop and be projected into perpetuity, resulting in a higher present value.17 The brand valuation specialists do not disclose their assumptions regarding the future lives of the brands but it must be assumed that they use indefiniteness/perpetuity as a general principle.
For the largest global brands on top of the league tables it is quite unlikely that they will disappear within the next 50 years. It is also unlikely that they will be acquired, for their sheer size and for antitrust reasons. But many of the smaller brands on the secondary rankings will not survive this long. As we all know, brands are replaced by others – a fact that can regularly be observed i.e. in telecommunications, banking, retail, and other sectors, in particular as a result of M&A. Accordingly, Hewlett Packard more or less retired Compaq and Palm, Microsoft will retire the Nokia brand on smartphones18. Orange Swiss was replaced recently by SALT; O2 Ireland became Three; CellNet became O2 UK; both Orange and T-Mobile UK became EE; and both D2 and Kabel Deutschland became Vodafone. In banking,
12 David Haigh (CEO of Brand Finance) in a press statement published on April 24, 2015, in response to the column of Mark
Ritson, see http://brandfinance.com/press-releases/why-variation-supports-the-need-for-brand-valuation/ 13 For this update of October, we continued to include IKEA because its reported brand value seems to be very appropriate
according to all benchmarks and valuation standards. We no longer include Schneider Electric for some inconsistencies in their reporting; in particular, the trademark value reported in 2011 seems to be part of a long-term arrangement with additional payments recurring in 2014.
14 David Haigh (CEO of Brand Finance) press statement, see footnote 12 above 15 IAS 38 in particular 16 Stefan Rüssli and Christof Binder, The useful life of trademarks, in: World Trademark Review, December 2014, pages 22-
25. 17 Returns in the future become increasingly immaterial over time through discounting. The outer years become less
important. Depending on the discount rate, perpetuity equals a definite useful life of 50 years. 18 The Nokia brand is likely persist on traditional cellphones in emerging markets until 2024.
MARKABLES 1227
Trademark Comparables AG Bahnhofstrasse 48 CH-6430 Schwyz Switzerland +41 (41) 810 28 83 [email protected]
Dresdner Bank became Commerzbank, Warburg Dillon Read and PaineWebber became UBS, ING Direct Canada became Tangerine, Citibank Germany became Targo Bank, and Winterthur Insurance became AXA. Remember? And finally all of us are aware of supermarket stores or fuel stations in their neighborhoods which changed their banners in the past. In Germany, respected brands like DEA (to Shell), Elf and Fina (to Total), BP (to ARAL and OMV) were replaced. Not to speak of dinosaurs like Gulf and Caltex. These are a few examples only. Branding aficionados must acknowledge that most brands are not perpetual but rather wasting assets. The harsh truth is that the value of brand in any of these replacements was unimportant enough to scrap it.
Now, one might argue that such brands would have survived but for the merger, and they would have had a much higher value (into perpetuity) for their previous owner. On the other hand – had such brands been really valuable, the new owner would not have replaced them. Under certain circumstances, the rebranding does not cause customer confusion, and the value of synergies and integration is greater than the value of keeping the brand. Thus, accountants are well advised to reflect about a potential end of a brand’s useful life and its potential replacement.
There are two aspects to consider in favor of the brand valuation consultancies. First, a valuation without an underlying transaction cannot make any assumptions on the value of the brand for a hypothetical new owner. And second, the value of the brand may depend on the brand portfolio and branding strategy of a new owner and his plans to rebrand or phase out. To account for this, we fully eliminated the effect of finite useful lives in purchase accounting in this comparative study. In the current sample, 56 of the 162 cases are assigned a finite life ranging from 1 to 50 years, with a mean life of 15 years. For better comparability and in full favor of the brand valuation consultancies, we have adjusted these 56 cases as if they had an indefinite life. If we hadn’t, the overall deviation would be 460% instead of 288%.19
Selling on unfair terms
Another concern that was raised against brand values from purchase accounting was that “the value placed on a brand through the PPA methodology may be a result of a company selling at distress, or on terms that are not fair.”20 With all due respect, why would a transaction between two independent parties be unfair? Why would a business be sold at less than the highest price that was offered? And if the buyer was not interested in such a distressed brand and attributed only low value to it, why would the seller of the business not sell the brand separately from the other assets if it was worth a lot? If the price was low or if there was only one interested buyer, the business and its brand were obviously not attractive, or the requested price was too high. In a market transaction between unrelated parties, unfair terms that would negatively affect the value of brands do not exist. Even more - PPAs in distress often report a purchase bargain (a negative goodwill), where the value of the acquired assets is higher than the price paid. This purchase bargain is often attributable to the reported brand value.
The reality in M&A is different. Valuation multiples and prices paid in M&A are higher than most analysts would anticipate. The average control premium paid over the last stock price is substantial.21 And for businesses at temporary distress, different (often higher) price/earnings multiples apply. For our comparative analysis here, the issue of distress is certainly minor. There are only very few cases that were sold in distress, and correspondingly there are only few distressed cases that sit on the league tables of the most valuable brands in the world.
Conservatism Finally, the most principal and serious objection against brand values from purchase accounting is that “accountants are very conservative and habitually under estimate
19 We had made the same adjustments in the first sample of 82 back in April. 20 Elspeth Cheung (Global BrandZ Valuation Director at Millward Brown) in a comment to the column of Mark Ritson (see
footnote 2) posted on the website of Marketing Week on April 24, 2015. 21 For example avg 34% on top of last market cap in a study of 4,855 cases of different sizes, industries and territories in the
MergerStat database. See Paul Komiak, Control Premiums: Evidence against market integration, in: Journal of Business Valuation 2010, 3 (1), pages 1-18.
MARKABLES 1327
Trademark Comparables AG Bahnhofstrasse 48 CH-6430 Schwyz Switzerland +41 (41) 810 28 83 [email protected]
the level of income attributable to brands they value.”22 To put it more pointedly, the brand valuation specialists are the self-appointed authority for brand valuation because they “genuinely understand brands and their true value”23, while accountants by the very nature of their profession do not understand enough about brands to value them.
This assertive view distracts from the fact that there is persisting inconsistency and disagreement between the brand valuation specialists themselves. Ironically, the deviation within the brand valuation specialists is larger than the deviation between Millward Brown and accounting. Furthermore, there is no such thing like “habitual” under estimation. In one third of the 154 cases analyzed, accountants report higher brand values than the brand valuation specialists. If the habitual underestimation of brands by accountants was true, it would necessarily implicate an (habitual) overestimation of other intangible assets. It is highly implausible that accountants are conservative for brands, but progressive for technology or customer relations or other intangible assets. Sadly, the statement about accountants’ conservatism is missing any factual foundation.
Brand value as reported in the league tables of the three firms represents an average of 18% of enterprise value.24 This ratio relates to a preselected sample of the most valuable brands of the world. Brand value as reported in unselected 4,550 PPAs represents 13% of enterprise value.25 For comparison of these two samples it must be considered that
- enterprise value in acquisitions is on average 34% higher than last observed market cap for the control premium paid26
- a PPA sample includes on average a 50% share of brands with finite lives (which is very often justified), accounting for approximately 33% lower brand values
- the PPA sample includes a) much smaller businesses and b) all industries where brands is rather unimportant.
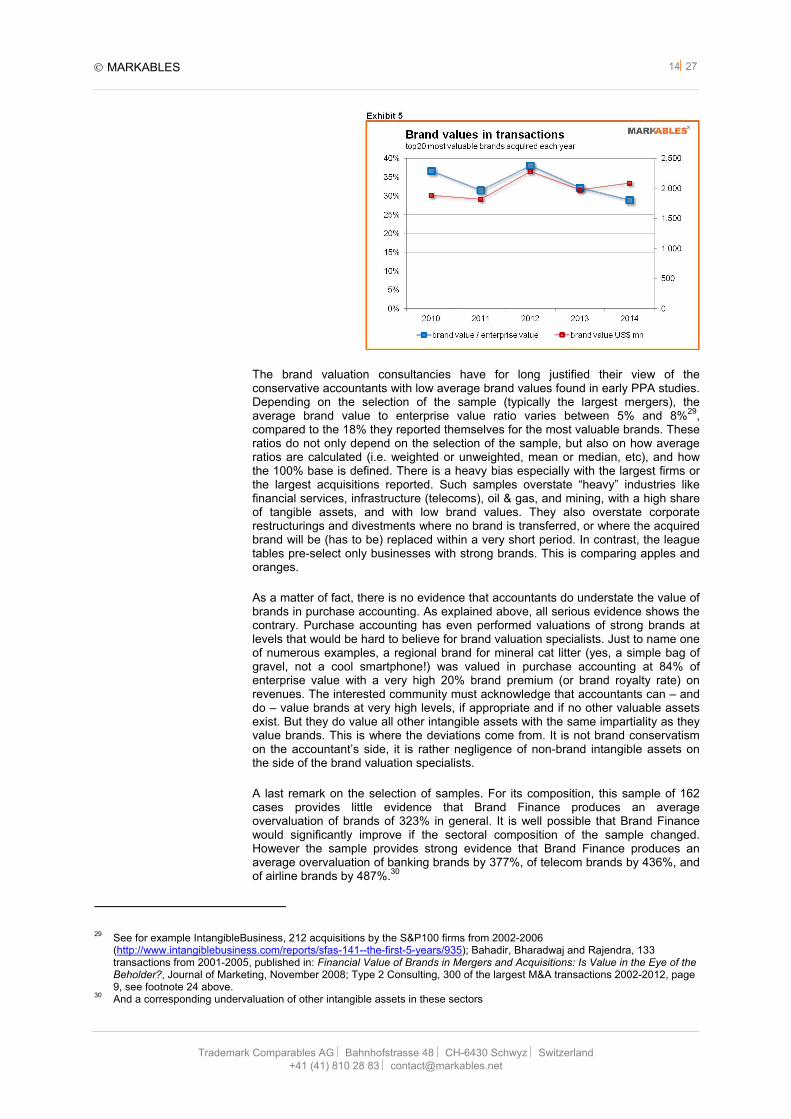
All depends on the selection of the sample that is used for comparison. The only acceptable direct comparison of the league table values would be against the most valuable brands that can be found in PPAs. MARKABLES publishes from its database the 20 most expensive brands acquired each year. Here, the average share of enterprise value (including the purchase premium) is 33%, thus almost two times higher than the 18% reported for the league tables (see exhibit 5).27 So, where is the point of undervaluation by accountants?
There is even more evidence. In the MARKABLES database, 15% of all businesses form part of a subgroup that we call brand-centric businesses (with brand being the dominant asset). This is the group which branding experts and marketing enthusiasts typically focus on. In this pre-selected group, brands represent an astonishing 44% of enterprise value on average. Our monthly peer group snapshots28 show average ratios of 36% for nutraceuticals, 36% for exhibitions and conventions, and 50% for OTC drugs. At the low end, they show 4% for CRM software, 6% for real estate developers, and 10% for road transportation. Most interestingly, they show as little as 2.2% for retail banks.
22 David Haigh (CEO of Brand Finance) press statement, see footnote 12 above 23 David Haigh (CEO of Brand Finance) press statement, see footnote 12 above 24 Type 2 Consulting, Brand Valuation – The Marketer’s Perspective, October 2013, page 9, see
http://de.slideshare.net/jpoknowles/brand-valuation-the-marketers-perspective?. Brand Finance reports an average of 16% globally; the other two firms are in the 20% area.
25 Christof Binder and Anke Nestler, Valuation of Intangibles and Trademarks – Do Not Miss Out On the Advantages of the Profit-Split Method DespiteUniloc; in Valuation Strategies, July 2015, p 16.
26 13% of (100+34) is equal to 17.4% of 100 27 See http://www.markables.net/brand_valuation_savviness. The yearly percentage ratios oscillate more than for the league
tables because the sample of the top20 is completely different each year. The 2014 figures might change slightly as some of the reported values are still preliminary.
28 See http://www.markables.net/brand_valuation_savviness
MARKABLES 1427
Trademark Comparables AG Bahnhofstrasse 48 CH-6430 Schwyz Switzerland +41 (41) 810 28 83 [email protected]
The brand valuation consultancies have for long justified their view of the conservative accountants with low average brand values found in early PPA studies. Depending on the selection of the sample (typically the largest mergers), the average brand value to enterprise value ratio varies between 5% and 8%29, compared to the 18% they reported themselves for the most valuable brands. These ratios do not only depend on the selection of the sample, but also on how average ratios are calculated (i.e. weighted or unweighted, mean or median, etc), and how the 100% base is defined. There is a heavy bias especially with the largest firms or the largest acquisitions reported. Such samples overstate “heavy” industries like financial services, infrastructure (telecoms), oil & gas, and mining, with a high share of tangible assets, and with low brand values. They also overstate corporate restructurings and divestments where no brand is transferred, or where the acquired brand will be (has to be) replaced within a very short period. In contrast, the league tables pre-select only businesses with strong brands. This is comparing apples and oranges.
As a matter of fact, there is no evidence that accountants do understate the value of brands in purchase accounting. As explained above, all serious evidence shows the contrary. Purchase accounting has even performed valuations of strong brands at levels that would be hard to believe for brand valuation specialists. Just to name one of numerous examples, a regional brand for mineral cat litter (yes, a simple bag of gravel, not a cool smartphone!) was valued in purchase accounting at 84% of enterprise value with a very high 20% brand premium (or brand royalty rate) on revenues. The interested community must acknowledge that accountants can – and do – value brands at very high levels, if appropriate and if no other valuable assets exist. But they do value all other intangible assets with the same impartiality as they value brands. This is where the deviations come from. It is not brand conservatism on the accountant’s side, it is rather negligence of non-brand intangible assets on the side of the brand valuation specialists.
A last remark on the selection of samples. For its composition, this sample of 162 cases provides little evidence that Brand Finance produces an average overvaluation of brands of 323% in general. It is well possible that Brand Finance would significantly improve if the sectoral composition of the sample changed. However the sample provides strong evidence that Brand Finance produces an average overvaluation of banking brands by 377%, of telecom brands by 436%, and of airline brands by 487%.30
29 See for example IntangibleBusiness, 212 acquisitions by the S&P100 firms from 2002-2006
(http://www.intangiblebusiness.com/reports/sfas-141--the-first-5-years/935); Bahadir, Bharadwaj and Rajendra, 133 transactions from 2001-2005, published in: Financial Value of Brands in Mergers and Acquisitions: Is Value in the Eye of the Beholder?, Journal of Marketing, November 2008; Type 2 Consulting, 300 of the largest M&A transactions 2002-2012, page 9, see footnote 24 above.
30 And a corresponding undervaluation of other intangible assets in these sectors
MARKABLES 1527
Trademark Comparables AG Bahnhofstrasse 48 CH-6430 Schwyz Switzerland +41 (41) 810 28 83 [email protected]
Part IV. Justifications of the brand value rankings
Variation is healthy In our first white paper, we discussed the inconsistencies and deviations between the brand value league tables and brand values reported in purchase accounting, and we postulated a higher degree of agreement and convergence, as many other authors did before. The press release of Brand Finance in reply to Mark Ritson’s column in Marketing Week does not promise too much in that sense. It is titled “Why Variation Supports the Need for Brand Valuation”. Further down, the release concludes “Rather than being a symptom of an unhealthy brand valuation industry, differences in value opinions are a sign of its health and vitality.”31
Does that mean the more variance we find in brand valuations, the better the choice, the quality and the user benefits – like in consumer goods markets? Is the strategy of the brand valuation consultancies to differentiate themselves to a maximum, to finally make comparisons impossible? Hopefully not. Most interestingly, Brand Finance stated exactly the opposite as a concluding remark in an article published 2011 in World Trademark Review, shortly after the brand valuation industry had developed and adopted ISO 10668, the global standard for brand valuations in 2010:
“The one cloud hanging over the brand valuation world is the confusion caused by widely different brand valuations in the public domain. We sincerely hope that this year the light of public scrutiny and the influence of new standards will finally lead to greater consensus in published brand values, and that they will make sense in the context of total intangible assets values.”32
Hard to imagine what happened in between. The good resolutions made in 2011 seemingly disappeared. Public scrutiny? Not really welcome. Greater Consensus? No, variation is healthy. There can be no doubt that the second (earlier) statement is the only way how it should be, what brand valuation should strive for, and what users expect from the brand valuation profession.
Share price forecasts
The three firms seem to have unisonous agreement that the variations are just “normal”. All of them found relief in comparing the variances in brand valuations with share price forecasts of equity analysts. In response to an article in The Economist in August 201433, Interbrand was forerunner with an analysis of Thomson Reuters data on the spread of target prices for the stock of the top 10 brands from their ranking.34 They found that the spread of the brand valuations is not much different from the spread of stock target prices. Brand Finance joined the canon in April 2015, with an analysis of Bloomberg data on the variance of the Apple target price among 67 equity analysts on April 26 (when Apple was about to launch its new watch). They found a maximum variance of 300% for the 67 analysts, compared to a variance of only 42% on Apple’s brand value between the three brand valuation firms.35 Finally – although with a softer voice - Millward Brown joined the song in April 2015, citing in general the different views on the effects of the Apple watch launch at Morgan Stanley and UBS analysts.36 This is both a surprisingly close harmony between competitors to explain their failure to find greater consistency in what they do, and a cheap point.
We are not going to discuss the statistical deficiencies in this approach. It makes much more sense to look at this comparison in general.
The price of a stock today is based on all relevant facts that are known today, and
31 David Haigh (CEO of Brand Finance) press statement, see footnote 12 above 32 David Haigh, The great recovery – the factors driving brand strength, in: World Trademark Review, June/July 2011, page
36. 33 What are brands for?, in: The Economist, August 30th 2014, pages 49-50. 34 Mike Rocha (Global Director Brand Valuation at Interbrand), Brand valuation: A strategic brand management framework to
unlock growth for your business, see http://www.bestglobalbrands.com/2014/articles/brand-valuation-mike-rocha/ 35 David Haigh (CEO of Brand Finance) press statement, see footnote 12 above 36 Elspeth Cheung (Global BrandZ Valuation Director at Millward Brown), see footnote 20 above
MARKABLES 1627
Trademark Comparables AG Bahnhofstrasse 48 CH-6430 Schwyz Switzerland +41 (41) 810 28 83 [email protected]
how they will possibly influence the future course of the business. In contrast, the target price of a stock in the future is something very different. The analyst has to figure out additional facts that are not yet known but might realize in the future. In other words, the job of an analyst is to make likely predictions about the future, not to assess the present. Brand valuation is a valuation as of today, based on the facts that are known today. Nobody expects the brand valuation consultancies to include into their valuations facts that are yet unknown, or to provide a “12 month target brand value”.37
Admittedly, target stock prices vary a lot and almost never become reality. That is why all stock market investors diversify their risk and pick a portfolio of different stocks to eliminate the volatility of each individual stock. Such diversification is applied – in one way or another - by private equity investors, by pension and other funds, by individual investors, and by corporate investors. They all put their money on a selection of different investments. That is how they overcome the oscillations of current and target stock market prices.
Now, imagine a brand manager thinking about marketing investment and asking for brand value advice. Typically, he has only one brand where he can invest his money, and no other options. If he based his investment decision on brand valuation today, he would play some sort of Russian roulette. Of course, this is not reality. The brand manager has other (better) tools to analyze and justify marketing investments. But this is the analogy which the brand valuation consultancies propose when they refer to the performance of equity analysts.
There is another major difference. The target stock prices of analysts are relentlessly tested, every single day. There is immediate feedback from the marketplace. And both the job market and the remunerations for equity analysts and portfolio managers are extremely competitive. If you perform well, you gain promotion and a (huge) bonus on your salary. If you perform below average, you are out. It is as simple as that. Compared to that, brand valuation is like a safe haven. If brand valuation wants to compare with equity analysts, they have to bear these consequences as well – testing, public scrutiny, sanctions and rewards.
With regard to rankings, all of us are certainly aware of published rankings listing the most valuable corporations of the world – by their current market capitalization. But with good reasons we never see such rankings based on the target stock prices in twelve months from Goldman Sachs, Morgan Stanley, Barclays, Lazard and the likes. Thus, suggesting share price predictions as comparable to brand valuations should also include their grateful restraint on publicity. And, the equity analysts themselves and their firms are subject to rankings every year compiled by the research teams of various publishing houses. The one with the most accurate predictions wins the number one position. That is what would be needed for brand valuation analysts as well (as long as they make their results public). Sadly, data available for the the reality testing of their valuations is much more limited.
ISO 10688 To underline their competence, both Interbrand and Brand Finance emphasize that they are accredited and certified with the ISO 10668 brand valuation standard. ISO 10668 is a standard for brand valuation issued and governed since 2010 by ISO, the international organization for standardization. The most famous and widely adopted ISO standard is ISO 9001 which governs the quality management systems of organizations.
To better understand ISO 10668, it is worth to take a look behind the scenes. Both Interbrand and Brand Finance were part of the working group which elaborated the standard between 2007 and 2010, among other brand valuation specialists.38 Being
37 Of course, any income or DCF based valuation needs to predict future revenue streams, but always based on actual plans,
facts that are known as of the valuation date, and a projection of existing experience into the future. But it is not speculating about news in the future, it is projecting past experiences, known facts and approved plans.
38 An introduction to Brand Finance, The world’s leading brand valuation and strategy consultancy, July 2011, page 10, see http://brandfinance.com/images/upload/brandfinance.pdf
MARKABLES 1727
Trademark Comparables AG Bahnhofstrasse 48 CH-6430 Schwyz Switzerland +41 (41) 810 28 83 [email protected]
the leading companies in the field, we must assume that both played a major role in the discussions and deliberations within the working group. The long expected and hard earned standard would hopefully help to reduce all the inconsistencies and variances. Today, five years after ISO 10668 was adopted, we realize that nothing improved. All the differences are still there. ISO 10668 is no more than a meta standard which specifies the principles and steps to be taken in any brand valuation. It is a summary of existing best practice and intentionally avoids detailed methodological specifications and requirements. As such, ISO 10668 applies to all proprietary and non-proprietary brand valuation approaches and methodologies that have been developed over the years, so long as they follow the fundamental principles specified in the meta standard.
Both Interbrand and Brand Finance do brand valuations basically by applying the same unchanged methodology and providing similar results as before. Instead of converging and unifying different methods and approaches into one, ISO 10668 did in fact freeze the pre-existing varieties and in addition awards a quality seal to all of them - the official ISO certification.
Beyond the application of the ISO standard, both Interbrand and Brand Finance also carry an official ISO 10668 certificate. According to ISO, certification can be a useful tool to add credibility, by demonstrating that products or services meet the expectations of customers. ISO itself does not perform certifications or issue certificates. This is done by authorized external certification bodies. Here the matter becomes peculiar.
One would assume that such certifications are performed and awarded by some masterminds of brand valuations, experts at least - but far from it; such experts are all part of the firms who seek for certification. The certifications are performed by the former committee secretary and project coordinator of the ISO 10668 working group, a qualified lawyer and administrator.39 He is not really a proven expert in brand valuation, and he certifies those companies which told him earlier how to phrase the standard he now certifies. But the peculiarities do not end here. This very same person acts today as official agent for Brand Finance in the territory Germany/Austria/Switzerland.40 Thereby, Brand Finance potentially governs both the ISO certification of its competitors and has access to their methodologies and trade secrets. In this screwy system the independent supervisory body is controlled by those who should be controlled, a condition which creates just the opposite of credibility, reliability and transparency. As a result, ISO 10668 is anything else than a widely adopted standard. Many countries including the US and China reject it, and it is no wonder that only a few companies in some European countries carry the certification.
In the press release announcing their ISO 10668 certification in late 2010, Interbrand stated: “Previously it was difficult to compare the results of various brand valuation methods, as the lack of general standards for brand valuation resulted in highly divergent results. This led to insecurity on the part of companies, which were often reluctant to participate in brand valuation processes. The brand valuation standards in ISO 10668 were created to address this problem and make brand valuation a more respectable enterprise.”41 Five years later one has to be honest and conclude that ISO 10668 in its current form was pointless.
Interbrand founder and then retired John Murphy was more realistic about the benefits of ISO 10668 when he stated in 2012: “Years ago we tried to get some sort of standardisation and accreditation [in brand valuation], but it was like herding cats.”42 Murphy went even further and recommended that brand valuation be regulated like accounting.
39 http://www.reuters.com/article/2010/12/01/idUS230322+01-Dec-2010+BW20101201 40 http://brandfinance.com/who-we-are/our-people/person/dr-holger-mhlbauer/ 41 see footnote 39 above 42 Jane Simms, Stand by your brand, ICAEW/economia, Jan 31 2012; see http://economia.icaew.com/business/stand-by-your-
brand
MARKABLES 1827
Trademark Comparables AG Bahnhofstrasse 48 CH-6430 Schwyz Switzerland +41 (41) 810 28 83 [email protected]
Interestingly, Millward Brown was never part of the ISO system. When it comes to valuation standards, Millward Brown adheres to US GAAP and IFRS. These are the standards which accountants have to adopt in purchase accounting. It is therefore no surprise that Millward Brown emerged very clearly on the top position in this comparative study.
Science, art, or craft?
Interbrand takes the view that “valuation (of any asset or business, not just brands) is both an art and a science, based on quantitative and qualitative assessment. The science is in the measurement and the art is in the interpretation.”43 With these fine words, the whole discipline of brand valuation is skillfully withdrawn from verifiability and hovering above any public debate.
The term “science” suggests validity and exactitude, like a law of nature or like something that is proven to be right. As a general principal, science is empirical and open to falsification if new evidence is presented. We are not aware that Interbrand’s (or any other) brand valuation methodology has ever been tested and proven empirically or scientifically. On the other side, “art” is something creative and imaginative. Artwork is always unique, inextricably linked with the artist who creates it. The artist is admired for his unique capabilities which cannot simply be learned or studied. In the context of valuation, the term “art” is misleading. It suggests that nobody else than the artist himself can do it. And it suggests that the valuator has the creative freedom of an artist and is not bound to rules or restrictions. We suggest dropping both terms “science” and “art” in this context.
In contrast, brand valuation should be considered something completely different, very down-to-earth. To say it in the words of Aswath Damodaran, one of the undisputed masterminds of corporate finance and valuation: “Valuation is a craft, not an art or a science. A craft akin to cooking and carpentry, and that you learn by doing it and by finding out what works and what does not.”44
Understanding brand valuation as a craft includes some key elements: - (mostly) everybody who is interested can learn it; the access to brand
valuation is not restricted - brand valuation requires education and learning by doing - brand valuation accepts reality testing, benchmarking and continuous
improvement - the methodology (the science) does not replace the experience of the
individual (the craftsmanship or the mastership)
The brand valuation companies go in a different direction. Their focus is not on the individuals and their experience. The focus of all of their competitive positioning, press, and public discussion is on the unique, proprietary methodologies, but neither on the experience and the know-how of the individuals doing the valuations, nor on the valuation results. Even more, the certification itself – the official approval and quality seal - is focused on the methodology alone, not on the individuals applying it. As we said above, none of the methodologies could ever be tested or proven empirically, let alone scientifically.
By contrast, brand valuation companies should focus their efforts and investments on the education of individuals, and in benchmarking and reality testing. Education of individuals means graduation with approved accreditations, like the many credentials in accounting, valuation and finance.45 And why not develop a valuation credential that includes more brand-specific content? Benchmarking and reality testing means to accept the findings of other brand valuators, the views of auditors, and the results of impairments and credit defaults, as an additional source of knowledge. Today, benchmarking different brand values is no longer a problem;
43 Mike Rocha (Global Director Brand Valuation at Interbrand), see footnote 34 above 44 Aswath Damodaran, Musings on Markets, see http://aswathdamodaran.blogspot.de/2015/08/my-valuation-class-fall-2015-
model.html 45 including CA, CPA, CFA, CVA, ASA, CBV, ABV, SSBV, RV, CPV, and others.
MARKABLES 1927
Trademark Comparables AG Bahnhofstrasse 48 CH-6430 Schwyz Switzerland +41 (41) 810 28 83 [email protected]
there is ample data available from M&A and brand transactions. Reality testing means exposing valuation results to the market and/or to scrutiny, i.e. to auditors, judges, tax authorities, banks, regular impairment tests, and more.
Difference of opinion
The brand valuation firms deliberately state that brand value is not more than an opinion, and that of course different opinions exist. Interbrand for example states: “It is important to bear in mind that a value is essentially an opinion (as opposed to an actual price achieved in a transaction) arrived at through research and analysis, and evaluated through a particular methodological lens. Because all methodologies are different, of course the valuations will vary, and this creates an inevitable degree of confusion.”46 The same goes for Brand Finance: “With so much variation in methodology and considering all that is open to the analyst’s interpretation, differences of opinion are bound to arise. Yet, it is perfectly reasonable to expect different organizations to have their own opinions on how brands should be valued—and inevitable that people will perceive value differently.”47
There is nothing to say against this in principle. But how far can the variances seriously go without being implausible or fully incredible? Is the acceptable variance between two opposing opinions 10%, 50% or 100%? Let us assume you bought something – like a travel, a car, or a nice dress. Now you realize that you could have bought the very same thing cheaper – somewhere else. You can ask yourself how much of an overpayment you would accept without feeling uncomfortable. Your feeling will be a question of materiality, and materiality is of course something very individual. There is no right answer to this, but we would argue that an acceptable variance between two different opinions of value on the same asset should be a 20% margin (allowing for a total spread of 40%). We would also allow for a few exceptional, complex cases (say 20%) where the allowed variance is higher than this spread. We can turn things round however we want - the values reported on the brand rankings are far outside of any acceptable level.
Still, to justify and explain the large variances, the brand valuation firms try to argue on three different levels which can be summarized as follows: different methodologies, different assumptions, and different concepts of value.
Methodologies As for methodologies, this is hardly acceptable as justification. There is no reason why different methodologies would not lead to similar and correct results.
Assumptions As for assumptions, they certainly influence the result of a valuation. But at this point personal experience and know-how of the valuator come into play. A DCF (or income) based valuation is always the balancing of future opportunities against the risks associated with them. An optimistic assessment of the size and growth of future returns of an asset (a brand) would necessarily be balanced by more risk-averse assumptions regarding the duration of the revenue stream and the discount rate, and vice versa. For example, some hyped fashion brands can show very high growth rates, but then it is more likely that their remaining life is shorter than 20 years, and that the high revenue growth will end sometime after the planning period. This balancing mechanism of basic valuation assumptions reduces the spread. Only inexperienced valuators would set all four factors – returns, growth, duration and discount rate - simultaneously on “optimistic” or “conservative” and thereby produce significant over- or undervaluation. All in all, different assumptions do not necessarily lead to large variances.
Concepts of value As for different concepts of value, this is a more serious aspect to consider. In fact, different concepts of value can result in different valuation results. In this context, the brand valuation firms themselves request that the reason for the valuation and the premise of value must be clearly defined. For example, the valuation may be for a going concern or for a liquidation premise. It may be for brand management or for
46 Mike Rocha (Global Director Brand Valuation at Interbrand), see footnote 34 above. 47 David Haigh (CEO of Brand Finance) press statement, see footnote 12 above
MARKABLES 2027
Trademark Comparables AG Bahnhofstrasse 48 CH-6430 Schwyz Switzerland +41 (41) 810 28 83 [email protected]
tax purposes. Or it may be an in-depth granular valuation or a high-level boardroom valuation. Depending on the underlying concept, the results of the valuation can of course vary.
Basically, the two most important concepts of value are the value of a brand to a (potential) buyer (fair value or market value), and opposed to it the benefit of the brand to its current owner (value in use, or value of owning and keeping it). In addition, there is the value to a lender (which is derived from fair value by applying a safety discount), the liquidation value (which is similar to the lending value and assumes a sale under time restrictions), the tax value (which is a value approved by tax authorities based on fair value considerations), and the value to a partial user, like i.e. a licensee (which has little to do with fair value and value in use48). For simplification we focus on the former two – fair value and value in use. Purchase accounting applies fair value standards. Sadly, the brand valuation firms do not clearly state which concept of value they apply in their rankings, we can only guess. Applying US GAAP and IFRS standards, we assume Millward Brown to apply a fair value concept. Brand Finance sometimes uses the term “separability” based on the royalty somebody else would pay the brand which indicates rather a fair value concept. Interbrand often points to the value of the brand to shareholders which could indicate a value in use. Admittedly, this is only guessing.
Of course, a brand’s value in use to its current owner can differ from its fair value to a potential buyer, in both directions. Depending on each particular case and its circumstances, one business can make a different (better) use of a particular brand than another. Sometimes, brands just drift around for years in their market, and suddenly they skyrocket under a new owner, embedded in a new network and infrastructure. Sometimes, brands make the related business shining brightly for a long time, and new owners make barely use of them or even drop them. If the value in use is far higher, it is rather unlikely that this brand will be sold or bought. If the value in use is far lower, it will be easy to find a buyer at a good price. Transactions take place if both values are within a negotiable range. Considering the increasing number of transactions and M&A, one has to assume that in most cases the values under the two different concepts are not too far apart.
While we may observe that in some cases a brand’s value in use is much higher than its fair value from the perspective of the current owner, such difference tends to diminish in the long run. There is no per se value of a high value in use, if this appreciation is not shared by others, like potential buyers, banks, tax authorities etc. A high value in use complicates or prevents not only a sale, but also brand-backed financing and taxation. Thus, such high value in use does not help in the long run. Despite all different valuation concepts, value will always come down to what somebody else is willing to pay. This holds true for brands like for any other assets. For those who think brand value is more than somebody else’s willingness to pay, we suggest different terms like patronage or collector’s passion.
This simple concept of transaction based value (what somebody else is willing to pay) does not support excessive deviations in value. Instead of lamenting that brand valuation is particularly difficult and complex and necessarily results in variation, we should better regard it as the valuation of any other asset or liability, be it a patent or building or an employee stock ownership plan. With this in mind, the acceptance of wide differences in opinion would decrease, and all participants in brand valuation would necessarily strive to find ways to converge. If all this is undesirable, we should surrender and introduce an additional concept and premise of brand value: the value in rankings.
48 For the differences in duration (a brand license has a limited term of three years average) and scope (a brand license is
typically a small add-on business for the licensee without extra investment and calculated at incremental cost, while brand ownership involves the whole business at fully-loaded cost).
MARKABLES 2127
Trademark Comparables AG Bahnhofstrasse 48 CH-6430 Schwyz Switzerland +41 (41) 810 28 83 [email protected]
Part V. Ramifications and conclusions
This paper is not intended to disparage brand valuation. There is no doubt that brand valuation is increasingly important and useful. Hundreds of thousands brand valuations performed every year – most of them for transaction, financial, accounting, reporting and taxation reasons - paint a clear picture of its importance. And there is also no doubt that brands can be valued reliably and validly, provided they are done thoroughly and based on all relevant information.
However, there is serious doubt about the veracity and benefit of the numerous brand value rankings that are released on a calendar schedule by firms like Interbrand, Millward Brown and Brand Finance, and others. These rankings are done fully unsolicited and non-commissioned. Since long the rankings have been criticized for having countless inconsistencies between them. Our comparative analysis of 157 brand values from rankings against the transaction values of the same brands revealed that in most cases the ranking values have lost touch with reality. The deviations in most industries and for brands with values below US$ 1,000 million are simply inacceptable by all professional and individual standards.
A brand valuation that goes without an in-depth look at all the other intangible assets that are part of the same business cannot be serious. And a fully commissioned brand valuation must inevitably be more precise than a non-commissioned valuation, as in a league table. To put it simply – brand values on league tables are low quality values at best whose interpretation and application is associated with substantial uncertainty and risk. The key problem is: most journalists and readers do not know that. They take it at face value, publish it, recite it, discuss it with colleagues, gossip about it, include it somehow in their decision making. … Naïve to believe that the countless Top 100 brand lists that made it into the media did not form a lot of opinions and beliefs. Countless of these brand values made it in the director’s reports of the financial statements of their owners, provided that the value or ranking shows some positive development. Purportedly, some CMOs even have their bonuses tied to the rankings. Many of them must be unfounded or wrong. And sad to say that many of those who read the rankings more carefully and realized the inconsistencies, became disbelievers and detractors.
Trevor Little, editor of World Trademark Review, made a interesting statement: “Brand valuation companies themselves would acknowledge that the values on ranking tables may be very different to the figure that is attached to a brand when a full valuation is undertaken or a transaction realized.”49 Do they really? Maybe Trevor has some inside knowledge from personal interviews, but the written statements of the brand valuation firms do not really support an acknowledgement. In contrast, we notice how passionately they defend themselves, justify the rankings and accuse each other and the accounting discipline to be the wrongdoers.
We have little hope that the release of meaningless brand rankings will stop in the very near future, but maybe they improve at a faster rate than in the past. A most important element of transparency – the designation of those brands on the rankings that are paying clients of the valuation firms – is rather unlikely to happen. At the very least, a clear explanation and instruction together with the rankings about their level of quality and accuracy would be helpful to reduce misinterpretation and confusion. Or, better still, the indication of a range of minimum and maximum brand value in which a fully commissioned brand value would most likely fall - instead of one definite but largely wrong figure. If not, the resulting confusion will seriously harm customer and reader confidence.
With regard to fully commissioned brand valuations, the specialized brand valuators should stop their class warfare against accountants. Instead, they should concentrate on getting their own valuations right and their image improved.
49 Trevor Little, see footnote 3 above

MARKABLES 2227
Trademark Comparables AG Bahnhofstrasse 48 CH-6430 Schwyz Switzerland +41 (41) 810 28 83 [email protected]
To come back to our initial question – blessing or curse – we sadly have to conclude that brand rankings are like a chronic disease which requires strict diet and discipline. Both press and audience play an important role in the cure and rehabilitation of the patient – by asking the right questions, by not contenting with cheap answers, and by insisting on meaningful standards and regulation.
MARKABLES 2327
Trademark Comparables AG Bahnhofstrasse 48 CH-6430 Schwyz Switzerland +41 (41) 810 28 83 [email protected]
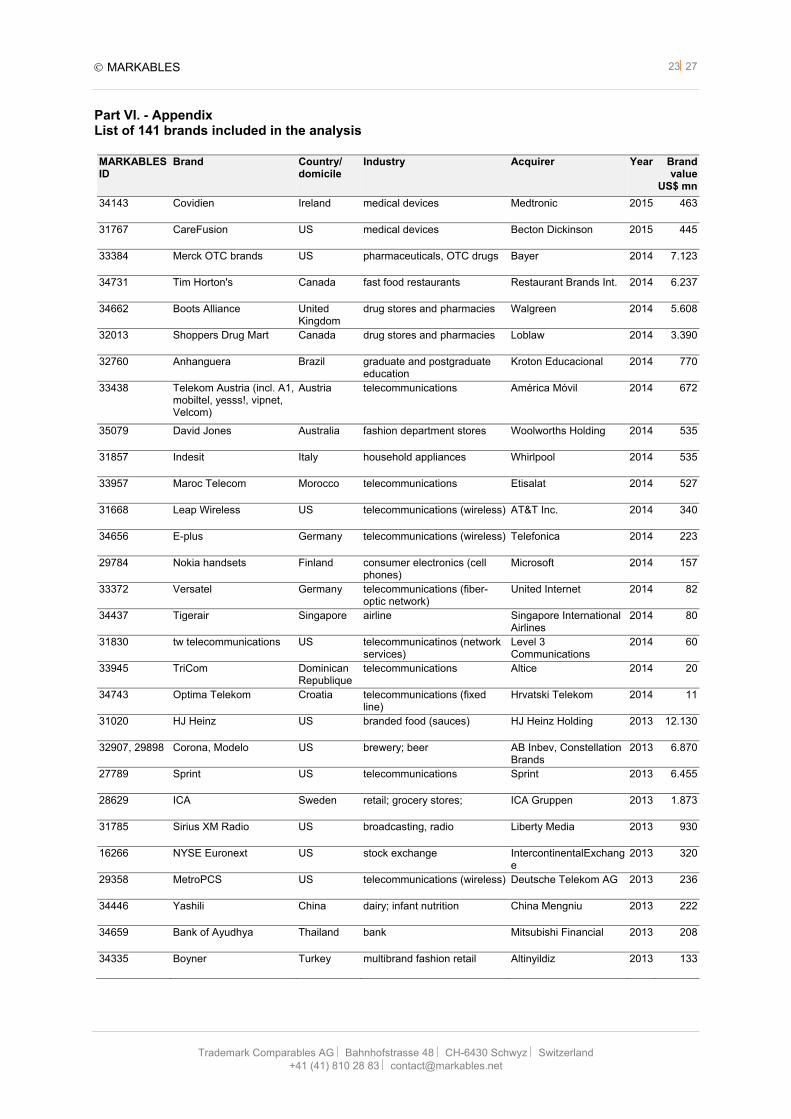
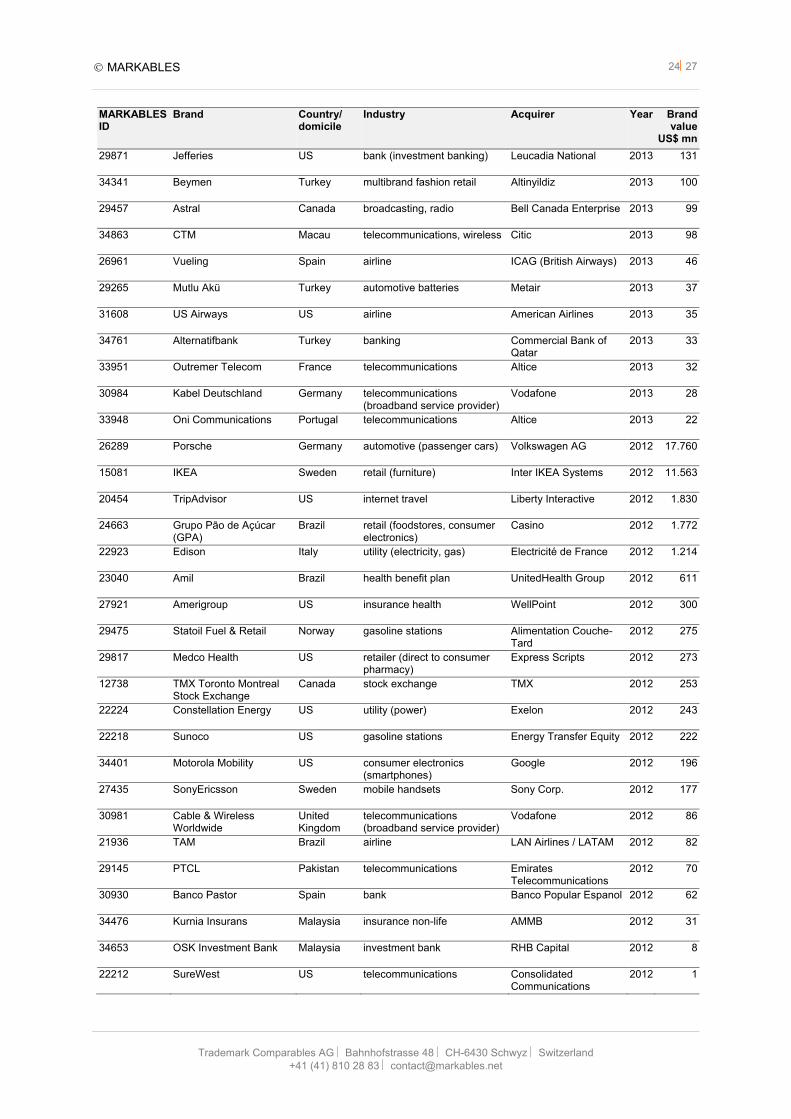
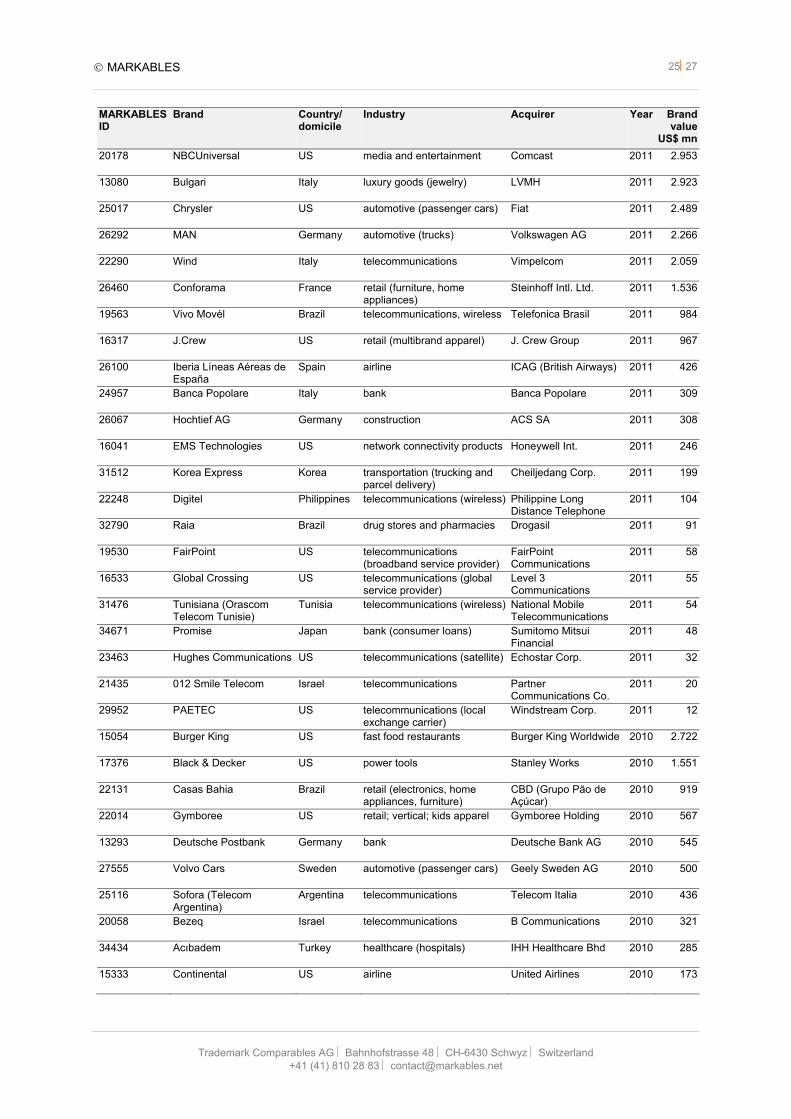
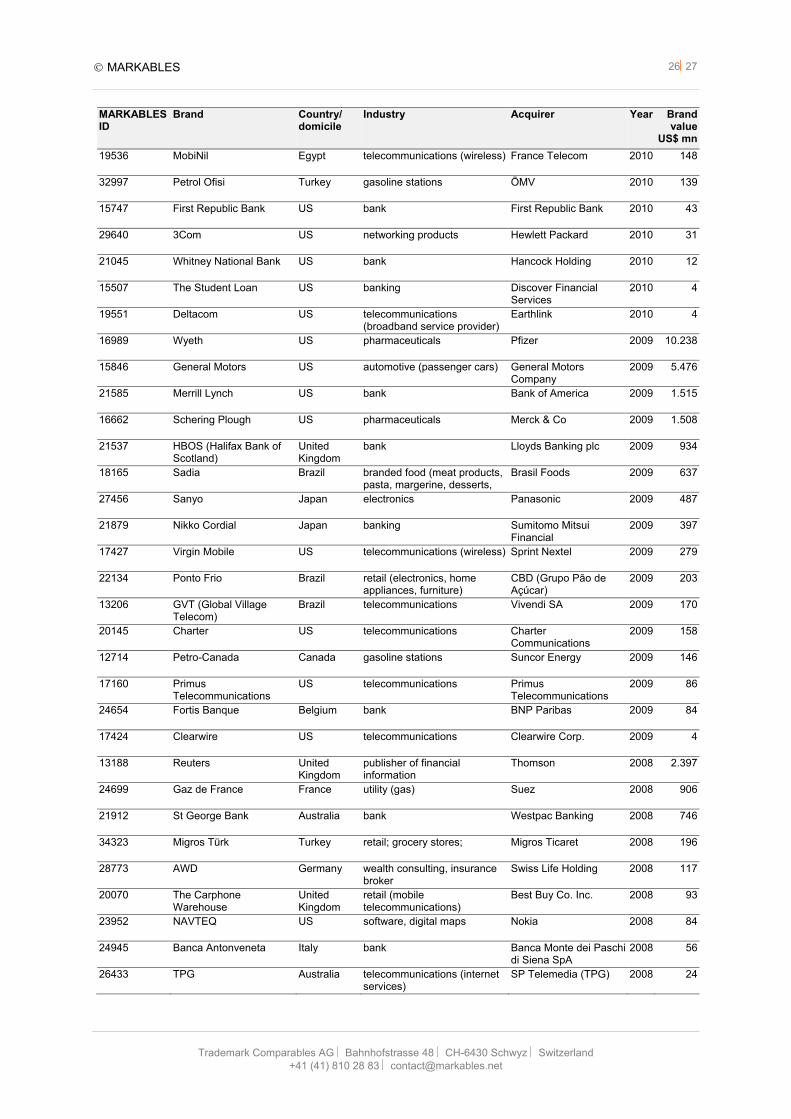
Part VI. - Appendix List of 141 brands included in the analysis MARKABLES ID
Brand Country/ domicile
Industry Acquirer Year Brand value
US$ mn
34143 Covidien Ireland medical devices Medtronic 2015 463
31767 CareFusion US medical devices Becton Dickinson 2015 445
33384 Merck OTC brands US pharmaceuticals, OTC drugs Bayer 2014 7.123
34731 Tim Horton's Canada fast food restaurants Restaurant Brands Int. 2014 6.237
34662 Boots Alliance United Kingdom
drug stores and pharmacies Walgreen 2014 5.608
32013 Shoppers Drug Mart Canada drug stores and pharmacies Loblaw 2014 3.390
32760 Anhanguera Brazil graduate and postgraduate education
Kroton Educacional 2014 770
33438 Telekom Austria (incl. A1, mobiltel, yesss!, vipnet, Velcom)
Austria telecommunications América Móvil 2014 672
35079 David Jones Australia fashion department stores Woolworths Holding 2014 535
31857 Indesit Italy household appliances Whirlpool 2014 535
33957 Maroc Telecom Morocco telecommunications Etisalat 2014 527
31668 Leap Wireless US telecommunications (wireless) AT&T Inc. 2014 340
34656 E-plus Germany telecommunications (wireless) Telefonica 2014 223
29784 Nokia handsets Finland consumer electronics (cell phones)
Microsoft 2014 157
33372 Versatel Germany telecommunications (fiber-optic network)
United Internet 2014 82
34437 Tigerair Singapore airline Singapore International Airlines
2014 80
31830 tw telecommunications US telecommunicatinos (network services)
Level 3 Communications
2014 60
33945 TriCom Dominican Republique
telecommunications Altice 2014 20
34743 Optima Telekom Croatia telecommunications (fixed line)
Hrvatski Telekom 2014 11
31020 HJ Heinz US branded food (sauces) HJ Heinz Holding 2013 12.130
32907, 29898 Corona, Modelo US brewery; beer AB Inbev, Constellation Brands
2013 6.870
27789 Sprint US telecommunications Sprint 2013 6.455
28629 ICA Sweden retail; grocery stores; ICA Gruppen 2013 1.873
31785 Sirius XM Radio US broadcasting, radio Liberty Media 2013 930
16266 NYSE Euronext US stock exchange IntercontinentalExchange
2013 320
29358 MetroPCS US telecommunications (wireless) Deutsche Telekom AG 2013 236
34446 Yashili China dairy; infant nutrition China Mengniu 2013 222
34659 Bank of Ayudhya Thailand bank Mitsubishi Financial 2013 208
34335 Boyner Turkey multibrand fashion retail Altinyildiz 2013 133
MARKABLES 2427
Trademark Comparables AG Bahnhofstrasse 48 CH-6430 Schwyz Switzerland +41 (41) 810 28 83 [email protected]
MARKABLES ID
Brand Country/ domicile
Industry Acquirer Year Brand value
US$ mn
29871 Jefferies US bank (investment banking) Leucadia National 2013 131
34341 Beymen Turkey multibrand fashion retail Altinyildiz 2013 100
29457 Astral Canada broadcasting, radio Bell Canada Enterprise 2013 99
34863 CTM Macau telecommunications, wireless Citic 2013 98
26961 Vueling Spain airline ICAG (British Airways) 2013 46
29265 Mutlu Akü Turkey automotive batteries Metair 2013 37
31608 US Airways US airline American Airlines 2013 35
34761 Alternatifbank Turkey banking Commercial Bank of Qatar
2013 33
33951 Outremer Telecom France telecommunications Altice 2013 32
30984 Kabel Deutschland Germany telecommunications (broadband service provider)
Vodafone 2013 28
33948 Oni Communications Portugal telecommunications Altice 2013 22
26289 Porsche Germany automotive (passenger cars) Volkswagen AG 2012 17.760
15081 IKEA Sweden retail (furniture) Inter IKEA Systems 2012 11.563
20454 TripAdvisor US internet travel Liberty Interactive 2012 1.830
24663 Grupo Pão de Açúcar (GPA)
Brazil retail (foodstores, consumer electronics)
Casino 2012 1.772
22923 Edison Italy utility (electricity, gas) Electricité de France 2012 1.214
23040 Amil Brazil health benefit plan UnitedHealth Group 2012 611
27921 Amerigroup US insurance health WellPoint 2012 300
29475 Statoil Fuel & Retail Norway gasoline stations Alimentation Couche-Tard
2012 275
29817 Medco Health US retailer (direct to consumer pharmacy)
Express Scripts 2012 273
12738 TMX Toronto Montreal Stock Exchange
Canada stock exchange TMX 2012 253
22224 Constellation Energy US utility (power) Exelon 2012 243
22218 Sunoco US gasoline stations Energy Transfer Equity 2012 222
34401 Motorola Mobility US consumer electronics (smartphones)
Google 2012 196
27435 SonyEricsson Sweden mobile handsets Sony Corp. 2012 177
30981 Cable & Wireless Worldwide
United Kingdom
telecommunications (broadband service provider)
Vodafone 2012 86
21936 TAM Brazil airline LAN Airlines / LATAM 2012 82
29145 PTCL Pakistan telecommunications Emirates Telecommunications
2012 70
30930 Banco Pastor Spain bank Banco Popular Espanol 2012 62
34476 Kurnia Insurans Malaysia insurance non-life AMMB 2012 31
34653 OSK Investment Bank Malaysia investment bank RHB Capital 2012 8
22212 SureWest US telecommunications Consolidated Communications
2012 1
MARKABLES 2527
Trademark Comparables AG Bahnhofstrasse 48 CH-6430 Schwyz Switzerland +41 (41) 810 28 83 [email protected]
MARKABLES ID
Brand Country/ domicile
Industry Acquirer Year Brand value
US$ mn
20178 NBCUniversal US media and entertainment Comcast 2011 2.953
13080 Bulgari Italy luxury goods (jewelry) LVMH 2011 2.923
25017 Chrysler US automotive (passenger cars) Fiat 2011 2.489
26292 MAN Germany automotive (trucks) Volkswagen AG 2011 2.266
22290 Wind Italy telecommunications Vimpelcom 2011 2.059
26460 Conforama France retail (furniture, home appliances)
Steinhoff Intl. Ltd. 2011 1.536
19563 Vivo Movél Brazil telecommunications, wireless Telefonica Brasil 2011 984
16317 J.Crew US retail (multibrand apparel) J. Crew Group 2011 967
26100 Iberia Líneas Aéreas de España
Spain airline ICAG (British Airways) 2011 426
24957 Banca Popolare Italy bank Banca Popolare 2011 309
26067 Hochtief AG Germany construction ACS SA 2011 308
16041 EMS Technologies US network connectivity products Honeywell Int. 2011 246
31512 Korea Express Korea transportation (trucking and parcel delivery)
Cheiljedang Corp. 2011 199
22248 Digitel Philippines telecommunications (wireless) Philippine Long Distance Telephone
2011 104
32790 Raia Brazil drug stores and pharmacies Drogasil 2011 91
19530 FairPoint US telecommunications (broadband service provider)
FairPoint Communications
2011 58
16533 Global Crossing US telecommunications (global service provider)
Level 3 Communications
2011 55
31476 Tunisiana (Orascom Telecom Tunisie)
Tunisia telecommunications (wireless) National Mobile Telecommunications
2011 54
34671 Promise Japan bank (consumer loans) Sumitomo Mitsui Financial
2011 48
23463 Hughes Communications US telecommunications (satellite) Echostar Corp. 2011 32
21435 012 Smile Telecom Israel telecommunications Partner Communications Co.
2011 20
29952 PAETEC US telecommunications (local exchange carrier)
Windstream Corp. 2011 12
15054 Burger King US fast food restaurants Burger King Worldwide 2010 2.722
17376 Black & Decker US power tools Stanley Works 2010 1.551
22131 Casas Bahia Brazil retail (electronics, home appliances, furniture)
CBD (Grupo Pão de Açúcar)
2010 919
22014 Gymboree US retail; vertical; kids apparel Gymboree Holding 2010 567
13293 Deutsche Postbank Germany bank Deutsche Bank AG 2010 545
27555 Volvo Cars Sweden automotive (passenger cars) Geely Sweden AG 2010 500
25116 Sofora (Telecom Argentina)
Argentina telecommunications Telecom Italia 2010 436
20058 Bezeq Israel telecommunications B Communications 2010 321
34434 Acıbadem Turkey healthcare (hospitals) IHH Healthcare Bhd 2010 285
15333 Continental US airline United Airlines 2010 173
MARKABLES 2627
Trademark Comparables AG Bahnhofstrasse 48 CH-6430 Schwyz Switzerland +41 (41) 810 28 83 [email protected]
MARKABLES ID
Brand Country/ domicile
Industry Acquirer Year Brand value
US$ mn
19536 MobiNil Egypt telecommunications (wireless) France Telecom 2010 148
32997 Petrol Ofisi Turkey gasoline stations ÖMV 2010 139
15747 First Republic Bank US bank First Republic Bank 2010 43
29640 3Com US networking products Hewlett Packard 2010 31
21045 Whitney National Bank US bank Hancock Holding 2010 12
15507 The Student Loan US banking Discover Financial Services
2010 4
19551 Deltacom US telecommunications (broadband service provider)
Earthlink 2010 4
16989 Wyeth US pharmaceuticals Pfizer 2009 10.238
15846 General Motors US automotive (passenger cars) General Motors Company
2009 5.476
21585 Merrill Lynch US bank Bank of America 2009 1.515
16662 Schering Plough US pharmaceuticals Merck & Co 2009 1.508
21537 HBOS (Halifax Bank of Scotland)
United Kingdom
bank Lloyds Banking plc 2009 934
18165 Sadia Brazil branded food (meat products, pasta, margerine, desserts,
Brasil Foods 2009 637
27456 Sanyo Japan electronics Panasonic 2009 487
21879 Nikko Cordial Japan banking Sumitomo Mitsui Financial
2009 397
17427 Virgin Mobile US telecommunications (wireless) Sprint Nextel 2009 279
22134 Ponto Frio Brazil retail (electronics, home appliances, furniture)
CBD (Grupo Pão de Açúcar)
2009 203
13206 GVT (Global Village Telecom)
Brazil telecommunications Vivendi SA 2009 170
20145 Charter US telecommunications Charter Communications
2009 158
12714 Petro-Canada Canada gasoline stations Suncor Energy 2009 146
17160 Primus Telecommunications
US telecommunications Primus Telecommunications
2009 86
24654 Fortis Banque Belgium bank BNP Paribas 2009 84
17424 Clearwire US telecommunications Clearwire Corp. 2009 4
13188 Reuters United Kingdom
publisher of financial information
Thomson 2008 2.397
24699 Gaz de France France utility (gas) Suez 2008 906
21912 St George Bank Australia bank Westpac Banking 2008 746
34323 Migros Türk Turkey retail; grocery stores; Migros Ticaret 2008 196
28773 AWD Germany wealth consulting, insurance broker
Swiss Life Holding 2008 117
20070 The Carphone Warehouse
United Kingdom
retail (mobile telecommunications)
Best Buy Co. Inc. 2008 93
23952 NAVTEQ US software, digital maps Nokia 2008 84
24945 Banca Antonveneta Italy bank Banca Monte dei Paschi di Siena SpA
2008 56
26433 TPG Australia telecommunications (internet services)
SP Telemedia (TPG) 2008 24
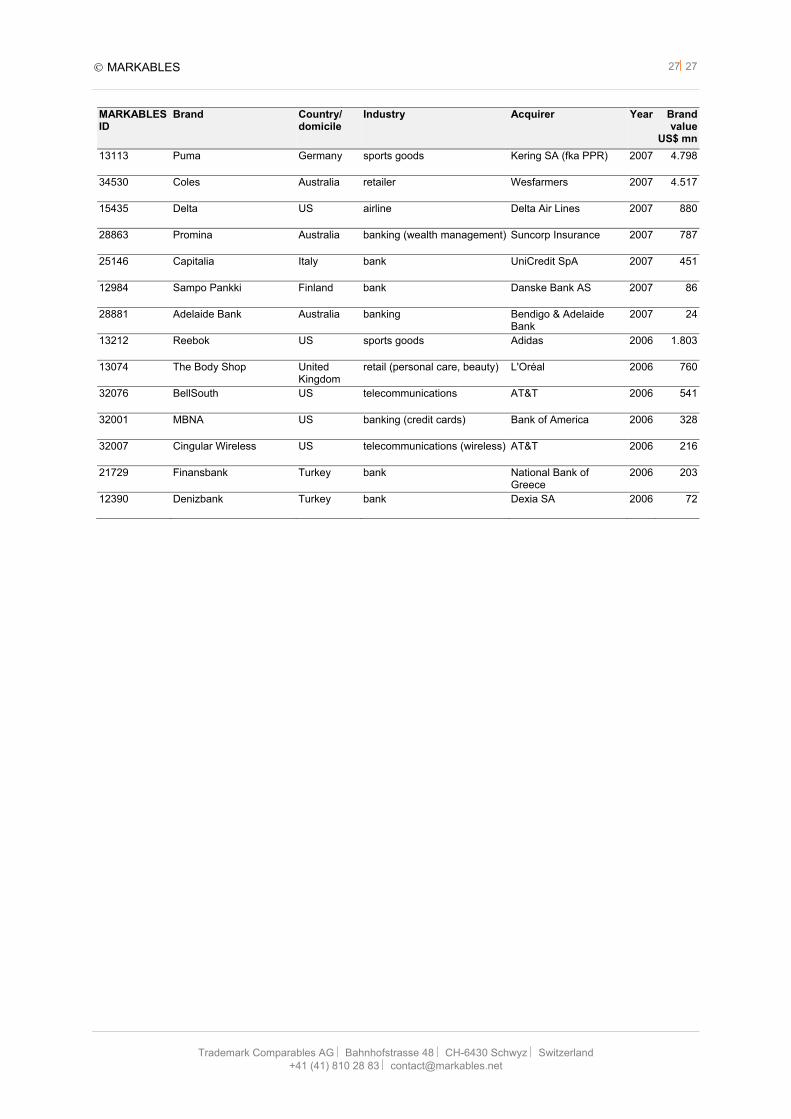
MARKABLES 2727
Trademark Comparables AG Bahnhofstrasse 48 CH-6430 Schwyz Switzerland +41 (41) 810 28 83 [email protected]
MARKABLES ID
Brand Country/ domicile
Industry Acquirer Year Brand value
US$ mn
13113 Puma Germany sports goods Kering SA (fka PPR) 2007 4.798
34530 Coles Australia retailer Wesfarmers 2007 4.517
15435 Delta US airline Delta Air Lines 2007 880
28863 Promina Australia banking (wealth management) Suncorp Insurance 2007 787
25146 Capitalia Italy bank UniCredit SpA 2007 451
12984 Sampo Pankki Finland bank Danske Bank AS 2007 86
28881 Adelaide Bank Australia banking Bendigo & Adelaide Bank
2007 24
13212 Reebok US sports goods Adidas 2006 1.803
13074 The Body Shop United Kingdom
retail (personal care, beauty) L'Oréal 2006 760
32076 BellSouth US telecommunications AT&T 2006 541
32001 MBNA US banking (credit cards) Bank of America 2006 328
32007 Cingular Wireless US telecommunications (wireless) AT&T 2006 216
21729 Finansbank Turkey bank National Bank of Greece
2006 203
12390 Denizbank Turkey bank Dexia SA 2006 72