Embed Size (px)
Citation preview

ORKLABRANDED CONSUMER GOODS
1994 1993
OPERATING REVENUE1) 16,308 13,739
OPERATING PROFIT1) 1,118 1,022
OPERATING MARGIN2) 6.9 7.4
RETURN ON CAPITAL EMPLOYED2) 16.6 19.5
FINANCIAL INVESTMENTS
1994 1993
PORTFOLIOMARKET VALUE1) 8,194 7,361
UNREALIZED GAINS1) 2,663 2,473
NET ASSET VALUE1) 5,727 5,150
PROFIT BEFORE TAX1) 350 273
CHEMICALS
1994 1993
OPERATING REVENUE1) 3,155 2,806
OPERATING PROFIT1) 349 224
OPERATING MARGIN2) 11.1 8.0
RETURN ON CAPITALEMPLOYED2) 19.3 14.2
1O R K L A A N N U A L R E P O R T 1 9 9 41) NOK million 2) Percent

2 O R K L A A N N U A L R E P O R T 1 9 9 4
OPERATING REVENUE BYGEOGRAPHICAL AREA
■ Norway 66%■ Scandinavia (excl. Norway) 17%■ Europe (excl. Scandinavia) 12%■ USA 2%■ Other 3%
Orkla, one of Norway’s largest listed companies,concentrates its activities on three main areas:Branded Consumer Goods, Chemicals andFinancial Investments. The Group’s sales totalledNOK 20.8 billion in 1994, of which 34% wereoutside Norway. 4,647 of the Group’s 16,873employees were employed abroad.
Orkla is an expertise and market-driven groupwhich bases its expansion and development onproducts and market areas where the opportunitiesof being preferred by customers and consumers aregood. The Group plays an active role in the devel-opment and restructuring of the industries in whichit has its main activities. This is carried out througha combination of internal development measures,acquisitions and cooperative arrangements.
The Group’s main goal is to be the leadingsupplier of branded consumer goods to Nordichouseholds. The Chemicals area is to be developedfurther within global niches based on fine and spe-cialty chemicals. Orkla will continue to be a majorequity investor, primarily in the Nordic region.
Orkla’s branded goods activities account for 79% of the Group’s total sales. Norway continues tobe the main market for Orkla’s branded consumergoods, but sales outside Norway are growing strong-ly following acquisitions in other Nordic countriesin recent years. In Norway Orkla is the market lead-er in most of its business areas. Expansion in recentyears has resulted in leading positions for certainproduct areas on a Nordic basis.
The focus of Orkla’s chemicals activities is onspecialty and fine chemicals, as well as chemical
specialty pulp. The Group has expanded in recentyears, particularly in the first two areas. The chem-icals business has production facilities and salesoffices in Europe, the USA and Asia and its prod-ucts are sold all over the world. Several of theproduct areas hold leading positions in their globalmarkets.
Orkla’s third business area, FinancialInvestments, represents 28% of the Group’s bal-ance sheet and primarily consists of long-termequity investments, mostly in large Norwegiancompanies.
Continuous operation over a number ofdecades has created a solid foundation of experienceand expertise in the three core areas. Systematictraining programmes and interaction betweenGroup companies further strengthen their expertise.
THE GROUP’S HISTORY
The present Orkla is the result of two major mergers: in 1986 between Orkla Industrier andBorregaard and in 1991 between Orkla Borregaardand Nora Industrier.
Orkla Industrier was founded in 1904 toresume the operation of the pyrite mines atLøkken Verk. The mining activity, which datedback to 1654, formed the basis for the develop-ment of a smelting industry. From the latter partof the 1940s onwards the company built up anextensive investment portfolio.
Borregaard was formed in 1918 whenNorwegian interests acquired the British company“The Kellner Partington Paper Pulp Co. Ltd”
OPERATING REVENUEBY MAIN AREA
■ Branded Consumer Goods 79%■ Chemicals15%■ Other 6%
T H I S I S O R K L A

3O R K L A A N N U A L R E P O R T 1 9 9 4
which produced pulp and paper in Norway,Sweden and Austria. From 1960 onwardsBorregaard expanded its activities in chemicals andconsumer products.
The food and beverages group NoraIndustrier, with traditions going back to the1820s, was established in 1978 and developed tobecome Norway’s leading supplier of beer and car-bonated soft drinks. Nora also had major positionsin the Norwegian food market.
The merger in 1986 formed the basis for theOrkla Group’s three areas of focus: BrandedConsumer Goods, Chemicals and FinancialInvestments. With the merger in 1991 the Group’s
position in branded goods was further strengthenedand provided a basis for future Nordic expansion.
BRANDED CONSUMER GOODS
Orkla is a leading supplier of branded consumergoods in Scandinavia. The Branded ConsumerGoods area recorded sales of NOK 16.3 billion in1994, of which 18% was derived from the otherScandinavian countries and 10% from marketsoutside Scandinavia. Orkla is the leading supplierof groceries in Norway and has a broad productrange in a number of sectors.
The Branded Consumer Goods area thusincludes the businesses Orkla Beverages (beer and
RESULT BY AREA
NOK million 1994 1993 1992 1991
Operating profit Branded Consumer Goods 1,118 1,022 1,016 776
Operating profit Chemicals 349 224 158 76
Operating profit Head Office/unallocated 58 (5) (4) (10)
Operating profit Industry area 1,525 1,241 1,170 842
Net financial items Industry area (301) (198) (292) (315)
Profit before tax Industry area 1,224 1,043 878 527
Profit before tax Investment area 350 273 (563) 317
Profit before tax and other items 1,574 1,316 315 844
Other items - - - (236)
Profit before tax and minority 1,574 1,316 315 608
Orkla’s 17,000 employeespossess valuable expertisewhich is decisive for theGroup’s profitability.Pictured on these and thefollowing two pages areemployees from the Group’sbusinesses.
From left:
David Hestevold, store salesman, Sætre
Dorota Ciszek, project assistant, Orkla Media
Tine Hammernes, marketing assistant,Denofa-Lilleborg
Knut Nåmdal, consultantchef, Stabburet Mastemyr
Thor Oscar Wulff, brewer, Ringnes
Kjetil Skjelin, fork lift driver, Stabburet Råbekken

carbonated soft drinks), Orkla Foods (frozenfoods, fresh and chilled meats, spreads, processedvegetables, condiments, juice, jams, squash, cereals,bread and yeast), Orkla Brands (detergentsand cleaning fluids, personal productsand cosmetics, biscuits, snacks andconfectioneries) and OrklaMedia (newspapers andmagazines).
The marketobjective is tobecome Scandina-via’s leading supplierof branded consumergoods, with selected nichepositions internationally. Forcertain product areas this ambition has largely
been realised, while for others Norwayremains the main market.
Orkla is now the Nordic region’slargest supplier of biscuits with opera-tions in Norway, Sweden and Finland.The food products business is expandingin the other Scandinavian countries andhas operations in Norway, Sweden andDenmark. The Group is Scandinavia’slargest supplier of berry- and fruit-basedproducts.
Several of Norway’s best-known brands areowned by Orkla, which is the market leader inbeer, carbonated soft drinks, a broad range of foodproducts, confectionery, biscuits, detergents, aswell as personal products and cosmetics. In the
case of chocolate and snacks, Orkla holds solidnumber two positions. Several of the Group’sproducts hold a strong position in the catering
sector.Orkla’s newspaper business is
concentrated on local newspa-pers with leading market posi-tions. The media business alsoowns 50% of Hjemmet
Mortensen, through which it hasstrong positions in the Norwegian
magazine market. In recent yearsOrkla Media has acquired holdings in several
Polish local newspapers and magazines.The Group maintains and strengthens the
Branded Goods area’s market positions throughcost-saving programmes and increased expenditureon advertising and product development. Orklahas established its own Branded Goods School,with the aim of further improving quality at alllevels and strengthening the transfer of know-howbetween product areas.
Orkla has long-term cooperation agreementswith Unilever covering detergents and personalproducts, and with The Coca-Cola Company forcarbonated soft drinks.
CHEMICALS
The Chemicals area holdsimportant global nichepositions in specialty andfine chemicals and isEurope’s leading producer
4 O R K L A A N N U A L R E P O R T 1 9 9 4
T H I S I S O R K L A

of chemical specialty pulp. 82% of the area’s totalsales in 1994 of NOK 3.2 billion were derivedfrom outside Norway. The chemicals area hasplants in several European countries and the USAand is now strengthening its presence in Asia.
Specialty chemicals include lignin-based bind-ing and dispersing agents for applications in ani-mal feeds, agrochemicals, oil drilling, cement anddyes. The wide range of applications means thatthere is little cyclicality in the business.Expenditure on research and development has ledto a range of added value products and strongmarket positions.
In its fine chemicals business Orkla is animportant supplier of intermediate products fornon-ionic X-ray contrast agents. As the world’s onlyfull range supplier of vanillin, Orkla has a solid glo-bal number two position. The recently acquireddiphenol business in Italy strengthens thevanillin area and permits growth in phar-maceuticals and agrochemicals.
Specialty pulp is used in, amongother things, textiles, photographic
paper and in the production ofthickening agents in foods.
Orkla owns considerable for-est and hydro power resources.
The Chemicals area focuses on cost-efficiency, product specialisation and onincreasing its market orientation.Expansion will continue in selected areas of specialty and fine chemicals.
FINANCIAL INVESTMENTS
Through its investment activities, Orkla hasestablished a broad overview and contact net-work in the Norwegian and international finan-cial markets. The insights this provides also con-tribute to the development of the Group’sindustrial activities. At the same time, proximityto an industrial environment gives theInvestment area access to know-how and analy-sis which most portfolio investors lack. Theoverall effect of this interaction is valuable forthe entire Group.
Orkla owns one of Norway’slargest securities portfolios, con-centrated on share holdings inNorwegian listed companies.Stockbroking and other financialservices are provided through the
company Orkla Finans.The market value of
the portfolio at 31.12.1994was NOK 8.2 billion, of whichclose to NOK 2.7 billion represent-ed unbooked, unrealised gains. Netasset value (the market value less debt)was NOK 5.3 billion. Investment deci-sions are based on the company’s ownresearch with a long term focus.
5O R K L A A N N U A L R E P O R T 1 9 9 4
Pictured from left:
Leif Thomassen, driver, Ringnes
Ihne Vagmo, sales assistant, Stabburet
Reinert Fure, researcher, Borregaard
June Anna Teigen, mechanic, Borregaard
Anh P. Tran, laboratoryengineer, Borregaard
Ole Dahl, analyst,Financial Investments
1994 was a good year for Orkla. The Industryarea continued to maintain profit growth. TheInvestment area achieved a return well above theOslo Stock Exchange All Share Index. Earningsper share rose 15% to NOK 24.00.
The Group took further important stepsduring 1994 in pursuit of its strategy andexpansion by the Branded Consumer Goodsarea in the Nordic region continued. Orklabecame the market leader in the Nordic bis-cuits market through exercising its option topurchase the remaining 51% of GöteborgsKex, and by acquiring the Finnish biscuits producer Kantolan. Orkla Media strengthenedits position through acquisitions in bothNorway and Poland. The Chemicals areamaintained growth in its core areas throughthe acquisition of international businesses inthe fine chemicals area and through furtherinvestments in a new fine chemicals plant inNorway. Orkla sold several businesses outsidethe Group's core areas in 1994 and early in1995. This has released a significant amount ofcapital and contributed to increased focus onthe core businesses.
Programmes for developing the organisa-tion and know-how have continued. A new per-sonnel and management development systemhas been brought into operation. Skills trainingin the Group has continued in important areasand was further strengthened.
RESULTS
The Group’s profit before tax rose by 20% toNOK 1,574 million. The profit for the yearafter tax and minority interests was NOK 1,149million (up 17%) which corresponds to NOK24.00 per share against NOK 20.80 in 1993.The Industry area made progress and capitalgains realised on the equities portfolio were larg-er than in the previous year.
The Group’s operating revenues were NOK20,780 million, an increase of 16% from 1993.Sales by businesses acquired in 1994 amounted toapproximately NOK 1.3 billion. In addition, the
full-year effect of companies purchased in 1993,and good volume growth for several Group com-panies, contributed to a rise in turnover.
The Group’s operating profit rose by 21%to NOK 1,541 million. The operating marginwas 7.4% against 7.1% in the previous year.
Operating profit for Branded ConsumerGoods rose by 9% to NOK 1,118 million. Theoperating margin was lower, however, in 1994than in 1993. The beverages business improvedits operating margin in spite of the fact thatresults, particularly in the first part of 1994,were negatively affected by the relocation andphasing-in of the new bottling plant atGjelleråsen outside Oslo. In addition, there wasa weaker development for Ringnes’ operationsin Poland. Continued cost-savings result inimproved margins for Orkla Media. OrklaFoods increased its advertising and productdevelopment expenditure substantially in 1994.Together with slightly lower price levels, this hasled to a reduction in the operating margin inspite of major cost-reductions. Orkla Brands’operating margin also fell, mainly due to poorresults for the confectionery business where areorganisation to wholesale distribution inNorway weakened profitability. The interna-tional confectionery business also developednegatively and the profit and loss account hasbeen charged with a write-down of assets atNeedlers of NOK 18 million.
The operating profit for the Chemicals areawas NOK 349 million against NOK 224 mil-lion in 1993. Economic recovery in Europe hasled to higher prices and continued specialisationhas resulted in a better product mix. In addi-tion, the area has increased production capacityfor certain products and generally achievedhigher productivity. The operating profit hasalso been positively influenced by a gain ofNOK 50 million on the disposal of the poly-mers business in November 1994. The operat-ing margin was 11.1% against 8.0% for 1993.
Profits from associated companies wereNOK 129 million against NOK 219 million in
6 O R K L A A N N U A L R E P O R T 1 9 9 4
0
10
20
30
40
4.3
20.824.0
NOK
0
10
20
30
40
50
92 93 94
31.5
39.8
46.6NOK
0
500
000
500
2000
92 93 94
1,2701,190
1,541
NOK million
EARNINGS PER SHARE
CASHFLOWPER SHARE
OPERATING PROFIT
92 93 94
R E P O R T O F T H E B O A R DO F D I R E C T O R S

the previous year. The reduction is mainly dueto the gain on the disposal of the shareholdingin TVNorge being booked in 1993. Jotun(41.6% owned) experienced a slight fall in prof-its in 1994, mainly as a result of an extraordi-nary write-down of NOK 30 million relating to goodwill in an Italian subsidiary. In HjemmetMortensen (50.0% owned) the benefits fromsynergies following the merger of the two com-panies in 1992 improved profits in 1994 com-pared with the previous year. Frionor (44.8%owned) also showed an improvement in resultsfrom 1993.
The Industry area’s return on capitalemployed was 17.6% against 18.0% in 1993.The high rate of expansion, involving majorinvestments, tends to reduce the return on capi-tal in the short term. An unchanged level ofreturn is therefore considered satisfactory.
The Investment area’s value-adjusted returnwas 9.5%, which is 2.4 percentage points betterthan the increase in the Oslo Stock ExchangeAll Share Index. The booked result before taxrose by NOK 77 million to NOK 350 million.Capital gains amounted to NOK 418 millionagainst NOK 350 million in 1993. Unrealisedcapital gains increased by NOK 190 millionand totalled NOK 2,663 million at 31.12.1994.The market value of the portfolio at the end ofthe year was NOK 8,194 million, which repre-sents an increase of NOK 833 million in 1994.Net share purchases totalled NOK 225 million.
The Group’s net financial expenses wereNOK 514 million, NOK 9 million less than in1993. Interest rate levels during 1994 were onaverage lower than in the previous year. Thiswas balanced by higher net interest-bearingdebt due to the high rate of investment.
The tax charge amounts to NOK 410 million, equivalent to 26.0% of the profitbefore tax.
The Board is satisfied with the developmentin the Group’s profits and proposes a dividendpayment of NOK 5.00 per share, an increase of22% from 1993.
STRATEGIC DEVELOPMENT
During 1994 Orkla has prepared a strategicplan for the next three years. The Group’s strat-egy, based on the three core areas of BrandedConsumer Goods, Chemicals and FinancialInvestments will be maintained. With effectfrom 1 January 1995, the Group’s holding inHelly-Hansen will be reported under theInvestment area and Viking Fottøy under HeadOffice/unallocated, so that the BrandedConsumer Goods area now consists of the busi-nesses Orkla Beverages, Orkla Foods, OrklaBrands and Orkla Media.
An important feature of the Group’s strate-gy is the development of know-how. Key ele-ments in this programme are the Orkla BrandedGoods School and a recently established schoolfor industrial marketing. Further resources arealso being devoted to skills training for opera-tives in the Group’s businesses.
The main goal of the Branded ConsumerGoods business is to strengthen its position inthe Nordic region. Emphasis is also beingplaced on improvements in competitivenessthrough lower unit costs, brand developmentand improved customer service. Further cost-reduction targets have been established andattention will be devoted to establishing systemswhich secure improved utilisation of advertisingexpenditure. Greater focus will also be broughtto bear on product development.
Orkla has enjoyed good cooperation withUnilever in the field of detergents and personalproducts since 1958. In February 1995, arevised agreement was signed which will rununtil 2014 and which extends the cooperationalong similar commercial principles as before.
The strategy of the Chemicals business willbe continued international growth and furtherspecialisation in the core areas of SpecialtyChemicals, Fine Chemicals and Specialty Pulp.Improved competitiveness through continuingproductivity measures and a greater level of spe-cialisation are also important elements.
The Investment area’s strategy is based on
7O R K L A A N N U A L R E P O R T 1 9 9 4
0
2
4
6
8
10
92 93 94
92 93 94
7.1 7.1 7.4
%
%
0
5
10
15
2018.0 18.0 17.6
OPERATING MARGINTHE GROUP
RETURN ON CAPITAL EMPLOYED,INDUSTRY AREA

the competitive advantages the area holds in theNordic equities markets as part of an industrialgroup. Efforts to build up expertise will contin-ue undiminished. Internationally, investmentswill mainly be made in selected sectors wherethe Investment area has particular expertise.
During 1994 and early 1995 Orkla tookimportant steps in implementing its strategy.Following the purchase of the remaining 51%of Göteborgs Kex and the Finnish biscuits pro-ducer Kantolan (previously Delicant), Orkla’sbiscuits business became market leader in theNordic region. During 1994 Orkla Media hasstrengthened its position through the purchaseof two leading local newspapers, DrammensTidende & Buskeruds Blad on 1.1.1994 andVarden on 1.7.1994. Further investments in thePolish media sector were made in 1994.
On 1.11.1994 the Chemicals area acquiredEniChem Synthesis’ diphenol business in Italy.Diphenols are used, among other things, as araw material in the production of vanillin.EniChem Synthesis’ 50% interest in EuroVanillinwas acquired at the same time, so this companyis now 100% owned. The transaction alsoincluded a 55% interest in a plant under con-struction in China, which will produce agro-chemicals. Towards the end of 1994 the finechemicals business’ new plant for the produc-tion of intermediates for non-ionic X-ray con-trast agents, was commissioned in Sarpsborg.Overall, the fine chemicals business strength-ened its position substantially in 1994. Duringthe autumn Borregaard sold its polymers opera-tion which was no longer a core business for theChemicals area.
On 1.8.1994 Orkla sold the Emo groupwith a book gain of NOK 31 million. In January Norgro was sold, giving an estimatedgain in 1995 of NOK 10 million. Both Emoand Norgro had been defined as outside theGroup’s core areas. In February 1995 50% ofthe shares in Helly-Hansen were sold, realising a book gain of NOK 67 million.
In total for 1994 and 1995 these sales have
released approximately NOK 700 million ofcapital.
OPERATING PARAMETERS
The economic recovery which has followed thefall in interest rates in 1993 has led to generallybetter operating parameters for Scandinavianindustry. In Norway and Denmark householdsavings ratios have fallen and private consump-tion increased. In Sweden and Finland the cur-rency depreciation in 1992 improved conditionsfor exporting companies and thereby led to eco-nomic recovery. In Sweden, however, the situa-tion is influenced by weak government financesand high interest rate levels.
1994 was characterised by the national refer-enda on EU membership in four of the six EFTAcountries. Norway, in contrast to Austria,Finland and Sweden, chose to remain outside theEuropean Union. In the short term this is not ofparticular importance for the Orkla Group as awhole. In the longer term the consequences of anEU border with two of our closest neighbours areuncertain. An important element in Orkla’s strat-egy for the Branded Consumer Goods area is tobe able to utilise production resources, know-how, product development and marketing meas-ures across the Nordic market and thus improveprofitability and productivity. This strategy willbe maintained, subject to relevant trade policies.
Norwegian exporters have found that EUcustoms duties on certain product areas arehigher than the new member countries previ-ously imposed. The Norwegian government hastherefore commenced negotiations with the EUwith a view to improving market access forNorwegian products. At the same timeNorwegian import protection has been restruc-tured as of 1.1.1995, following implementationof the GATT agreement, to a duty-based systeminstead of import prohibitions or quotas. In addition, indications have been given thatNorwegian import protection will be furtherreduced. Orkla’s group companies have consid-erably improved productivity year-on-year, in
8 O R K L A A N N U A L R E P O R T 1 9 9 4
85 86 87 88 89 90 91 92 93 94
0
2
4
-2
6Source: DLF
% growth from previous year
VOLUME IN GROCERYRETAILING, NORWAY

order to adapt to greater competition as a resultof the continuing liberalisation process. It is alsonecessary that the Norwegian government dealswith raw materials and finished productstogether in its negotiations with the EU so thatdifferences in the treatment of Norwegian andforeign manufacturers can be avoided.
With effect from 1 January 1995, the limi-tation on foreign ownership established by theNorwegian Concession Act was abolished. Thiscould affect demand and valuation in theNorwegian stock market, thus improving accessto equity for Norwegian companies. The regu-lations governing life insurance companies wereslightly improved in 1994, but it is important,however, to continue these measures so that thelife insurance companies can use long-termevaluations as a basis for their investment poli-cy. Ownership of Norwegian listed companiesby private individuals has been falling for manyyears. The authorities should use tax policy tocreate the conditions to enable private individu-als once again to form a larger and more activeinvestor group in Norwegian quoted companies.The current system of adjusting the opening val-ue for tax purposes by the company’s taxed capi-tal (RISK) is so complicated that it is unlikely topromote private equity investment. These issuesare of particular importance with regard to thelong-term potential for maintaining a reasonablelevel of Norwegian ownership.
MARKET CONDITIONS
AND MARKETING MEASURES
Preliminary statistics show that the Norwegiangrocery market recorded volume growth of 2.5-3.0% in 1994, which is a higher rate of growththan in previous years. In grocery retailing,supermarkets have increased their market sharesat the expense of discount stores, which haveextended their product range. In Sweden thegrocery market grew by 1.3%, which is betterthan in 1993 when the market fell. There wasvolume growth in the Danish market for gro-ceries of around 2.5%.
In Orkla’s branded consumer goods businessesthe market for carbonated soft drinks showedparticularly strong growth, up 14% in 1994.There were also good advances by the marketsfor personal products and detergents. The beermarket reported growth of 2% in 1994 afterseveral years of decline.
Orkla’s businesses generally maintained orincreased their market shares in 1994, in spiteof greater competition from both foreign sup-pliers and private brands. This is a result ofsteady improvements in unit costs, strongbrands and a greater focus on consumer-orientedproduct development. Orkla’s advertisingexpenditure rose by 28% compared with 1993.During 1994 a large number of successful newlaunches took place with advertising support.Examples include Dove soap and Organics haircare products in the personal products area, turkey-based products under the brand Arionon the food side, Blenda Sensitive and JIFMicro in the detergents market and TAB X-tra,a sugar free cola drink.
9O R K L A A N N U A L R E P O R T 1 9 9 4
0
0
0
0
0
ADVERTISING EXPENSES
100115
146
188Index 1991=100
91 92 93 94
STOCKMARKET PERFORMANCE OSLO AND INTERNATIONALLY
0
1
2
3
4
5
6
7
94 93 92 91 90 89 88 87 86 85 84 83
■ London■ Oslo ■ Tokyo■ New York
Lines ending at Feb. 95
Source: Oslo Stock Exchange All Share Index, Dow Jones Industrial Average,FT-SE 100, Nikkei Index
In the Chemicals area the economic recovery inEurope has led to improved market conditions.There continues to be a high level of activity inthe USA and strong growth in the Far East.Demand has risen, but this was not reflected insignificant price increases in 1994 for Borregaard’smain product groups.
The Oslo Stock Exchange was affected dur-ing large parts of the year by interest rateinstability and uncertainty ahead of the referen-dum on EU membership. Following the referen-dum result on 28 November, the marketimproved and during the year the Oslo StockExchange All Share Index rose by 7.1%.Internationally, there was a relatively weakdevelopment on the major European exchangeswhile the Japanese market developed very posi-tively over the year. The FT World Index inlocal currencies fell by 2.1% in 1994.
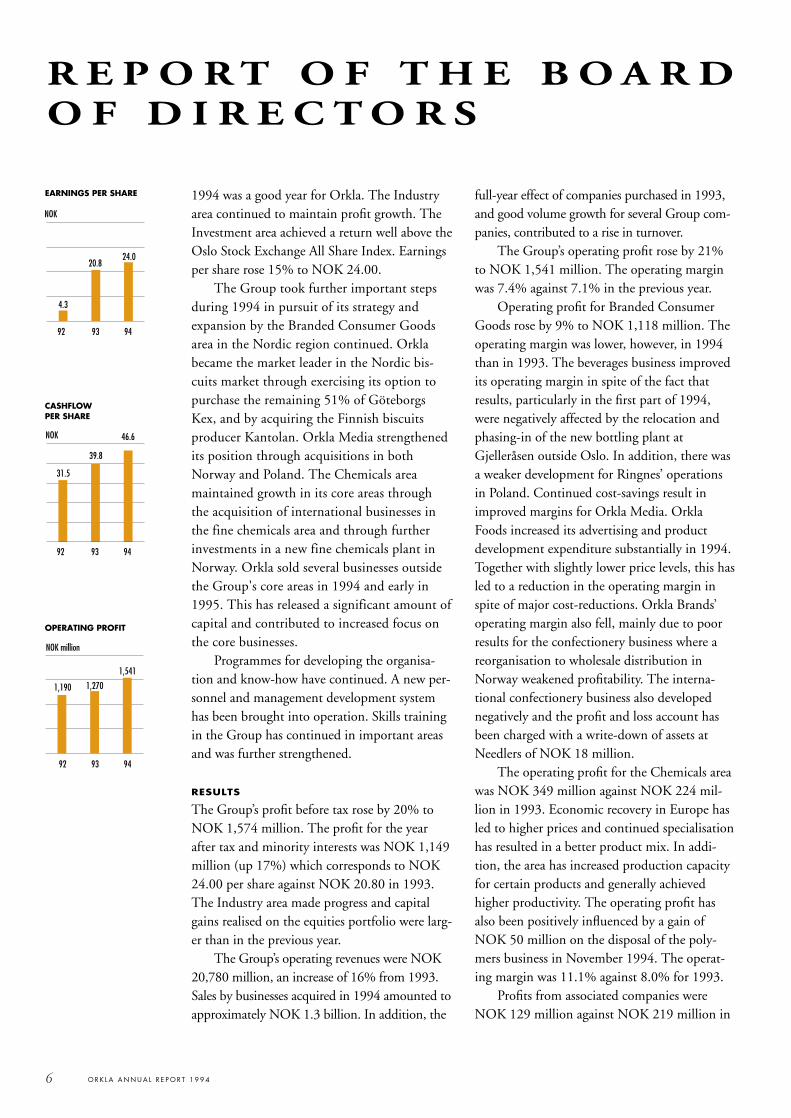
INTERNATIONALISATION
Sales outside Norway amounted to 34% of theGroup’s total operating revenues in 1994, whichis 4 percentage points higher than in the previ-ous year. 18% of sales took place outside theNordic region. Foreign sales have risen consider-ably in recent years, as a result of Orkla’s long-term strategy of reducing its dependence on theNorwegian market.
In the Branded Consumer Goods area,international growth has mainly been in theother Nordic countries. The acquisition of theremaining shares in Göteborgs Kex and the full-year effect from BOB Industrier contributedmost to the increase from 1993. In addition,there has been a positive development in the saleof Norwegian manufactured products such asfrozen pizza through distribution channels inthe rest of the Nordic region.
In the Chemicals area international growthhas been outside the Nordic region, mainly as aresult of good demand growth in Europe. Theopening of a new APD plant and purchase ofthe diphenol business in Italy also contributedto growth in international sales.
PRODUCTIVITY MEASURES
The Group’s measures to increase efficiency haveagain produced results in 1994. Fixed costs mea-sured as a proportion of operating revenues fellfurther and totalled 25.5% against 27.3% in theprevious year. This enables the Group to expandmarket shares over the long term through moder-ate price increases and a higher level of invest-ment in brand and product development withoutweakening the operating margin.
During the year Ringnes’ bottling plants inEastern Norway were grouped at Gjelleråsen,and this significantly reduced costs during thelatter part of 1994.
Projects, including standardisation of ITsystems, were commenced in 1994 in order toimprove the efficiency of the Group’s adminis-trative staffs.
CASHFLOW, INVESTMENTS
AND CAPITAL SITUATION
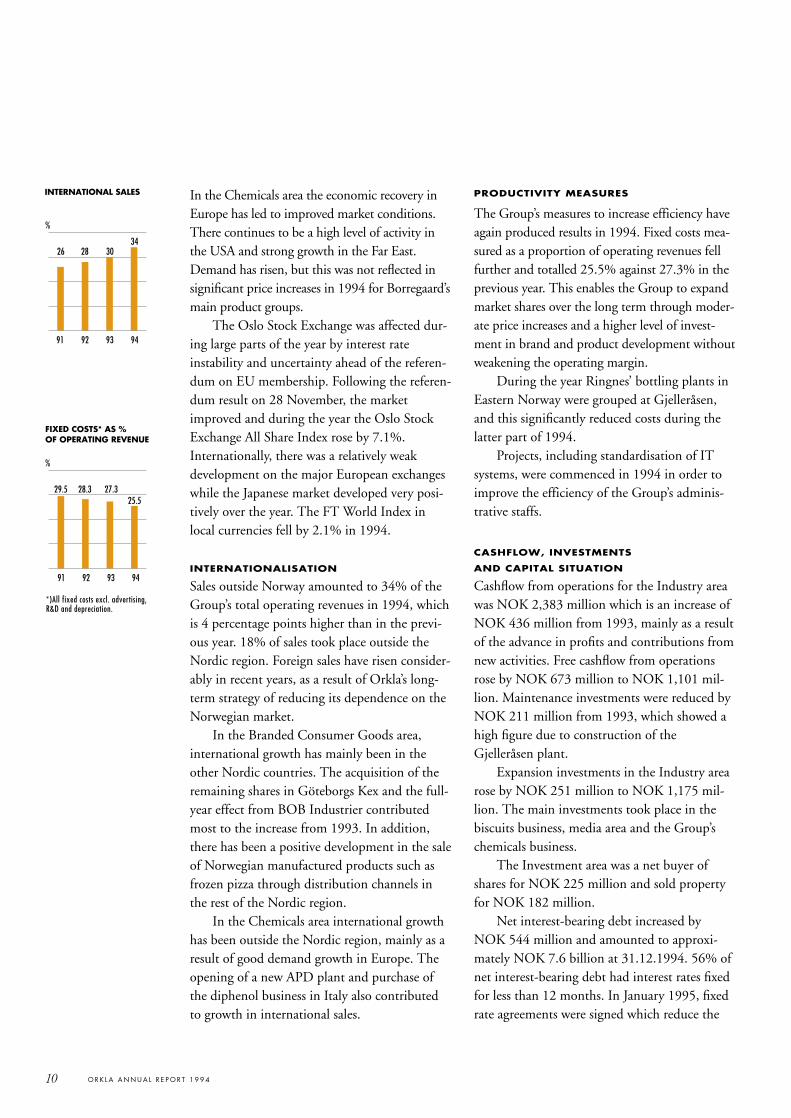
Cashflow from operations for the Industry areawas NOK 2,383 million which is an increase ofNOK 436 million from 1993, mainly as a resultof the advance in profits and contributions fromnew activities. Free cashflow from operationsrose by NOK 673 million to NOK 1,101 mil-lion. Maintenance investments were reduced byNOK 211 million from 1993, which showed ahigh figure due to construction of theGjelleråsen plant.
Expansion investments in the Industry arearose by NOK 251 million to NOK 1,175 mil-lion. The main investments took place in thebiscuits business, media area and the Group’schemicals business.
The Investment area was a net buyer ofshares for NOK 225 million and sold propertyfor NOK 182 million.
Net interest-bearing debt increased byNOK 544 million and amounted to approxi-mately NOK 7.6 billion at 31.12.1994. 56% ofnet interest-bearing debt had interest rates fixedfor less than 12 months. In January 1995, fixedrate agreements were signed which reduce the
FIXED COSTS* AS %OF OPERATING REVENUE
10 O R K L A A N N U A L R E P O R T 1 9 9 4
0
10
20
30
40
91 92 93 94
26 28 3034
0
10
20
30
40
91 92 93 94
*)All fixed costs excl. advertising,R&D and depreciation.
29.5 28.3 27.325.5
%
INTERNATIONAL SALES
%
CASHFLOWINDUSTRY AREA
■ Cashflow from operations■ Net maintenance and
environmental investments
NOK million
proportion to 50%. 31% of debt at 31.12.1994matures in 1995 and the average time to matur-ity was 3.3 years.
During 1994, new loans, including therenegotiation of maturities on existing loans anddrawing facilities, amounted to NOK 8 billion.This figure includes a syndicated loan and draw-ing facility of USD 680 million which wasestablished in December. At 31.12.1994 thishad not been drawn. In addition, Orkla has aliquidity reserve of NOK 3.1 billion of whichNOK 2.3 billion represents committed unutil-ised drawing facilities.
The Group’s equity rose by NOK 656 mil-lion to NOK 7,229 million at 31.12.1994. Theadoption of a new accounting principle on pen-sions has resulted in a charge against equity ofNOK 285 million. The book equity ratio was34.8%. Including unrealised gains on the equityportfolio (before tax), the Group’s equity ratioat 31.12.1994 was 42.0%.
PERSONNEL AND ORGANISATION
The number of employees in the Group at theyear-end was 16,873 of whom 4,647 workedoutside Norway. The increase of 1,792 in rela-tion to 1993 was due to the acquisition of businesses.
The Group’s personnel and managementdevelopment system PLUS was implemented byall Group companies in 1994. The objective isto improve the Group’s professional and man-agement resources through, among other things,career planning and training measures.
Measures to improve skill levels in theGroup’s food manufacturing companies, theFiO project, were continued in 1994.Developing skills and know-how is a priorityarea and makes an important contribution toimplementing the Group’s goals and strategies.25 graduates participated in Orkla’s trainee pro-gramme. Orkla’s Branded Goods School provid-ed training to more than 150 middle managersin 1993 and 1994. In addition, there were 100participants at seminars on consumer and cus-
tomer orientation at the Branded Goods Schoolin 1994.
A corresponding training programme inwhich emphasis is placed on the development ofgood customer relations in industrial sales hasrecently been established. The first course atOrkla’s “Relationships School” began in early1995.
Cooperation with the employee organisa-tions has been good and the Group’s industrialdemocracy schemes have functioned as intend-ed. The Group’s Goals and Values provide abasis for cooperation with employees on futuredevelopment. The Board wishes to thank allemployees in Orkla for their efforts andacknowledges the results that have beenobtained.
HEALTH, ENVIRONMENT AND SAFETY
The number of injuries in relation to hoursworked continues to fall. Sick leave was some-what lower than in the previous year. Groupcompanies have complied with permits relatingto emissions to the external environment withvery few exceptions.
During the year standby organisations havebeen established throughout the Group to han-dle accidents and emergencies. Exercises andtraining will continue to ensure focus on safetyin the Group.
During the year several Group companiescompleted ISO standard certification.
The first subproject of the Orkus researchproject on the relationship between the workingenvironment, injuries, sickness and insurancehas recently been completed. Several of themain Group companies have participated in astudy of the working environment. The resultswill be particularly relevant to measures toimprove the working environment in participat-ing companies.
11O R K L A A N N U A L R E P O R T 1 9 9 4
0
10
20
30
40
92 93 94
36.1 34.7 34.8%
DEBT AND EQUITY
■ Net interest-bearing debt■ Equity (incl. min.int.)
NOK billion
EQUITY RATIO
0
0
0
0
0
0
92 93 94
2,2441,947
891
2,383
794 1,102
0
2000
4000
6000
8000
92 93 94
6.0 6.8
7.67.1
5.1
7.4

ALLOCATION OF THE
PROFIT FOR THE YEAR
Orkla A.S has a profit after group transfers ofNOK 909 million. The Board proposes the fol-lowing allocations (NOK million):
Allocated to dividend (236)Transferred to the legal reserve (77)Transf. from temporary restricted reserve 36Transferred to free reserves (632)Total (909)
FUTURE PROSPECTS
Volume growth in the Norwegian grocery mar-ket is expected to be lower in 1995. In the otherNordic countries there is particular uncertaintyas to trends in the Swedish market as a result ofthe expected tightening in the households’financial position. A gradual reduction inNorwegian import protection for agricultural
goods will lead to greater competition. Orklawill respond to this development with furthermeasures to improve competitiveness by reduc-ing unit costs and increasing expenditure onproduct and brand development.
The cyclical upturn in Europe is expectedto continue and will provide better demand forthe Group’s Chemicals area. Prices of cyclicalproducts are rising and this will have a positiveimpact on Borregaard in 1995, even thoughmore moderate price growth must be expectedfor the area’s specialised qualities.
The economic recovery is expected to leadto better profits for listed companies. At thesame time a significant increase in inflation isnot expected, partly because the supply oflabour continues to be good. This is expected to result in stable interest rate levels. The condi-tions therefore should be in place for a goodperformance by equity markets.
12 O R K L A A N N U A L R E P O R T 1 9 9 4
Lysaker, 22 February 1995
The Board of Directors of Orkla A.S
Svein Ribe-Anderssen Odd Gleditsch jr. Truls Holthe Roger JohansenChairman
Kjell Kjønigsen Knut Leversby Jørgen B. Lysholm Harald Norvik
Stein Stugu Egil Friberg Jens P. Heyerdahl d.y.Observer Group Chief Executive

13O R K L A A N N U A L R E P O R T 1 9 9 4
P R O F I T A N D L O S S A C C O U N TO R K L A G R O U P
Amounts in NOK million Note 1994 1993 1992
Operating revenue 1 20,780 17,858 16,807
Raw materials, goods in process and finished goods (9,176) (7,891) (7,538)
Wages and other personnel costs 2 (4,356) (3,803) (3,540)
Other manufacturing, selling and administrative expenses 5 (4,589) (3,959) (3,678)
Ordinary depreciation 15 (1,118) (935) (861)
Operating expenses (19,239) (16,588) (15,617)
OPERATING PROFIT 1,541 1,270 1,190
Profits from associated companies 14 129 219 112
Financial items, net 6 (514) (523) (606)
Portfolio gains, net 7 418 350 (381)
PROFIT BEFORE TAXES AND MINORITY INTERESTS 1,574 1,316 315
Taxes 8 (410) (317) (100)
Minority interests 13 (15) (15) (4)
PROFIT FOR THE YEAR 20 1,149 984 211

14 O R K L A A N N U A L R E P O R T 1 9 9 4
Amounts in NOK million Note 1994 1993 1992
ASSETS
Cash and bank deposits 9 1,000 635 787
Portfolio investments 4 5,531 4,888 3,766
Accounts and other short-term receivables 5 3,161 2,717 2,207
Inventories 10 2,063 1,794 1,779
Current assets 11,755 10,034 8,539
Interests in associated companies 14 1,014 1,172 970
Shares and investments in other companies 11 92 137 177
Other receivables 3 449 1,039 1,108
Goodwill 15 1,500 951 675
Fixed assets 15 6,592 6,159 5,274
Long-term assets 9,647 9,458 8,204
Total assets 21,402 19,492 16,743
L IABIL IT IES AND EQUITY
Short-term interest-bearing liabilities 16, 17 2,653 1,739 1,617
Short-term interest-free liabilities 12 4,452 3,803 3,497
Current liabilities 7,105 5,542 5,114
Long-term interest-bearing liabilities 16, 17 6,039 6,003 4,419
Long-term interest-free liabilities 18 816 1,177 1,167
Long-term liabilities 6,855 7,180 5,586
Minority interests 13 213 197 206
Share capital 1,219 1,219 1,219
Other equity 6,010 5,354 4,618
Equity 20 7,229 6,573 5,837
Liabilities and equity 21,402 19,492 16,743
Mortgages 21 350 426 690
Guarantees and other commitments 19, 21, 22 548 349 313
B A L A N C E S H E E TO R K L A G R O U P

15O R K L A A N N U A L R E P O R T 1 9 9 4
Amounts in NOK million 1994 1993 1992
Industrial activities (including Head Office):
Operating profit 1,526 1,241 1,170
Ordinary depreciation 1,107 923 857
Changes in net working capital (250) (217) 217
Cashflow from operations 2,383 1,947 2,244
Net maintenance and environmental investments (891) (1,102) (794)
Free cashflow from operations 1,492 845 1,450
Financial items, net (391) (417) (425)
Free cashflow from industrial activities (incl. H.O.) 1,101 428 1,025
Cashflow from investment activities beforenet purchases/sales of shares and real estate (93) (92) (161)
Tax, dividends and cash consideration paid (522) (431) (499)
Miscellaneous capital transactions 188 84 126
Group's self-financing capacity 674 (11) 491
Expansion investments in industrial activities (1,175) (924) (802)
Net purchase/sale of portfolio shares (225) (772) 677
Net purchase/sale of properties (Investment area) 182 (256) -
Net cashflow (544) (1,963) 366
Change in gross interest-bearing debt 951 1,706 (368)
Change in liquid assets/interest-bearing receivables (407) 257 2
Change in net interest-bearing debt 544 1,963 (366)
Cashflow from operations expresses the gross cashflow generated by the industrial activities (incl. H.O.), adju-
sted for changes in funds employed in providing working capital.
Free cashflow from operations represents the industrial activities (incl. H.O.) debt service capacity and the abi-
lity to expand when the current level of activity has been maintained through renewal and environmental investments.
Free cashflow from Industrial activities (incl. H.O.) shows the industrial activities ability to expand after
financial items.
Group´s self-financing capacity represents the amount the Group can use for expansion investments without
increasing net interest-bearing debt.
Net cashflow shows the Group’s ability to repay debt/borrowing requirement after expansion investments, dividend
payments, taxes and miscellaneous capital transactions.
C A S H F L O W S T A T E M E N TO R K L A G R O U P

1994 GROUP ACCOUNTS
The Group accounts for 1994 have been prepared using thesame principles and groupings of items as in previous years,with the following exception:
The Group has introduced a new principle for the record-ing of pensions and now follows the draft Norwegian account-ing standard on pension expenses issued by the NorwegianAccounting Standards Foundation. The new Norwegian stan-dard is similar to the international (and American) principlesand is based on recording pension costs as they are incurred andensuring that they are systematically and fairly allocated overthe period of earnings. The introduction of this standard can beconsidered as a fundamental accounting change and the effect(NOK 285 million) has thus been charged directly against theGroup’s equity at the beginning of the year. Previous annualaccounts have not been restated. The Group’s pension expenses,calculated under the old principle, totalled NOK 96 million in1993. Costs under the new principle amounted to NOK 86million for 1994, which is an indication of future levels.
GENERAL
The Group accounts show the consolidated result and finan-cial position of the parent company Orkla A.S and its inter-ests in other companies. Interests in companies where theGroup holds more than 50% of the capital and exerts a dom-inant influence are fully consolidated in accordance with thepurchase method. Interests in joint ventures, with theexception of limited companies, where Orkla, together withothers, has a decisive but not controlling influence, are con-solidated pro rata in accordance with the gross method.Interests in associated companies where the Group has astrategic interest and significant influence (20-50%), areaccounted for in accordance with the equity method.
The purchase prices for assets and liabilities in subsidiar-ies, joint ventures and associated companies are used as abasis for recording results in the Group accounts. TheGroup’s equity comprises the parent company’s equity andamounts earned subsequent to the above-mentioned compa-nies becoming subsidiaries, less amortization of amounts paidfor tangible assets in excess of book values, goodwill andminority interests.
ACCOUNTING AND
CONSOLIDATION PRINCIPLES
Each of the company accounts consolidated in the Grouphave been prepared using consistant accounting and valua-tion principles, and the presentation of captions in the profitand loss account and balance sheet has been made using uni-form definitions.
Shares in subsidiaries are eliminated and the purchaseprice of the shares is replaced by the company’s assets andliabilities, valued at the cost price to the Group. The differ-ence between the purchase price for the shares and thecompany’s aggregate equity capital at the date of acquisitionis allocated to those company assets (or liabilities) which havemarket values different from the book value, with any residu-al value being treated as goodwill in the Group accounts.
Foreign subsidiaries which are not an integrated part ofthe parent company are translated using the year endexchange rate for the balance sheet and the average exchangerate for the year for the profit and loss account. Translationdifferences are charged directly against equity. Foreign subsid-iaries which operate as an integrated part of the parent com-pany are translated using the year end exchange rate for mon-etary balance sheet items and the historic rate for non-mon-etary balance sheet items. In the profit and loss account,depreciation and the cost of materials are translated using thehistoric rate, other items are translated using the averageexchange rate for the year. Translation differences are record-ed within the caption ´other financial items´. In countrieswhere the accumulated inflation over the three preceedingyears exceeds 100%, the accounts have been inflation-adjust-ed. Depreciation and the book value of operating assets aretranslated at the exchange rate in effect on the date of acqui-sition. The profit and loss account is translated using theaverage exchange rate for the year. Other balance sheet itemsare translated at the year-end exchange rate. Translation dif-ferences are recorded within the caption ´other financialitems´.
Shares in joint ventures, with the exception of limitedcompanies, are eliminated using the same principles as forsubsidiaries. Orkla’s share of each caption is included withinthe Group accounts (the gross method).
Shares in associated companies are consolidated sepa-rately and the Group’s share of the results after amortizationof goodwill is added to the cost of the investment. The treat-ment of goodwill in associated companies is based on thesame principles as for subsidiaries.
The Group’s interests in the limited companies Jotun,Hjemmet Mortensen and three media companies in Polandare treated as associated companies, with the exception of thetax charge which is included within the caption ´other taxes´in the Group´s profit and loss account. These interests wouldhave been treated in accordance with the guidelines for jointventures as set out in the draft Norwegian AccountingStandard if the necessary amendments to the Companies Acthad been made.
16 O R K L A A N N U A L R E P O R T 1 9 9 4
A C C O U N T I N G P R I N C I P L E S
CLASSIFICATION, VALUATION AND ACCRUAL
PRINCIPLES
The accounts are based on the fundamental principles of his-toric cost, accruals, going concern, consistency and prudence.
Classification of current assets in the accounts is deter-mined as all assets related to the stock cycle, receivables duewithin one year and “assets not intended to be permanentlyretained or used in the business”. Other assets are classified asfixed assets. The difference between short and long-termliabilities is determined at one year prior to the maturity date.
Valuation of current assets is made at the lower of origi-nal cost and market value. Fixed assets are valued at originalcost less accumulated ordinary depreciation.
If the market value of a fixed asset has suffered a perma-nent diminuation, it will be written down.
Accounts receivable are valued at the year end expectedrealisable value. The Group’s aggregate provision for baddebts on accounts receivable is stated in Note 5.
Inventories of materials are valued at the lower of costand market value based on the FIFO principle. Finishedgoods and goods in process are valued at the cost of process-ing. A provision is made for obsolescence.
Shares and other investments classified as current assetsare financial investments and valued in accordance with theportfolio principle. The portfolio is managed as a whole andan adjustment in value is only made if the aggregate holdingshave a lower market value than original cost. Individualinvestments in the portfolio which have incurred a long-termfall in value are written down. Long-term shareholdings andother interests which are not treated as investments in asso-ciated companies are recorded using the cost method. Thecost method for long-term investments means thatshares/interests are recorded in the balance sheet at originalcost and cash payments received are treated as dividends.
Fixed assets are capitalised and depreciated only if theyhave an economic useful life in excess of 3 years and a costprice in excess of NOK 15,000. Maintenance of fixed assets isrecorded as an operating expense, whereas expenditure onadditions or improvements are capitalised and depreciated inline with the corresponding asset. Asset replacements are cap-italised. Excess values arising from mergers are allocated inthe Group accounts to the relevant fixed assets and depreciat-ed accordingly. Fixed assets are depreciated on a straight linebasis using the following rates: buildings 2-4%, machineryand fixtures 7-15%, transport equipment and reusable crates20%, computer equipment and reusable bottles 25%.
Goodwill. On acquiring another company for a consid-eration which exceeds the value of the individual assets, thedifference, to the extent it represents an economic value, is
recorded in the balance sheet as goodwill. Goodwill is amor-tised over its expected useful economic life, based on calcula-tions made at the time of purchase, but never exceeds 20years. The value of goodwill is written down if the marketvalue is considered to be be less than the book value and thereduction is considered permanent.
Pension matters. Accounting for pension costs is inaccordance with the draft Norwegian accounting standard onpensions. Pension costs and liabilities are calculated by actu-aries using assumptions regarding discount rates, future salaryadjustments, state pension benefits, future returns and actu-arial calculations on deaths and voluntary departures, etc.The pension funds are valued in the balance sheet at marketvalue less net pension liabilities. Any overfunding is recordedin the balance sheet to the extent that it is likely it can beutilised. Changes in pension liabilities due to alterations inthe terms of pension plans are allocated to the profit and lossaccount over the estimated average remaining working life ofpensionable employees. Changes in pension assets and liabil-ities due to changes in and deviations from the calculationassumptions (estimate changes) are allocated to the profit andloss account over the estimated average remaining workinglife of pensionable employees if the differences exceed 10% ofthe gross pension liability (or pension assets if larger).Unamortised differences are disclosed in Note 2.
Foreign exchange. The treatment of foreign exchange inthe Group differs between hedged and unhedged items.“Hedged” means that the economic effect of fluctuations inthe relevant currency has been eliminated. Balance sheetitems which hedge each other are presented using the yearend rate, while balance sheet items which are hedged by off-balance sheet financial instruments are presented using thehedge rate. Hedging transactions undertaken to hedge con-tractual cashflows are valued together with those cashflowswhile any unrealised loss on hedging transactions which donot cover contractual cashflows is expensed within the cap-tion ‘financial items’. Unhedged foreign exchange positionsare treated in aggregate on a portfolio basis. If there is anoverall net loss on the portfolio it is expensed, but net gainsare not recorded as income.
Taxes. The tax charge is based on the financial result andconsists of the aggregate of taxes payable and changes indeferred tax. Deferred tax is calculated in the balance sheet atthe nominal tax rate for timing differences arising betweenaccounting and tax values.
17O R K L A A N N U A L R E P O R T 1 9 9 4

18 O R K L A A N N U A L R E P O R T 1 9 9 4
NOTE 1, Operating revenue
Amounts in NOK million 1994 1993 19921)
Net sales in Norway 13,136 12,126 11,909Net sales in rest of Scandinavia 3,355 2,041 1,720Net sales outside Scandinavia 3,780 3,344 2,912Total net sales 20,271 17,511 16,541Miscellaneous operating revenues 2) 509 347 266Operating revenue 20,780 17,858 16,8071) Revenue of Orkla Finans has been reclassified from "Sales" to "Miscellaneous operating revenues".2) Includes gains on the sale of fixed assets of NOK 129 million in 1994.
NOTE 2, Wages and other personnel costs
Wages and other personnel costs consist of costs directly related to remu-neration of employees and officers, costs related to pension arrangementsfor both present and past employees and government employment taxes.The costs consist of:Amounts in NOK million 1994 1993 1992Wages and holiday pay (3,686) (3,213) (2,978)Other remuneration (33) (27) (43)Employment tax (551) (467) (467)Pension costs (86) (96) (52)Wages and other personnel costs (4,356) (3,803) (3,540)
Pension mattersMost employees in the Group are members of the Group service pensionschemes. As at 31.12.1994, a total of 11,139 present employees weremembers of the service pension schemes. In addition the service pensionschemes include 3,775 previous employees. The service pension schemesare defined as “net schemes” which do not bind the Group to liabilitiesarising from any changes in benefits from State’s social security fund. Inthe light of the accounting standard’s requirement to distinguish betweenbenefit plans and contribution plans, the Group has chosen to treat theservice pension schemes as benefit plans. The Group’s legal obligationswill not be affected by this accounting treatment.
In addition, the Group has pension liabilities which are not coveredby insurance. These relate to early retirement pensions, discretionarypensions to early retired employees, pensions with a pension base higherthan the Taxes Act maximum limit, pensions to previous board membersand pensions to people who for various reasons have not been includedin the service pension scheme which are to be paid by the Group. 4,949people are covered by these schemes.
Several of the Group’s insured pension schemes are overfunded. Theoverfunding has been evaluated and it is assumed in the accounts that alloverfunding is capable of being utilised due to the fact that someuninsured schemes can be covered from these funds, known futureliabilities and the steady development which is taking place in the Group’sbusiness and organisation.
The pension charge for the year is calculated by an independentactuary based on information as at 01.01.94. It is adjusted for anysubsequent material changes.
In 1993 uninsured pension liabilities were calculated using the oldpension accounting principle using a discount rate of 5%. The oldprinciple did not take into account future changes in salaries andpensions. The 1993 discount rate cannot therefore be used in futurecalculations under the new principle which must be calculated using anoverall evaluation of a combined set of new assumptions. Against thisbackground and in the light of the statement from the Oslo Stock
Exchange, the following assumptions have been used in 1994. (Thetransitional effect of using the assumptions below, rather than a set ofassumptions based on a 5% discount rate, is not material to the Group).
Assumptions:Discount rate 6%Future salary adjustment 3%Average remaining working life 15 yearsPension adjustment/G-adjustment 2%Voluntary departures before/after 45 years 2%/0%Return on pension funds 7%Best estimate of return 1994 -2% to +1%
The pension schemes in foreign companies include both defined benefitand contribution plans. The schemes have been accounted for inaccordance with local rules and conditions. It is considered that therewould be no significant differences resulting from a restatement based onthe new Norwegian standard.
(Amounts in NOK million)
Composition of net pension cost 1994Present value of the year’s pension earnings (incl. employment tax) (94)Interest cost on pension liability (134)Amortisation of deferred liability due todifference between plan/assumptions -Expected return on pension funds 148Net pension cost benefit plans (80)Contribution plans (6)Net pension cost (86)
Composition of net pension liability 31.12.94 01.01.94Gross pension liability (2,403) (2,324)Pension funds 2,127 2,152Actual net pension liability (276) (172)Unamortised differences from plan assumptions 131 -Net pension liability (145) (172)Capitalised net pension liability (319)Capitalised net pension assets 174
Composition of pension funds at 01.01.94Liquid assets 3%Money market investments 4%Bonds 47%Loans 17%Shares 21%Real estate 8%Total pension funds 100%Approximately 18% of pension funds are managed in the company’s ownpension funds and 82% in life insurance companies of which 62% is inunit linked schemes.
NOTE 3, Other receivables
The amount includes loans to persons and companies covered by Section§§12-10 and 11-8.16 of the Norwegian Companies Act for the Group ofNOK 73 million as well as net pension funds of NOK 174 million. Also included is the Group’s deferred tax allowance of NOK 79 million. (see note 18).
N O T E SO R K L A G R O U P

19O R K L A A N N U A L R E P O R T 1 9 9 4
Number Book Market ShareAmounts in NOK million of shares value value owned %
Owned by Orkla A.S
Norwegian listed sharesBank/InsuranceBolig & Næringsbanken 374,500 50 51 3.8Den norske Bank 4,615,000 76 86 0.7Norgeskreditt 407,700 50 61 3.6UNI Storebrand Pref. 12,711,209 127 133UNI Storebrand Ord. 34,410,713 378 724IndustryAdresseavisen 267,234 69 59 14.0Alcatel STK 207,400 17 38 2.5Arendal Fossekompani 40,769 11 17 1.6Dyno 4,600,262 514 907 18.3Eeg-Henriksen 275,325 18 17 4.3Elkem 12,530,367 498 1,090 25.4Gyldendal 127,295 5 38 5.4Helikopterservice 632,300 51 51 2.7Hafslund Nycomed A 4,052,769 334 586Hafslund Nycomed B 440,947 60 63Håg 99,400 10 16 9.4Kverneland 466,163 21 43 6.2Kværner A 2,189,228 317 704 5.0Maritime Group 206,400 17 15 3.0Nera 770,000 75 75 6.9Norsk Hydro 524,500 94 140 0.2Nora Eiendom 1,577,587 57 221 24.2Norsk Vekst 250,000 25 23 3.8Norske Skog A 212,400 38 40Norske Skog B 153,000 25 28Raufoss 756,372 66 79 10.1Rica Hotell 260,000 19 26 4.3Saga Petroleum A 2,824,264 240 210 2.2Schibsted 961,000 72 75 1.4Skrivervik Data 287,500 21 18 9.6Steen & Strøm Invest 1,422,600 69 100 8.9Miscellaneous 63 52ShippingActinor Shipping 315,035 32 37 7.8Bergesen A 2,099,917 229 343Bergesen B 233,400 34 38Benor Tankers 832,800 31 27 4.4Color Line 2,086,546 45 52 3.8Leif Høegh 393,300 34 35 1.3Larvik-Scandi Line 1,500,000 30 23 6.3Nordic American Shipping 388,064 17 16 9.0Smedvig 2,655,800 164 240 9.9Storli A 157,000 12 18Storli B 371,000 18 42Miscellaneous 16 17Investment FundsOmega AMS 9,950 1 2Omega Investment Fund 1,951 39 62Total Norwegian listed shares 4,189 6,738
Foreign listed sharesNordicAutoliv 65,000 11 17Catena A 142,000 9 8Chips Pref. 397,776 47 99Ejendomselskabet Norden 55,000 16 15
Number Book Market ShareAmounts in NOK million of shares value value owned %
Owned by Orkla A.S cont.
Enso A 380,000 23 22GN Store Nord Hold. 15,671 9 8Graphium 73,212 8 9Investor B 65,000 10 11Lemminkäinen 150,000 9 8Santasalo 240,000 11 13Tampella 800,000 22 16Volvo A 80,000 10 10Volvo B 400,000 50 51Ø.K. Holding 50,000 8 8Miscellaneous 90 88Other countriesGranada Group 100,000 5 5Int. Biotechnology 1,000,000 11 9Jardine Matheson Hold. 100,400 6 5Norex America 1,415,200 74 89Revco 29,611 2 5Sita Units 9,000 5 8Stolt Nielsen 47,500 7 7Unigestion 7,000 5 5Miscellaneous 108 93Total foreign listed shares 556 609Total listed shares 4,745 7,347Unlisted sharesAsia Invest Fund 108,953 15 8Berlingske 87,000 49 48Carl Aller 6,120 40 40Chips Stamm 1) 52,245 11 13Dagbladet Pref. 71,677 23 32Dagbladet A 101,466 37 45Eiendomsspar 212,222 34 22 2.4Holberg Industries Ord. 520,750 33 33Holberg Industries Pref. 71,944 52 52Kone Cranes 220,000 30 30Lindex 275,000 25 25NetCom 5,251 25 101 22.4Selmer 150,000 15 15 3.2Scala 4,100 10 10YIT-Yhtymä 389,500 24 26Miscellaneous 53 48Total unlisted shares 476 548
Limited partnershipsDeepsea Drillships 18 - 32.5European Acquisition 28 28 15.7Industrikapital 1989 I II III 54 54 29.8Industrikapital 1994 I II III IV 31 31 39.0Glenwood Venture Ic 2 - 23.7Glenwood Venture IIb 3 2 4.4Total limited partnerships, current assets 136 115
Miscellaneous securitiesConvertible bonds 151 151Options 3 3
Shares owned by Group companiesNetCom 2,550 9 9 10.9Adresseavisen 60,234 3 13 3.2Miscellaneous shares owned by Group companies 8 8
Total 5,531 8,194
NOTE 4, Portfolio investments
12.5
4.6
14.4
1.2
4.1
2.4
1) In addition Orkla owns 187.500 voting shares in Chips OY. See note 11.

NOTE 5, Other manufacturing, selling and administrative expenses
Other manufacturing, selling and administrative expenses represent agrouping of cost items not specified on other lines in the profit and lossaccount. Major individual items include transport costs of NOK 776 milli-on, energy costs of NOK 389 million, repair and maintenance costs ofNOK 436 million and advertising and research and development costs ofNOK 959 million. In addition, losses on receivables of NOK 27 million areincluded.
Accounts receivable at 31.12. are shown less a reserve for bad debts. The reserve has developed as follows:
Amounts in NOK million 1994 1993 1992Bad debt reserve at 01.01. 82 82 88Realised losses for the year (33) (27) (41)Provision for bad debts for the year 27 27 35Bad debt reserve at 31.12. 76 82 82
NOTE 6, Financial items, net
Amounts in NOK million 1994 1993 1992Dividends 134 99 75Interest income 99 98 169Interest expenses (659) (699) (810)Net foreign exchange gains/losses (35) 4 (15)Other financial items, net (53) (25) (25)Financial items, net (514) (523) (606)
NOTE 7, Portfolio gains, net
Amounts in NOK million 1994 1993 1992Portfolio shares 1) 418 350 (355)Net write-down/losses, ships - - (26)Total 418 350 (381)1) Includes a write-down in 1992 on shares in UNI Storebrand and Elkem of
NOK 203 million and NOK 453 million respectively.
NOTE 8, Taxes
Amounts in NOK million 1994 1993 1992Tax payable in Norway (314) (245) (232)Tax payable abroad (49) (33) (43)Tax payable associated companies 1) (42) (38) (29)Total tax payable (405) (316) (304)
Change in deferred tax Norway 12 10 211Change in deferred tax abroad (5) (1) 8Change in deferred tax ass. companies 1) (12) (10) (15)Total change in deferred tax 2) (5) (1) 204Total tax charge (410) (317) (100)1) Relates to Hjemmet Mortensen, Jotun and 3 media companies in Poland.2) See note 18.
NOTE 9, Cash and bank deposits
This item includes restricted deposits of NOK 189 million for the Group.(NOK 158 million in 1993 and NOK 204 million in 1992).
NOTE 10, Inventories
Amounts in NOK million 1994 1993 1992Raw materials 762 652 608Goods in process 124 100 100Finished goods 1,177 1,042 1,071Total 2,063 1,794 1,779
NOTE 11, Shares and investments in other companies 1)
Number Book ShareAmounts in NOK million of shares value owned %Owned by Orkla A.SAB Chips OY 2) 187,500 60 10.0Owned by Group companiesViking Askim SB 2,400,000 6 30.0Solo 1,136 1 56.8Norsk Avfallshåndtering 3,330 3 2.5Miscellaneous 10Total shares 80Miscellaneous interests in partnerships 3) 12Total, Group 921) In companies where the interest is larger than 20%, an evaluation of the Group’s influence has
concluded that it would not be correct to present the interest as "associated companies".2) Interest in voting share capital. In addition to the above item, the Investment area owns shares in
Chips OY recorded as current assets. In total the company owns 13.8% of the voting share capitaland 19.1% of the total share capital of Chips OY.
3) Of which owned by Orkla A.S: ANS Høgset (7.1%) NOK 2 million and ANS Nordkapp (4.2%)NOK 1 million.
NOTE 12, Short-term interest-free liabilities
Amounts in NOK million 1994 1993 1992Accounts payable 1,353 1,311 1,128State duties, taxes, holiday pay etc. 1,202 1,096 961Accrued unassessed taxes 348 295 241Allocated to dividend 244 202 182Other short-term liabilities 1) 1,305 899 985Total 4,452 3,803 3,4971) Includes from 1994 liability for outstanding recyclable containers (NOK 115 million).
Previously included in other long-term liabilities.
NOTE 13, Minority interests
Amounts in NOK million 1994 1993The minorities’ share of:Ordinary depreciation 44 32Operating profit 29 30Profit before taxes and minority interests 25 24Taxes 10 9Development:Minority interests at 01.01. 197 206Minority interests’ share of the year’s result 15 15Increase in connection with establishment of new subsid. 16 5Reduction on further acquisition of shares in subsidiaries (8) (7)Write-down of own shares in Oktav Invest A.S - (13)Dividends to minority interests (7) (9)Minority interests at 31.12. 213 197Minority interests are divided between:Ringnes Poland 77 92Nora Denmark 43 42Bakers 1) 45 37Orkla Media group 23 11Borregaard group 8 5Miscellaneous minorities 17 10Total 213 1971) At 20.01.1995 Bakers became 100% owned by Orkla A.S.
20 O R K L A A N N U A L R E P O R T 1 9 9 4
N O T E S O R K L A G R O U P

21O R K L A A N N U A L R E P O R T 1 9 9 4
N O T E S O R K L A G R O U P
NOTE 14, Interests in associated companies
Additions/ Dividend Deprecia- BookShare Original Book disposals Share Share received/ Book tion of value of
owned costprice value at during of of price ad- value goodwill goodwillAmounts in NOK million % at 01.01. 01.01. the year profit taxes justment 31.12.94 in 1994 at 31.12.Jotun A.S 41.6 144 413 1 70 (41) 9 452 (3) 39Göteborgs Kex AB 1) - 261 260 (260) - - - - - -Frionor A/S 44.8 118 123 20 12 - (2) 153 (2) 38Hjemmet Mortensen A.S 50.0 21 31 - 26 (12) 15 60 - -Drammens Tidende og Buskeruds Blad A.S 1) - 89 89 (89) - - - - - -Asker og Bærums Budstikke A.S 29.1 70 73 1 5 - (4) 75 (2) 27Bergens Tidende A.S 28.4 67 72 - 8 - - 80 (1) 13A/S Østlandets Blad 54.0 17 20 7 1 - - 28 - 7Norsk Telegrambyrå A.S 22.1 - - 3 2 - 9 14 - -Media companies Poland 3) - - - 50 2 (1) - 51 (2) 24K/S Swan Sea 35.0 18 20 - (4) - - 16 - -K/S Knutsen Bøyelaster III 28.0 20 15 - (1) - - 14 - -Hemne Orkladal Billag A/S1) - 8 11 (11) - - - - - -Orkla Exolon A.S K/S 42.3 4 19 - 2 - - 21 - -Oskar Sylte A.S 44.0 8 10 - 2 - - 12 (1) 4Tai Cang Borregaard Chemicals 55.0 - - 28 - - - 28 - -Miscellaneous2) - 21 16 - 4 - (10) 10 - 1
Total 866 1,172 (250) 129 (54) 17 1,014 (11) 1531) Subsidiaries from 01.01.1994.2) Miscellaneous holdings include, amongst others, investments in ANS Karasjokk Hotell, Ekonor A/S, ANS Bodø Engrossenter, LignoTech Verkaufsg.mbH and ANS Rica Nordkapp.3) Relates to interests in 7 regional and local leading newspapers and 2 national magazines.
NOTE 15, Fixed assets and goodwill, intangible assets, etc.
Fixed assets Ordinary de- BookAccumulated Revalu- Written De- Book Addi- Dis- preciation and value
cost ations down preciation value tions posals write-downs 31.12.Amounts in NOK million at 01.01. at 01.01. at 01.01. at 01.01. at 01.01. in 1994 in 1994 in 1994 1994Machinery, vehicles 7,944 5 (4) (5,163) 2,782 1,275 (61) (841) 3,155Buildings and plant 3,592 71 (25) (1,346) 2,292 568 (238) (157) 2,465Rental property 192 - - (41) 151 19 (20) (6) 144Other real estate 455 73 (4) (12) 512 24 (7) (5) 524Total 12,183 149 (33) (6,562) 5,737 1,886 (326) (1,009) 6,288Construction in progress 410 - - - 410 (102) (11) - 297Prepaid costs relating to new con. 12 - - - 12 (1) (4) - 7Total 12,605 149 (33) (6,562) 6,159 1,783 (341) (1,009) 6,592
Goodwill, intangible assets etc. BookAccumulated Written De- Book Ordinary value
cost down preciation value Additions deprecation 31.12.Amounts in NOK million at 01.01. at 01.01. at 01.01. at 01.01. in 1994 in 1994 1994Odense Marcipan 227 - (43) 184 - (11) 173Dragsbæk-group 70 - (17) 53 - (4) 49BOB Industrier 271 - (7) 264 - (13) 251Göteborgs Kex-group - - - - 328 (17) 311Kims 227 (115) (29) 83 - (5) 78Nidar Europe BV 37 - (8) 29 - (2) 27Bakers-group 123 - (35) 88 3 (8) 83Denofa Lilleborg-group 48 - (13) 35 - (2) 33Media-group 213 - (90) 123 279 (23) 379Chemicals area 45 - (29) 16 18 (8) 26Miscellaneous 152 - (76) 76 30 (16) 90Total 1,413 (115) (347) 951 658 (109) 1,500
Investments in and disposals of fixed assets and goodwillInvestments in: Disposals at sales price:
Amounts in NOK million 1990 1991 1992 1993 1994 1990 1991 1992 1993 1994Goodwill, etc. 572 161 45 341 658 - - - - -Machinery, vehicles 640 840 952 1,000 1,275 123 110 72 82 165Ships - - - - - - - 73 - -Buildings and plant 252 200 153 633 568 834 155 14 27 247Rental property 183 32 12 1 19 43 615 2 - 37Other real estate 70 88 71 71 24 77 136 20 7 7Construction in progress 136 15 170 98 (102) 37 - - - -Prepaid costs relating to new con. (7) 12 - 8 (1) - - - - -Total 1,846 1,348 1,403 2,152 2,441 1,114 1,016 181 116 456

22 O R K L A A N N U A L R E P O R T 1 9 9 4
Certificate issues at 31.12.1994 (Amounts in NOK million)
ISIN Coupon Term Loan amount250633 5.63% 11.04.94-11.04.95 200250644 5.58% 28.04.94-28.04.95 100250645 5.70% 02.05.94-02.05.95 50250684 6.00% 11.08.94-13.02.95 100250696 7.00% 21.09.94-21.03.95 150250728 6.75% 14.12.94-14.12.95 200250740 6.45% 23.12.94-20.10.95 100
900
Foreign exchange and interest rate managementIn order to reduce the Group’s exposure to unfavourable movements ininterest rate levels and foreign exchange rates, the Group uses, amongothers, various off-balance sheet financial instruments.
The Group’s balance sheet and future cashflows denominated inforeign currencies are hedged partly through borrowings denominated inforeign currencies and partly through the use of currency hedginginstruments. In order to obtain effective management of the interest structure the Groupuses interest hedging instruments in addition to chosing interest period forloans.
Loan portfolio’s foreign exchange and interest fixing distribution (including hedging transactions, see note 17)Amounts in AfterNOK million 1995 1996 1997 1998 1999 2000 2000NOK 3,215 1,190 932 511 56 503 16SEK 993 136 - - - - -USD 377 - - - - - -Other 763 - - - - - -Total 5,348 1,326 932 511 56 503 16Int.-bear. assets (1,066) - - - - - -Net 4,282 1,326 932 511 56 503 16
The average remaining interest period for Orkla A.S’ debt (includinghedging transactions) at 31.12.1994 was 1.2 years. The averageremaining interest period for loans with interest adjustment after 1995 is2.7 years.
In January 1995 interest swap agreements converting floating tofixed rate (3-4 years) were established for a total of NOK 480 million.
NOTE 16, Loans at 31.12.1994
The Group's interest-bearing debt by type and maturityBalance at Repayment schedule After
Amounts in NOK million 31.12.94 19951) 1996 1997 1998 1999 2000 2000Bank loans 4,040 825 232 365 1,312 1,031 259 16Bond issues 2) 2,945 503 503 403 2 33 501 1,000Mortgage institutions, insurance companies, miscellaneous 478 96 19 15 18 248 8 74Of which next year's instalment (1,424) (1,424) - - - - - -Total long-term interest-bearing debt 6,039 - 754 783 1,332 1,312 768 1,090Long-term debt due within one year 1,424Bank loans 272Certificate issues 2) 900Miscellaneous 57Total short-term interest-bearing debt 2,653 2,653Total interest-bearing debt 8,692 2,653 754 783 1,332 1,312 768 1,0901) The amounts are classified as short-term debt.2) Capital market issues are shown separately below.
The average time to maturity at 31.12.1994 on the Group’s interest-bearing debt was 3.3 years.In December Orkla established a term loan and revolving credit facility of USD 680 million with a maturity of 5.5 years. No drawings had been
made at 31.12.1994. In addition, Orkla has committed unutilised drawing facilities of NOK 2.3 billion.Orkla A.S has a group bank account system with Den norske Bank and Christiania Bank og Kreditkasse. The accounts of Orkla A.S are the only
accounts directly settled with the banks and all subsidiaries’ accounts are treated as internal matters. At 31.12.1994 the aggregate deposits were NOK424 million, while the total drawing rights amounted to NOK 450 million.
The company may not sell shares in the following companies without the consent of the lenders in the long-term international bank loans:Borregaard Industries, Denofa-Lilleborg, Nora and Ringnes.
Bond issues (Orkla A.S) at 31.12.1994 (Amounts in NOK million)
(All loans are publicly quoted)ISIN Coupon Term Interest Original Out- Repay-
payments loan amount standing ment185855 Orkla Industrier 10.00% 1981/1999 30.12. 40 31 Fixed 1) 2)
185858 Orkla Borregaard 10.80% 1990/1995 02.04. 500 500 Fixed185859 Orkla 10.50% 1991/1996 20.12. 500 500 Fixed 3)
185861 Orkla 9.40% 1993/2000 21.04. 500 500 Fixed 3)
185862 Orkla 7.75% 1993/2003 12.02., 12.08. 500 500 Fixed 3)
185863 Orkla 6.10% 1994/2002 25.02., 25.08. 500 500 Fixed 3)
185865 Orkla 6.40% 1994/1997 16.06. 400 400 Fixed 3)
2,940 2,9311) Convertible bond. Bondholders have the right to convert the bonds to shares before 01.12.1999 at a conversion price of NOK 14.00 per share, see note 20 (equity). 2) Call option for issuer.3) Tap issue, limit NOK 1 billion.
N O T E S O R K L A G R O U P
23O R K L A A N N U A L R E P O R T 1 9 9 4
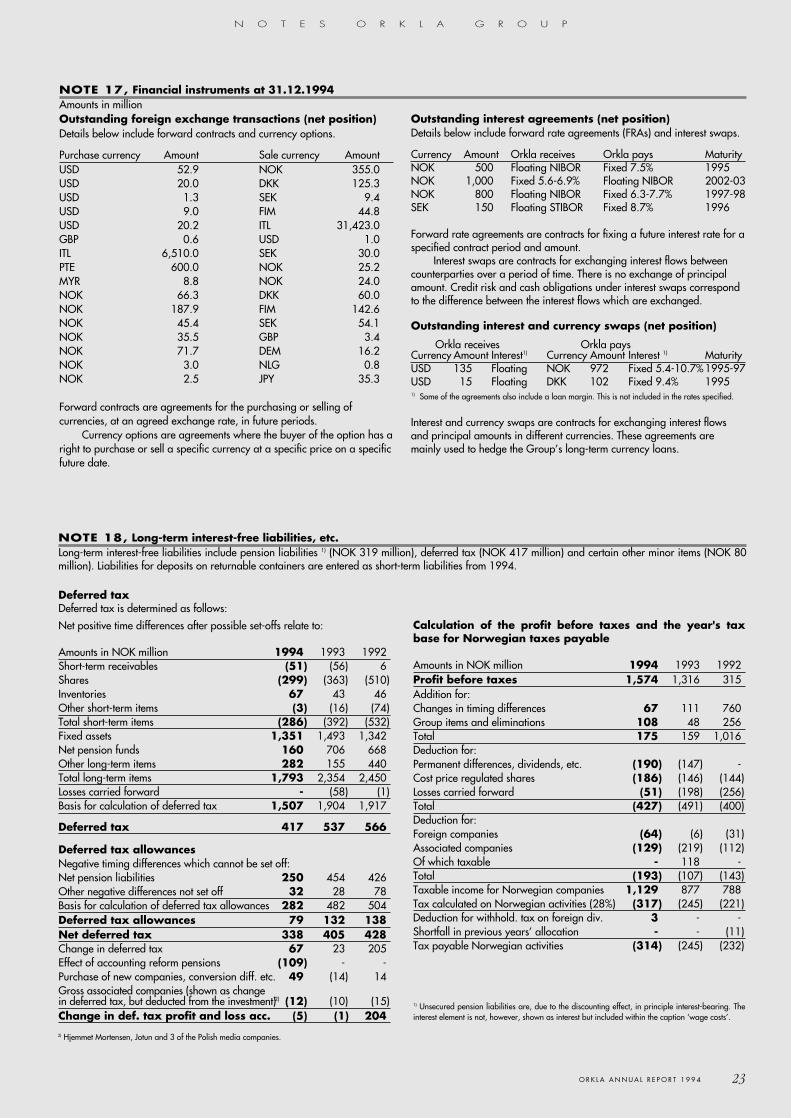
NOTE 18, Long-term interest-free liabilities, etc. Long-term interest-free liabilities include pension liabilities 1) (NOK 319 million), deferred tax (NOK 417 million) and certain other minor items (NOK 80million). Liabilities for deposits on returnable containers are entered as short-term liabilities from 1994.
Deferred taxDeferred tax is determined as follows:
Net positive time differences after possible set-offs relate to:
Amounts in NOK million 1994 1993 1992Short-term receivables (51) (56) 6Shares (299) (363) (510)Inventories 67 43 46Other short-term items (3) (16) (74)Total short-term items (286) (392) (532)Fixed assets 1,351 1,493 1,342Net pension funds 160 706 668Other long-term items 282 155 440Total long-term items 1,793 2,354 2,450Losses carried forward - (58) (1)Basis for calculation of deferred tax 1,507 1,904 1,917
Deferred tax 417 537 566
Deferred tax allowancesNegative timing differences which cannot be set off:Net pension liabilities 250 454 426Other negative differences not set off 32 28 78Basis for calculation of deferred tax allowances 282 482 504Deferred tax allowances 79 132 138Net deferred tax 338 405 428Change in deferred tax 67 23 205Effect of accounting reform pensions (109) - -Purchase of new companies, conversion diff. etc. 49 (14) 14Gross associated companies (shown as changein deferred tax, but deducted from the investment)2) (12) (10) (15)Change in def. tax profit and loss acc. (5) (1) 204
Calculation of the profit before taxes and the year's taxbase for Norwegian taxes payable
Amounts in NOK million 1994 1993 1992Profit before taxes 1,574 1,316 315Addition for:Changes in timing differences 67 111 760Group items and eliminations 108 48 256Total 175 159 1,016Deduction for:Permanent differences, dividends, etc. (190) (147) -Cost price regulated shares (186) (146) (144)Losses carried forward (51) (198) (256)Total (427) (491) (400)Deduction for:Foreign companies (64) (6) (31)Associated companies (129) (219) (112)Of which taxable - 118 -Total (193) (107) (143)Taxable income for Norwegian companies 1,129 877 788Tax calculated on Norwegian activities (28%) (317) (245) (221)Deduction for withhold. tax on foreign div. 3 - -Shortfall in previous years’ allocation - - (11)Tax payable Norwegian activities (314) (245) (232)
1) Unsecured pension liabilities are, due to the discounting effect, in principle interest-bearing. Theinterest element is not, however, shown as interest but included within the caption ‘wage costs’.
N O T E S O R K L A G R O U P
Outstanding foreign exchange transactions (net position)Details below include forward contracts and currency options.
Purchase currency Amount Sale currency AmountUSD 52.9 NOK 355.0USD 20.0 DKK 125.3USD 1.3 SEK 9.4USD 9.0 FIM 44.8USD 20.2 ITL 31,423.0GBP 0.6 USD 1.0ITL 6,510.0 SEK 30.0PTE 600.0 NOK 25.2MYR 8.8 NOK 24.0NOK 66.3 DKK 60.0NOK 187.9 FIM 142.6NOK 45.4 SEK 54.1NOK 35.5 GBP 3.4NOK 71.7 DEM 16.2NOK 3.0 NLG 0.8NOK 2.5 JPY 35.3
Forward contracts are agreements for the purchasing or selling ofcurrencies, at an agreed exchange rate, in future periods.
Currency options are agreements where the buyer of the option has aright to purchase or sell a specific currency at a specific price on a specificfuture date.
Outstanding interest agreements (net position)Details below include forward rate agreements (FRAs) and interest swaps.
Currency Amount Orkla receives Orkla pays MaturityNOK 500 Floating NIBOR Fixed 7.5% 1995NOK 1,000 Fixed 5.6-6.9% Floating NIBOR 2002-03NOK 800 Floating NIBOR Fixed 6.3-7.7% 1997-98SEK 150 Floating STIBOR Fixed 8.7% 1996
Forward rate agreements are contracts for fixing a future interest rate for aspecified contract period and amount.
Interest swaps are contracts for exchanging interest flows betweencounterparties over a period of time. There is no exchange of principalamount. Credit risk and cash obligations under interest swaps correspondto the difference between the interest flows which are exchanged.
Outstanding interest and currency swaps (net position)
Orkla receives Orkla paysCurrency Amount Interest1) Currency Amount Interest 1) MaturityUSD 135 Floating NOK 972 Fixed 5.4-10.7%1995-97USD 15 Floating DKK 102 Fixed 9.4% 19951) Some of the agreements also include a loan margin. This is not included in the rates specified.
Interest and currency swaps are contracts for exchanging interest flowsand principal amounts in different currencies. These agreements aremainly used to hedge the Group’s long-term currency loans.
NOTE 17, Financial instruments at 31.12.1994Amounts in million
2) Hjemmet Mortensen, Jotun and 3 of the Polish media companies.

24 O R K L A A N N U A L R E P O R T 1 9 9 4
N O T E S O R K L A G R O U P
NOTE 19, Long-term cooperation agreements
Since 1958 Orkla has enjoyed good cooperation with Unilever in the field of detergents and personal products. In February 1995 a revised agree-ment was signed which runs until 2014 and which extends cooperation along similar commercial principles as before.
Ringnes is The Coca-Cola Company’s largest bottler in Norway, with a franchise agreement for bottled carbonated soft drinks. Coca-Cola’s bottlingagreements are geographically defined, and Ringnes covers Møre, Trøndelag and Nordland, and most of Southern and Eastern Norway (including Oslo).
NOTE 20, Development in equity over the last 5 years
Share Legal Temporary re- Free GroupAmounts in NOK million capital reserve stricted reserve reserves Orkla A.S reserve TotalEquity at 31.12.89 667 408 - 464 1,539 (70) 1,469Bonus issue 66 (66) - - - - -Increase in capital on subscription 64 450 - - 514 - 514Profit for the year Orkla A.S - - - 117 117 (117) -Group transfer received - - - 337 337 (337) -Allocation to dividend - - - (111) (111) - (111)Allocated to legal reserve and merger difference - 48 - (49) (1) - (1)Group profit for the year - - - - - 493 493Conversion difference foreign subsidiaries etc. - - - - - 5 5Equity at 31.12.90 797 840 - 758 2,395 (26) 2,369Merger Nora Industrier A.S 382 141 - 297 820 110 930Cancellation, amortisation and cash consideration 1) (71) (341) - (418) (830) - (830)Uninsured pension obligations - - - (24) (24) (181) (205)Profit for the year Orkla A.S - - - (138) (138) 138 -Group transfer received - - - 511 511 (511) -Allocation to dividend - - - (161) (161) - (161)Allocated to legal reserve and free reserves - 36 13 (49) - - -Group profit for the year - - - - - 704 704Various equity corrections 2) - - - - - (143) (143)Conversion difference foreign subsidiaries etc. - - - - - (5) (5)Equity at 31.12.91 1,108 676 13 776 2,573 86 2,659Conversion deferred tax model 01.01.92 - - 153 882 1,035 2,082 3,117Equity at 01.01.92 1,108 676 166 1,658 3,608 2,168 5,776Bonus issue 1:10 111 (111) - - - - -Profit for the year Orkla A.S - - - (817) (817) 817 -Group transfer received - - - 713 713 (713) -Allocation to dividend - - - (178) (178) - (178)Allocation to legal reserve and free reserves - - (34) 34 - - -Group profit for the year - - - - - 211 211Conversion difference foreign subsidiaries etc. - - - - - 28 28Equity at 31.12.92 1,219 565 132 1,410 3,326 2,511 5,837Adjustment reserves at 01.01. and cash payment - (7) 7 (15) (15) - (15)Profit for the year Orkla A.S - - - 8 8 (8) -Group transfer received - - - 818 818 (818) -Allocation to dividend - - - (192) (192) - (192)Allocated to legal reserve and free reserves - 15 (36) 21 - - -Group profit for the year - - - - - 984 984Write-down own shares in Oktav Invest - - - - - (28) (28)Conversion difference foreign subsidiaries etc. - - - - - (13) (13)Equity at 31.12.93 1,219 573 103 2,050 3,945 2,628 6,573Profit for the year Orkla A.S - - - 198 198 (198) -Entries resulting from introduction of new pension standard - 6 - 51 57 (57) -Group transfer received - - - 711 711 (711) -Allocation to dividend - - - (236) (236) - (236)Allocated to legal reserve and free reserves - 77 (36) (41) - - -Group profit for the year - - - - - 1,149 1,149Charge as a result of the introd. of new pension standard - - - - - (285) (285)Conversion difference foreign subsidiaries etc. - - - - - 28 28Equity at 31.12.94 1,219 656 67 2,733 4,675 2,554 7,2291) Relates to the cancellation of 170,160 Nora Industrier shares, amortisation of 2,686,774 Orkla Borregaard shares and NOK 274 million in cash payment.2) Relates to cash payment and dividend on own shares and write-down of own shares.
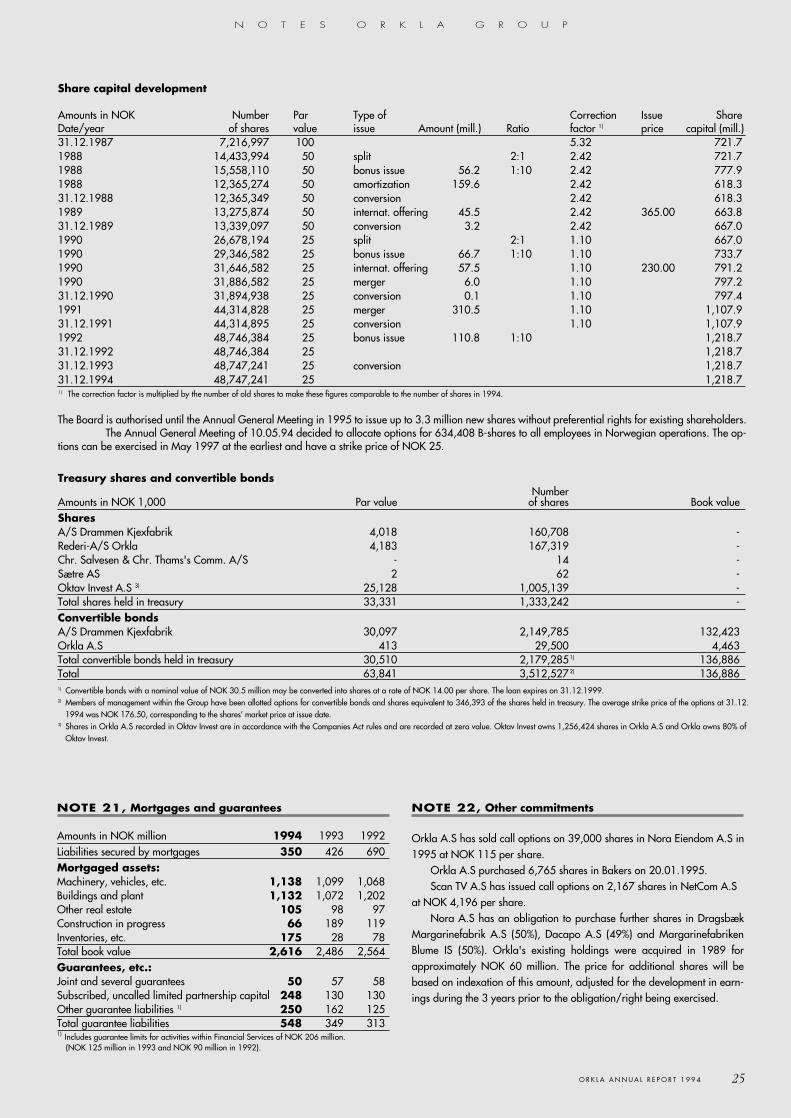
25O R K L A A N N U A L R E P O R T 1 9 9 4
NOTE 21, Mortgages and guarantees
Amounts in NOK million 1994 1993 1992Liabilities secured by mortgages 350 426 690Mortgaged assets:Machinery, vehicles, etc. 1,138 1,099 1,068Buildings and plant 1,132 1,072 1,202Other real estate 105 98 97Construction in progress 66 189 119Inventories, etc. 175 28 78Total book value 2,616 2,486 2,564Guarantees, etc.:Joint and several guarantees 50 57 58Subscribed, uncalled limited partnership capital 248 130 130Other guarantee liabilities 1) 250 162 125Total guarantee liabilities 548 349 3131) Includes guarantee limits for activities within Financial Services of NOK 206 million.
(NOK 125 million in 1993 and NOK 90 million in 1992).
NOTE 22, Other commitments
Orkla A.S has sold call options on 39,000 shares in Nora Eiendom A.S in1995 at NOK 115 per share.
Orkla A.S purchased 6,765 shares in Bakers on 20.01.1995.Scan TV A.S has issued call options on 2,167 shares in NetCom A.S
at NOK 4,196 per share.Nora A.S has an obligation to purchase further shares in Dragsbæk
Margarinefabrik A.S (50%), Dacapo A.S (49%) and MargarinefabrikenBlume IS (50%). Orkla's existing holdings were acquired in 1989 forapproximately NOK 60 million. The price for additional shares will bebased on indexation of this amount, adjusted for the development in earn-ings during the 3 years prior to the obligation/right being exercised.
Share capital development
Amounts in NOK Number Par Type of Correction Issue ShareDate/year of shares value issue Amount (mill.) Ratio factor 1) price capital (mill.)31.12.1987 7,216,997 100 5.32 721.71988 14,433,994 50 split 2:1 2.42 721.71988 15,558,110 50 bonus issue 56.2 1:10 2.42 777.91988 12,365,274 50 amortization 159.6 2.42 618.331.12.1988 12,365,349 50 conversion 2.42 618.31989 13,275,874 50 internat. offering 45.5 2.42 365.00 663.831.12.1989 13,339,097 50 conversion 3.2 2.42 667.01990 26,678,194 25 split 2:1 1.10 667.01990 29,346,582 25 bonus issue 66.7 1:10 1.10 733.71990 31,646,582 25 internat. offering 57.5 1.10 230.00 791.21990 31,886,582 25 merger 6.0 1.10 797.231.12.1990 31,894,938 25 conversion 0.1 1.10 797.41991 44,314,828 25 merger 310.5 1.10 1,107.931.12.1991 44,314,895 25 conversion 1.10 1,107.91992 48,746,384 25 bonus issue 110.8 1:10 1,218.731.12.1992 48,746,384 25 1,218.731.12.1993 48,747,241 25 conversion 1,218.731.12.1994 48,747,241 25 1,218.71) The correction factor is multiplied by the number of old shares to make these figures comparable to the number of shares in 1994.
The Board is authorised until the Annual General Meeting in 1995 to issue up to 3.3 million new shares without preferential rights for existing shareholders.The Annual General Meeting of 10.05.94 decided to allocate options for 634,408 B-shares to all employees in Norwegian operations. The op-
tions can be exercised in May 1997 at the earliest and have a strike price of NOK 25.
Treasury shares and convertible bondsNumber
Amounts in NOK 1,000 Par value of shares Book valueSharesA/S Drammen Kjexfabrik 4,018 160,708 -Rederi-A/S Orkla 4,183 167,319 -Chr. Salvesen & Chr. Thams's Comm. A/S - 14 -Sætre AS 2 62 -Oktav Invest A.S 3) 25,128 1,005,139 -Total shares held in treasury 33,331 1,333,242 -Convertible bondsA/S Drammen Kjexfabrik 30,097 2,149,785 132,423Orkla A.S 413 29,500 4,463Total convertible bonds held in treasury 30,510 2,179,2851) 136,886Total 63,841 3,512,5272) 136,8861) Convertible bonds with a nominal value of NOK 30.5 million may be converted into shares at a rate of NOK 14.00 per share. The loan expires on 31.12.1999. 2) Members of management within the Group have been allotted options for convertible bonds and shares equivalent to 346,393 of the shares held in treasury. The average strike price of the options at 31.12.
1994 was NOK 176.50, corresponding to the shares’ market price at issue date. 3) Shares in Orkla A.S recorded in Oktav Invest are in accordance with the Companies Act rules and are recorded at zero value. Oktav Invest owns 1,256,424 shares in Orkla A.S and Orkla owns 80% of
Oktav Invest.
N O T E S O R K L A G R O U P
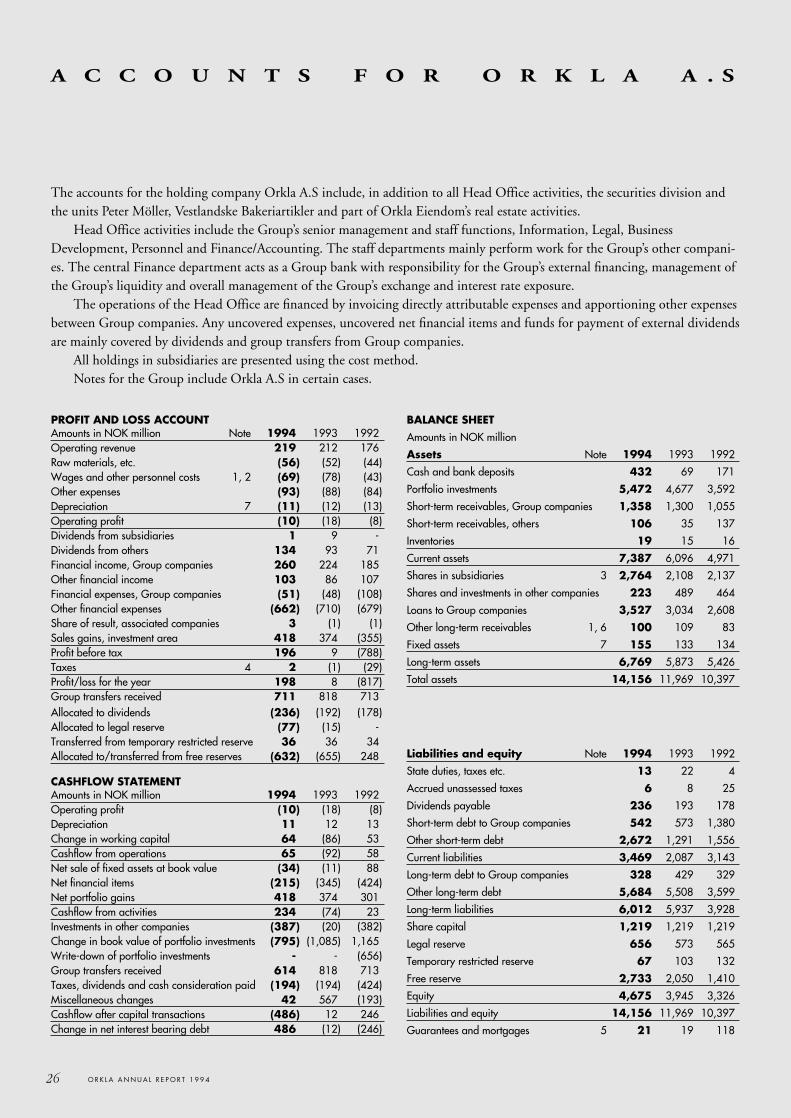
26 O R K L A A N N U A L R E P O R T 1 9 9 4
PROFIT AND LOSS ACCOUNTAmounts in NOK million Note 1994 1993 1992Operating revenue 219 212 176Raw materials, etc. (56) (52) (44)Wages and other personnel costs 1, 2 (69) (78) (43)Other expenses (93) (88) (84)Depreciation 7 (11) (12) (13)Operating profit (10) (18) (8)Dividends from subsidiaries 1 9 -Dividends from others 134 93 71Financial income, Group companies 260 224 185Other financial income 103 86 107Financial expenses, Group companies (51) (48) (108)Other financial expenses (662) (710) (679)Share of result, associated companies 3 (1) (1)Sales gains, investment area 418 374 (355)Profit before tax 196 9 (788)Taxes 4 2 (1) (29)Profit/loss for the year 198 8 (817)Group transfers received 711 818 713Allocated to dividends (236) (192) (178)Allocated to legal reserve (77) (15) -Transferred from temporary restricted reserve 36 36 34Allocated to/transferred from free reserves (632) (655) 248
CASHFLOW STATEMENTAmounts in NOK million 1994 1993 1992Operating profit (10) (18) (8)Depreciation 11 12 13Change in working capital 64 (86) 53Cashflow from operations 65 (92) 58Net sale of fixed assets at book value (34) (11) 88Net financial items (215) (345) (424)Net portfolio gains 418 374 301Cashflow from activities 234 (74) 23Investments in other companies (387) (20) (382)Change in book value of portfolio investments (795) (1,085) 1,165Write-down of portfolio investments - - (656)Group transfers received 614 818 713Taxes, dividends and cash consideration paid (194) (194) (424)Miscellaneous changes 42 567 (193)Cashflow after capital transactions (486) 12 246Change in net interest bearing debt 486 (12) (246)
BALANCE SHEETAmounts in NOK million
Assets Note 1994 1993 1992
Cash and bank deposits 432 69 171
Portfolio investments 5,472 4,677 3,592
Short-term receivables, Group companies 1,358 1,300 1,055
Short-term receivables, others 106 35 137
Inventories 19 15 16
Current assets 7,387 6,096 4,971
Shares in subsidiaries 3 2,764 2,108 2,137
Shares and investments in other companies 223 489 464
Loans to Group companies 3,527 3,034 2,608
Other long-term receivables 1, 6 100 109 83
Fixed assets 7 155 133 134
Long-term assets 6,769 5,873 5,426
Total assets 14,156 11,969 10,397
Liabilities and equity Note 1994 1993 1992
State duties, taxes etc. 13 22 4
Accrued unassessed taxes 6 8 25
Dividends payable 236 193 178
Short-term debt to Group companies 542 573 1,380
Other short-term debt 2,672 1,291 1,556
Current liabilities 3,469 2,087 3,143
Long-term debt to Group companies 328 429 329
Other long-term debt 5,684 5,508 3,599
Long-term liabilities 6,012 5,937 3,928
Share capital 1,219 1,219 1,219
Legal reserve 656 573 565
Temporary restricted reserve 67 103 132
Free reserve 2,733 2,050 1,410
Equity 4,675 3,945 3,326
Liabilities and equity 14,156 11,969 10,397
Guarantees and mortgages 5 21 19 118
The accounts for the holding company Orkla A.S include, in addition to all Head Office activities, the securities division andthe units Peter Möller, Vestlandske Bakeriartikler and part of Orkla Eiendom’s real estate activities.
Head Office activities include the Group’s senior management and staff functions, Information, Legal, BusinessDevelopment, Personnel and Finance/Accounting. The staff departments mainly perform work for the Group’s other compani-es. The central Finance department acts as a Group bank with responsibility for the Group’s external financing, management ofthe Group’s liquidity and overall management of the Group’s exchange and interest rate exposure.
The operations of the Head Office are financed by invoicing directly attributable expenses and apportioning other expensesbetween Group companies. Any uncovered expenses, uncovered net financial items and funds for payment of external dividendsare mainly covered by dividends and group transfers from Group companies.
All holdings in subsidiaries are presented using the cost method.Notes for the Group include Orkla A.S in certain cases.
A C C O U N T S F O R O R K L A A . S

27O R K L A A N N U A L R E P O R T 1 9 9 4
NOTE 1, Pension matters
(Amounts in NOK million)
Composition of net pension cost 1994Present value of the year’s pension earnings(including employment tax) (6)Amortisation on deferred liabilities due to differencefrom plan/assumptions 0Interest cost on pension liability (10)Expected return on pension funds 14Net pension cost (2)
Composition on net pension liability 31.12.94 01.01.94Gross pension liability (172) (171)Pension funds 198 209Actual net pension funds 26 38Unamortised plan/estimate changes 14 -Capitalised net pension funds 40 38
Composition of pension funds at 01.01.94Liquid assets 4%Money market investments 1%Bonds 49%Loans 2%Shares 43%Real estate 1%Total pension funds 100%
NOTE 2, Remuneration and contractual arrangements
Remuneration to the Group Chief Executive amounted to NOK1,186,493. In addition, there were benefits of a car scheme, freenewspapers, etc. totalling NOK 40,619. The Group Chief Executivereceived no internal director’s fees.
The Group Chief Executive’s pension on full earnings will amount totwo thirds of the pension base. On resignation prior to pensionable age,a payment equivalent to 3 years´ salary would be made calculated fromthe salary at the date of resignation.
Remuneration to the Board, Corporate Assembly and Auditor Remuneration to the Board and Corporate Assembly amounted to NOK907,000 and NOK 416,500 respectively. The Chairman of the Boardreceived no remuneration other than director’s fee. The Auditor’s feesamounted to NOK 495,000.
NOTE 3, Shares in subsidiaries
Company’s Ownedshare Book by the
Amounts in NOK million Currency capital value Group %
Ringnes a.s 249 249 100.0
Nora A.S 436 492 100.0
Sætre AS 5 11 100.0
Nidar AS 110 110 100.0
A/S Denofa og Lilleborg FabrikerGroup A 7 54 100.0Group B 10 61 100.0
Helly-Hansen A/S 3) 42 137 100.0
Viking Fottøy A.S 25 27 100.0
Orkla Media A.S 237 253 100.0
Bakers AS 1) 2 153 71.4
Borregaard Industries LimitedOrdinary shares GBP 14 216 100.0Preference shares GBP 1 43 99.9
Kemetyl AB SEK 4 36 100.0
Borregaard NEA AS 5 101 100.0
Chr. Salvesen & Chr. Thams’s Comm. A/S 4 21 100.0
Borregaard Skoger A.S 7 3 100.0
A/S Høvellast - 1 100.0
Norgro A.S 2) 50 80 100.0
Orkla Finans A.S 19 21 94.7
Oktav Invest A.S 65 - 80.0
Viking Askim A.S 36 104 100.0
Rederi-A/S ORKLA - - 100.0
The Borregaard Comp. Inc. USD - - 100.0
Omega Consultants A.S - - 100.0
AB Orklaprodukter SEK - - 100.0
A.S Drammen Kjexfabrik - 12 100.0
NINO CB A.S 1 1 100.0
NINO A.S 21 24 100.0
Tou Bruk A.S 1 - 100.0
Orkla Eiendom A.S 1 1 100.0
Kantolan FIM 10 41 100.0
Swebiscuits AB SEK 10 512 100.0
Scan-TV A.S - - 100.0
Peter Möller Omega-3 GmbH DEM - - 100.0
TOTAL - 2,764 -1) Bakers became 100% owned at 20.01.1995.2) Norgro was sold at 05.01.1995.3) 50% of the shares in Helly-Hansen were sold at 06.02.1995.
N O T E SO R K L A A . S
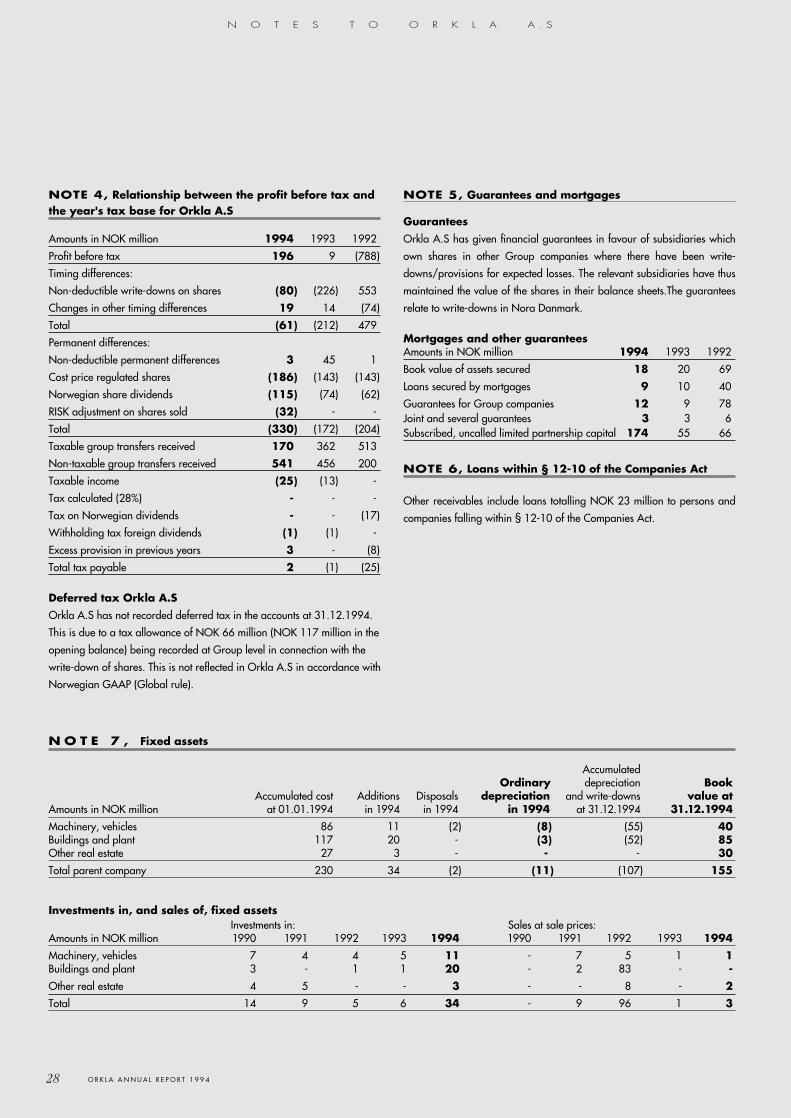
28 O R K L A A N N U A L R E P O R T 1 9 9 4
N O T E 7 , Fixed assets
AccumulatedOrdinary depreciation Book
Accumulated cost Additions Disposals depreciation and write-downs value atAmounts in NOK million at 01.01.1994 in 1994 in 1994 in 1994 at 31.12.1994 31.12.1994Machinery, vehicles 86 11 (2) (8) (55) 40Buildings and plant 117 20 - (3) (52) 85Other real estate 27 3 - - - 30Total parent company 230 34 (2) (11) (107) 155
Investments in, and sales of, fixed assetsInvestments in: Sales at sale prices:
Amounts in NOK million 1990 1991 1992 1993 1994 1990 1991 1992 1993 1994Machinery, vehicles 7 4 4 5 11 - 7 5 1 1Buildings and plant 3 - 1 1 20 - 2 83 - -Other real estate 4 5 - - 3 - - 8 - 2Total 14 9 5 6 34 - 9 96 1 3
NOTE 4, Relationship between the profit before tax andthe year's tax base for Orkla A.S
Amounts in NOK million 1994 1993 1992
Profit before tax 196 9 (788)
Timing differences:
Non-deductible write-downs on shares (80) (226) 553
Changes in other timing differences 19 14 (74)
Total (61) (212) 479
Permanent differences:
Non-deductible permanent differences 3 45 1
Cost price regulated shares (186) (143) (143)
Norwegian share dividends (115) (74) (62)
RISK adjustment on shares sold (32) - -
Total (330) (172) (204)
Taxable group transfers received 170 362 513
Non-taxable group transfers received 541 456 200
Taxable income (25) (13) -
Tax calculated (28%) - - -
Tax on Norwegian dividends - - (17)
Withholding tax foreign dividends (1) (1) -
Excess provision in previous years 3 - (8)
Total tax payable 2 (1) (25)
Deferred tax Orkla A.SOrkla A.S has not recorded deferred tax in the accounts at 31.12.1994.
This is due to a tax allowance of NOK 66 million (NOK 117 million in the
opening balance) being recorded at Group level in connection with the
write-down of shares. This is not reflected in Orkla A.S in accordance with
Norwegian GAAP (Global rule).
NOTE 5, Guarantees and mortgages
GuaranteesOrkla A.S has given financial guarantees in favour of subsidiaries which
own shares in other Group companies where there have been write-
downs/provisions for expected losses. The relevant subsidiaries have thus
maintained the value of the shares in their balance sheets.The guarantees
relate to write-downs in Nora Danmark.
Mortgages and other guaranteesAmounts in NOK million 1994 1993 1992
Book value of assets secured 18 20 69
Loans secured by mortgages 9 10 40
Guarantees for Group companies 12 9 78Joint and several guarantees 3 3 6Subscribed, uncalled limited partnership capital 174 55 66
NOTE 6, Loans within § 12-10 of the Companies Act
Other receivables include loans totalling NOK 23 million to persons and
companies falling within § 12-10 of the Companies Act.
N O T E S T O O R K L A A . S
29O R K L A A N N U A L R E P O R T 1 9 9 4
We have audited the annual accounts of Orkla
A.S for 1994, showing a profit for the year of
NOK 198 million for Orkla A.S and a profit for
the year of NOK 1,149 million for the Orkla
Group. The annual accounts, which consist of
the Directors’ report, profit and loss account,
balance sheet, statement of cashflows, notes and
the corresponding consolidated accounts, are
the responsibility of the Board of directors and
the Group Chief Executive.
Our responsibility is to examine the
company’s annual accounts, its accounting
records and the conduct of its affairs.
We have conducted our audit in accordance
with applicable laws, regulations and generally
accepted auditing standards. We have per-
formed the auditing procedures we considered
necessary to determine that the annual accounts
are free of material errors or omissions. We have
examined, on a test basis, the accounting mate-
rial supporting the financial statements, assessed
the appropriateness of the accounting principles
applied, the accounting estimates made by man-
agement and evaluated the overall presentation
of the annual accounts. We have also evaluated
the company’s asset management and internal
controls to the extent required by generally
accepted auditing standards.
The allocation of profit for the year, as pro-
posed by the Board of Directors, complies with
the requirements of the Joint Stock Companies
Act.
In our opinion, the annual accounts have
been prepared in conformity with the Joint
Stock Companies Act and present fairly the
company’s and the Group’s financial positions as
at 31 December 1994 and the result of the
operations for the fiscal year in accordance with
generally accepted accounting principles.
AUDIT REPORT TO THE
ANNUAL GENERAL MEETING OF ORKLA A.S
The Corporate Assembly of Orkla A.S has
received the Board of Director’s proposed Profit
and Loss account and Balance Sheet for 1994
for Orkla A.S and the Group and recommends
that the Annual General Meeting adopts the
accounts and the proposal of the Board of
Directors for the allocation of profit for 1994.
STATEMENT FROM THE CORPORATE ASSEMBLY TO
THE ANNUAL GENERAL MEETING OF ORKLA A.S
Oslo, 22 February 1995Arthur Andersen Co.
Finn Berg JacobsenState Author i s ed Publ i c Accountant (Norway)
Lysaker, 9 March 1995The Corporate Assembly of Orkla A.S
Øystein EskelandChairman o f the Corporate As s embly
&
30 O R K L A A N N U A L R E P O R T 1 9 9 4
S H A R E S A N D S H A R E H O L D E R S
SHAREHOLDER POLICY
Orkla’s shareholders should over time receive a
competitive return on their shares. This return will
be a combination of dividends and a rise in the
share price. The objective is that shareholders
should receive a stable increase in dividends, subject
to the underlying development of the business
being satisfactory. Orkla has a conservative policy
on new issues in which the interests of existing
shareholders are decisive. The Group’s overall prof-
itability goal is its return on capital employed. All
business areas are required over time to achieve an
average return on capital employed of at least 15%.
INVESTOR RELATIONS
Communication with investors, analysts and the
stockmarket in general, both in Norway and
abroad, is a priority for Orkla. Readily available and
reliable information on the Group will, in Orkla’s
view, increase the market’s interest in the share and
form a better basis for evaluating the Group. Orkla
holds regular presentations in financial centres in
Europe and the USA and also holds frequent indi-
vidual meetings with investors and analysts.
Important events affecting the Group are reported
immediately.
VOTING RIGHTS AND SHARE OWNERSHIP
As a result of adaptation by Norway to EEA regula-
tions, Orkla merged its Ordinary A and Free A
share classes to a single class with effect from
1.1.1995. The company now has only two share
classes: A and B. The latter do not carry voting
rights. The company has no ownership limitations
other than as provided in Norwegian concession
legislation.
In total 47.4 million shares were traded in
1994, almost equal to the total number of out-
standing shares. Aggregate turnover of Orkla shares
on the Oslo Stock Exchange was NOK 6,456 mil-
lion, which represented 5.2% of total equity turn-
over on the Exchange. 25% of total turnover in
Free A and B shares took place on SEAQ
International. At 31.12.1994 Orkla had 32,512
shareholders and 25.2% of the shares were held by
foreign investors. During the spring of 1995 Orkla
will facilitate trading in the company’s shares in the
USA through the establishment of a Level 1 ADR
programme for both share classes.
The Annual General Meeting held on
10.5.1994 resolved to grant the employees of the
Norwegian companies options on a total of
634,408 B shares. The options may be exercised in
May 1997 at the earliest and has a strike price at
NOK 25.00. Employees in senior positions
throughout the Group have been granted options
on convertible bonds and shares corresponding to a
total of 346,393 treasury shares. The average strike
price at 31.12.1994 was NOK 176.50, the same as
the market value at the time of issue.
The Board holds an authorisation from
5.5.1993 until the Annual General Meeting in
1995 to issue up to 3.3 million shares without pref-
erential rights for existing shareholders.
DIVIDEND AND SHARE PRICE PERFORMANCE
The Board proposes that a dividend of NOK 5.00
per share is paid for 1994, an increase of 22% from
1993. Those shareholders registered as holders at
the date of the annual general meeting have the
right to the dividend which will be paid on
30.5.1995.
Orkla’s market capitalisation at 31.12.1994 was
NOK 11,727 million, corresponding to 4.8% of
the Oslo Stock Exchange’s equity market capitalisa-
tion, which made Orkla the Oslo Stock Exchange’s
fourth largest company by market capitalisation at
the end of the year. During 1994 there was an aver-
age fall in the Orkla share price of 12.2%, against a
rise in the Oslo Stock Exchange All Share Index of
7.1%. Shareholders received NOK 4.10 in dividend
per share in 1994.
At 31.12.1994 the share capital totalled NOK
1,218,681,025 divided into 48,747,241 shares of
NOK 25. The average number of outstanding
shares in 1994, fully diluted, was 47,816,539.

31O R K L A A N N U A L R E P O R T 1 9 9 4
SHARES OUTSTANDING AT 31.12.1994
A-shares B-shares Total
Issued shares 39,488,961 9,258,280 48,747,241
Treasury shares (see note 20) (1,135,891) (197,351) (1,333,242)
Shares outstanding 38,353,070 9,060,929 47,413,999
Convertible bonds 1,986,655 198,665 2,185,320
Treasury convertible bonds (see note 20) (1,981,168) (198,117) (2,179,285)
Employee share scheme options - 634,408 634,408
Shares outstanding (fully diluted) 38,358,557 9,695,885 48,054,442
SHARE PRICE 1994
NOK Ordinary FreeA-shares A-shares B-shares
High 297.00 305.00 293.00
Low 180.00 180.00 175.00
Close at 30.12.1994 250.00 247.00 240.00
THE 10 LARGEST SHAREHOLDERS AT 31.12.1994
% of % ofA-shares B-shares Total capital votes
Folketrygdfondet 4,668,538 775,487 5,444,025 11.2% 11.8%
UNI Storebrand *) 3,586,843 517,956 4,104,799 8.4% 9.1%
Chase Manhattan Bank 2,673,633 599,116 3,272,749 6.7% 6.8%
Norsk Hydro incl. Pension fund *) 2,845,306 24,864 2,870,170 5.9% 7.2%
Investhon A.S 1,604,179 103,750 1,707,929 3.5% 4.1%
Citibank 672,719 894,097 1,566,816 3.2% 1.7%
Hartog & Co. A.S 1,515,000 - 1,515,000 3.1% 3.8%
Morgan Guaranty Trust 509,122 833,215 1,342,337 2.8% 1.3%
Avanse Forvaltning A.S 1,274,510 - 1,274,510 2.6% 3.2%
Oktav Invest A.S **) 1,047,021 209,403 1,256,424 2.6% 2.7%
Total 20,396,871 3,957,888 24,354,759 50.0% 51.7%
Total all shares 39,488,961 9,258,280 48,747,241 100.0% 100.0%*) A grouping of several legal entities with inter-company relationships.
**) 80% owned by Orkla A.S.
SHARES BY SIZE OF SHARE HOLDING
AT 31.12.1994
No of No of % ofshares shareholders capital
1 - 100 21,219 1.3%
101 - 1,000 9,588 6.0%
1,001 - 10,000 1,427 7.6%
10,001 - 100,000 218 12.1%
100,001 - 500,000 46 21.4%
500,001 - 14 51.6%
60
70
80
90
100
110
120
1 2 3 4 5 6 7 8 9 10 11 12
■ Orkla A ■ Oslo Stock Exchange All Share IndexIndex Jan. 1, 1994=100
10
15
20
25
30
12.92 6.93 12.93 6.94 12.94
OWNERSHIP BY FOREIGN INVESTORS
SHARE PRICE DEVELOPMENT 1994
%

32 33O R K L A A N N U A L R E P O R T 1 9 9 4 O R K L A A N N U A L R E P O R T 1 9 9 4
B A S I S F O R V A L U A T I O N
PROFIT AND LOSS ACCOUNT (NOK mill.) BALANCE SHEET (NOK mill.)
Operating revenues 20,634 17,704 16,746 ASSETS
Operating expenses (18,002) (15,540) (14,719) Current assets 9,093 7,629 6,654
Goodwill depreciation (109) (63) (66) Long-term assets 9,471 9,068 8,188
Ordinary depreciation (998) (860) (791) Total assets 1) 18,564 16,697 14,842
Operating profit 1,525 1,241 1,170 LIABILITIES AND EQUITY
Profit from associated companies 129 219 133 Interest-free debt 5,511 5,148 4,819
Financial items (430) (417) (425) Interest-bearing debt 8,675 7,456 6,051
Profit before tax 1,224 1,043 878 Equity 4,378 4,093 3,972
KEY FIGURES Total liabilities and equity 18,564 16,697 14,842
International sales (NOK mill.) 7,135 5,385 4,632 Net interest-bearing debt 4,558 4,306 3,329
Cashflow from operations (NOK mill.) 2,383 1,947 2,244
Net maintenance and environmental inv. (NOK mill.) (891) (1,102) (794) 1) of which lending to Financial Investments 3,083 2,594 1,927
Operating margin (%) 7.4 7.0 7.0
Return on capital employed (%)* 17.6 18.0 18.0
Total man-years 16,196 14,466 13,555
*(Operating profit + profit from associated companies) / Average capital employed
INDUSTRY AREA (BRANDED CONSUMER GOODS AND CHEMICALS) + HEAD OFFICE/UNALLOCATED
1994 1993 1992 1994 1993 1992
ORKLA BEVERAGES ORKLA FOODS ORKLA BRANDS
1994 1993 1992 1994 1993 1992 1994 1993 1992
PROFIT AND LOSS ACCOUNT (NOK mill.)
Operating revenues 3,322 3,025 2,752 5,286 4,527 4,114 5,386 4,436 4,163
Operating expenses (2,826) (2,585) (2,287) (4,696) (3,974) (3,612) (4,752) (3,863) (3,667)
Goodwill depreciation (1) 0 0 (42) (32) (23) (27) (9) (23)
Ordinary depreciation (332) (305) (246) (186) (162) (145) (186) (143) (142)
Operating profit 163 135 219 362 359 334 421 421 331
Profit from associated companies 4 1 1 0 0 1 70 92 115
CAPITAL EMPLOYED AT 31.12. (NOK mill.)
Net working capital (67) (38) (166) 97 29 (50) 406 298 301
Associated companies 15 16 11 1 2 2 452 674 637
Goodwill 13 9 0 585 613 337 451 149 152
Fixed assets 1,899 1,915 1,575 1,202 1,157 960 962 801 814
Capital employed 1,860 1,902 1,420 1,885 1,801 1,249 2,271 1,922 1,904
KEY F IGURES
International sales (NOK mill.) 318 294 145 1.525 991 633 1,805 1,117 1,106
Cashflow from operations (NOK mill.) 523 332 658 521 438 579 488 583 571
Net maintenance and environmental inv. (NOK mill.) (297) (548) (386) (212) (164) (190) (153) (137) (172)
Operating margin (%) 4.9 4.4 8.0 6.8 7.9 8.1 7.8 9.5 7.9
Return on capital employed (%)* 8.8 8.0 17.1 19.2 22.9 24.8 22.0 25.9 22.8
Total man-years 3,792 3,581 3,118 3,234 3,210 2,735 3,474 2,844 2,913
S U M M A R Y A C C O U N T S O F T H E O P E R A T I N G U N I T S
PROFIT AND LOSS ACCOUNT (NOK mill.) BALANCE SHEET (NOK mill.)
Operating revenues 158 160 68 ASSETS
Operating expenses (131) (119) (44) Current assets 5,789 5,215 3,825
Ordinary depreciation (11) (12) (4) Long-term assets 521 520 241
Operating profit 16 29 20 Total assets 6,310 5,735 4,066
Profit from associated companies 0 0 (21) LIABILITIES AND EQUITY
Portfolio gains 418 350 (381) Interest-free debt 145 178 68
Financial items (84) (106) (181) Interest-bearing debt 3,101 2,880 1,927
Profit before tax 350 273 (563) Equity 3,064 2,677 2,071
SECURITIES PORTFOLIO (NOK mill.) Total liabilities and equity 6,310 5,735 4,066
Market value 8,194 7,361 3,798 Net interest-bearing debt 3,068 2,776 1,790
Book value 5,531 4,888 3,793
Unrealised gains before tax 2,663 2,473 5
Net asset value 5,252 4,690 1,865
Equity ratio, value adjusted (%) 64.1 63.7 49.1
FINANCIAL INVESTMENTS
1994 1993 1992 1994 1993 1992
ORKLA APPAREL ORKLA MEDIA*) BRANDED CONSUMER GOODS CHEMICALS
1994 1993 1992 1994 1993 1992 1994 1993 1992 1994 1993 1992
1,297 1,113 1,077 1,726 1,283 1,261 16,308 13,739 12,988 3,155 2,806 2,613
(1,197) (1,045) (980) (1,486) (1,122) (1,130) (14,295) (11,979) (11,307) (2,625) (2,424) (2,288)
(2) 0 0 (24) (11) (10) (95) (52) (56) (8) (7) (5)
(34) (28) (24) (76) (57) (54) (800) (686) (609) (173) (151) (162)
64 40 73 140 93 67 1,118 1,022 1,016 349 224 158
0 0 0 17 104 13 117 218 140 5 3 2
349 298 328 (222) (153) (119) 646 487 347 470 351 298
0 0 0 253 261 139 777 978 817 35 13 12
16 16 1 386 128 136 1,444 909 622 25 16 23
139 150 147 541 387 394 4,667 4,381 3,868 1,561 1,283 1,168
504 464 476 958 623 550 7,534 6,755 5,654 2,091 1,663 1,501
910 686 657 0 2 1 4,559 3,090 2,542 2,576 2,294 2,088
36 103 13 309 162 117 1,825 1,584 1,877 403 336 243
(14) (31) (30) (69) (40) (46) (702) (915) (795) (152) (158) (137)
4.9 3.6 6.8 8.1 7.2 5.3 6.9 7.4 7.8 11.1 8.0 6.0
12.0 7.9 14.4 18.8 35.2 13.9 16.6 19.5 20.4 19.3 14.2 11.2
1,515 1,337 1,290 1,656 1,191 1,190 13,671 12,163 11,246 2,036 1,882 1,890
* Hjemmet Mortensen treated as a joint venture. See page 46.


34 O R K L A A N N U A L R E P O R T 1 9 9 4
Def. 1994 1993 1992 1991 1990
Turnover
1. Operating revenue (NOK million) 20,780 17,858 16,807 16,133 15,465
2. International sales (%) 34 30 28 26 23
Profit/Cashflow/Investments
3. Operating profit (NOK million) 1,541 1,270 1,190 870 911
4. Net profit 1 (NOK million) 1,149 984 203 767 641
5. Self-financing capacity 2 (NOK million) 674 (11) 491 (144) 817
6. Maintenance/Environmental investments, net 3 (NOK million) 891 1,102 794 856 621
7. Expansion investments 4 (NOK million) 1,175 924 802 380 1,261
Profitability
8. Operating margin 5 (%) 7.4 7.1 7.1 5.4 5.9
9. Return on capital employed (Industry area) 6 (%) 17.6 18.0 18.0 12.4 N/A
10. Return on equity 7 (%) 17.0 15.9 3.5 14.0 15.0
Capital
11. Market capitalisation 8 (NOK million) 11,727 13,358 7,912 7,262 9,458
12. Book value of total assets (NOK million) 21,402 19,492 16,743 17,093 17,044
13. Book value of equity (incl. minority interests) 9 (NOK million) 7,442 6,770 6,043 5,892 5,249
14. Equity ratio 10 (%) 34.8 34.7 36.1 34.5 30.8
15. Net interest-bearing debt 11 (NOK million) 7,626 7,082 5,119 5,485 5,430
16. Interest coverage ratio 12 3.8 3.2 1.5 2.2 2.8
Shares
17. No. of shares outstanding (fully diluted) at 31.12. (x 1,000) 48,054 47,420 47,420 47,450 50,994
18. Average no. of shares outstanding (fully diluted) (x 1,000) 47,817 47,420 47,435 47,610 49,708
Share-related key figures
19. Share price at 31.12. Ordinary A-shares 13 (NOK) 250 280 167 155 191
20. Earnings per share 14 (NOK) 24.00 20.80 4.30 16.10 12.90
21. Cashflow per share 15 (NOK) 46.60 39.80 31.50 34.50 29.40
22. Dividend per share (NOK) 5.00 4.10 3.75 3.41 3.18
23. Payout ratio 16 (%) 20.5 19.6 87.7 21.0 24.8
24. Price/earnings ratio 17 10.4 13.5 39.0 9.6 14.8
25. Price/cashflow ratio 17 5.4 7.0 5.3 4.5 6.5
Personnel
26. Total employees 16,873 15,081 14,679 14,505 14,044
27. Total man-years 16,281 14,532 13,606 13,473 12,871
1. Excluding other items in 1990 and 1991.For 1990 a tax level of 28% is applied.
2. From cashflow statement page 15. 3. Investments in industrial plants, machinery, etc. within existing activities - Book
value of fixed assets sold4. Strategic investments to expand the Group's activities.5. (Operating profit/Operating revenue) x 1006. (Operating profit + Profit from associated companies)/(Average interest free cur-
rent assets - Average interest free current liabilities + Average long-term assets)7. (Net profit/Average book equity) x 1008. Historic market capitalisation of the Group at 31.12.1990 is calculated by
adding the market capitalisation of Nora Industrier and Orkla Borregaard, after eliminating pro forma treasury shares.
9. For 1990: Book equity + consolidation reserve + 72% of other conditional tax-free reserves + Min.interests
10. Book equity capital including min. interests/Total book assets11. Total interest-bearing debt - Interest-bearing receivables and liquid assets (cash,
bank deposits, etc.)12. (Profit before tax - Other items + Net interest expenses)/Net interest expenses13. Share price 1990 is for Orkla Borregaard's Ordinary A-shares.14. Net profit/Average no. of shares held externally15. (Net profit + Ord. depreciation + Write-downs share portfolio - Minorities' share
of ord.depreciation - Change in deferred tax)/Average no. of shares held exter-nally
16. (Allocation for dividend for the accounting year/Net profit) x 10017. Relates to Orkla Ordinary A-shares.
B A S I S F O R V A L U A T I O N
G R O U P K E Y F I G U R E S
35O R K L A A N N U A L R E P O R T 1 9 9 4
A S S E T V A L U E S
B A S I S F O R V A L U A T I O N
A possible model for valuing Orkla is to distinguish betweenindustrial assets where the value relates to future earningsfrom continuing operations and the Group’s tradeable assetswith identifiable market values.
Orkla owns a number of Norwegian, and certain Nordic,brands which are important for the Group’s future earnings.In addition, Orkla has cooperation agreements with Unileverin detergents and personal products and with The Coca-Colacompany regarding carbonated soft drinks. No account istaken in this summary of additional values related to Orkla’sbrands and cooperation agreements. This could be taken intoaccount in the discount rate used in the valuation.
Set out below are details of the main data necessary tovalue Orkla’s assets. Using this as a basis an investor may usehis own assumptions on the value of different assets to pre-pare a valuation of the Group.
FORESTS
The Group owns 110,000 hectares of which approximately80,000 hectares represent productive forests. Forests have abook value under fixed assets of NOK 117 million. Theannual logging quantity is approximately 120,000 sm3 whichis sold at market price.
POWER
The Group’s hydro-electric power production in a normalyear is 655 GWh of which 615 GWh is derived from water-falls not subject to reversion. In addition, there is 45 GWh ofreplacement power. Of this approximately 450 GWh is usedinternally in the Group in a normal year. Power is sold or setoff internally at market prices, mainly on long-term con-tracts. The book value of assets related to the power businessunder fixed assets is NOK 113 million of which NOK 33million is the book value of power rights.
INVESTMENT AREA
At 31.12.1994 the Group’s securities portfolio had a marketvalue of approximately NOK 8.2 billion. The book value wasNOK 5.5 million.
The Group owns approximately 20% of SkøyenNæringspark, a former industrial area of some 6.3 hectares inOslo. The area is being developed and on completion at theend of the decade will consist of approximately 187,000square metres of commercial and office premises, includingcar parking of around 20,000 square metres. The book valueof Orkla’s interest was NOK 106 million.
The Investment area’s net interest-bearing debt amountedto NOK 3,068 million at 31.12.1994, and the book value ofequity was NOK 3,064 million.
INDUSTRY AREA
The operating profit is divided between the different businessareas in the tables on pages 32 and 33. The Industry area’snet interest-bearing debt at 31.12.1994 totalled NOK 4,558million.
TAX
The Group’s tax charge for 1994 amounts to NOK 410 mil-lion corresponding to 26.0%. This tax charge primarilyrelates to industrial activities. As a result of cost price adjust-ments, mainly related to the transitional rules for the 1991tax reform, and tax exemption on dividends from Norwegiancompanies, the Investment area’s tax charge is very low. At31.12.1994 unutilised cost price adjustments related to thetax reform totalled approximately NOK 400 million.
Adjusted profit, Industry area 1994 1993 1992 1991Operating profit, Industry area 1,525 1,241 1,170 842Adjustments for forests and power (63) (36) (52) (54)Adjusted operating profit 1,462 1,205 1,118 788Share of results associated companies 129 219 133 35Net financial expenses (430) (417) (425) (350)Adjusted ordinary profit 1,161 1,007 826 473

NORDIC BRANDED CONSUMER GOODS
STRATEGY
During 1994 Orkla continued its efforts todevelop Nordic business systems in the BrandedConsumer Goods area. The objective of thisstrategy is to achieve synergies through jointproduct development and marketing, improvedutilisation of the businesses’ distribution systemsin the respective Nordic countries, as well asproduction specialisation.
As a result of the acquisition of the remain-ing 51% of the shares in Göteborgs Kex and thepurchase of the Finnish biscuits companyKantolan, an integrated Nordic biscuits businesshas been established. This business is the marketleader in the Nordic region with an aggregatemarket share of around 36%.
Foods continues tointroduce selected brandsacross Nordic national fron-tiers. Good results have beenobtained from launches inSweden of both frozen pizzaand sugar-free squashes. At the same time, productspreviously introduced by BOBin Sweden have been launchedin Norway.
RESULTS
The operating profit of theBranded Consumer Goodsarea was NOK 1,118 mil-
lion compared with NOK 1,022 million in1993. Operating revenues totalled NOK 16,308million, an increase of 19% from 1993. Most ofthe growth took place outside Norway and wasmainly related to the Foods and Biscuits busi-nesses. In addition Orkla Media recorded con-siderable growth in operating revenues as a resultof expansion in newspapers in Norway. Beveragesachieved growth of 10% as a consequence ofstrong expansion in the Norwegian market forcarbonated soft drinks. 18% of the BrandedConsumer Goods area’s total sales are derivedfrom the other Nordic countries and 10% fromsales outside the Nordic region, compared with12% and 11% respectively in 1993.
The achieved cost-savings have largely com-pensated for lower prices in real terms in Foods
and poor results for Confec-tionery. The operating mar-gin for the area as a wholenevertheless deteriorated, large-ly due to higher expenditureon advertising and productdevelopment. A number ofnew products were launched in1994, several involving heavypromotional support.
Advertising expenditure hasnow reached a more appropriatelevel, and it is expected that therate of growth will level out inthe future. The transition toTV advertising has largely been
36 O R K L A A N N U A L R E P O R T 1 9 9 4
OPERATING REVENUE
■ Orkla Beverages 19.8%■ Orkla Foods 31.2%■ Orkla Brands 31.0%■ Orkla Apparel 7.7%■ Orkla Media 10.3%
BRANDED CONSUMER GOODS

completed. In the coming years we will furtherincrease our efforts to improve the value ofadvertising expenditure. There will continue tobe strong growth in product developmentwhich is essential for continued profit growth.Our objective is to increase the proportion ofsales represented by new products in the future.The rate of product launches has risen in recentyears and will be further intensified in 1995.This is particularly the case for Orkla Foods.
MARKETING
The consumer goods markets have shown amoderate volume increase in all Nordic coun-tries. In the Norwegian market there was vol-ume growth of 2.5-3.0% and price increases ofless than 2%. As a result of a new GATT agree-ment and the debate on membership of the EU,the structure and competitiveness of the foodmanufacturing industry have been importantsubjects for public debate. Expenditure totallingNOK 900 million to support restructuring inthe industry was approved by the Norwegianparliament and allocated by the NorwegianIndustrial and Regional Development Fund atthe yearend. Orkla’s food products business wasallocated some of these funds, which will con-tribute positively to the business’ restructuring.The proportion allocated is nevertheless moder-ate, given the size of Orkla.
As in previous years, 1994 was characterisedby tough and growing competition. At the sametime, the process towards concentration in
wholesaling andretailing in theNorwegian grocery marketcontinued. Orkla’s confectionerybusiness in Norway switched fromdirect to wholesale distribution at thebeginning of the year, which had a negativeimpact on the business’s result in 1994.
Several of the Group’s Branded ConsumerGoods companies participated as official spon-sors of the Winter Olympics at Lillehammer,where good exposure was obtained forCoca-Cola, KIMs and New Energy.
On the food products side, Arion (slicedmeats and prepared dishes based on turkey) waslaunched. Detergents and Personal productsincreased their market shares with launcheswhich included Blenda Sensitive, JIF Micro,Dove, Organics and new Solidox varieties.The areas Snacks and Biscuits strengthenedtheir positions with product launches acrossNordic national frontiers. Beverages launchedthe beer 3 1/2 as well as Tab X-tra and Nestea.
ORGANISATIONAL CHANGES
On 6 February 1995 Orkla sold 50% of theshares in Helly-Hansen. With effect from1.1.1995 Viking Fottøy reports together withHead Office/Unallocated while the remainingholding in Helly-Hansen has been included inthe Investment area’s portfolio as a financialinvestment.
37O R K L A A N N U A L R E P O R T 1 9 9 4
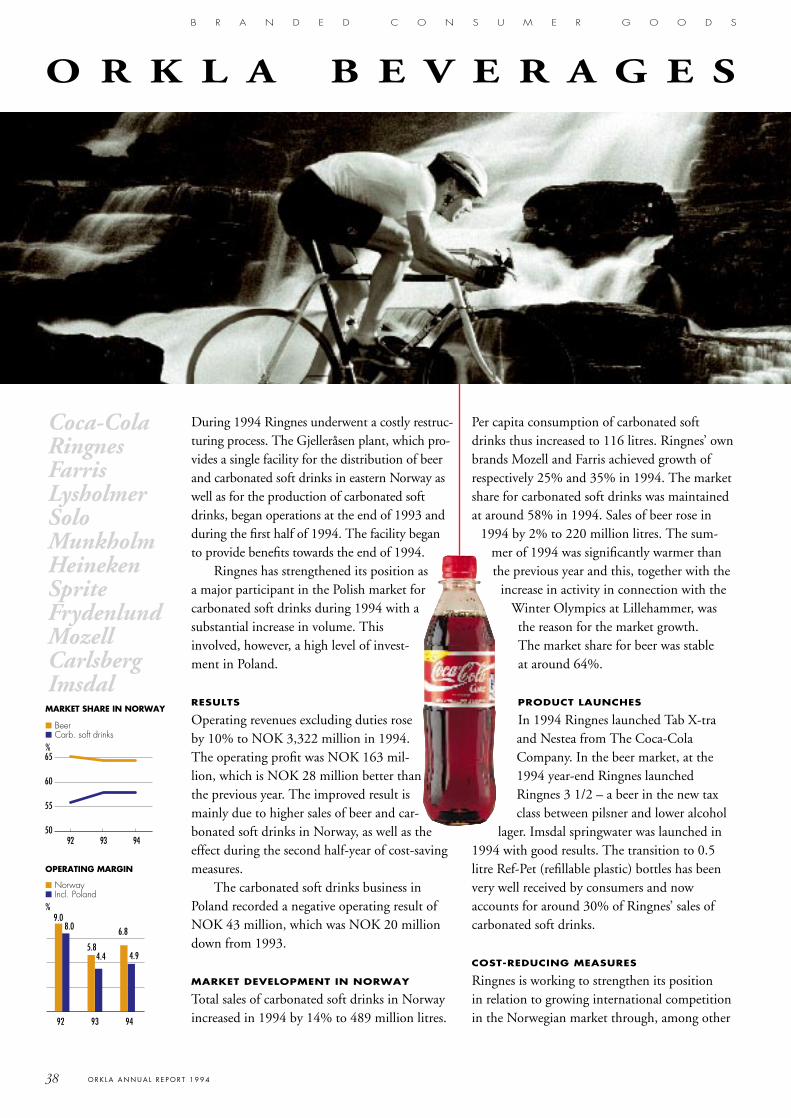
OPERATING MARGIN
■ Norway ■ Incl. Poland%
38 O R K L A A N N U A L R E P O R T 1 9 9 4
Coca-ColaRingnesFarrisLysholmerSoloMunkholmHeinekenSpriteFrydenlundMozellCarlsbergImsdal
B R A N D E D C O N S U M E R G O O D S
During 1994 Ringnes underwent a costly restruc-turing process. The Gjelleråsen plant, which pro-vides a single facility for the distribution of beerand carbonated soft drinks in eastern Norway aswell as for the production of carbonated softdrinks, began operations at the end of 1993 andduring the first half of 1994. The facility beganto provide benefits towards the end of 1994.
Ringnes has strengthened its position asa major participant in the Polish market forcarbonated soft drinks during 1994 with asubstantial increase in volume. Thisinvolved, however, a high level of invest-ment in Poland.
RESULTS
Operating revenues excluding duties roseby 10% to NOK 3,322 million in 1994.The operating profit was NOK 163 mil-lion, which is NOK 28 million better thanthe previous year. The improved result ismainly due to higher sales of beer and car-bonated soft drinks in Norway, as well as theeffect during the second half-year of cost-savingmeasures.
The carbonated soft drinks business inPoland recorded a negative operating result ofNOK 43 million, which was NOK 20 milliondown from 1993.
MARKET DEVELOPMENT IN NORWAY
Total sales of carbonated soft drinks in Norwayincreased in 1994 by 14% to 489 million litres.
Per capita consumption of carbonated softdrinks thus increased to 116 litres. Ringnes’ ownbrands Mozell and Farris achieved growth ofrespectively 25% and 35% in 1994. The marketshare for carbonated soft drinks was maintainedat around 58% in 1994. Sales of beer rose in
1994 by 2% to 220 million litres. The sum-mer of 1994 was significantly warmer thanthe previous year and this, together with the
increase in activity in connection with theWinter Olympics at Lillehammer, wasthe reason for the market growth.The market share for beer was stableat around 64%.
PRODUCT LAUNCHES
In 1994 Ringnes launched Tab X-traand Nestea from The Coca-ColaCompany. In the beer market, at the1994 year-end Ringnes launchedRingnes 3 1/2 – a beer in the new taxclass between pilsner and lower alcohol
lager. Imsdal springwater was launched in1994 with good results. The transition to 0.5litre Ref-Pet (refillable plastic) bottles has beenvery well received by consumers and nowaccounts for around 30% of Ringnes’ sales ofcarbonated soft drinks.
COST-REDUCING MEASURES
Ringnes is working to strengthen its positionin relation to growing international competitionin the Norwegian market through, among other
50
55
60
65
92 93 94
MARKET SHARE IN NORWAY
■ Beer ■ Carb. soft drinks%
0
5
0
5
0
92 93 94
9.08.0
4.4 4.9
6.8
5.8
O R K L A B E V E R A G E S

39O R K L A A N N U A L R E P O R T 1 9 9 4
things, reducing costs. All production of carbo-nated soft drinks in the Oslo region has beengrouped at the Gjelleråsen plant as from thespring of 1994. The distribution of beer andcarbonated soft drinks for central easternNorway has been located at Gjelleråsen sinceOctober 1993. Both these measures do nowgenerate positive effects. The restructuring pro-cess involved planned production shutdowns forperiods in 1994. This had an impact on costssince it was necessary to buy products from oth-er bottlers as well as to transport substantial vol-umes to Gjelleråsen from the company’s ownplants in other parts of the country. The distri-bution structure has also been reviewed in otherparts of Norway. This has resulted in a reorgan-isation of route structures and closure of depotswhich should give improved distribution effi-ciency. The depots at Skien and Tønsberghave been closed and replaced by anew depot in Larvik.
Investments will be made in1995 in a bottling line in Arendalwhich will be operational beforethe summer, as well as in anautomated warehouse atGjelleråsen. These are beingmade to increase capacity in response to the stronggrowth which has takenplace in the market forcarbonated soft drinks.
INTERNATIONALISATION
Ringnes’ Polish companies have increased theirsales by 47% in their franchise areas. Operationsin Poland have functioned satisfactorily. Theoverall development in the market for carbonat-ed soft drinks has also been in line with expecta-tions. However the development in results hasbeen poorer than expected due to a highergrowth in sales of low price products than thatfor products with higher prices. In addition,sales of carbonated soft drinks in one-way plasticcontainers have obtained a much stronger posi-
tion than originally expected. Thishas led to a lower level of pro-duction by the company itself
and thus weakened margins inRingnes’ businesses. As a conse-
quence of greater competition inthe market, prices of carbonated
soft drinks have, moreover, notfollowed the general rate of infla-tion. The high volume growthinvolves substantial investmentswhich have been charged to the
result through a high level ofdepreciation.
It has been decided not to pro-ceed with plans to enter the brewery
sector in Poland. As a result of this,the activities of Ringnes Beer which sold
imported beer in Poland were wound upin 1994.
OPERATING REVENUEBY PRODUCT GROUP
■ Soft drinks Norway 58%■ Beer Norway 33%■ Soft drinks Poland 9%
MARKET DEVELOPMENTIN NORWAY
■ Beer■ Carb. soft drinks
92 93 94
219 214 220
394 428
489million litre
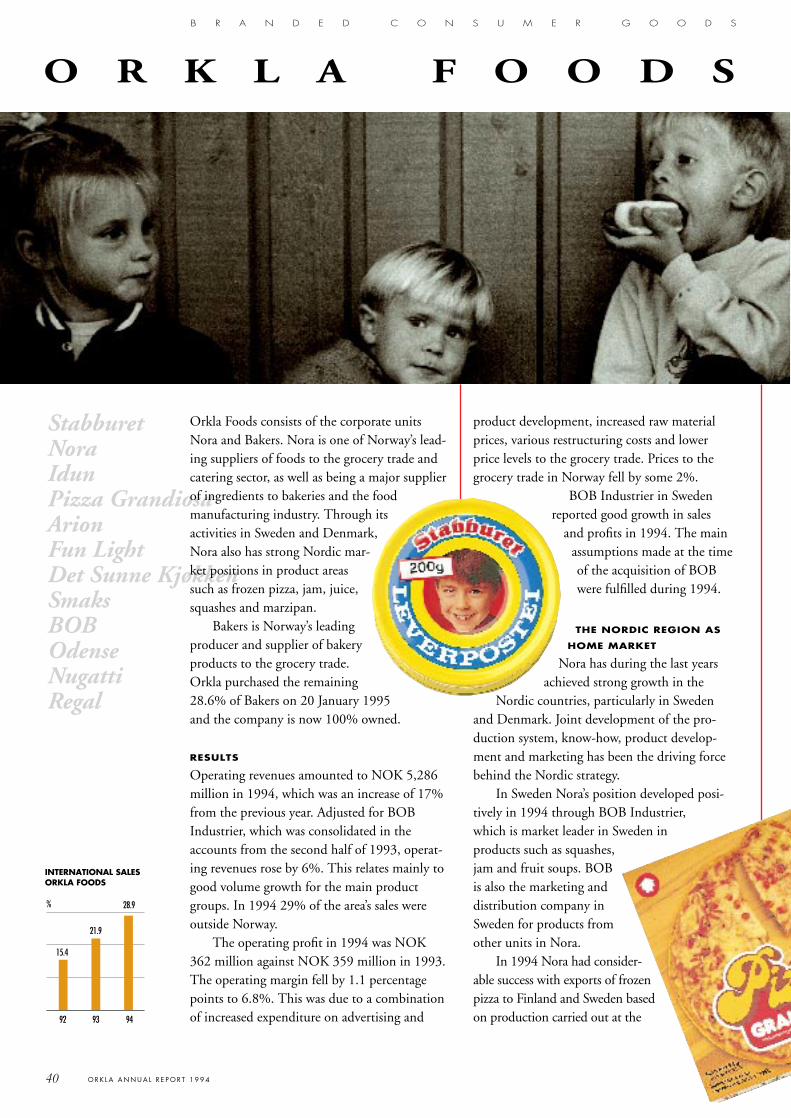
StabburetNoraIdunPizza GrandiosaArionFun LightDet Sunne KjøkkenSmaksBOBOdenseNugattiRegal
Orkla Foods consists of the corporate unitsNora and Bakers. Nora is one of Norway’s lead-ing suppliers of foods to the grocery trade andcatering sector, as well as being a major supplierof ingredients to bakeries and the foodmanufacturing industry. Through itsactivities in Sweden and Denmark,Nora also has strong Nordic mar-ket positions in product areassuch as frozen pizza, jam, juice,squashes and marzipan.
Bakers is Norway’s leadingproducer and supplier of bakeryproducts to the grocery trade.Orkla purchased the remaining28.6% of Bakers on 20 January 1995 and the company is now 100% owned.
RESULTS
Operating revenues amounted to NOK 5,286million in 1994, which was an increase of 17%from the previous year. Adjusted for BOBIndustrier, which was consolidated in theaccounts from the second half of 1993, operat-ing revenues rose by 6%. This relates mainly togood volume growth for the main productgroups. In 1994 29% of the area’s sales wereoutside Norway.
The operating profit in 1994 was NOK362 million against NOK 359 million in 1993.The operating margin fell by 1.1 percentagepoints to 6.8%. This was due to a combinationof increased expenditure on advertising and
product development, increased raw materialprices, various restructuring costs and lowerprice levels to the grocery trade. Prices to thegrocery trade in Norway fell by some 2%.
BOB Industrier in Swedenreported good growth in sales
and profits in 1994. The mainassumptions made at the timeof the acquisition of BOBwere fulfilled during 1994.
THE NORDIC REGION AS
HOME MARKET
Nora has during the last yearsachieved strong growth in the
Nordic countries, particularly in Swedenand Denmark. Joint development of the pro-duction system, know-how, product develop-ment and marketing has been the driving forcebehind the Nordic strategy.
In Sweden Nora’s position developed posi-tively in 1994 through BOB Industrier,which is market leader in Sweden inproducts such as squashes,jam and fruit soups. BOBis also the marketing anddistribution company inSweden for products fromother units in Nora.
In 1994 Nora had consider-able success with exports of frozenpizza to Finland and Sweden basedon production carried out at the
40 O R K L A A N N U A L R E P O R T 1 9 9 4
B R A N D E D C O N S U M E R G O O D S
0
0
0
0%
92 93 94
INTERNATIONAL SALESORKLA FOODS
O R K L A F O O D S
15.4
21.9
28.9

Stranda plant in Norway. In Sweden pizza wassold and marketed by BOB Industrier. Followingthe launch in Sweden in January 1994, Norabecame market leader during the course of theyear. Pizza exports to Finland also developed posi-tively and Nora’s entry in the market contributedto considerable growth in the frozen pizza market.
Nora also achieved success in 1994 withexports to Finland of Fun Lightsquash, produced by StabburetGimsøy in Skien. Production has,however, been transferred sinceJanuary 1995 to BOB Industrier inSweden as a result of changes intrade terms following Swedish andFinnish membership of theEuropean Union. BOB now servesboth the Swedish and Finnish mar-ket with this product.
Nora is established in Denmarkthrough Odense Marcipan andthe Dragsbæk/Dacapo group (50%owned). Odense Marcipan is the Nordicregion’s largest producer of marzipan
with a market share of 35%. TheDragsbæk/Dacapo group’s main prod-ucts are margarine, salads andcrisped onions. Aggregate sales in
Denmark amounted to aroundNOK 470 million in 1994.
Even though the Nordiccountries have chosen differ-ent forms of association with
the EU, Nora will continue to develop the Nordicregion as its home market. On the other hand,Nora’s internationalisation process will be dif-ferent from what it would have been if Norwayhad become a member of the European Union.For certain products, it will be more difficult topursue joint Nordic development on purchasing,production and marketing. The future param-
eters for trade in food productsbetween Norway and the EU havenot yet been finally established, how-ever. Among other things, the newGATT agreement will be of particu-lar relevance to the degree of Nordicintegration within Nora. The param-eters are expected to be clarified dur-ing the first half of 1995. Nora willcontinue to work for market accessfor Norwegian products in theNordic region in selected areas.
FOCUS ON COST-REDUCING MEASURES
Nora’s objective is to be competitive at aEuropean level. Improvements in competitive-ness require, among other things, continuouscost-saving measures, a strong focus on productdevelopment and brand building as well assteady improvements in the efficiency of pro-duction systems.
In 1994 a number of cost-saving measureswere carried out, which to some extent havealready produced benefits and to some extentwill have effects in the coming years.
41O R K L A A N N U A L R E P O R T 1 9 9 4
0
2
4
6
8
0
92 93 94
%
OPERATING MARGINORKLA FOODS
OPERATING REVENUE BYCOUNTRY, NORA
■ Norway 68%■ Sweden 17%■ Denmark 10%■ Other 5%
8.1 7.9 6.8

PRODUCT LAUNCHES
In recent years the use of resources in areas suchas product development, brand building andadvertising has increased markedly. Stabburet’slaunch of the Arion brand, a series of slicedmeats and prepared dishes using turkey, was themain news in 1994. Other launches in 1994included Idun ketchup without preservatives,new varieties of Idun dressings, a new Nora GodFrokost juice, Quiche, RisiFrutti, and severalnew salad varieties from Smaks. An ambitiousprogramme of new launches has also been pre-pared for 1995.
THE GROCERY AREA
Of Nora’s total operating revenues of NOK4,809 million in 1994, sales of branded goods tothe grocery sector in the Nordic region repre-sented 73%. The strongest brands in theNorwegian grocery sector are Stabburet, Nora,Idun, Pizza Grandiosa and Fun Light. Stabburetmaintained or strengthened its market shares inmost product areas for the grocery sector. BOBstrengthened its position in the Swedish grocerysector and obtained market access to several newchains in 1994. The sector improved its operat-ing profit from 1993 but the operating marginwas at the same level.
CATERING
The catering sector is an important market areafor Nora, with 11% of sales. Important custom-er groups are hotels, restaurants, roadside cafés,
canteens, kiosks and public institutions. Theoperating profit and margin for the catering sec-tor was lower than in 1993 as a result of a weakdevelopment in volume.
INDUSTRY
Several of the corporate units in Nora deliveringredients for further processing to bakeriesand other food manufacturing industry, includ-ing deliveries by Odense of marzipan and nou-gat to bakeries, of flour products by Regal Mølleto bakeries, and yeast to the same customergroup by Idun Industri. Sales in this market areaamounted to almost NOK 800 million in 1994,approximately 16% of Nora’s total sales. Overallthe operating result in 1994 was in line withthe previous year, but the operating margin waslower.
BAKERY PRODUCTS
Operating revenues rose by NOK 107 millionto NOK 583 million. The increase was mainlydue to the purchase of Hansen & Næss inLarvik and Bager Pedersen in Arendal in 1994,as well as the full-year effect of businessesacquired in 1993. In addition, certain regionsshow good volume development. The operatingprofit was slightly higher in 1994, while theoperating margin was reduced.
42 O R K L A A N N U A L R E P O R T 1 9 9 4
B R A N D E D C O N S U M E R G O O D S
0
0
0
0
92 93 94
100
172
256
ADVERTISING EXPENSES
(index 1992=100)
O R K L A F O O D S

Overall Orkla Brands strength-ened its Norwegian and
Scandinavian market shares in 1994.The development in market share was
satisfactory for all business areas withthe exception of Confectionery where the
reorganisation to wholesale distributiongave rise to transitional problems. Increased
market shares were achieved through a contin-ued high rate of product launches combinedwith active sales promotion and a strongincrease in advertising expenditure.
The main aim behind the establishment ofOrkla Brands was to create a common brandedgoods environment. This work has proceeded asplanned, while efforts are also being made toachieve synergies on the cost side. At the sametime one of the main priorities for Orkla Brandsis to further improve delivery standards andcooperate with customers to reduce coststhroughout the entire supply chain.
Priority is also being given in 1994 to envi-ronmental work. There were no significant dis-charges to the external environment in 1994and great emphasis is placed on furtherreducing also those emissions,which are well below thepermitted limits. Animportant part of theoverall environmentalprogramme is to reduce thefrequency of injuries at the pro-duction plants and it is therefore
encouraging that there was a clear decrease in1994. Denofa-Lilleborg was the first company inNorway to complete the “Green Office” project.
Since 1958 Orkla has enjoyed good cooper-ation with Unilever in detergents and personalproducts. In February 1995 a revised agreementwas signed which runs until 2014 and whichextends the cooperation along similar commer-cial principles as before.
RESULTS
Operating revenues increased by NOK 950million (21%) to NOK 5,386 million. Consol-idation of Göteborgs Kex following the acquisi-tion of the remaining 51% of the shares con-tributed about half this figure. Organic growthwas 9%. In addition to general market growthand higher market shares, an important part ofthe increase in sales can be attributed to the
edible oils business which experiencedvery good market conditions and
which resumed soya meal sales fol-lowing start-up of the extraction
plant.The operating profit
was NOK 421 million,which is in line withthe previous year. A
positive effect of the con-solidation of Göteborgs Kex was
more than balanced by the poor resultin Confectionery. Overall the result in
Confectionery is charged with non-recurring
43O R K L A A N N U A L R E P O R T 1 9 9 4
B R A N D E D C O N S U M E R G O O D S
MARKET GROWTHDETERGENTS (VALUE)
92 93 94
92 93 94
0
2
4
6
8
10
0
2
4
6
8
10
4
9
7
9 9
7
%
%
MARKET GROWTHPERSONAL PRODUCTS(VALUE)
O R K L A B R A N D S
StratosLabanTroika
DocKIMsPolly
BallerinaBixit
Singoalla

INTERNATIONAL SALESCONFECTIONERY
NOK mill.
costs of approximately NOK 40 million, ofwhich about one half was a write-down inNeedlers and the remainder related to the shiftto wholesale distribution in Norway.
Other business areas reported an improve-ment in profits overall. Higher advertisingexpenditure has led to increased market shares.In the longer term this provides a good basis forcontinued growth in earnings.
DETERGENTS
The total market for household detergentsincreased in 1994. The switch to concentrat-ed products continued and a consequentialreduction in underuse is the main reasonfor market growth. There was a highrate of new launches in 1994, withthe most important being BlendaSensitive and JIF Micro.
The transition to concen-trated powders, which hastaken place over severalyears, led to the ending of pro-duction of traditional powders atthe Oslo plant at the end of 1994. As part ofmeasures to secure future competitiveness, plan-ning of a new plant for liquid detergents hascommenced. An agreement has been signed withUnilever on exports of this type of product toseveral countries in Europe.
In cooperation with Personal products,Detergents has introduced a sophisticated order,despatch and invoicing system which contrib-
utes to lower costs and an improved deliveryservice for customers.
Industrial detergents increased their share ofa relatively stable overall market and continueto be the clear market leader. Profits developedpositively.
PERSONAL PRODUCTS
Several major launches, with the shampoo/con-ditioner brand Organics, Dove soap
and new Solidox varieties beingthe main ones, contributed to
increased market shares and abasis for future profitability. This
also contributed, however, to astrong increase in advertising expendi-
ture. Consequently, the result in 1994was somewhat weaker than in 1993.
CONFECTIONERY
The reorganisation to wholesale distribution inNorway was completed on 1 May and involvedconsiderable non-recurring expenses which havebeen charged to the 1994 results. The reorgan-isation also involved a loss of volume and marketshare for the year as a whole. Towards the end ofthe year there were signs of improvement, how-ever, and volume and market share in the lastfour months, seen in isolation, were in line withthe previous year.
As part of measures to adapt the cost structureto the new distribution pattern, it has been decid-ed to close the warehouse in Oslo and group all
O R K L A B R A N D S
B R A N D E D C O N S U M E R G O O D S
92 93 94
0
1
2
3
4
5
SNACKS CONSUMPTION PER CAPITA■ 1993■ 1994Kg.
Norway Denmark Sweden Finland
370435 442
44 O R K L A A N N U A L R E P O R T 1 9 9 4
0
100
200
300
400
500
OmoZaloJifOrganicsDoveSolidoxLa MotePeter Möller
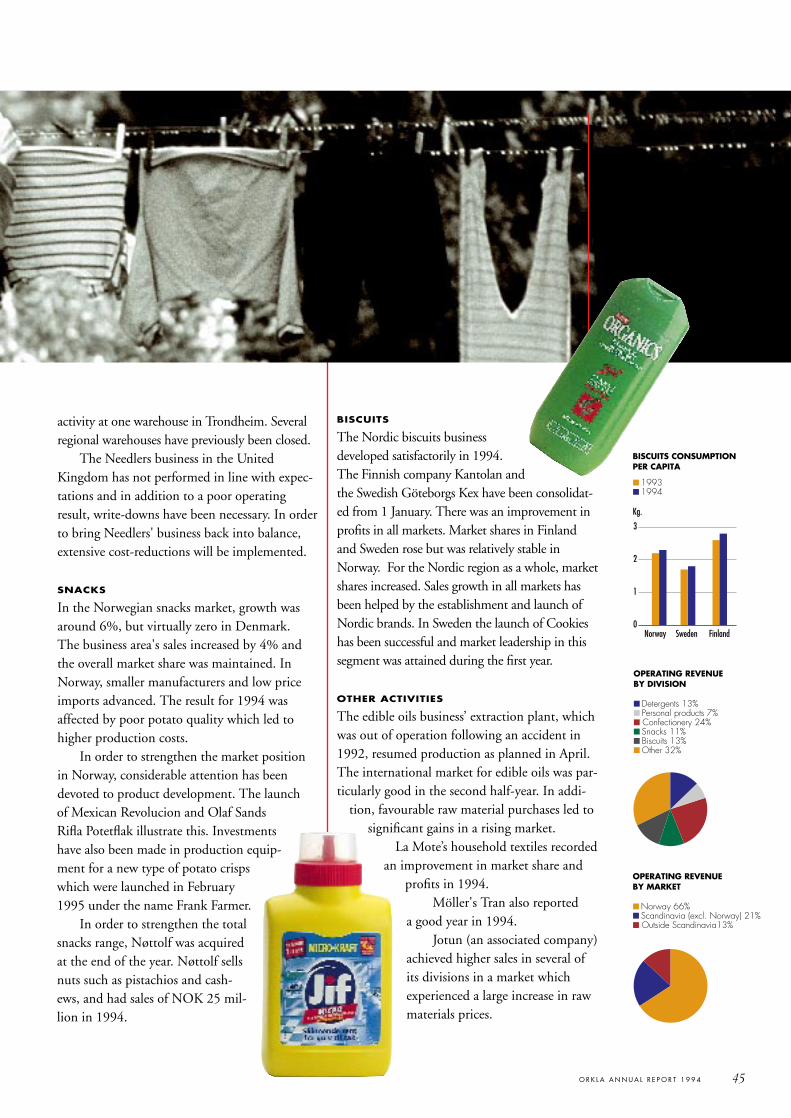
45O R K L A A N N U A L R E P O R T 1 9 9 4
activity at one warehouse in Trondheim. Severalregional warehouses have previously been closed.
The Needlers business in the UnitedKingdom has not performed in line with expec-tations and in addition to a poor operatingresult, write-downs have been necessary. In orderto bring Needlers' business back into balance,extensive cost-reductions will be implemented.
SNACKS
In the Norwegian snacks market, growth wasaround 6%, but virtually zero in Denmark.The business area's sales increased by 4% andthe overall market share was maintained. InNorway, smaller manufacturers and low priceimports advanced. The result for 1994 wasaffected by poor potato quality which led tohigher production costs.
In order to strengthen the market positionin Norway, considerable attention has beendevoted to product development. The launchof Mexican Revolucion and Olaf SandsRifla Potetflak illustrate this. Investmentshave also been made in production equip-ment for a new type of potato crispswhich were launched in February1995 under the name Frank Farmer.
In order to strengthen the totalsnacks range, Nøttolf was acquiredat the end of the year. Nøttolf sellsnuts such as pistachios and cash-ews, and had sales of NOK 25 mil-lion in 1994.
BISCUITS
The Nordic biscuits businessdeveloped satisfactorily in 1994.The Finnish company Kantolan andthe Swedish Göteborgs Kex have been consolidat-ed from 1 January. There was an improvement inprofits in all markets. Market shares in Finlandand Sweden rose but was relatively stable inNorway. For the Nordic region as a whole, marketshares increased. Sales growth in all markets hasbeen helped by the establishment and launch ofNordic brands. In Sweden the launch of Cookieshas been successful and market leadership in thissegment was attained during the first year.
OTHER ACTIVITIES
The edible oils business’ extraction plant, whichwas out of operation following an accident in1992, resumed production as planned in April.The international market for edible oils was par-ticularly good in the second half-year. In addi-
tion, favourable raw material purchases led tosignificant gains in a rising market.
La Mote’s household textiles recordedan improvement in market share and
profits in 1994.Möller's Tran also reported
a good year in 1994. Jotun (an associated company)
achieved higher sales in several ofits divisions in a market whichexperienced a large increase in rawmaterials prices.
OPERATING REVENUEBY DIVISION
■ Detergents 13%■ Personal products 7%■ Confectionery 24%■ Snacks 11%■ Biscuits 13%■ Other 32%
OPERATING REVENUEBY MARKET
■ Norway 66%■ Scandinavia (excl. Norway) 21%■ Outside Scandinavia13%
0
1
2
3g
BISCUITS CONSUMPTION PER CAPITA
■ 1993■ 1994
Kg.
Norway Sweden Finland

HjemmetNorsk UkebladVi MennFamilienDrammens Tidende ogBuskeruds BladSunnmørspostenHaugesunds Avis
46 O R K L A A N N U A L R E P O R T 1 9 9 4
O R K L A M E D I A
B R A N D E D C O N S U M E R G O O D S
Orkla Media secured its position as Norway’ssecond largest privately owned media companywith activities in the sectors of newspapers, mag-azines and direct marketing. The business areaexpanded considerably through acquisitions inboth Norway and Poland. All sectors reportedimprovements in operating profits and margins.
RESULTS*
Operating revenues in 1994 totalled NOK1,726 million. The increase of 35% from theprevious year was mainly due to acquisitions.The operating profit rose by NOK 47 million toNOK 140 million with new businesses makinga positive contribution. The operating marginrose from 7.2% in 1993 to 8.1% in 1994, main-ly as a result of cost-reductions and the disposalof operating assets.
NEWSPAPERS
The main strategy is to concentrate on subscrip-tion-based, local leading newspapers. At the endof 1994 Orkla Media was direct-ly or indirectly a majority ownerin 17 Norwegian newspaperswhich all had leading positions intheir respective local markets.
The sector achieved an oper-ating profit of NOK 95 millionand an operating margin of 9.9% compared with NOK 53million and 8.6%, respectively, in1993.
Orkla Media’snewspapersrecorded a rise incirculation from 1993of 0.3% to 228,150 copies.Advertising volume was in line withthe previous year and the downward trendsince 1988 seems to have ended.
Work on product development, productiv-ity improvements and training have given posi-tive results in 1994.
During 1994 the sector expanded with theacquisition of Varden (95%) and an increase inthe holding in Fjordenes Tidende from 34.9%to 98.5%. In addition, Drammens Tidende ogBuskeruds Blad (92.3% owned), where an agree-ment to purchase shares was signed at the end of 1993, was consolidated as a subsidiary from1.1.1994. The interest in Vestfold Grafiske ASwas sold.
Orkla Media has also expanded in the Polishnewspaper market and in 1994 acquired inter-
ests in a further two leadingregional newspapers. At the endof 1994 the media area had stra-tegic positions in seven leadingregional newspapers with inter-ests varying from 25.5% to78.4%. The total circulation ofthe newspapers is around400,000 or 10-12% of totalPolish newspaper circulation.During 1995 the newspaper in
0
5
0
5
0%
91 92 93 94
OPERATING MARGIN
OPERATING REVENUEBY SECTOR
■ Newspapers 55.8%■ Magazines 27.8%■ Direct marketing 16.4%
*Hjemmet Mortensen (50%) is treated here as a joint venture. In the Group accounts it is reported according to the equity method.
2.2
5.3
7.28.1
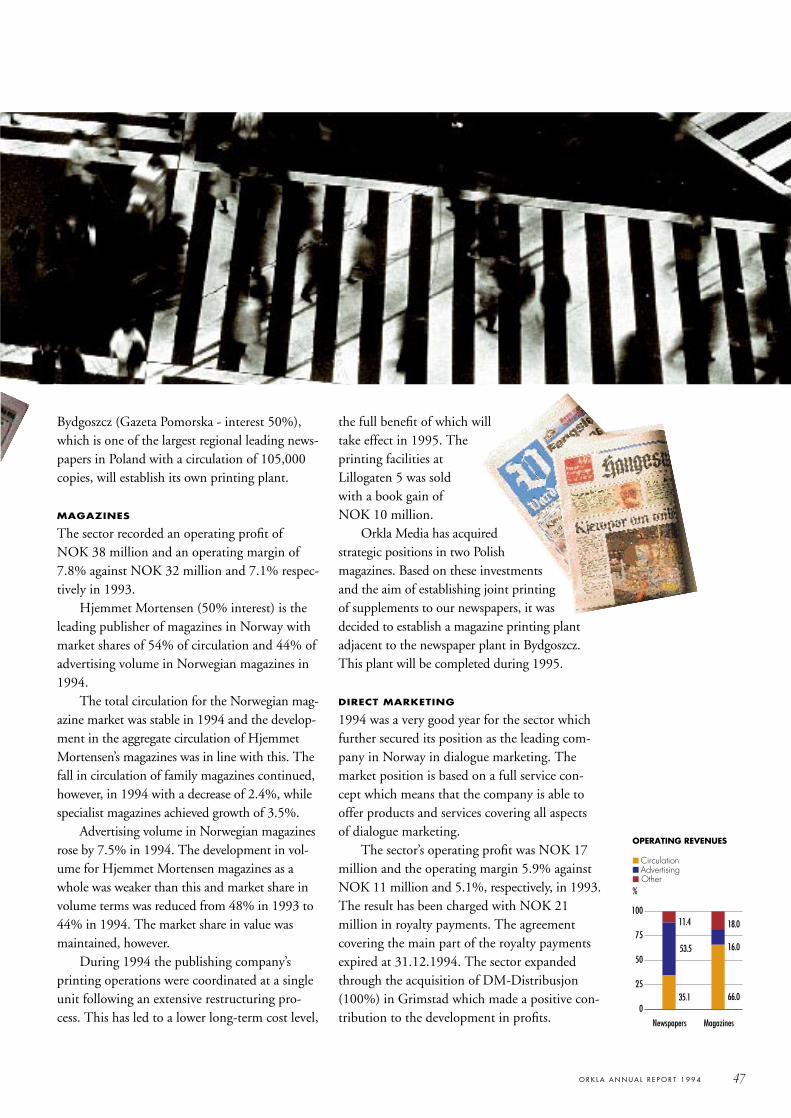
47O R K L A A N N U A L R E P O R T 1 9 9 4
Bydgoszcz (Gazeta Pomorska - interest 50%),which is one of the largest regional leading news-papers in Poland with a circulation of 105,000copies, will establish its own printing plant.
MAGAZINES
The sector recorded an operating profit of NOK 38 million and an operating margin of7.8% against NOK 32 million and 7.1% respec-tively in 1993.
Hjemmet Mortensen (50% interest) is theleading publisher of magazines in Norway withmarket shares of 54% of circulation and 44% ofadvertising volume in Norwegian magazines in1994.
The total circulation for the Norwegian mag-azine market was stable in 1994 and the develop-ment in the aggregate circulation of HjemmetMortensen’s magazines was in line with this. Thefall in circulation of family magazines continued,however, in 1994 with a decrease of 2.4%, whilespecialist magazines achieved growth of 3.5%.
Advertising volume in Norwegian magazinesrose by 7.5% in 1994. The development in vol-ume for Hjemmet Mortensen magazines as awhole was weaker than this and market share involume terms was reduced from 48% in 1993 to44% in 1994. The market share in value wasmaintained, however.
During 1994 the publishing company’sprinting operations were coordinated at a singleunit following an extensive restructuring pro-cess. This has led to a lower long-term cost level,
the full benefit of which willtake effect in 1995. Theprinting facilities atLillogaten 5 was soldwith a book gain of NOK 10 million.
Orkla Media has acquiredstrategic positions in two Polishmagazines. Based on these investmentsand the aim of establishing joint printingof supplements to our newspapers, it wasdecided to establish a magazine printing plantadjacent to the newspaper plant in Bydgoszcz.This plant will be completed during 1995.
DIRECT MARKETING
1994 was a very good year for the sector whichfurther secured its position as the leading com-pany in Norway in dialogue marketing. Themarket position is based on a full service con-cept which means that the company is able tooffer products and services covering all aspectsof dialogue marketing.
The sector’s operating profit was NOK 17million and the operating margin 5.9% againstNOK 11 million and 5.1%, respectively, in 1993.The result has been charged with NOK 21 million in royalty payments. The agreementcovering the main part of the royalty paymentsexpired at 31.12.1994. The sector expandedthrough the acquisition of DM-Distribusjon(100%) in Grimstad which made a positive con-tribution to the development in profits.
0
25
50
75
100
k
OPERATING REVENUES
■ Circulation■ Advertising■ Other%
35.1
53.5
11.4
66.0
16.0
18.0
Newspapers Magazines
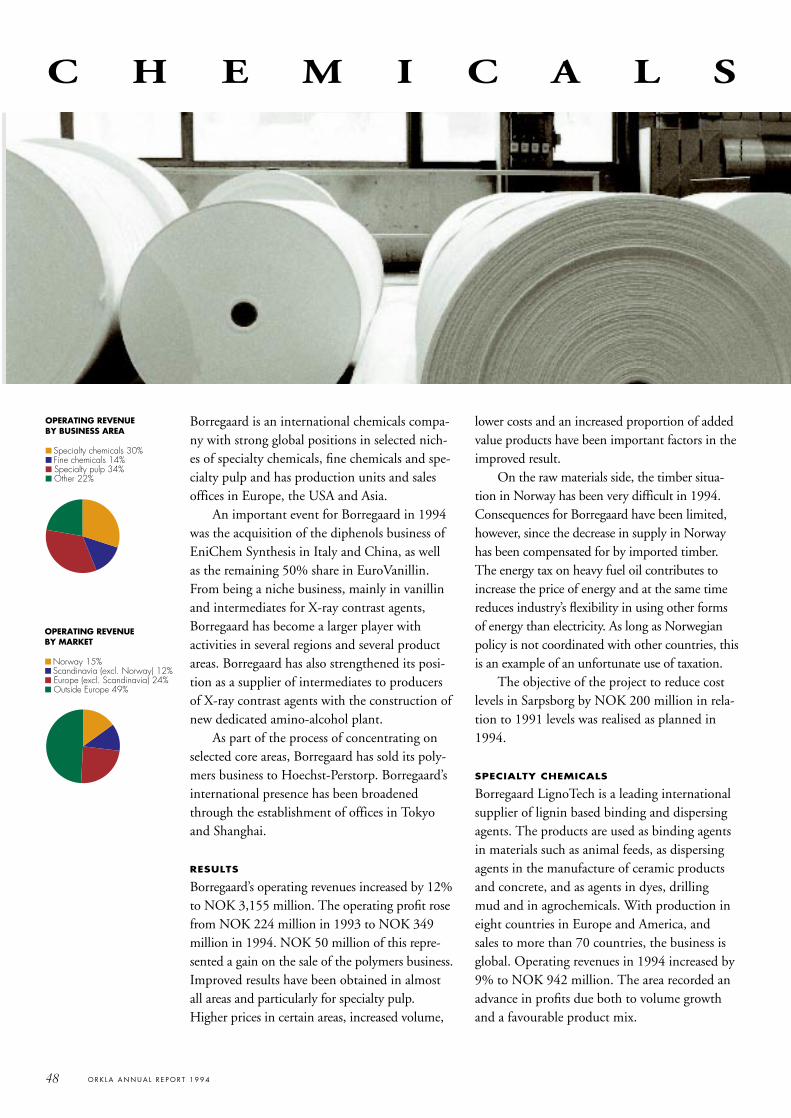
Borregaard is an international chemicals compa-ny with strong global positions in selected nich-es of specialty chemicals, fine chemicals and spe-cialty pulp and has production units and salesoffices in Europe, the USA and Asia.
An important event for Borregaard in 1994was the acquisition of the diphenols business ofEniChem Synthesis in Italy and China, as wellas the remaining 50% share in EuroVanillin.From being a niche business, mainly in vanillinand intermediates for X-ray contrast agents,Borregaard has become a larger player withactivities in several regions and several productareas. Borregaard has also strengthened its posi-tion as a supplier of intermediates to producersof X-ray contrast agents with the construction ofnew dedicated amino-alcohol plant.
As part of the process of concentrating onselected core areas, Borregaard has sold its poly-mers business to Hoechst-Perstorp. Borregaard’sinternational presence has been broadenedthrough the establishment of offices in Tokyoand Shanghai.
RESULTS
Borregaard’s operating revenues increased by 12%to NOK 3,155 million. The operating profit rosefrom NOK 224 million in 1993 to NOK 349million in 1994. NOK 50 million of this repre-sented a gain on the sale of the polymers business.Improved results have been obtained in almostall areas and particularly for specialty pulp.Higher prices in certain areas, increased volume,
lower costs and an increased proportion of addedvalue products have been important factors in theimproved result.
On the raw materials side, the timber situa-tion in Norway has been very difficult in 1994.Consequences for Borregaard have been limited,however, since the decrease in supply in Norwayhas been compensated for by imported timber.The energy tax on heavy fuel oil contributes toincrease the price of energy and at the same timereduces industry’s flexibility in using other formsof energy than electricity. As long as Norwegianpolicy is not coordinated with other countries, thisis an example of an unfortunate use of taxation.
The objective of the project to reduce costlevels in Sarpsborg by NOK 200 million in rela-tion to 1991 levels was realised as planned in1994.
SPECIALTY CHEMICALS
Borregaard LignoTech is a leading internationalsupplier of lignin based binding and dispersingagents. The products are used as binding agentsin materials such as animal feeds, as dispersingagents in the manufacture of ceramic productsand concrete, and as agents in dyes, drillingmud and in agrochemicals. With production ineight countries in Europe and America, andsales to more than 70 countries, the business isglobal. Operating revenues in 1994 increased by9% to NOK 942 million. The area recorded anadvance in profits due both to volume growthand a favourable product mix.
48 O R K L A A N N U A L R E P O R T 1 9 9 4
OPERATING REVENUE BY BUSINESS AREA
■ Specialty chemicals 30%■ Fine chemicals 14%■ Specialty pulp 34%■ Other 22%
OPERATING REVENUEBY MARKET
■ Norway 15%■ Scandinavia (excl. Norway) 12%■ Europe (excl. Scandinavia) 24%■ Outside Europe 49%
C H E M I C A L S

A new lignin plant outside Seattle in the USAwill be completed at the beginning of 1995.Products from this plant will cover markets inAsia, Latin and North America. The use of sev-eral production locations provides the businesswith marketing flexibility and better deliverycapacity.
Priority continues to be given to growth,both in product and market development andAsia will be an important area. Further invest-ments in product development will enable theproduct range based on other raw materialsthan lignin to be extended.
FINE CHEMICALS
The Fine Chemicals area consists of BorregaardFine Chemicals and Borregaard Synthesis.Operating revenues rose in 1994 by NOK 114million to NOK 438 million, of which newbusinesses represented NOK 52 million. In 1995 sales of at least NOK 800 million areexpected, mainly due to the full-year effectfrom new businesses.
Borregaard Fine Chemicals is a leadinginternational supplier of advanced fine chemi-cals to the pharmaceutical industry. The busi-ness is the market leader in intermediates fornon-ionic X-ray contrast agents. Operating rev-enues increased by 20% in relation to 1993. A new plant for the production of intermediatesfor X-ray contrast agents commenced operationtowards the end of 1994.
Borregaard Synthesis is a new business areawhich was established in November 1994 inconnection with the purchase of the diphenolbusiness from the Italian company EniChemSynthesis. The business includes the productionand processing of fine chemicals for the phar-maceutical industry and the food manufactur-ing industry, and the production of agro- andphotographic chemicals. The acquisitionincludes technology and two production plantsin Italy (Borregaard Italia), a 55% interest in aplant under construction China, and also thepurchase of EniChem’s 50% interest inEuroVanillin in Sarpsborg.
EuroVanillin is the world’s second largestvanillin producer and the only one able to offerboth lignin and guaiacol-based vanillin as well asethyl vanillin. Operating revenues rose in 1994by 40% to NOK 117 million. The improve-ment can be attributed both to volume growthresulting from new production capacity as wellas price increases. Growth is expected in themarket for both vanillin and ethyl vanillin. A separate sales organisation for EuroVanillinhas been established in Sarpsborg. Further pro-ductivity improvements are expected in 1995.
Borregaard Italia is the world’s second larg-est diphenol producer. The main markets areEurope, Asia and the USA. During 1995Borregaard will make efforts to optimise theproduct portfolio. Tai Cang BorregaardChemicals will produce an agrochemical for use in rice fields. The company represents an
49O R K L A A N N U A L R E P O R T 1 9 9 4
92 93 94
0
5
10
15
OPERATING MARGIN*
%
92 93 94
CASHFLOW FROM OPERATIONS
NOK mill.
6.08.0
11.1*
243336
403
* 9.6% excl. NOK 50 mill. gain onsale of the polymers business.

important element in Borregaard’s expansion in China and will provide a basis for furthergrowth in this market.
SPECIALTY PULP
Borregaard ChemCell is a leading supplier inEurope of specialty pulp for chemical applica-tions. The business focuses on applications ofthe cellulose molecule as a natural and biode-gradable polymer. In 1994 operation of the dis-charge treatment plants was further improved atthe same time as a biofuels plant for the burn-ing of bark and sludge was completed.
Operating revenues increased by 3% toNOK 1,059 million and the area improvedprofits in 1994. Prices for specialty pulp rosetowards the end of the year. The potential forprice increases for Borregaard’s qualities is nor-mally less than for standard paper pulp. Totalcosts were reduced despite higher timber prices.Particular focus is placed on specialisation,product quality, and the development of newapplications and products. 1995 is expected tobe a good year for Borregaard ChemCell due toa general improvement in the economic situa-tion internationally and particularly to positiveprospects for the pulp market.
OTHER AREAS
Borregaard is the Nordic region’s largest produc-er of industrial ethanol. Through Kemetyl AB,Borregaard has become Sweden’s largest supplierof industrial ethanol to the consumer and
industrial markets. The parameters regardingthe sale of ethanol to Sweden have changed sub-stantially since Norway voted against member-ship of the European Union and a customs dutyof close to 100% has been imposed on importsto the EU. The situation will not, however,affect earnings in 1995.
Chloralkali experienced a general decline insodium hydroxide prices at the beginning of theyear, but has since then seen a recovery whichwill continue in 1995. Chlorine prices haveincreased slightly but insufficient to outweigh the low hydroxide prices. The trading businessincreased its operating revenues by 16% to NOK69 million in 1994 due to higher volumes and afavourable change in the product mix.
Borregaard NEA recorded an improvementin profits due to strong markets and good prices.Mechanical pulp from Borregaard Vafos has aleading market position in the European pack-aging industry and paper from BorregaardHellefos has a strong position in the Europeanmarket for pocket book paper.
Borregaard’s total energy consumption in1994 was 1,861 GWh. The Group’s own hydro-electric power production totalled 666 GWh,and gross heat production from the sulphuricacid plant was equivalent to 509 GWh. TheGroup’s hydroelectric power production in anormal year is 655 GWh, of which 615 GWhis from waterfalls not subject to governmentalreversion. In addition, there is replacementpower of 45 GWh. As a result of the generally
50 O R K L A A N N U A L R E P O R T 1 9 9 4
0
100
200
300
400
500
92 93 94
mill. kr.
TOTAL INVESTMENTS
274 274
478
C H E M I C A L S
NOK mill.

high price for electric power during the year,832 GWh of heat was produced using oil, whilethe corresponding figure in 1993 was 361GWh. Power prices showed an increase duringthe year, which contributed to a strong improve-ment in results for Borregaard Energi.
The Group is one of Norway’s largest pri-vate forest owners, with approximately 110,000hectares, of which around 80,000 hectares isproductive forest. The annual logging quantityis around 120,000 sm3.
ENVIRONMENT
All Borregaard’s production units in Norwayand abroad comply with operating permits andobserve environmental restrictions. Borregaardadopts an open approach to all environmentalissues. A new plant for burning bark and organ-ic sludge from the treatment plants in Sarpsborghas been brought into operation.
In 1994 Borregaard joined the environmentalresponsibility programme (MIA) established bythe National Process Industry Association. Thisis the industry’s answer to the challenge set bythe international environmental conference inRio de Janeiro in 1992. The programme setsrequirements to improve health, environmentaland safety standards. Studies have been made ofworking environments and risk analyses pre-pared for the plants in Sarpsborg. During 1994Borregaard had no serious injuries at workwhich led to long periods of absence.
The running-in of the treatment plants hascontinued throughout 1994 and emissions oforganic material (COD) have been reduced by30% in relation to 1993. Det norske Veritas hasundertaken a life cycle analysis which shows thatBorregaard’s choice of process with lignin pro-cessing is more favourable to the atmosphericgas balance than a traditional pulp plant whichburns the lye.
51O R K L A A N N U A L R E P O R T 1 9 9 4
60
80
100
120
90 91 92 93 9489
PRICE DEVELOPMENTSPECIALTY PULP
(Index average 1989=100)
PRODUCTS AND APPLICATIONS
LIGNIN: Dispersing agents which regulate theproperties of water/powder mixtures,used in i.a. concrete additives, agricul-tural chemicals and dyes. Binding agents, used in i.a. animal feedpellets, coal and peat briquettes andglue additives.
FINE CHEMICALS: Intermediate products for the pharma-ceutical industry, and agrochemicals.
VANILLIN: Flavourings and fragrances, raw materialfor pharmaceutical products.
SULPHITE PULP: Rayon filament yarn and staple fibre, cellophane, thickening agents in foodproducts and cosmetics, detergent addi-tive, photo paper, chlorine free paperproducts and fluff.
ETHANOL: Car care products, paints and lacquers,cosmetics.
SULPHURIC ACID: Fertilisers, pigments.SODIUMHYDROXIDE: General chemical uses.CHLORINE: Water treatment chemicals, hydrochloric
acid, PVC.PAPER: Book paper.MECHANICAL PULP: Board, moulded products.TIMBER: Saw wood, pulp wood.ENERGY: Electricity and heat.
0
5
0
5
0
92 93 94
%
RETURN ON CAPITALEMPLOYED
11.2
14.2
19.3

The business area includes the Group’s equityand real estate investments. In addition, finan-cial services are provided, mainly in stockbrok-ing and corporate finance, through the OrklaFinans group.
MARKET CONDITIONS
1994 was a relatively poor year for internationalstock markets. Of the leading markets, onlyJapan gave a satisfactory return, while in Europethere were some substantial market declines.The background to the weak development canlargely be attributed to the rise in long-terminternational interest rate levels. The markets inNorway, Sweden and Finland enjoyed a relative-ly good development in prices, with rises of7.1%, 4.6% and 16.7% respectively.
Economic growth in the USA was high in1994, while at the same time the growth rate inWestern Europe and Japan increased. The FarEast economies have continued to experiencestrong growth, while in Eastern Europe itappears that economic activity is stabilising aftersubstantial falls in output for several years.
In 1994 there was a relatively strongincrease in raw materials prices, with the excep-tion of oil and gas. A slightly weaker oil pricedevelopment was compensated for, however, bygood growth in production on the Norwegiancontinental shelf and lower development costs.Increased raw materials prices combined withgenerally high demand for goods, both inNorway and internationally, means that
Norwegian companies as a whole experiencea good advance in profits. The rise in interestrates and the fall in the dollar exchange rate of9.7% during the year meant, however, that theperformance of the Oslo Stock Exchange wasrelatively moderate in 1994.
Uncertainty regarding the EU referendumaffected the market for a long time in 1994 but,in the short term, however, it appears that theoutcome has not had a significant impact on theNorwegian economy and financial markets.
There was a high level of new issue activityin the Norwegian market in 1994, particularlyin the first half-year. The supply of capital hasmainly come from foreign investors and thegovernment, primarily through Folketrygdfon-det. Financial savings in the Norwegian privatesector are currently at a high level. It is disturb-ing that the parameters for equity investments
52 O R K L A A N N U A L R E P O R T 1 9 9 4
0
2
4
6
8
10
12
82 83 84 85 86 87 88 89 90 91 92 93 94
GROWTH OF NOK 131.12.82 - 31.12.94
■ Orkla’s Financial Investments■ Oslo Stock Exchange■ Money Market
NOK
F I N A N C I A L I N V E S T M E N T S
MAIN SHARE HOLDINGS AT 31.12.94
Share of Share of Market valueportfolio (%) company (%) (NOK million)
Elkem 13.3 25.4 1,090
Dyno 11.1 18.3 907
UNI Storebrand 10.5 12.5 857
Kværner 8.6 5.0 704
Hafslund Nycomed 7.9 4.6 649
Bergesen d.y. 4.6 4.1 381
Smedvig 2.9 9.9 240
Nora Eiendom 2.7 24.2 221
Saga Petroleum 2.6 2.2 210

are such that only a small part of this saving isdirected to the equity market.
No major individual investments weremade by the Investment area during the year.Small investments were made in Smedvig, DnB,Nera and Schibsted, and overall there were netsales of Norwegian shares in 1994. The largestsales took place in Bergesen and HafslundNycomed, with the holding in Bergesen beingreduced from 7.1% to 4.1%, and the holdingin Hafslund Nycomed reduced from 6.5%to 4.6%.
Activity in foreign markets, especiallyScandinavia, rose in 1994. Foreign investmentsamounted to approximately 13% of the portfo-lio at the end of the year.
The portfolio of unlisted companies wasalso increased in 1994. Investments throughIndustrikapital increased following participationin a new fund. Otherwise NetCom is the largestsingle investment. Other new projects includeparticipation in Kone Cranes and a convertibleloan to Resource Group International.
Net purchases of shares and bonds totallingNOK 225 million were made in 1994. Thereturn on the whole portfolio was 9.5%, whichis 2.4 percentage points better than the rise inthe Oslo Stock Exchange All Share Index. Atthe end of the year the portfolio had a marketvalue of NOK 8,194 million.
RESULT
The Investment area recorded a book profitbefore tax of NOK 350 million in 1994 againstNOK 273 million in 1993. Portfolio gainstotalling NOK 418 million were realised, anddividends of NOK 130 million received.Unrealised gains on the portfolio rose by NOK190 million to NOK 2,663 million.
The Orkla Finans group recorded a profitbefore tax of NOK 39 million in 1994 againstNOK 50 million in 1993. The market positionwas strengthened through the takeover of SiriusSecurities, but there was a somewhat lower mar-gin on secondary trading in the stockmarketdue to slightly lower commission rates. OrklaFinans played an important role in arrangingseveral initial public offerings.
At the beginning of 1995 both theNorwegian and international economies weredeveloping positively and earnings prospects forthe main companies in the portfolio appeargood.
53O R K L A A N N U A L R E P O R T 1 9 9 4
0
3,000
6,000
9,000
82 83 84 85 86 87 88 89 90 91 92 93 94
MARKET VALUE ANDNET ASSET VALUE1982-1994
■ Net Asset Value■ Market Value
NOK mill.9,000
6,000
3,000
0

At the end of the 1980s an extensive restructur-ing of Borregaard’s activities was commenced.Concentration on specialty and fine chemicals,together with cost improvements, international-isation, environmental awareness and a profit-driven approach at all levels have brought thebusiness to its current position as a leading inter-national supplier of advanced chemical productsin selected niches. The chemicals business hasbecome more specialised, profitability hasimproved and cyclicality has been reduced.
Today Borregaard has production units in 10 countries, some 2,000 employees and expectedsales in 1995 of approximately NOK 3.5 billion.
RICH TRADITIONS
The name Borregaard has rich traditions. Thebusiness was founded as The Kellner PartingtonPaper Pulp Company Limited in 1889, based onBritish capital and Austrian technology. It waspurchased by Norwegian interests in 1918 andhas since then been called Borregaard.
For many years Borregaard was one of theworld’s leading manufacturers of pulp andpaper, with production in several countries andsales around the globe. During the period afterthe Second World War, production was gradual-ly expanded to include various chemical prod-ucts, mainly with by-products from pulp pro-duction as the raw material. However, growth inthe original wood-processing business came toan end and the company disposed of its interna-tional production units.
This was the situation when Orkla Industrierand Borregaard merged in 1986. Shortly there-after, work began on strengthening Borregaard’smanagement and organisation and focusingbusiness development towards chemicals.
UNIQUE BASIS
Borregaard’s chemicals business goes back to1938 when production of ethanol began, usingsugar compounds in by-products from the pulpproduction. The same by-products were thebasis for the production of vanillin, whichbegan in 1962 and lignin products which beganin 1967. Fine chemicals production, whichcommenced in the early 1980s is not based,however, on raw materials from pulp produc-tion, but involves advanced application of spe-cialised chemicals know-how. Production andprocessing of chemical sulphite pulp is alsolargely founded on chemicals expertise. Pulpqualities have gradually become more special-ised and are sold increasingly to customers whouse them in other chemical production.
The total chemicals expertise and marketknow-how which has been built up in the com-pany provides the strength to be able to winleading global positions in niches of specialtyand fine chemicals. This was the backgroundfor the decision to concentrate the business onselected chemicals sectors.
Based on the new strategy, the organisationwas restructured, the management strengthenedand major investments made in environmental
54 O R K L A A N N U A L R E P O R T 1 9 9 4
0
500
1,000
1,500
2,000
2,500
3,000
90 91 92 93 940%
5%
10%
15%
20%
25%
30%
FINANCIAL DEVELOPMENT
■ Operating revenue (NOK mill.)■ Return on capital employed (%)
BORREGAARD - ORKLA'S CHEMICALS BUSINESS
T H E M E A R T I C L E B Y T H E G R O U P M A N A G E M E N T
3,000
2,500
2,000
1,500
1,000
500
0

and production facilities at the main plant com-plex in Sarpsborg. Simultaneously Borregaarddeveloped its global positions in the chosen coreareas through acquisition of a number of smallcompanies in Europe and the USA.
BORREGAARD TODAY
In line with its business concept Borregaardtoday is a chemicals company with strong globalpositions in selected niches of organic chemicalsand speciality pulp.
The main goal for Borregaard’s core busi-nesses is to increase added value further bydeveloping more specialist niche products whichmeet the requirements and needs of customersand which are thus less exposed to price compe-tition. This strengthens loyalty amongst estab-lished customers, and at the same time creates a good basis for cooperation and alliances withnew customers and with companies operating inassociated areas.
SPECIALTY CHEMICALS
Specialty chemicals sell on their performance -the benefits they provide to the customer. Thecore of Borregaard’s specialty chemicals businessis the production of a broad range of bindingand dispersing agents based on lignin. Ligninproducts are made through the chemical andother modification of by-products from the production of sulphite and, for certain qualities,sulphate pulp. Market-oriented research anddevelopment efforts and the expansion of sales
to new geographic areas has made it possiblesteadily to increase the proportion of specialisedproducts, with a positive impact on profits.The specialities are mainly found in dispersingagents. These are important materials in a num-ber of industrial sectors since they regulate theviscosity of water/powder combinations, suchas, for example, concrete, oil drilling mud, dyes,plasterboard and agrochemicals. As an example,the addition of small quantities of special ligninin concrete mixes provides stronger concretewhich uses less cement and provides a smoothercast - which improves quality and reduces costs.Based on close, long-term cooperation with cus-tomers, new dispersing agents are tailor-madefor specific functions. Lignin products are alsoeasily biologically degraded, and thus haveadvantages in relation to competing chemicals.
With annual production of approximately400,000 tonnes and some 450 employees,Borregaard is the leading international companyin this business area. The lignin business isorganised under the name BorregaardLignoTech and has 11 plants in eight countries.The latest addition on the production side is anew NOK 100 million plant outside Seattle inthe USA. Products are sold in 70 countriesthroughout the world and turnover is expectedto exceed NOK 1 billion in 1995. Raw materi-als for the plants are obtained from various pulpproducers for whom these by-products oftenhave limited alternative uses. The internationalbusiness system is thus flexible on the raw mate-
55O R K L A A N N U A L R E P O R T 1 9 9 4
0
100
200
300
400
90 91 92 93 9440
60
80
100
120
REDUCED CYCLICALDEPENDENCE
■ Operating result (NOK mill.)■ NBSK price (Index 1990=100)

rials side and raw materials are priced relativelyindependently of traditional cost factors inwood processing plants. The advantage of dif-ferent lignin plants is utilised in the productionof various specialty products. Together withBorregaard LignoTech’s group research anddevelopment resources, this provides an interna-tional business system with many strengths.Priority continues to be given to growth - boththrough acquisitions and through maintainingand strengthening market and product develop-ment. In addition to Europe and the USA, theAsian markets are growing rapidly. BorregaardLignoTech is also considering expanding itsproduct range through the gradual use of otherraw materials than lignin.
FINE CHEMICALS
While specialty chemical products sell on perfor-mance, the main characteristic of fine chemicalsis that they are specific, defined chemical sub-stances. Borregaard’s fine chemicals businessincludes pharmaceutical intermediates, vanillinand diphenols. The latter are used, among otherthings, for photo- and agrochemicals. Customersoften use fine chemicals in combination withother chemicals and are thus dependent on pre-cise specifications being met without deviations.The international fine chemicals industry is animportant market for Borregaard’s fine chemicals.Using sophisticated technology for advancedorganic synthesis and based on particularstrengths in upscaling, process development,
quality assurance and control, Borregaard is theleading supplier in the market for chemical inter-mediates used to produce non-ionic X-ray con-trast agents. Intermediates are often advancedchemical formulae which have been developed incooperation with international pharmaceuticalmanufacturers and several of them are backed byconsiderable R&D effort by Borregaard.
For a number of years Borregaard has pro-duced vanillin from lignin raw materials. Thebusiness was considerably strengthened throughthe acquisition of EniChem Synthesis’ diphe-nols business in the autumn of 1994. The pur-chase included EniChem’s interest inEuroVanillin - which Borregaard thus owns100% - as well as a fine chemicals business withstrategic raw materials, process technology andproduction at plants in Ravenna and Madone inItaly. In addition, it included a joint venturewhich has been established with the Chineseauthorities for the production of agrochemicalsin China - cooperation which in Borregaard’sview will provide a basis for future developmentin the Chinese market.
Through EuroVanillin, Borregaard is thesecond largest producer of vanillin in the worldand the only supplier offering a full range ofvanillin varieties. The vanillin business will toan increasing extent be supplemented by otherfine chemicals, including those based on chemi-cal raw materials from the businesses in Italy.
The total fine chemicals business will reachsales of some NOK 800 million in 1995. This
56 O R K L A A N N U A L R E P O R T 1 9 9 4
BORREGAARD - ORKLA'S CHEMICALS BUSINESS

provides Borregaard with a strong position in themarket for both aroma chemicals and pharma-ceutical fine chemicals. The area will also growthrough the development of new products basedon linking raw materials, technology researchand product development capacity in the variousparts of Borregaard’s fine chemicals environment.
SPECIALTY PULP
Borregaard’s pulp sector has a capacity of some160,000 tonnes and each year uses over900,000 sm3 of fresh and dried spruce as a rawmaterial. In recent years the operations havebecome increasingly specialised. Borregaard’schemicals expertise has been used to shift thebusiness almost entirely towards products with a high process value and properties which make
them particularly suited to chemical industrialapplications. This development has meant thatthe business has become less cyclical and thequality of underlying earnings has improved.Borregaard is today the leading European sup-plier of specialty pulp for chemical applicationsbased on natural polymers and is in the fore-front in combining customer-oriented productdevelopment and environmentally friendlyproducts.
The goal is to be the world’s leading partnerin highly processed specialty pulp.
Further efforts will be made to increase thelevel of specialisation through, among otherthings, further cooperation with the specialtyand fine chemicals business.
57O R K L A A N N U A L R E P O R T 1 9 9 4
BORREGAARD
SPECIALTYCHEMICALS
OTHER ACTIVITIES
SPECIALTYPULP
FINECHEMICALS
BorregaardLignoTech
BorregaardFine Chemicals
BorregaardSynthesis
BorregaardChemCell
Kemetyl AB
Chloralkali
Trading
Energy
Forests
NEA

POLICY
Orkla's industrial activities include the produc-tion and sale of a broad range of branded goodsand chemicals and chemical-related products. In recognition of the fact that Orkla's operationsand products affect the environment, the Grouphas established the following policies which gov-ern all our activities:• We endeavour to maintain the highest pos-
sible quality in our work on all environmentalissues.
• We regard our ability to respond to environ-mental challenges as a key factor in business success.
• The principle "from cradle to grave" should serve as a guide for all our businesses.
• We adopt an open and proper approach in our work on the environment and endea-vour to maintain a good dialogue with the authorities, environmental organisations and the public.
• The environment is a line responsibility in our organisation.
• We will require our suppliers and allthose acting on ourbehalf to adopt thesame principles.
Orkla is a memberof the World BusinessCouncil ForSustainableDevelopment and hassigned its charter.
GENERAL
Orkla endeavours to use its know-how to makeits products more suitable for consumers byreducing, as far as possible, the burden on theenvironment during their lifecycle. More effec-tive use of energy, raw materials and packaging,cleaner processes, more environmentally suitableend-products, lower emissions and less wasteand more recycling and reuse are key elementsin daily environmental work.
This work is taking place throughout thewhole Group, but this article focuses on exam-ples from Orkla Brands and the Chemicals area.
ENVIRONMENTAL IMPROVEMENT
OF PRODUCTS
Denofa-Lilleborg, which produces detergentsand personal products, introduced the deter-gent Blenda in a phosphate-free formula in1988 and in 1990 was the first market leaderin Europe with a range entirely free of phos-phates. The company was also in the forefrontwith its launch in 1991 of Sun dishwasher
detergent using a non-corrosiveformula.
The company's first micropowders were launched in1990 and contain 35% lesschemicals than standard pow-ders. Subsequently, liquidfabric detergents have beenlaunched in micro formula-tions. In 1994 micro prod-
58 O R K L A A N N U A L R E P O R T 1 9 9 4
E N V I R O N M E N T
R E P O R T B Y T H E G R O U P M A N A G E M E N T
The micro detergent powderscontain 35% less chemicalsthan standard powders. In 1994 they accounted formore than 50% of total salesof fabric detergents.

ucts accounted for more than 50% of totalsales of fabric detergents.
A number of new micro products, includ-ing JIF Micro and several micro varieties ofComfort, were introduced on the market lastyear. Blenda Sensitive was also launched in1994. This is a micro powder free of perfumesand dyes and is recommended by theNorwegian Asthma and Allergic Association.
In 1994, Lilleborg's industrial detergentsdivision also introduced micro-products forwashing fabrics and milk production equipmentwhich further reduce the use of chemicals.
OMO Color was the first household prod-uct in Norway to receive the official Nordicenvironmental award, the Swan mark, in 1993.Since then all varieties of OMO Micro powderand all Blenda micro varieties have received theSwan mark.
In the near future standards will be pub-lished on Swan marking of washing-up liquidsand cleaning detergents. One of the company'sgoals is to adapt its products in these areas sothat they can carry the Swan mark. Researchshows that most consumers prefer Swan markedproducts.
PACKAGING
Efforts to develop the most environmentallysuitable packaging are given priority in all prod-uct areas.
It is important to ensure that packaging is assmall and light as possible. Denofa-Lilleborg has
attacked this problem from several angles - firstlyby changing the product which is to be packed,as has been done with the transition to microproducts. In the case of fabric softeners, the tran-sition to micro varieties has reduced the need fortransport capacity to one fifth. In addition, workhas been carried out to make packaging of prod-ucts lighter. In 1994 the personal products divi-sion reduced its annual consumption of corru-gated board by 70 tonnes by moving away fromtraditional transport packing.
Increased use of refill packs,which take less space and pro-duce less waste, makes it pos-sible to use the original contain-er several times. During 1994 itwas decided to entirely end sales oforiginal packing for detergents, sothat OMO's and Blenda's varieties ofliquid detergents and micro powders arenow sold exclusively in refill packs. Use ofrecycled packaging material also means great-er reuse. In the detergents area 100% recycledmaterial is now used in transport packing. The percentage in refill bags is 80-90% and inbottles 25%.
It is perhaps worth pointing out that thequestion of introducing packaging duties shouldbe carefully evaluated in the light of the abovefactors. If without careful consideration a dutysystem is introduced under which each packag-ing unit is subject to the same duty amount,there is a danger of conflict with the continuing
59O R K L A A N N U A L R E P O R T 1 9 9 4
The shift to micro fabricdetergents, both liquid andpowder varieties, hastogether with the use ofrefill packs contributed to asubstantial decrease in theconsumption of packagingmaterial.

trend towards increasingly smaller, lighter and more environmentally friendly packagingsolutions.
IMPROVED PROCESSES
AND REDUCED DISCHARGES
Process improvements and continued reduc-tions in emissions are important in all partsof the Group's industrial business. In theChemicals area this type of measureis particularly important. Most ofthe Group's chemical activities areassociated with Borregaard's plantcomplex in Sarpsborg where, amongother things, by-products from theproduction of specialty pulp areutilised as raw materials in the man-ufacture of a range of differentproducts. Det Norske Veritas hasbeen commissioned to evaluate thisstrategy in relation to traditional pulp produc-tion, where by-products are seen only as anenergy source and burnt. A lifecycle study hasbeen carried out which has focused in particularon total emissions under the two processes,including customers' emissions of carbon diox-ide. The conclusion is that Borregaard's process-ing strategy is overall more favourable in termsof atmospheric pollution.
Discharges of dissolved organic material towater, measured as chemical oxygen demand(COD) were reduced by 30% in relation to1993. Emissions are in line with the authorities'
requirements. The biological treatment plantand the recently built bio-fuel boiler plant forbark and sludge are important measures toreduce emissions. Further optimisation of theseplants will permit a further reduction in emis-sions. Part of the biological treatment processinvolves converting bio-sludge to biogas in an
anaerobic environment. This process stage isa pioneering project and it has proved pos-
sible to reduce the quantity of sludgeby as much as 70%. The remainingsludge is burnt together with bark.The biogas is also burnt, replacingpurchased propane. The biologicaltreatment plant has also had a positiveeffect on emissions of fibre and chloro-organic material, with reductions of38% and 24% respectively from 1993levels. Increased biogas production,
together with a number of smaller pro-cess improvements, has provided savings in heatenergy corresponding to approximately 3,000tonnes of oil per year in 1994. In addition, thebio-fuels boiler plant provides heat energy corre-sponding to 6,000 tonnes of fuel oil per year.
Emissions of mercury to the atmosphere andwater from the chloralkali plant in Sarpsborg areconsiderably lower than the authorities' require-ments and in line with the best plants in Europe.
In addition to continuous monitoring ofprocess emissions, regular measurements of sul-phur dioxide concentrations are made at severallocations in Sarpsborg. Measurements show levels
60 O R K L A A N N U A L R E P O R T 1 9 9 4
0
25
50
75
100
80 81 82 83 84 85 86 87 88 89 90 91 92 93 94
EMISSION OF SULPHURDIOXIDE
Index (1980=100)
0
25
50
75
100
80 81 82 83 84 85 86 87 88 89 90 91 92 93 94
DISCHARGE OF ORGANIC MATERIAL (COD) TO WATER
Index (1980=100)
E N V I R O N M E N T
In developing SwedishKemetyl’s new N-series com-prising nine car maintenanceproducts, particular emphasishas been placed on combiningenvironmental suitability and effectiveness. The N-products is the firstseries of car maintenanceproducts in Sweden to receivethe official Nordic environ-mental award, the Swanmark.

between 20% and 32% of the limits the author-ities have set, and even in the plant area itself thelevel is only 55% of the permitted maximum.
The paper plant owned by BorregaardHellefos in Hokksund, outside Drammen,reduced fibre emissions in 1994 by 50% follow-ing the installation of a fibre treatment plant.The new emission level is well below theauthorities' requirement.
REDUCTION OF HEAVY METAL DISCHARGES
AT LØKKEN
Since mining at Løkken Gruber was closed in1987, considerable attention has beenfocused on the run-off of heavy metals fromthe old mines and spoil tips. An extensiveand thorough evaluation of various pos-sible measures to deal with this pollu-tion has led to a solution whichinvolves using the old mines as “natu-ral” treatment plants. Run-off fromthe area is pumped back into the oldmine galleries where natural filtrationtakes place. The environmental solu-tions at Løkken has attracted consid-erable interest and has now been inoperation for more than two years.In 1994 the Norwegian PollutionControl Authority approved thesystem based on, among other things,a maximum value of copper in theOrkla river of 10-12 microgrammesper litre of water. In 1994 the average
concentration was 7-8 micro-grammes and spawning salmon wereobserved for the first time in recent his-tory immediately down stream of Løkken.
HEALTH, WORKING ENVIRONMENT
AND SAFETY
The Group's efforts in terms of health, workingenvironment and safety have been furtherincreased in 1994 and have contributed to a posi-tive development.
The number of injuries in relation to hoursworked continues to fall. Sick leave was some-
what lower than the previous year.During 1994 standby organisations have
been established in the Group companiesfor handling accidents and emergencies.
Exercises and maintenance of theseprogrammes will contribute to ensur-ing that safety work in the Group isgiven the necessary priority. Duringthe year several companies havereceived ISO certification.
61O R K L A A N N U A L R E P O R T 1 9 9 4
4
5
6
7%
92 93 94
DEVELOPMENT IN SICK LEAVE
0
25
50
75
100
80 81 82 83 84 85 86 87 88 89 90 91 92 93 94
DISCHARGE OFCHLORO-ORGANICCOMPOUNDS (AOX) TO WATER
Index (1980=100)
6.46.0
5.7
SolidoxDuring 1994 Denofa-Lilleborg stopped sell-ing toothpaste with cardboard packaging,which has given substantial savings in pack-aging material.
KrystalDenofa-Lilleborg has entered a cooperationwith the World Wildlife Fund (WWF) forKrystal soft-soap. Since Krystal is a genuinenatural product, Krystal has received theWWF Panda bear on its containers andDenofa-Lilleborg supports WWF’s work.
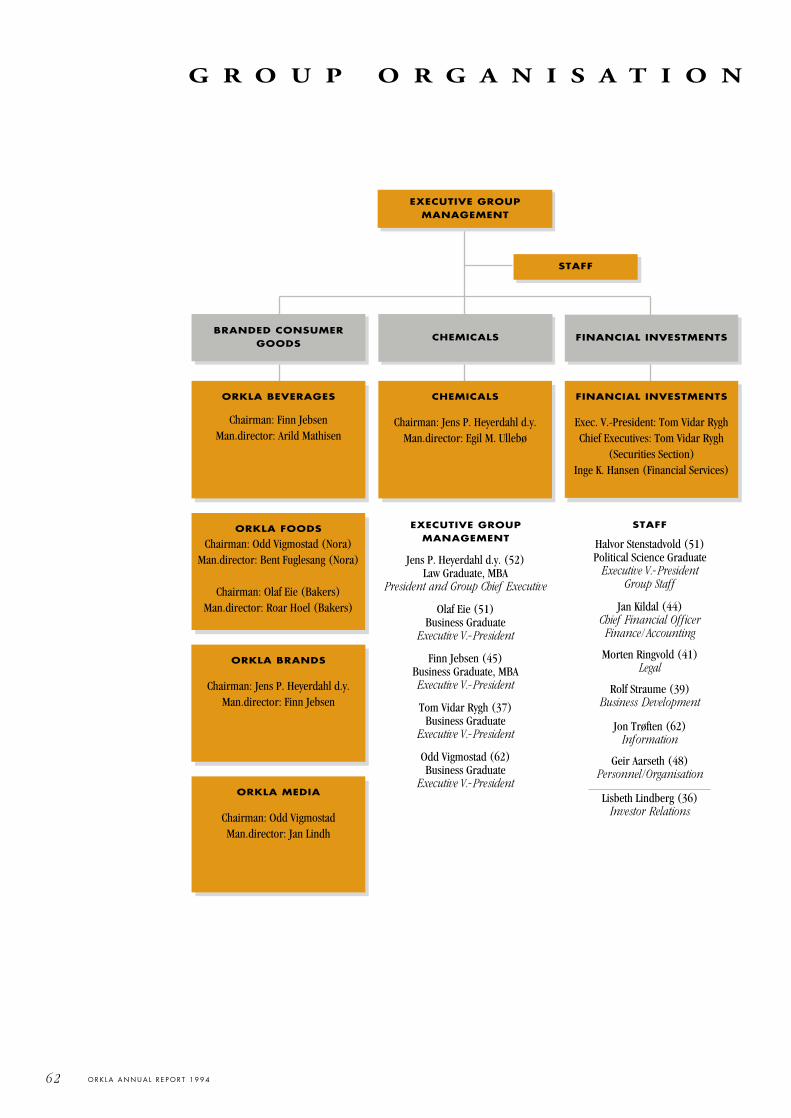
62 O R K L A A N N U A L R E P O R T 1 9 9 4
G R O U P O R G A N I S A T I O N
EXECUTIVE GROUP MANAGEMENT
STAFF
BRANDED CONSUMERGOODS
CHEMICALS FINANCIAL INVESTMENTS
ORKLA FOODS
Chairman: Odd Vigmostad (Nora)Man.director: Bent Fuglesang (Nora)
Chairman: Olaf Eie (Bakers)Man.director: Roar Hoel (Bakers)
ORKLA MEDIA
Chairman: Odd VigmostadMan.director: Jan Lindh
CHEMICALS
Chairman: Jens P. Heyerdahl d.y.Man.director: Egil M. Ullebø
ORKLA BEVERAGES
Chairman: Finn JebsenMan.director: Arild Mathisen
FINANCIAL INVESTMENTS
Exec. V.-President: Tom Vidar RyghChief Executives: Tom Vidar Rygh
(Securities Section)Inge K. Hansen (Financial Services)
STAFFEXECUTIVE GROUP MANAGEMENT
Jens P. Heyerdahl d.y. (52)Law Graduate, MBA
President and Group Chief Executive
Olaf Eie (51)Business Graduate
Executive V.-President
Finn Jebsen (45)Business Graduate, MBAExecutive V.-President
Tom Vidar Rygh (37)Business Graduate
Executive V.-President
Odd Vigmostad (62)Business Graduate
Executive V.-President
Halvor Stenstadvold (51)Political Science Graduate
Executive V.-PresidentGroup Staff
Jan Kildal (44)Chief Financial OfficerFinance/Accounting
Morten Ringvold (41)Legal
Rolf Straume (39)Business Development
Jon Trøften (62)Information
Geir Aarseth (48)Personnel/Organisation
Lisbeth Lindberg (36)Investor Relations
ORKLA BRANDS
Chairman: Jens P. Heyerdahl d.y.Man.director: Finn Jebsen

63O R K L A A N N U A L R E P O R T 1 9 9 4
R E P R E S E N T A T I V E S
CORPORATEASSEMBLY
Elected by the shareholders
Øystein Eskeland (220)chairman
Lucy Smith (436) deputy chairman
Svein Erik Amundsen (83)
Ebbe C. Astrup (37,078)
Westye Egeberg (506)
Svein R. Hagen (0)
Ragnar Halvorsen (1,445)
Chr. Haneborg (2,592)
Hans Herman Horn (1,300)
Synnøve Liaaen Jensen (38)
Leif Kjær (4,582)
Borger A. Lenth (265)
Tore Lindholt (0)
Leiv L. Nergaard (0)
Oddbjørn Oddaker (18)
Egil Offenberg (416)
Inger E. Prebensen (0)
Anders Ringnes (4,408)
Cathrine Mellbye Schultz (2,427)
Tore Steen (1,597)
Halvor Svenkerud (773)
Halgrim Thon (4,355)
David Vikøren (150)
Stein Wessel-Aas (0)
Deputies
Egil Alnæs jr.
Bjørn R. Berntsen
Thor Falkanger
Eilif Holte
Truls Nyquist
Mari Pran
Fabian Stang
Elisabeth Wille
Election commitee
Øystein Eskeland (220)
Tore Lindholt (0)
Svein R. Hagen (0)
Elected by the employees
Louis Belaska (0)
Jon-Ivar Fjeld (0)
Thorhild Fredly (0)
Anne Margrethe Grimsvang(0)
Britt-Karin Gundersen (0)
Bjørn Haraldsen (4)
Bjørn Johansen (0)
Harald Johansen (78)
Hans Johnsen (0)
Kristin Kvikstad (0)
Sverre Olsen (0)
Jan Rønning (0)
Deputies
Asbjørn Bråtekas
Anders Døvik
Bjørn Tore Eriksen
Odd Hansen
Randi Hansen
Steinar Johansen
Ann-Karin Karlsen
Anne-May Kristiansen
Tore H. Larsen
Gunn Liabø
Arvid Liland
Jan Lillebo
Trine Mæland
The next election of mem-bers to the CorporateAssembly will take place in1995 for members electedby the shareholders and in1996 for members electedby the employees.
THE BOARD OFDIRECTORS
Svein Ribe-Anderssen (159)chairman
Odd Gleditsch jr. (100)
Jens P. Heyerdahl d.y.(135,827)
Truls Holthe (6,149)
Roger Johansen *(18)
Kjell Kjønigsen* (5)
Knut Leversby (5)
Jørgen B. Lysholm (61,728)
Harald Norvik (11)
Stein Stugu* (0)
Board observer elected bythe employees
Egil Friberg (8)
Deputy board members elected by the employees
Liv Brynhildsvoll (0)
Håkon Olav Edgren (0)
Terje Vidar Hansen (0)
Vilhelm Johannesen (4)
Jan A. Jørgensen (30)
Jan Cato Landsverk (0)
Arvid Strand (0)
Torbjørn Wold (0)
Figures in brackets indicatethe number of shares ownedat 31.12.1994, includingshares owned by spouseand dependent minors.
AUDITOR
Arthur Andersen & Co.Finn Berg JacobsenState Authorized PublicAccountant
* Elected by the employees
Active participation by the employees in the governing bodies both atGroup level and in the individual subsidiaries are important elements inthe decision making processes at Orkla. A common aim has been toevolve representational schemes which adequately secure a broad basefor involvement and genuine influence.
The employees elect three of Orkla's 10 Board members and oneobserver. 12 of the Corporate Assembly's 36 members are elected bythe Group's employees.
On a Group basis, the employees have two Committees ofRepresentatives - for those belonging to unions which are members ofLO and of other employee organisations, respectively, both with their
own executive committees. The arrangement ensures a broad represen-tation for the Group's employees, both by company and organisation.The executive committees of the Committees of Representatives haveregulary meetings with the Group's management on issues relevant tothe Group.
In addition to the Group schemes mentioned here, the employeeshave representatives on the boards of directors of the individual subsi-diaries.
The summaries show the members of the governing bodies atGroup level as at January 1995.
INDUSTRIAL DEMOCRACY AT ORKLA
THE COMMITTEE OFREPRESENTATIVESFOR UNIONIZEDMEMBERS OF LO* )
Executive committee
Stein Stugu chairman
Egil Fribergdeputy chairman
Bjørn Johansentreasurer
Aage Andersensecretary
Gunn Liabøcommittee member
Bjørn K. Tonningcommittee member
Arve Schevikcommittee member
Ann-Karin Karlsen1st deputy
Terje V. Hansen2nd deputy
Harald Johansen3rd deputy
Committee of representatives
Jostein Aukland
Egil Friberg
Leif Erling Danielsen
Erik Hansen
Inge Hansen
Odd Hansen
Per Arvid Hansen
Randi Hansen
Roald Hansen
Terje V. Hansen
Torstein Hårsaker
Bjørn Johansen
Harald Johansen
Kjell Johansen
Kjell Henning Johansen
Jan A. Jørgensen
Kjell Kjønigsen
Tore H. Larsen
Gunn Liabø
Mariann Olsen
Arne Panengstuen
Svein Rannekleiv
Inge Rønneberg
Arne Rønning
Arve O. Schevik
Stein Stugu
Per Gunnar Støa
Berit Sundsby
Bjørn K. Tonning
Terje Tveter
Roger Vangen
Tove Vig
John Egil Øygard
COMMITTEE OFREPRESENTATIVESFOR MEMBERS OFOTHER EMPLOYEEORGANISATIONS
Executive committee
Roger Johansen chairman
Arvid Stranddeputy chairman
Irene Torstensonsecretary
Anne Margrethe Grimsvangtreasurer
Morten Brennemocommittee member
Arild Bolstadcommittee member
Jon Cato Landsverkdeputy
Tom Stokstad deputy
Committee of representatives
Grete Asprem
Bjørn Hansen
Berit Eriksen
Kjell M. Halvorsen
Fredrik Schreier
Arild R. Ingebretsen
Kristin Kvikstad
Jon Cato Landsverk
Trine Torp Larsen
Terje Nygaard
Arvid Liland
Svein Erik Pedersen
Bjørn Sollien
Kjetil Scawland
Tom Stokstad
Morten Sørensen
Øyvind Johansen
Øystein Ustumo
Sigurd Vik
Tor Wangen
Anne Lise Brevik
Reidar Aaserød
* ) The Norwegian Federation of Trade Unions
64 O R K L A A N N U A L R E P O R T 1 9 9 4
G R O U P D I R E C T O R Y
THE PARENTCOMPANY
Orkla A.SP.O.Box 308 N-1324 LysakerTel. +47 22 50 10 80Telefax +47 22 50 16 91
Orkla A.SP.O.Box 162 N-1701 SarpsborgTel. +47 69 11 80 00Telefax +47 69 11 87 70
Orkla A.SP.O.Box 8N-7332 Løkken VerkTel. +47 72 49 67 00Telefax +47 72 49 63 20
The registered office is inSarpsborg. The GroupManagement is located atLysaker.
Representation in SingaporeOrkla A.S400 Orchard Road# 10-04 Orchard TowersSingapore 0923Tel. 095 65 737 08 37Telefax 095 65 737 89 96
BRANDED CON-SUMER GOODS
ORKLA BEVERAGES
Ringnes a.sP.O.Box 7152 H N-0307 OsloTel. +47 22 06 95 00Telefax +47 22 06 97 70
Ringnes Bryggeri, Oslo
Ringnes FrydenlundsBryggeri, Oslo
Ringnes GjelleråsenNittedal
Ringnes Arendals Bryggeri a.s, Arendal
Ringnes E.C. Dahls Bryggeri a.s, Trondheim
Ringnes Nordlands-bryggeriet, Bodø
Ringnes Tou Bryggeri a.s, Forus
Ringnes Farris, Larvik
Ringnes Imsdalen, Koppang
Warszawa Coca-ColaBottlers Ltd.Warsaw, Poland
Bydgoszcz Coca-ColaBottlers Ltd.Bydgoszcz, Poland
Lublin Coca-Cola Bottlers Ltd., Lublin, Poland
ORKLA FOODS
Nora A.SP.O.Box 711N-1411 KolbotnTel. +47 66 81 61 00Telefax +47 66 80 63 78
Stabburet WholesaleProducts
Stabburet A/S, Kolbotn
Stabburet A/S, Fredrikstad
Stabburet A/S, Gressvik
Stabburet A/S, Brumunddal
Stabburet A/S, Rygge
Stabburet A/S, Ualand
Stabburet A/S, Vigrestad
Stabburet A/S Division Idun Rygge, Rygge
Stabburet A/S Gimsøy Kloster, Skien
BOB Industrier
BOB Industrier ABKumla, Sweden
Stabburet Fresh Products
Stabburet A/S, Kolbotn
Stabburet A/S, Brumunddal
Stabburet A/S, Stranda
Stabburet A/S,Smaks Salater, Olsvik
Odense Marcipan
Odense Marcipan A/SOdense C, Denmark
Industry Division
Idun Industri A.S, Oslo
Sunda A.S, Oslo
Dragsbæk Margarine-fabrik A/S, ThistedDenmark
Dacapo, Randers Salat &Løg A/S, Randers, Denmark
Margarinfabriken Blume I/SRanders, Denmark
Kjarnavôrur HFHafnarfjördur, Iceland
Regal Mølle a.sDivision Bjølsen ValsemølleOsloDivision ChristianssandsMøller, Kristiansand SDivision Moss AktiemøllerMossDivision Tou Mølle, Tau
Bakery Products
Bakers ASP.O.Box 43 Økern N-0508 OsloTel. +47 22 72 35 35Telefax +47 22 65 82 12
Bakers Økern AS, Oslo
Bakers Bærum AS, Rud
Bakers AS, Avd. Hansen &Næss, Larvik
Bakers AS, Avd. BagerPedersen, Arendal
Bakers Heba, Brumunddal
Ekco Møllhausen BakerierAS, Kløfta
Bakers Bryne AS, Bryne
Bakers Martens AS, Kokstad
Kvalitetsbakeren A/SNesttun
Bakers Trøndelag ASTrondheim
ORKLA BRANDS
A/S Denofa og Lilleborg FabrikerP.O.Box 4236 TorshovN-0401 OsloTel. +47 22 89 50 00Telefax +47 22 15 74 89
A/S Denofa og LilleborgFabriker, Fredrikstad
Lilleborgs Avdeling forStorforbrukere, Ski
A/S Ello, Kristiansund N
Elico, Oslo
Fredrikstad Blikk & Metallvarefabrikk A.SFredrikstad
Vestlandske BakeriartiklerKokstad
Otarès Norge A/SSandvika
Division Bergen: Meling & Co. , Bergen
Division RenimexKristiansand
La Mote AS, Oslo
Peter Möller, Oslo
Sætre ASP.O.Box 4272 TorshovN-0401 OsloTel. +47 22 89 25 00Telefax +47 22 89 50 93
Sætre ASN-1410 KolbotnTel. +47 22 89 25 00Telefax +47 66 80 26 07
Esskå, division of Sætre ASSagstua
KIMs A/S Sømarksvej 31-35DK-5471SøndersøDenmarkTel. 095 45 6389 1212Telefax 095 45 6489 3120
KIMs, Skien, division ofSætre AS
KIMs, Skreia, division ofSætre AS
Göteborgs Kex ABP.O.Box 73, S-442 21Kungälv, SwedenTel. 095 46 303 20 90 00Telefax 095 46 303 209 050
Kantolan OY Hämeenlinna, Finland
Nidar ASN-7005 TrondheimTel. +47 73 58 30 00Telefax +47 73 91 28 78
Needlers plc, Hull, England
Wiversales B.V., OosterhoutThe Netherlands
Wiversales Belgium B.V.B.A.Wuustwezel, Belgium
ORKLA MEDIA
Orkla Media A.SP.O.Box 250N-1324 LysakerTel. +47 22 50 10 80Telefax +47 22 50 95 94
Newspapers
Orkla Communication A.SP.O.Box 250N-1324 LysakerTel. +47 22 50 10 80Telefax +47 22 50 95 94
Moss Avis A/S, Moss
A/S Fredriksstad BladFredrikstad
A/S Varden, Skien
A/S Gjengangeren, Horten
A/S Sandefjords Blad ogTrykkeri, Sandefjord
Tønsbergs Aktietrykkeri (Tønsbergs Blad), Tønsberg
Drammens Tidende &Buskeruds Blad A/SDrammen
A/S LaagendalspostenKongsberg
Telen A/S, Notodden
Røyken og Hurums Avis A/SSlemmestad
Telemark Trykk A.SNotodden
A/S Buskerud DistribusjonDrammen
Sunnmørsposten AS, Ålesund
Sunnmøringen A.S, Stranda
Fjordenes Tidende, Måløy
A/S Haugesunds AvisHaugesund
A/S Romsdals Budstikke Molde
A/S Driva-Trykk Sunndalsøra
A/S Åndalsnes Avis Åndals-nes
Orkla Press International A.SLysaker
Orkla Press International A.SWroclaw, Poland
Magazines
Hjemmet Mortensen ASP.O.Box 5001 MajorstuaN-0301 OsloTel. +47 22 94 10 00Telefax +47 22 33 30 96
Hjemmet MortensenTrykkeri AS, Oslo
Telecom Scandinavia ASOslo
Direct Marketing
Orkla DM ASP.O.Box 2306 SollieN-0201 OsloTel. +47 22 52 25 50Telefax +47 22 73 27 00
Direct Mail AS - Media Print AS, Oslo
Forbruker Kontakt A.SOslo
Selektiv Markedsføring A.SGrimstad and Oslo
Selektiv DM A.S, Oslo
Media Data A.S, Oslo
DM Distribusjon ASGrimstad
CHEMICALS
Borregaard P.O.Box 162 N-1701 Sarpsborg Tel. +47 69 11 80 00Telefax +47 69 11 87 70
Borregaard IndustriesLimited P.O.Box 162 N-1701 SarpsborgTel. +47 69 11 80 00Telefax +47 69 11 87 70
LignoTech (UK) Ltd.Warrington, Cheshire United Kingdom
LignoTech Sweden ABVargön, Sweden
LignoTech Finland OYTampere, Finland
LignoTech DeutschlandGmbHKarlsruhe, Germany
LignoBond Verkaufsgesellschaft mbHKarlsruhe, Germany
LignoTech Verkaufsgesellschaft mbHDüsseldorf, Germany
LignoTech Schweiz AGLuterbach, Switzerland
LignoTech USA, Inc.Rothschild, Wisconsin, USA
LignoTech Iberica S.ATorrelavega, Spain
Borregaard S.E.A. Pte LtdSingapore, Singapore 0511
Borregaard GmbHFrankfurt/Main, Germany
Borregaard FranceParis, France
Borregaard IndustriesLimited, Japan BranchTokyo, Japan
Borregaard Fine Chemicals A.S, Sarpsborg
EuroVanillin KS, Sarpsborg
Borregaard Italia S.r.l.Milan, Italy
Tai Cang BorregaardChemicals Co. Ltd.Jiangsu Province, China
Borregaard ShanghaiRepresentative OfficeShanghai, China
Borregaard NEA ASLysaker
Borregaard Trælandsfos ASKvinesdal
Borregaard Hellefos AS Hokksund
Borregaard Vafos ASKragerø
A/S Tronstad Brug Ltd.Sylling
A/S Børresen, Sylling
Borregaard UK Ltd.Virginia Water, SurreyUnited Kingdom
Borregaard Skoger A.SElverum
Orkla Exolon AS KSOrkanger
Kemetyl AB Stockholm, Sweden
F INANCIALINVESTMENTS
SECURITIES
Orkla A.SFondsseksjonenP.O.Box 308N-1324 LysakerTel. +47 22 50 10 80Telefax +47 22 50 23 80
FINANCIAL SERVICES
Orkla Finans A.SP.O.Box 1724 Vika N-0121 OsloTel. +47 22 40 08 00Telefax +47 22 33 14 41
- Securities brokerage- Insurance brokerage- Portfolio management- Fund management
OTHER ACT IV IT I ES
Chr. Salvesen & Chr.Thams's CommunicationsAktieselskab, Løkken Verk
A/S Høvellast, Oslo
Viking Fottøy A.SP.O.Box 33 AlnabruN-0614 OsloTel. +47 22 07 24 00Telefax +47 22 07 24 99
Viking Sko ABVarberg, Sweden
Viking Jalkineet OYVantaa, Finland
Herold Halle Viking A/SRingsted, Denmark

PHOTOGRAPHS:Product photos p. 1-61: Petter WinsnesBlack and white photos:p. 2-5, 40-41, 48-57: Svein Erik Dahl, Samfotop. 36-37, 44-45: GV-Pressp. 38-39: Sjøberg Bildebyråp. 42-43, 46-47: NPS Billedbyråp. 58-59: Pål Hermansen, Samfotop. 60-61: Image Bank

P.O.BOX 308, N-1324 LYSAKER, NORWAY. TELEPHONE +47 22 50 10 80 TELEFAX +47 22 50 16 91 ENTERPRISE NUMBER N 910 747 711
BU
RSO
N-M
ARS
TELLER A/
S ■
PRINT: PA
INTB
OX
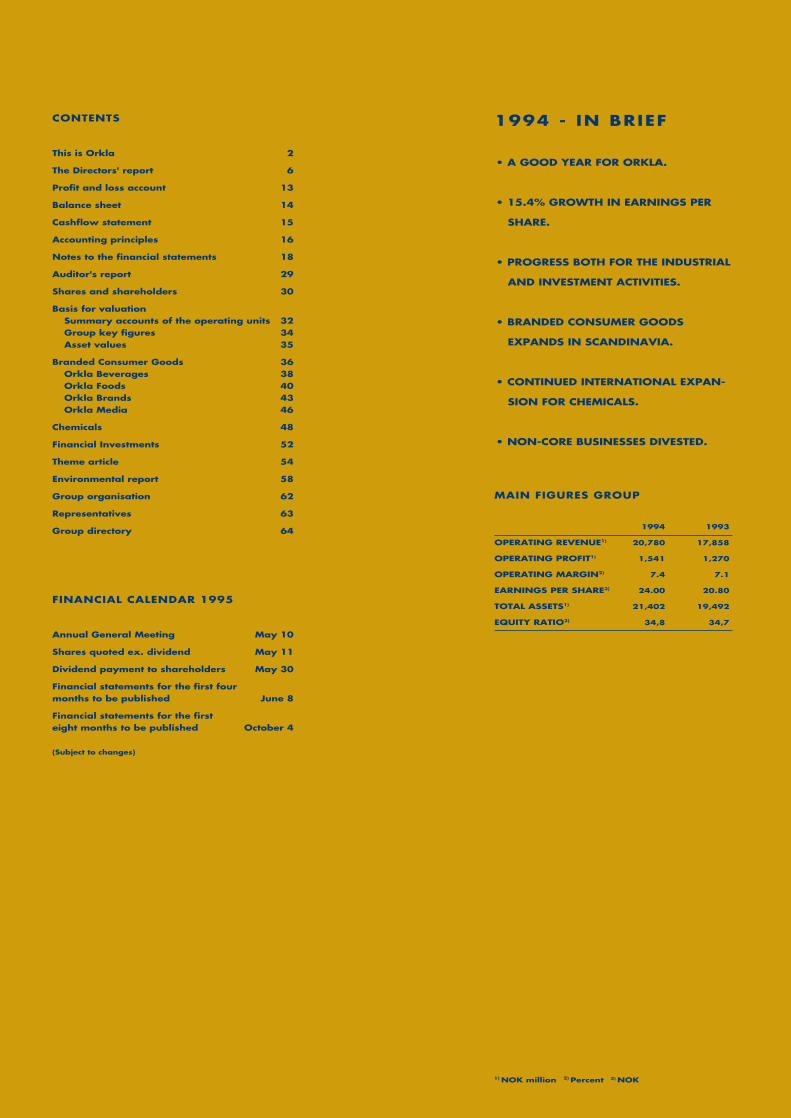
CONTENTS
This is Orkla 2
The Directors' report 6
Profit and loss account 13
Balance sheet 14
Cashflow statement 15
Accounting principles 16
Notes to the financial statements 18
Auditor's report 29
Shares and shareholders 30
Basis for valuationSummary accounts of the operating units 32Group key figures 34Asset values 35
Branded Consumer Goods 36Orkla Beverages 38Orkla Foods 40Orkla Brands 43Orkla Media 46
Chemicals 48
Financial Investments 52
Theme article 54
Environmental report 58
Group organisation 62
Representatives 63
Group directory 64
FINANCIAL CALENDAR 1995
Annual General Meeting May 10
Shares quoted ex. dividend May 11
Dividend payment to shareholders May 30
Financial statements for the first four months to be published June 8
Financial statements for the first eight months to be published October 4
(Subject to changes)
1994 - IN BRIEF
• A GOOD YEAR FOR ORKLA.
• 15.4% GROWTH IN EARNINGS PER
SHARE.
• PROGRESS BOTH FOR THE INDUSTRIAL
AND INVESTMENT ACTIVITIES.
• BRANDED CONSUMER GOODS
EXPANDS IN SCANDINAVIA.
• CONTINUED INTERNATIONAL EXPAN-
SION FOR CHEMICALS.
• NON-CORE BUSINESSES DIVESTED.
MAIN FIGURES GROUP
1994 1993
OPERATING REVENUE1) 20,780 17,858
OPERATING PROFIT1) 1,541 1,270
OPERATING MARGIN2) 7.4 7.1
EARNINGS PER SHARE3) 24.00 20.80
TOTAL ASSETS1) 21,402 19,492
EQUITY RATIO2) 34,8 34,7
1) NOK million 2) Percent 3) NOK

ORKLA
Table of ContentsOverviewSummary 1994Key figuresReport of the Board of DirectorsIncome StatementBalance SheetCash Flow AnalysisNotesShareholders Policy
••••••••••
••••••••••
W&KO@?7@@@@?
?O)Xe?J@@@@@Le?W26K??O2@@)K?O&@@@@@)K?O&@@@6X?@@@@@@@@@@@@@@@@@@@@@@@@1?3@@@@@@@@@@@@@@@@@@@@@@@5?N@@@@@@@@@@@@@@@@@@@@@@@H?J@@@@@@@@@@@@@@@@@@@@@@@
?W&@@@@@@@@@fI4@@@@@@@@@6K??W&KO&@@@@@@(M?@@6K?e?I4@@@@@@@@@@6X?W&@@@@@@@@@0Y?J@@@@6K?e?I'@@@@@@@@@1?7@@@@@@@@(M??W&@@@@@@@fV'@@@@@@@@@L@@@@@@@@@He?7@@@@@@@@f?V'@@@@@@@@13@@@@@@@5?e?@@@@@@@@5gV'@@@@@@@@V'@@@@@(Y?e?@@@@@@@(Y?O26X??N@@@@@@@@@@@Hf?@@@@@@@e@@@@1?e3@@@@@ ?O2@@6K?fW26?@K?O@Kf@@@6X?eW2@@@?@@@@hW2@@@@h
?7@@@@5?f?@@@@@@@)X@@@@@?eN@@@@@ W2@@@@@@@6K?e7@@@@@@@@@@6X?@@@@)??W&@@@5?@@@@h7@@@@@L?g?@@@@@H?f?@@@@@@@@@@@@@5?e?3@@@@ ?W&@@@@@@@@@@6X?@@@@@@@@@@@@1?@@@@eW&@@@@H?@@@@h@@@@@@1?g?@@@@@g?@@@@@@@@@@@@@f?N@@@@@@6X ?7@@@@@@@@@@@@1?@@@@@@@@@@@@@?@@@@@?7@@@@5e@@@@g?J@@@@@@@?g
@@@@@@@@g?@@@@@@@@@@@@@1?f@@@@@@@) J@@@@(M??I'@@@@?@@@@f?@@@@?@@@@Y?@@@@(Ye@@@@g?7@@@@@@@Lg@@@@@@@@g?@@@@@@@@@@@@@5?f@@@@@@@? 7@@@(YfN@@@@?@@@@fJ@@@@?@@@@@@@@@(Y?e@@@@gJ@@@@?@@@1g@@@@@@@@g?@@@@@@@@@@@@@H?f@@@@@@@1 @@@@H?f?@@@@@@@@@e?O&@@@@?@@@@@@@@@Hf@@@@g7@@@5?@@@@L?f@@@@@@@@g?@@@@@@@@??I4@g@@@@@@@5 @@@@g?3@@@@@@@@@@@@@@@@5?@@@@@@@@@?f@@@@L?f@@@@H?3@@@1?f@@@@@@@@g?@@@@@@@@?h?J@@@@@@0Y @@@@g?N@@@@@@@@@@@@@@@@H?@@@@@@@@@Lf@@@@1?e?J@@@5eN@@@@Lf?I'@@@@@g?@@@@@@@@?h?7@@@@(M @@@@g?J@@@@@@@@@@@@@@@@L?@@@@@@@@@)X?e@@@@5?e?7@@@Ye?@@@@1fN@@@@@L?f?@@@@@@@@@@?g?@@@@@H? @@@@L?f?7@@@@@@@@@(?4@@@@1?@@@@@@@@@@1?e@@@@H?e?@@@@@@@@@@@@@f?3@@@@1?fJ@@@@@@@@@@LgJ@@@@@ @@@@1?f?@@@@@@@@@@He?@@@@?@@@@@V'@@@@Le@@@@L?eJ@@@@@@@@@@@@@L?e@@@@@Lf7@@@@@@@@@@1g7@@@@@L? @@@@@LfJ@@@@?@@@@@?e?@@@@?@@@@@?V'@@@)X?@@@@)K?O&@@@@@@@@@@@@@1?e
W&@@@@@)X??J@@@@@@@@@@@@L?e?J@@@@@@)X 3@@@@)K??O&@@@@?@@@@@?e?@@@@?@@@@@??N@@@@)X@@@@@@@@@@@@g?@@@@Le7@@@@@@@1??7@@@@X?I'@@@@)XeW&@@@@@@@1 V'@@@@@@@@@@@@5?@@@@@?e?@@@@@@@@@@?e3@@@@@@@@@@@@@@@@@g?@@@@1e@@@@@@@@@L?@@@@@1??V'@@@@1?W&@@@@@@@@5 ?V'@@@@@@@@@@(Y?@@@@@?e?@@@@@@@@@@?eV'@@@@@@@@@@@@@@@5g?3@@@@e3@@@@@@@@)X@@@@@@?eN@@@@@W&@@@@@@@@(Y V4@@@@@@@@0Ye@@@@@?e?@@@@@@@@@@?e?V4@@@@@@@@@@@@@0Yg?V4@@@eN@@@@@@@@@@@@@@@@?e?@@@@@@@@@@@@@@@H? I4@@@0M??@@0?'@@@@@@@@he@@@@@@@(MI4@
?V'@@@@@@@@@6KeO2@@@@@@@@(YN@@@@@@@@@@@@@@@@@@@@@@@J@@@@@@@@@@@@@@@@@@@@@@@1?7@@@@@@@@@@@@@@@@@@@@@@@@?@@@@@@@@@@@@@@@@@@@@@@@@@??I4@@(M?e@@@@@@e?I4@0M?I(Yf@@@@@@
@@@@@@
B R A N D E D C O N S U M E RG O O D S
ORKLA IS A LEADING SUPPLIER
OF BRANDED CONSUMER
GOODS TO THE SCANDINAVIAN
MARKET. BRANDED GOODS
REPRESENT CLOSE TO 80%
OF THE GROUP'S TOTAL SALES. F I N A N C I A LI N V E S T M E N T S
ORKLA OWNS ONE OF NORWAY'S
LARGEST INVESTMENT PORTFOLIOS
WHICH REPRESENTS AROUND 25%
OF THE GROUP'S BALANCE SHEET.
THE PORTFOLIO HAS PROVIDED A
BETTER RETURN THAN THE OSLO
STOCK EXHANGE OVER A NUMBER
OF YEARS.
CHEMICALS
ORKLA HAS STRONG GLOBAL
MARKET POSITIONS IN SELECTED
NICHES OF SPECIALTY AND FINE
CHEMICALS. MORE THAN 80%
OF SALES ARE OUTSIDE NORWAY.
THE CHEMICALS BUSINESS REPRE-
SENTS 15% OF THE GROUP'S SALES
AND IS GROWING STRONGLY.
ORKLAA N N U A L R E P O R T 1 9 9 4
1994
ORKLA