Embed Size (px)
Citation preview
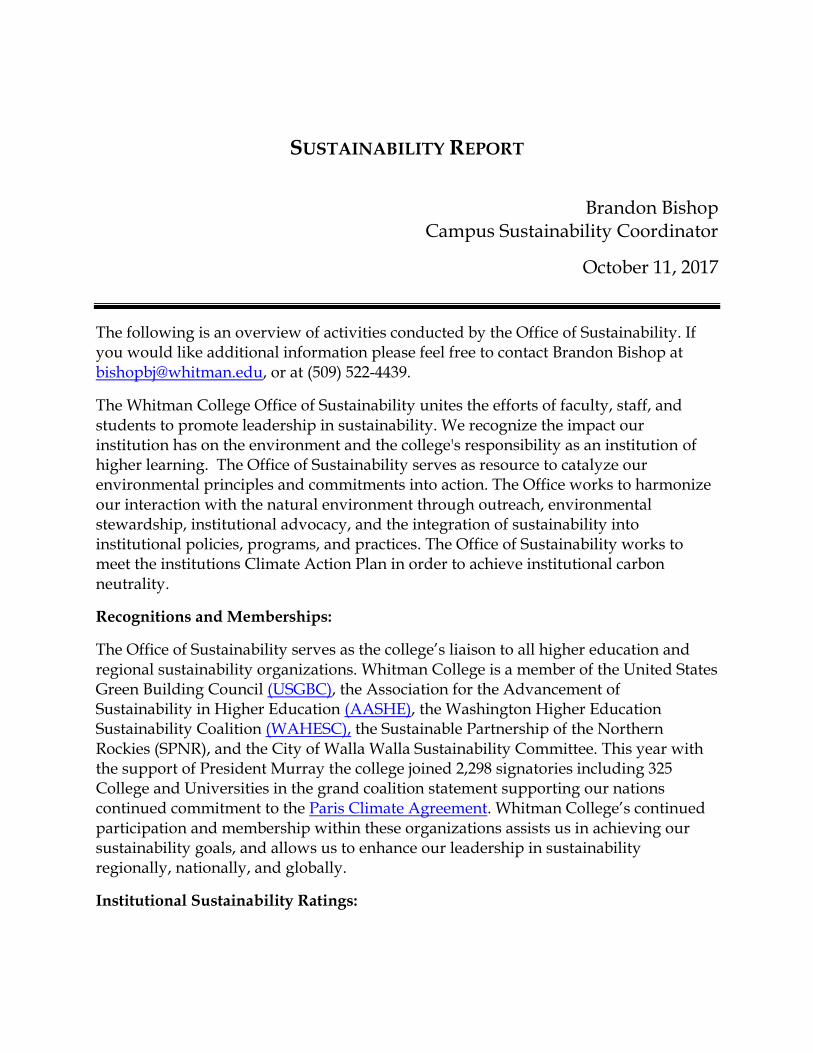
SUSTAINABILITY REPORT
Brandon Bishop
Campus Sustainability Coordinator
October 11, 2017
The following is an overview of activities conducted by the Office of Sustainability. If you would like additional information please feel free to contact Brandon Bishop at [email protected], or at (509) 522-4439.
The Whitman College Office of Sustainability unites the efforts of faculty, staff, and students to promote leadership in sustainability. We recognize the impact our institution has on the environment and the college's responsibility as an institution of higher learning. The Office of Sustainability serves as resource to catalyze our environmental principles and commitments into action. The Office works to harmonize our interaction with the natural environment through outreach, environmental stewardship, institutional advocacy, and the integration of sustainability into institutional policies, programs, and practices. The Office of Sustainability works to meet the institutions Climate Action Plan in order to achieve institutional carbon neutrality.
Recognitions and Memberships:
The Office of Sustainability serves as the college’s liaison to all higher education and regional sustainability organizations. Whitman College is a member of the United States Green Building Council (USGBC), the Association for the Advancement of Sustainability in Higher Education (AASHE), the Washington Higher Education Sustainability Coalition (WAHESC), the Sustainable Partnership of the Northern Rockies (SPNR), and the City of Walla Walla Sustainability Committee. This year with the support of President Murray the college joined 2,298 signatories including 325 College and Universities in the grand coalition statement supporting our nations continued commitment to the Paris Climate Agreement. Whitman College’s continued participation and membership within these organizations assists us in achieving our sustainability goals, and allows us to enhance our leadership in sustainability regionally, nationally, and globally.
Institutional Sustainability Ratings:
AASHE Silver STARS Rating: Whitman College received our first full rating by the Sustainability Rating and Tracking System. This benchmarking system is managed by AASHE and is utilized by the Princeton Review, Sierra Club, and other higher education sustainability ranking organizations. In our first full sustainability review our institution received a Silver Stars Rating. In this first ranking Whitman received a score of 51.20 placing us in the middle of the pack for similar sized institutions. In our comparative cohort Colorado College received a Gold rating at 66.79 and Pomona College received a Gold rating at 68.35.
Sustainability Rated by the Sierra Club & Princeton Review: This year the college was ranked 200 out of 227 institutions by the Sierra Club. We were additionally included in Princeton Review’s Guide to 375 Green Colleges. This represents a first step in our recognition as a leader within sustainability. It is our hope that as we advance our Climate Action Plan we will see an increase in our institutional rating by AASHE STARS. This rating will lead to increased rankings by third party entities like the Princeton Review, and the Sierra Club.
Recognition by the EPA: Whitman College was recognized by the Environmental Protection Agency through the EPA Green Power Partnership. In offsetting 100% of our electricity use through the purchase of renewable energy credits and onsite solar generation we beat institutions like Lewis and Clark with our total green energy usage. In addition to receiving an award for the most green energy use within the Northwest Conference, Whitman College was admitted to the EPA Green Power Leadership Club.
Chamber of Commerce: Whitman College was awarded the Walla Walla Valley Chamber of Commerce Smart Business Partnership Award for Large Business. This Smart Business Partner award recognizes large and small businesses that practice outstanding commitment to sustainable business practices. This is the first time Whitman College has been selected as this awards recipient.
Campus Carbon Footprint:
In FY16 Whitman College produced 23,377.1 mtCO2e of greenhouse gas emissions. In order to model the social externality produced by these emissions I have chosen to utilize the DICE-2R model of $33.00 per metric ton of greenhouse gas emissions. (Moore & Diaz, 2015) This would place the global financial impact of our emissions for FY16 at $771,444. In FY17 the total emissions were 24,526.5 mtCO2e of greenhouse gas emissions. The total institutional externality was $809,374 for all of Whitman College’s greenhouse gas emissions in FY17. It should be noted for FY16 and FY17 I have reduced the individually attributed greenhouse gas emissions to those individually reported in relation to the college’s transportation model. As such this likely underestimates the total Scope 3 emissions attributable to the college. This is due to significant challenges in tracking campus travel and limitations on individually reported behavior.
The original baseline of the college for FY13 was 12,475.5 mtCO2e. In reviewing the college’s 2013 Greenhouse Gas Inventory a major error was observed within the electricity fuel blend. After adjusting this fuel blend to Pacific Power’s 2012-2013 regional fuel blend this increased the total emissions by 4,848.5 to 17,323.2 mtCO2e. It should additionally be noted that this emissions number did not contain trust properties and residence life properties. This audit adjusted those numbers as field standards require an emissions model that encompasses all fiduciary sources of operation. As such in reviewing the emissions baseline the college was more accurately near 22,000mtCO2e for FY13.
In the early 2000’s the Sustainability Advisory Committee (SAC) advised the college to purchase a small amount of renewable energy credits from the Pacific Power Blue Sky Program. As of 2012 the college allocated funds in addition to a $5.00 student fee to purchase $20,000 in Renewable Energy Credits annually. This worked to offset 5,200 mWh of electricity, or roughly 27% of the campuses electricity use. In 2016 the campus Climate Action Plan committed to reducing campus greenhouse gas emissions by 50% by 2020, and 100% by 2050. In order to reach short term carbon offset goals the college allocated an additional $10,000 to offset 100% of electricity use through the purchase of Green-E certified RECs. In FY2017 the college offset 100% of its electricity use and was recognized by the EPA Green Power Partnership. In order to meet our 50% reduction by 2020 the college began purchasing carbon offsets for natural gas for FY18. Within FY17 our RECS accounted for roughly 13,936.3 mtC02e. This offset reduced our attributable emissions from 24,526.5 mtCO2e to 10,590.2mtCO2e.
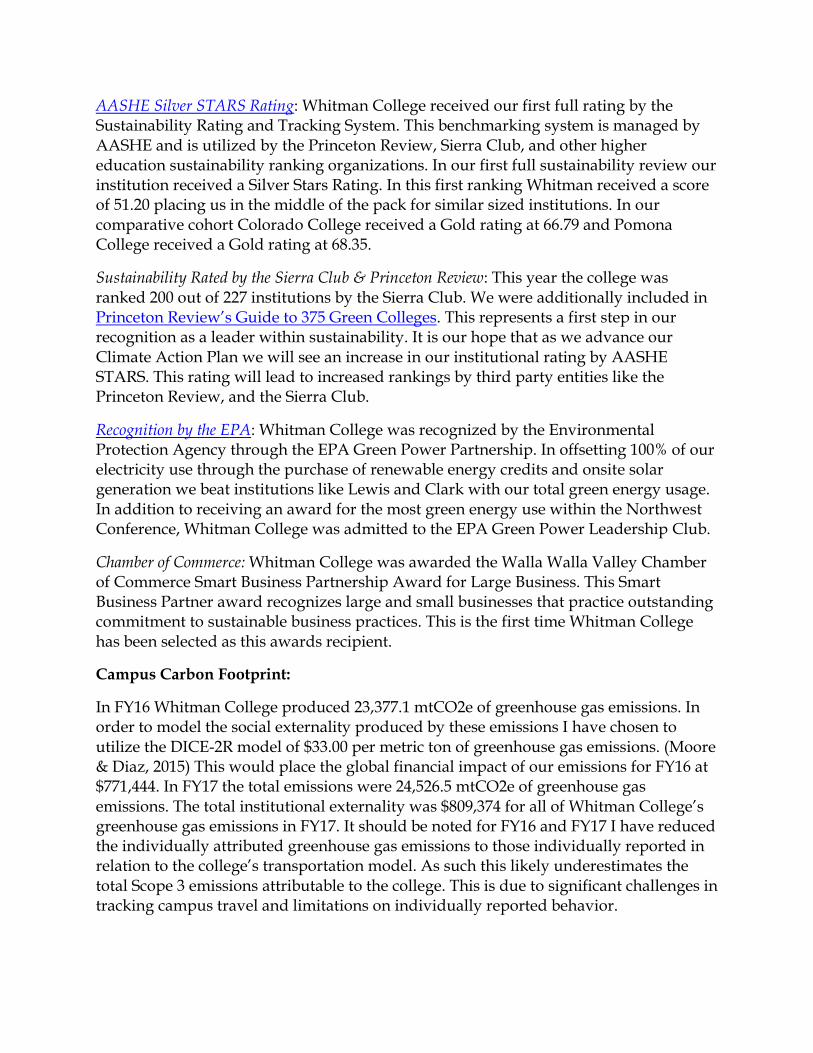
The following is an overview of institutional emissions by source:
FY2017 Energy Consumption CO2 CH4 N2O eCO2
MMBtu kg kg kg Metric Tonnes
Scope 1 Co-gen Electricity - - - - -
Co-gen Steam - - - - -
On-Campus Stationary (Heating) 62,053.9 3,294,471.4 295.7 6.1 3,303.7
Fleet Transportation 1,832.2 131,266.9 25.6 8.6 134.5
Refrigerants & Chemicals - - - - 75.2
Agriculture - - - 1,102.2 328.5
Scope 2 Purchased Electricity 46,710.3 11,107,002.9 1,215.9 152.9 11,183.0
Purchased Steam / Chilled Water - - - - -
Scope 3 Faculty / Staff Commuting 543.4 38,796.2 8.3 2.8 39.8
Student Commuting 55.7 3,983.0 0.8 0.3 4.1
Directly Financed Air Travel 2,236.7 436,218.8 4.3 5.0 437.8
Other Directly Financed Travel 422.6 30,710.7 4.1 1.5 31.3
Study Abroad Air Travel - - - - -
Student Travel to/from Home 54,802.4 7,992,502.8 395.5 184.5 8,057.4
Solid Waste - - 1,577.7 - 39.4
Wastewater - - 0.0 0.1 0.0
Paper - - - - 129.4
Scope 2 T&D Losses 3,185.3 757,406.3 82.9 10.4 762.6
Offsets Additional -
Non-Additional (13,936.3)
Totals Scope 1 63,886.0 3,425,738.2 321.2 1,116.9 3,841.8
Scope 2 46,710.3 11,107,002.9 1,215.9 152.9 11,183.0
Scope 3 61,245.9 9,259,617.8 2,073.7 204.5 9,501.3
All Scopes 171,842.3 23,792,358.9 3,610.8 1,474.3 24,526.5
All Offsets (13,936.3)
Net
Emissions: 10,590.2
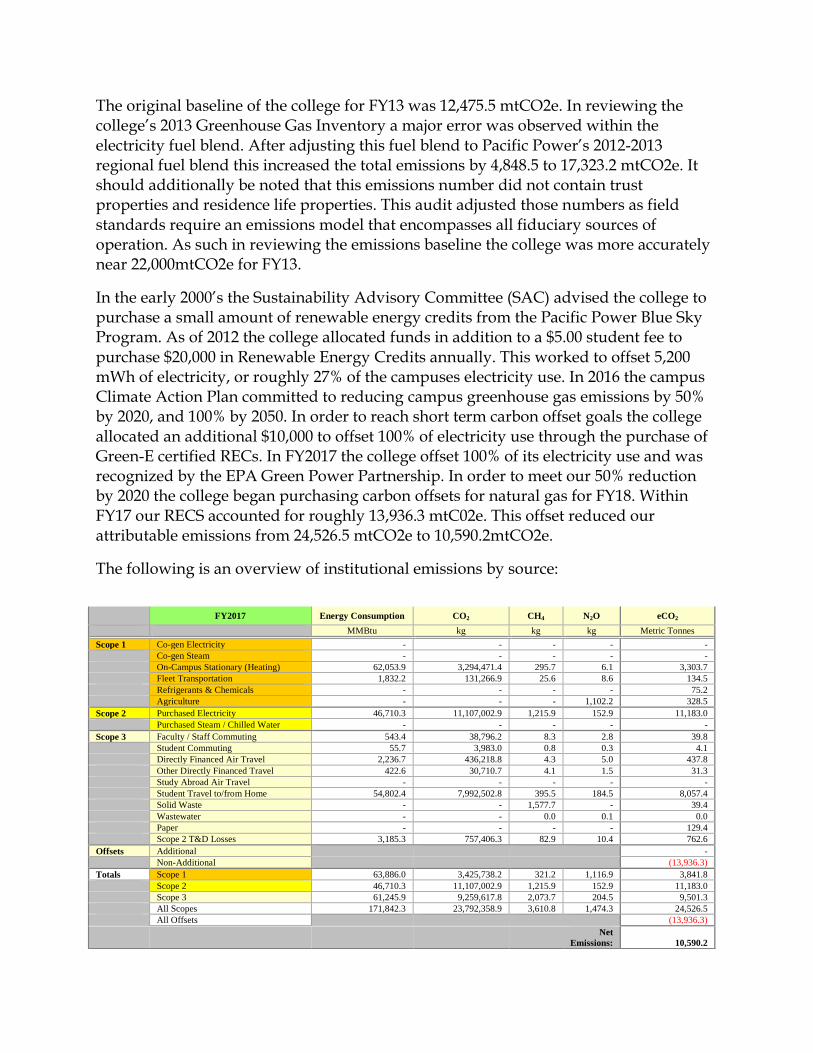
FY2016 Energy Consumption CO2 CH4 N2O eCO2
MMBtu kg kg kg Metric Tonnes
Scope 1 Co-gen Electricity - - - - -
Co-gen Steam - - - - -
On-Campus Stationary (Heating) 52,505.9 2,807,838.4 254.9 5.6 2,815.9
Fleet Transportation 1,890.1 135,409.4 26.4 8.9 138.7
Refrigerants & Chemicals - - - - 277.4
Agriculture - - - 1,302.8 388.2
Scope 2 Purchased Electricity 45,487.3 11,054,417.8 1,250.1 154.2 11,131.6
Purchased Steam / Chilled Water - - - - -
Scope 3 Faculty / Staff Commuting 549.9 39,263.7 8.4 2.8 40.3
Student Commuting 54.4 3,893.3 0.8 0.3 4.0
Directly Financed Air Travel 2,210.5 431,121.8 4.3 4.9 432.7
Other Directly Financed Travel 419.2 30,464.5 4.1 1.5 31.0
Study Abroad Air Travel - - - - -
Student Travel to/from Home 53,880.0 7,829,573.7 392.0 182.1 7,893.6
Solid Waste - - 1,782.4 - 44.6
Wastewater - - 0.1 0.1 0.0
Paper - - - - 129.4
Scope 2 T&D Losses 202.9 49,314.8 5.6 0.7 49.7
Offsets Additional -
Non-Additional (1,961.1)
Totals Scope 1 54,396.0 2,943,247.8 281.3 1,317.4 3,620.2
Scope 2 45,487.3 11,054,417.8 1,250.1 154.2 11,131.6
Scope 3 57,317.0 8,383,631.8 2,197.6 192.3 8,652.2
All Scopes 157,200.3 22,381,297.4 3,729.0 1,663.9 23,377.20
All Offsets (1,961.1)
Net
Emissions: 21,299.5
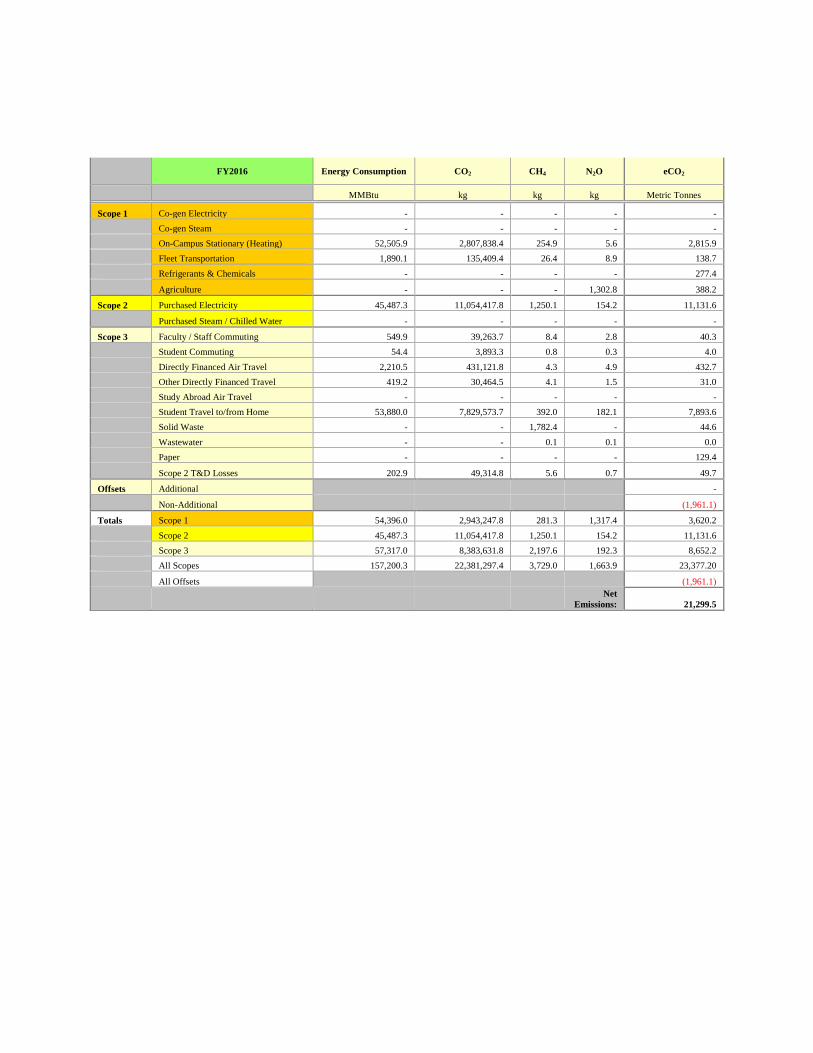
The following provides a visual representation of historic campus emissions and Renewable Energy Credits (REC) purchases. The greenhouse gas emissions are represented by the blue area in mtCO2e. The REC purchases are represented by the red area. This graph reflects that our current REC purchases are offsetting roughly half of our institutional greenhouse emissions. The increased emissions between 2013 and 2017 are due to increased building space and energy consumption trends. Projects for FY18 hold similar to FY17. We are continuing to project an increase in emissions for FY19 due to the opening of the new residence hall and dining hall this may require the purchase of additional RECs to meet our 2020 goals. However, it should be noted the college was able to begin its efforts to offset our natural gas use with the purchase of emissions offsets for FY18.
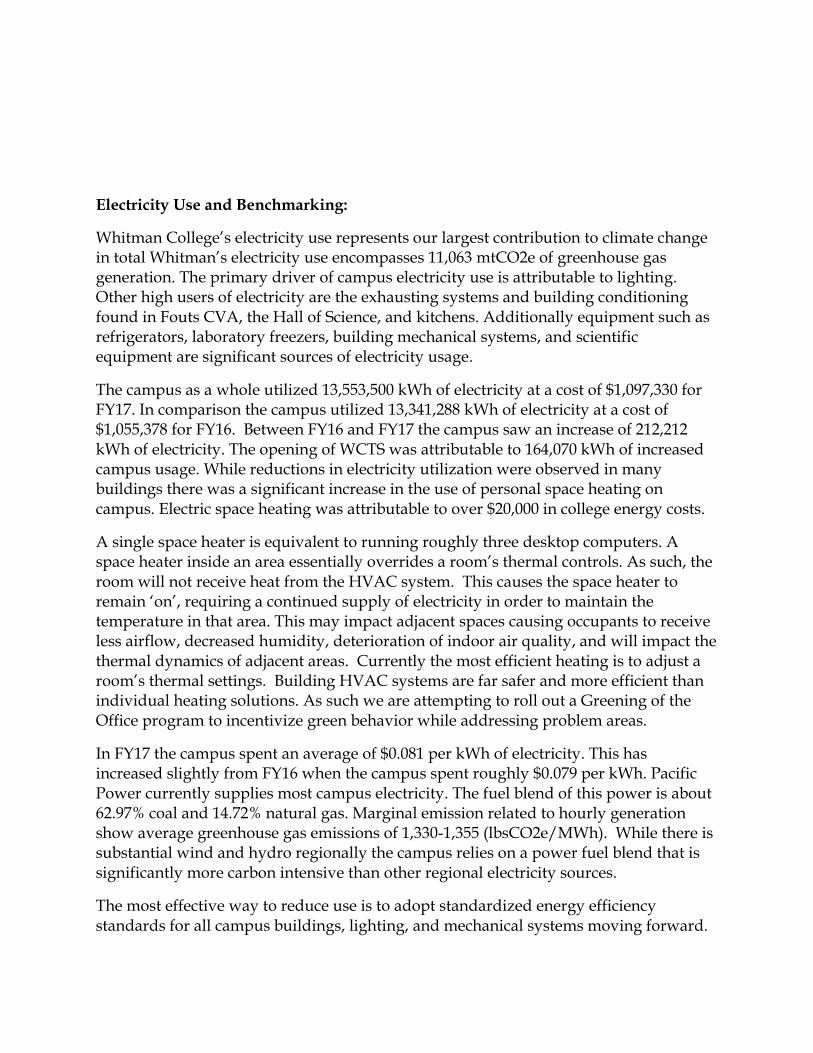
Electricity Use and Benchmarking:
Whitman College’s electricity use represents our largest contribution to climate change in total Whitman’s electricity use encompasses 11,063 mtCO2e of greenhouse gas generation. The primary driver of campus electricity use is attributable to lighting. Other high users of electricity are the exhausting systems and building conditioning found in Fouts CVA, the Hall of Science, and kitchens. Additionally equipment such as refrigerators, laboratory freezers, building mechanical systems, and scientific equipment are significant sources of electricity usage.
The campus as a whole utilized 13,553,500 kWh of electricity at a cost of $1,097,330 for FY17. In comparison the campus utilized 13,341,288 kWh of electricity at a cost of $1,055,378 for FY16. Between FY16 and FY17 the campus saw an increase of 212,212 kWh of electricity. The opening of WCTS was attributable to 164,070 kWh of increased campus usage. While reductions in electricity utilization were observed in many buildings there was a significant increase in the use of personal space heating on campus. Electric space heating was attributable to over $20,000 in college energy costs.
A single space heater is equivalent to running roughly three desktop computers. A space heater inside an area essentially overrides a room’s thermal controls. As such, the room will not receive heat from the HVAC system. This causes the space heater to remain ‘on’, requiring a continued supply of electricity in order to maintain the temperature in that area. This may impact adjacent spaces causing occupants to receive less airflow, decreased humidity, deterioration of indoor air quality, and will impact the thermal dynamics of adjacent areas. Currently the most efficient heating is to adjust a room’s thermal settings. Building HVAC systems are far safer and more efficient than individual heating solutions. As such we are attempting to roll out a Greening of the Office program to incentivize green behavior while addressing problem areas.
In FY17 the campus spent an average of $0.081 per kWh of electricity. This has increased slightly from FY16 when the campus spent roughly $0.079 per kWh. Pacific Power currently supplies most campus electricity. The fuel blend of this power is about 62.97% coal and 14.72% natural gas. Marginal emission related to hourly generation show average greenhouse gas emissions of 1,330-1,355 (lbsCO2e/MWh). While there is substantial wind and hydro regionally the campus relies on a power fuel blend that is significantly more carbon intensive than other regional electricity sources.
The most effective way to reduce use is to adopt standardized energy efficiency standards for all campus buildings, lighting, and mechanical systems moving forward.
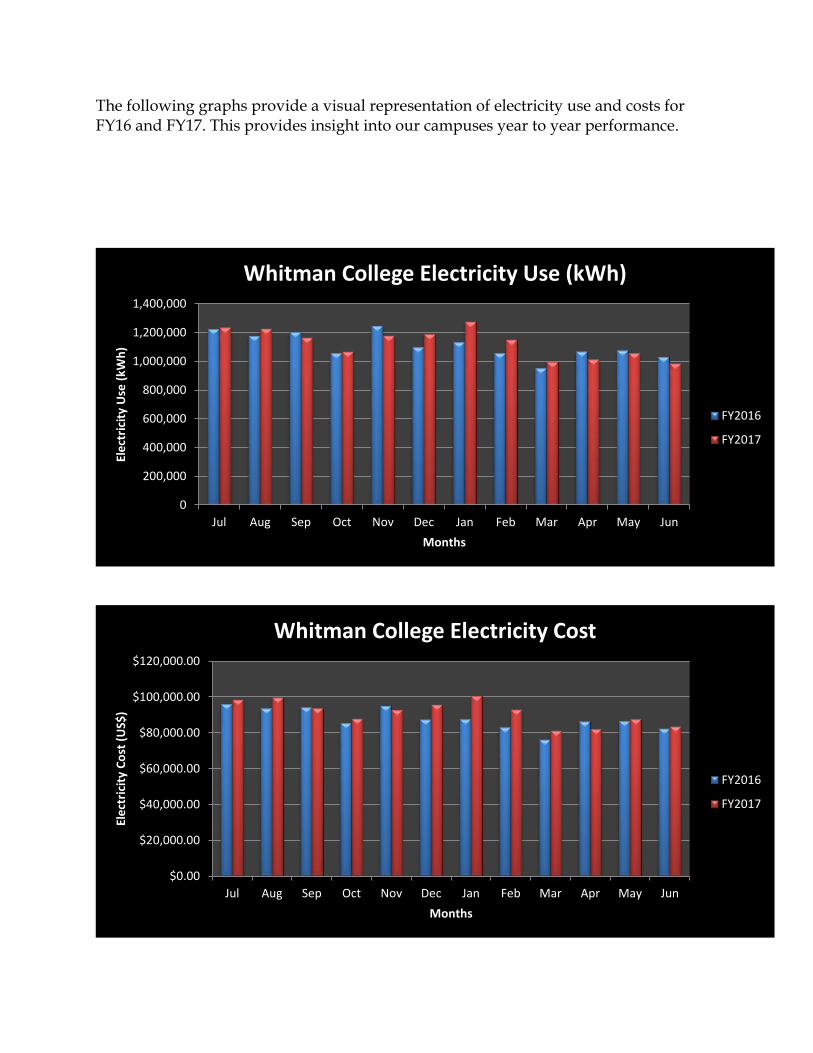
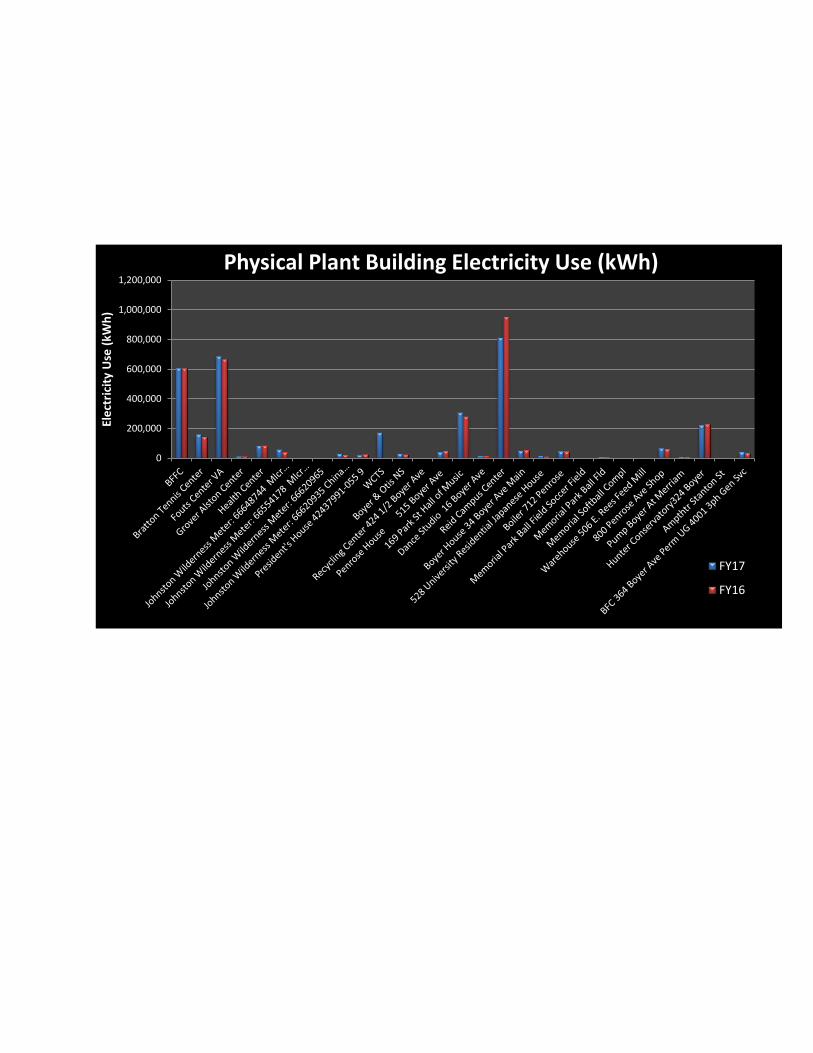
The following graphs provide a visual representation of electricity use and costs for FY16 and FY17. This provides insight into our campuses year to year performance.
0
200,000
400,000
600,000
800,000
1,000,000
1,200,000
1,400,000
Jul Aug Sep Oct Nov Dec Jan Feb Mar Apr May Jun
Ele
ctri
city
Use
(kW
h)
Months
Whitman College Electricity Use (kWh)
FY2016
FY2017
$0.00
$20,000.00
$40,000.00
$60,000.00
$80,000.00
$100,000.00
$120,000.00
Jul Aug Sep Oct Nov Dec Jan Feb Mar Apr May Jun
Ele
ctri
city
Co
st (
US$
)
Months
Whitman College Electricity Cost
FY2016
FY2017
0
200,000
400,000
600,000
800,000
1,000,000
1,200,000
Ele
ctri
city
Use
(kW
h)
Physical Plant Building Electricity Use (kWh)
FY17
FY16
Natural Gas Benchmarking:
Whitman College’s natural gas usage is a significant component of our institutional greenhouse gas emissions. Natural gas is primarily utilized for heating and cooking throughout the campus. Within the campus there are a number of different heating
0
2,000
4,000
6,000
8,000
10,000
12,000
14,000
Ele
ctri
city
Use
(kW
h)
Residence Hall Electricity Use
FY16
FY17
0
100,000
200,000
300,000
400,000
500,000
600,000
Anderson Hall North Hall Prentiss Hall
Ele
ctri
city
Use
(kW
h)
Residence Hall Electricity Use
FY17
FY16
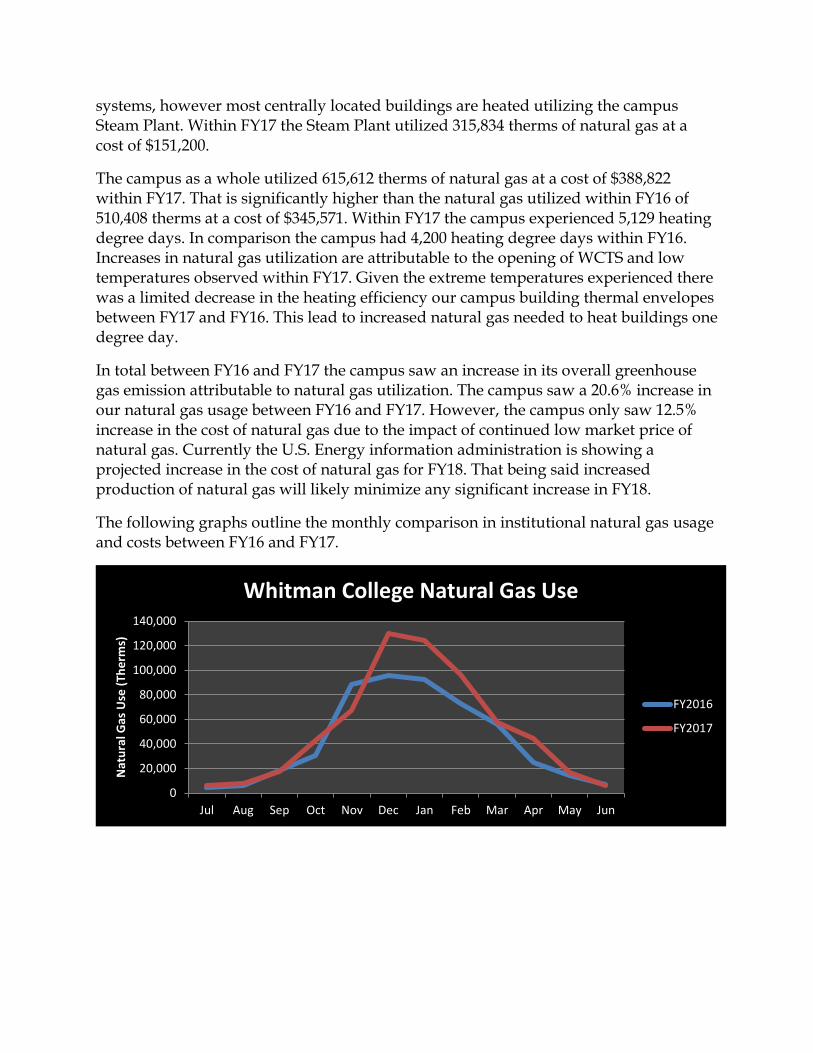
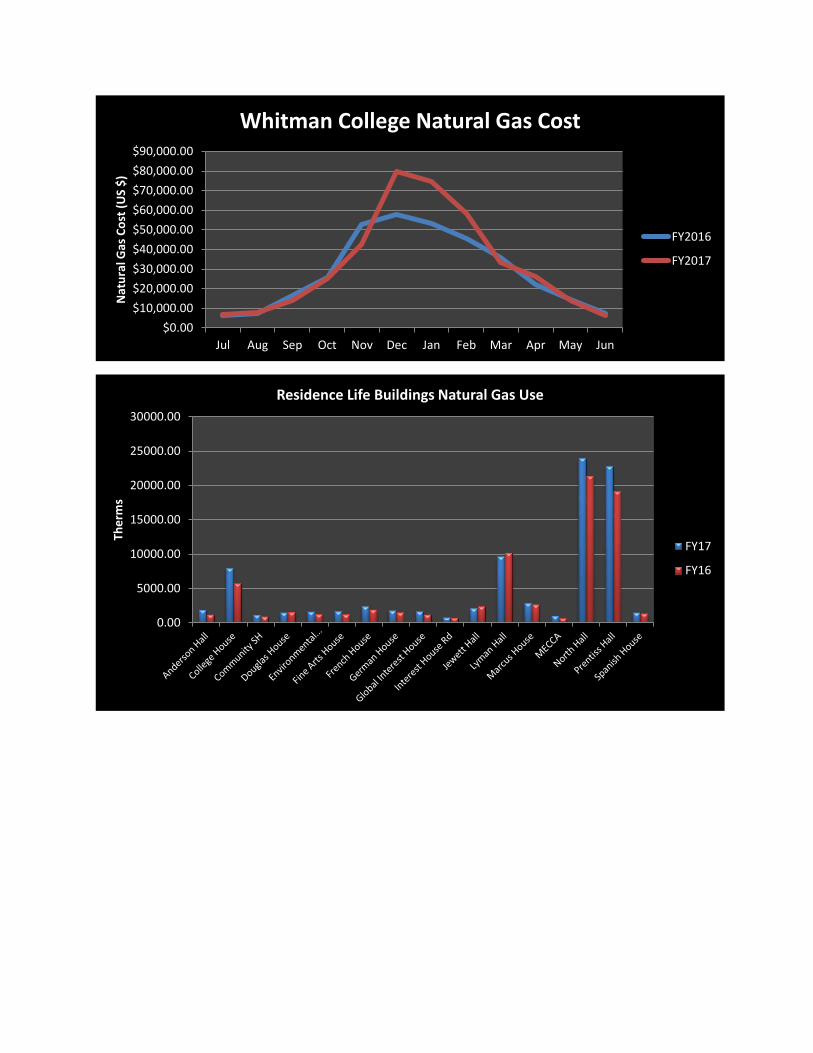
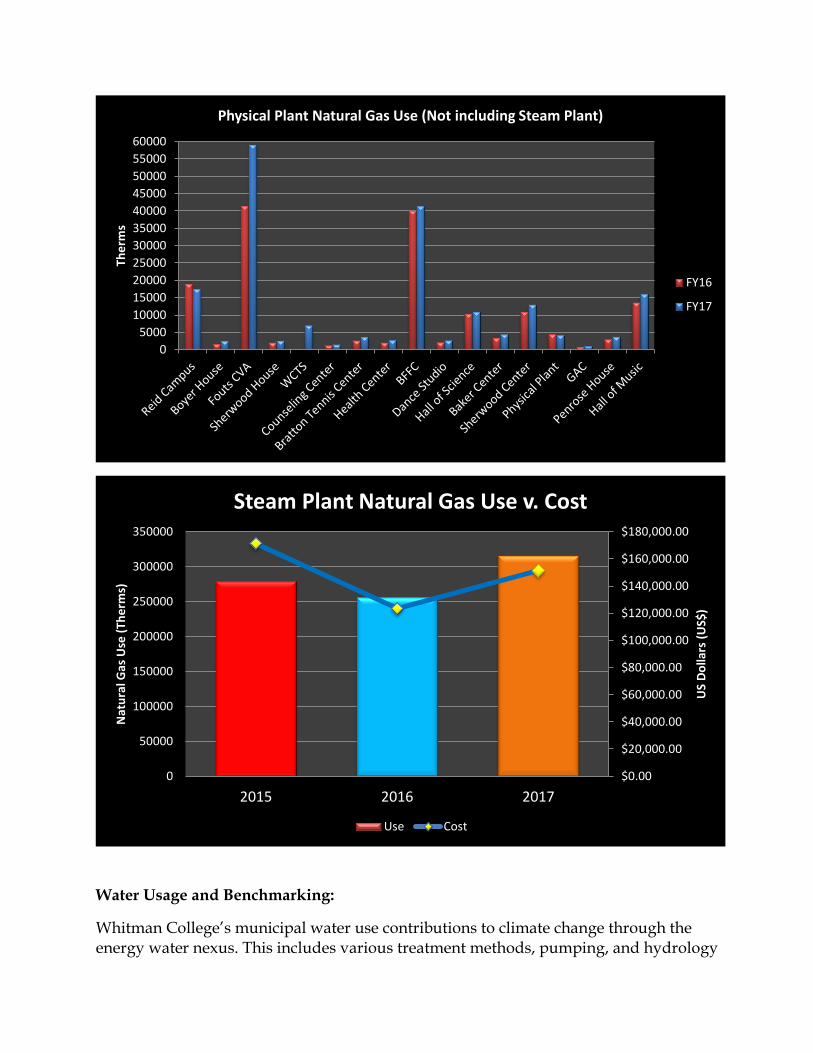
systems, however most centrally located buildings are heated utilizing the campus Steam Plant. Within FY17 the Steam Plant utilized 315,834 therms of natural gas at a cost of $151,200.
The campus as a whole utilized 615,612 therms of natural gas at a cost of $388,822 within FY17. That is significantly higher than the natural gas utilized within FY16 of 510,408 therms at a cost of $345,571. Within FY17 the campus experienced 5,129 heating degree days. In comparison the campus had 4,200 heating degree days within FY16. Increases in natural gas utilization are attributable to the opening of WCTS and low temperatures observed within FY17. Given the extreme temperatures experienced there was a limited decrease in the heating efficiency our campus building thermal envelopes between FY17 and FY16. This lead to increased natural gas needed to heat buildings one degree day.
In total between FY16 and FY17 the campus saw an increase in its overall greenhouse gas emission attributable to natural gas utilization. The campus saw a 20.6% increase in our natural gas usage between FY16 and FY17. However, the campus only saw 12.5% increase in the cost of natural gas due to the impact of continued low market price of natural gas. Currently the U.S. Energy information administration is showing a projected increase in the cost of natural gas for FY18. That being said increased production of natural gas will likely minimize any significant increase in FY18.
The following graphs outline the monthly comparison in institutional natural gas usage and costs between FY16 and FY17.
0
20,000
40,000
60,000
80,000
100,000
120,000
140,000
Jul Aug Sep Oct Nov Dec Jan Feb Mar Apr May Jun
Nat
ura
l Gas
Use
(Th
erm
s)
Whitman College Natural Gas Use
FY2016
FY2017
$0.00
$10,000.00
$20,000.00
$30,000.00
$40,000.00
$50,000.00
$60,000.00
$70,000.00
$80,000.00
$90,000.00
Jul Aug Sep Oct Nov Dec Jan Feb Mar Apr May Jun
Nat
ura
l Gas
Co
st (
US
$)
Whitman College Natural Gas Cost
FY2016
FY2017
0.00
5000.00
10000.00
15000.00
20000.00
25000.00
30000.00
The
rms
Residence Life Buildings Natural Gas Use
FY17
FY16
Water Usage and Benchmarking:
Whitman College’s municipal water use contributions to climate change through the energy water nexus. This includes various treatment methods, pumping, and hydrology
0
5000
10000
15000
20000
25000
30000
35000
40000
45000
50000
55000
60000
The
rms
Physical Plant Natural Gas Use (Not including Steam Plant)
FY16
FY17
$0.00
$20,000.00
$40,000.00
$60,000.00
$80,000.00
$100,000.00
$120,000.00
$140,000.00
$160,000.00
$180,000.00
0
50000
100000
150000
200000
250000
300000
350000
2015 2016 2017
US
Do
llars
(U
S$)
Nat
ura
l Gas
Use
(Th
erm
s)
Steam Plant Natural Gas Use v. Cost
Use Cost
impacts. In the United States buildings utilize around 13.5% of all potable water use. (USGBC) Within the United States changing climate and ground water depletion nationally have created a number of water security concerns and a changing framework of water conservation policy.
Typically in the Western United States water costs increases around 12% annually. Since FY15 we have seen our water costs increase from $0.42 per square foot to $0.48 per square foot in FY17. The college has observed an average increase in cost of water totaling about $0.02 per CCF of potable water.
Within this period the college has diminished fiduciary risk by transitioning irrigation to the Hall of Science Deep Well Aquifer. This taps into the Walla Walla Valley deep aquifer that is currently recharged by the City of Walla Walla. This action has reduced some of the ecological impacts of municipal water usage. Unfortunately it has the impact of eliminating fiduciary incentives for reduced water usage and taps into the emergency water supply for the Walla Walla Valley. At this time the amount of water pulled from the aquifer is not measured. The college should consider metering the water as a social and ecological necessity. It should be noted at this time the municipal recharging has negated decreases in the aquifers capacity. Climate projections for the Blue Mountains will likely have significant implications on future recharge capacity.
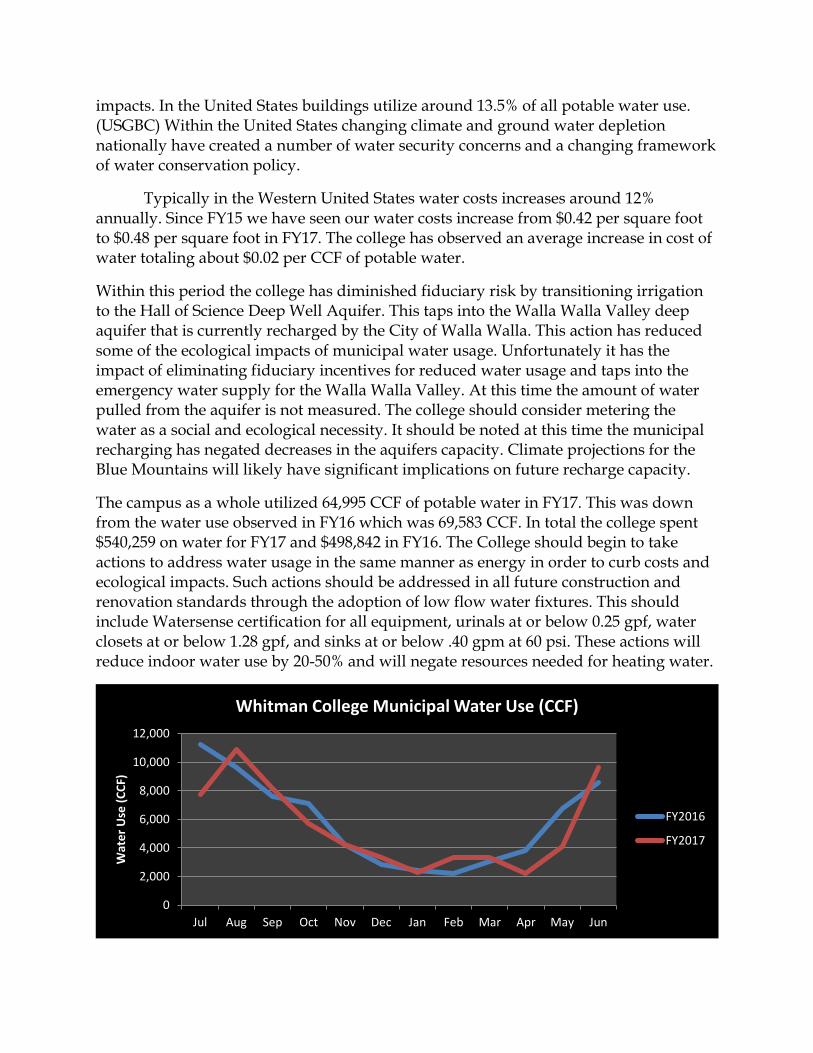
The campus as a whole utilized 64,995 CCF of potable water in FY17. This was down from the water use observed in FY16 which was 69,583 CCF. In total the college spent $540,259 on water for FY17 and $498,842 in FY16. The College should begin to take actions to address water usage in the same manner as energy in order to curb costs and ecological impacts. Such actions should be addressed in all future construction and renovation standards through the adoption of low flow water fixtures. This should include Watersense certification for all equipment, urinals at or below 0.25 gpf, water closets at or below 1.28 gpf, and sinks at or below .40 gpm at 60 psi. These actions will reduce indoor water use by 20-50% and will negate resources needed for heating water.
0
2,000
4,000
6,000
8,000
10,000
12,000
Jul Aug Sep Oct Nov Dec Jan Feb Mar Apr May Jun
Wat
er
Use
(C
CF)
Whitman College Municipal Water Use (CCF)
FY2016
FY2017
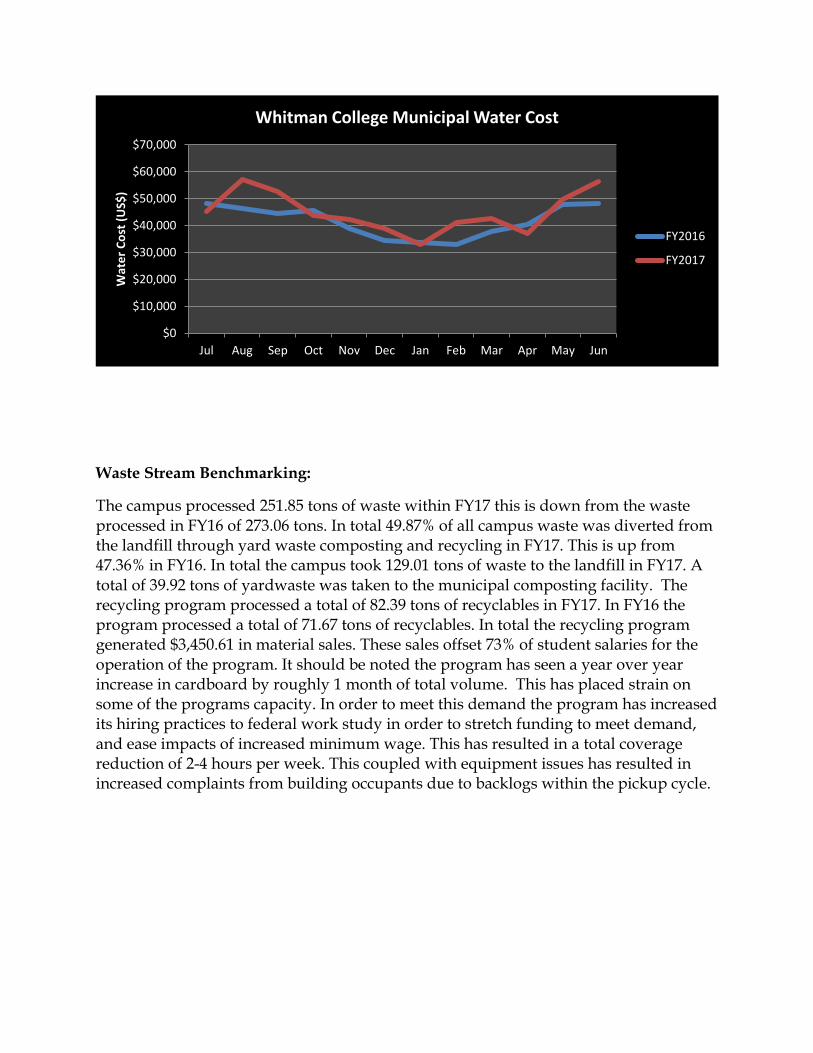
Waste Stream Benchmarking:
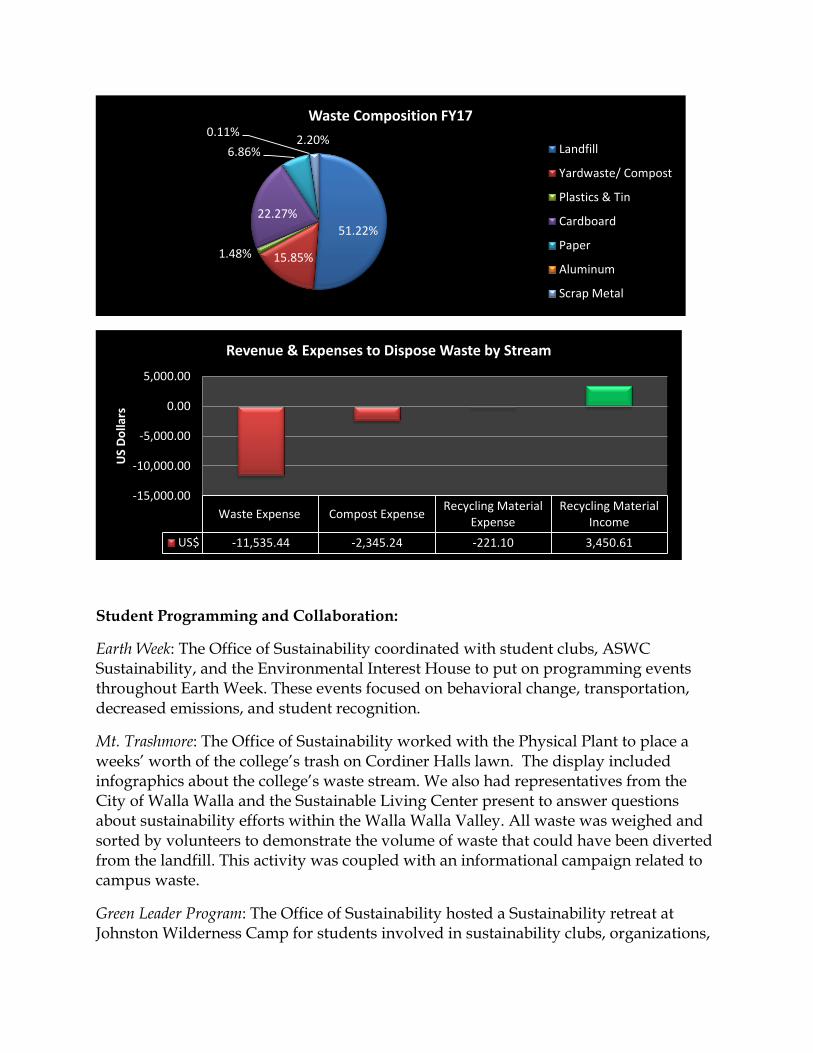
The campus processed 251.85 tons of waste within FY17 this is down from the waste processed in FY16 of 273.06 tons. In total 49.87% of all campus waste was diverted from the landfill through yard waste composting and recycling in FY17. This is up from 47.36% in FY16. In total the campus took 129.01 tons of waste to the landfill in FY17. A total of 39.92 tons of yardwaste was taken to the municipal composting facility. The recycling program processed a total of 82.39 tons of recyclables in FY17. In FY16 the program processed a total of 71.67 tons of recyclables. In total the recycling program generated $3,450.61 in material sales. These sales offset 73% of student salaries for the operation of the program. It should be noted the program has seen a year over year increase in cardboard by roughly 1 month of total volume. This has placed strain on some of the programs capacity. In order to meet this demand the program has increased its hiring practices to federal work study in order to stretch funding to meet demand, and ease impacts of increased minimum wage. This has resulted in a total coverage reduction of 2-4 hours per week. This coupled with equipment issues has resulted in increased complaints from building occupants due to backlogs within the pickup cycle.
$0
$10,000
$20,000
$30,000
$40,000
$50,000
$60,000
$70,000
Jul Aug Sep Oct Nov Dec Jan Feb Mar Apr May Jun
Wat
er
Co
st (
US$
) Whitman College Municipal Water Cost
FY2016
FY2017
Student Programming and Collaboration:
Earth Week: The Office of Sustainability coordinated with student clubs, ASWC Sustainability, and the Environmental Interest House to put on programming events throughout Earth Week. These events focused on behavioral change, transportation, decreased emissions, and student recognition.
Mt. Trashmore: The Office of Sustainability worked with the Physical Plant to place a weeks’ worth of the college’s trash on Cordiner Halls lawn. The display included infographics about the college’s waste stream. We also had representatives from the City of Walla Walla and the Sustainable Living Center present to answer questions about sustainability efforts within the Walla Walla Valley. All waste was weighed and sorted by volunteers to demonstrate the volume of waste that could have been diverted from the landfill. This activity was coupled with an informational campaign related to campus waste.
Green Leader Program: The Office of Sustainability hosted a Sustainability retreat at Johnston Wilderness Camp for students involved in sustainability clubs, organizations,
51.22%
15.85% 1.48%
22.27%
6.86%
0.11% 2.20%
Waste Composition FY17
Landfill
Yardwaste/ Compost
Plastics & Tin
Cardboard
Paper
Aluminum
Scrap Metal
Waste Expense Compost ExpenseRecycling Material
ExpenseRecycling Material
Income
US$ -11,535.44 -2,345.24 -221.10 3,450.61
-15,000.00
-10,000.00
-5,000.00
0.00
5,000.00
US
Do
llars
Revenue & Expenses to Dispose Waste by Stream
and leadership at Whitman College. The retreat was an effort to encourage collaboration amongst student organizations and to unify sustainability priorities for the academic year.
Student Organizations: It is the goal of the Office of Sustainability to attend a minimum of one club meeting per semester of all student sustainability clubs and organizations. The Office also works to attend all ASWC Sustainability meetings. Currently the Office is working with the Society of Physics Students to convert a truck into an electronic vehicle for the Zero Waste Program.
Food Week: The Office of Sustainability is currently coordinating with ASWC Sustainability and CCC to put on a week around sustainable foods. This programming will take place in November.
Sustainability Conference: The Office has worked with ASWC to encourage students to attend regional and national sustainability conferences. In May of last year the office took four students to the WAHESC conference at Gonzaga. This year the program will work to take students to a similar joint Washington/Oregon conference at Portland State University WOHESC
Overview of Office of Sustainability Efforts:
Lighting Retrofits: The Office of Sustainability conducted an LED lighting retrofit of Baker Faculty Center. This lighting retrofit is slated to pay itself back in 1.5 years. The Office of Sustainability is working with an intern in the 3/2 program on the analysis of a lighting retrofit of Penrose House. In addition to these smaller retrofits the Office is currently working with Maintenance on proposals for lighting retrofits within Jewett Hall, Reid Campus Center, and Maxey Auditorium. The Office is also conducting a pilot program to assess LED upgrades of campus light poles. It is recommended that an institutional policy/directive address an aggressive phase out of halogens and incandescent lightbulbs. Furthermore, the office recommends a uniform policy on purchasing of lighting supplies in order to centralize objectives and increase efficiency and effectiveness.
LEED Certification: The Office of Sustainability is working closely with our design and construction team on elements of the new Dining Hall and Residence Hall. We are currently going through the design review process on both buildings in order to assess all elements of the construction process in order to meet all LEED requirements and institutional environmental goals. The Office is also providing analysis on certain elements and making recommendations throughout the construction process. Currently the project has adopted low flow water fixtures, 116kW of solar, and an electric vehicle charging station.
Building Sub metering: This summer the building sub metering project for Lyman Hall was placed on hold due to the cost of metering. The Office is currently assessing options and seeking a bid for alternative metering options.
Energy, Water, Waste and Emissions Benchmarking: The Office has constructed a complex yet rudimentary database of all campus utilities and waste in an effort to more accurately measure campus use and expenditures; but also to better assess opportunities for savings. The institution currently operates behind the curve on comprehensive utility management failing to utilize best practices and technology.
Renewable Energy: The Office of Sustainability actively assesses REC pricing trends and opportunities for renewable energy development. The Office has actively applied to two renewable energy development grants. The college was denied both grants due to the age of building roofs and technical limitations of our electricity metering. Currently we are working with other schools within the State of Washington to evaluate best options for the development of rooftop solar and to stay apprised of the ever changing legal landscape related to renewable energy.
Sustainability Advisory Committee:
The committee has rebuilt its full membership including faculty, students, and staff and is holding regular meetings. The committee recommended the adoption of a vehicle idling policy to meet the standards laid out within the Climate Action Plan in May. The committee also voted to generally endorse the ASWC Zero Waste Plan. The committee just received an update on campus sustainability efforts and will begin a focus on components of the Climate Action Plan at its next regular meeting.