Embed Size (px)
Citation preview

December 2013 City of Brawley Local Limits Study
Prepared by LEE & RO, Inc.

Brawley Local Limits Study 2013
LEE & RO, INC. Page i
Table of Contents 1. Introduction ..................................................................................................................... 1
1.1 Background ............................................................................................................... 1
1.2 Scope of Work ........................................................................................................... 1
1.3 Wastewater Treatment and Collection System .......................................................... 2
1.3.1 Brawley WWTP ................................................................................................... 2
1.3.2 Industrial Users ................................................................................................... 7
1.4 Project Methodology .................................................................................................. 8
2. Identification of Pollutants of Concern ............................................................................10
2.1 Introduction ...............................................................................................................10
2.2 Criteria for Potential Pollutants of Concern ...............................................................10
2.2.1 Regulatory Review .............................................................................................10
2.3 Screening .................................................................................................................16
2.3.1 Methodology ......................................................................................................16
2.3.2 Results ...............................................................................................................18
2.3.3 Selection of POCs ..............................................................................................19
3. Flow and Load Analysis ..................................................................................................20
3.1 Introduction ...............................................................................................................20
3.2 Flow Analyses ..........................................................................................................20
3.2.1 Influent Flow.......................................................................................................20
3.2.2 Controlled Flow ..................................................................................................20
3.2.3 Uncontrolled Flow ..............................................................................................21
3.2.4 Summary of Flow ...............................................................................................22
3.3 Load Analyses ..........................................................................................................22
4. Removal Efficiencies ......................................................................................................24
4.1 Introduction ...............................................................................................................24
4.2 Sources of Removal Efficiency Data .........................................................................26
4.3 Selection of Representative Removal Efficiency .......................................................26
5. MAHL Analyses ..............................................................................................................28
5.1 Introduction ...............................................................................................................28
5.2 MAHL Analysis Method ............................................................................................28
5.2.1 Select AHL Equations ........................................................................................28

Brawley Local Limits Study 2013
LEE & RO, INC. Page ii
5.2.2 Calculate AHLs ..................................................................................................29
5.3 MAHL Analysis Results ............................................................................................34
5.4 Comparison of Influent Loadings and MAHLs for the Brawley WWTP ......................34
6. Designating and Implementing Local Limits ....................................................................38
6.1 Introduction ...............................................................................................................38
6.2 Control Strategies for Pollutants ...............................................................................38
6.2.1 MAIL Analyses ...................................................................................................38
6.2.2 Numeric Limits ...................................................................................................41
6.2.3 Slug Discharges .................................................................................................42
7. Collection System-Based Limits .....................................................................................44
7.1 Introduction ...............................................................................................................44
7.2 Fire and Explosions ..................................................................................................44
7.3 Corrosion ..................................................................................................................44
7.4 Flow Obstruction.......................................................................................................45
7.5 Temperature .............................................................................................................45
7.6 Toxic Gases, Vapors and Fumes ..............................................................................45
8. Conclusions and Recommendations ..............................................................................46
9. References .....................................................................................................................50
Brawley Local Limits Study 2013
LEE & RO, INC. Page iii
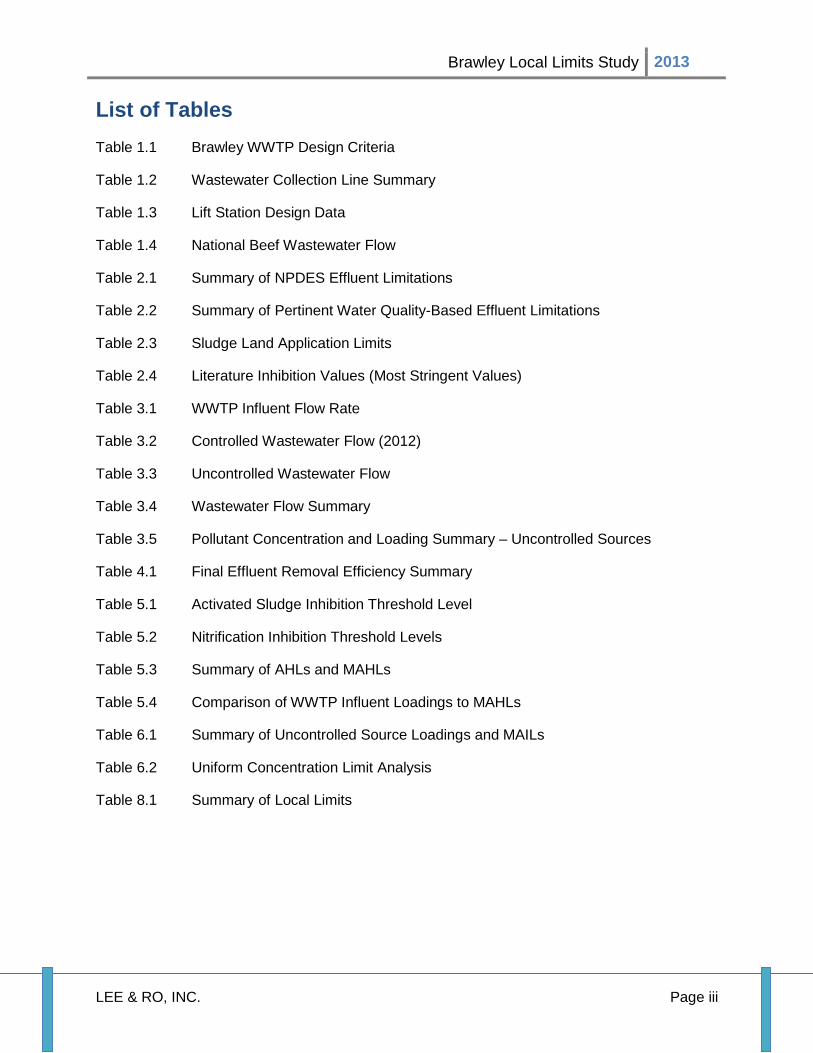
List of Tables Table 1.1 Brawley WWTP Design Criteria
Table 1.2 Wastewater Collection Line Summary
Table 1.3 Lift Station Design Data
Table 1.4 National Beef Wastewater Flow
Table 2.1 Summary of NPDES Effluent Limitations
Table 2.2 Summary of Pertinent Water Quality-Based Effluent Limitations
Table 2.3 Sludge Land Application Limits
Table 2.4 Literature Inhibition Values (Most Stringent Values)
Table 3.1 WWTP Influent Flow Rate
Table 3.2 Controlled Wastewater Flow (2012)
Table 3.3 Uncontrolled Wastewater Flow
Table 3.4 Wastewater Flow Summary
Table 3.5 Pollutant Concentration and Loading Summary – Uncontrolled Sources
Table 4.1 Final Effluent Removal Efficiency Summary
Table 5.1 Activated Sludge Inhibition Threshold Level
Table 5.2 Nitrification Inhibition Threshold Levels
Table 5.3 Summary of AHLs and MAHLs
Table 5.4 Comparison of WWTP Influent Loadings to MAHLs
Table 6.1 Summary of Uncontrolled Source Loadings and MAILs
Table 6.2 Uniform Concentration Limit Analysis
Table 8.1 Summary of Local Limits

Brawley Local Limits Study 2013
LEE & RO, INC. Page iv
List of Figures Figure 1.1 Brawley WWTP Process Flow Diagram
Appendices I. Local Limit Sampling Plan
II. WWTP Influent and Effluent, Sludge, and Priority Pollutants Analysis Data
III. Sample Analyses Data
IV. Flow and Loading Data
V. Removal Efficiency
VI. Allowable Headworks Loading Calculations
VII. MAILs and Local Limits Calculations
VIII. Fume Toxicity

Brawley Local Limits Study 2013
LEE & RO, INC. Page v
Acronyms and Abbreviations ACGIH American Conference of Governmental Industrial Hygienists ADRE Average Daily Removal Efficiency AHL Allowable Headworks Loading BOD5 5-day Biochemical Oxygen Demand CFR Code of Federal Regulations COD Chemical Oxygen Demand CWA Clean Water Act DAF Dissolved Air Floatation gpd Gallons per Day IPP Industrial Pretreatment Program IU(s) Industrial User(s) MAHL(s) Maximum Allowable Headworks Loading(s) MAIL(s) Maximum Allowable Industrial Loading(s) MGD Million Gallons per Day MRE Mean Removal Efficiency NIOSH National Institute for occupational Safety and Health NPDES National Pollutant Discharge Elimination System OSHA Occupational Safety and Health Administration PMH Pioneers Memorial Hospital POC(s) Pollutant(s) of Concern POTW Publicly Owned Treatment Works RWQCB Regional Water Quality Control Board SAF Suspended Air Floatation SIU(s) Significant Industrial User(s) STEL(s) Short-Term Exposure Limit(s) SUO Sewer Use Ordinance TKN Total Kjehldahl Nitrogen TSS Total Suspended Solid TOC Total Organic Carbon TWA-TLV Time-Weighted Average Threshold Limit Value UCL(s) Uniform Concentration Limit(s) USEPA U.S. Environmental Protection Agency UV Ultraviolet VOC Volatile Organic Compound WQBEL(s) Water Quality-Based Effluent Limitation(s) WQS(s) Water Quality Standard(s) WWTP Wastewater Treatment Plant
Brawley Local Limits Study 2013
LEE & RO, INC. Page 1
1. Introduction
1.1 Background
The U.S. Environmental Protection Agency (USEPA) developed the National Pretreatment Program to protect water quality by reducing the level of pollutants discharged by industry and other nondomestic wastewater sources to Publicly Owned Treatment Works (POTWs). The statutory authority for the National Pretreatment Program lies in the Clean Water Act (CWA). Under Section 307(b) of CWA, the USEPA developed the National Pretreatment Program, as a core part of the National Pollutant Discharge Elimination System (NPDES) Pretreatment Standards. The objectives of the Program are to prevent the introduction of pollutants into POTWs that could pass through or interfere with POTW operation, resulting in adverse receiving water quality impacts; to improve opportunities to recycle and reclaim wastewaters and sludge; and to prevent worker health and safety problems. To meet the requirements of the 1977 amendment of the CWA, USEPA promulgated its General Pretreatment Regulations in June 1978 (40 Code of Federal Regulations (CFR) Part 403 – General Pretreatment Regulations for Existing and New Sources of Pollutants). These regulations are used for development and implementation of local and state pretreatment programs.
The General Pretreatment Regulations require that POTWs develop and implement their local limits based on site-specific conditions. POTWs should consider the following factors in developing local limits: POTW treatability; NPDES compliance history; condition of the receiving water body; water quality of the receiving water body; POTW’s retention, use, and disposal of sewage sludge; and worker health and safety concerns.
The City of Brawley must develop an Industrial Pretreatment Program (IPP) as required by the Regional Water Quality Control Board (RWQCB), Colorado River Basin Region, and specified in Section VI.C.5.b of the City’s NPDES Permit No. CA0104523 for the City of Brawley Wastewater Treatment Plant (WWTP). As a prerequisite to implementation of the IPP, the City needs to develop local limits to protect their treatment plant, the sewer system, sludge, and receiving water from potentially harmful pollutants in industrial and commercial discharges. Local limits will enforce the specific and general prohibitions based upon the maximum loading of pollutants that can be accepted by WWTP.
1.2 Scope of Work
The purpose of this Local Limits Study report is to develop and recommend local limits for the City of Brawley in accordance with RWQCB’s requirements and bring the City of Brawley into compliance with their NPDES discharge permit. This report will focus on the identification of pollutants of concern (POCs), flow and load analysis, maximum allowable headworks loadings (MAHL) analysis, and local limits development. Additionally, the City’s current sewer use ordinance (SUO) will be reviewed and updated to incorporate local limits.

Brawley Local Limits Study 2013
LEE & RO, INC. Page 2
1.3 Wastewater Treatment and Collection System
1.3.1 Brawley WWTP
The City of Brawley collects and treats wastewater from approximately 5,400 commercial and residential wastewater accounts. The City owns and operates a wastewater collection system and treatment facility that receives wastewater from the entire city. Significant upgrades of the WWTP were conducted in 2011.
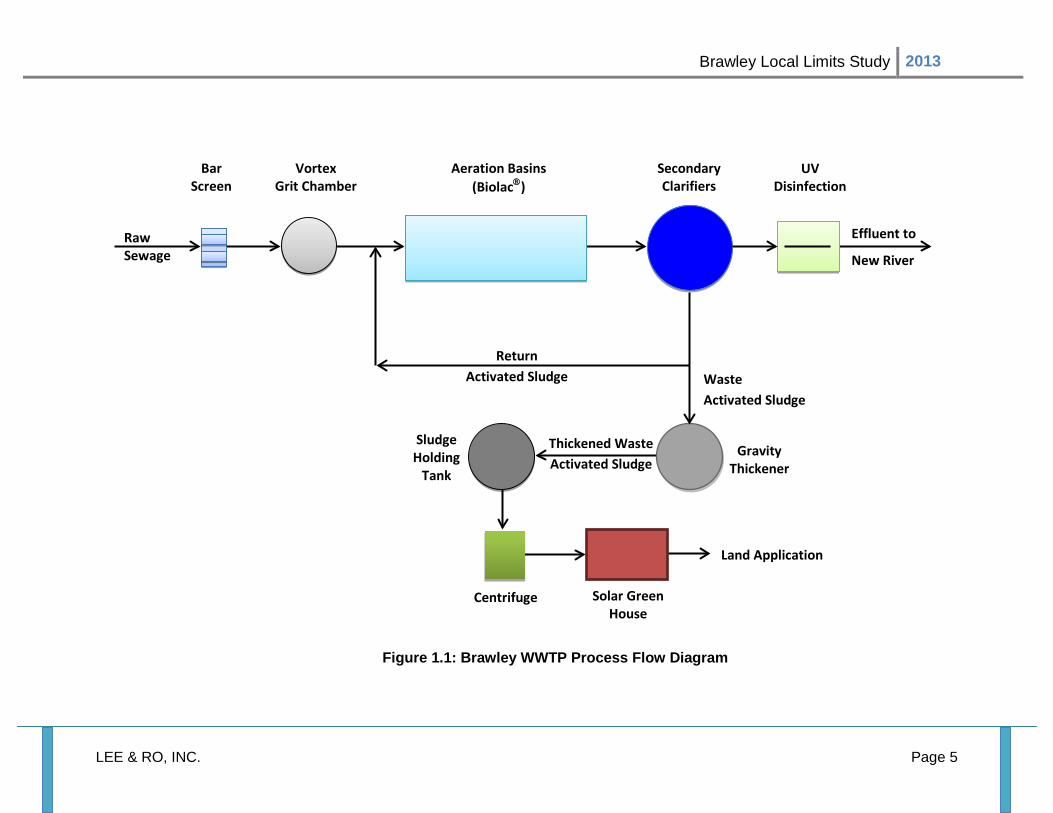
The City’s WWTP provides a full secondary level of wastewater treatment. The facility consists of preliminary screening, three Biolac activated sludge treatment units equipped with diffusers, three secondary clarifiers, and ultraviolet (UV) disinfection. The treated effluent is discharged to the New River. The wasted activated sludge is thickened in a sludge thickening units and dewatered in a centrifuge sludge dewatering unit, and then dried using solar greenhouse sludge drying structures. No primary sludge is produced since the Biolac® process operates without primary treatment. Figure 1.1 presents a process flow diagram of Brawley WWTP, and Table 1.1 summarizes the WWTP design criteria.
The WWTP conducts self-monitoring activities. Influent samples are collected at the headworks before the mechanical bar screen, and effluent samples are collected immediately after UV disinfection and before the effluent weir. All samples are composite samples and are analyzed at either the on-site laboratory or at a contract laboratory.
Brawley’s WWTP design capacity is 5.9 mgd. The average annual flow between 2010 and 2011 was 3.8 mgd. The maximum monthly flow for these periods was 4.5 mgd.
Table 1.1 Brawley WWTP Design Criteria
Description Units Criteria
Preliminary Treatment Bar Screen
Number 1 Capacity mgd 16
Screenings Washer/Compactor Number 1 Capacity mgd 70
Vortex Grit Tank Number 1 Capacity mgd 16
Grit Pump Number 1 Capacity gpm 250
Grit Separator/Washer Number 1

Brawley Local Limits Study 2013
LEE & RO, INC. Page 3
Description Units Criteria
Capacity gpm 250 Activated Sludge Aeration
Number 3 Dimension (top), per basin ft 220 x 180 Dimension (bottom), per basin ft 169 x 129 Water Depth ft 14 Volume, per basin 106 gal 2.9
Aeration Blower Number 4 Capacity, each cfm 2,200 Horsepower, each hp 150
Secondary Clarifiers Number 3 Diameter, each ft 80 Surface Area, each ft2 5,027 Side Water Depth ft 14.85 Return Activated Sludge (RAS) Pump Number 5 (3 duty and 2 standby) Capacity, each gpm 4,950 Horsepower, each hp 25 Waste Activated Sludge (WAS) Pump
Number 2 (1 duty and 1 standby) Capacity, each gpm 250 Horsepower hp/each 3 Gravity Thickener Number 1
Diameter ft 50 Side Water Depth ft 12
Sludge Holding Tank Number 1
Diameter ft 50 Side Water Depth ft 12 Sludge Holding Tank Blower 2 (530 cfm, each)
Centrifuge Sludge Dewatering Number 1
Capacity gpm 200

Brawley Local Limits Study 2013
LEE & RO, INC. Page 4
Description Units Criteria
Solar Green House Number 2
Dimension ft 204 x 42 UV Disinfection Number 1
Capacity mgd 16 Chemical Feed System Ferric Facility 1
Storage Tank 1 (1,000 gallon) Metering Pump 2 (0 – 1.0 gph)
Polymer Facility Storage Tank 1 (1,000 gallon) Metering Pump 4 ( 0.15 – 7.5 gph)
Brawley Local Limits Study 2013
LEE & RO, INC. Page 5
Raw Sewage
Bar Screen
Effluent to
New River
Figure 1.1: Brawley WWTP Process Flow Diagram
Aeration Basins (Biolac)
Secondary Clarifiers
UV Disinfection
Land Application
Gravity Thickener
Centrifuge Solar Green House
Return Activated Sludge
Thickened Waste Activated Sludge
Waste Activated Sludge
Vortex Grit Chamber
Sludge Holding
Tank

Brawley Local Limits Study 2013
LEE & RO, INC. Page 6
The City’s wastewater collection system was established over 70 years ago. The system includes two lift stations, approximately 65 miles of wastewater collection lines ranging from 6 to 30 inches, and 1.5 miles of 10-inch force main. The City’s WWTP serves approximately 5,400 connections. Among these, approximately 4,900 are single and multiple family residential units. The remaining connections are industrial and commercial. Table 1.2 presents a summary of the collection system lines.
Table 1.2 Wastewater Collection Line Summary
Line Size (inches)
Total Length (feet)
6 7,696
8 224,040
10 14,398
12 10,998
14 1,763
15 31,741
18 21,008
21 29,838
30 398
Total Linear Footage 341,880
10-inch force main 7,998
The City’s wastewater collection system is a gravity flow system and generally follows the major drainage features of the service area. The majority of the system is a combined sanitary and storm sewer system. All of the collectors and the force main flow to the City’s WWTP, which ultimately discharges to the New River.
The City operates two lift stations that pump wastewater into nearby gravity sewers. They are the Citrus View Sewage Lift Station No. 2 and the South Brawley Sewage Lift Station No. 1. Table 1.3 lists these lift stations and their rated capacities and design details.

Brawley Local Limits Study 2013
LEE & RO, INC. Page 7
Table 1.3 Lift Station Design Data
Items Unit Citrus View Lift Station No. 2
South Brawley Lift Station No. 1
Wet Well Volume Gallons 3,170 6,830
Number of Pump 2 2
Pump Discharge Flow gpm 200 1,200
Pump Type Constant Speed Constant Speed
1.3.2 Industrial Users
The City of Brawley WWTP receives wastewater from two significant dischargers, National Beef and Pioneers Memorial Hospital. These dischargers discharge wastewater into sewer system at a constant flow. Significant industrial users (SIUs) are defined in 40 CFR 403.4 as follows:
• All users subject to Categorical Pretreatment Standards under 40 CFR 403.6 and 40 CRF chapter I, subchapter N.
• Any other industrial user that: o discharges an average of 25,000 gpd or more of process wastewater to the
WWTP (excluding sanitary, non-contact cooling and boiler blowdown wastewater) o contributes a process waste stream that makes up 5 percent or more of the
average dry weather hydraulic or organic capacity of the WWTP; or o is designated as such by the City, as defined in 40 CFR 403.12(a), on the basis
that the industrial user has a reasonable potential for adversely affecting the WWTP’s operation or for violating any pretreatment standard or requirement.
National Beef (formerly known as Brawley Beef) owns and operates a meat packing facility that processes approximately 2,400 head of cattle per day. The National Beef plant discharges approximately 1.61 mgd of partially treated wastewater from its beef processing and livestock operations. National Beef has an agreement with the City of Brawley which allows it to discharge up to 2.1 mgd of flow to the City’s collection system.
National Beef currently operates a pretreatment facility that was intended to remove a substantial amount of BOD, TSS, ammonia, and oil & grease. The treated wastewater is discharged to the Brawley WWTP. The pretreatment facility consists of the following unit processes:
1) Two Dissolved Air Floatation units (DAF) – Remove fats, grease and suspended solids.
2) One covered anaerobic pond (Pond No. 1) – Hydrolyze fats and protein into simpler organic material with production of methane and carbon dioxide.
3) One aerobic pond (Pond No. 2) – Remove organic material and oxidize ammonia to nitrate.

Brawley Local Limits Study 2013
LEE & RO, INC. Page 8
4) One clarifier at Pond No. 3 inlet – Settle mixed liquor flowing from Pond No. 2 to allow return of solids to Pond No. 2 inlet and wasting of solids to the belt press.
5) One suspended air floatation (SAFTM) flotation cell – Remove solids before discharge to the sanitary sewer.
6) One belt press – Thicken WAS to 20% solids.
Table 1.4 presents the monthly wastewater flow discharged from the National Beef pretreatment facility from January through July 2012.
Table 1.4 Nation Beef Wastewater Flow
Month Wastewater Flow (mgd)
January, 2012 1.68
February, 2012 1.55
March, 2012 1.52
April, 2012 1.66
May, 2012 1.63
June, 2012 1.63
July, 2012 1.63
Monthly Average Flow 1.61
Pioneers Memorial Hospital (PMH) is an acute care facility which has approximately 110 beds. The average water use in PMH is approximately 68,000 gpd. The wastewater flow is estimated using the assumption that 80 percent of water used flows back into City’s sewer system. The wastewater generated in PMH may contain a variety of toxic organic substances such as pharmaceuticals, radionuclides, solvents, and disinfectants for medical purposes.
1.4 Project Methodology
To determine the appropriate local limit implementation procedures, the MAHL is calculated for each pollutant of concern. A MAHL is the estimated maximum loading of a pollutant that can be received at a WWTP’s headworks without causing pass through or interference. An allowable headworks loading (AHL) is the estimated maximum loading of a pollutant that can be received at a WWTP’s headworks that should not cause a WWTP to violate a particular operational restriction or environmental criterion. A pollutant’s MAHL is determined by first calculating its AHL for each environmental criterion. The most stringent AHL is the MAHL. AHLs are developed to prevent interference or pass through.

Brawley Local Limits Study 2013
LEE & RO, INC. Page 9
Developing and implementing local limits using the MAHL approach will be accomplished by the following five steps recommended in 2004 USEPA Local Limits Development Guidance.
1) Determine the Pollutants of Concern (POCs): As a first step, the pollutants to be evaluated to determine the need for local limits will be identified. The known environmental criteria (e.g. NPDES limits, water quality criteria, sludge quality criteria, etc.) will be applied to screening pollutants.
2) Collect and Analyze Data: After identifying the POCs, the data used in MAHL calculations will be collected by sampling and analysis of selected wastewater streams, sludge, commercial and domestic discharge (Refer to Appendix I).
3) Calculate MAHLs for each POC: AHLs for each POC will be calculated based on WWTP removal efficiency and on environmental criteria for pass through and interference. The most stringent AHL will determine the MAHL.
4) Designate and Implement Local Limits: The MAHLs will be compared with the actual and potential loadings for determination of local limits. If needed, appropriate local limits will be developed. The process includes determining the amount of each pollutant that can be allocated to industrial users (IUs), submitting a development package to the Approval Authority for review and approval, incorporating the local limits into local law, and applying the local limits to the IUs.
5) Address Collection System Concerns: Collection system concerns such as fires and explosions, corrosion, flow obstructions, high temperature, and toxic gases, vapor or fumes will be addressed, and limits set as necessary.

Brawley Local Limits Study 2013
LEE & RO, INC. Page 10
2. Identification of Pollutants of Concern
2.1 Introduction
A pollutant of concern (POC) is defined as any pollutant that might reasonably be expected to be discharged to the wastewater treatment plant in sufficient amounts to cause pass through or interfere with the treatment process; cause problems in the collection system; jeopardize its workers; cause operational problems; or exceed the California Water Quality Standard (WQS) or National Pollutant Discharge Elimination System (NPDES) permit effluent limitations. POCs are identified in accordance with 2004 USEPA Local Limits Development Guidance.
2.2 Criteria for Potential Pollutants of Concern
To develop potential POCs, the following regulatory standards were reviewed:
• Brawley WWTP NPDES Permit (2010)
• 40 CFR Part 131, Water Quality Standards; Establishment of Numeric Criteria for
Priority Toxic Pollutants for the State of California (2000)
• Federal Sewage Sludge Standards (1995)
• Process Inhibition Threshold Values for Activated Sludge and Nitrification
• Discharge Screening Levels based on Explosivity and Fume Toxicity (2002)
• OSHA, ACGIH and NIOSH Exposure Levels (2002 and 2003)
2.2.1 Regulatory Review
NPDES Permit
The current NPDES permit for the City of Brawley regulates the treatment plant discharge effluent for flow, BOD5, pH, TSS, oil and grease, total ammonia (as nitrogen), copper (total recoverable), selenium (total recoverable), cyanide, and bis(2-ethylhexyl)phthalate. The effluent limitations for both BOD5 and TSS are 30 mg/L as an average monthly and 45 mg/L as an average weekly. The average monthly percent removal of BOD5 and TSS should be more than 85 percent. The effluent limitation for total ammonia is 2.1 mg/L as a monthly average and 3.2 mg/L as a weekly average. The oil and grease in the effluent must not exceed a daily maximum of 25 mg/L. In addition, the NPDES permit contains limits for copper, selenium, cyanide and bis(2-ethylhexyl)phthalate which are determined by the Water Quality-Based Effluent Limitations (WQBELs) required by Section 301(b) of the CWA and Section 122.44(d). The effluent limitations for copper are 52 μg/L daily maximum and 21 μg/L monthly average. The effluent limitations for selenium are 8.2 μg/L daily maximum and 4.1 μg/L monthly average. The effluent

Brawley Local Limits Study 2013
LEE & RO, INC. Page 11
limitations for cyanide are 9.2 μg/L daily maximum and 3.0 μg/L monthly average. The effluent limitations for bis(2-ethylhexyl)phthalate are 12 μg/L daily maximum and 5.9 μg/L monthly average. Table 2.1 presents current NPDES final effluent limitations expressed as concentration and daily mass limits.
Table 2.1 Summary of NPDES Effluent Limitations
Parameters Effluent Limitations
Units Average Monthly
Average Weekly
Maximum Daily
Instantaneous Minimum
Instantaneous Maximum
Flow mgd 5.9 - - - -
BOD5 at 20oC mg/L 30 45 - - -
lb/day1 1,476 2,214 - - -
TSS mg/L 30 45 - - -
lb/day1 1,476 2,214 - - -
Oil and Grease mg/L - - 25 - -
lb/day1 - - 1,230 - -
pH Standard units - - - 6.0 9.0
Total Ammonia as Nitrogen
mg/L 2.1 - 3.2 - -
lb/day1 103 - 157 - -
Copper, total recoverable
μg/L 21 - 52 - -
lb/day1 1 - 2.6 - -
Selenium, total recoverable
μg/L 4.1 - 8.2 - -
lb/day1 0.20 - 0.40 - -
Cyanide2 μg/L 3.0 - 9.2 - -
lb/day1 0.15 - 0.45 - -
Bis(2-Ethylhexyl)Phthalate
μg/L 5.9 - 12 - -
lb/day1 0.29 - 0.59 - - 1 The mass-based effluent limitations are based on a design capacity of 5.9 mgd. 2 Expressed as free cyanide.

Brawley Local Limits Study 2013
LEE & RO, INC. Page 12
Water Quality-Based Effluent Limitations (WQBELs)
The current NPDES permit does not contain effluent limitations for toxic pollutants other than copper, selenium, cyanide and bis(2-ethylhexyl)phthalate. However, the final effluent quality is governed by the California Surface WQSs and should meet WQBELs applicable to the New River, which is the ultimate discharge point of treatment plant effluent. WQS have been established for protection of freshwater aquatic life, human health, and wildlife. For all parameters that have the reasonable potential to cause or contribute to an excursion above a WQS, numeric WQBELs are established. Table 2.2 summarizes the water quality criteria established for priority pollutants that have been detected in the effluent of the WWTP.
Table 2.2 Summary of Pertinent Water Quality-Based Effluent Limitations
Parameter
Most Stringent Criteria
Fresh Water Human Health for Consumption of
Acute Chronic Organisms Only
μg/L μg/L μg/L μg/L
Arsenic 150 340 150 -
Cadmium 2.2 4.3 2.2 -
Copper 31 52 31 -
Lead 19 477 19 -
Mercury 0.051 - - 0.051
Nickel 169 1,516 169 4,600
Selenium 5 20 5 -
Silver 44 44 - -
Zinc 388 388 388 -
Bis(2-Ethylhexyl)Phtalate 5.9 - - 5.9
Reference: Brawley NPDES Permit, Attachment F, Table F-10 and California CTR (2000)
Sludge Quality Standards
The sludge generated at the Brawley WWTP will be hauled off by a private contractor and applied to farmland or applied by the City on parks and public green areas in the future. The sludge quality standards for land application are established by federal sludge regulations (40 CFR Part 503, Standards for the Use or Disposal of Sewage Sludge), as presented in Table 2.3. Each state can establish its own sludge use and disposal standards as long as they are at least as stringent or are as protective as the federal requirement. USEPA recommends that the wastewater treatment facility consider the attainment of the “Clean Sludge” standards from 40 CFR 503, and that achievement of these standards is consistent with the objectives of the National Pretreatment Program.

Brawley Local Limits Study 2013
LEE & RO, INC. Page 13
Table 2.3 Sludge Land Application Limits
Pollutant Ceiling
Concentration
Monthly Average Pollutant
Concentration (Clean Sludge)
Cumulative Pollutant
Loading Rate
Annual Pollutant Loading Rate
mg/kg mg/kg kg/hectare kg/hectare/365 days
Arsenic 75 41 41 2
Cadmium 85 39 39 1.9
Copper 4,300 1,500 1,500 75
Lead 840 300 300 15
Mercury 57 17 17 0.85
Molybdenum 75 - - -
Nickel 420 420 420 21
Selenium 100 100 100 5
Zinc 7,500 2,800 2,800 140
Process Inhibition Criteria
In addition to pollutants with NPDES effluent limitations, USEPA recommends that a WWTP consider pollutants that may interfere with POTW operation to be potential POCs. The Brawley WWTP operates an extended aeration activated sludge process (i.e. Biolac) to remove organics, solids, and ammonia (i.e. nitrification) in the wastewater. Inhibition threshold levels for activated sludge, and nitrification were obtained from 2004 USEPA Local Limits Development Guidance. Table 2.4 summarizes inhibition threshold levels.

Brawley Local Limits Study 2013
LEE & RO, INC. Page 14
Table 2.4 Literature Inhibition Values (Most Stringent Values)
Pollutants Activated Sludge
Inhibition Threshold (mg/L)
Nitrification Inhibition Threshold
(mg/L)
Metal/Nonmetal Inorganics
Ammonia 480 -
Arsenic 0.1 1.5
Cadmium 1 - 10 5.2
Chloride - 180
Chromium (VI) 1 1 - 10
Chromium (III) 10 - 50 -
Chromium (Total) 1 - 100 0.25 - 1.9
Copper 1 0.05 - 0.48
Cyanide 0.1 - 5 0.34 - 0.5
Iodine 10 -
Lead 1 - 5 0.5
Mercury 0.1 - 1 -
Nickel 1.0 - 2.5 0.25 - 0.5
Silver - -
Sulfate - -
Sulfide 25 - 30 -
Zinc 0.3 - 5 0.08-0.5
Organics
Acrylonitrile - -
Anthracene 500 -
Benzene 100 - 500 -
Carbon Tetrachloride - -
Chlorobenzene - -
Chloroform - 10
2-Chlorophenol 5 -

Brawley Local Limits Study 2013
LEE & RO, INC. Page 15
Pollutants Activated Sludge
Inhibition Threshold (mg/L)
Nitrification Inhibition Threshold
(mg/L)
1,2 Dichlorobenzene 5 -
1,3 Dichlorobenzene 5 -
1,4 Dichlorobenzene 5 -
2,4 Dichlorophenol 64 64
2,4 Dimethylphenol 40 - 200 -
2,4 Dinitrophenol - 150
2,4 Dinitrotoluene 5 -
2,4 Diphenylhydrazine 5 -
Ethylbenzene 200 -
Hexachlorobenzene 5 -
Methylchloride - -
Naphthalene 500 -
Nitrobenzene 30 - 500 -
Pentachlorophenol 0.95 -
Phenanthrene 500 -
Phenol 50 - 200 4
Tetrachloroethylene - -
Toluene 200 -
Trichloroethylene - -
2,4,6 Trichlorophenol 50 - 100 -
Surfactants 100 - 500 -

Brawley Local Limits Study 2013
LEE & RO, INC. Page 16
Collection System Criteria
Explosive and flammable pollutants discharged to the WWTP can accumulate and threaten the collection system, as well as the health and safety of plant workers. Therefore, local limits should regulate the discharge of these pollutants. In the 2004 USEPA Local Limits Development Guidance, Appendix I, discharge screening levels for explosivity and fume toxicity are evaluated.
The fume toxicity of pollutants discharged to the WWTP can cause an adverse health effect when the plant worker is exposed to these pollutants. The time-weighted average threshold limit value (TWA-TLV) and short-term exposure limits (STELs) for gases that pose the threat of acute or chronic health effects in people can be found in the 2004 USEPA Local Limits Development Guidance, Appendix I.
Volatile organic compound (VOC) vapors can be toxic and carcinogenic, and may produce acute and chronic health effects when plant workers are exposed to these VOC vapors. Also, acidic discharges can combine with nonvolatile substances which then produce toxic gases and vapors (e.g. sulfide and cyanide to hydrogen sulfide and hydrogen cyanide). To respond to this, local limits based on the maximum recommended levels of these POCs should be established. A list of pollutants and the NIOSH, OSHA, and ACGIH guidelines and exposure levels can be found in 2004 USEPA Local Limits Development Guidance, Appendix J.
2.3 Screening
A POC is any pollutant that might be expected to be discharged to the sewer system in sufficient amounts to pass through or interfere with the treatment works, contaminate sludge, cause problems in the collection system, or jeopardize workers. Screening of potential POCs is in accordance with USEPA guidelines and all pollutants categorized as POCs will be used for determination of local limits.
2.3.1 Methodology
To identify POCs, various types of pollutant information were reviewed. Most of the data provided by the City for review were readily available from monitoring data collected by the City for regulatory compliance. The following data were compiled and reviewed to identify the pollutants that should be evaluated to determine the need for local limits:
• Monthly WWTP influent and effluent concentration data for 2010 and 2011 • Yearly sludge monitoring data for 2011 and 2012 • Yearly priority pollutants analysis data (effluent and receiving water) for 2010 and 2011
The summary of monthly WWTP influent and effluent, yearly sludge monitoring data and yearly priority pollutants analysis data is presented in Appendix II.

Brawley Local Limits Study 2013
LEE & RO, INC. Page 17
The data were also reviewed to ensure that the influent and/or effluent priority pollutant scans contained the following pollutants:
• Toxic pollutants designated in the NPDES permit and/or State WQSs that apply to the WWTP effluent or receiving water stream segment (i.e. New River)
• Organic toxic pollutants and toxic metals listed in 40 CFR Part 122, Appendix D, Table II and Table III
• Any toxic pollutants and hazardous substances required to be identified by existing dischargers if expected to be present, as listed in 40 CFR Part 122, Appendix D, Table V
• Any pollutants that are present and may cause a potential impact to the collection system, treatment works, worker health and safety or air quality
• Any pollutants that may impact treatment performance (i.e. process inhibition criteria) • Any pollutants in sludge listed in 40 CFR 503 Standards for the Use or Disposal of
Sewage Sludge. • Any pollutants that are recommended by the Regional Water Quality Control Board
(RWQCB)
USEPA recommends that the POTW conduct screening for any pollutant found in the priority pollutant scans of influent, effluent, or sludge to determine whether the pollutant should be listed as a POC. Although a pollutant is considered as a potential POC, the POTW may determine, based on the pollutant’s concentration and on other data from industrial users and commercial dischargers, that the pollutant need not be selected as a POC for the full headworks analysis.
The USEPA provides guidance for identifying POCs, which is described in 2004 USEPA Local Limits Development Guidance. A pollutant is considered a potential POC if it meets any of the following screening criteria.
1) A pollutant is on USEPA’s list of 15 pollutants that a WWTP should assume to be of concern.
2) A pollutant has a pre-existing local limit.
3) A pollutant is limited by a permit or applicable environmental criteria.
4) A pollutant has caused operational problems in the past.
5) A pollutant has important implications for the protection of the treatment works, collection system, or the health and safety of WWTP workers.
The POCs were examined by evaluating industrial discharge, influent, effluent, and sludge concentrations for regulatory compliance. Using the screening criteria above, 19 POCs were identified, as described in the following section.

Brawley Local Limits Study 2013
LEE & RO, INC. Page 18
2.3.2 Results
1) National POCs
The USEPA has identified 15 pollutants often found in WWTP sludge and effluent that it considers potential POCs. The following are national POCs listed in 2004 USEPA Local Limits Development Guidance.
10 Original POCs 5 New POCs
○ Arsenic ○ Cadmium ○ Molybdenum ○ Chromium ○ Copper ○ Selenium ○ Cyanide ○ Lead ○ BOD5 ○ Mercury ○ Nickel ○ TSS ○ Silver ○ Zinc ○ Ammonia
The USEPA recommends that each WWTP, at a minimum, screen for the presence of the 15 national pollutants using data on industrial user discharges and collected from samples of WWTP influent, effluent, and sludge.
All 15 pollutants were detected one or more times in the industrial discharge, influent, effluent, and/or sludge samples from 2010 through 2011 and will be carried forward for determination of local limits.
2) Pre-existing Local Limits
In 2005, the City of Brawley established local limits for the various pollutants in the City’s SUO (Section 22.18). However, these limits were based on instantaneous maximum concentration. Limits based on daily maximum concentration or on monthly average concentration were not established for pollutants. In this report, new limits for pollutants will be evaluated and established based on daily maximum and/or monthly average concentration.
3) Pollutants Limited by Permit or Other Environmental Criteria
The Brawley NPDES permit contains effluent limitations for BOD5, TSS, oil and grease, ammonia, copper, selenium, cyanide, and bis(2-ethylhexyl)phthalate. BOD5, TSS, ammonia, copper, selenium, and cyanide are national POCs and therefore already included. From local limits sampling analysis data conducted in August 2012, Bis(2-ethylhexyl)phthalate was detected in industrial discharge (i.e. National Beef pretreated wastewater discharge), WWTP influent and effluent, or sludge samples. The average concentration was ranged from 0.05 mg/L to 0.16 mg/L. Therefore, bis(2-ethylhexyl)phthalate was included in potential POCs.
California WQSs have been established for several pollutants that have been detected in the plant influent or effluent. Table 2.2 summarized WQS for specific pollutants which were detected in WWTP effluent monitoring data. Most of pollutants except bis(2-ethylhexyl)phthalate

Brawley Local Limits Study 2013
LEE & RO, INC. Page 19
are already included in national POCs. Bis(2-ethylhexyl)phthalate will be included in potential POCs.
○ Bis(2-ethylhexyl)phthalate
4) Sludge Quality Standards
Pollutants regulated by 40 CFR 503 include arsenic, cadmium, copper, lead, mercury, nickel, selenium, and zinc. All of these pollutants are national POCs and have already been selected to be analyzed for local limits.
5) Process Inhibition Criteria
All metal and organic compounds detected in recent plant monitoring have been selected as POCs. The threshold inhibition concentrations of these pollutants will be used to develop AHLs based on inhibition criteria.
6) Collection System Criteria
Collection system criteria, including those to protect worker health and safety, are not amenable to MAHL analyses. Collection system-based limits are discussed in Chapter 7.
7) Operational Considerations
Because of its potential to cause obstructions of the flow in the collection system, oil and grease was included as a POC.
2.3.3 Selection of POCs
Based on the pollutant screening analysis, the following 18 pollutants were identified as potential POCs and selected for further evaluation.
○ Arsenic
○ Cadmium
○ Chromium
○ Copper
○ Cyanide (total)
○ Cyanide (free)
○ Lead
○ Mercury
○ Molybdenum
○ Nickel
○ Selenium
○ Silver
○ Zinc
○ BOD5
○ TSS
○ Ammonia
○ Bis(2-ethylhexyl)phthalate
○ Oil and Grease

Brawley Local Limits Study 2013
LEE & RO, INC. Page 20
3. Flow and Load Analysis
3.1 Introduction
This section will discuss the flow and loading evaluation to determinate the pollutant load distribution by residential, commercial, and industrial dischargers. Current wastewater flow and loading were estimated from the last two years of water consumption data and WWTP influent flow data (2009 Wastewater Rate Study, and 2010 to 2011NPDES monthly monitoring reports).
3.2 Flow Analyses
3.2.1 Influent Flow
Brawley WWTP influent flow has been determined from measurement of the total wastewater flow into the treatment works. The measurement of wastewater flow includes all sources: residential, commercial, and industrial. Hauled waste is not allowed into the Brawley WWTP. Table 3.1 presents the total wastewater flow at Brawley WWTP.
Table 3.1 WWTP Influent Flow Rate
Year Average
Daily Flow Max Daily Flow
(mgd) (mgd)
2010 3.9 4.2
2011 3.5 3.8
3.2.2 Controlled Flow
The controlled flow includes industrial dischargers, hauled waste, and specific commercial users that the POTW intends to regulate with numerical local limits. As discussed earlier, hauled waste is not allowed into the WWTP and there are no commercial users discharging high-strength wastewater to the collection system except small auto shop and radiator repair shop. Therefore, the wastewater flow generated by industrial users is considered the controlled flow.
The City’s current water billing system identifies customers by categories so that accounts can be classified by use class and used to identify each customer by sector and usage category. According to the City’s water billing system, there is one industrial water user in Brawley. The only industrial user is a meat processing company, National Beef. National Beef discharges approximately 1.61 mgd of the meat process wastewater to the WWTP and has an agreement with the City to discharge up to 2.1 mgd. Another discharger, Pioneers Memorial Hospital, can

Brawley Local Limits Study 2013
LEE & RO, INC. Page 21
be classified as a significant discharger due to its wastewater flow and characteristics. The estimated wastewater flow is approximated 95,000 gpd and may contain toxic organic substances. Table 3.2 summarizes the estimated wastewater flow from the two major dischargers.
Table 3.2 Controlled Wastewater Flow (2012)
Dischargers Estimated
Wastewater Flow
(gpd)
National Beef 1,614,000
Pioneers Memorial Hospital 95,000 1
Total 1,709,000
(= 1.71 mgd)
3.2.3 Uncontrolled Flow
Uncontrolled flow includes the flow from sources that the POTW does not control, such as residential sources, commercial sites, infiltration and inflow, storm water, and waste haulers. Although Brawley has a combined storm water and sewer pipe system, only a very small amount of storm flow is expected to flow into WWTP due to rare rainfall events. Waste haulers are not allowed to dispose waste at the Brawley WWTP.
The uncontrolled flows from residential (single family and multi-family), commercial, and other institutional/governmental sources are approximately 2.09 mgd. The estimated wastewater flow for each discharger category was calculated from total uncontrolled flow (i.e. 2.09 mgd) by multiplying percentage of discharger wastewater flow indicated in City’s sewer rate study (2009). Table 3.3 presents estimated wastewater by uncontrolled flow dischargers.
Table 3.3 Uncontrolled Wastewater Flow
Dischargers Estimated
Wastewater Flow
(mgd)
Single Family 1.22
Multi Family 0.63
Commercial 0.20
Institutional/governmental 0.04
Total 2.09
Brawley Local Limits Study 2013
LEE & RO, INC. Page 22
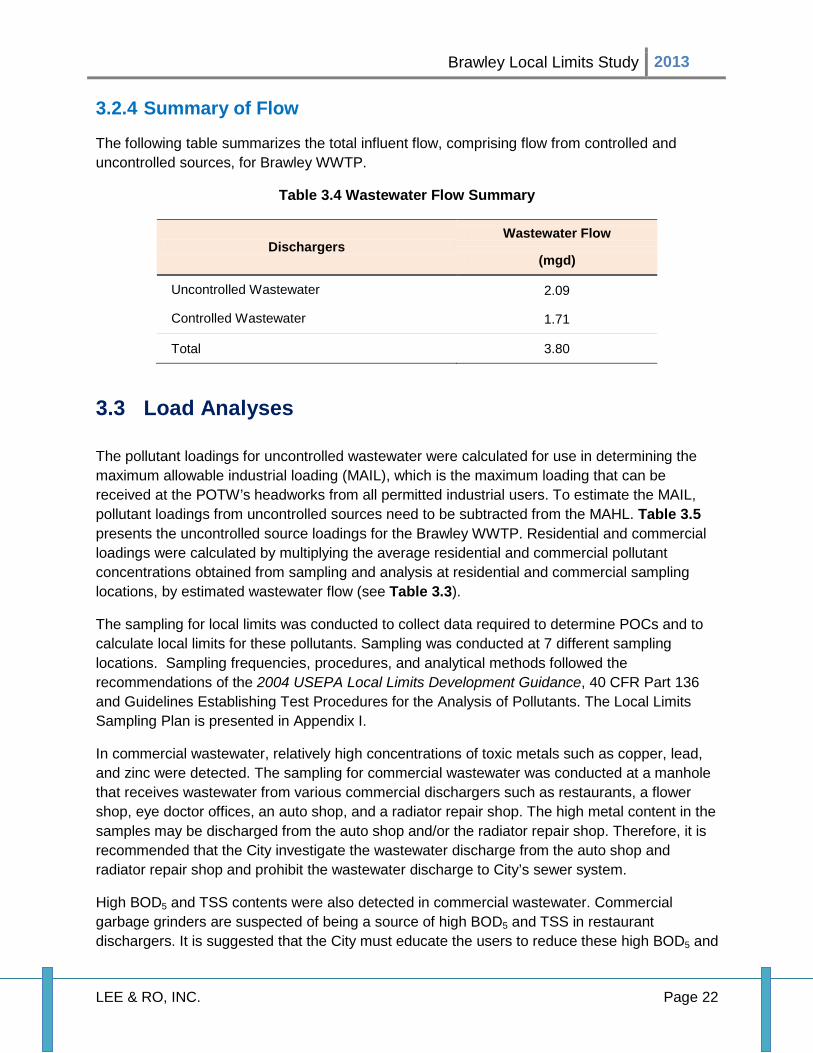
3.2.4 Summary of Flow
The following table summarizes the total influent flow, comprising flow from controlled and uncontrolled sources, for Brawley WWTP.
Table 3.4 Wastewater Flow Summary
Dischargers Wastewater Flow
(mgd)
Uncontrolled Wastewater 2.09
Controlled Wastewater 1.71
Total 3.80
3.3 Load Analyses
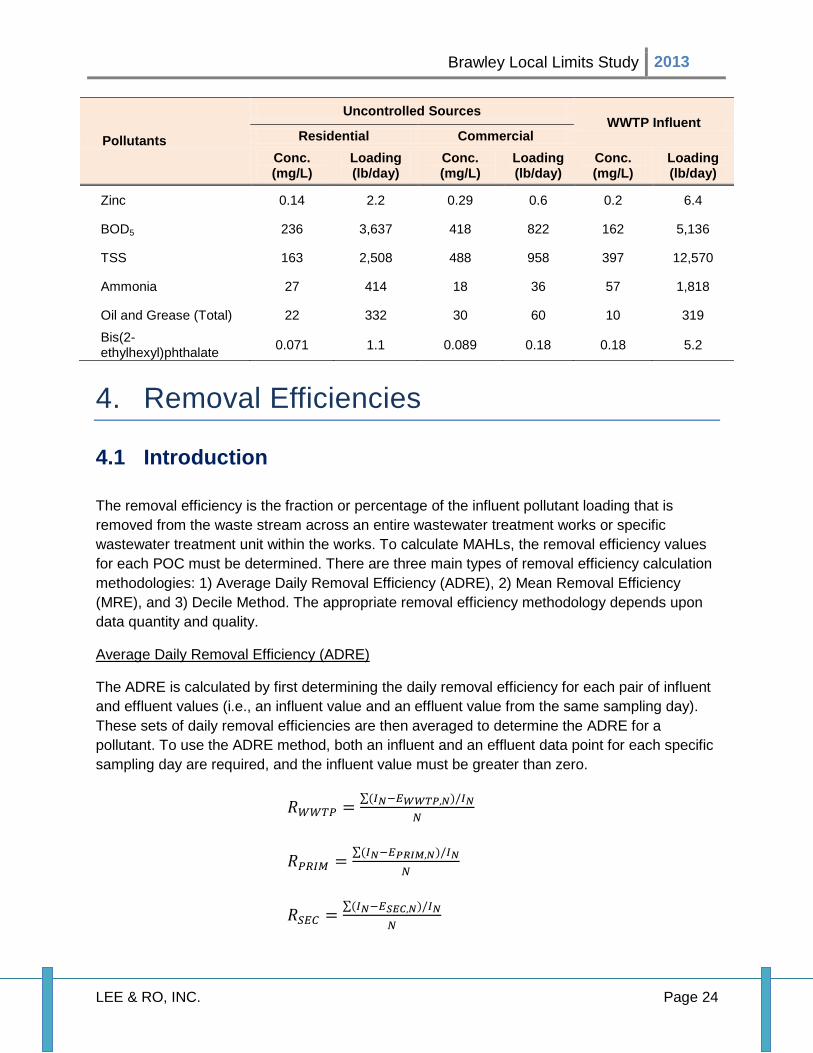
The pollutant loadings for uncontrolled wastewater were calculated for use in determining the maximum allowable industrial loading (MAIL), which is the maximum loading that can be received at the POTW’s headworks from all permitted industrial users. To estimate the MAIL, pollutant loadings from uncontrolled sources need to be subtracted from the MAHL. Table 3.5 presents the uncontrolled source loadings for the Brawley WWTP. Residential and commercial loadings were calculated by multiplying the average residential and commercial pollutant concentrations obtained from sampling and analysis at residential and commercial sampling locations, by estimated wastewater flow (see Table 3.3).
The sampling for local limits was conducted to collect data required to determine POCs and to calculate local limits for these pollutants. Sampling was conducted at 7 different sampling locations. Sampling frequencies, procedures, and analytical methods followed the recommendations of the 2004 USEPA Local Limits Development Guidance, 40 CFR Part 136 and Guidelines Establishing Test Procedures for the Analysis of Pollutants. The Local Limits Sampling Plan is presented in Appendix I.
In commercial wastewater, relatively high concentrations of toxic metals such as copper, lead, and zinc were detected. The sampling for commercial wastewater was conducted at a manhole that receives wastewater from various commercial dischargers such as restaurants, a flower shop, eye doctor offices, an auto shop, and a radiator repair shop. The high metal content in the samples may be discharged from the auto shop and/or the radiator repair shop. Therefore, it is recommended that the City investigate the wastewater discharge from the auto shop and radiator repair shop and prohibit the wastewater discharge to City’s sewer system.
High BOD5 and TSS contents were also detected in commercial wastewater. Commercial garbage grinders are suspected of being a source of high BOD5 and TSS in restaurant dischargers. It is suggested that the City must educate the users to reduce these high BOD5 and

Brawley Local Limits Study 2013
LEE & RO, INC. Page 23
TSS loadings not flowing into existing sewer system. The City may also elect to prohibit the use of commercial garbage grinders.
WWTP influent loadings are also presented in Table 3.5. WWTP influent loadings will be compared to the MAHL for each POC in order to determine the need for local limits. When the average influent loading of pollutants exceeds 60 percent of the MAHL or when the maximum daily influent loading of pollutants exceeds 80 percent of the MAHL, local limits are needed. The detail will be discussed in Chapter 5.
The concentrations of BOD and TSS in some of the commercial samples taken on 8/4/2012, 8/6/2012 and 8/7/2012 were unusually high. These samples skewed the TSS and BOD results for the commercial sources. In calculating the pollutant concentration and loading summary in Table 3.5 below, the BOD for commercial sources for the days 8/4/2012 and 8/7/2012 was disregarded, since the sample values were 2-3 times the average. The TSS samples for 8/4, 8/6 and 8/7/2012 were also disregarded since they were more than three times the average and are not considered typical. Upon correction of the commercial BOD and TSS concentrations and loads, the calculated headworks loads for the treatment plant based on contributions from the various sources were within 10% of the measured plant influent concentrations. The data for the residential sources was more consistent and was used directly.
Table 3.5 Pollutant Concentration and Loading Summary – Uncontrolled Sources
Pollutants
Uncontrolled Sources WWTP Influent
Residential Commercial Conc. (mg/L)
Loading (lb/day)
Conc. (mg/L)
Loading (lb/day)
Conc. (mg/L)
Loading (lb/day)
Arsenic ND - ND - ND -
Cadmium 0.001 0.015 0.0008 0.0016 ND -
Chromium 0.0042 0.065 0.0077 0.015 0.0047 0.15
Copper 0.09 1.4 0.29 0.57 0.065 2
Cyanide (total) ND - ND - ND -
Cyanide (free) ND - ND - ND -
Lead 0.001 0.016 0.34 0.66 0.0039 0.12
Mercury ND - 0.00028 0.0006 ND -
Molybdenum 0.0056 0.087 0.011 0.021 0.02 0.63
Nickel 0.0043 0.067 0.008 0.017 0.0078 0.25
Selenium ND - ND - ND -
Silver 0.00055 0.0085 0.003 0.006 ND -
Brawley Local Limits Study 2013
LEE & RO, INC. Page 24
Pollutants
Uncontrolled Sources WWTP Influent
Residential Commercial Conc. (mg/L)
Loading (lb/day)
Conc. (mg/L)
Loading (lb/day)
Conc. (mg/L)
Loading (lb/day)
Zinc 0.14 2.2 0.29 0.6 0.2 6.4
BOD5 236 3,637 418 822 162 5,136
TSS 163 2,508 488 958 397 12,570
Ammonia 27 414 18 36 57 1,818
Oil and Grease (Total) 22 332 30 60 10 319 Bis(2-ethylhexyl)phthalate 0.071 1.1 0.089 0.18 0.18 5.2
4. Removal Efficiencies
4.1 Introduction
The removal efficiency is the fraction or percentage of the influent pollutant loading that is removed from the waste stream across an entire wastewater treatment works or specific wastewater treatment unit within the works. To calculate MAHLs, the removal efficiency values for each POC must be determined. There are three main types of removal efficiency calculation methodologies: 1) Average Daily Removal Efficiency (ADRE), 2) Mean Removal Efficiency (MRE), and 3) Decile Method. The appropriate removal efficiency methodology depends upon data quantity and quality.
Average Daily Removal Efficiency (ADRE)
The ADRE is calculated by first determining the daily removal efficiency for each pair of influent and effluent values (i.e., an influent value and an effluent value from the same sampling day). These sets of daily removal efficiencies are then averaged to determine the ADRE for a pollutant. To use the ADRE method, both an influent and an effluent data point for each specific sampling day are required, and the influent value must be greater than zero.
𝑅𝑊𝑊𝑇𝑃 = ∑(𝐼𝑁−𝐸𝑊𝑊𝑇𝑃,𝑁)/𝐼𝑁𝑁
𝑅𝑃𝑅𝐼𝑀 = ∑(𝐼𝑁−𝐸𝑃𝑅𝐼𝑀,𝑁)/𝐼𝑁𝑁
𝑅𝑆𝐸𝐶 = ∑(𝐼𝑁−𝐸𝑆𝐸𝐶,𝑁)/𝐼𝑁𝑁
Brawley Local Limits Study 2013
LEE & RO, INC. Page 25
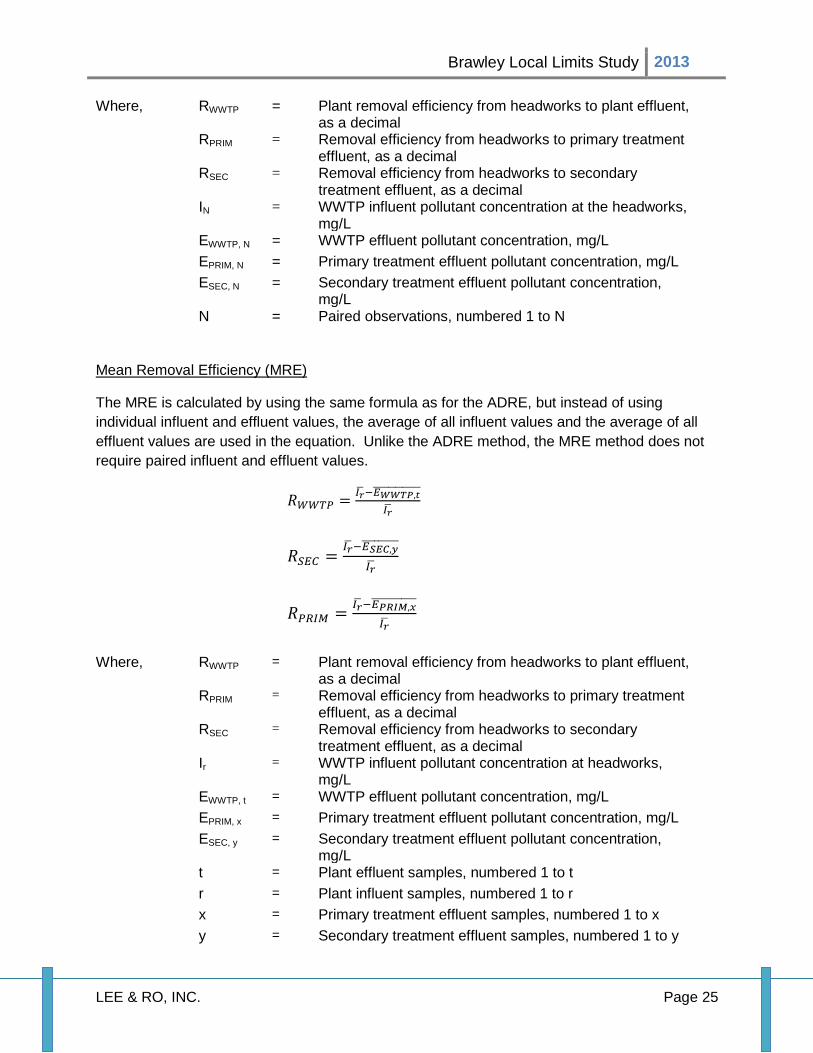
Where, RWWTP = Plant removal efficiency from headworks to plant effluent, as a decimal
RPRIM = Removal efficiency from headworks to primary treatment effluent, as a decimal
RSEC = Removal efficiency from headworks to secondary treatment effluent, as a decimal
IN = WWTP influent pollutant concentration at the headworks, mg/L
EWWTP, N = WWTP effluent pollutant concentration, mg/L EPRIM, N = Primary treatment effluent pollutant concentration, mg/L ESEC, N = Secondary treatment effluent pollutant concentration,
mg/L N = Paired observations, numbered 1 to N
Mean Removal Efficiency (MRE)
The MRE is calculated by using the same formula as for the ADRE, but instead of using individual influent and effluent values, the average of all influent values and the average of all effluent values are used in the equation. Unlike the ADRE method, the MRE method does not require paired influent and effluent values.
𝑅𝑊𝑊𝑇𝑃 = 𝐼𝑟�−𝐸𝑊𝑊𝑇𝑃,𝑡�������������
𝐼𝑟�
𝑅𝑆𝐸𝐶 = 𝐼𝑟�−𝐸𝑆𝐸𝐶,𝑦���������
𝐼𝑟�
𝑅𝑃𝑅𝐼𝑀 = 𝐼𝑟�−𝐸𝑃𝑅𝐼𝑀,𝑥������������
𝐼𝑟�
Where, RWWTP = Plant removal efficiency from headworks to plant effluent, as a decimal
RPRIM = Removal efficiency from headworks to primary treatment effluent, as a decimal
RSEC = Removal efficiency from headworks to secondary treatment effluent, as a decimal
Ir = WWTP influent pollutant concentration at headworks, mg/L
EWWTP, t = WWTP effluent pollutant concentration, mg/L EPRIM, x = Primary treatment effluent pollutant concentration, mg/L ESEC, y = Secondary treatment effluent pollutant concentration,
mg/L t = Plant effluent samples, numbered 1 to t r = Plant influent samples, numbered 1 to r x = Primary treatment effluent samples, numbered 1 to x y = Secondary treatment effluent samples, numbered 1 to y

Brawley Local Limits Study 2013
LEE & RO, INC. Page 26
Decile Method
Unlike the above methods, the decile method considers how often the actual daily removal efficiency will be above or below a specified removal rate. The decile method requires at least nine daily removal efficiency values based on paired sets of influent and effluent data. By sorting daily removal efficiency from highest to lowest, it calculates the percentage of the daily removal efficiency. The decile method is similar to a data set median but it divides the ordered data set into 10 equal parts. 10 percent of the data set is below the first decile; 20 percent of the data is below the second decile, etc. The fifth decile is equivalent to the data set medium. The USEPA recommends using the seventh decile removal for calculating sludge quality-based AHLs and third decile removal for calculating water quality-based AHLs.
4.2 Sources of Removal Efficiency Data
Sample analysis data for influent and final effluent were utilized to calculate site-specific removal efficiencies using the mean removal efficiency (MRE) methodology. For pollutants that were detected in influent but not in the effluent, ½ of the value of the method detection level was substituted for effluent results reported as non-detected. In the absence of sufficient site-specific performance data for certain pollutants, removal efficiencies reported by USEPA (i.e. 2004 USEPA Local Limits Development Guidance, Appendix R) were used. These literature values represent median removal efficiencies from a database of 40 wastewater treatment plants. Removal efficiency calculations for POCs are shown in Appendix V.
4.3 Selection of Representative Removal Efficiency
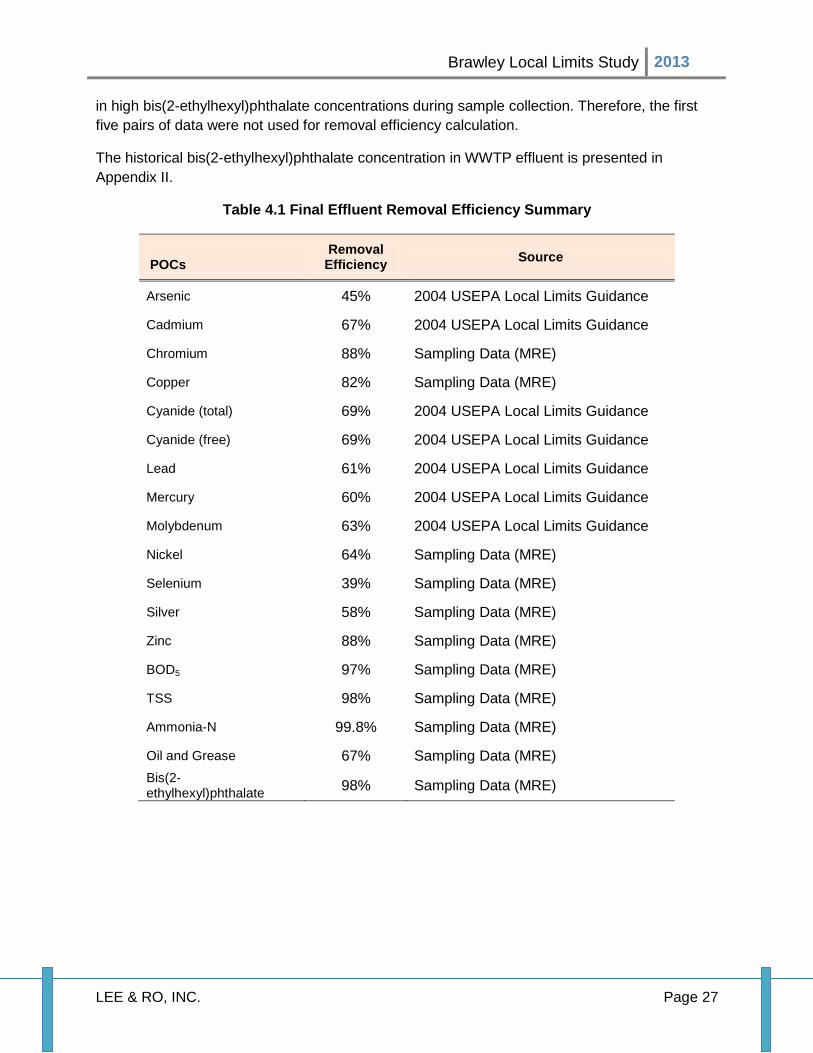
The removal efficiencies for each pollutant are included in the following Table 4.1. Because the Brawley WWTP consists of the Biolac activated sludge process without a separate primary treatment process, the primary removal efficiency was not applied to calculate AHLs based on process inhibition (i.e. nitrification and activated sludge). The final effluent removal efficiency was applied to AHLs calculations based on NPDES permit limits and sludge quality standards.
Where possible, removal efficiencies for the POCs were calculated from site-specific data. Removal efficiencies for arsenic, cadmium, cyanide (total and free), lead, mercury, and molybdenum, which had insufficient data to calculate site-specific values, were cited from 2004 USEPA Local Limits Development Guidance.
In addition to sample analysis data of bis(2-ethylhexyl)phthalate, 2011 - 2012 monthly WWTP effluent concentration data were reviewed for removal efficiency calculation. During local limits sampling, the WWTP effluent concentration of bis(2-ethylhexyl)phthalate showed much higher levels than the composite sample data of the 2011 - 2012 WWTP effluent monitoring data. This might be that the sample contacted plastic tubing, gloves or other PVC based material resulting
Brawley Local Limits Study 2013
LEE & RO, INC. Page 27
in high bis(2-ethylhexyl)phthalate concentrations during sample collection. Therefore, the first five pairs of data were not used for removal efficiency calculation.
The historical bis(2-ethylhexyl)phthalate concentration in WWTP effluent is presented in Appendix II.
Table 4.1 Final Effluent Removal Efficiency Summary
POCs
Removal Efficiency Source
Arsenic 45% 2004 USEPA Local Limits Guidance
Cadmium 67% 2004 USEPA Local Limits Guidance
Chromium 88% Sampling Data (MRE)
Copper 82% Sampling Data (MRE)
Cyanide (total) 69% 2004 USEPA Local Limits Guidance
Cyanide (free) 69% 2004 USEPA Local Limits Guidance
Lead 61% 2004 USEPA Local Limits Guidance
Mercury 60% 2004 USEPA Local Limits Guidance
Molybdenum 63% 2004 USEPA Local Limits Guidance
Nickel 64% Sampling Data (MRE)
Selenium 39% Sampling Data (MRE)
Silver 58% Sampling Data (MRE)
Zinc 88% Sampling Data (MRE)
BOD5 97% Sampling Data (MRE)
TSS 98% Sampling Data (MRE)
Ammonia-N 99.8% Sampling Data (MRE)
Oil and Grease 67% Sampling Data (MRE) Bis(2-ethylhexyl)phthalate 98% Sampling Data (MRE)

Brawley Local Limits Study 2013
LEE & RO, INC. Page 28
5. MAHL Analyses
5.1 Introduction
The MAHL is an estimate of the upper limit of pollutant loading to a WWTP and is intended to prevent pass through or interference. The MAHL is the maximum pollutant load in pounds per day that the WWTP can receive without exceeding regulatory criteria or experiencing plant operation upset. The MAHL analysis for a single POC is basically calculated in following three steps:
• Determine WWTP removal efficiency for the POC (Section 4)
• Calculate the allowable headworks loading (AHL) for each environmental criterion
(Section 5)
• Designate as the MAHL the most stringent AHL for the POC (Section 5)
5.2 MAHL Analysis Method
5.2.1 Select AHL Equations
An AHL is the estimated maximum loading of a pollutant that can be received at the WWTP headworks. The maximum loading of a pollutant should not cause violation of WWTP discharge limits or other environmental criteria. An AHL is calculated for each applicable criterion: water quality, sludge quality, and the various forms of interference. The AHLs for each POC are calculated based on the applicable environmental criteria, plant flow rates, and plant removal efficiencies. After calculating a series of AHLs for each POC, the lowest AHL is typically chosen as the MAHL.
AHLs were calculated based on the following applicable criteria:
• Brawley WWTP NPDES Permit (No. CA0104523, expire on May 19, 2015)
• WWTP Design Capacity (for conventional pollutants)
• California Water Quality Standards (WQS, May 2000))
• Plant Inhibition: 1) Activated Sludge Inhibition, and 2) Nitrification Inhibition
• Sludge Quality Standards

Brawley Local Limits Study 2013
LEE & RO, INC. Page 29
5.2.2 Calculate AHLs
Local limits development uses a mass-balance approach to determine the AHLs and calculates the amount of loading received at the POTW headworks that will still meet the environmental or treatment plant criteria that apply to each pollutant. In calculating AHLs, steady-state equations were used for conservative pollutants such as metals because the amount of pollutant loading was conserved throughout the treatment process.
1) NPDES Permit AHL
The NPDES permit limit is the most effective means of restricting the discharge of toxic substances. The AHL based on the NPDES permit limit was calculated for each POC using the following equation:
𝐴𝐻𝐿𝑁𝑃𝐷𝐸𝑆 =(8.34) (𝐶𝑁𝑃𝐷𝐸𝑆) (𝑄𝑊𝑊𝑇𝑃)
(1 − 𝑅𝑊𝑊𝑇𝑃)
Where, AHLNPDES = AHL based on NPDES permit limit, lb/day CNPDES = NPDES permit limit, mg/L QWWTP = WWTP average flow rate, MGD RWWTP = WWTP removal efficiency from headworks to plant
effluent, as a decimal 8.34 = Conversion factor
The AHL calculations based on NPDES permit limits are presented in Appendix VI.
2) WWTP Design Capacity
For conventional pollutants, particularly BOD5, TSS, and ammonia, USEPA recommends considering design capacity of the WWTP in formulating the AHLs. The design capacity of BOD5 and TSS were based upon a design concentration of 175 mg/L and 190 mg/L in WWTP influent and an influent flow rate of 3.8 mgd (average monthly flow from 2010 to 2012). The design capacity of ammonia was based upon a design concentration of 37 mg/L.
The AHL based on design capacity was calculated using the following equation:
𝐴𝐻𝐿𝐷𝐸𝑆𝐼𝐺𝑁 = (8.34) (𝐶𝐷𝐸𝑆𝐼𝐺𝑁) (𝑄𝑊𝑊𝑇𝑃)
Where, AHLDESIGN = AHL based on WWTP design capacity, lb/day CDESIGN = Design capacity for BOD5 and TSS, mg/L QWWTP = WWTP average flow rate, MGD 8.34 = Conversion factor
The AHL calculations based on WWTP design capacity are presented in Appendix VI.
Brawley Local Limits Study 2013
LEE & RO, INC. Page 30
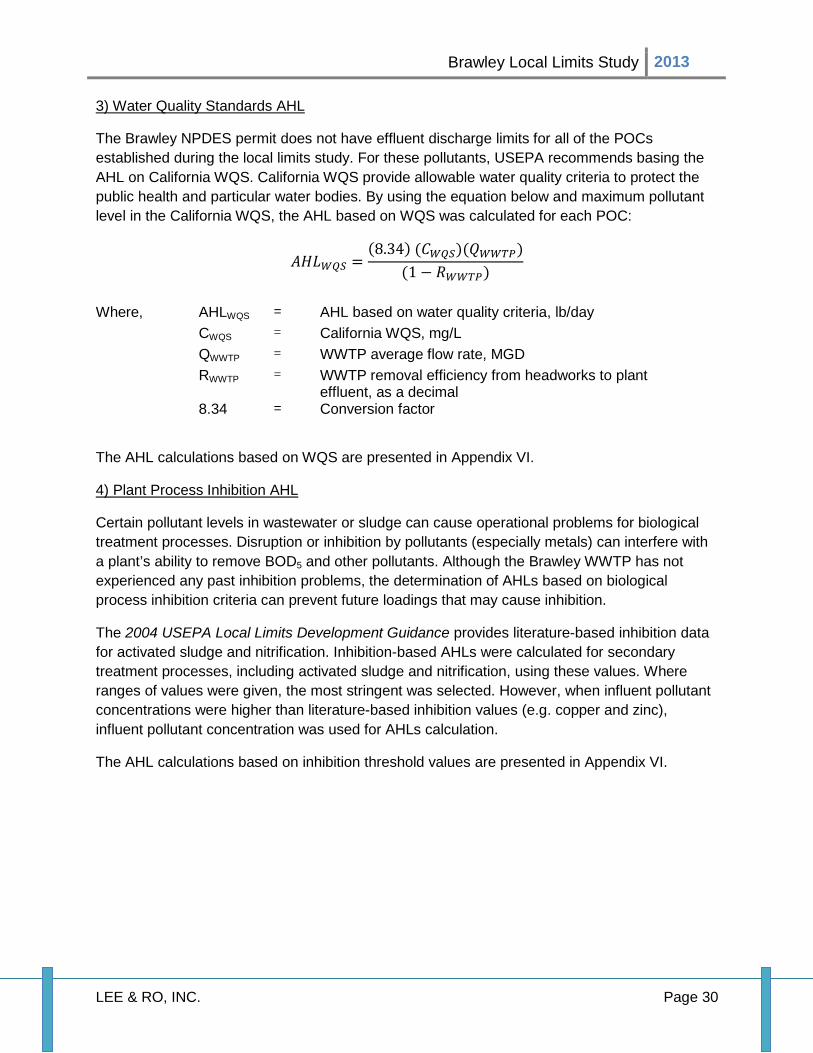
3) Water Quality Standards AHL
The Brawley NPDES permit does not have effluent discharge limits for all of the POCs established during the local limits study. For these pollutants, USEPA recommends basing the AHL on California WQS. California WQS provide allowable water quality criteria to protect the public health and particular water bodies. By using the equation below and maximum pollutant level in the California WQS, the AHL based on WQS was calculated for each POC:
𝐴𝐻𝐿𝑊𝑄𝑆 =(8.34) (𝐶𝑊𝑄𝑆)(𝑄𝑊𝑊𝑇𝑃)
(1 − 𝑅𝑊𝑊𝑇𝑃)
Where, AHLWQS = AHL based on water quality criteria, lb/day CWQS = California WQS, mg/L QWWTP = WWTP average flow rate, MGD RWWTP = WWTP removal efficiency from headworks to plant
effluent, as a decimal 8.34 = Conversion factor
The AHL calculations based on WQS are presented in Appendix VI.
4) Plant Process Inhibition AHL
Certain pollutant levels in wastewater or sludge can cause operational problems for biological treatment processes. Disruption or inhibition by pollutants (especially metals) can interfere with a plant’s ability to remove BOD5 and other pollutants. Although the Brawley WWTP has not experienced any past inhibition problems, the determination of AHLs based on biological process inhibition criteria can prevent future loadings that may cause inhibition.
The 2004 USEPA Local Limits Development Guidance provides literature-based inhibition data for activated sludge and nitrification. Inhibition-based AHLs were calculated for secondary treatment processes, including activated sludge and nitrification, using these values. Where ranges of values were given, the most stringent was selected. However, when influent pollutant concentrations were higher than literature-based inhibition values (e.g. copper and zinc), influent pollutant concentration was used for AHLs calculation.
The AHL calculations based on inhibition threshold values are presented in Appendix VI.

Brawley Local Limits Study 2013
LEE & RO, INC. Page 31
Activated Sludge Inhibition
The equation below was used to calculate AHLs based on activated sludge inhibition. The equation calculates the AHL for conservative pollutants such as metals. Table 5.1 presents the threshold concentration of activated sludge inhibition from 2004 USEPA Local Limits Development Guidance Appendix G. As discussed in earlier section, City operates Biolac process without separate primary clarifiers. Therefore, removal efficiency (RPRIM) through primary process is considered as zero.
𝐴𝐻𝐿𝐴𝑆 =(8.34) �𝐶𝐴𝑆_𝐼𝑁𝐻𝐼𝐵𝐼� (𝑄𝑊𝑊𝑇𝑃)
(1 − 𝑅𝑃𝑅𝐼𝑀)
Where, AHLAS = AHL based on activated sludge inhibition, lb/day CAS_INHIBI = Activated sludge inhibition criteria, mg/L QWWTP = WWTP average flow rate, MGD RPRIM = Removal efficiency from headworks to primary treatment
effluent, as a decimal 8.34 = Conversion factor
Table 5.1 Activated Sludge Inhibition Threshold Levels
Pollutants Inhibition Threshold Level (mg/L)
Ammonia 480
Arsenic 0.1
Cadmium 1
Chromium 1
Copper 1
Cyanide (total) 0.1
Lead 1
Mercury 0.1
Nickel 1.0
Zinc 0.3

Brawley Local Limits Study 2013
LEE & RO, INC. Page 32
Nitrification Inhibition
The equation below was used to calculate AHLs based on nitrification inhibition. The equation calculates the AHL for conservative pollutants such as metals. Table 5.2 presents the threshold concentration of nitrification inhibition from 2004 USEPA Local Limits Development Guidance Appendix G. As discussed in earlier section, City operates Biolac process without separate primary clarifiers. Therefore, removal efficiency (RPRIM) through primary process is considered as zero.
𝐴𝐻𝐿𝑁𝐼𝑇𝑅𝐼 =(8.34) �𝐶𝑁𝐼𝑇𝑅𝐼_𝐼𝑁𝐻𝐼𝐵𝐼� (𝑄𝑊𝑊𝑇𝑃)
(1 − 𝑅𝑃𝑅𝐼𝑀)
Where, AHLNITRI = AHL based on nitrification inhibition, lb/day CNITRI_INHIBI = Nitrification inhibition criteria, mg/L QWWTP = WWTP average flow rate, MGD RPRIM = Removal efficiency from headworks to primary treatment
effluent, as a decimal 8.34 = Conversion factor
Table 5.2 Nitrification Inhibition Threshold Levels
Pollutants Inhibition Threshold Level (mg/L)
Arsenic 1.5
Cadmium 5.2
Chromium 0.25
Copper 0.5 1
Cyanide 0.34
Lead 0.5
Nickel 0.25
Zinc 0.4 2
1. Cited from Skinner and Parker (1961) and Russell and et al. (1982) 2. Maximum WWTP influent zinc concentration without nitrification inhibition. Also, cited from John T. Fox and et al. (2006) and Kelly II, R. T. and et al. (2004)

Brawley Local Limits Study 2013
LEE & RO, INC. Page 33
5) Sludge AHL
According to 40 CFR 503, Standards for the Use or Disposal of Sewage Sludge, pollutant levels are established for three disposal alternatives: land application, surface disposal, and incineration. The current Brawley NPDES permit specifies that all sludge and/or solids generated at the treatment plant are to be disposed, treated, or applied to land in accordance with 40 CFR Part 503. Regardless of how the WWTP disposes of sludge, 2004 USEPA Local Limits Development Guidance recommends considering use of land application “clean sludge” values from 40 CFR 503.13 in AHL calculations. Use of these criteria can improve a plant’s beneficial use options for disposal of sludge. Furthermore, these standards are consistent with the objectives of the National Pretreatment Program listed at 40 CFR 403.2.
40 CFR 503 establishes limitations for nine common metals (arsenic, cadmium, copper, lead, mercury, molybdenum, nickel, selenium, and zinc). Additionally, the Brawley NPDES permit requires other constituents (TKN, ammonia, nitrate, phosphorus, potassium, total solids, fecal coliform, total petroleum hydrocarbons, cyanide, and bis(2-ethylhexyl)phthalate) to be sampled and analyzed from sludge prior to disposal.
The equation below was used to calculate the AHLs based on sludge land application:
𝐴𝐻𝐿𝑆𝐿𝐷𝐺 =(8.34) (𝐶𝑆𝐿𝐺𝑆𝑇𝐷)( 𝑃𝑆100) (𝑄𝑆𝐿𝐷𝐺)(𝐺𝑆𝐿𝐷𝐺)
𝑅𝑊𝑊𝑇𝑃
Where, AHLSLDG = AHL based on sludge, lb/day CSLGTD = Sludge standard – “Clean Sludge” at 40 CFR Part 503,
mg/L PS = Percent solids of sludge to disposal QSLDG = Total sludge flow rate to disposal, mgd RWWTP = Removal efficiency from headworks to plant effluent, as a
decimal GSLDG = Specific gravity of sludge, kg/L 8.34 = Conversion factor
The AHL calculations based on biosolids criteria are presented in Appendix VI.

Brawley Local Limits Study 2013
LEE & RO, INC. Page 34
5.3 MAHL Analysis Results
Protecting water quality (NPDES permit standard and WQS), sludge quality, and plant processes typically requires selection of the lowest AHL value for each potential POC for use as the MAHL. Table 5.3 presents the summary of the calculated AHLs that will serve as MAHLs for this evaluation.
5.4 Comparison of Influent Loadings and MAHLs for the Brawley WWTP
The summaries of influent loadings and the calculated MAHLs for the Brawley WWTP are presented in Table 5.4. MAHLs for all POCs were higher than WWTP influent loadings. 2004 USEPA Local Limits Development Guidance suggests that local limits are needed when the following criteria are satisfied:
• Average influent loading of a toxic pollutant exceeds 60 percent of the MAHL
• Maximum daily influent loading of a toxic pollutant exceeds 80 percent of the MAHL any time in the 12-month period preceding the analysis
• Monthly average influent loading reaches 80 percent of average design capacity for BOD, TSS, and ammonia during any one month in the 12-month period preceding the analysis
Table 5.4 summarizes the comparison of WWTP influent loadings to MAHLs recommended by 2004 USEPA Local Limits Development Guidance. Most of the influent pollutant loadings at the WWTP were far below the calculated MAHLs and did not meet the stated criteria for local limit implementation. However, molybdenum, BOD5, TSS, ammonia and bis(2-ethylhexyl)phthalate satisfied the criteria for local limit implementation. The average influent loading and maximum daily influent loading of these pollutants exceeded 60 percent and 80 percent of the MAHL, respectively. Especially, BOD5, TSS and ammonia reached 80 percent of average design capacity suggesting that local limits are needed.
Except for molybdenum, BOD5, TSS, ammonia and bis(2-ethylhexyl)phthalate, other pollutants are unlikely to cause problems for the plant performance at current loadings. However, it is recommended that the City establish local limits for the specified set of pollutants, with the exception of silver, to prevent increases in loadings from current industrial users and/or loadings from new industrial users from reaching levels that could jeopardize plant performance. The specified set of pollutants include 1) pollutants that qualified for local limits implementation (i.e. copper, molybdenum, BOD5, TSS, ammonia, and bis(2-ethylhexyl)phthalate), 2) other national POCs (i.e., arsenic, cadmium, chromium, cyanide (total), lead, mercury, nickel, selenium, zinc), and 3) other site specific pollutants (i.e. cyanide (free), oil and grease).
Brawley Local Limits Study 2013
LEE & RO, INC. Page 35
Among the pollutants, the ratio of influent silver loading to the calculated MAHL was very low (the maximum influent loading-to-MAHL ratio was 2.5%) and it does not appear that control of industrial discharges for this pollutant is required.

Brawley Local Limits Study 2013
LEE & RO, INC. Page 36
Table 5.3 Summary of AHLs and MAHLs
POCs
AHLs
MAHLs Controlling Criteria
NPDES Permit
Design Criteria WQS
Activated Sludge
Inhibition Nitrification Inhibition
Sludge Quality
(lb/day) (lb/day) (lb/day) (lb/day) (lb/day) (lb/day) (lb/day) Arsenic - - 0.86 3.2 47 0.62 0.62 Sludge Quality Cadmium - - 0.21 32 165 0.40 0.21 WQS Chromium - - - 32 7.9 - 7.9 Nitrification Inhibition Copper 3.8 - - 32 16 12 3.8 NPDES Permit Cyanide (total) - - - 3.2 11 - 3.2 Activated Sludge Inhibition Cyanide (free) 0.31 - - - - - 0.31 NPDES Permit Lead - - 1.5 32 16 3.3 1.5 WQS Mercury - - 0.004 3.2 - 0.19 0.004 WQS Molybdenum - - - - - 0.81 0.81 Sludge Quality Nickel - - 15 32 7.9 4.4 4.4 Sludge Quality Selenium 0.21 - - - - 1.7 0.21 NPDES Permit Silver - - 3.3 - - - 3.3 WQS Zinc - - 101 9.5 13 22 9.5 Activated Sludge Inhibition BOD5 - 5,539 - - - - 5, 539 Design Criteria TSS - 6,014 - - - - 6,014 Design Criteria Ammonia-N - 1,171 - 15,192 - - 1,171 Design Criteria Oil and Grease 2,384 - - - - - 2,384 NPDES Permit Bis(2-ethylhexyl)phthalate 10 - - - - - 10 NPDES Permit

Brawley Local Limits Study 2013
LEE & RO, INC. Page 37
Table 5.4 Comparison of WWTP Influent Loadings to MAHLs
POCs
MAHL 60% of MAHL
Average Influent Loading
New Local Limits
Required? 80% of MAHL
Maximum Influent Loading
New Local Limits
Required?
80% of Design
Capacity
Monthly Average Influent Loading
New Local Limits
Required?
(lb/day) (lb/day) (lb/day) (lb/day) (lb/day) (lb/day) (lb/day)
(A) (B) (B) > (A) (C) (D) (D) > (C) (E) (F) (F) > (E)
Arsenic 0.62 0.37 - No 0.50 - No - - - Cadmium 0.21 0.13 - No 0.17 - No - - - Chromium 7.9 4.7 0.15 No 6.3 0.21 No - - - Copper 3.8 2.3 2.0 No 3.0 2.8 No - - - Cyanide (total) 3.2 1.9 - No 2.5 - No - - - Cyanide (free) 0.31 0.18 - No 0.25 - No - - - Lead 1.5 0.93 0.12 No 1.2 0.16 No - - - Mercury 0.004 0.0024 - No 0.0032 - No - - - Molybdenum 0.81 0.49 0.63 Yes 0.65 0.79 Yes - - - Nickel 4.4 2.7 0.25 No 3.6 0.31 No - - - Selenium 0.21 0.13 - No 0.17 0.06 No - - - Silver 3.3 1.98 - No 2.6 0.012 No - - - Zinc 9.5 5.7 6.4 Yes 7.6 12.3 Yes - - - BOD5 5,539 3,323 5,136 Yes 4,431 8,862 Yes - - - TSS 6,014 3,608 12,570 Yes 4,811 17,091 Yes 4,431 5,507 Yes Ammonia-N 1,171 703 1,818 Yes 937 2,247 Yes 4,811 6,900 Yes Oil and Grease 2,384 1,430 319 No 1,907 475 No 937 950 Yes Bis(2-ethylhexyl)phthalate 10 6.0 5.7 No 8.0 8.2 Yes - - -
Brawley Local Limits Study 2013
LEE & RO, INC. Page 38
6. Designating and Implementing Local Limits
6.1 Introduction
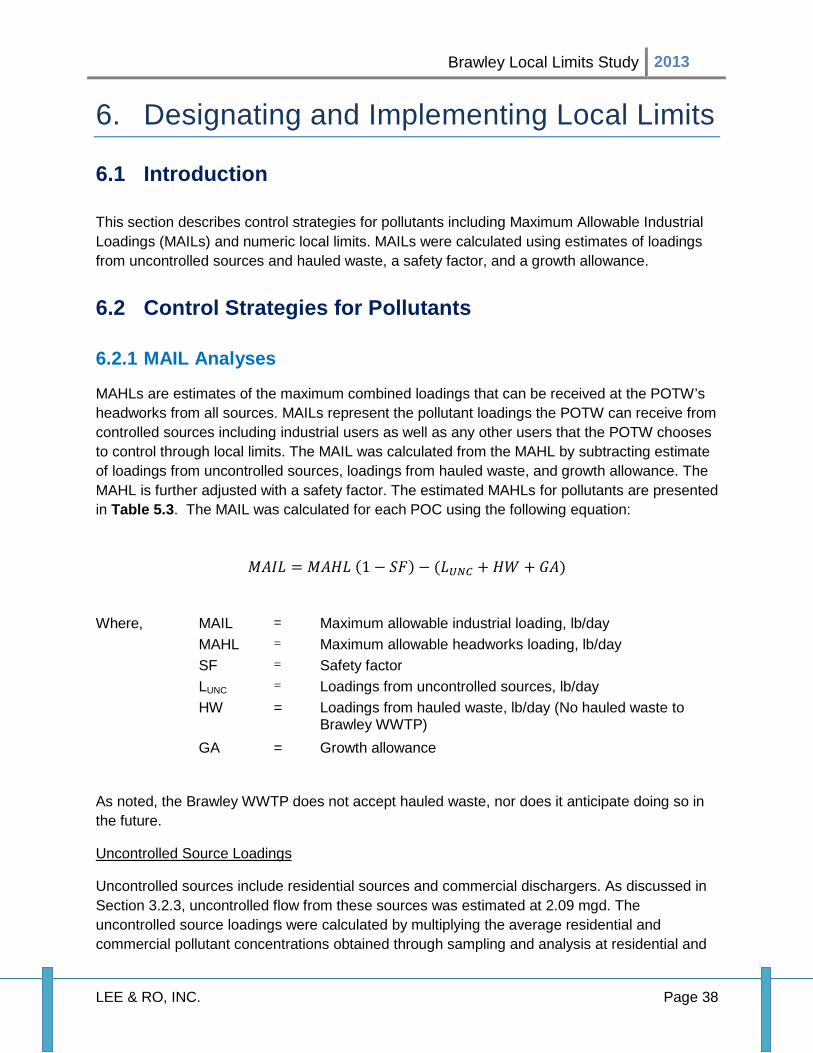
This section describes control strategies for pollutants including Maximum Allowable Industrial Loadings (MAILs) and numeric local limits. MAILs were calculated using estimates of loadings from uncontrolled sources and hauled waste, a safety factor, and a growth allowance.
6.2 Control Strategies for Pollutants
6.2.1 MAIL Analyses
MAHLs are estimates of the maximum combined loadings that can be received at the POTW’s headworks from all sources. MAILs represent the pollutant loadings the POTW can receive from controlled sources including industrial users as well as any other users that the POTW chooses to control through local limits. The MAIL was calculated from the MAHL by subtracting estimate of loadings from uncontrolled sources, loadings from hauled waste, and growth allowance. The MAHL is further adjusted with a safety factor. The estimated MAHLs for pollutants are presented in Table 5.3. The MAIL was calculated for each POC using the following equation:
𝑀𝐴𝐼𝐿 = 𝑀𝐴𝐻𝐿 (1 − 𝑆𝐹) − (𝐿𝑈𝑁𝐶 + 𝐻𝑊 + 𝐺𝐴)
Where, MAIL = Maximum allowable industrial loading, lb/day MAHL = Maximum allowable headworks loading, lb/day SF = Safety factor LUNC = Loadings from uncontrolled sources, lb/day HW = Loadings from hauled waste, lb/day (No hauled waste to
Brawley WWTP) GA = Growth allowance
As noted, the Brawley WWTP does not accept hauled waste, nor does it anticipate doing so in the future.
Uncontrolled Source Loadings
Uncontrolled sources include residential sources and commercial dischargers. As discussed in Section 3.2.3, uncontrolled flow from these sources was estimated at 2.09 mgd. The uncontrolled source loadings were calculated by multiplying the average residential and commercial pollutant concentrations obtained through sampling and analysis at residential and

Brawley Local Limits Study 2013
LEE & RO, INC. Page 39
commercial sampling locations, by the estimated wastewater flow from each of these groups of users. The following equation was used for the uncontrolled loading calculation:
𝐿𝑈𝑁𝐶 = (𝐶𝑈𝑁𝐶)(𝑄𝑈𝑁𝐶)(8.34)
Where, LUNC = Uncontrolled loading, lb/day CUNC = Uncontrolled pollutant concentration, mg/L QUNC = Uncontrolled flow rate, mgd 8.34 = Unit conversion factor
Table 6.1 summarizes the uncontrolled source loadings of POCs.
Safety Factor
The magnitude of the safety factor is site-specific, depending on local conditions. 2004 USEPA Local Limits Development Guidance recommends a minimum 10 percent safety factor in order to address data uncertainties that can affect the ability of the POTW to calculate accurate local limits. A safety factor of zero is assumed for BOD5, TSS, and ammonia because the WWTP design incorporates max month and peak day safety factors.
Expansion/Growth Allowance
United States Census data show that the population of Brawley increased 9.7% during the period from 2000 to 2010, an annual rate of less than 0.93%. Recent data for housing starts show that few building permits have been issued in the past few years during the current downturn in the housing market. Under current economic conditions, it is assumed that City of Brawley will not have any significant amount of growth in the near future, therefore, it will not hold in any reserve a portion of its MAHLs calculated on the current plant flow for growth.
The wastewater treatment plant flow at the time of this analysis was an average of 3.8 mgd. Allowable loadings for BOD5, TSS, ammonia and total nitrogen have been calculated based in the design influent concentration and the current flow. The treatment plant has a design flow of 5.9 mgd. Therefore, as the City grows and the influent flows increase, additional capacity for industrial flows will increase as well in proportion to the flow increases associated with them. In the event that population growth remains stagnant, the City may elect to dedicate more of its existing plant capacity to industrial users, provided that it does not exceed the design capacity. The City may evaluate future SIU’s based on the proposed flows at the time of permit application. Such discretion should be incorporated into the SUO.
Brawley Local Limits Study 2013
LEE & RO, INC. Page 40
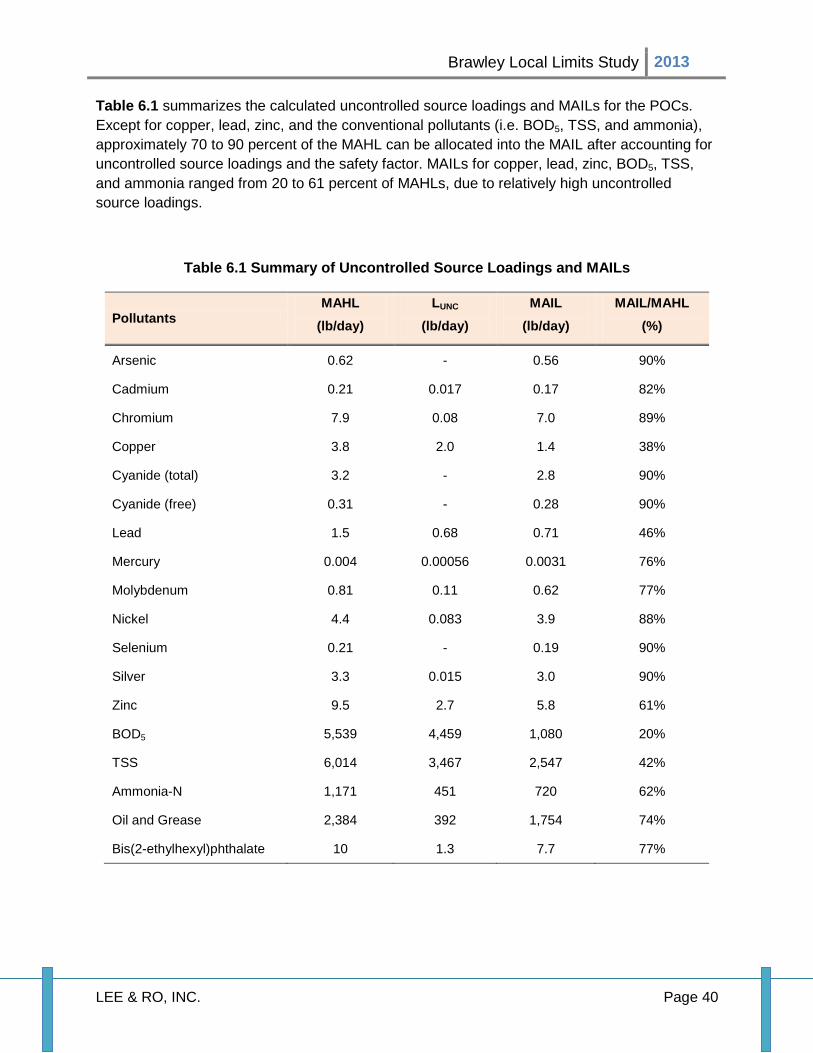
Table 6.1 summarizes the calculated uncontrolled source loadings and MAILs for the POCs. Except for copper, lead, zinc, and the conventional pollutants (i.e. BOD5, TSS, and ammonia), approximately 70 to 90 percent of the MAHL can be allocated into the MAIL after accounting for uncontrolled source loadings and the safety factor. MAILs for copper, lead, zinc, BOD5, TSS, and ammonia ranged from 20 to 61 percent of MAHLs, due to relatively high uncontrolled source loadings.
Table 6.1 Summary of Uncontrolled Source Loadings and MAILs
Pollutants MAHL
(lb/day) LUNC
(lb/day) MAIL
(lb/day) MAIL/MAHL
(%)
Arsenic 0.62 - 0.56 90%
Cadmium 0.21 0.017 0.17 82%
Chromium 7.9 0.08 7.0 89%
Copper 3.8 2.0 1.4 38%
Cyanide (total) 3.2 - 2.8 90%
Cyanide (free) 0.31 - 0.28 90%
Lead 1.5 0.68 0.71 46%
Mercury 0.004 0.00056 0.0031 76%
Molybdenum 0.81 0.11 0.62 77%
Nickel 4.4 0.083 3.9 88%
Selenium 0.21 - 0.19 90%
Silver 3.3 0.015 3.0 90%
Zinc 9.5 2.7 5.8 61%
BOD5 5,539 4,459 1,080 20%
TSS 6,014 3,467 2,547 42%
Ammonia-N 1,171 451 720 62%
Oil and Grease 2,384 392 1,754 74%
Bis(2-ethylhexyl)phthalate 10 1.3 7.7 77%
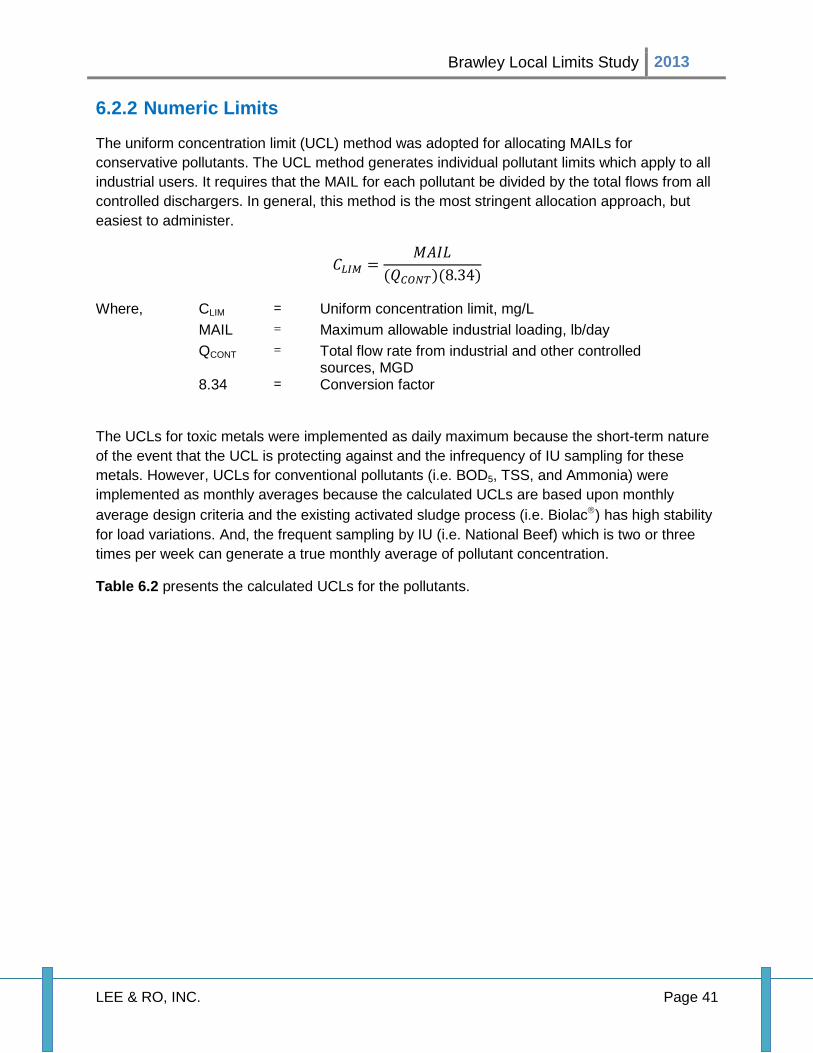
Brawley Local Limits Study 2013
LEE & RO, INC. Page 41
6.2.2 Numeric Limits
The uniform concentration limit (UCL) method was adopted for allocating MAILs for conservative pollutants. The UCL method generates individual pollutant limits which apply to all industrial users. It requires that the MAIL for each pollutant be divided by the total flows from all controlled dischargers. In general, this method is the most stringent allocation approach, but easiest to administer.
𝐶𝐿𝐼𝑀 =𝑀𝐴𝐼𝐿
(𝑄𝐶𝑂𝑁𝑇)(8.34)
Where, CLIM = Uniform concentration limit, mg/L MAIL = Maximum allowable industrial loading, lb/day QCONT = Total flow rate from industrial and other controlled
sources, MGD 8.34 = Conversion factor
The UCLs for toxic metals were implemented as daily maximum because the short-term nature of the event that the UCL is protecting against and the infrequency of IU sampling for these metals. However, UCLs for conventional pollutants (i.e. BOD5, TSS, and Ammonia) were implemented as monthly averages because the calculated UCLs are based upon monthly average design criteria and the existing activated sludge process (i.e. Biolac) has high stability for load variations. And, the frequent sampling by IU (i.e. National Beef) which is two or three times per week can generate a true monthly average of pollutant concentration.
Table 6.2 presents the calculated UCLs for the pollutants.

Brawley Local Limits Study 2013
LEE & RO, INC. Page 42
Table 6.2 Uniform Concentration Limit Analysis
Pollutants Uniform
Concentration Limit 1 (mg/L)
MAHL-Based Local Limits Required?
Arsenic 0.04 Yes
Cadmium 0.012 Yes
Chromium 0.5 Yes
Copper 0.1 Yes
Cyanide (total) 0.2 Yes
Cyanide (free) 0.02 Yes
Lead 0.05 Yes
Mercury 0.0002 Yes
Molybdenum 0.04 Yes
Nickel 0.3 Yes
Selenium 0.01 Yes
Silver 0.2 Yes
Zinc 0.4 Yes
BOD5 76 Yes
TSS 180 Yes
Ammonia-N 50 Yes
Oil and Grease 123 Yes Bis(2-ethylhexyl)phthalate 0.5 Yes
1. Daily Maximum Limits except BOD5, TSS, and Ammonia.
6.2.3 Slug Discharges
Slug discharges are short term discharges which may exceed longer term average limits and have the potential to disrupt the treatment process or impact effluent quality. 2004 USEPA Local Limits Development Guidance recommends the adoption of maximum limits for slug discharges in the event that an industrial discharger to control potential process upsets from short-term discharges which may exceed longer term average limits. This is especially important for those POCs which are near the MAHL and which may be discharged in sufficient amounts over the short term by an industrial user to exceed the MAHL and potentially create

Brawley Local Limits Study 2013
LEE & RO, INC. Page 43
operational problems at the WWTP. BOD5, TSS, and ammonia in discharges from the National Beef plant fit these criteria due to the large potential flow from the plant (up to 2.1 mgd, which is more than one-third of the treatment capacity) and historical experience where high concentrations of these pollutants discharged from the National Beef pretreatment facility have caused operational upsets at the treatment plant. It is possible to have a single day discharge from the National Beef facility which would cause operational problems at the WWTP and which would not result in violation of a 30-day average limit.
The current contract between the City and National Beef contains maximum limits for BOD5 and TSS of 250 mg/l. Upsets of the National Beef pretreatment process which exceed these limits have historically resulted in operational problems at the treatment plant. Operational problems have been associated with an inability to maintain adequate oxygen concentrations in the aeration basins. High BOD5 and TSS loadings have been associated with rapid oxygen depletion in the aeration basins. They have also resulted in extended problems with maintaining oxygen concentrations due to the demand from organic solids which overwhelm the solids wasting capability of the system, resulting in high MLVSS levels which continue to exert demand until they can be wasted from the system. To protect the treatment plant from operational problems that could result in poor effluent quality, it is recommended that the instantaneous maximum discharge concentration limit for slug loading be retained at 250 mg/l for both BOD5 and TSS, as set by the existing Brawley SUO.
High ammonia levels in National Beef pretreatment effluent may result in rapid depletion of dissolved oxygen levels in the aeration basins because the Biolac® basins contain large populations of nitrifiers which can rapidly oxidize ammonia to nitrate. While this may help prevent pass through of ammonia under some conditions, the rapid oxidation of ammonia to nitrite and nitrate consumes significant dissolved oxygen and can result in difficulty in maintaining dissolved oxygen levels in the aeration basins, causing rapid increases in required air flow to the basins and resulting in short-term overload of the blowers and aeration equipment. The existing contract with National Beef has an instantaneous maximum limit of 30 mg/l for ammonia for discharges to the City sewer system. It is recommended that the instantaneous maximum discharge concentration limit for ammonia be increased to 50 mg/l and monthly average concentration limit for ammonia be retained as 30 mg/L, as set by the existing Brawley SUO.
Alternative measurement techniques for pollutants from National Beef which have historically caused plant upsets were investigated during the sampling phase to identify indicators of National Beef pre-treatment plant upset which would provide real time or much more rapid detection of operational problems. The intent was to determine limits of a surrogate analyte which would serve to protect the WWTP from slug loadings. Total Organic Carbon (TOC) and Chemical Oxygen Demand (COD) were both analyzed in parallel with BOD5, TSS, and ammonia. TOC was not found to be an appropriate predictor of plant upset.
COD, may be determined rapidly with on-line analyzers and was found to be a good predictor of the potential for plant upset. COD levels were found to be roughly 3.6 times the sampled BOD5 . Influent data from 8/8/12 was considered not representative and was not used in the analysis.

Brawley Local Limits Study 2013
LEE & RO, INC. Page 44
High COD levels have been observed to be associated with high TSS septic discharges from National Beef, which may be associated with over pumping of basins and discharge of septic solids. These discharges have impacted the plant operation by rapidly depleting dissolved oxygen concentrations in the aeration basin, often in less than one hour. The aeration blowers then ramp up to maximum capacity, and are still unable to maintain measurable dissolved oxygen levels in the basins. Such an incident occurred on 8/5/2012, during the local limits sampling. It is proposed to add a maximum limit of 900 mg/l of COD to the National Beef discharge to further protect the treatment plant from slug load upset. This limit correlates to a BOD limit of 250 mg/l. COD results may be used to rapidly identify a slug load to the plant.
7. Collection System-Based Limits
7.1 Introduction
Collection system-based limits protect the POTW from fire and explosions, corrosion, flow obstructions, high temperature, and toxic gases, vapors, or fumes. 2004 USEPA Local Limits Development Guidance recommends that POTWs may need to develop local limits for their collection system to meet the requirements found at 40 CFR 403.5(b), which include protecting the health and safety of workers at the POTW.
7.2 Fire and Explosions
The General Pretreatment Regulations prohibit the discharge of pollutants that will cause a fire or explosion hazard in the POTW. To protect against fires and explosions, the City’s existing SUO (Section 22.15 (b) 1) prohibits discharge of pollutants with a fire or explosive hazard.
Brawley SUO Section 22.15 (b) 1 prohibits: Pollutants which create a fire or explosive hazard in the POTW, including, but not limited to, waste streams with a closed-cup flashpoint of less than 140 degree Fahrenheit or 60 degrees Celsius using the test methods specified in 40 CFR 261.21.
7.3 Corrosion
The General Pretreatment Regulations prohibit discharges of pollutants that will cause corrosive structural damage to a POTW. The regulations prohibit discharges with pH lower than 5.0. Federal regulation, 40 CFR 261, 22(a)(1) specifies that the maximum discharge pH should be less than 12.5 to prevent wastewater from being considered a hazardous waste. The City’s existing SUO contains a specific prohibition against discharge of wastewater with a pH less than 6.0 or more than 9.0 (Section 22.15, (b) 2).

Brawley Local Limits Study 2013
LEE & RO, INC. Page 45
Brawley SUO Section 22.15 (b) 2 prohibits: Wastewater having a pH less than 6.0 or more than 9.0 or otherwise causing corrosive structural damage to the POTW or equipment.
7.4 Flow Obstruction
The General Pretreatment Regulations prohibit discharge of solid or viscous pollutants that obstruct wastewater flow to WWTP. The greatest threat of obstruction comes from polar fats, oils, and grease of animal and vegetable origin. These pollutants can accumulate and congeal in the collection system, pump stations, and WWTP, obstructing influent flow, reducing pipe and pump capacities, interfering with the POTW instruments, reducing treatment capacity, and increasing operations and maintenance cost. Although the calculated AHL-based local limit of oil and grease is 126 mg/L, the existing oil and grease limit (i.e. 40 mg/L) has proven effective in preventing accumulation of oil and grease in the collection system and at the treatment plant that could create blockages and other maintenance issues. Therefore, it is recommended that 40 mg/L of limit be retained.
7.5 Temperature
The City’s existing SUO contains a specific prohibition against discharges having a temperature greater than 140 degrees Fahrenheit (or 60 degrees Celsius) or which will inhibit biological activity in the WWTP resulting in interference. Any discharge that causes the temperature at the WWTP headworks to exceed 104 degree Fahrenheit (or 40 degrees Celsius) is also prohibited.
Brawley SUO Section 22.15 (b) 5 prohibits: Wastewater having a temperature greater than 140°F (60°C), or which will inhibit biological activity in the treatment plant resulting in interference, but in no case wastewater which causes the temperature at the introduction into the treatment plant to exceed 104°F (40°C).
7.6 Toxic Gases, Vapors and Fumes
The General Pretreatment Regulations prohibit the discharge of pollutants that lead to the accumulation of toxic gases, vapors, or fumes in the POTW in sufficient quantity to cause worker health and safety problems. 2004 USEPA Local Limits Development Guidance, Appendix I lists discharge screening levels based on fume toxicity, and Appendix J lists exposure limits for volatile organic priority pollutants. The exposure limits for hydrogen cyanide and hydrogen sulfide are 1.15 mg/L and 0.034 mg/L for fume toxicity based on the lowest criterion for acute toxicity. The calculations for these limits are presented in Appendix VIII.

Brawley Local Limits Study 2013
LEE & RO, INC. Page 46
8. Conclusions and Recommendations Eighteen pollutants were identified as POCs in developing local limits for the Brawley WWTP. MAHL and MAIL analyses were conducted for 12 inorganic compounds and metals, one volatile organic carbon (VOC), and three conventional pollutants. Local limits for oil and grease and pH were also evaluated. The proposed MAHL-based local limits for pollutants except BOD5, TSS, and ammonia were established as daily maximum concentrations due to potential impact of events on plant performance (i.e. biological inhibition) and the infrequency of IU sampling. The proposed MAHL-based local limits for BOD5, TSS, and ammonia were established as monthly average concentrations due to frequent IU sampling. It is recommended that the City be authorized in its Sewer Use Ordinance the option to establish mass limits in addition to or in lieu of the recommended concentration limits. The recommended local limits for pollutants are described below and apply to all industrial users. Local limits for Arsenic, Molybdenum and Nickel are based on sludge produced prior the plant upgrade; more samples will be taken and the local limits and SUO will be revised, if required. Table 8.1 summarizes the recommended instantaneous maximum limits, daily maximum limits, and monthly average limits for the pollutants.
• Arsenic. The average influent loading was less than 5 percent of the MAHL. The recommended UCL for arsenic was 0.04 mg/L based on sludge quality criteria of 41 mg/kg. This limitation would be implemented as a daily maximum allowable concentration limit for all industrial dischargers.
• Cadmium. The recommended UCL for cadmium was 0.012 mg/L as daily maximum allowable concentration limit and was controlled by the water quality standard of 0.0022 mg/L.
• Chromium. The average influent loadings for chromium accounted for 2 percent of the MAHL. The recommended UCL for chromium was 0.5 mg/L as daily maximum allowable concentration limit and was controlled by nitrification inhibition threshold level of 0.25 mg/L.
• Copper. The average influent loading accounted for 54 percent of the MAHL. It is recommended that the UCL for copper of 0.1 mg/L be established and implemented as a daily maximum. The UCL for copper was controlled by current NPDES permit limit of 0.021 mg/L.
• Total Cyanide and Free Cyanide. The recommended UCL for total cyanide and free cyanide were 0.2 mg/L and 0.02 mg/L. These limitations would be implemented as a daily maximum allowable concentration limit for all industrial dischargers. Total Cyanide was highest toxic limit protective of Brawley WWTP. The UCLs for both cyanides were calculated with estimated concentration as well as literature removal efficiency in secondary process. The City will continue to monitor periodically for Cyanide (free) in domestic and commercial waste streams and may reevaluate its local limits based on those results in the future.

Brawley Local Limits Study 2013
LEE & RO, INC. Page 47
• Lead. The average influent loading for lead was less than 8 percent of the MAHL. It was recommended that the UCL for lead of 0.05 mg/L be established and implemented as a daily maximum allowable concentration. The UCL for lead was controlled by the water quality standard of 0.019 mg/L.
• Mercury. The recommended UCL of mercury was 0.0002 mg/L as daily maximum allowable concentration. The UCL of mercury was controlled by the water quality standard of 0.000051 mg/L.
• Molybdenum. The highest average influent loading to MAHL (78 percent) was detected. The recommended UCL of molybdenum was 0.04 mg/L as a daily maximum allowable concentration. The UCL of molybdenum was controlled by sludge quality criteria of 75 mg/kg.
• Nickel. The average influent loading for nickel accounted for 6 percent of the MAHL. It is recommended that the UCL for nickel of 0.3 mg/L be established and implemented as a daily maximum allowable concentration limit for all industrial dischargers.
• Selenium. The average influent loading for nickel accounted for 21 percent of the MAHL. It is recommended that the UCL for selenium of 0.01 mg/L be established and implemented as a daily maximum allowable concentration limit for all industrial dischargers. The UCL for selenium was controlled by current NPDES permit limit of 0.0041 mg/L.
• Silver. The recommended UCL of silver was 0.2 mg/L as daily maximum allowable concentration. The UCL of silver was controlled by the water quality standard of 0.044 mg/L.
• Zinc. The second highest influent loading to MAHL (67 percent) was detected. The recommended UCL of zinc was 0.4 mg/L. The UCL for zinc was controlled by activated sludge inhibition threshold level of 0.3 mg/L.
• Bis(2-Ethylhexyl)phthalate. The average influent loading for bis(2-ethylhexyl)phthalate accounted for 57 percent of the MAHL. It is recommended that the UCL for bis(2-ethylhexyl)phthalate of 0.5 mg/L be established and implemented as a daily maximum allowable concentration limit for all industrial dischargers. The UCL for bis(2-ethylhexyl)phthalate was controlled by current NPDES permit limit of 0.0059 mg/L. The City will continue to monitor influent and effluent Bis(2-ethylhexyl)phthalate and calculate the removal efficiency to determine NDPES permit compliance after additional sampling has been performed, since only two samples were used to set the local limits. If necessary, local limits and the Sewer Use Ordinance will be revised to assure NPDES compliance.
• Oil and Grease. The recommended UCL of oil and grease is 40 mg/L as a daily maximum allowable concentration. This is the current prohibition for oil and grease (as an instantaneous maximum concentration) in Brawley SUO which has proven effective in preventing accumulation in the collection system and WWTP.

Brawley Local Limits Study 2013
LEE & RO, INC. Page 48
Restaurants should be required in a modification to the Brawley SUO to provide and maintain grease traps as a best management practice for reducing oil and grease loadings to the sewer system.
• pH. It is recommended that the current prohibition of discharge pH of less than 6.0 or greater than 9.0 be maintained and established as the UCL.
• BOD5, TSS, and Ammonia, Monthly Average Limit. The calculated UCLs for these pollutants were based on WWTP design criteria, i.e. 175 mg/L of BOD5, 190 mg/L of TSS, and 37 mg/L of ammonia. The recommended UCLs for BOD5, TSS, and ammonia are 76 mg/L, 180 mg/L, and 30 mg/L, respectively. These limitations will be implemented as a monthly average allowable concentration limit for all industrial dischargers. An instantaneous maximum limit will be implemented in lieu of a daily maximum limit for these discharges.
• BOD5, TSS, and Ammonia, Instantaneous Maximum Limit. Slug loadings from National Beef have historically caused operational problems at the WWTP. Recommended instantaneous maximum limits for National Beef discharge are 250 mg/l BOD5, 250 mg/l TSS, and 50 mg/l ammonia. An instantaneous maximum limit of 900 mg/l COD should be implemented as well. These limits will be applied to all significant industrial users. National Beef should be required to have a slug loading prevention plan to demonstrate how it will achieve and assure compliance with these limits.
• Total Nitrogen. With an instantaneous maximum limit for ammonia (i.e. 50 mg/L), the recommended instantaneous maximum limit of total nitrogen is 73 mg/L. This total nitrogen limit is based on the ratio of the sampled ammonia and total nitrogen concentration (i.e. 1.46). Total nitrogen is the sum of organic and ammonia nitrogen (TKN) plus nitrates and nitrites. Nitrates and nitrites were not detected in the WWTP influent, so that TKN is a reasonable measure of total nitrogen in this case. A limit on total nitrogen is necessary to account for potential nitrate and nitrate discharges from National Beef in the future when nitrification pre-treatment facilities are enabled.

Brawley Local Limits Study 2013
LEE & RO, INC. Page 49
Table 8.1 Summary of Local Limits
Pollutants
Recommended Local Limits
Instantaneous Maximum
Daily Maximum
Monthly Average
(mg/L) (mg/L) (mg/L)
Inorganic Metals
Arsenic - 0.04 -
Cadmium - 0.012 -
Chromium - 0.5 -
Copper - 0.1 -
Cyanide (Total) - 0.2 -
Cyanide (Free) - 0.02 -
Lead - 0.05 -
Mercury - 0.0002 -
Molybdenum - 0.04 -
Nickel - 0.3 -
Selenium - 0.01 -
Silver - 0.2 -
Zinc - 0.4 -
Organic Compound and Others
Bis(2-ethylhexyl)phthalate - 0.5 -
Conventional Pollutants
BOD5 250 - 76
TSS 250 - 180
COD 900 - -
Ammonia as Nitrogen 50 - 30
Total Nitrogen 73 - -
Oil and Grease - 40 -
pH 6.0 – 9.0 6.0 – 9.0 -
Temp (°F) 140 - -

Brawley Local Limits Study 2013
LEE & RO, INC. Page 50
9. References USEPA (2004), Local Limits Development Guidance, Washington, D.C., U.S. Environmental Protection Agency
USEPA (2004), Local Limits Development Guidance Appendices, Washington, D.C., U.S. Environmental Protection Agency
USEPA (2007), National Pretreatment Program (40 CFR 403) – Controlling Fats, Oils, and Grease Discharges from Food Service Establishments, Washington, D.C., U.S. Environmental Protection Agency
City of Brawley, Sewer Ordinance - Section 22, Revised in 2008
City of Brawley (2009), Summary of Analysis – Wastewater Rates, California, Bartle Wells Associates
City of Brawley (2008), Wastewater Treatment Plant Improvements Preliminary Design Report, California, Lee & Ro, Inc.
John T. Fox, Christopher J. Brandriff, and Charles B. Bott (2006), Assessing the Potential for Nitrification at Wastewater Treatment Facilities as a Result of Zinc Orthophosphate Addition to Potable Water Distribution Systems, 2006 WEFTEC, Water Environment Foundation, 6593-6622
Kelly II, R. T., Henriques, I. D. S, and Love, N. G. (2004a), Chemical Inhibition of Nitrification in Activated Sludge, Biotechnology and Bioengineering, 85 (6), 638-694
Reid, G. N., R. Y. Nelson, C. Hall, U. Bonilla and R. Reid (1968), Effects of Metallic Ions on Biological Waste Treatment, Water Sew. Works
Russell, L. L., C. b. Cain, and D. I. Jenkins. (1984), Impacts of Priority Pollutants on Publicly Owned Treated Works Processes: A Literature Review, 1984 Purdue Industrial Waste Conference
Skinner and Walker (1961), Growth of Nitrosomonas Europaea in Water and Continuous Culture, Archs. Mikrobiol. 38, 339-349

Appendices
I. Local Limit Sampling Plan
II. WWTP Influent and Effluent, Sludge, and Priority Pollutants
Analysis Data
III. Sample Analyses Data
IV. Flow and Loading Data
V. Removal Efficiency
VI. Allowable Headworks Loading Calculations
VII. MAILs and Local Limits Calculations
VIII. Fume Toxicity

Appendix I
Local Limit Sampling Plan

City of Brawley
Local Limits Sampling Plan
July 23 2012

City of Br
Page 1
LocTo develMost of tcollectedto identify
M Q Y P
The samthe samplimits willOperatio
1. P The US EdevelopmchromiumbiochemGuidance
The datacontained
Tth
Oa
Ad
Asy
A A
S A
(R
rawley – Loc
al Limop a samplinhe data prov
d by the City y the polluta
Monthly influeQuarterly sludYearly priorityPriority pollut
pling plan wpling frequenl be conductns Supervis
Pollutants
Environmentment (2004) m, copper, cical oxygen e also recom
a were reviewd the followi
Toxic pollutanhat apply to W
Organic toxicnd Table III
Any toxic pollischargers if
Any pollutantystem, treat
Any pollutantAny pollutantSewage SludAny pollutantRWQCB)
cal Limits Sa
mits Sng plan for lovided by thefor regulato
ants that sho
ent and effludge monitory pollutants aants analysi
will address: ncy and procted by City oor, (760) 35
s to Be Ev
tal Protectiohas identifieyanide, leaddemand (BO
mmends sam
wed to ensung pollutant
nts designatWWTP efflu
c pollutants a
lutants and hf expected tos that are prment works,s that impacs in biosolid
dge. s that are re
ampling Plan
Sampocal limits, v City for revry complianc
ould be evalu
uent concenting data for analysis datis data from
(1) the pollucedures, andof Brawley (D1 -7183, dar
valuated
n Agency (Ued 15 nationd, mercury, mOD), total sumpling for org
re that the ins:
ted in NPDEent or stream
and toxic me
hazardous so be presentresent and m, worker heact the treatms listed in 40
ecommended
n
pling Pvarious typesiew were reace. The follouated to dete
tration data f2010 and 20ta (effluent aLift Station
tants to be ed (4) the anaDavid Arvizurvizu@brawl
USEPA) guidal pollutants
molybdenumuspended soganic priority
nfluent and/o
S permits anm segment
etals listed in
substances rt listed in 40
may cause aalth and safeent performa0 CFR 503 S
d by Region
Plans of pollutanadily availabowing data wermine the n
for 2010 and011 and receiving
evaluated, (2alytical methu, Water Distley-ca.gov).
dance docums of concern m, nickel, selolids (TSS), ay pollutants.
or effluent pr
nd/or State W(i.e. New Riv
n 40 CFR Pa
required to b0 CFR Part 1a potential imety or air quaance (i.e. prStandards fo
al Water Qu
nt informationble from monwere compileneed for loca
d 2011
g water) for 2
2) the samphods. All samtribution/Sew
ment for loca(POCs); arsenium, silveand ammon
riority polluta
Water Qualiver)
art 122, Appe
be identified 122, Appendmpact to the ality rocess inhibior the Use o
uality Contro
July
n were revienitoring dataed and revieal limits:
2011 and 20
ling locationmpling for locwage Collect
al limits senic, cadmer, zinc, ia. 2004 US
ant scan
ty Standards
endix D, Tab
by existing dix D, Table Vcollection
ition criteria)r Disposal o
ol Board
2012
ewed.
ewed
012
s, (3) cal tions
ium,
SEPA
s
ble II
V
) of

City of Br
Page 2
J:\PROJ\46
Preliminaas site-spand GreaPOCs alo
rawley – Loc
66\466-56\O Lo
ary evaluatiopecific POCsase (O&G) wong with the
Table 1 P
Nation
Ars
Cad
Chr
Cop
Cya
Lea
Mer
Mol
Nic
Sel
Silv
Zinc
Bio
Tot
AmN)
Other
Che
Oil
Bis(
AbbrPotenToxic
cal Limits Sa
ocal Limit Stud
on of the influs. Chemical
were also idee listing criter
Pollutants o
Pa
nal POCs
enic
dmium
romium
pper
anide (Total
ad
rcury
lybdenum
kel
enium
ver
c
chemical Ox
al Suspende
monia, TKN
Site Specif
emical Oxyg
and Grease
(2-ethylhexy
eviations - Bntial Industricity W: Wate
ampling Plan
y Report\Samp
uent, effluenOxygen De
entified as a ria.
of Concern
arameters
& Free Cya
xygen Dema
ed Solids (TS
, Nitrate, an
fic Pollutant
gen Demand
yl)phthalate
B: Biosolid Cial User Disc
er Quality Sta
n
pling Plan\Loca
nt, and sludgmand (CODsite-specific
(Pollutants
nide)
and (BOD)
SS)
d Nitrate (as
ts
(COD)
Criteria, I: Procharge, N: Nandard
al Limits Samp
ge data identD), Bis(2-ethyc POCs. Ta
s to be samp
Selec
B, I,
B, I,
B, I,
B, I,
B, I, W
B, I,
B, I, W
B
B, I,
B, IU
I, W
B, I,
N
N, IU
s I, N
IU
N, IU
N, W
ocess InhibitNPDES Perm
ling Plan (rev 3
tified the 15 ylhexyl)phth
able 1 summ
pled and ev
ction Criteri
IU, W
IU, W
IU, W
IU, W
W
IU, W
W
IU, W
U, W
IU, W
U
U
W
tion, IU: mit, T: Fume
July
3).docx
national POalate and O
marizes the li
valuated)
ia
2012
OCs il st of
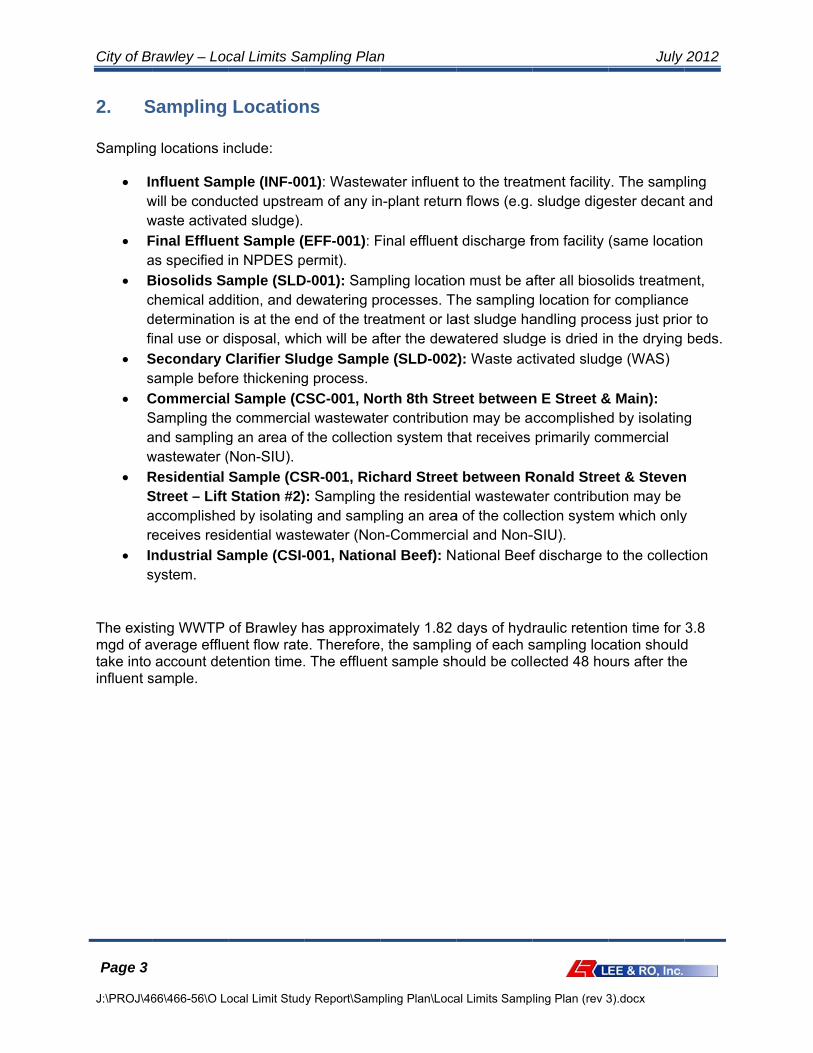
City of Br
Page 3
J:\PROJ\46
2. S Sampling
Inww
Fa
Bcdfi
Ss
CSaw
RSare
Ins
The existmgd of atake into influent s
rawley – Loc
66\466-56\O Lo
Sampling
g locations in
nfluent Samwill be conduwaste activatFinal Effluenas specified Biosolids Sachemical adddeterminationinal use or d
Secondary Csample beforCommercialSampling theand samplingwastewater (Residential Street – Lift accomplisheeceives resindustrial Sa
system.
ting WWTP verage effluaccount det
sample.
cal Limits Sa
ocal Limit Stud
Location
nclude:
mple (INF-00ucted upstreated sludge). nt Sample (in NPDES pample (SLDdition, and dn is at the en
disposal, whClarifier Slure thickeningl Sample (Ce commerciag an area of (Non-SIU). Sample (CSStation #2)d by isolatindential wastample (CSI-
of Brawley hent flow ratetention time.
ampling Plan
y Report\Samp
ns
01): Wastewam of any in
EFF-001): Fpermit). D-001): Sam
ewatering pnd of the treich will be af
udge Samplg process.
CSC-001, Noal wastewate
the collectio
SR-001, Ric): Sampling tg and samptewater (Non-001, Nation
has approxime. Therefore. The effluen
n
pling Plan\Loca
water influentn-plant return
Final effluent
pling locatiorocesses. Thatment or lafter the dewe (SLD-002
orth 8th Streer contributioon system th
hard Streetthe resident
pling an arean-Commercinal Beef): N
mately 1.82, the samplin
nt sample sh
al Limits Samp
t to the treatn flows (e.g.
t discharge f
on must be ahe sampling
ast sludge hawatered sludg2): Waste act
eet betweenon may be ahat receives
t between Rtial wastewata of the colleal and Non-ational Beef
days of hydng of each s
hould be coll
ling Plan (rev 3
tment facility sludge dige
from facility
after all biosog location forandling procge is dried intivated sludg
n E Street &accomplished
primarily co
Ronald Streeter contribut
ection system-SIU). f discharge t
raulic retentsampling locected 48 ho
July
3).docx
y. The sampester decant
(same locat
olids treatmer compliancecess just prion the drying ge (WAS)
& Main): d by isolating
ommercial
et & Stevention may be m which only
to the collec
ion time for cation shouldours after the
2012
ling t and
ion
ent, e or to beds.
g
n
y
ction
3.8 d e

City of Br
Page 4
J:\PROJ\46
3. S Sampling
2004 EPAdeterminNational and the cfor Natiosampling
The minito 5 MGDwastewacollectiondays for
Influent
Final E
Biosolid
Second
Comme
Reside
Industr1 Due toafter fir
Sampling
Where aprocedurbased onfor analy
rawley – Loc
66\466-56\O Lo
Sampling
g Frequencie
A Guidancee potential PPOCs and P
collection synal POCs an
g methods on
mum recomD (Brawley) ter samplesn system, infinitial local li
T
Loca
t (INF-001)
ffluent (EFF
d (SLD-001)
dary Clarifier
ercial (CSC-
ntial (CSR-0
ial (CSI-001
o hydraulic rrst day of infl
g Procedure
ppropriate, 2res for flow-pn the flow of sis.
cal Limits Sa
ocal Limit Stud
Frequen
es
recommendPOCs; and 1POTW-specstem to calcnd POTW-spnly allow for
mended samcapacity is a should be cfluent, efflueimits develo
Table 2 Sam
ation
-001) 1
)
r Sludge (SL
-001)
001)
)
retention timluent sample
s
24-hour comproportional the discharg
ampling Plan
y Report\Samp
ncies and
ds 1 to 2 day1 to 2 days ocific POCs foculate local lpecific POCsgrab sampl
mpling days at least 7 cocollected durent, and biospment.
mpling Loca
LD-002)
me, second de.
mposite sampsampling, wge being sam
n
pling Plan\Loca
Procedu
ys of samplinof sampling for POTW inflimits. Samps and shouldes (e.g. pH,
for initial locnsecutive saring dry, norsolids. Table
ation and Sa
Co
National POCs
7
7
2
2
7
7
7
ay of effluen
pling will be with discrete mpled, and t
al Limits Samp
ures
ng for organfor sludge/biluent, primarling days shd be 24-houcyanide, an
cal limits devampling daysmal operatine 2 presents
ampling Fre
onsecutive Other PrioPollutant
Metal7
7
2
2
7
7
7
nt sample wi
conducted isamples (althen combin
ling Plan (rev 3
nic priority poiosolids, andry effluent a
hould be conr composite
nd temperatu
velopment fos. For a locang conditionss a summary
equency
Sampling Dority ts -
OtP
ill be collecte
n accordancliquots) collened to form a
July
3).docx
ollutants to d 7 to 14 daynd final efflu
nsecutive day samples unure).
or POTWs oal limits studs in the y of sampling
Days ther PriorityPollutants -
Organic 7
7
2
2
7
7
7
ed 48 hours
ce with standected over tima single sam
2012
ys of uent, ys
nless
of up y,
g
y
dard me
mple

City of Br
Page 5
J:\PROJ\46
Grab samEstablisha series osamples between will be an
At the tim
Biosolid sdrying bewithin theanalysis.
Sampling
SamplesTeflon ana glass s1669, Sasamplingfor returnshipped olab, as reinvolving
Table 3 pfor wet st
For biosoFor the cthe sludgmixed an
Table
P
Nationa
Arse
Cadm
Chro
rawley – Loc
66\466-56\O Lo
mpling will behing Test Proof grab samare recommeach grab s
nalyzed sepa
me of grab sa
samples (SLeds. Severale sludge dry
g Equipment
can be collend HDPE bosampling botampling Ambg bottles musn shipping noon ice (belowequired. Clea handling of
presents a stream analys
olids samplincenter of eacge using a cond transferre
3 Sampling
arameters
al POCs
nic
mium
mium (Total
cal Limits Sa
ocal Limit Stud
e conductedocedures forples over th
mended at a sample for aarately and t
ample collec
LD-001) requ aliquots (m
ying beds an
t
ected with aottles can bettle. The exabient Water fst be pre-cleot later than w 4 oC and dan, non-talcf the samplin
summary of ssis.
ng (SLD-001ch quarter, aoring device
ed to a 1 L H
g Type, Size
Sam
C
C
l) C
ampling Plan
y Report\Samp
d for cyanider the Analyse course of minimum. T flow-proporthe results w
ction, pH, an
uire that a coinimum 4 ald the aliquo
Teflon bottl interchange
amples of othfor Determin
eaned at the one week p
dark) by ove, polyethylen
ng apparatus
sampling typ
1), samples wa single core . Samples frDPE bottle.
e, Containe
mpling Type
omposite
omposite
omposite
n
pling Plan\Loca
e as specifiedis of Pollutana 24-hour pe
The interval wrtioned grab will be averag
nd temperatu
omposite saiquots) are tts are comp
e, HDPE boeable but BOher samplingnation of Met
laboratory pprior to the saernight couriene gloves ms, samples a
pe, size, con
will be takensample will
rom each qu
r, and PreseSample
MiniSamplin
Cont
200 ml, H
200 ml, H
200 ml, H
al Limits Samp
d by 40 CFRnts. Where geriod is recowaste streamcomposite sged accordi
ure will be m
ample be taktaken from ra
posited to for
ottle, or glassOD and orgag devices artals at EPA performing thampling episer and preseust be worn
and blanks.
ntainer, and
n by dividingbe collected
uarter will be
ervation for
mum ng Size & tainer
HDPE
HDPE
HDPE
ling Plan (rev 3
R Part 136, Ggrab sampleommended. m flow will besample. Theng to flow w
measured an
ken of the sluandomly selrm a single s
s bottle (minanic priority pre provided iQuality Critehe analysis sode. Sampervation comduring all o
preservation
g drying bed d through th
e combined a
r Pollutants
Pres
HNO3 – pH
HNO3 – pH
HNO3 – pH
July
3).docx
Guidelines es are necesFour grab e measured
e grab sampweight.
d recorded.
udge mass iected locatio
sample for
nimum 1 literpollutants ren EPA Metheria Levels. Tand schedules must be
mpleted on sperations
n for pollutan
into quartere entire depand thoroug
s: Wet Strea
servation
H<2, 4 oC, Da
H<2, 4 oC, Da
H<2, 4 oC, Da
2012
ssary,
le
n ons
r). equire hod The led
ite or
nts
rs. pth of hly
am
ark
ark
ark

City of Br
Page 6
J:\PROJ\46
P
Copp
CyanFree
Lead
Merc
Moly
Nicke
Selen
Silve
Zinc
BOD
TSS
Amm
TKN
Nitra
Nitrite
Other S
COD
Bis(2ethyl
Oil a1 %Tota2 Preven
All samp
P S S F
Sampling
The sam
rawley – Loc
66\466-56\O Lo
arameters
per
nide (Total &Cyanide)
d
cury
bdenum
el
nium
r
1
monia (as N)
(as N)
te (as N)
e (as N)
Site Specific
D
2-hexyl)phtha
nd Grease
l Solids for Snt contamina
le containers
Project NameSampling DatSampling Loc
ield Measur
g Quality Ass
pling progra
cal Limits Sa
ocal Limit Stud
Sam
C
&
C
C
C
C
C
C
C
C
C
C
C
C
C
c Pollutants
C
late 2 C
Sludge and Bation from sa
s will be labe
e te and Timecation rement (Tem
surance/Qua
am will includ
ampling Plan
y Report\Samp
mpling Type
omposite
Grab
omposite
omposite
omposite
omposite
omposite
omposite
omposite
omposite
omposite
omposite
omposite
omposite
omposite
s
omposite
omposite
Grab
Biosolids ampling equi
eled with the
mperature & p
ality Control
de the follow
n
pling Plan\Loca
MiniSamplin
Cont200 ml, H
500 ml, H
200 ml, H
200 ml, H
200 ml, H
200 ml, H
200 ml, H
200 ml, H
200 ml, H
Glass BOContainer
100 ml, H
400 ml, H
500 ml, H
100 mL, H
100 mL, H
200 ml, H
200 ml, G
1 L, Glass
ipment and g
e following in
pH)
l
wing quality a
al Limits Samp
mum ng Size & tainer
HDPE
HDPE
HDPE
HDPE
HDPE
HDPE
HDPE
HDPE
HDPE
OD r
HDPE
HDPE
HDPE
HDPE
HDPE
HDPE
Glass
s
gloves conta
nformation:
assurance/q
ling Plan (rev 3
Pres
HNO3 – pH
NaOH – pHDark
HNO3 – pH
HNO3 – pH
HNO3 – pH
HNO3 – pH
HNO3 – pH
HNO3 – pH
HNO3 – pH
4 oC, Dark
4 oC, Dark
H2SO4 – pH
H2SO4 – pH
4 oC, Dark
4 oC, Dark
H2SO4 – pH
4 oC, Dark
H2SO4 – pH
aining plastic
uality contro
July
3).docx
servation
H<2, 4 oC, Da
H>12, 4 oC,
H<2, 4 oC, Da
H<2, 4 oC, Da
H<2, 4 oC, Da
H<2, 4 oC, Da
H<2, 4 oC, Da
H<2, 4 oC, Da
H<2, 4 oC, Da
H<2, 4 oC, D
H<2, 4 oC, D
H<2, 4 oC, D
H<2, 4 oC, D
c.
ol sampling:
2012
ark
ark
ark
ark
ark
ark
ark
ark
Dark
Dark
Dark
Dark

City of Br
Page 7
J:\PROJ\46
Oex
O T O
co
Flow Dat
Flow data
T S S
4. A All sampAll samp503, Stanpollutantsselected.
Table 4 spollutants
Na
rawley – Loc
66\466-56\O Lo
One set of spxcept VOCs
One set of duTrip blanks foOne set of eqollected by a
ta
a will be coll
Total POTWSludge flow Sludge flow t
Analytical
ling and analing and anandards for ths, an analyti.
summarizess.
Tab
Paramete
ational POC
Arsenic
Cadmium
Chromium
Copper
Cyanide (TFree Cyani
Lead
Mercury
cal Limits Sa
ocal Limit Stud
plit samples s. uplicate samor one set ofquipment blaautomatic sa
lected as fol
W flow (WAS) to Deto disposal
l Methods
alysis of wasalysis of bioshe Use or Dical method
s the recomm
ble 4 Maxim
ers 1
Cs
(Total)
Total & ide) 2
ampling Plan
y Report\Samp
collected at
mples collectef VOC sampanks collecteampler.
lows:
ewatering U
s
stewater will solids/sludgeisposal of Sewhich has th
mended max
um Reporti
MaximumReporting
Limit
0.5
0.1
0.5
0.5
3
0.25
0.0005
n
pling Plan\Loca
the WWTP
ed at the WWles collected
ed at the WW
nit
be conductee will be conewage Sludghe most sen
ximum repor
ing Limits f
m g Units
μg/L
μg/L
μg/L
μg/L
μg/L
μg/L
μg/L
al Limits Samp
influent for e
WTP influend at the WWWTP influent
ed in accordducted in acge. To accur
nsitive and lo
rting limits an
for Analytic
s An
L
L
L
L
L S
L
L
ling Plan (rev 3
each group o
t for VOCs. WTP influent.
t for each gr
dance with 4ccordance wrately detect
owest detect
nd analytica
al Methods
nalytical Me
EPA 200.8
EPA 200.8
EPA 200.8
EPA 200.8
SM 4500-CN
EPA 200.8
EPA 245.
July
3).docx
of analytes
roup of analy
0 CFR Part with 40 CFRt trace levelstion limit will
l methods fo
ethod
8
8
8
8
N E
8
1
2012
ytes
136. Part s of be
or
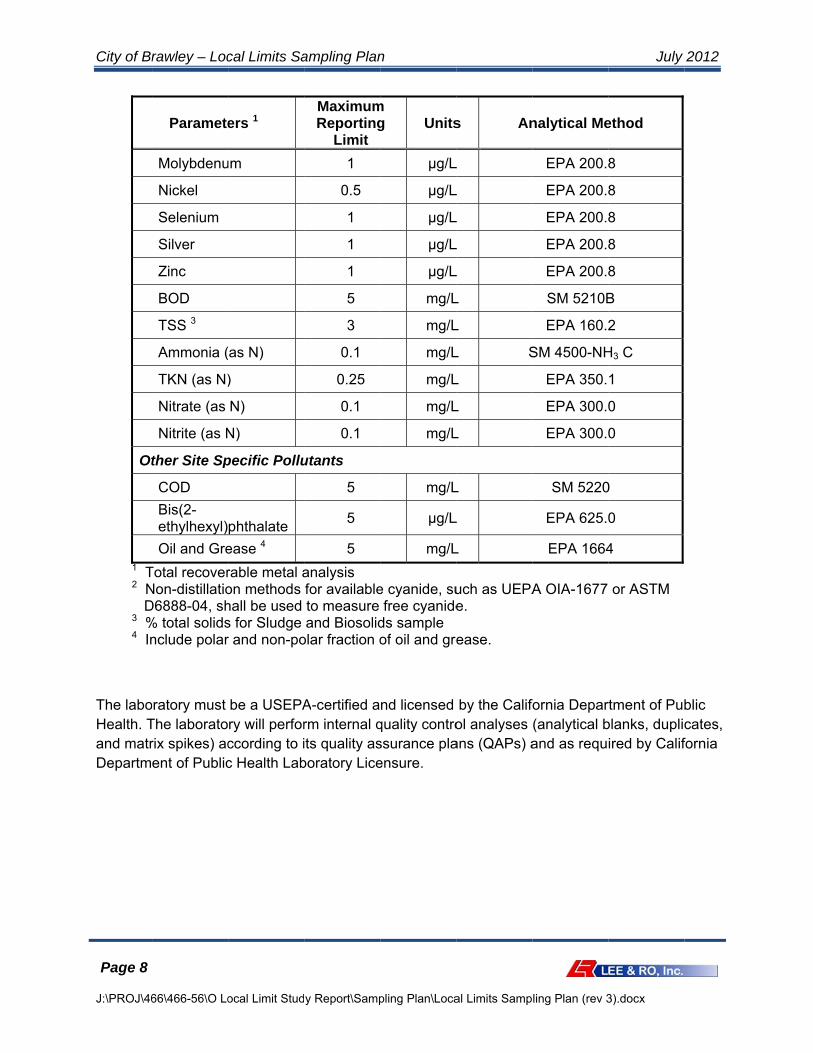
City of Br
Page 8
J:\PROJ\46
Ot
1 T2 N D3 %4 In
The laboHealth. Tand matrDepartm
rawley – Loc
66\466-56\O Lo
Paramete
Molybdenu
Nickel
Selenium
Silver
Zinc
BOD
TSS 3
Ammonia (
TKN (as N)
Nitrate (as
Nitrite (as N
ther Site Sp
COD
Bis(2-ethylhexyl)
Oil and Gre
Total recoverNon-distillatioD6888-04, sh% total solidsnclude polar
oratory must The laboratorix spikes) acent of Public
cal Limits Sa
ocal Limit Stud
ers 1
um
(as N)
)
N)
N)
pecific Pollu
phthalate
ease 4
rable metal aon methods hall be used s for Sludge r and non-po
be a USEPAry will perforccording to ic Health Lab
ampling Plan
y Report\Samp
MaximumReporting
Limit 1
0.5
1
1
1
5
3
0.1
0.25
0.1
0.1
utants
5
5
5
analysis for availableto measure and Biosolid
olar fraction o
A-certified arm internal qits quality asboratory Lice
n
pling Plan\Loca
m g Units
μg/L
μg/L
μg/L
μg/L
μg/L
mg/L
mg/L
mg/L
mg/L
mg/L
mg/L
mg/L
μg/L
mg/L
e cyanide, sufree cyanide
ds sample of oil and gre
nd licensed quality controssurance plaensure.
al Limits Samp
s An
L
L
L
L
L
L
L
L S
L
L
L
L
L
L
uch as UEPAe.
ease.
by the Califool analyses
ans (QAPs) a
ling Plan (rev 3
nalytical Me
EPA 200.8
EPA 200.8
EPA 200.8
EPA 200.8
EPA 200.8
SM 5210B
EPA 160.2
SM 4500-NH
EPA 350.
EPA 300.0
EPA 300.0
SM 5220
EPA 625.0
EPA 1664
A OIA-1677
fornia Depar(analytical band as requ
July
3).docx
ethod
8
8
8
8
8
B
2
H3 C
1
0
0
0
0
4
or ASTM
rtment of Pubblanks, duplicired by Calif
2012
blic cates, fornia

City of Br
rawley – Loccal Limits Sa
Daily S
ampling Plan
AppSampling
n
pendix g Activit
A ty Scheddule
July 2012

C
A
123P
4
City of Brawley
Appendix A: D
Sampling Days
CDay 1 Day 2 Day 3 Day 4 Day 5 Day 6 Day 7 Day 8 Day 9
. Abbreviations
. Due to hydrau
. Influent (INF-0Parameters
Composite SArsenic, CadNickel, Selen(as N), Nitrite
. Biosolids (SLD
Composite SNot Required
– Local Limits S
Daily Sampling
Influent (INF-001) (
CS GS C√ √
√ √
√ √
√ √
√ √
√ √
√ √
– CS: Composiulic retention tim001), Final Efflue
Sampling Paramdmium, Chromiunium, Silver, Zine (as N), COD, B
D-001) and Seco
Sampling Paramd.
Sampling Plan
g Activity Sch
Final Effluent EFF-001)
B(S
CS GS C
√ √
√ √
√ √
√ √
√ √
√ √
√ √
ite Sampling, Gme, first day efflu
ent (EFF-001),
meters um (total), Coppnc, BOD, TSS, ABis(2-ethylhexy
ondary Clarifier
meters GAM(G
hedule
S
Biosolid SLD-001) Cla
CS GS C
√
√
S: Grab Sampliuent sample will Commercial (CS
per, Lead, MercuAmmonia (as N)l)phthalate,
Sludge (SLD-0
Grab Sampling Arsenic, CadmiuMercury, Molybd(as N), TKN (as Grease (Polar a
Sampling Locat
Secondary arifier Sludge (SLD-002)
CS GS
√ √
ng. be collected 48
SC-001), Resid
ury, Molybdenum), TKN (as N), N
002) Sampling P
Parameters um, Chromium (denum, Nickel, N), Nitrate (as
and Non-polar)
tions
Commercial(CSC-001)
CS GS√ √
√ √
√ √
√ √
√ √
√ √
√ √
8 hours after firsential (CSR-001
Grab Sm,
Nitrate Cyanid(Polar
Parameters
(total), Copper, Selenium, SilveN), Nitrite (as N
Residentia(CSR-001
CS G√ √
√ √
√ √
√ √
√ √
√ √
√ √
st day influent s1), and Industria
Sampling Paramde (Total and Frand Non-polar)
Cyanide (Total er, Zinc, % TotaN), Bis(2-ethylhe
al )
Industr(CSI-00
GS CS √ √ √ √
√ √
√ √
√ √
√ √
√ √
ample. al (CSI-001) Sa
meters ree), Oil and Gr)
and Free), Leal Solids (TS), A
exyl)phthalate, O
July 2012
rial 01)
GS √
√
√
√
√
√
√
mpling
rease
ad, mmonia Oil and

C
City of Brawley
– Local Limits SSampling Plan July 2012

Appendix II
WWTP Influent and Effluent, Sludge, and Priority Pollutants Analysis Data

City of Brawley ‐ Local Limits Study
2010 ‐ 2011 Brawley WWTP NPDES Monitoring Data ‐ Influent
BOD TSSTotal
Ammonia
Oil and
Grease
DATE mg/L mg/L mg/L mg/L
Jan‐10 171 175 26.7 13.7
Feb‐10 128 204 24.6 7.3
Mar‐10 134 162 22.6 12.4
Apr‐10 176 130 32.8 21.3
May‐10 183 169 35.7 20.0
Jul‐10 128 471 30.0 ND
Aug‐10 134 181 21.7 ND
Sep‐10 140 170 22.8 7.6
Oct‐10 144 159 22.8 ND
Nov‐10 120 197 22.0 12.4
Dec‐10 129 196 34.0 17.8
Jan‐11 122 717 31.4 9.0
Feb‐11 150 348 37.6 19.3
Mar‐11 378 366 32.0 16.0
Apr‐11 241 152 43.8 15.6
May‐11 259 152 37.8 9.0
Jun‐11 232 101 35.0 10.7
Jul‐11 204 98 27.4 ND
Aug‐11 155 161 33.5 ND
Sep‐11 168 217 35.4 25.7
Oct‐11 149 124 21.7 25.7
Nov‐11 190 163 24.2 40.8
Dec‐11 185 205 26.9 21.4
J:\PROJ\466\466‐56\K Calcs\Brawley ‐ Sampling Data and Local Limits Calculation (rev 3).xlsx NPDES Data

City of Brawley ‐ Local Limits Study
2010 ‐ 2011 Brawley WWTP NPDES Monitoring Data ‐ Effluent
BOD TSS pH Temperature E. ColiFecal
ColiformEnterococci
DATE mg/L mg/LStandard
UnitsDeg. F
MPN/100
ml
MPN/100
mlMPN/100 ml
Jan‐10 26.4 15.81 7.9 59 56.6 56.0 12.7
Feb‐10 19.3 14.11 7.9 63 10.0 11.0 8.0
Mar‐10 29.2 13.97 7.9 65 9.1 36.6 17.4
Apr‐10 57.6 15.74 8.0 69 14.3 32.7 10.7
May‐10 36.6 17.52 8.0 73 58.3 164.3 77.6
Jul‐10 34.8 20.6 8.0 86 1.1 3.0 4.2
Aug‐10 37.9 20.6 7.8 85 1.6 3.5 3.8
Sep‐10 35.1 25.3 7.7 81 5.2 13.6 2.3
Oct‐10 36.3 13.3 7.8 75 12.0 25.6 2.6
Nov‐10 30.2 16.7 7.8 65 19.7 20.4 6.5
Dec‐10 23.0 22.7 7.8 61 91.2 147.9 77.6
Jan‐11 28.7 26.3 7.9 59 69.3 114.2 69.3
Feb‐11 28.8 27.9 7.9 60 299 281 465
Mar‐11 54.8 35.6 7.7 67 362 500 1,426
Apr‐11 36.6 33.3 7.9 72 1,758 1,600 1,600
May‐11 56.7 34.0 7.8 73 756 882 741
Jun‐11 60.8 22.3 7.9 78 2,263 1,600 1,426
Jul‐11 38.3 11.6 7.9 85 1.8 7.7 4.0
Aug‐11 11.1 8.7 7.7 88 4.3 18.8 9.5
Sep‐11 9.6 5.5 7.4 89 3.0 6.4 2.8
Oct‐11 11.3 4.7 7.5 80 7.0 24.5 7.1
Nov‐11 10.3 4.6 7.7 74 5.7 10.3 4.9
Dec‐11 11.0 6.6 7.3 67 12.7 28.8 15.1
J:\PROJ\466\466‐56\K Calcs\Brawley ‐ Sampling Data and Local Limits Calculation (rev 3).xlsx NPDES Data

City of Brawley ‐ Local Limits Study
2010 ‐ 2011 Brawley WWTP NPDES Monitoring Data ‐ Effluent (Continued)
DO Nitrate Nitrite Ammonia TN TP TDS O&G
DATE mg/L mg/L mg/L mg/L mg/L mg/L mg/L mg/L
Jan‐10 4.3 3.65 0.22 22.82 28.77 9.27 1,490 ND
Feb‐10 4.3 3.95 0.15 24.22 33.84 8.90 1,576 ND
Mar‐10 4.8 8.36 1.37 23.86 37.77 8.53 1,572 ND
Apr‐10 4.6 18.58 0.94 29.82 56.76 9.20 1,670 ND
May‐10 3.7 6.71 0.10 34.02 45.57 11.32 1,646 ND
Jul‐10 3.9 5.95 0.33 35.49 45.34 9.15 1,240 ND
Aug‐10 3.5 25.21 6.59 18.34 53.32 8.64 1,308 ND
Sep‐10 3.5 76.30 2.27 10.78 80.32 9.44 1,284 ND
Oct‐10 3.3 16.60 2.18 20.58 40.39 9.38 1,344 ND
Nov‐10 4.5 22.96 1.70 23.64 52.44 9.22 1,212 ND
Dec‐10 4.5 4.29 0.45 26.88 39.08 8.79 1,124 ND
Jan‐11 4.1 2.48 0.15 28.32 40.44 7.90 1,408 ND
Feb‐11 4.3 3.08 0.13 28.84 45.72 8.14 1,344 ND
Mar‐11 2.3 0.63 0.10 37.58 47.49 7.89 1,280 ND
Apr‐11 2.3 1.39 0.22 49.00 60.33 8.79 1,316 ND
May‐11 3.8 1.83 0.26 41.55 50.53 11.78 1,472 ND
Jun‐11 3.1 2.50 0.14 35.99 43.90 0.80 1,240 ND
Jul‐11 5.7 15.05 0.58 18.48 41.12 7.99 1,084 ND
Aug‐11 5.8 117 0.44 1.12 120.33 7.23 1,232 ND
Sep‐11 4.6 35.05 0.47 2.24 45.73 10.22 1,232 ND
Oct‐11 4.3 23.73 0.53 0.84 26.50 6.00 1,268 ND
Nov‐11 4.3 17.40 ND 0.78 19.78 3.70 1,304 ND
Dec‐11 3.6 18.23 ND 2.38 23.51 2.08 1,348 ND
J:\PROJ\466\466‐56\K Calcs\Brawley ‐ Sampling Data and Local Limits Calculation (rev 3).xlsx NPDES Data
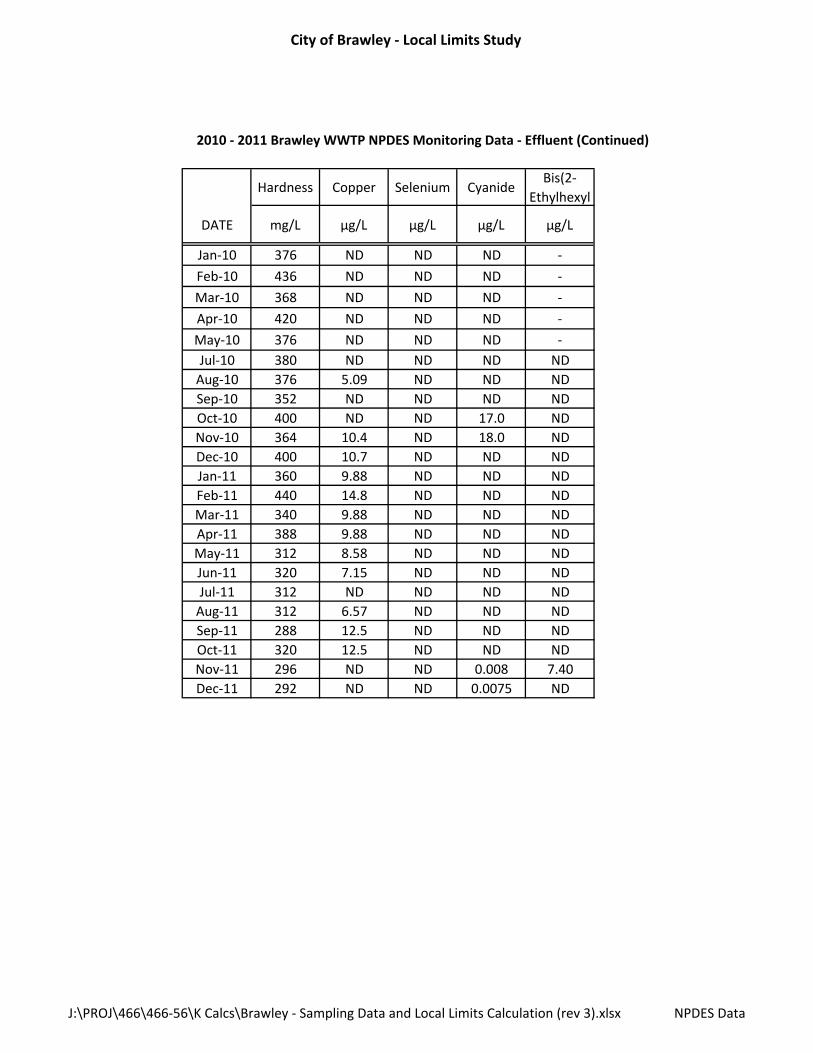
City of Brawley ‐ Local Limits Study
2010 ‐ 2011 Brawley WWTP NPDES Monitoring Data ‐ Effluent (Continued)
Hardness Copper Selenium CyanideBis(2‐
Ethylhexyl
DATE mg/L µg/L µg/L µg/L µg/L
Jan‐10 376 ND ND ND ‐
Feb‐10 436 ND ND ND ‐
Mar‐10 368 ND ND ND ‐
Apr‐10 420 ND ND ND ‐
May‐10 376 ND ND ND ‐
Jul‐10 380 ND ND ND ND
Aug‐10 376 5.09 ND ND ND
Sep‐10 352 ND ND ND ND
Oct‐10 400 ND ND 17.0 ND
Nov‐10 364 10.4 ND 18.0 ND
Dec‐10 400 10.7 ND ND ND
Jan‐11 360 9.88 ND ND ND
Feb‐11 440 14.8 ND ND ND
Mar‐11 340 9.88 ND ND ND
Apr‐11 388 9.88 ND ND ND
May‐11 312 8.58 ND ND ND
Jun‐11 320 7.15 ND ND ND
Jul‐11 312 ND ND ND ND
Aug‐11 312 6.57 ND ND ND
Sep‐11 288 12.5 ND ND ND
Oct‐11 320 12.5 ND ND ND
Nov‐11 296 ND ND 0.008 7.40
Dec‐11 292 ND ND 0.0075 ND
J:\PROJ\466\466‐56\K Calcs\Brawley ‐ Sampling Data and Local Limits Calculation (rev 3).xlsx NPDES Data


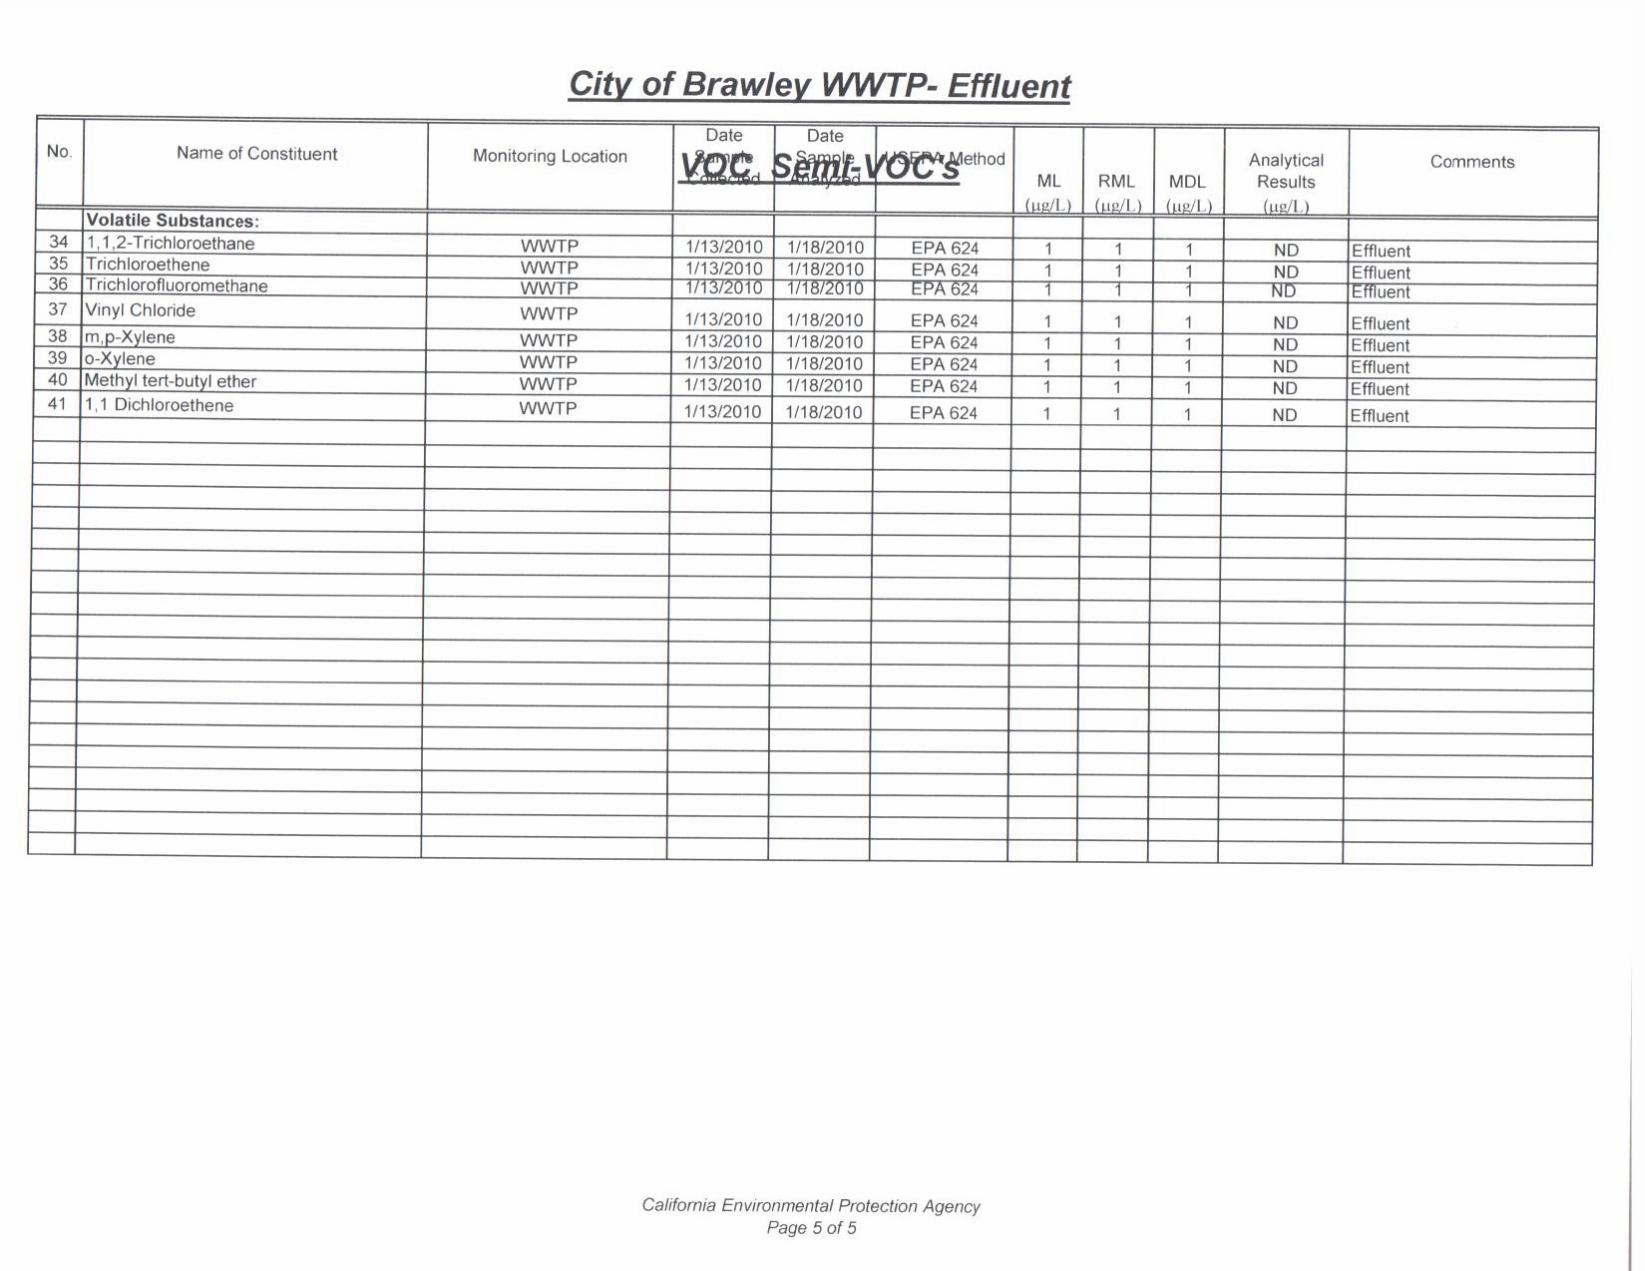


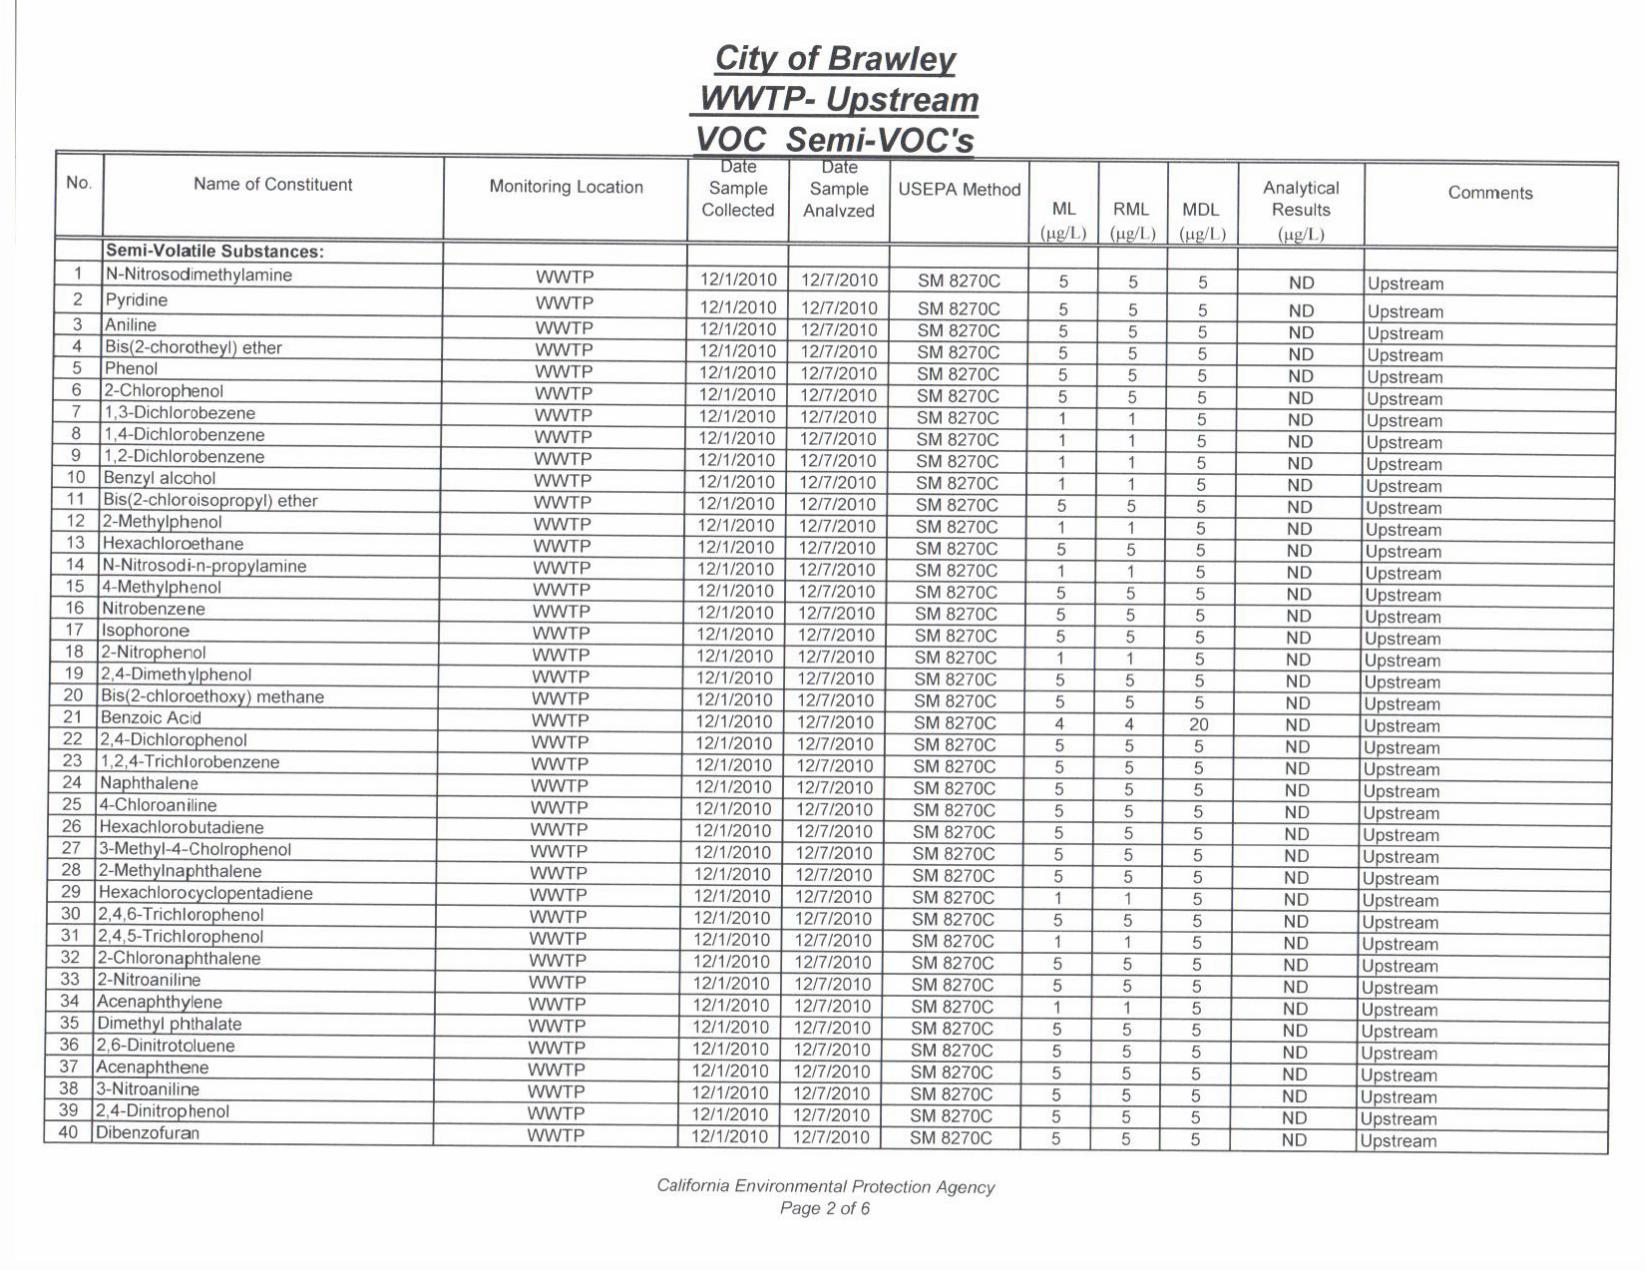

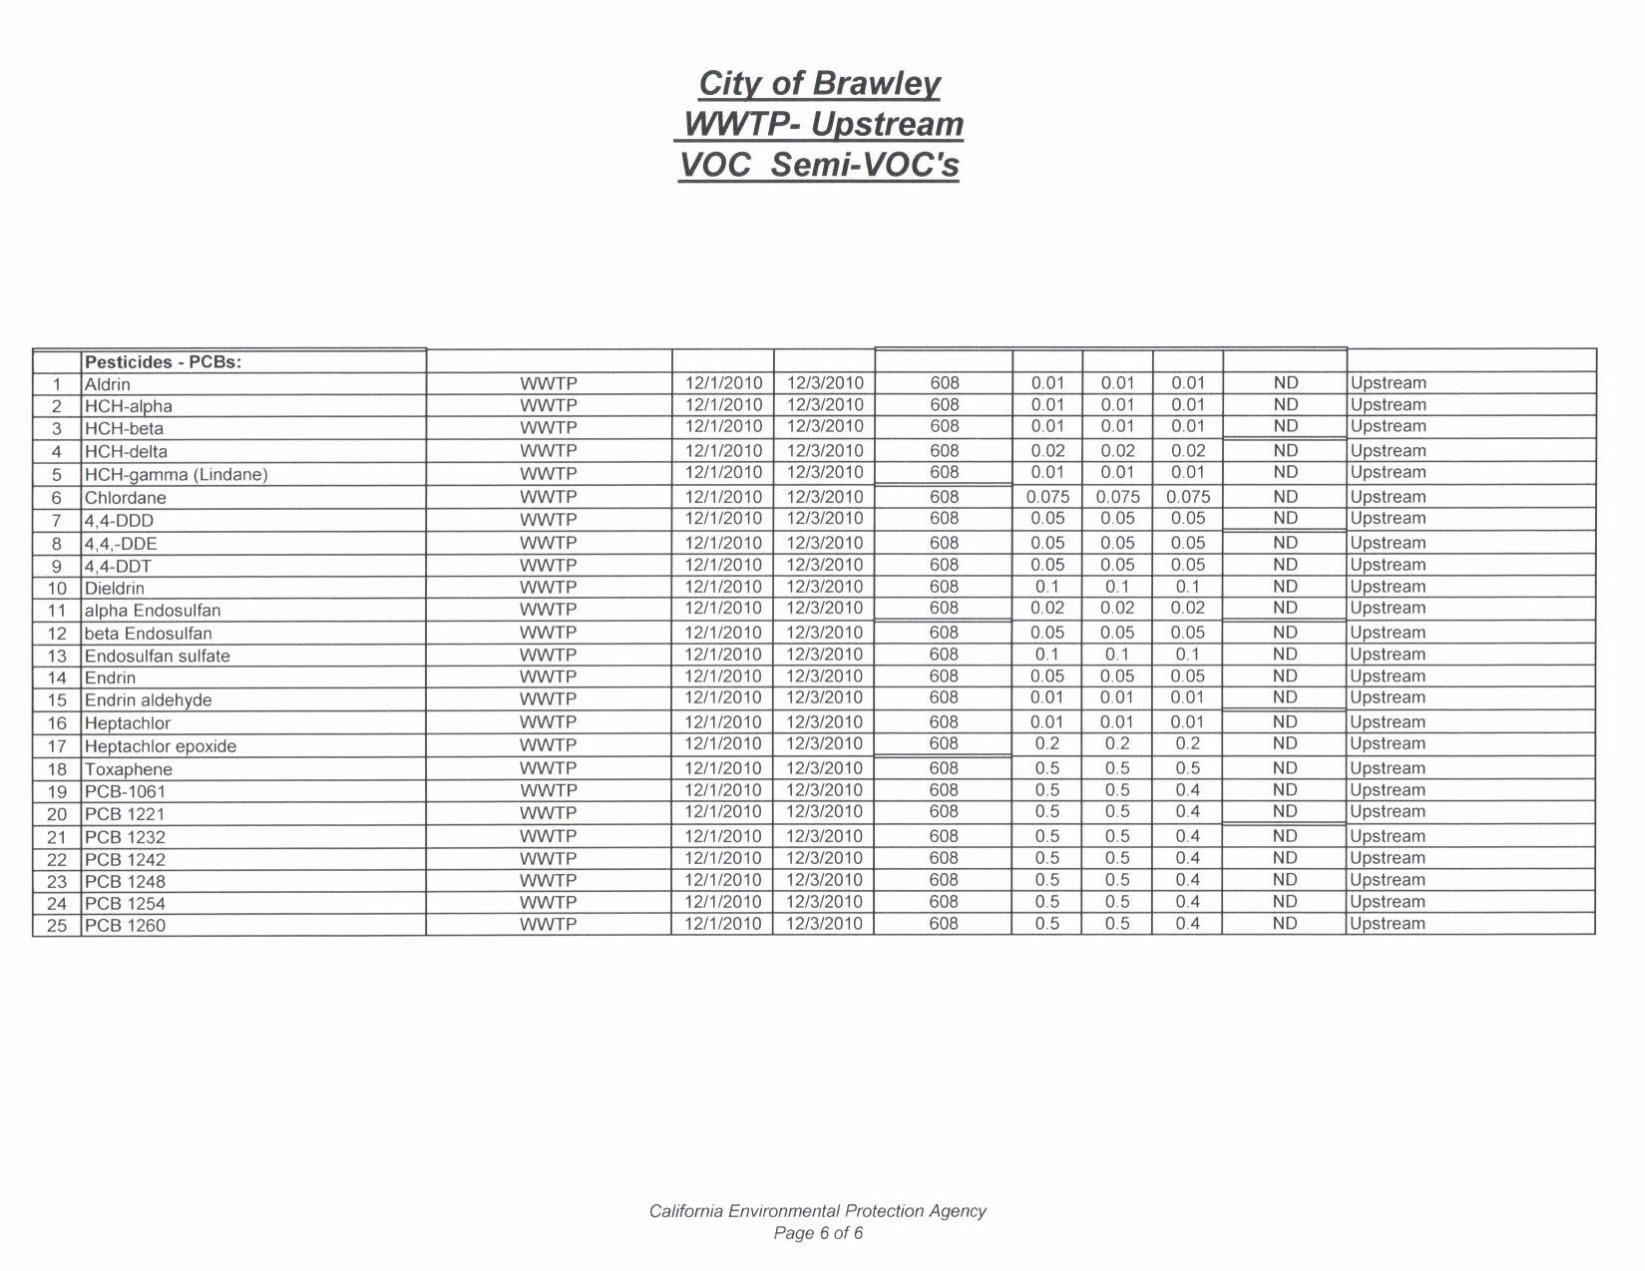


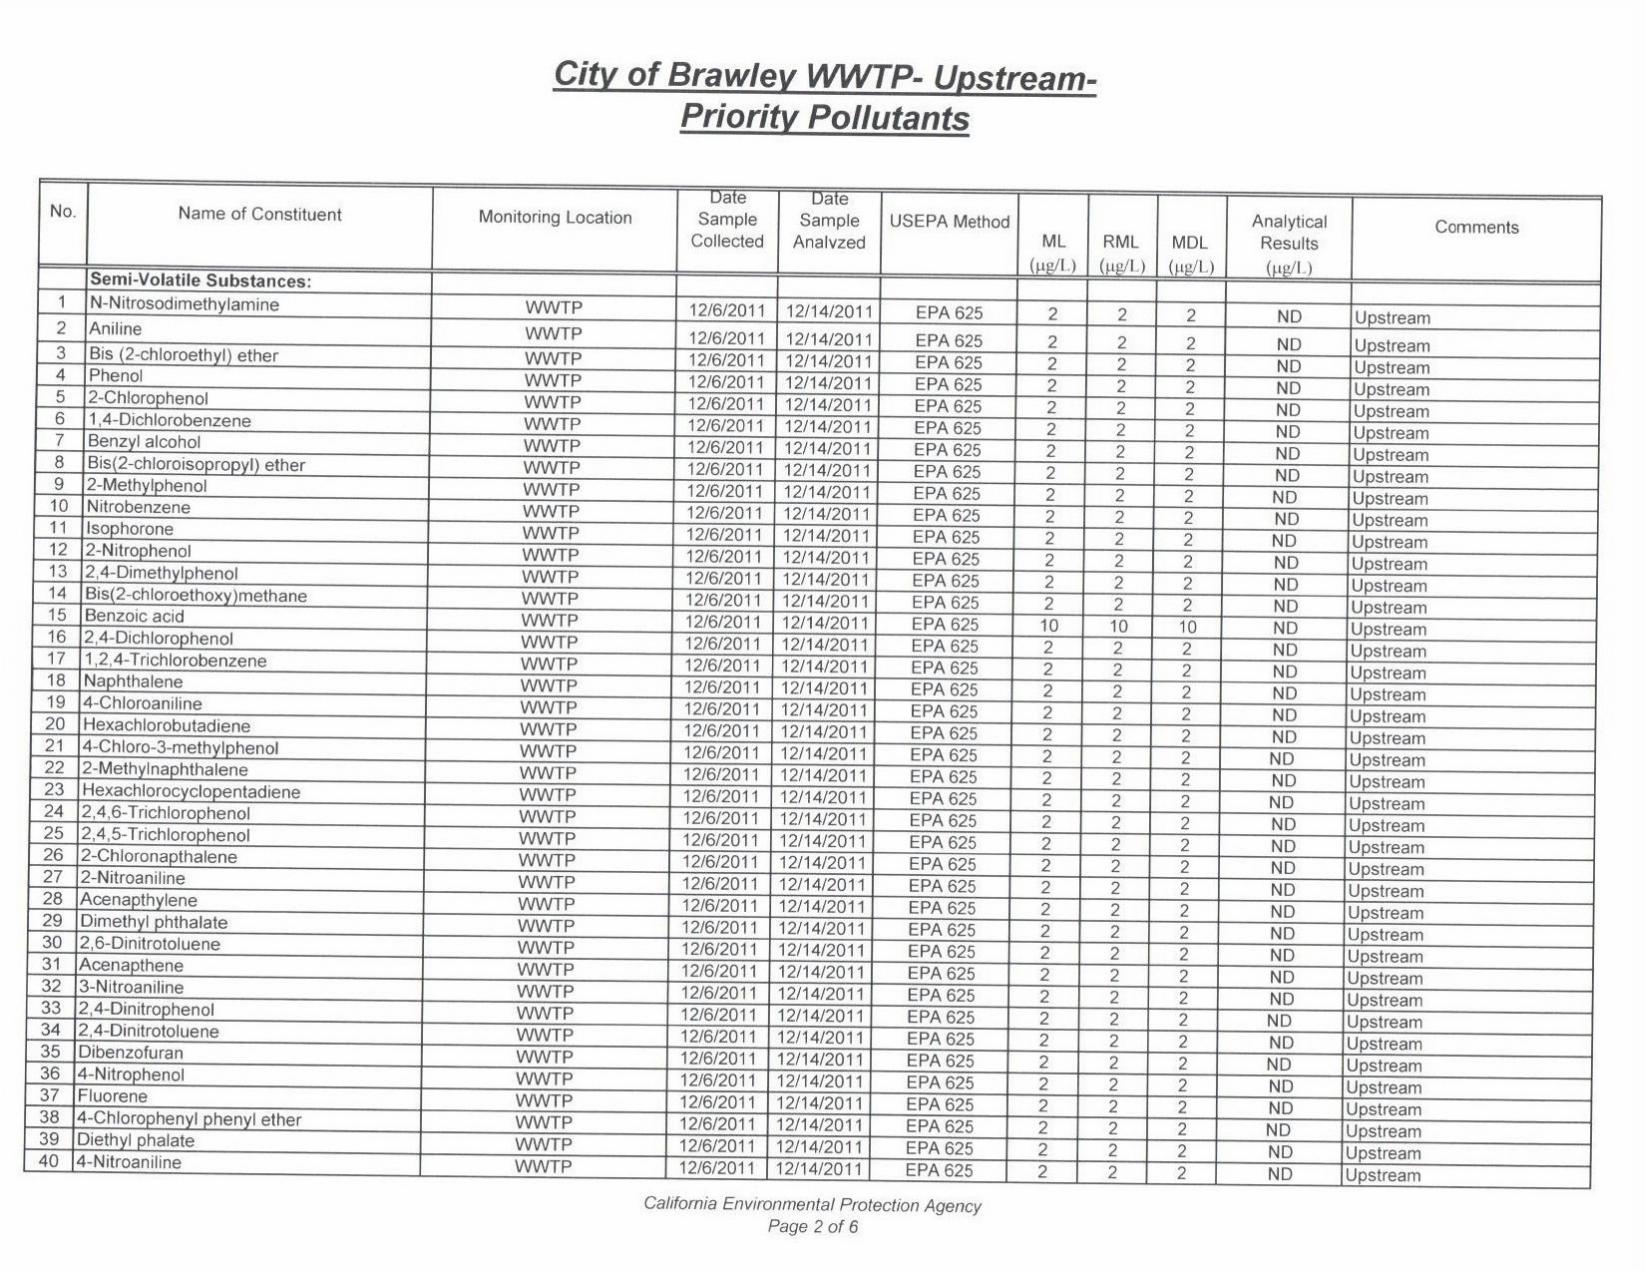


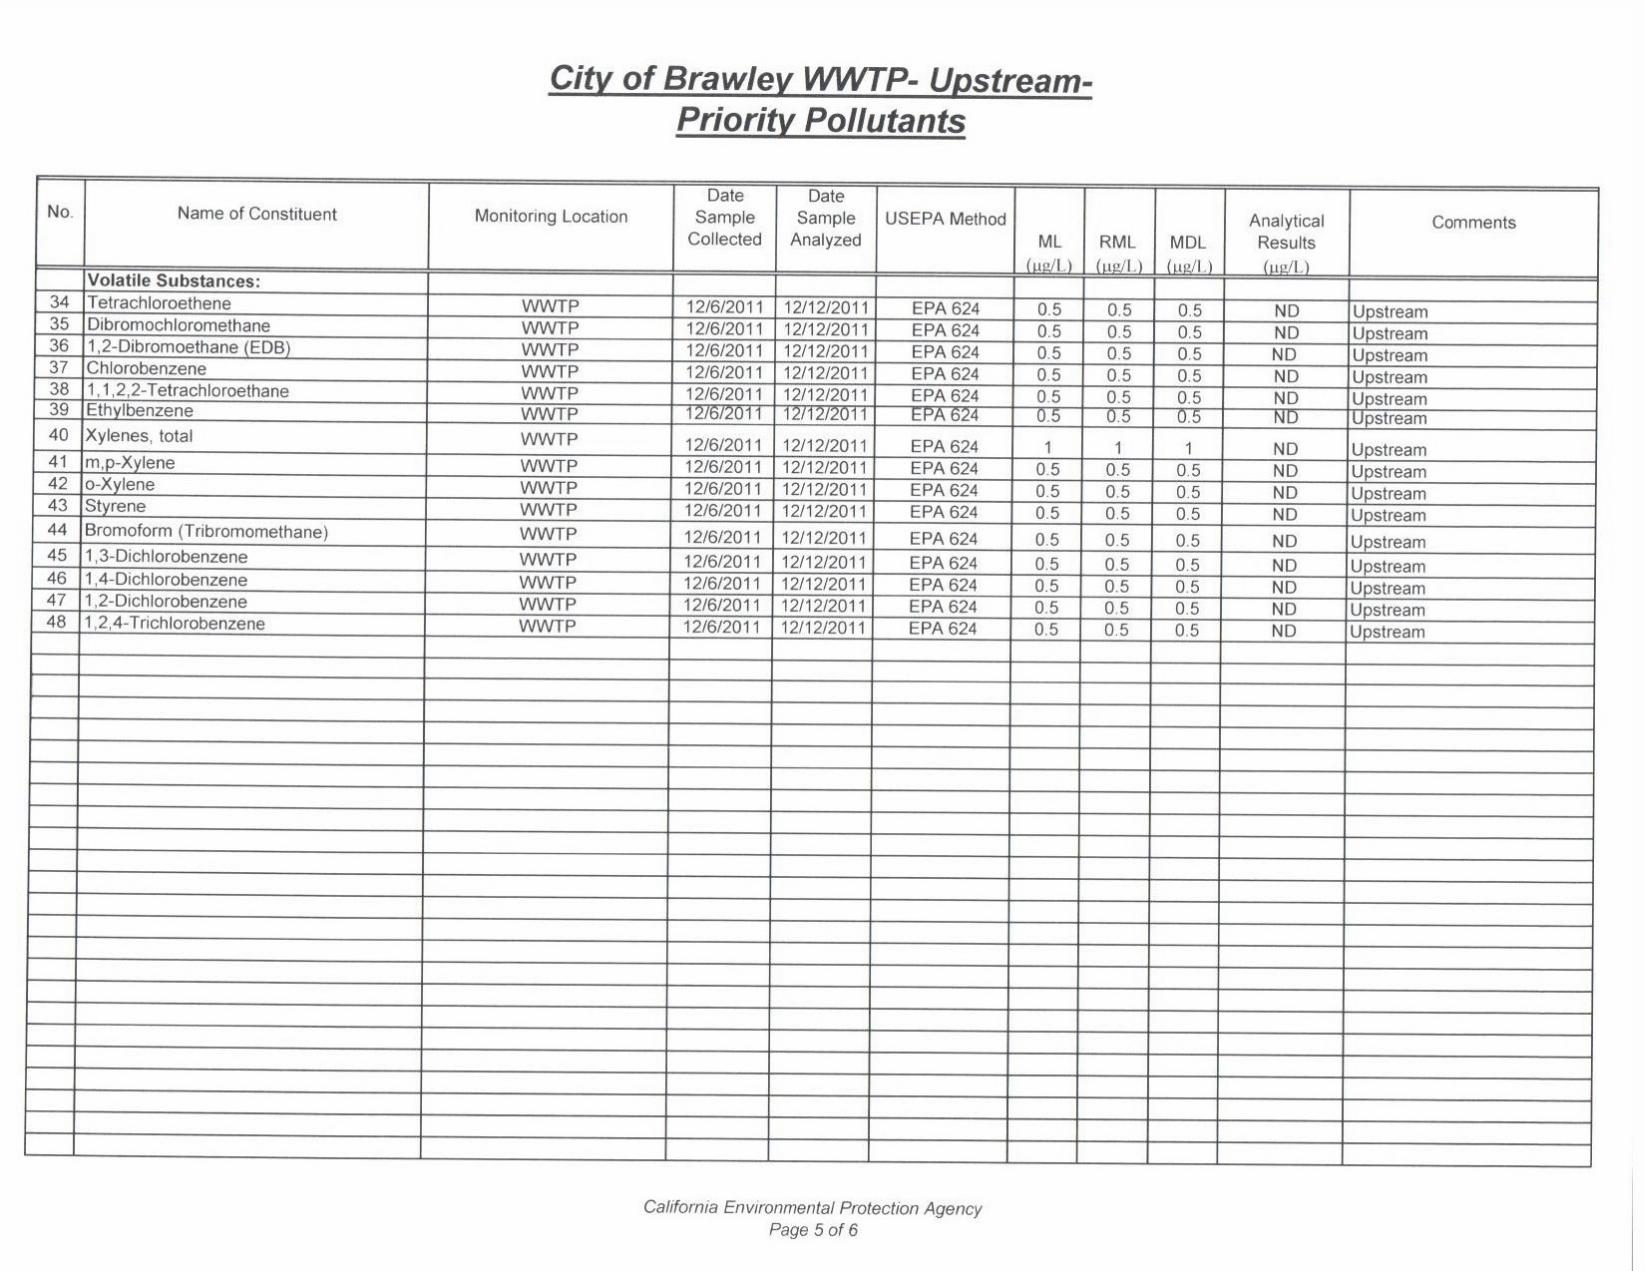


Appendix III
Sample Analyses Data

City of Brawley ‐ Local Limits Study
Day 1 Sample Analysis (8/2/2012)
Sampling Locations
Parameters Influent Final Effluent Biosolids Sec. Clarifier Commercial Residential Industrial
INF‐001 EFF‐001 SLD‐001 Sludge, SLD‐002 CSC‐001 CSR‐001 CSI‐001
(mg/L) (mg/L) (mg/Kg) (mg/Kg) (mg/L) (mg/L) (mg/L)
Arsenic ND 0.0011 ND ND 0.0014 J
Cadmium ND 0.00006 J ND 0.0011 J ND
Chromium ND 0.0007 ND ND ND
Copper 0.06 0.01 0.15 0.093 0.011
Cyanide (Total) ND ND ND ND ND
Cyanide (Free) ND ND ND ND ND
Lead 0.0042 J 0.0002 J 0.86 0.0011 J 0.00034 J
Mercury ND ND ND ND ND
Molybdenum 0.018 0.015 0.01 0.0055 J 0.031
Nickel 0.008 J 0.0027 No Sludge No Sludge 0.01 J 0.0064 J 0.008 J
Selenium 0.0019 J 0.0012 Data Data ND 0.0019 J 0.0015 J
Silver 0.00038 J ND on Day 1 on Day 1 0.0073 J 0.0003 J ND
Zinc 0.091 0.024 0.15 0.13 0.018
BOD5 130 ND 360 260 54
COD 490 42 550 640 190
TOC 39 9.3 140 59 27
TSS 340 ND 180 210 85
Ammonia‐N 60 ND 19 25 99
TKN 76 0.25 34 52 100
Nitrite‐N ND 0.02 ND ND ND
Nitrate‐N ND 35 ND 0.03 J ND
Oil and Grease (Total) 4.1 J 1.8 15 15 ND
Oil and Grease (Polar) 2.6 J ND 13 13 ND
Bis(2‐ethylhexyl)phthalate 0.26 0.09 0.096 0.064 0.11
ND: Not Detected or above the Maximum Detection Limit
J: Estimated (less than the RL, but greater than or equal to the lab MDL)
EFF sample: 48 hrs delayed due to WWTP HRT
Industrial sample (CSI‐001): from National Beef discharge
J:\PROJ\466\466‐56\K Calcs\Brawley ‐ Sampling Data and Local Limits Calculation (rev 1).xlsxBrawley ‐ Sampling Data and Local Limits Calculation (rev 1).xlsx D1

City of Brawley ‐ Local Limits Study
Day 2 Sample Analysis (8/3/2012)
Sampling Locations
Parameters Influent Final Effluent Biosolids Sec. Clarifier Commercial Residential Industrial
INF‐001 EFF‐001 SLD‐001 Sludge, SLD‐002 CSC‐001 CSR‐001 CSI‐001
(mg/L) (mg/L) (mg/Kg) (mg/Kg) (mg/L) (mg/L) (mg/L)
Arsenic ND 0.0011 ND ND ND
Cadmium ND 0.00006 J 0.00067 J ND ND
Chromium 0.0038 J 0.0006 0.0052 J ND ND
Copper 0.047 0.01 0.2 0.077 0.019
Cyanide (Total) ND ND ND ND ND
Cyanide (Free) ND ND ND ND ND
Lead 0.0039 J 0.0001 J 0.21 0.0007 J 0.0012 J
Mercury ND ND ND ND ND
Molybdenum 0.019 0.017 0.0075 J 0.0051 J 0.03
Nickel 0.0078 J 0.0028 No Sludge No Sludge 0.0057 J 0.0026 J 0.0071 J
Selenium ND 0.0011 Data Data ND ND ND
Silver ND ND on Day 2 on Day 2 0.0011 ND ND
Zinc 0.2 0.024 0.22 0.11 0.082
BOD5 200 3 540 260 260
COD 530 39 700 500 330
TOC 48 9.4 80 84 27
TSS 410 4 980 98 790
Ammonia‐N 71 ND 8.8 23 96
TKN 87 ND 20 34 100
Nitrite‐N ND ND ND ND 0.11
Nitrate‐N ND 38 ND ND ND
Oil and Grease (Total) 15 2 25 61 14
Oil and Grease (Polar) 12 ND 21 54 9.5
Bis(2‐ethylhexyl)phthalate 0.13 0.021 0.059 0.075 0.037
ND: Not Detected or above the Maximum Detection Limit
J: Estimated (less than the RL, but greater than or equal to the lab MDL)
EFF sample: 48 hrs delayed due to WWTP HRT
Industrial sample (CSI‐001): from National Beef discharge
J:\PROJ\466\466‐56\K Calcs\Brawley ‐ Sampling Data and Local Limits Calculation (rev 1).xlsxBrawley ‐ Sampling Data and Local Limits Calculation (rev 1).xlsx D2

City of Brawley ‐ Local Limits Study
Day 3 Sample Analysis (8/4/2012)
Sampling Locations
Parameters Influent Final Effluent Biosolids Sec. Clarifier Commercial Residential Industrial
INF‐001 EFF‐001 SLD‐001 Sludge, SLD‐002 CSC‐001 CSR‐001 CSI‐001
(mg/L) (mg/L) (mg/Kg) (mg/Kg) (mg/L) (mg/L) (mg/L)
Arsenic ND 0.0011 ND ND 0.0031 J
Cadmium ND 0.00007 J 0.00088 J ND 0.00065 J
Chromium 0.0039 J 0.0006 0.0066 J ND 0.0067 J
Copper 0.056 0.01 0.17 0.077 0.054
Cyanide (Total) ND ND ND ND ND
Cyanide (Free) ND ND ND ND ND
Lead 0.0033 J 0.0001 J 0.15 0.0012 J 0.0055 J
Mercury ND ND ND ND ND
Molybdenum 0.019 0.018 0.0067 J 0.0051 J 0.033
Nickel 0.0084 J 0.0029 No Sludge No Sludge 0.0067 J 0.0083 J 0.014 J
Selenium ND 0.0012 Data Data ND ND 0.0034 J
Silver ND ND on Day 3 on Day 3 ND ND ND
Zinc 0.21 0.025 0.32 0.15 0.41
BOD5 140 ND 990 180 260
COD 680 39 1600 510 990
TOC 63 9.3 270 65 53
TSS 390 7 1500 160 700
Ammonia‐N 69 0.076 J 22 26 110
TKN 100 ND 81 43 170
Nitrite‐N ND 0.07 ND ND ND
Nitrate‐N ND 38 J ND ND ND
Oil and Grease (Total) 10 4.4 89 22 15
Oil and Grease (Polar) 8.2 ND 84 19 13
Bis(2‐ethylhexyl)phthalate 0.18 0.026 0.14 0.087 0.046
ND: Not Detected or above the Maximum Detection Limit
J: Estimated (less than the RL, but greater than or equal to the lab MDL)
EFF sample: 48 hrs delayed due to WWTP HRT
Industrial sample (CSI‐001): from National Beef discharge
J:\PROJ\466\466‐56\K Calcs\Brawley ‐ Sampling Data and Local Limits Calculation (rev 1).xlsxBrawley ‐ Sampling Data and Local Limits Calculation (rev 1).xlsx D3

City of Brawley ‐ Local Limits Study
Day 4 Sample Analysis (8/5/2012)
Sampling Locations
Parameters Influent Final Effluent Biosolids Sec. Clarifier Commercial Residential Industrial
INF‐001 EFF‐001 SLD‐001 Sludge, SLD‐002 CSC‐001 CSR‐001 CSI‐001
(mg/L) (mg/L) (mg/Kg) (mg/Kg) (mg/L) (mg/L) (mg/L)
Arsenic ND 0.0011 ND ND 0.0026 J
Cadmium ND 0.0001 J 0.00064 J 0.00068 J 0.00086 J
Chromium 0.0065 J 0.0004 J 0.0065 J ND 0.0071 J
Copper 0.082 0.012 0.17 0.1 0.07
Cyanide (Total) ND ND ND ND ND
Cyanide (Free) ND ND ND ND ND
Lead 0.0052 J 0.0001 J 0.2 0.0012 J 0.0068 J
Mercury ND ND ND ND ND
Molybdenum 0.025 0.02 0.0059 J 0.0057 J 0.042
Nickel 0.0099 J 0.0027 No Sludge No Sludge 0.0068 J 0.0033 J 0.014 J
Selenium ND 0.0011 Data Data ND ND 0.0032 J
Silver ND 0.00016 J on Day 4 on Day 4 ND ND ND
Zinc 0.39 0.024 0.2 0.17 0.57
BOD5 280 ND 210 250 300
COD 1100 35 750 610 1200
TOC 68 8.9 81 67 43
TSS 540 ND 250 160 880
Ammonia‐N 63 0.22 8.1 27 100
TKN 110 ND 29 44 260
Nitrite‐N ND 0.1 ND ND 0.21
Nitrate‐N ND 36 ND ND ND
Oil and Grease (Total) 9.4 2.8 4.6 38 15
Oil and Grease (Polar) 2.4 ND ND 34 10
Bis(2‐ethylhexyl)phthalate 0.19 0.046 0.03 0.074 0.038
ND: Not Detected or above the Maximum Detection Limit
J: Estimated (less than the RL, but greater than or equal to the lab MDL)
EFF sample: 48 hrs delayed due to WWTP HRT
Industrial sample (CSI‐001): from National Beef discharge
J:\PROJ\466\466‐56\K Calcs\Brawley ‐ Sampling Data and Local Limits Calculation (rev 1).xlsxBrawley ‐ Sampling Data and Local Limits Calculation (rev 1).xlsx D4

City of Brawley ‐ Local Limits Study
Day 5 Sample Analysis (8/6/2012)
Sampling Locations
Parameters Influent Final Effluent Biosolids Sec. Clarifier Commercial Residential Industrial
INF‐001 EFF‐001 SLD‐001 Sludge, SLD‐002 CSC‐001 CSR‐001 CSI‐001
(mg/L) (mg/L) (mg/Kg) (mg/L) (mg/L) (mg/L) (mg/L)
Arsenic ND 0.0011 5.1 0.012 ND ND 0.0025 J
Cadmium ND 0.00006 J 0.99 J 0.0046 0.00059 J 0.00073 J 0.0011 J
Chromium ND 0.0005 2.8 0.058 0.0044 J ND ND
Copper 0.051 0.014 510 1.9 0.28 0.099 0.019
Cyanide (Total) ND ND 1.7 0.015 ND ND ND
Cyanide (Free) ND ND 1.3 0.015 ND ND ND
Lead 0.0028 J 0.0002 J 27 0.12 0.22 0.0011 J 0.0013 J
Mercury ND ND 0.17 J 0.0021 0.0002 ND ND
Molybdenum 0.017 0.02 21 0.061 0.011 0.0062 J 0.041
Nickel 0.0053 J 0.0029 24 0.084 0.0074 J 0.0034 J 0.0065 J
Selenium ND 0.0013 11 0.028 ND ND ND
Silver ND ND 1.4 0.006 J 0.0018 J ND ND
Zinc 0.13 0.026 610 3.1 0.23 0.14 0.11
BOD5 130 6 620 280 74
COD 470 42 1300 540 310
TOC 44 8.4 130 89 26
TSS 190 9 83 % 8300 2300 160 170
Ammonia‐N 47 0.2 3400 0.41 20 24 84
TKN 76 0.14 48000 390 51 39 200
Nitrite‐N ND 0.04 J ND 2.6 ND ND ND
Nitrate‐N ND 34 7.3 23 ND ND 0.88
Oil and Grease (Total) 11 3 J ND % 12 230 22 4.3
Oil and Grease (Polar) 8 ND ND % 4 J 220 19 2.7
Bis(2‐ethylhexyl)phthalate 0.18 0.024 ND 0.023 0.13 0.058 0.036
ND: Not Detected or above the Maximum Detection Limit
J: Estimated (less than the RL, but greater than or equal to the lab MDL)
EFF sample: 48 hrs delayed due to WWTP HRT
Industrial sample (CSI‐001): from National Beef discharge
J:\PROJ\466\466‐56\K Calcs\Brawley ‐ Sampling Data and Local Limits Calculation (rev 1).xlsxBrawley ‐ Sampling Data and Local Limits Calculation (rev 1).xlsx D5

City of Brawley ‐ Local Limits Study
Day 6 Sample Analysis (8/7/2012)
Sampling Locations
Parameters Influent Final Effluent Biosolids Sec. Clarifier Commercial Residential Industrial
INF‐001 EFF‐001 SLD‐001 Sludge, SLD‐002 CSC‐001 CSR‐001 CSI‐001
(mg/L) (mg/L) (mg/Kg) (mg/Kg) (mg/L) (mg/L) (mg/L)
Arsenic ND 0.001 4.2 J 0.021 ND ND ND
Cadmium ND 0.00005 J 1.2 0.0058 0.0014 J 0.0014 J ND
Chromium ND 0.0005 28 0.084 0.014 J ND ND
Copper 0.089 0.013 540 2.5 0.66 0.098 0.031
Cyanide (Total) ND ND 1.5 ND ND ND ND J
Cyanide (Free) ND ND 1.6 ND ND ND ND
Lead 0.0039 J 0.0002 J 29 0.15 0.45 0.0011 J 0.0025 J
Mercury ND ND 0.16 J 0.0036 0.00035 ND ND
Molybdenum 0.021 0.02 22 0.11 0.02 0.0061 J 0.032
Nickel 0.0071 J 0.003 22 0.1 0.014 J 0.0033 J 0.0092 J
Selenium ND 0.0012 11 0.038 ND ND ND
Silver ND ND 2.8 0.0098 0.0037 J ND ND
Zinc 0.15 0.025 610 3.5 0.57 0.17 0.22
BOD5 170 ND 1500 250 110
COD 530 31 1500 680 350
TOC 46 8.5 180 73 26
TSS 420 6 85 % 6700 2200 220 280
Ammonia‐N 42 0.067 J 2900 0.52 25 30 66
TKN 56 ND 49000 300 50 30 93
Nitrite‐N ND 0.08 J ND 0.94 ND ND 0.02 J
Nitrate‐N ND 33 ND 25 ND ND ND
Oil and Grease (Total) 9 3.2 0.19 % 3.6 23 16 4.6
Oil and Grease (Polar) 5.4 ND 0.16 % ND 20 13 ND
Bis(2‐ethylhexyl)phthalate 0.18 0.0033 0.69 J 0.02 0.094 0.072 0.034
ND: Not Detected or above the Maximum Detection Limit
J: Estimated (less than the RL, but greater than or equal to the lab MDL)
EFF sample: 48 hrs delayed due to WWTP HRT
Industrial sample (CSI‐001): from National Beef discharge
J:\PROJ\466\466‐56\K Calcs\Brawley ‐ Sampling Data and Local Limits Calculation (rev 1).xlsxBrawley ‐ Sampling Data and Local Limits Calculation (rev 1).xlsx D6

City of Brawley ‐ Local Limits Study
Day 7 Sample Analysis (8/8/2012)
Sampling Locations
Parameters Influent Final Effluent Biosolids Sec. Clarifier Commercial Residential Industrial
INF‐001 EFF‐001 SLD‐001 Sludge, SLD‐002 CSC‐001 CSR‐001 CSI‐001
(mg/L) (mg/L) (mg/Kg) (mg/Kg) (mg/L) (mg/L) (mg/L)
Arsenic ND 0.001 ND ND ND
Cadmium ND 0.00005 J 0.00082 J ND ND
Chromium ND ND 0.0096 J 0.0042 J ND
Copper 0.067 0.011 0.39 0.086 0.069
Cyanide (Total) ND ND ND ND ND
Cyanide (Free) ND ND ND ND ND
Lead 0.0038 J 0.0001 J 0.27 0.00087 J 0.0061 J
Mercury ND ND 0.0003 ND ND
Molybdenum 0.02 0.018 0.013 0.0058 J 0.048
Nickel 0.0084 0.0024 No Sludge No Sludge 0.0087 J 0.003 J 0.017 J
Selenium ND 0.001 Data Data ND ND 0.0029 J
Silver ND ND on Day 7 on Day 7 0.0014 J 0.0008 J ND
Zinc 0.24 0.024 0.32 0.11 0.49
BOD5 86 ND * 360 170 56
COD 680 37 1100 510 710
TOC 54 8.7 150 77 31
TSS 490 5 540 130 210
Ammonia‐N 50 ND 26 33 75
TKN 77 ND 44 55 130
Nitrite‐N ND 0.08 J ND ND 2
Nitrate‐N ND 40 ND ND ND
Oil and Grease (Total) 12 6.2 26 16 2.8 J
Oil and Grease (Polar) ND 3.4 J 21 7.6 ND
Bis(2‐ethylhexyl)phthalate 0.14 0.0027 J 0.075 0.064 0.05
ND: Not Detected or above the Maximum Detection Limit
J: Estimated (less than the RL, but greater than or equal to the lab MDL)
EFF sample: 48 hrs delayed due to WWTP HRT
Industrial sample (CSI‐001): from National Beef discharge
* Failed to analyze BOD5. Estimated as ND
J:\PROJ\466\466‐56\K Calcs\Brawley ‐ Sampling Data and Local Limits Calculation (rev 1).xlsxBrawley ‐ Sampling Data and Local Limits Calculation (rev 1).xlsx D7

Appendix IV
Flow and Loading Data
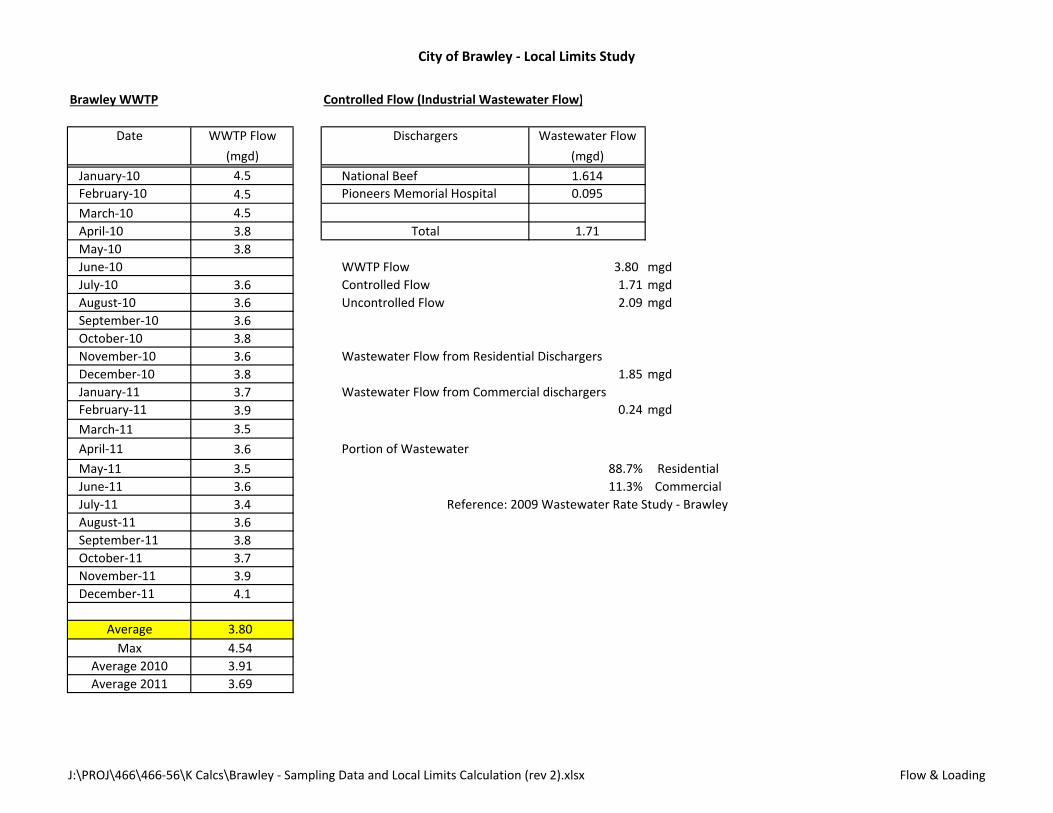
City of Brawley ‐ Local Limits Study
Brawley WWTP Controlled Flow (Industrial Wastewater Flow)
Date WWTP Flow Dischargers Wastewater Flow
(mgd) (mgd)
January‐10 4.5 National Beef 1.614
February‐10 4.5 Pioneers Memorial Hospital 0.095
March‐10 4.5
April‐10 3.8 Total 1.71
May‐10 3.8
June‐10 WWTP Flow 3.80 mgd
July‐10 3.6 Controlled Flow 1.71 mgd
August‐10 3.6 Uncontrolled Flow 2.09 mgd
September‐10 3.6
October‐10 3.8
November‐10 3.6 Wastewater Flow from Residential Dischargers
December‐10 3.8 1.85 mgd
January‐11 3.7 Wastewater Flow from Commercial dischargers
February‐11 3.9 0.24 mgd
March‐11 3.5
April‐11 3.6 Portion of Wastewater
May‐11 3.5 88.7% Residential
June‐11 3.6 11.3% Commercial
July‐11 3.4 Reference: 2009 Wastewater Rate Study ‐ Brawley
August‐11 3.6
September‐11 3.8
October‐11 3.7
November‐11 3.9
December‐11 4.1
Average 3.80
Max 4.54
Average 2010 3.91
Average 2011 3.69
J:\PROJ\466\466‐56\K Calcs\Brawley ‐ Sampling Data and Local Limits Calculation (rev 2).xlsx Flow & Loading

City of Brawley ‐ Local Limits Study
National Beef
Date Water Use Water Use Water Use Wastewater Flow
(gallon/month) (gpd) (mgd) (mgd)
Jul‐11 52910000 1763667 1.76
Aug‐11 54360000 1812000 1.81
Sep‐11 52840000 1761333 1.76
Oct‐11 52950000 1765000 1.77
Nov‐11 60180000 2006000 2.01
Dec‐11 62770000 2092333 2.09
Jan‐12 51150000 1705000 1.71 1.68
Feb‐12 55780000 1859333 1.86 1.55
Mar‐12 51460000 1715333 1.72 1.52
Apr‐12 68230000 2274333 2.27 1.66
May‐12 58720000 1957333 1.96 1.63
Jun‐12 58380000 1946000 1.95 1.63
Jul‐12 63550000 2118333 2.12 1.63
Aug‐12 57760000 1925333 1.93
Average 1907238 1.91 1.61
J:\PROJ\466\466‐56\K Calcs\Brawley ‐ Sampling Data and Local Limits Calculation (rev 2).xlsx Flow & Loading

City of Brawley ‐ Local Limits Study
Loading Summary
Parameters Average Influent WWTP Influent Residential Commercial Uncontrolled Controlled
Concentration Loading Loading Loading Loading Loading
(mg/L) (lbs/day) (lbs/day) (lbs/day) (lbs/day) (lbs/day)
Arsenic ‐ ‐ ‐ ‐ ‐ 0.032
Cadmium ‐ ‐ 0.015 0.0016 0.017 0.012
Chromium 0.0047 0.15 0.065 0.015 0.080 0.093
Copper 0.065 2.0 1.4 0.6 1.956 0.53
Cyanide (Total) ‐ ‐ ‐ ‐ ‐ ‐
Cyanide (Free) ‐ ‐ ‐ ‐ ‐ ‐
Lead 0.0039 0.12 0.016 0.7 0.68 0.046
Mercury ‐ ‐ ‐ 0.0006 0.0006 ‐
Molybdenum 0.020 0.63 0.087 0.021 0.11 0.49
Nickel 0.0078 0.25 0.067 0.017 0.08 0.15
Selenium ‐ ‐ ‐ ‐ ‐ 0.037
Silver ‐ ‐ 0.008 0.006 0.015 ‐
Zinc 0.20 6.4 2.2 0.6 2.7 3.7
BOD5 162 5,136 3,637 822 4,459 2143
COD 640 20,256 8,795 2,106 10,901 7847
TOC 52 1,637 1,133 290 1,422 448
TSS 397 12,570 2,508 958 3,467 5991
Ammonia‐N 57 1,818 414 36 451 1212
TKN 83 2,632 655 87 741 2025
Nitrite‐N ‐ ‐ ‐ ‐ ‐ 7.9
Nitrate‐N ‐ ‐ ‐ ‐ ‐ 12
Oil and Grease (Total) 10 319 332 60 392 125
Oil and Grease (Polar) 6.4 204 272 63 334 118
Bis(2‐ethylhexyl)phthalate 0.18 5.7 1.1 0.18 1.3 0.7
J:\PROJ\466\466‐56\K Calcs\Brawley ‐ Sampling Data and Local Limits Calculation (rev 2).xlsx Flow & Loading

Appendix V
Removal Efficiency

City of Brawley ‐ Local Limits Study
Removal Efficiency Calculation
Mean Removal Efficiency (MRE)
Where, RWWTP = Plant removal efficiency from headworks to plant
effluent, as decimal
RPRIM = Removal efficiency from headworks to primary treatment
effluent, as decimal
RSEC = Removal efficiency from headworks to secondary treatment
effluent, as decimal
Ir = WWTP influent pollutant concentration at headworks, mg/L
EWWTP, t = WWTP effluent pollutant concentration, mg/L
EPRIM, x = Primary treatment effluent pollutant concentration, mg/L
ESEC, y = Secondary treatment effluent pollutant concentration, mg/L
t = Plant effluent samples, numbered 1 to t
r = Plant effluent samples, numbered 1 to r
x = Primary treatment effluent samples, numbered 1 to x
y = Secondary treatment effluent samples, numbered 1 to y
J:\PROJ\466\466‐56\K Calcs\Brawley ‐ Sampling Data and Local Limits Calculation (rev 3).xlsx R%1

City of Brawley ‐ Local Limits Study
Pollutant Concentation and MRE (WWTP Influent and Effluent)
Arsenic Cadmium Chromium
Sample Influent Final Eff Influent Final Eff Influent Final Eff
Day (mg/L) (mg/L) (mg/L) (mg/L) (mg/L) (mg/L)
1 ND 0.0011 ND 0.00006 ND 0.0007
2 ND 0.0011 ND 0.00006 0.0038 0.0006
3 ND 0.0011 ND 0.00007 0.0039 0.0006
4 ND 0.0011 ND 0.00010 0.0065 0.0004
5 ND 0.0011 ND 0.00006 ND 0.0005
6 ND 0.001 ND 0.00005 ND 0.0005
7 ND 0.001 ND 0.00005 ND ND
Average ‐ 0.00107 ‐ 0.00006 0.00473 0.00055
Removal Efficiency 45% 1 67% 1 88%
Copper Cyanide (Total) Cyanide (Free)
Sample Influent Final Eff Influent Final Eff Influent Final Eff
Day (mg/L) (mg/L) (mg/L) (mg/L) (mg/L) (mg/L)
1 0.06 0.01 ND ND ND ND
2 0.047 0.01 ND ND ND ND
3 0.056 0.01 ND ND ND ND
4 0.082 0.012 ND ND ND ND
5 0.051 0.014 ND ND ND ND
6 0.089 0.013 ND ND ND ND
7 0.067 0.011 ND ND ND ND
Average 0.06457 0.01143 ‐ ‐ ‐ ‐
Removal Efficiency 82% 69% 1 69% 2
Lead Mercury Molybdenum
Sample Influent Final Eff Influent Final Eff Influent Final Eff
Day (mg/L) (mg/L) (mg/L) (mg/L) (mg/L) (mg/L)
1 0.0042 0.0002 ND ND 0.018 0.015
2 0.0039 0.0001 ND ND 0.019 0.017
3 0.0033 0.0001 ND ND 0.019 0.018
4 0.0052 0.0001 ND ND 0.025 0.02
5 0.0028 0.0002 ND ND 0.017 0.02
6 0.0039 0.0002 ND ND 0.021 0.02
7 0.0038 0.0001 ND ND 0.0084 0.018
Average 0.00387 0.00014 ‐ ‐ 0.0182 0.0183
Removal Efficiency 61% 1 60% 1 63% 1
J:\PROJ\466\466‐56\K Calcs\Brawley ‐ Sampling Data and Local Limits Calculation (rev 3).xlsx R%1

City of Brawley ‐ Local Limits Study
Nickel Selenium Silver
Sample Influent Final Eff Influent Final Eff Influent Final Eff
Day (mg/L) (mg/L) (mg/L) (mg/L) (mg/L) (mg/L)
1 0.008 0.0027 0.0019 0.0012 0.00038 ND
2 0.0078 0.0028 ND 0.0011 ND ND
3 0.0084 0.0029 ND 0.0012 ND ND
4 0.0099 0.0027 ND 0.0011 ND 0.00016
5 0.0053 0.0029 ND 0.0013 ND ND
6 0.0071 0.003 ND 0.0012 ND ND
7 ND 0.0024 ND 0.001 ND ND
Average 0.0078 0.0028 0.0019 0.0012 0.00038 0.00016
Removal Efficiency 64% 39% 58%
Zinc BOD5 COD
Sample Influent Final Eff Influent Final Eff Influent Final Eff
Day (mg/L) (mg/L) (mg/L) (mg/L) (mg/L) (mg/L)
1 0.091 0.024 130 ND 490 42
2 0.2 0.024 200 3 530 39
3 0.21 0.025 140 ND 680 39
4 0.39 0.024 280 ND 1100 35
5 0.13 0.026 130 6 470 42
6 0.15 0.025 170 ND 530 31
7 0.24 0.024 86 ND 680 37
Average 0.20 0.025 162 4.5 640 38
Removal Efficiency 88% 97% 94% 3
TOC TSS Ammonia‐N
Sample Influent Final Eff Influent Final Eff Influent Final Eff
Day (mg/L) (mg/L) (mg/L) (mg/L) (mg/L) (mg/L)
1 39 9.3 340 ND 60 ND
2 48 9.4 410 4 71 ND
3 63 9.3 390 7 69 0.076
4 68 8.9 540 ND 63 0.22
5 44 8.4 190 9 47 0.2
6 46 8.5 420 6 42 0.067
7 54 8.7 490 5 50 ND
Average 52 9 397 6 57 0.14
Removal Efficiency 83% 3 98% 99.8%
J:\PROJ\466\466‐56\K Calcs\Brawley ‐ Sampling Data and Local Limits Calculation (rev 3).xlsx R%1

City of Brawley ‐ Local Limits Study
TKN Nitrite‐N Nitrate‐N
Sample Influent Final Eff Influent Final Eff Influent Final Eff
Day (mg/L) (mg/L) (mg/L) (mg/L) (mg/L) (mg/L)
1 76 0.25 ND 0.02 ND 35
2 87 ND ND ND ND 38
3 100 ND ND 0.07 ND 38
4 110 ND ND 0.1 ND 36
5 76 0.14 ND 0.04 ND 34
6 56 ND ND 0.08 ND 33
7 77 ND ND 0.08 ND 40
Average 83 0.20 ‐ 0.1 ‐ 36.3
Removal Efficiency 100% 3 ‐ 3 ‐ 3
Oil & Grease (Total) Oil & Grease (Polar) Bisphthalate
Sample Influent Final Eff Influent Final Eff Influent Final Eff
Day (mg/L) (mg/L) (mg/L) (mg/L) (mg/L) (mg/L)
1 4.1 1.8 2.6 ND 0.26 0.09
2 15 2 12 ND 0.13 0.021
3 10 4.4 8.2 ND 0.18 0.026
4 9.4 2.8 2.4 ND 0.19 0.046
5 11 3 8 ND 0.18 0.024
6 9 3.2 5.4 ND 0.18 0.0033
7 12 6.2 ND 3.4 0.14 0.0027
Average 10.1 3.3 6.4 3.4 0.16 0.003
Removal Efficiency 67% 47% 398%
4
1 Cited from 2004 USEPA Local Limits Guidance2 Assumed that free cyanide and total cyanide have same removal efficiency3 Not Required for Local Limit Calculation4 Not used data pair from Day 1 to Day 5 due to high effluent bis(2‐ethylhexy)phthalate
concentration compared with last two year max effluent value (i.e. 0.0074 mg/L).
Note that bis(2‐ethylhexy)phthalate had detected one time for last two years.
See Appendix II, Brawley NPDES Monitoring Data ‐ Effluent
J:\PROJ\466\466‐56\K Calcs\Brawley ‐ Sampling Data and Local Limits Calculation (rev 3).xlsx R%1

Appendix VI
Allowable Headworks Loading Calculations

City of Brawley ‐ Local Limits Study
AHL based on WQBELs (Water Quality Standard)
Annual Average Flow 3.80 mgd (from 2010 to 2011)
where, AHLWQS = AHL based on water quality criteria, lb/day
CWQS = California WQS, mg/L
RWWTP = WWTP removal efficiency from headworks to plant effluent,
as decimal
8.34 = Conversion factor
WQBELs Limits & Removal Efficiency
Pollutants CWQS RWWTP
Arsenic 0.015 mg/L 45%
Cadmium 0.0022 mg/L 67%
Lead 0.019 mg/L 61%
Mercury 0.000051 mg/L 60%
Nickel 0.169 mg/L 64%
Silver 0.044 mg/L 58%
Zinc 0.388 mg/L 88%
CWQS: referenced from NPDES Permit
Allowable Headworks Loading (AHL WQS ) based on WQBELs Limits
Pollutants AHL (lbs/day)
Arsenic 0.86
Cadmium 0.21
Lead 1.5
Mercury 0.004
Nickel 15
Silver 3.3
Zinc 101
J:\PROJ\466\466‐56\K Calcs\Brawley ‐ Sampling Data and Local Limits Calculation (rev 3).xlsx AHLs

City of Brawley ‐ Local Limits Study
AHL based on NPDES Permit Limits
Annual Average Flow 3.80 mgd (from 2010 to 2011)
where, AHLNPDES = AHL based on NPDES permit limit, lb/day
CNPDES = NPDES permit limit, mg/L
QWWTP = WWTP average flow rate, MGD
RWWTP = WWTP removal efficiency from headworks to plant effluent,
as decimal
8.34 = Conversion factor
NPDES Limits & Removal Efficiency
Pollutants CNPDES RWWTP
BOD5 30 mg/L 97% (not applicable)
TSS 30 mg/L 98% (not applicable)
Oil & Grease 25 mg/L 67%
Total Ammonia‐N 2.1 mg/L 100% (not applicable)
Copper 0.021 mg/L 82%
Selenium 0.0041 mg/L 39%
Cyanide (free) 0.003 mg/L 69%
Bis(2‐ethylhexyl)phthalate 0.0059 mg/L 98%
Allowable Headworks Loading (AHL NPDES ) based on NPDES Permit
Pollutants AHL (lbs/day)
BOD5 34,243 (not applicable)
TSS 60,821 (not applicable)
Oil & Grease 2,384
Total Ammonia‐N 27,119 (not applicable)
Copper 3.8
Selenium 0.21
Cyanide (free) 0.31
Bis(2‐ethylhexyl)phthalate 10
J:\PROJ\466\466‐56\K Calcs\Brawley ‐ Sampling Data and Local Limits Calculation (rev 3).xlsx AHLs
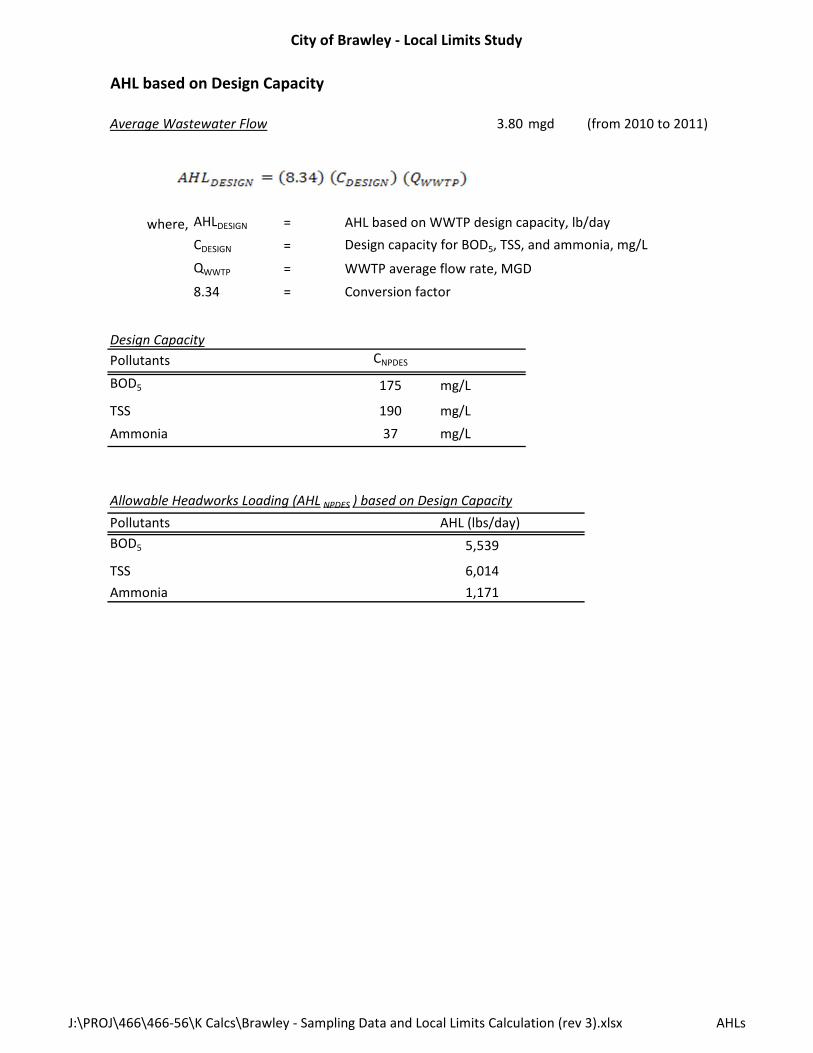
City of Brawley ‐ Local Limits Study
AHL based on Design Capacity
Average Wastewater Flow 3.80 mgd (from 2010 to 2011)
where, AHLDESIGN = AHL based on WWTP design capacity, lb/day
CDESIGN = Design capacity for BOD5, TSS, and ammonia, mg/L
QWWTP = WWTP average flow rate, MGD
8.34 = Conversion factor
Design Capacity
Pollutants CNPDES
BOD5 175 mg/L
TSS 190 mg/L
Ammonia 37 mg/L
Allowable Headworks Loading (AHL NPDES ) based on Design Capacity
Pollutants AHL (lbs/day)
BOD5 5,539
TSS 6,014
Ammonia 1,171
J:\PROJ\466\466‐56\K Calcs\Brawley ‐ Sampling Data and Local Limits Calculation (rev 3).xlsx AHLs

City of Brawley ‐ Local Limits Study
AHL based on Activated Sludge Inhibition
Annual Average Flow 3.80 mgd (from 2010 to 2011)
where, AHLAS = AHL based on activated sludge inhibition, lb/day
CAS_INHIBI = Activated sludge inhibition criteria, mg/L
QWWTP = WWTP average flow rate, MGD
RPRIM = Removal efficiency from headworks to primary treatment effluent,
as decimal
8.34 = Conversion factor
Activated Sludge Inhibition Criterion
Pollutants CAS_INHIBI RPRIM
Arsenic 0.1 mg/L 0% (No Primary Process)
Cadmium 1 mg/L 0% (No Primary Process)
Chromium 1 mg/L 0% (No Primary Process)
Copper 1 mg/L 0% (No Primary Process)
Cyanide (total) 0.1 mg/L 0% (No Primary Process)
Lead 1 mg/L 0% (No Primary Process)
Mercury 0.1 mg/L 0% (No Primary Process)
Nickel 1 mg/L 0% (No Primary Process)
Zinc 0.3 mg/L 0% (No Primary Process)
Ammonia 480 mg/L 0% (No Primary Process)
CAS_INHIBI: Referenced from EPA 2004 Local Limits Development Guidance
Allowable Headworks Loading (AHL AS ) based on Activated Sludge Inhibition
Pollutants AHL (lbs/day)
Arsenic 3.2
Cadmium 32
Chromium 32
Copper 32
Cyanide (total) 3.2
Lead 32
Mercury 3.2
Nickel 32
Zinc 9.5
Ammonia 15,192
C:\Users\Jay Jung\Desktop\Brawley ‐ Sampling Data and Local Limits Calculation (rev 3).xlsx AHLs

City of Brawley ‐ Local Limits Study
AHL based on Nitrification Inhibition
Annual Average Flow 3.80 mgd (from 2010 to 2011)
where, AHLNITRI = AHL based on nitrification inhibition, lb/day
CNITRI_INHIBI = Nitrification inhibition criteria, mg/L
QWWTP = WWTP average flow rate, MGD
RPRIM = Removal efficiency from headworks to primary treatment effluent,
as decimal
8.34 = Conversion factor
Nitrification Inhibition Criterion
Pollutants CNITRI_INHIBI RPRIM
Arsenic 1.5 mg/L 0% (No Primary Process)
Cadmium 5.2 mg/L 0% (No Primary Process)
Chromium 0.25 mg/L 0% (No Primary Process)
Copper * 0.5 mg/L 0% (No Primary Process)
Cyanide (total) 0.34 mg/L 0% (No Primary Process)
Lead 0.5 mg/L 0% (No Primary Process)
Nickel 0.25 mg/L 0% (No Primary Process)
Zinc** 0.4 mg/L 0% (No Primary Process)
CNITRI_INHIBI: Referenced from EPA 2004 Local Limits Development Guidance
* Referenced from Skinner and Walker (1961) and Reid and et al. (1968)
** Maximum concentration that did not cause interference in Brawley WWTP and Referenced
from John T. Fox and et al. (2006)
Allowable Headworks Loading (AHL NITRI ) based on Nitrification Inhibition
Pollutants AHL (lbs/day)
Arsenic 47
Cadmium 165
Chromium 7.9
Copper 15.8
Cyanide (total) 11
Lead 16
Nickel 7.9
Zinc 12.7
J:\PROJ\466\466‐56\K Calcs\Brawley ‐ Sampling Data and Local Limits Calculation (rev 3).xlsx AHLs

City of Brawley ‐ Local Limits Study
Copper Inhibition to Nitrification (Reference)
1. Skinner and Walker (1961), Growth of Nitrosomonas Europaea in Water
and Continuous Culture, Archs. Microbial. 38, 339‐349.
: 0.5 ppm of Copper inhibit growth of Nitrosomonas
2. Reid, G. N., R. Y. Nelson, C. Hall, U. Bonilla and R. Reid "Effects of Metallic Ions
on Biological Waste Treatment" Water Sew. Works, July 1968
: 0.5 mg/L Copper threshold concentration on Nitrification
Zinc Inhibition to Nitrification (Reference)
1. John T. Fox, Christopher J. Brandriff, and Charles B. Bott (2006), Assessing the
Potential for Nitrification Inhibition at Wastewater Treatment Facilities as a Result
of Zinc Orthophosphate Addition to Potable Water Distribution System, WEFTEC06,
Water Environment Foundation, 6593‐6622
: No significant inhibition at 0.5 mg/L Zinc, slight inhibition at 1.0 mg/L Zinc, significant
inhibition at 10 mg/L of Zinc.
2. Kelly II, R. T., Henriques, I. D. S, and Love, N. G. (2004a), Chemical Inhibition of Nitrification
in Activated Sludge, Biotechnology and Bioengineering, 85 (6), 638‐694
: No significant reactor performance or effluent quality at 2.5 mg/L of Zinc.
J:\PROJ\466\466‐56\K Calcs\Brawley ‐ Sampling Data and Local Limits Calculation (rev 3).xlsx AHLs

City of Brawley ‐ Local Limits Study
AHL based on Sludge Quality (Clean Sludge Criteria ‐ Table 3 of 40 CFR Part 503.13)(Recommended by EPA 2004 Local Limits Development Guidance)
Total Sludge Flow Rate to Disposal (i.e. to Centrifuge) 0.024 mgd
Percent Solids of Sludge to Disposal (i.e. to Centrifuge) 3.4 %
Assumed Specific Gravity of Sludge 1 kg/L
where, AHLSLDG = AHL based on sludge, lb/day
CSLGTD = Sludge standard – “Clean Sludge” at 40 CFR Part 503, mg/L
PS = Percent solids of sludge to disposal
QSLDG = Total sludge flow rate to disposal, mgd
RWWTP = Removal efficiency from headworks to plant effluent,
as decimal
GSLDG = Specific gravity of sludge, kg/L
8.34 = Conversion factor
Clean Sludge Criteria (Table 3, 40 CFR 503.13) & Removal Efficiency
Pollutants CSLGTD RWWTP
Arsenic 41 mg/Kg dry sludge 45%
Cadmium 39 mg/Kg dry sludge 67%
Copper 1500 mg/Kg dry sludge 82%
Lead 300 mg/Kg dry sludge 61%
Mercury 17 mg/Kg dry sludge 60%
Molybdenum * 75 mg/Kg dry sludge 63%
Nickel 420 mg/Kg dry sludge 64%
Selenium 100 mg/Kg dry sludge 39%
Zinc 2800 mg/Kg dry sludge 88%
CSLGTD: Referenced from EPA 2004 Local Limits Development Guidance
* Ceiling Concentration in Table 1, 40 CFR 503.13
Allowable Headworks Loading (AHLSLDG) based on Sludge Quality
Pollutants AHL (lbs/day)
Arsenic 0.62
Cadmium 0.40
Copper 12
Lead 3.3
Mercury 0.19
Molybdenum 0.81
Nickel 4.4
J:\PROJ\466\466‐56\K Calcs\Brawley ‐ Sampling Data and Local Limits Calculation (rev 3).xlsx AHLs

City of Brawley ‐ Local Limits Study
Selenium 1.7
Zinc 22
J:\PROJ\466\466‐56\K Calcs\Brawley ‐ Sampling Data and Local Limits Calculation (rev 3).xlsx AHLs

Appendix VII
MAILs and Local Limits Calculations

City of Brawley - Local Limits Study
J:\PROJ\466\466-56\K Calcs\Brawley - Sampling Data and Local Limits Calculation (rev 4).xlsx MAIL
Maximum Allowable Industrial Loading (MAIL) and Local Limits
PollutantsMAHL
(lbs/day)LUNC
(lbs/day)MAIL
(lbs/day)Local Limits
(mg/L)Local Limits Required?
Arsenic 0.62 - 0.56 0.04 YesCadmium 0.21 0.017 0.17 0.012 YesChromium 7.9 0.080 7.0 0.5 YesCopper 3.8 2.0 1.4 0.1 YesCyanide (total) 3.2 - 2.8 0.2 YesCyanide (free) 0.31 - 0.28 0.02 YesLead 1.5 0.68 0.71 0.05 YesMercury 0.004 0.0006 0.0031 0.0002 YesMolybdenum 0.81 0.11 0.62 0.04 YesNickel 4.4 0.083 3.9 0.3 YesSelenium 0.21 - 0.19 0.01 YesSilver 3.3 0.015 3.0 0.2 YesZinc 9.5 2.7 5.8 0.4 YesBOD5 5,539 4,459 1080 76 YesTSS 6,014 3,467 2,547 180 YesAmmonia-N 1,171 451 720 50 YesOil and Grease 2,384 392 1,754 123 YesBis(2-ethylhexyl)phthalate 10 1.3 7.70 0.5 Yes
MAIL = Maximum allowable industrial loading, lbs/dayMAHL = Maximum allowable headworks loading, lbs/day
SF = Safety factor 10%LUNC = Loadings from uncontrolled sources, lbs/dayHW = Loadings from hauled waste (No hauled waste in Brawley)GA = Growth allowance

Appendix VIII
Fume Toxicity
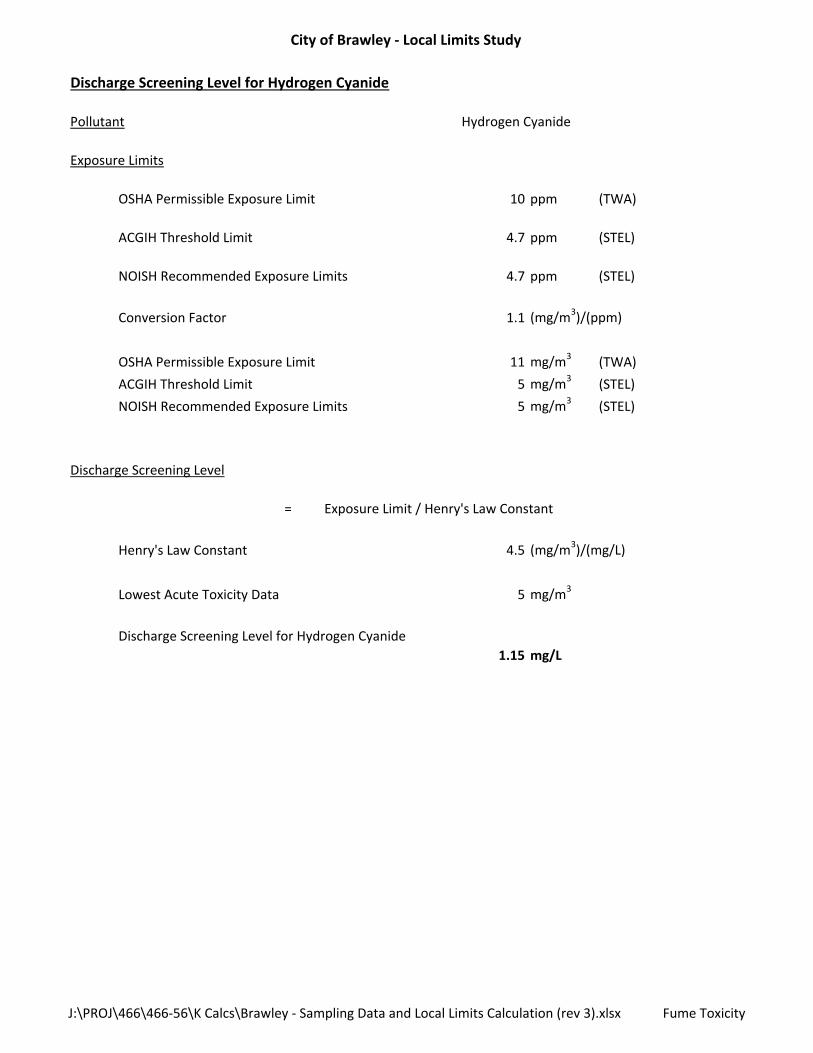
City of Brawley ‐ Local Limits Study
Discharge Screening Level for Hydrogen Cyanide
Pollutant Hydrogen Cyanide
Exposure Limits
OSHA Permissible Exposure Limit 10 ppm (TWA)
ACGIH Threshold Limit 4.7 ppm (STEL)
NOISH Recommended Exposure Limits 4.7 ppm (STEL)
Conversion Factor 1.1 (mg/m3)/(ppm)
OSHA Permissible Exposure Limit 11 mg/m3(TWA)
ACGIH Threshold Limit 5 mg/m3(STEL)
NOISH Recommended Exposure Limits 5 mg/m3(STEL)
Discharge Screening Level
= Exposure Limit / Henry's Law Constant
Henry's Law Constant 4.5 (mg/m3)/(mg/L)
Lowest Acute Toxicity Data 5 mg/m3
Discharge Screening Level for Hydrogen Cyanide
1.15 mg/L
J:\PROJ\466\466‐56\K Calcs\Brawley ‐ Sampling Data and Local Limits Calculation (rev 3).xlsx Fume Toxicity
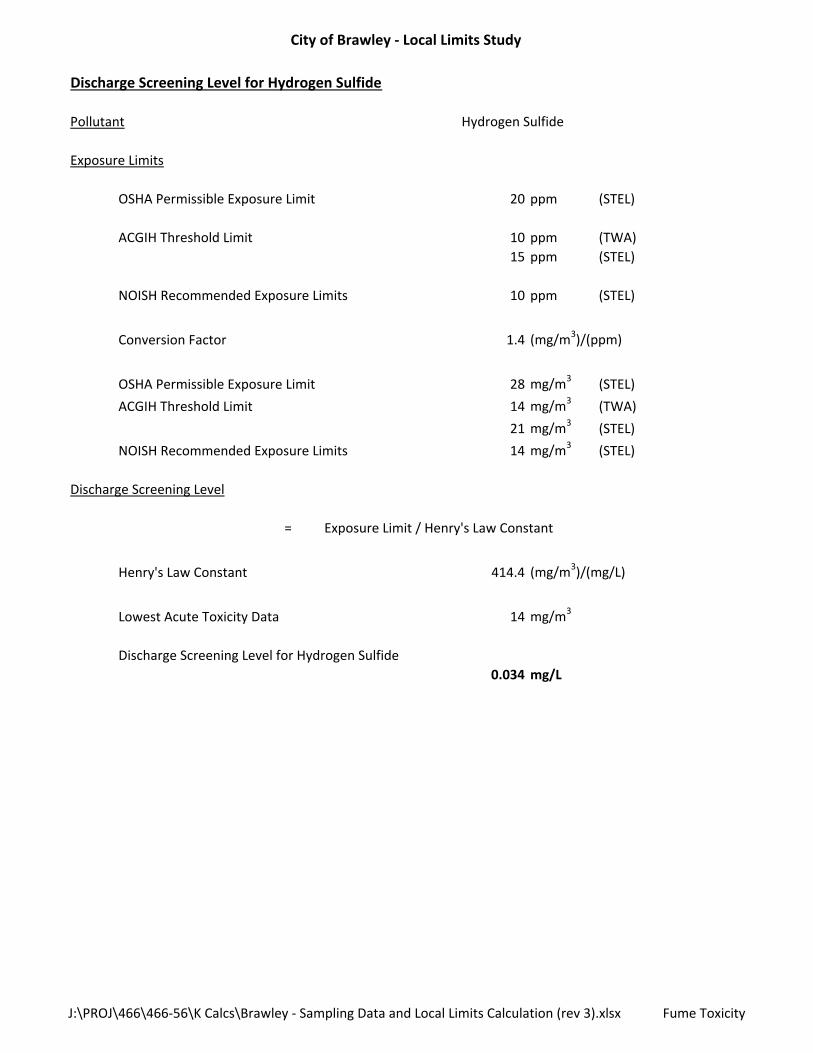
City of Brawley ‐ Local Limits Study
Discharge Screening Level for Hydrogen Sulfide
Pollutant Hydrogen Sulfide
Exposure Limits
OSHA Permissible Exposure Limit 20 ppm (STEL)
ACGIH Threshold Limit 10 ppm (TWA)
15 ppm (STEL)
NOISH Recommended Exposure Limits 10 ppm (STEL)
Conversion Factor 1.4 (mg/m3)/(ppm)
OSHA Permissible Exposure Limit 28 mg/m3(STEL)
ACGIH Threshold Limit 14 mg/m3(TWA)
21 mg/m3(STEL)
NOISH Recommended Exposure Limits 14 mg/m3
(STEL)
Discharge Screening Level
= Exposure Limit / Henry's Law Constant
Henry's Law Constant 414.4 (mg/m3)/(mg/L)
Lowest Acute Toxicity Data 14 mg/m3
Discharge Screening Level for Hydrogen Sulfide
0.034 mg/L
J:\PROJ\466\466‐56\K Calcs\Brawley ‐ Sampling Data and Local Limits Calculation (rev 3).xlsx Fume Toxicity