Embed Size (px)
Citation preview

Brazil
Analyst VisitMarch, 2007

2DisclaimerThe views expressed here contain information derived from publicly available sources that have not been independently verified. Norepresentation or warranty is made as to the accuracy, completeness or reliability of the information. Any forward looking information in this presentation has been prepared on the basis of a number of assumptions which may prove to be incorrect. This presentation should not be relied upon as a recommendation or forecast by BHP Billiton.
Nothing in this release should be construed as either an offer to sell or a solicitation of an offer to buy or sell shares in any jurisdiction.

3Contents
Country outlook - Eleazar de Carvalho
BHP Billiton presence in Brazil
• Aluminium CSG – Aldo Albanese
• Iron Ore CSG – Sebastião Ribeiro
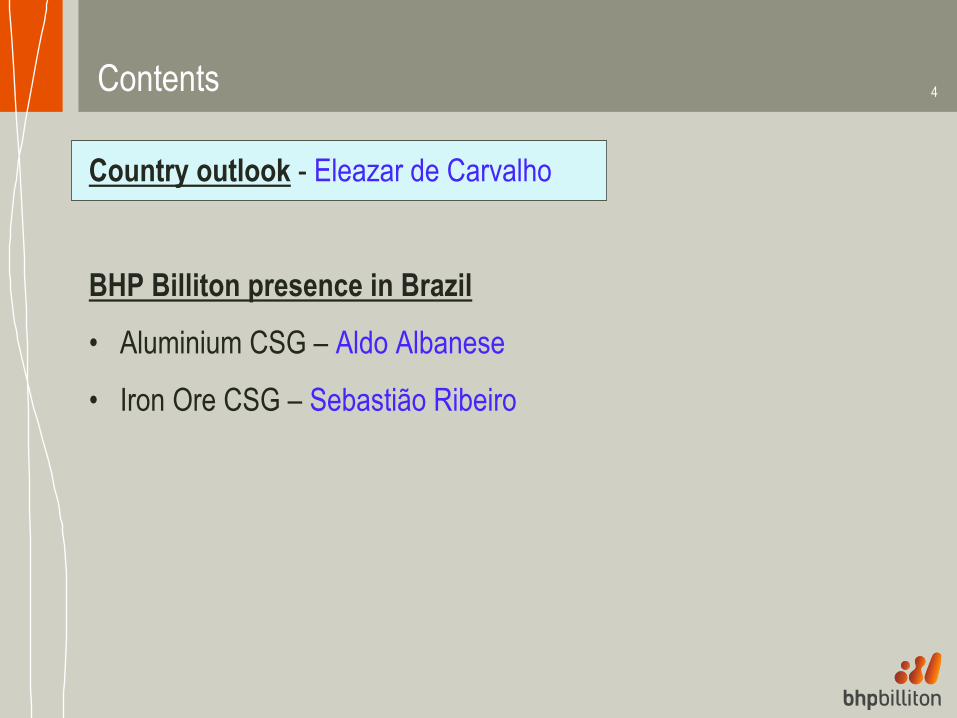
4Contents
Country outlook - Eleazar de Carvalho
BHP Billiton presence in Brazil
• Aluminium CSG – Aldo Albanese
• Iron Ore CSG – Sebastião Ribeiro

5Country Overview
Source: IBGE
Rio Grande do Sul
Santa Catarina
Paraná
São Paulo Rio deJaneiro
EspírtoSanto
Minas Gerais
Mato Grosso
Mato Grossodo Sul
Goiás
DistritoFederal
Rondônia
Acre
RoraimaAmapá
ParáMaranhão
Piauí
Ceará Rio Grandedo Norte
ParaíbaPernambuco
SergipeAlagoas
Bahia
Tocantins
Amazonas
• Federal Republic, 27 States
• 4 Year Presidential term
• Population: 188 million (5th largest)
• Urban population: 81%
• Capital: Brasilia
• Largest Cities:
• São Paulo: 11 million
• Rio de Janeiro: 6 million
• Currency: Brazilian Real (BRL)
• Language: Portuguese
• GDP (2005): $796 billion (10th largest)

6Brazil recent history
Redemocratizationbegins
New Constitution Approved
FHC Elected
Economic Miracle “Lost Decade” Stabilization
• Growth (Avg 70-79 of 8.8%)
• State-driven
• Recession
• Hyper Inflation
• Political transition
• Economic Reforms
• Privatization
• Fiscal Responsibility
Collor Impeachment
FHC Reelected
Lula Elected
Lula Reelected
20061998 20021988 19941992198519821970
“Plano Real”ExternalDebt Default
MilitaryCoup
1964
Military Government

710th largest economy in the world
Largest in:
Fresh-Water Reserves
Dry Beans
Green Coffee
Oranges, Papayas
Ethanol & Sugar Cane
Second Largest in:
Beef
Poultry
Soybeans
Tobacco Leaves
Iron Ore
Strong in:
Petroleum
Aviation industry
Steel production
Textile industry
Automobile production
Construction & Engineering
HydroelectricityAnd a land of natural resources (% of world):Mineral Reserves ProductionIron Ore 22.5% 20.5%Bauxite 7.8% 12.3%Nickel 6.1% 3.3%Manganese 2.5% 11.8%
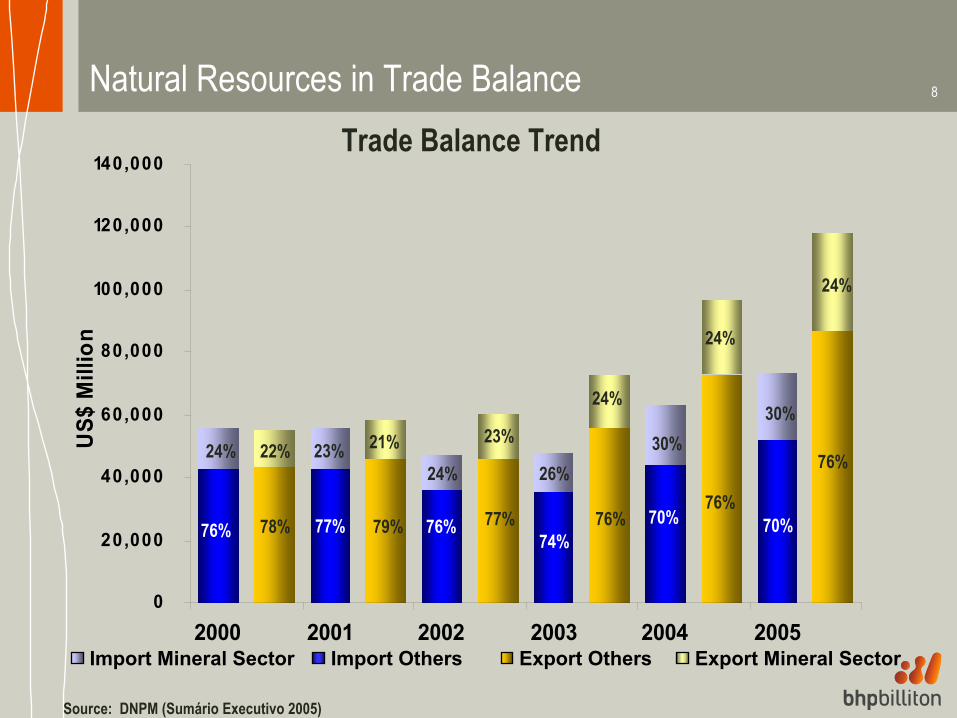
8Natural Resources in Trade Balance
0
20,000
40,000
60,000
80,000
100,000
120,000
140,000
2000 2001 2002 2003 2004 2005
US$
Mill
ion
22% 21% 23%
24%
24%
78% 79% 77%76%
76%
76% 77% 76%74%
70%
24% 23%24% 26%
30%
Source: DNPM (Sumário Executivo 2005)
Trade Balance Trend
Import Mineral Sector Export Mineral SectorImport Others Export Others
24%
76% 70%
30%

9
Good signs in terms of Economic situation: BRL remains strong when compared to recent past…
Source : Citigroup
0.00
0.50
1.00
1.50
2.00
2.50
3.00
3.50
4.00
Jun-
94
Dec
-94
Jun-
95
Dec
-95
Jun-
96
Dec
-96
Jun-
97
Dec
-97
Jun-
98
Dec
-98
Jun-
99
Dec
-99
Jun-
00
Dec
-00
Jun-
01
Dec
-01
Jun-
02
Dec
-02
Jun-
03
Dec
-03
Jun-
04
Dec
-04
Jun-
05
Dec
-05
Jun-
06
60.00
80.00
100.00
120.00
140.00
160.00
180.00
200.00
220.00
BRL/USD Real Effective Exchange Rate

10
Source : Banco Central do Brasil (IPCA)
… inflation targeting in a declining path…
9.3
2003
7.6
2004
5.7
2005
12.5
0
2
4
6
8
10
12
14
2002
%
3.1
2006

11
Source : Banco Central do Brasil
… as well as Short Term Interest Rates…
Mar-07: Central Bank reduced Selic to 12.75%
10
15
20
25
30
May-99 May-00 May-01 May-02 May-03 May-04 May-05 May-06
%

12
Source : Citigroup (JP Morgan)
… with a positive impact on the country risk
Embi+ Brazil
Basis Points
0
200
400
600
800
1000
1200
1400
Jan-03 Jul-03 Jan-04 Jul-04 Jan-05 Jul-05 Jan-06 Jul-06 Jan-07
EMBI+ (February 2007)BrazilArgentinaMexicoRussiaTurkeyPhillipinesEmerging Markets
18020710299
211162168

13When Brazil will reach “Investment Grade” ? Years of “Investment Grade” Achievement
1.232.021.180.871.22External Debt/Exports17.8%23.5%36.6%27.0%34.5%External Debt (%GPD)48.0%63.3%39.7%18.2%42.8%Total Public Debt (%GPD)-4.7%-4.8%1.8%1.2%-1.1%Nominal Fiscal Result (%GPD)84.5107.447.7102.830.7Int’l Reserves (US$ Bi)1.4%2.0%8.6%1.7%-2.9%Current Account (%GPD)16.04.23.43.513.2Foreign Direct Invest. (US$ Bi)46.1-13.960.59.3-5.6Trade Balance (US$ Bi)
15.8%
4.7%2002
Oct-03
Russia
3.9%
10.0%2003
Jan-04
India
4.1%
3.8%20012002
South Korea
12.3%
3.9%1999
Mar-00
Mexico
2.5%IPC
2.9%GDP GrowthDec 2006Year of data
?Date upgraded
BrazilEconomics Indicators
Source: UBS

14
Average GDP Growth for Selected Emerging Countries (1980 – 2005)
Sing
apor
e
Malay
sia
Thail
and
9.4%
6.6% 6.5% 6.3% 5.9%5.7%
4.9%4.2%
2.8%2.5%
0%
2%
4%
6%
8%
10%
Chin
a
Kore
a
Indi
a
Chile
Turk
ey
Mexic
o
Braz
il
Source : IMF/ Citigroup
The big issue is growth…

15Challenges for sustainable growth
Sounds good Not good enough Lack of relevant actions
PPP, Project Finance being implemented. Budgetary constraints. Energy can be an issue
Considered as key-factor for growth
Lack of InvestmentsInfra-Structure
Social Programs providing benefits for families with childrens at school
Considered as key-factor for growth
Poverty and Lack of Investments
Quality of Education
Reforms under discussionNo political consensus towards Tax reforms
Complex Tax Environment with double taxation and high Tax evasion
Excessive Tax Burden
Decreasing path of interest ratesInterest Rates decrease considered key-factor for Growth
High Government Indebtedness
High Real Interest Rates
Reforms under discussionNo political consensus towards Social Security Reform
Higher Life Expectancy and High Benefits
Social Security Deficit
Fiscal Adjustments TargetsNo political consensus towards Privatization and Legal Central Bank Autonomy
High Government Expenditures
Net Public Debt
Decreasing path of interest rates.Fiscal Targets to assureGovernment savings.
Interest Rates decrease considered key-factor for Growth
High Expenditures with Interest Payments and low Government Savings
Not Enough Investments
Current Evaluation
Current Mitigation InitiativesEnvironmentMain CauseChallenges
++ + -
+
++
--
-++
PAC
PAC
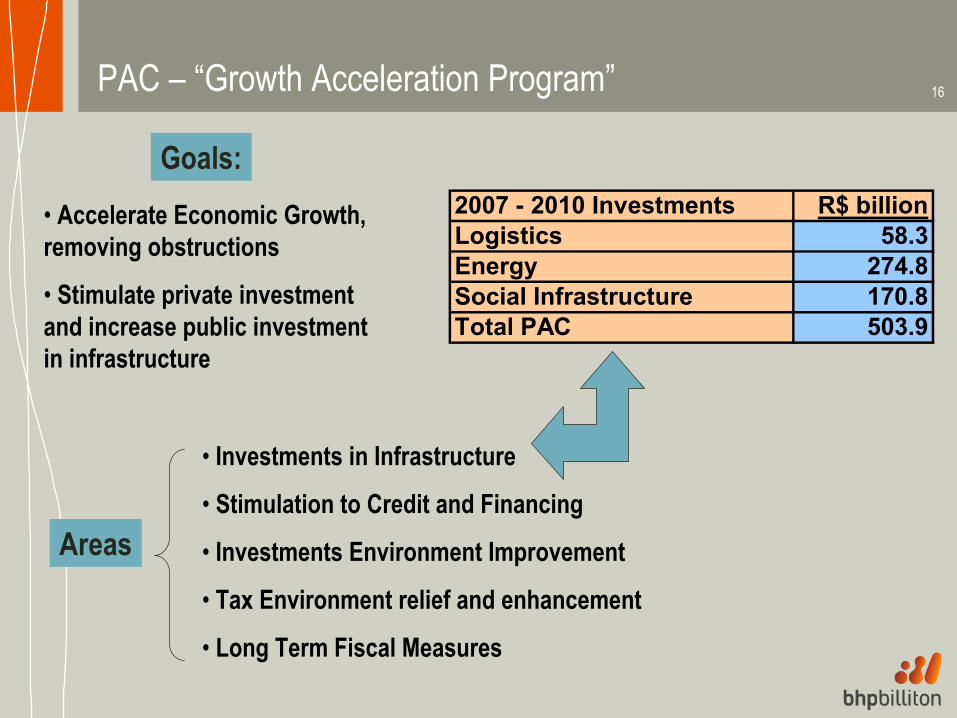
16PAC – “Growth Acceleration Program”
• Investments in Infrastructure
• Stimulation to Credit and Financing
• Investments Environment Improvement
• Tax Environment relief and enhancement
• Long Term Fiscal Measures
2007 - 2010 Investments R$ billionLogistics 58.3Energy 274.8Social Infrastructure 170.8Total PAC 503.9
Areas
Goals:• Accelerate Economic Growth, removing obstructions
• Stimulate private investment and increase public investment in infrastructure

17Basic data and projections
(*) Market consensus forecast as per Central Bank’s Focus Report (March 5, 2007)
2004 2005 2006 2007 (*) 2008 (*)
GDP growth (%) 4.9% 2.3% 2.9% 3.4% 3.7%
Investment (% of GDP) 19.6% 19.9% 20.7% 21.1% 21.3%
Unemployment (%) 11.5% 9.8% 10.0% 9.9% 9.8%
Inflation IPCA (%) 7.6% 5.7% 3.1% 4.1% 3.6%
Nominal interest (%) 17.8% 18.0% 13.3% 11.8% 10.5%
Trade Balance ($ billion) 33.7 45.1 46.1 36.7 24.6
Int'l Reserves ($ billion) 52.9 53.8 84.5 106.7 114.7
Exchange rate (R$/US$) 2.65 2.34 2.15 2.13 2.14
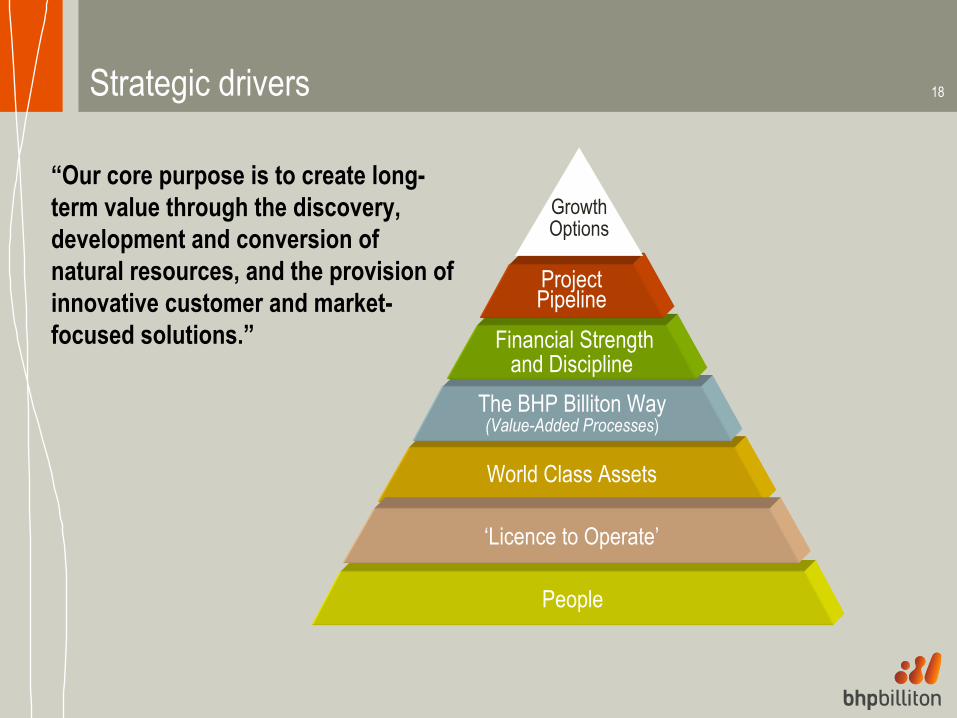
18Strategic drivers
“Our core purpose is to create long-term value through the discovery, development and conversion of natural resources, and the provision of innovative customer and market-focused solutions.”
People
World Class Assets
The BHP Billiton Way(Value-Added Processes)
Financial Strength and Discipline
Project Pipeline
‘Licence to Operate’
Growth Options

19Presence in Brazil
1971: Billiton created in Brazil by Shell Brasil Ltda (100%)
1972: BHP Group started in Brazil through Marcona
1974: Samarco Project initiated (Marcona – 49%)
1974: MRN Agreement signed
1981: Alumar Consortium created
1994: Billiton Assets sold by Shell to Gencor
1997: “new” Billiton IPO in London
2001: Merger BHP Billiton
2006: Valesul Divestment
Aluminium
Iron ore
PARÁMARANHÃO
RIO DE JANEIRO
ESPÍRITO SANTO
MRN
ALUMAR
SAMARCO(GERMANO)
SAMARCO(PONTA UBU)
MINASGERAIS

20History of Growth in Brazil
1979 – Start-up: 3.3 Mtpa
1984 – 1998 – Several Debottlenecking to 11.0 Mtpa
2003 – Expansion to 16.3 Mtpa
1977 – Start-up: 5 Mtpa
1997 – 2nd Plant: expansion to 12 Mtpa
1998 – 2006 – creep to 14 Mtpa
2008 – 3rd Plant: expansion to 21.6 Mtpa
1984 – Start-up: Refinery 500 ktpa
Smelter 127 ktpa
1986 – Smelter L.II: expansion to 283 ktpa (Alcoa)
1990 – Smelter L.III: expansion to 380 ktpa (BHP Billiton)
2005 – Refinery creep to 1,500 ktpa
2006 – Smelter L.III expansion to 440 ktpa (Alcoa)
2009 – Refinery expansion to 3,500 ktpa

21Key messages
Brazil is powerful in mineral resources (Bauxite and Iron ore);
Brazil is moving toward Investment grade. Solid economic indicators;
BHP Billiton is well positioned in Brazil with 30 years of presence and growth, and aligned with group strategic drivers;
BHP Billiton interested in continued investment opportunities in Brazil

22Contents
Country outlook - Eleazar de Carvalho
BHP Billiton presence in Brazil
• Aluminium CSG – Aldo Albanese
• Iron Ore CSG – Sebastião Ribeiro

23Aluminium Strategic Imperatives – Forward View
People
World Class Assets
The BHP Billiton Way(Value-Added Processes)
Financial Strength and Discipline
Project Pipeline
Growth Options
‘Licence to Operate’
Build organisational capability & create productive workplace
Enhance stakeholder relations
Vacate non tier 1 assets and enhance retained assets
Add value to operations by leveraging best practice
Reduce operating costs and improve financial performance
• BD initiatives (e.g., Guinea)• Develop / acquire Tier 1 assets
• Alumar refinery• Worsley & Bakhuis (Feasibility)

24
Suriname 921kt
RefineriesBauxite Mines Smelters
MRN 2,565kt
Alumar 503kt
Mozal 262ktHillside 700ktBayside 179kt
Alumar 178ktSuriname
2,163kt
Worsley 2,763kt Boddington
10,589kt
Aluminium CSG – Asset locations & FY06 production
Valesul 43kt
Now sold (effective July 2006)

25
Aluminium - BHP Billiton in BrazilMRN – Bauxite Mine
82 MMt of reserves
597 MMt of resources (*)
MRN looking for more deposits in the area
Mining Beneficiation PortDeforestation Reforestation
17.725.8MRN
Production(Mt)
ROM(Mt)
Capacity100% terms
CVRD40%
BHP Billiton15%
Alcan12%
CBA10%
Alcoa18%
Hydro5%
(*) Competent person: see appendix 1 information

26
M IN E
BEN EFICIATION
RAILWAY
PORT
STRIPPIN G
EX CAVATIONAN D H AULAGE
TAILLIN G DISPOSAL
REFORESTATION
CRUSH IN G CRUSH ED BAUX ITEWASH IN G
WASH ED BAUX ITE
CAR LOADIN G RAILWAY TRAN SPORTATION
CAR DUM PER WET BAUX ITE DRYIN G DRY BAUX ITE SH IPLOADER
OPERATION SEQUEN CE
MRN Production Process

27
Aluminium - BHP Billiton in BrazilMRN – Bauxite Mine
10,32810,978
16,37217,161 17,331
5,000
10,000
15,000
20,000
FY02 FY03 FY04 FY05 FY06
Production Performance (100%)Fuel - Oil
15%
Fuel - Diesel13%
Fuel - Other2%
Material18%Labor
19%
Services33%
Cost Breakdown – YTD 07kt
28
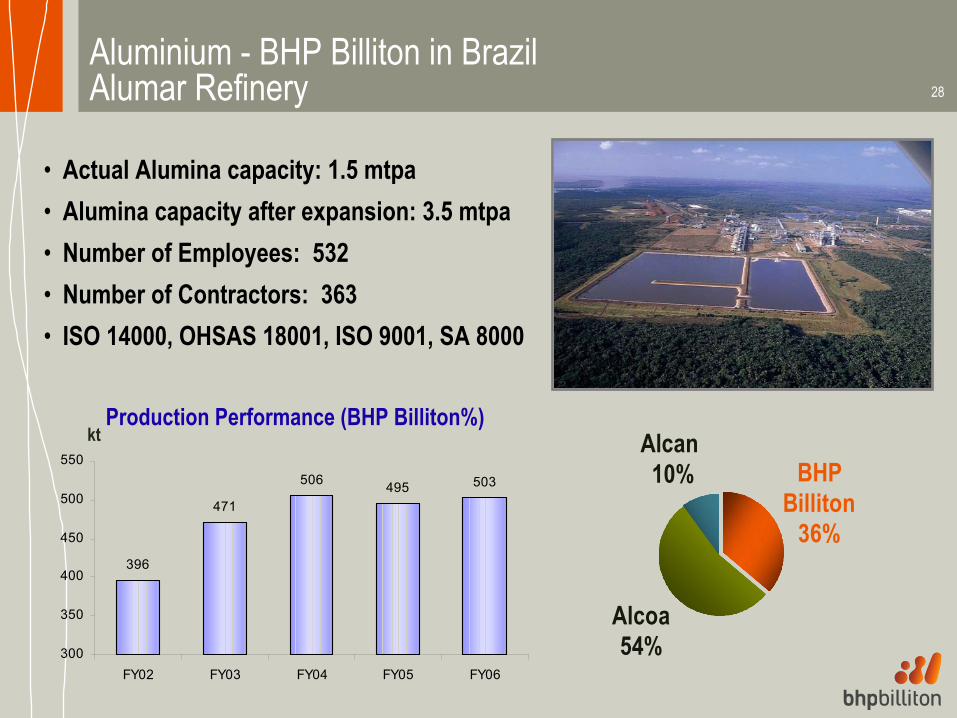
Aluminium - BHP Billiton in BrazilAlumar Refinery
• Actual Alumina capacity: 1.5 mtpa• Alumina capacity after expansion: 3.5 mtpa• Number of Employees: 532• Number of Contractors: 363• ISO 14000, OHSAS 18001, ISO 9001, SA 8000
Alcan 10%
Alcoa 54%
BHP Billiton
36%
Production Performance (BHP Billiton%)kt
396
471
506 495 503
300
350
400
450
500
550
FY02 FY03 FY04 FY05 FY06

29
Aluminium - BHP Billiton in BrazilAlumar Smelter
• Aluminium Capacity: 440 ktpy• Number of Employees: 1174• Number of Contractors: 776• ISO 14000, OHSAS 18001, ISO 9001, SA 8000• Long Term Energy Contract
Alcoa 60%
BHP Billiton
40%
Production Performance (BHP Billiton%)kt
152
178
156
176 178
100
120
140
160
180
FY02 FY03 FY04 FY05 FY06

30Cost Breakdown – YTD 2007
Bauxite35%
Soda11%Energy
20%
Labor6%
Maintenance + Sust Capex
9%
Contracted Services
4%
Other15%
Alumina32%
Electricity35%
Other 11%
Pitch2%
Coke5%
Labor6%
Maintenance + Sust capex
5%
Contract Services
2%
Alloys2%
Alumar Refinery Alumar Smelter

31Cost curve Refineries - 2007
Alu
mar
MRN dividend

32Cost curve Smelters - 2007
Alu
mar
Sm
elte
r
Bays
ide
(S)
Bays
ide
(P)
Hill
side
Moz
al

33Alumar Refinery Expansion
BHP Billiton share 36%
Share of approved Capex US$ 725M
Initial production date Q2 CY 2009
Incremental production 100% basis -2 mtpa
Capex increase (40%) following BHP Billiton’s review of the estimate and inclusion of additional contingencies & foreximpact.

34
Zero LTI accidents, Project TIFR 1.193.5 million man-hours worked to dateOverall progress 30% completeEngineering 60% completeProcurement 35% completeConstruction 10% complete
Integrated team operational under Alcoa Management with SNC-Lavalin Program Manager, Hatch Engineering and Camargo Correa Construction
Alliance contracts agreed with 3 major Brazilian contractors for Civil, Mechanical, and Electrical construction
Project Status Summary

35Contents
Country outlook - Eleazar de Carvalho
BHP Billiton presence in Brazil
• Aluminium CSG – Aldo Albanese
• Iron Ore CSG – Sebastião Ribeiro
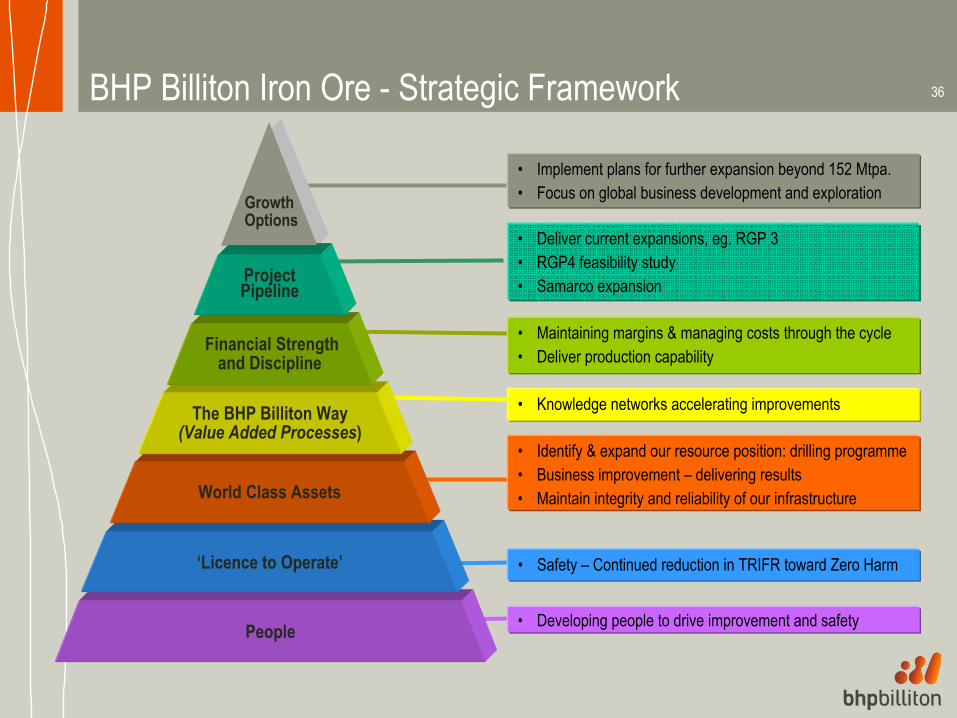
36BHP Billiton Iron Ore - Strategic Framework
• Identify & expand our resource position: drilling programme• Business improvement – delivering results• Maintain integrity and reliability of our infrastructure
• Developing people to drive improvement and safety
• Safety – Continued reduction in TRIFR toward Zero Harm
• Deliver current expansions, eg. RGP 3• RGP4 feasibility study• Samarco expansion
• Implement plans for further expansion beyond 152 Mtpa.• Focus on global business development and exploration
• Maintaining margins & managing costs through the cycle• Deliver production capability
• Knowledge networks accelerating improvements
People
‘Licence to Operate’
World Class Assets
The BHP Billiton Way(Value Added Processes)
Financial Strength and Discipline
Project Pipeline
GrowthOptions

37BHP Billiton Iron Ore Overview• Iron Ore became stand-alone CSG in
November 2006
• Global Iron Ore headquarters in Perth, Western Australia
• Responsible for global iron ore development
• No change for customers - CSM marketing model remains (iron ore, metallurgical coal and manganese)
• Integrated mine, port and rail operations in the Pilbara “Western Australia”
• 50% share of Samarco in Brazil
• More than 7000 direct employees and contractors in WA
• 8.7% of WA employees Indigenous (Jan 07)
COLOMBIA
VENEZUELA
PERU
BOLIVIA
ECUADOR
GUYANA
SURINAME
FRENCHGUIANA
PARAGUAY
ARGENTINA
URUGUAY
CHILE
BrazilSamarco
Port Hedland
PERTH
Western Australia
WA Iron Ore
Newman
Pellet Plants, Port

38Brazil is one of the focus regions outside WA
Focus regions outside WA

39
Iron Ore - BHP Billiton in BrazilSamarco Mineração S.A.Mining Pelletizing PortBeneficiation Pipeline
23.921.624.7524.7534.3Expansion Project15.914.016.516.520.9Optimized
Sales(dmt)
Pelletizing(dmt)
Pipeline(dmt)
Beneficiation(dmt)
Mining (*)(wmt)100% terms
TubarãoVitória
SAMARCO Mine
Pipeline396 Km
CVRD Railr
oad
IRON QUADRANGLE
BH
Rio de Janeiro
Ponta Ubu
MRSRailroad
Sepetiba
• 50/50 JV with CVRD • Expansion Project Completion – H1 CY 2008• Slurry Pipeline – Low Transportation Cost• Leader in concentrating low grade iron ore itabirites in Brazil• Sales – 100% Seaborne Market• 31% Own Generated Power Supply(*) Samarco own ore mining, excluding 3rd party purchase
40
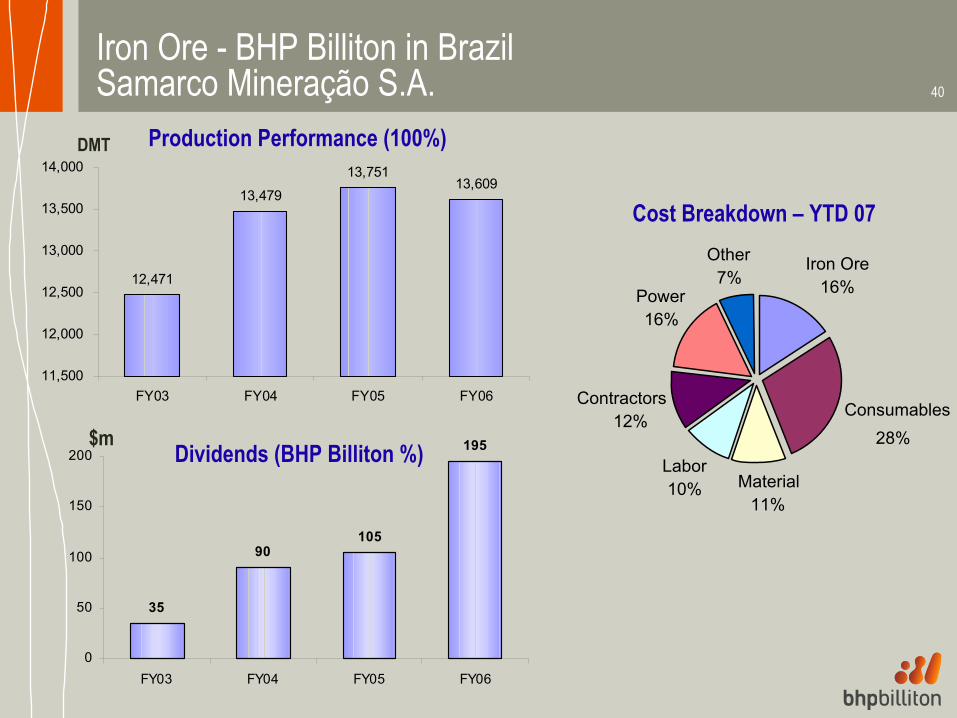
Iron Ore - BHP Billiton in BrazilSamarco Mineração S.A.
12,471
13,479
13,75113,609
11,500
12,000
12,500
13,000
13,500
14,000
FY03 FY04 FY05 FY06
Production Performance (100%)
Cost Breakdown – YTD 07
Dividends (BHP Billiton %)
35
90105
195
0
50
100
150
200
FY03 FY04 FY05 FY06
$m
DMT
Iron Ore16%
Consumables28%
Material11%
Labor10%
Contractors12%
Power16%
Other7%

41Samarco ExpansionProject Objective• To increase production of pellets by 7.6mtpa to 21.6mtpa.Project deliverables• Increased mining fleet and equipment• New Concentrator at Germano• 400 km slurry pipeline between Germano and new Pellet Plant at Ponta Ubu• New 7.6 mtpa Pellet Plant at Ponta Ubu• Upgrade of stockyard and ship loading facilities at Ponta Ubu.

42Project Status SummarySafety: 9 million man hours expended with CIFR < 0.1 per million hours.
ProgressAs at end January 2007 all major work fronts have commenced construction:
Overall project progress – 55% completeEngineering – 95% complete Procurement – all major equipment ordered and in process of being delivered. Construction – 26% completeOn schedule to commence production H1 CY 2008.
CostOriginal budget of R$ 3.112M (nominal) – healthy status against budget.In BHP Billiton (50%) terms approved capital cost of US$ 590m (nom.)

43

44Appendix 1 – MRN reserves and resources
The MRN ore reserves and resources are based on information compiled by J P C de Melo Franco, who is a member of the Australian Institute of Mining and Metallurgy. Mr Melo Franco is employed by Mineração Rio do Norte SA. He has sufficient experience with the estimation, assessment, evaluation and economic extraction of large scale copper mining operations and projects. This experience is relevant to the style of mineralization and type of deposit under consideration and to the activity which he is undertaking, and as such he qualifies as a Competent Person as defined in the 1999 Edition of the 'Australasian Code for Reporting of Exploration Results, Mineral Resources and Ore Reserves