Embed Size (px)
Citation preview

BRAZIL AS AN ECONOMIC SUPERPOWER? UNDERSTANDING BRAZIL’S CHANGING ROLE
IN THE GLOBAL ECONOMY
BRAZIL: THE CHALLENGES IN
BECOMING AN AGRICULTURAL
SUPERPOWER DRAFT 1
Geraldo Barros Full Professor of Economics and Director of the Center for Advanced Studies on Applied Economics of the University of Sao Paulo, CEPEA/USP, Brazil. ww.cepea.esalq.usp.br * [email protected] Cite as: Barros, Geraldo, “Brazil: The Challenges in Becoming an Agricultural Superpower”, in Lael Brainard and Leonardo Martinez-Diaz (eds.), Brazil as an Economic Superpower? Understanding Brazil’s Changing Role in the Global Economy (Washington, D.C.: Brookings Institution Press, forthcoming).
Paper presented at the Brookings Conference, Washington-DC, April 28-29/2008.
ABSTRACT This paper provides an overview of Brazil’s agroindustrial sector and examines the challenges Brazil faces in becoming an agricultural superpower. These challenges include restoring the investment pattern in infrastructure, science and technology, and human capital of previous decades, with the difference that this time the role of private-sector financing will necessarily be much more important. Other challenges include environmental sustainability, sanitary and food quality/security conditions, and trade policy and negotiations. The public sector has yet to deal with centuries-old issues such as rural labor relations, agrarian reform, and Indian issues.

Geraldo Barros Brazil: The Challenges in Becoming an Agricultural Superpower 2
I. INTRODUCTION
The impressive performance of Brazil’s agribusiness (agriculture and agroindustry) during
the twentieth century resulted from an ambitious national economic development strategy,
conceived in the early 1930s, and whose implementation took six or seven decades. This
project promoting industrialization and urbanization demanded overcoming food supply and
foreign reserve restrictions, with a key role played by agriculture. The project also entailed
territorial occupation based on infrastructure expansion, research and technology, and
human capital investments (including substantial immigration), plus a set of sectoral policies
that were intermittently but consistently carried out throughout several different political
regimes and government administrations.
The major test of the success of this strategy took place in the mid-1980s, when government
support had to be severely curtailed and the economy was opened to foreign competition.
Despite that initiative, the value of agricultural production kept its post–World War II pace,
doubling about every 20 years. Nonetheless, today agriculture accounts for only 5% of
Brazil’s GDP (one-fifth of its 1947 share), meaning that relative agricultural income was
shrinking. In the meantime, after the war, an increasingly sophisticated agribusiness sector
developed, which currently represents some 30% of Brazil’s GDP, with strong participation
from multinational companies.
The social returns on investments in agriculture began to be perceptible starting in the mid-
1970s, when real food prices began a continuous 30-year fall of almost 80% at the retail
level, and of 60% at the farm gate. It is remarkable that the agroindustry and retail margins
have also declined at a time of strong market concentration and fierce competition. It took
such a deep fall in food prices to make a historical improvement in Brazil’s income
distribution possible during the 1990s. On the external front, the agribusiness sector
provided $10–15 billion in annual trade surpluses that were strategic to securing the
country’s solvency in the turbulent 1990s. These surpluses helped keep Brazil from being
forced into a period of growth slower than the then-present 2.5% annual rate.

Geraldo Barros Brazil: The Challenges in Becoming an Agricultural Superpower 3
How could farmers bear such a reduction in prices and still expand production? The major
explanation lies in farming’s total factor productivity, which doubled in the 30 years to 2005
and explains around 70% of the growth in farm output. In addition, artificially high labor
costs, low interest rates, and growing land supplies all favored mechanization and large-scale
farming. That meant that many farmers who could not keep pace with new technology had
to abandon agriculture. Huge rural labor migrations and worrying environmental depletion
were the main costs of the agribusiness success.
The structure of the paper is as follows. The next section starts with a discussion of the
Vargas project of industrialization that started in the 1930s; section III introduces the role of
agriculture in the Vargas project; section IV presents data on agribusiness’s performance
over the last decades; sections V through X discuss the growth challenges faced by the
country, in light of economic integration, science and technology, human capital,
environmental concerns, and investments; and finally, sections XI and XII present future
perspectives for Brazil, taking in to account the world scenario, as well as offering
concluding remarks.
II. INDUSTRIALIZATION: THE VARGAS PROJECT
In 1994, president-elect Fernando Henrique Cardoso announced the end of the Getúlio
Vargas era in his farewell speech in the Senate. The death of the Vargas project had been
announced at least three times before: first in 1945, when the dictator Vargas was
overthrown; again in 1954, when Vargas died; and in last in 1964, when a military coup
overthrew the constitutionally elected president João Goulart—a Vargas man.1
Since the beginning of the twentieth century, Brazil has firmly wished to move from an
agrarian to an urban, industrialized society, implementing a national project aimed at that
goal. At the time, Brazil—like the rest of the world—was in the midst of the international
financial crisis of 1929. Agriculture was the foundation upon which Brazil’s economic system
1 Source: FGV- CPDOC.

Geraldo Barros Brazil: The Challenges in Becoming an Agricultural Superpower 4
functioned up to the beginning of the twentieth century. Seventy percent of its foreign
currency revenues came from coffee exports, which dried up when the external funds that
helped to support the huge stocks of that commodity evaporated. No wonder a xenophobic
mood focusing on import substitution tended to predominate in Brazil’s political circles. In
fact, a political revolution in 1930, led by Vargas, substituted an ancient agrarian-dominated
political system with an industrial-oriented one; the authoritarian Vargas government would
last for 15 years, during which many of the modern institutions (e.g., labor unions, social
security, public funding for state companies) were created.
Investment capital was raised through public funds (fiscal and inflationary taxation) and
foreign investment, which was heavily applied to transportation infrastructure. Human
capital was available from European and Asian migration to southern and southeastern
Brazil, which began in earnest following the ban on African-based slavery at the end of the
nineteenth century. Nascent industry was assured a captive domestic market thanks to a
package of protectionist tools, particularly an overvalued currency, import tariffs, and
quotas. The strategy was to produce domestically previously imported goods, beginning with
consumer goods, and followed by intermediary and capital goods. After Vargas, the strategy
was maintained and even intensified by President Juscelino Kubitscheck (who brought the
automobile industry to Brazil in 1956). In 1960 the national capital was moved from Rio de
Janeiro to Brasilia in the center-west region to (among other reasons) stimulate occupation
of frontier areas and the development of agriculture in the savannah lands.
It is clear that during the Vargas period and beyond, Brazil showed outstanding
performance, as far as growth is concerned. From 1945 to 1980, the growth rate of its GDP
was 7.5% per year, on average. Since then, that rate has fallen to a meager 2.5%. During this
time, inflation surged and was only brought under control after half a dozen different
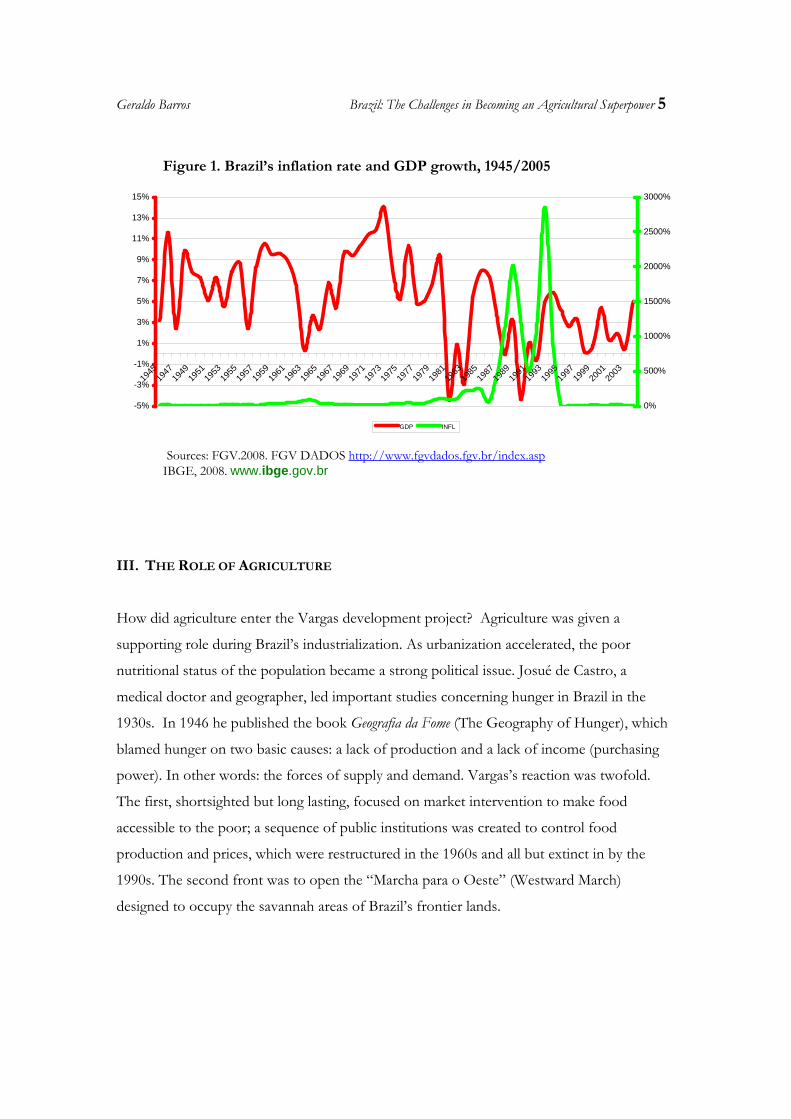
economic plans were implemented. As can be seen in Figure 1, in 1994, the Real Plan was
able to bring inflation down; however, economic growth remained low. Brazil is still looking
for a new project capable of bringing growth back, but only of that special type that keeps
inflation down.
Geraldo Barros Brazil: The Challenges in Becoming an Agricultural Superpower 5
Figure 1. Brazil’s inflation rate and GDP growth, 1945/2005
Sources: FGV.2008. FGV DADOS http://www.fgvdados.fgv.br/index.asp IBGE, 2008. www.ibge.gov.br
III. THE ROLE OF AGRICULTURE
How did agriculture enter the Vargas development project? Agriculture was given a
supporting role during Brazil’s industrialization. As urbanization accelerated, the poor
nutritional status of the population became a strong political issue. Josué de Castro, a
medical doctor and geographer, led important studies concerning hunger in Brazil in the
1930s. In 1946 he published the book Geografia da Fome (The Geography of Hunger), which
blamed hunger on two basic causes: a lack of production and a lack of income (purchasing
power). In other words: the forces of supply and demand. Vargas’s reaction was twofold.
The first, shortsighted but long lasting, focused on market intervention to make food
accessible to the poor; a sequence of public institutions was created to control food
production and prices, which were restructured in the 1960s and all but extinct in by the
1990s. The second front was to open the “Marcha para o Oeste” (Westward March)
designed to occupy the savannah areas of Brazil’s frontier lands.
-5%
-3%
-1%
1%
3%
5%
7%
9%
11%
13%
15%
1945
1947
1949
1951
1953
1955
1957
1959
1961
1963
1965
1967
1969
1971
1973
1975
1977
1979
1981
1983
1985
1987
1989
1991
1993
1995
1997
1999
2001
2003
0%
500%
1000%
1500%
2000%
2500%
3000%
GDP INFL
Geraldo Barros Brazil: The Challenges in Becoming an Agricultural Superpower 6
In addition to providing food, agriculture was supposed to continue generating foreign
currency to fund the imports demanded by industrialization. Coffee exports, on one hand,
provided much needed foreign currency, but when revenues from coffee exports rose, the
exchange rate appreciated, making life harder on the nascent industrial sector. To help the
industrialization process, right in the beginning of his mandate (1930), Vargas instituted a
multiple exchange rate regime. In practice this was nothing more than a coffee export tax
(confisco), through which exporters were taxed with an overvalued exchange rate. This heavy
reliance on coffee exports served as a reminder that the country was in need of other
exportable commodities.
The occupation of the so-called cerrado (savannahs) was not a peaceful process; it was unfair
and violent, with heavy costs for native populations and migrants from the Northeast. At
some point, the occupation process got out of the control of the authorities and as a result
one of the stated objectives—establishing a reasonably equitable agrarian system—was not
attained. Land ownership concentration also resulted from a combination of technological
and production factor prices; cheap land, low subsidized capital, and artificially high labor
costs all led to large-scale farming.
Academic discussion tended to oppose, on the one side, the land reform solution—how to
deal with the so-called agrarian problem (i.e., land ownership concentration and too many
landless)—and, on the other, the farm modernization strategy—to solve the “traditional-
agriculture problem,” allegedly “efficient but poor.” Although most analysts would say that
the first option was rejected, the truth is that Brazil has since been involved with an intense
and never-ending land reform and colonization program. The fact is that the political
options fell upon a mixed strategy. A complex of agricultural modernization policies was put
in place in the 1960s encompassing price supports and subsidized credit. Growth in the
agrobusiness sector also had environmental costs, such as soil degradation, water misuse and
contamination, air pollution, fauna and flora sacrifices, and deforestation. Only recently have
concrete steps been taken to address these problems, and only more recently have the very
first concrete results become visible.

Geraldo Barros Brazil: The Challenges in Becoming an Agricultural Superpower 7
By the mid-1980s, the federal government’s financing capacity collapsed, so that even the
agricultural credit and commercialization instruments had to be severely curtailed. The
private sector took most regional development into its own hands, including the investment
of hundreds of billion dollars in farm capital, warehouses, and processing facilities.
Fortunately, new technology was kept flowing in and the agribusiness sector was able to
employ it efficiently by exporting part of the increased output, thereby avoiding a weak
domestic market that would have inhibited the growth of strong agroenergy, fiber, grain, and
meat agribusinesses. Plenty of foreign reserves were generated to help Brazil keep its
financial solvency during the severe financial crises of the 1990s.
IV. THE PERFORMANCE OF AGRIBUSINESS
Six decades after the initial official programs, and 20 years after the direct policy (credit, price
support, and storage) instruments began to be curtailed, a long-term evaluation of the
agribusiness experience is finally possible. Figures 2 and 3 show that farm prices—both for
crops and livestock—fell about 60% in real terms from 1975 to 2006, while output more
than tripled. These results are measurable by total farm increase in productivity, which
doubled over the same time period.
Figure 2. Farm crops and livestock real price indexes
Source: FGV. 2008, FGV DADOS http://www.fgvdados.fgv.br/index.asp with author’s elaboration.
0
20
40
60
80
100
120
140
1975
1976
1977
1978
1979
1980
1981
1982
1983
1984
1985
1986
1987
1988
1989
1990
1991
1992
1993
1994
1995
1996
1997
1998
1999
2000
2001
2002
2003
2004
2005
2006
CROPS LIVESTOCK

Geraldo Barros Brazil: The Challenges in Becoming an Agricultural Superpower 8
Figure 3. Farm output, inputs, and total factor productivity, 1975/2006
Source: Gasques et al. (2006).
Productivity growth permitted Brazil’s agribusiness to expand impressively in international
markets. As indicated in Figure 4, the agribusiness sector contributed between US$10 billion
and US$15 billion in trade surpluses per year during the 1990s, when the economy as a
whole suffered chronic deficits. Thanks to the performance of the agribusiness sector, Brazil
avoided insolvency until 1998, when the substantial capital flight demanded deep changes in
the exchange rate regime (fluctuation and devaluation).
0
50
100
150
200
250
300
350
1975
1976
1977
1978
1979
1980
1981
1982
1983
1984
1985
1986
1987
1988
1989
1990
1991
1992
1993
1994
1995
1996
1997
1998
1999
2000
2001
2002
2003
2004
2005
OUTPUT INPUTS TFP

Geraldo Barros Brazil: The Challenges in Becoming an Agricultural Superpower 9
Figure 4. Brazil’s total and agribusiness trade surpluses, 1994/2007
Source: MDIC, 2008. www.mdic.gov.br and CEPEA-USP, 2008.www.cepea.esalq.usp.br
Also thanks to this productivity effect, since the mid-1990s Brazil has been able to reduce
income concentration. As can be seen in Figure 5, in the 1990s, minimum wage increases
took place at a time of decreasing real food prices, thus leading to higher real wages; poor
families were able to spend more, not only on food but on other consumer goods as well.
That made possible, for instance, the redistribution of income through several sequential
government programs, which culminated with the so-called Bolsa Família (Family Grant),
which transferred cash to more than 11 million poor families. Figure 6 shows that the Gini
index of income concentration has been decreasing since 2001, so that for the first time such
money transfers have turned into real purchasing power increase for poor families. Increased
consumption, which began with food, soon extended to other items, such as housing
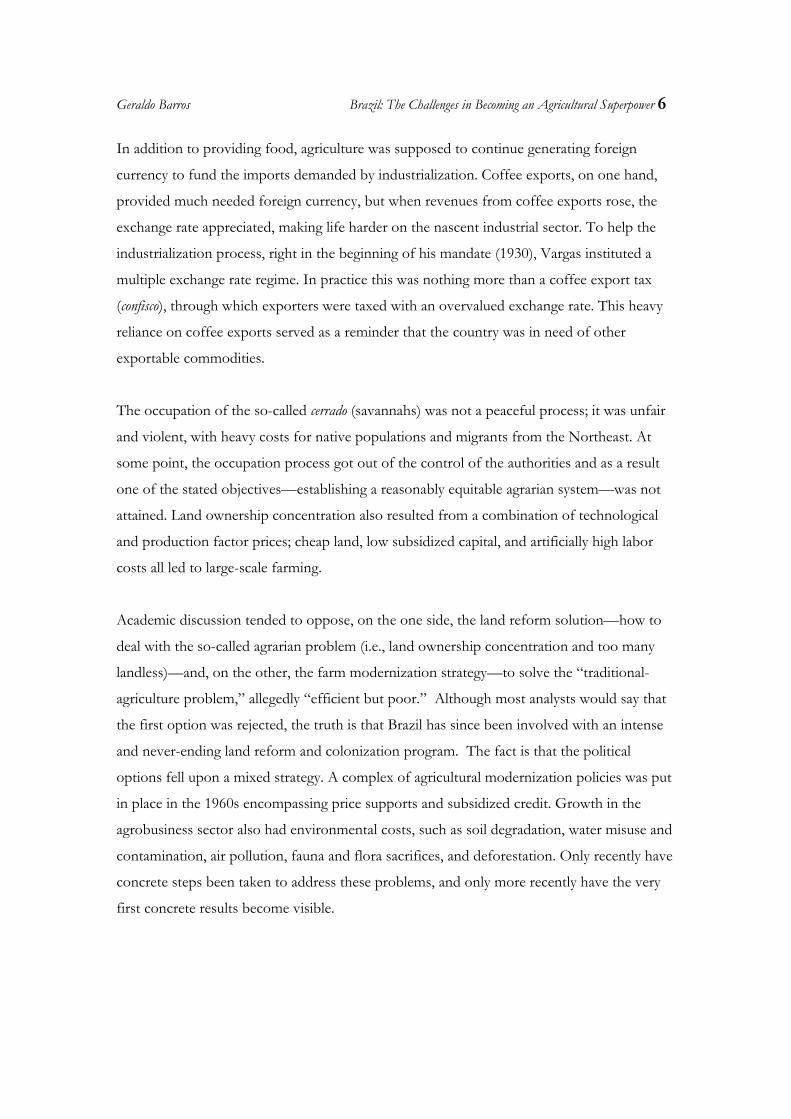
improvements, home stoves, refrigerators, and furniture. Recent data (shown in Figure 7)
indicate that the poorest 10% of Brazil’s population had an 8% annual growth in per capita
income from 2001 to 2005, while average (for the whole population) annual growth was
0.9%.
-10000
0
10000
20000
30000
40000
50000
1994 1995 1996 1997 1998 1999 2000 2001 2002 2003 2004 2005 2006 2007
TOTAL AGRIBUSINESS

Geraldo Barros Brazil: The Challenges in Becoming an Agricultural Superpower 10
Figure 5. Nominal minimum wage changes, real food costs to consumers, and real minimum wages
Source: FIPE, 2008. www.fipe.org.br/web/index.asp; http://www.portalbrasil.net/salariominimo.htm elaboration of the author.
Figure 6. Gini income distribution coefficient, Brazil, 1977/2005
Source: Paes de Barros (2006)
0.587 0.581
0.566
0.569
0.5930.592
0.5980.6000.600
0.612
0.602
0.580
0.599
0.623
0.604
0.589 0.594
0.582
0.593 0.588
0.596
0.587
0.599
0.615
0.634
0.550 0.560 0.570 0.580 0.590 0.600 0.610 0.620 0.630 0.640 0.650
1977 1979 1982 1984 1986 1988 1990 1993 1996 1998 2001 2003 2005
Mean Gini Coefficient
0
50
100
150
200
250
300
350
400
450
500
jan/
75fe
v/76
mar
/77
abr/7
8m
ai/7
9ju
n/80
jul/8
1ag
o/82
set/8
3ou
t/84
nov/
85de
z/86
jan/
88fe
v/89
mar
/90
abr/9
1m
ai/9
2ju
n/93
jul/9
4ag
o/95
set/9
6ou
t/97
nov/
98de
z/99
jan/
01fe
v/02
mar
/03
abr/0
4m
ai/0
5ju
n/06
jul/0
7
0%
50%
100%
150%
200%
250%
300%
350%
NOM WAGE CHANGES
REAL WAGES
FOOD PRICES
Geraldo Barros Brazil: The Challenges in Becoming an Agricultural Superpower 11
Figure 7. Per capita income growth according to poorest accumulated classes, Brazil, 2001/2005
Source: Paes de Barros (2006).
Brazil has relied, since the 1990s, on significant trade surpluses on agricultural products and
on income redistribution measures that are no longer simple short-term solutions but are
able to offer long-term benefits to the poor. Today Brazil appears to be on the verge of a
long cycle of more domestically oriented economic growth; the country can count on a
strong and competitive agribusiness sector as one of its leading sectors.
This historical success would not be entirely told if the economic and social conditions of
farmers—the main actors of the story—were not examined. Two points deserve to be
stressed. The first is the extreme insecurity under which farmers do their businesses. The
second is the sacrifices many farmers had to bear during the changing process.
Among the many different ways of analyzing farmers’ economic progress, it suffices to
examine the evolution of the value of their main asset, land, as can be seen in Figure 8.
012345678
10 20 30 40 50 60 70 80 90 100
% Poorest

Geraldo Barros Brazil: The Challenges in Becoming an Agricultural Superpower 12
Figure 8. Yields versus price, income and use of land, 1989/2007
Sources: FGV (2008). http://www.fgvdados.fgv.br/index.asp IBGE, 2008. www.ibge.gov.br;authors’ calculations.
Over the last 17 years, the real price of land at first decreased 50% compared to 1989 and
then increased back 70% by 2007. Since land alone stands for 70% or more of a farm’s total
assets, one concludes that farming is very risky in Brazil. Why did this rapid fluctuation in
land value happen? In Figure 8, one sees that the average return per hectare2 jumped more
than 35% in the four years from 1989 to 1993 and fell 40% from 2002 to 2006. That
fluctuation is attributable not to prices but to increasing yields and the fall in chemical input
prices, stimulating output expansion, which up to 1999 demanded no additional expansion
of land. Indeed, as yields increased, the “effective” (yield-corrected) land supply was growing
and its price was falling. When yields stopped increasing, more land was needed, but the
“effective” supply of land stagnated and prices began to rise again. Farm asset value varies
widely and helps explain why farmers have had hard times meeting financial obligations,
despite yield gains and growing output.
2 Land net return is an index dividing terms of trade (the price received by farmers over the price paid, multiplied by yield per hectare).
0
20
40
60
80
100
120
140
160
180
1989 1990 1991 1992 1993 1994 1995 1996 1997 1998 1999 2000 2001 2002 2003 2004 2005 2006 2007
LAND PRICE
FARM AREA
YIELDS
NET LAND INCOME /HA

Geraldo Barros Brazil: The Challenges in Becoming an Agricultural Superpower 13
The second point to complete the farmers’ story may seem paradoxical: While large numbers
of farmers left the agricultural business, the government insisted on settling more people in
the farming sector. Brazil’s share of the rural population fell from 64% of the total in 1950
to 44% in 1970 and to 19% in 20003. That has meant that since World War II, every decade
has seen about 10 to 15 million people in Brazil leave rural areas and move to urban centers.4
In 1998, the mean per capita income in rural areas was still only half that in urban areas.5
Despite this income discrepancy, the official agrarian reform programs have been settling (or
promising to settle) around 70,000 to 80,000 families per year over last 10 years.6 In addition,
the land reform program is proceeding without a visible conclusion and under practically
continuous conflicts over land ownership, thus deepening the environment of uncertainty in
farming activities.
V. BRAZIL’S GROWTH CHALLENGES
Sustainable economic growth has to be a consequence of productivity increases, as pointed
out by Helpman and Krugman (1993). Brazil and Latin American countries in general have
lagged behind as far as economic development is concerned in the four decades since World
War II (Summers and Heston 1991). Labor productivity in those countries has remained at
about 30% of labor productivity in the United States during that period, according to van
Ark & McGuckin (1999). One hypothesis is that closing their economies to trade—a strategy
to reach industrialization—was one major factor explaining the observed stagnation in
productivity in Latin American countries. Others factors were underinvestments in human
capital, science and technology, and infrastructure.
Pires and Garcia (2004) show a decomposition of total factor productivity (TFP) among
countries in terms of technical progress, technical efficiency, scale effect, and allocative 3 IBGE (1950,1970,2000) 4 Camarano and Abramovay (1999). 5Kassouf (2005). 6 Gomes (2006)
Geraldo Barros Brazil: The Challenges in Becoming an Agricultural Superpower 14
efficiency. Brazil’s TFP was hit by allocative factors but not by a lack of technical progress,
as were other Latin American countries. Allocative efficiency has been directly associated
with the degrees of openness and inversely associated with the importance of the public
sector in the economy. Brazil has a 40% share of its GDP spent by the government and still
is a rather closed economy, with a ratio of imports plus exports to GDP of 21.5%.
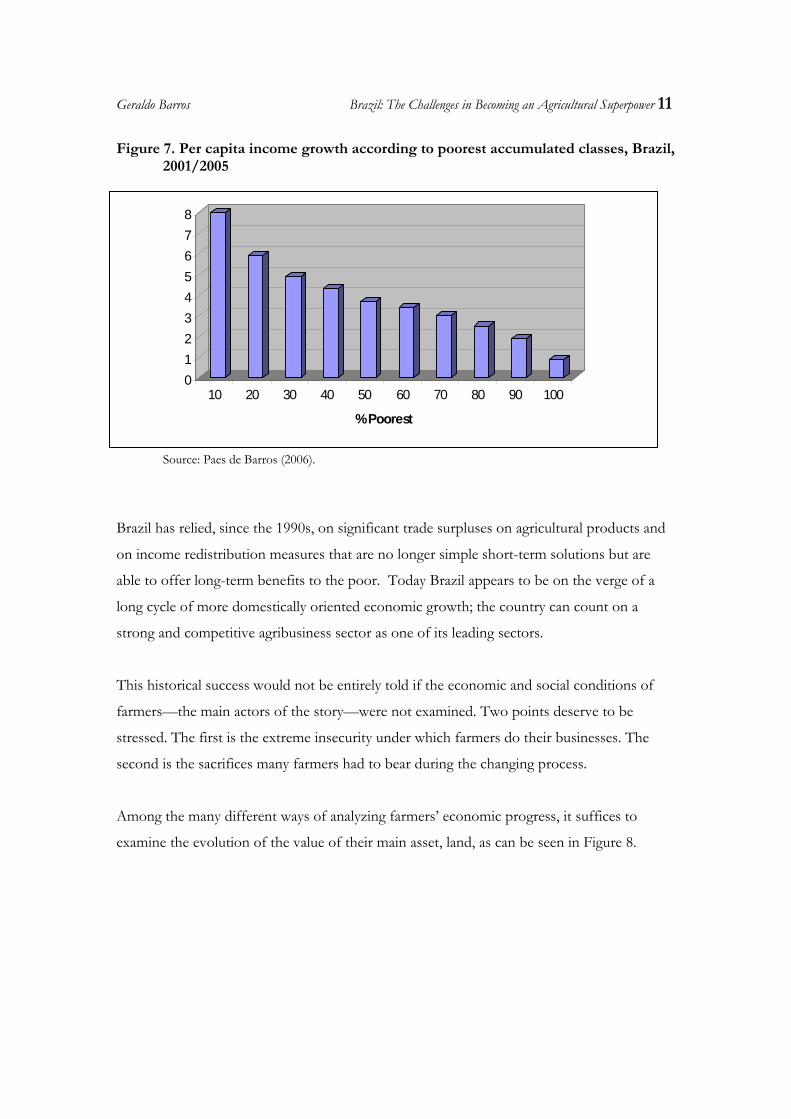
As can be seen from Figure 9, growth policies can be targeted at the production function
(science and technology and economic integration) and/or the factors of production. For
labor, human capital policies can be designed; for capital, economic (capital market)
integration and savings policies can be developed; and for natural resources, environment
policies can be devised.
Figure 9. Policies for enhancing factor of production and production function
Source: author
VI. ECONOMIC INTEGRATION
Brazil has partially opened its economy. As imports were taxed, by the mid-1980s, the
imports/GDP ratio had fallen to only 6.6% (during which time the mean tariff rate was
LABOR
CAPITAL
NATURALRESOURCES
ECONOMICINTEGRATION
S & T
HUMANCAPITAL
ENVIRONMENT
SAVINGS
PRODUCTION FACTORS
PRODUCTIONFUNCTION
POLICIES

Geraldo Barros Brazil: The Challenges in Becoming an Agricultural Superpower 15
45%). In 1996, this mean rate had fallen to 13.6% (while the highest one was still kept at
35%). Since 2000, and up to 2006, the imports ratio was close to 9%7. For Brazilian
agribusiness, the remaining barriers to industrial trade and services have been obstacles at the
trade negotiation tables.
The FTAA negotiations failed to progress as either Brazil’s demands on market access and
USA’s requirements on intellectual property rights, trade on services and government
procurement and investment protection were not met at the depth desired by each part8.
Anderson, Martin and Valenzuela. (2006) argue that market access is more important than
domestic subsidies because of the amounts of support involved and because of its higher
potential for distortion. Not only tariffs should be reduced but technical and sanitary barriers
should be properly reconsidered and better disciplined.
AS a matter of fact, Brazil has concentrated its trade efforts on Mercosur, within which the
performance of each member has been dictated mostly by macroeconomic factors,
particularly the cyclical exchange rate and GDP growth. This trade agreement, as should be
expected in cases involving similarly endowed countries, has led predominantly to
intraindustry trade, although Brazil was favored on manufactured goods and Argentina on
agricultural commodities, fuel, and other nontraditional goods thanks to gains of scale.
Thanks to growth in productivity, Brazil has been able to expand as a global trader faster
than Argentina, and it has also done better in trading within Mercosur.
Although Brazil’s trade strategy has been condemned for lacking focus, Harrison et al.
(2003) argued that Brazil can benefit from the strategy of simultaneously negotiating trade
agreements such as the Free Trade Area of the Americas (FTAA) and the Mercosur–
European Union agreement while supporting the Doha liberalization agenda. Since Brazil’s
tariff structure favors capital-intensive industry, liberalization would strengthen labor-
intensive sectors, thus increasing the demand for, and wages of, unskilled labor. Therefore,
Brazil could gain if both the United States and the EU offered tariff free access to
agricultural markets in exchange for liberalized industrial markets. If the most protected
7 External trade data from MDIC (Ministério do Desenvolvimento, Industria e Comércio Exterior): http://www.desenvolvimento.gov.br/sitio/interna/interna.php?area=5&menu=1486&refr=608 8 US Government Accountability Office 2005

Geraldo Barros Brazil: The Challenges in Becoming an Agricultural Superpower 16
markets of each were not opened, the FTAA would be preferred as a trade partner (because
of the other FTAA partners). The FTAA and EU- Mercosur are trade-creating agreements
for the countries involved, but multilateral negotiations with only 50% tariff liberalization
would bring gains to the world as a whole four times greater than just FTAA or the
Mercosur-EU agreements (Harrison et al.,2003).
Anderson, Martin and Mensbrughhe (2006) showed that full liberalization in the Doha
Round would lead to a 0.67% gain in the world’s real income (US$287 billion/year), 70% of
which accruing to high-income countries. Interestingly enough, two-thirds of the gains
would be derived just from agricultural liberalization. Half the benefits will come from
South-South liberalizations because of the observed recent increase in trade within emerging
countries at slightly higher than average tariffs. Ninety-three percent of the gains from
liberalization would come from tariff removal versus export and domestic subsidies.
Most analyses of economic integration—static as they are from a technological perspective,
and subject to several methodological constraints—point to very small gains for liberalizing
countries. Results for the United States prompted Krugman (1995) to conclude that “yet
there is a dirty little secret in international trade. The measurable costs of protectionist
policies—the reductions in real income that can be attributed to tariffs and import quotas—
are not all that large. … For example, most estimates of the cost of protection in the United
States put it well under 1 percent of GDP.” Similar results were found by Ferreira Filho and
Horridge (2006), who showed that Brazil’s GDP would rise by 0.31% in a full worldwide
liberalization scenario.9
Most Latin American countries implemented the import substitution strategy, thus ignoring
factors such as the minimum size of plants, increasing returns to scale and indivisibilities in
the production process, which explain the observed relationship between exports and
economic growth. In addition to these sources of inefficiency, Bacha and Bonelli (2004)
9 This study, for instance, uses a computable general equilibrium static interregional model of Brazil based on the ORANIG model of Australia (Horridge 2000) with given technological input/output data for 1996. Other relevant assumptions are that national levels of labor employment and capital are fixed, land is fixed in each sector, and the trade balance is a fixed share of GDP.
Geraldo Barros Brazil: The Challenges in Becoming an Agricultural Superpower 17
estimate that the relative price of investment goods doubled between the 1950s and the
1980s in Brazil—most of which is attributable to an import substitution development
strategy that protected the domestic industrial sector. In other words, closing the economy
brings about underinvestment in capital goods because it makes these goods more
expensive.
Increasing returns to scale is a key factor in explaining major puzzles of recent integration
experiences, such as the predominance of trade between similar countries (in terms of factor
endowments) and the strength of intraindustry trade. Scale economies may arise from the
expansion of exports and imports of intermediate goods (or parts). Consumers benefit from
cheaper imports of large-scale production, both nationally and abroad.
The role of trade as an important factor affecting the availability and distribution of
knowledge is discussed by Grossman and Helpman (1995), who show that trade can
distribute knowledge directly and indirectly (through the transference of intermediate goods,
which embody research and development, R&D). In their analysis, Targetti and Forti (1997)
use the Kaldorian “cumulative causation” and the “technology gap” approaches, which can
be used to describe how a country lagging behind the technological frontier can benefit from
technology spillover, if it has the potential to do so. Baumol and Wolf (1988) identified some
convergence clubs (groups within which convergence takes place) as being industrialized
countries, centrally planned economies, and middle-income economies. Convergence was
not observed in the low-income-country group.
In the case of agriculture, it has long been shown that trade is a crucial condition for
sustainable technical innovation and growth. Cochrane (1953) argued that because of what
he called the “technological treadmill,” innovation is profitable for the first adopters, but the
incentives soon wane. As more and more farmers adopt the new technology, prices decline
and profits are reduced because of the inelasticity of domestic demand. Economic
integration, however, has the fortunate effect of expanding the market and increasing
demand elasticity, thereby taking farmers—at least partially—off the treadmill trap, making it
possible for scale economies to be exploited for the benefit of producers and consumers

Geraldo Barros Brazil: The Challenges in Becoming an Agricultural Superpower 18
alike. The growing efficiency of modern agriculture in Brazil could be attributed in great part
to the international integration the country engaged in during the 1990s.
It is worth mentioning that protectionism, by depressing agricultural prices, leads to the
gradual loss of that providential role attributed to external markets. It is as if the security net
is gradually moved down, so that farmers will need to reduce costs as protectionism
advances. That may be related to continuous increases in farm size—to explore economies
of scale—with probable negative social effects, or even to the need to look for new, cheaper
lands with probable negative environmental effects.
VII. SCIENCE AND TECHNOLOGY
Brazil has a structured science and technology (S&T) system that is increasingly integrating
governmental and private business sectors. For Krieger (2005), however, Brazil still lags
behind other emerging countries like China, India, and South Korea, with a total expenditure
in S&T representing 4% of GDP. Some aspects of evidence for Brazil’s performance in
S&T, presented by Krieger (2005), are that (1) scientific production is increasing around 8%
a year; and (2) doctor graduation rates are increasing 14% a year, with a current flow pf
around 7,500 doctors/year (the number of researchers graduating annually, 126,000, is still
very low, at less than 0.5 per 1,000 people). The major challenge is to expand S&T
production and capacity building while at the same time accelerating the transfer of
technology to the business sector. Private and foreign companies have a small but increasing
contribution; American companies spend 0,5% of sales revenue on R&D in Brazil
(Hiratuka, 2005), which ranks fifth in terms of countries receiving American R&D money
over the next three years—behind China, the United States, India, the United Kingdom, and
Germany—according to the Economist Intelligence Unit (2004).
Investments in agricultural technology have not been disregarded. In the early 1970s,
EMBRAPA—the Brazilian Agricultural Research Company—was created by the military
regime as the core agricultural institution and the coordinator of a structured agricultural
research system. Funding of the system has not been maintained at desirable trends, but

Geraldo Barros Brazil: The Challenges in Becoming an Agricultural Superpower 19
minimum levels have been assured so that the flow and standard of research have been
preserved by different administrations since the system was implemented. Recent figures
presented by Alves & Oliveira indicate that EMBRAPA’s yearly budget is close to US$300
million, or 0.6% of agricultural GDP. It is important to emphasize that EMBRAPA is the
leading public institution generating technology for the agricultural sector; however, most
universities also conduct research and develop agricultural technology. For instance, the
University of São Paulo’s share of overall scientific publication is 24% of Brazil’s total,
according to Leta et al (2005).
One major challenge faced by the agricultural research system was to make the occupation
of the cerrado viable, particularly with the adaptation of soybeans, but also with beef, pork,
poultry, milk, and vegetables.10 Among the notable techniques produced/adapted by
EMBRAPA was the no-till system, which simplified operations and reduced the costs
associated with the diversification, rotation, and succession of (multiple) crops. Additionally,
EMBRAPA devised cattle-crop association and its optimistic perspectives regarding the
cerrado’s sustainability. Cerrado soils have favorable physical conditions but are highly acid
and low in phosphorus, calcium, magnesium, and potassium. New techniques were also
developed to detect and correct the acidity and fertility problems adapted to different
production systems. Agricultural gypsum—a by-product phosphatic fertilizers—is used to
correct calcium deficiencies in the deepest soil layers, reducing aluminum saturation and
providing for the soil’s sulfur needs.
Maize (corn), soybeans, and coffee are the crops that benefited the most from the use of
gypsum. Soybeans, beans, and peas, meanwhile, have expressly benefited from the nitrogen-
fixing bacteria inoculation practice. Besides saving large amounts of urea, inoculation also
provides environmental gains since it avoids water source contamination.
EMBRAPA’s current priorities encompass:11
10 See www.cpac.embrapa.be/tecnologias for information on EMBRAPA’s contribution to cerrado agriculture. 11Lima (2007).

Geraldo Barros Brazil: The Challenges in Becoming an Agricultural Superpower 20
a) Precision in agriculture;
b) Environment services in agriculture;
c) Health-promoting (functional) foods;
d) Aquaculture technologies;
e) Biosafety for genetically modified crops;
f) High-quality beef;
g) Organic agriculture;
h) Conservation of national genetic resources;
i) Tools for plant sanitary protection;
j) Forest for energy production;
k) Environmental, social, and economic effects of the beef industry;
l) Nanotechnology;
m) Sustainable production of sugarcane for energy purposes;
n) Genomics technologies for the development of water-use-efficient plants;
o) Technologies for biodiesel production;
p) Genomics for the advancement of animal breeding and production;
q) Climatic risks zoning for small farming agriculture, bioenergy, and pastures.
Still regarding the technological side of the agrobusiness in Brazil, the case of ethanol is
worth mentioning. Interestingly enough, a significant part of the research efforts has been
made by the private sector. On the agricultural field, technology results have been observed
in terms of new varieties thanks to the “Genoma Project”, biological pest control and soil
management. At the industry level improvements have been made in fermentation – through
DNA analysis - , energy co-generation – through the use of bagasse – and the destination of
residuals for soil fertilization. Over the last 30 years national average yield has increased
around 30%; in the Center-West (Cerrado) region the increase reached as much as 75%.
During the same time period, the cane sugar content was raised from 9.5% to 14%, and the
cane sugar extraction rate grew from 88% to 98%. As a result the ethanol production per
hectare has grown 56% since 1980. Currently besides continuous efforts in these areas
leading ultimately to higher productivity and lower costs, frontier research is being carried

Geraldo Barros Brazil: The Challenges in Becoming an Agricultural Superpower 21
out on such matters as the production of ethanol from cellulose of, for instance, the cane
bagasse12.
VIII. HUMAN CAPITAL
Brazil has some positive educational results to show over the last 30 years, but there remains
a long way to go13. For instance, illiteracy (within those age 15 or older) has been reduced
from 33.6% of the population in 1970 to 11.1% in 2005, which is still a large rate and only
lower than Bolivia’s in Latin America. In addition, in 2006, 22% of the Brazilian population
15 years and older was functionally illiterate, defined as having fewer than 4 years of
schooling.
The rural population over 15 years old has a mean 4.3 years of schooling, while the urban
mean is 7.7 years, so farm activity is mostly hit by the lack of formal education. The rural
sector has an illiteracy rate of 30 % for people over 15 years of age, and functional rural
illiteracy is 44% Only 27% of rural youth 15-17 of age are attending school.. On the other
hand, the World bank data show that most of the progress in basic schooling took place
within the poor part of the population; from 1992 to 2001, enrollment in primary education
increased from 97% to 99% in the 20% richest bracket of the population and from 75% to
94% in the 20% poorest bracket.14 The same data indicate that since illiteracy ranges from
2.7% for the population age 15 to 19 years to 30% for those between 65 and 69 years, the
dynamics of the population indicate a strong trend towards reducing the problem over time.
Brazil has a long way to go to improve the educational level of the majority of its population
not only for competitive edge but also as the essential way to seriously and permanently fight
poverty. Quantitative results at the elementary level from efforts of the 1990s and 2000s are
good; however, overall student proficiency is very low. Human capital investments take a
long time to mature, so the sooner they begin, the better for the country.
12 Bom & Ferrara (2007). 13 Data for education are from IBGE (2007). 14 http://siteresources.worldbank.org/EDUCATION/Resources/Education-Notes/EdNotesBrazil.pdf.
Geraldo Barros Brazil: The Challenges in Becoming an Agricultural Superpower 22
IX. THE ENVIRONMENT
Environmental problems must be examined within a social and economic cost/benefit
analysis, provided that costs are duly internalized to firms. For instance, it is usual to observe
that expanding agriculture anchored on Green Revolution practices and stimulated by fiscal
incentives and cheap credit provoke a series of negative environmental effects. But most of
these effects are reported to have no grounding in hard evidence. It is an unproven matter
that deforestation is caused by crop or beef cattle activities. There is, on the other hand,
evidence that both may be carried out in economically sound ways.15 Beef cattle ranching has
been shown to be a profitable activity, apart from deforestation revenues. On the other
hand, it is true that beef cattle are associated with the emission of the methane, as it
corresponds to 60% of carbon dioxide emissions from the farm sector.16
Technology alone does not help much. About 17% (Shiki, 1997) of the open area in the
cerrado, for instance, is currently abandoned; land (a major asset for many farmers) is used up
to exhaustion, which does not take a long time, despite the availability of technology to
circumvent degradation through no-tillage systems and pasture-crop integration/rotation.
Going after new land is still privately cheaper than preserving the older, more degraded land
currently in use.
Among the environmental risks, one can mention illegal deforestation, intentional and
unintentional burning, river sedimentary deposits, provoking water scarcity and a reduction
of water quality, and air pollution (nitrogen oxide, carbon monoxide, hydrocarbons, and
particulate matter, in addition to other highly toxic substances). Again, there is not enough
hard evidence on the extent and effects of these events.
As has been the case of food security (and quality), the world market—and ultimately
consumers in general—will learn to play a fundamental role in the interaction between
15 Margulis (2003). 16 Ministério de Ciência e Tecnologia (2004).

Geraldo Barros Brazil: The Challenges in Becoming an Agricultural Superpower 23
production of food and the natural resources required for that production. This will come
through price incentives as far as consumers are willing to pay a higher price for the output
of environmentally friendly production processes. Also punishment through tariff and
nontariff barriers may induce farmers and agroindustries towards desirable production
processes.Then, technology will be able to play a key role in enhancing production
efficiency, the intensification of land use, and improving grass and feed quality.
Environmentally recommended practices, when privately profitable, have been adopted at
fast rates by farmers. Soybean and corn in successive (multiple) croppings have permitted
the use of the same land tract twice. That is a highly intensive use of land with possible
harmful environment consequences, but high-intensity land use is also a substitute for
deforestation. On the positive side, the accelerated expansion of the no-tillage system is a
strong example of an environmentally friendly practice.
X. SAVINGS AND INVESTMENT
The Brazilian farm sector has shown enough capacity to grow expansively over the past
thirty years, while prices decreased thanks to substantial productivity growth. A significant
part of the investment necessary to achieve this was facilitated by cheap government credit
from the 1960s to the 1980s.17 Cheap credit also played the role of partially offsetting policy
discrimination against agriculture through, for instance, overvalued currency and price
controls.18
During the sequence of inflation-fighting economic reforms in the 1980s—marked by deep
market intervention and price controls—credit supply was curtailed, and the outstanding
debt was adjusted at monetary correction rates. These rates were considered too high by
many farmers, who since that time have been involved in cyclically renegotiating repayments.
Additionally, as the flow of official credit was curtailed and/or access to it was denied
17 Rahal estimates that the highest rural credit subsidy was reached in 1979–80 and that since 1991 its average has been near zero (Rahal 2003). 18 Barros (1992).

Geraldo Barros Brazil: The Challenges in Becoming an Agricultural Superpower 24
because of overdue debt, farmers adopted the only strategy left: investing when savings
and/or suppliers’ credit were available, i.e., during periods of high profitability. This creates
a cyclical pattern that leads to the majority of farmers investing simultaneously when the
prices of capital goods and inputs are high. As a result, during years of low profitability,
farmers are unable to fully repay their debts. This then leads to a new wave of renegotiations.
Usually, as a palliative measure, the government agrees to facilitate current repayments
related to both official and suppliers’ debt. Of course, within a couple of years the problem
will show up again. The current 2008 agricultural debt is estimated to be close to US$50
billion, according to the Central Bank’s data elaborated by Rezende & Kreter (2007), a value
very close to half the farm sector’s GDP.19
The agricultural debt ended up being transferred to the National Treasury as part of the
program that restructured the banking system in the 1990s, known as PROER. So the
definitive solution to the problem will come if and when the government takes time to
formulate a long-term repayment scheme compatible with the real cash or savings flow from
farming. The next step will then be to reestablish normal loans to farmers and, more
important, to promote the creation of a savings and loans system, by and for farmers, to
avoid the present vicious cyclical investment pattern.
As farmers reenter the financial market, it is essential to make sure that the nonfarm
investments needed for agribusiness’s expected growth are forthcoming. On the one hand,
there are those general, nonspecific infrastructure investments like energy and transportation
facilities, which are general preconditions for private investment. On the other hand, there
are those agribusiness specific investments, like farm and nonfarm processing and storage
facilities. Barros et al. (2007)20 estimate that capital/output ratio in the Brazil’s agribusiness
sector is close to 2.6, a number very close to the national (whole economy) average (Feo,
2001). According to Barros et al , the agribusiness sector has been investing around 9% of its
GDP. In general, land stands for half the typical supply chain’s capital stock. Considering a
constant capital/output ratio of 2.6, then if the agribusiness output grows at 3.1% per year to
19 For Brazilian agribusiness GDP estimates, see http://www.cepea.esalq.usp.br/pib/. 20 See also Feu (2001) and Silva Filho (2001).
Geraldo Barros Brazil: The Challenges in Becoming an Agricultural Superpower 25
meet a 2.6%yearly growth in domestic demand and 9.4% growth in exports, capital stock
will have to expand 30% in the coming 10 years. The amount of new capital is US$38 billion
(9% of agribusiness GDP) on average per year for the next ten years21.
Farmers will be responsible for 9% (US$3.4 billion/year) of the overall amount—excluding
land—of farm investment per year. Official rural investment credit,22 which has been
financing just half that amount, has to be expanded proportionally (that is, doubled). That
points to the importance of solving the agricultural debt problem to open the possibility of
farm investment intensification.
The two major challenges to agribusiness expansion are related to capital restriction. First,
there is the issue of available land, which is widely estimated to be around 90 million
hectares, not counting current native forest.23 Second, there is the additional capital needed
to put that land to work, which this naive estimate ignores. Many analysts are optimistic
about the potential for alternative ways of increasing production based on the lowest
possible land-use expansion, by increasing the adoption of multiple croppings in the same
land tract, together with crop-cattle-forest cycles in degraded pasturelands.
Among the major obstacles facing the expanding agribusiness sector in Brazil, it is important
to remember the amount of available capital investment and the lack of previous
infrastructure investments in transportation and energy, which also inhibit private
investments in agribusiness-related capital. In this later aspect, there have been efforts to set
up a regulatory system to attract private partners to invest in infrastructure. There is
currently an investment plan (PAC24) to be executed with US$35 billion in public and private
capital from 2007 to 2010, which includes reforming and building new roads (45,000 km),
railways (2,300 km), water transportation systems (67 ports, 1 canal lock) and airports (20).
21 See appendix for detailed calculation of investment needs. 22Most of the credit for farm investment proceeds from nonmonetary sources, mainly from the Worker Support Fund (FAT). Working capital credit, on the other hand, is funded by demand deposits. See Rezende and Kreter 2007. 23 Sampaio (2004). 24 Plano de Aceleração do Crescimento, Growth Accelerating Plan

Geraldo Barros Brazil: The Challenges in Becoming an Agricultural Superpower 26
The efficacy of the plan’s implementation is still under question, due to the generally
observed bureaucratic inefficiency of the public sector..
Since PAC involves both public and private funds, its execution is subject to many
jurisdictional questions as demonstrated by similar previous initiatives, which rendered many
controversies related illegalities and corruption. In addition, the major political party
supporting the federal government is somewhat ideologically divided insofar as private
capital entering public investment is concerned. Finally, many PAC initiatives will take place
in native forest and Indian regions and have to be their proposal approved by their national
government institutions (IBAMA and FUNAI), respectively.
Still another investment-inhibiting factor is the lack of economic security related to
institutional uncertainty, which affects land ownership. For example, several farms and
technology companies have been subject to unaccountable property-invasion events, most of
which have gone unpunished. Despite the growing number of people settled in rural areas,
the completion of the land reform process is still beyond the horizon.
XI. WORLD SCENARIO
The new century brought a worrying scenario with respect to the performance of Brazil’s
agribusiness sector. Brazil will play an important role as the world finds its way out of a
dangerous crisis, in which the prices of agricultural commodities and production inputs have
exhibited an unprecedented upward trend. The World Bank predicts that to meet growth in
demand, cereal supply would have to increase by 50% and that of meat by 85% from 2000
to 2030. The problem emerges if these changes occur too rapidly. According to the IMF,25
commodity dollar prices for food increased by 57.3% and those for beverages by 47.6%
from 2005 to March 2008. Starting in 2002, the rise was 65.5% and 58.5%, respectively,
during the period in which the Food and Agriculture Policy Research Institute estimates that
25 IMF 2008.

Geraldo Barros Brazil: The Challenges in Becoming an Agricultural Superpower 27
fertilizer prices more than doubled.26 This evidence suggests that both output and input
prices have moved markedly upward, leading to the conclusion that output may increase in
response to an expansion of demand and to the rise in commodity prices, but so too will
costs.
The price surge is the result of a worldwide expressive growth in emerging and developing
countries where food—cereals and meat—demand income elasticity is higher than the world
average. At the same time, there is an expectation that world agribusiness will help produce
energy from new, cleaner sources like ethanol and biodiesel. The fast-growing demand in the
natural resources sector—for things such as food, fibers, clean energy, oil, and minerals—
means that at least in the short and medium terms such commodities will see their relative
prices rise when compared to industrial goods and services.
Unfortunately, an offsetting new wave of productivity increases is not in sight. In the United
States, for example, agricultural multifactor productivity, which grew at a rate of 2.01% a
year from 1950 to 1989, has been increasing at half that rate since 1990.27 In Brazil, the last
couple of years have seen yields practically stagnate. Nevertheless, the productivity gap
between developed and African countries is widening rather than closing.28 At this time,
therefore, it is hard to see that prices will end up declining in response to increasing output.
At the current rate of world economic growth—particularly in China, African oil-producing
countries, and other emerging economies—it is expected that demand for agribusiness
commodities, such as grains, meat, fibers and energy, will continue to grow firmly, and prices
of both output and inputs will remain higher than their 2005–6 level. Agribusiness price
increases, coupled with high and increasing oil prices, indicate that accelerated economic
growth will continue in tandem with inflation. If inflation is to be restrained, economic
growth must be sacrificed. Ironically, the need to grow at a slower rate comes when a leading
developed country looks for measures to avoid a recession, and when emerging countries
appear to have, at least in part, decoupled themselves from the United States. It is probable
26 http://www.fapri.missouri.edu/outreach/publications/2008/FAPRI_MU_Report_03_08.pdf. 27 http://www.farmfoundation.org/projects/documents/2007PardeyAlstonHandout.pdf. 28 World Bank. (2007).

Geraldo Barros Brazil: The Challenges in Becoming an Agricultural Superpower 28
at this point to say that while economic independence is not very useful, a reduction in
growth is inevitable.
If the demand for agribusiness output is not contained, the world risks not only high
inflation but also a renewed attack on natural resources. Brazil in particular already faces the
challenge of finding ways to effectively preserve its natural resources, especially its rainforest,
but also its soil and water supply. A surge in agribusiness production in response to
skyrocketing prices and costs will not help to circumvent these difficulties.
XII. CONCLUSION
What challenges does Brazil face in becoming an agricultural superpower? First, it is
necessary to restore the investment pattern in infrastructure, science and technology, and
human capital of previous decades—with the difference that this time the role of the private
sector will necessarily be much more important, financially speaking. The role of the public
sector will be very important as well because, to begin with, the private sector depends on
proper regulation and institutions developed by the public sector. Fortunately, the federal
government has recently launched several infrastructure projects to be developed by the
private sector, and important progress has been made regarding the use of biotechnology in
agriculture. However, many farmers still feel insecure with respect to land-related ownership
conflicts involving so-called social movements. In addition, the public sector is supposed to
efficiently deal with new twenty-first-century issues such as environmental matters (i.e., air
and water pollution, deforestation), sanitary and food quality/security conditions, and trade
negotiations related to various types of protectionism. Meanwhile, the public sector has yet
to deal with centuries-old issues such as rural labor relations, agrarian reform, and indigenous
peoples’ issues.
Within 10 years, according to FAPRI, Brazil’s agribusiness is expected to reach a share of
one-third of soybean production, and one-fourth of sugar production; 50% of the exports of
broilers and beef will come from Brazil. At the same time Brazil will double its ethanol
production. Besides the investments in basic infrastructure (transportation, energy, etc.),

Geraldo Barros Brazil: The Challenges in Becoming an Agricultural Superpower 29
substantial direct agribusiness (farm and agroindustry) investment will be needed, much of
which is expected to come from the nonpublic sector, as well as from abroad.
XIII - REFERENCES
1 Alves, E. , A.J. Oliveira. 2005. “O Orçamento da Embrapa”. Revista de Política Agrícola XIV(4) Anderson, K., W. Martin, and D. Mensbrughhe. 2006. “Doha Polices: Where Are the Pay-Offs?” In Trade, Doha, and Development: Window into the Issues, World Bank. http://web.worldbank.org/WBSITE/EXTERNAL/TOPICS/TRADE/0,,contentMDK:20732399~pagePK:148956~piPK:216618~theSitePK:239071,00.html. Anderson, K. W.Martin, E.Valenzuela. 2006. “The Relative Importance of Global Agricultural Subsidies and Market Access”. World Bank Research Working Paper 3900, April. Bacha, E.L., and R. Bonelli. 2004. Accounting for Brazil’s Growth Experience. 1940–2002. Texto para Discussão 1018. IPEA, Brasília. Barros, G.S. C., et al. 2007. Análise dos Impactos Econômicos e Sociais do Programa do Biodiesel no Brasil. CEPEA-ESALQ/USP, Banco Mundial. 51p. (preliminary version). Baumol, W., and E. Wolf. 1988. “Productivity Growth, Convergence and Welfare: Reply.” Amer. Ec. Rev. 78: 1155–59. Bon, E.P.S. , M.A Ferrara.2007. “Bioethanol Porduction via Enzymatic Hydrolisis of Cellulosic Biomass” http://www.fao.org/bitech/seminaroct2007.htm Camarano, A. A., and R. Abramovay. 1999. “Êxodo Rural, Envelhecimento e Masculinização no Brasil: Panorama dos últimos 50 anos.” Texto para Discussão 621. IPEA.Rio de Janeiro. http://www.econ.fea.usp.br/abramovay/artigos_cientificos/1999/Exodo_rural.pdf. Cochrane, W.W. 1953. “A Theoretical Scaffolding for Considering Governmental Pricing Policy in Agriculture.” Journal of Farm Economics XXXV(1): 1–14. Economist Intelligence Unit, 2004.Scattering the seeds of invention: The globalisation of research and development. http://www.eiu.com/GlobalisationOfRandD. FAPRI. 2008. FAPRI 2008 World Agricultural Outlook.Center for Agricultural and Rural Development.Iowa State University.(http://fapri.iastate.edu)

Geraldo Barros Brazil: The Challenges in Becoming an Agricultural Superpower 30
Ferreira Filho, J.B.S., and M. Horridge. 2006. “Economic Integration, Poverty and Regional Inequality in Brazil.” Rev. Bras. Econ. 60(4): 363–87. Feu, A., 2001. “Evolução da Razão Capital/Produto no Brasil e nos Países da OCDE.” Economia & Energia 28.( http://ecen.com/eee28/ocde.htm) FGV- CPDOC. “A Era Vargas - 1º tempo - dos anos 20 a 1945.” http://www.cpdoc.fgv.br/nav_historia/htm/ev_saibamais.htm. Gasques, J. G., E. T. Bastos, and M. R. P. Bacchi. 2006. “Produtividade e Fontes de Crescimento da Agricultura Brasileira” (mimeo). IPEA, Brasília. [email protected]. Gomes, M. 2006. “Reforma agrária - ONG diz que reforma agrária de Lula é ‘residual’”. Reporter Brasil. www.reporterbrasil.org.br. Grossman, G., and E. Helpman. 1995. “The Politics of Free Trade Agreements.” Amer. Econ. Rev. 85(4): 667–90. Harrison, G.W., J.F. Rutherford, D.G. Tarr, and A. Gurgel. 2003. “Regional, Multilateral, and Unilateral Trade Policies of Mercosur for growth and Poverty Reduction in Brazil.” Development Research Group, World Bank. Helpman, E., and P.R. Krugman. 1993. Market Structure and Foreign Trade. MIT Press, Cambridge, Mass. Hiratuca, C. 2005. “Internacionalização de atividades de presquisa e desenvolvimento das empresas transnacionais: análise da inserção das filiais brasileiras”. São Paulo Perspec. vol.19 no.1 São Paulo Jan./Mar. Horridge, J.M. 2000. “ORANIG: A General Equilibrium Model of the Australian Economy.” Working Paper No. OP-93. Centre of Policy Studies, Monash University, Melbourne. IBGE. 1950, 1970, 2000. Censos Demográficos. Rio de Janeiro,RJ. IBGE (2007), Síntese dos Indicadores Sociais ftp://ftp.ibge.gov.br/Indicadores_Sociais/Sintese_de_Indicadores_Sociais_2007/Tabelas/ IMF 2008. Índices of Primary Commodity Prices. http://www.imf.org/external/np/res/commod/table1b.pdf Kassouf, A L. 2005. “Acesso aos serviços de saúde nas áreas urbanas e rurais do Brasil.” RER 43(01). http://www.scielo.br/pdf/resr/v43n1/25834.pdf . Krieger, E.M. 2005. Perspectivas da Ciência e Tecnologia no Brasil. PPT Presentation. www.iea.usp.br/iea/online/midiateca/perspectivas.ct.krieger.ppt

Geraldo Barros Brazil: The Challenges in Becoming an Agricultural Superpower 31
Krugman, P. 1995. “Dutch Tulips and Emerging Markets: Another Bubble Bursts.” Foreign Affairs, July-August. Leta, J. C.R.J. Pereira, H. 2005. “The Life Sciences - the relative contribution of the University of São Paulo to the highest impact factor journals and to those with the largest number of articles, 1980 to 1999”. Scientometrics 63(3) Lima, S.M.V. 2007. “R&D Priorities and Portfolio.” EMBRAPA. Research and Development Department. http://www.anodaciencia.com.br/multimidia/multimidia_20080318163314.pdf. Margulis, S. 2003. “Causes of Deforestation of the Brazilian Amazon.” http://www.diesel-ebooks.com/cgi-bin/item/5551407977/Causes-of-Deforestation-of-the-Brazilian-Amazon-eBook.html. Ministério de Ciência e Tecnologia. 2004. “Influência do Manejo da Produção Animal sobre a Emissão de Metano em Bovinos de Corte, Brasília-DF.” www.mct.gov.br/upd_blob/0012/12921.pdf Paes de Barros, R. 2006. “A Recente Queda na Desigualdade no Brasil: magnitude, determinantes e conseqüências”. PPT presentation, IPEA, Brasília. Pires, J.O., and F. Garcia. 2004. “Productivity of Nations a Stochastic Frontier Approach to TFP Decomposition.” Texto para Discussão 143. Escola de Economia de São Paulo – EESP/FGV. SP. Rahal, C.S. 2003. “A Evolução dos Preços da Terra no Estado de São Paulo: Análise de seus determinantes.” Dissertação de mestrado. ESALQ/USP. Piracicaba-SP. Rezende, G.C., and A.C. Kreter. 2007. “A Recorrência de Crises de Endividamento Agrícola no Brasil e a Conseqüente Necessidade de reforma da Política de Crédito Agrícola.” Revista de Política Agrícola XVI(4). Sampaio, E. 2004. O Estado da Arte da Agricultura Brasileira. Ministério da Agricultura, Pecuária e Abastecimento. http://www.bndes.gov.br/conhecimento/seminario/EduardoSampaio.pdf Silber, S. 2003. “Mudanças Estruturais na Economia Brasileira (1988–2002): Abertura, estabilização e crescimento.” http://www.usp.br/prolam/simao.pdf Shiki, S. 1997. “Sistema Agroalimentar nos cerrados brasileiros: caminhando para o caos?” In: SHIKI, S.; SILVA, J.G.; ORTEGA, A.C. (Org.) Agricultura, meio ambiente e sustentabilidade do cerrado brasileiro. Uberlândia: Universidade Federal de Uberlândia. Silva Filho, T.N.T. 2001. “Estimando o Produto Potencial Brasileiro: Uma abordagem de função de produção.” Texto para Discussão 17, Banco Central do Brasil.

Geraldo Barros Brazil: The Challenges in Becoming an Agricultural Superpower 32
Summers, R., and A. Heston. 1991. “The Penn World Trade Table (Mark 5): An Expanded Set of International Comparisons, 1950–88.” Quarterly Journal of Economics, May. Targetti, F, and A. Forti. 1997. “Growth and Productivity: A Model of Cumulative Growth and Catching Up.” Cambridge Journal of Economics 21: 27–43. United States Accountability Office. 2005. Free Trade Area of the Americas – missed deadline prompts efforts to restart stalled hemispheric trade negotiations. http://www.gao.gov/new.items/d05166.pdf Van Ark, B. R.H. McGuckin. 1999. “International Comparisons of Labor Productivity and per Capita Income. Monthly Labor Review (July). (www.bls.gov/opub/mlr/1999/07/art3full.pdf) World Bank. 2007. World Development Report. http://www.worldbank.org/wdr2007/.
APPENDIX
According to CEPEA-USP29, the Brazilian agribusiness constant price output (Y) had an average of R$523 billion from 1994 to 2007; domestic demand has taken 92% of that output and external demand, thus, 8%. Agribusiness output has been increasing at the average annual rate of 2.5% over that period while agribusiness net exports yearly rate of growth is estimated to be 9.4%. The following identity may be considered:
ttt YEXTDOM =+ (1) where DOM is domestic demand, EXT is net exports and Y is constant price GDP. The growth rate for those variable are related as follows:
YEXTDOM rrr =−+ )1( αα (2)
29 http://www.cepea.esalq.usp.br
Geraldo Barros Brazil: The Challenges in Becoming an Agricultural Superpower 33
where r is rate of growth and α is the share of domestic demand (DOM) in GDP. If as FAPRI assumes %4=YBr - that is Brazil’s real GDP increases at 4% per year, then, since domestic agribusiness demand elasticity 65.0, =YDOMη
026.0)04.0(65.0, === YYDOMDOM rr η or 2.6%
Then, using (2), agribusiness constant price GDP has to grow at the annual rate of:
031.0)094.0)(08.0()026.0)(92.0(^
=+=Y
r or 3.1%
very close to its recent historical rate. Since agribusiness output was evaluated at R$628 billion (US$393 billion) in 2007, it is predicted to be R$812 billion by 2017. Considering a capital/output ratio of 2.6, annual investment will present an average of R$61.5 billion (US$38.5 billion) so that agribusiness capital stock will increase from R$1.6 trillion (US$1 trillion) to R$2.3 trillion.