Embed Size (px)
Citation preview

Brazilian Water Resources
Report and Implementation of
SEEA-Water in Brazil
National Seminar of SEEA Implementation
Rio de Janeiro, September 2013

Reference for systematic and periodic follow up regarding water resources situation
and management in Brazil, as well as NWRP implementation status.
Brazilian Water Resources ReportAnnual Editions
2006 2009 2010 2013 201420122011
Brazilian Water
Resources Report
2009“Baseline”
2010 Update
Brazilian Water
Resources Report
2013
(State of the Art + Water Use Balance
2014 Update
ANNUAL VARIATIONS
2011
Update2012
Update
“Balance of the last 4 years”

Contextualização do Relatório -2013
• Fruto da integração estabelecida
com os diversos parceiros
institucionais em um processo
complexo de apropriação da
informação.
• Federais (SRHU, Inmet,
DNOCS, SBF/MMA, IBAMA,
Senir/MI)
• 50 órgãos gestores estaduais
de recursos hídricos e meio
ambiente
ANA
ANA
National WaterAgency
General CoordinationExecution/Implementation
INSTITUTIONAL PARTNERS
Environmental Institutions
INMET
DNOCS
MMA/SRHU,
SEMA/AC, SEMA/AP, SDS/AM, SEMARH/AL, IMA/AL, INEMA/BA, SRH/CE, COGERH/CE, IBRAM/DF, ADASA/
DF, CAESB/DF, SEAMA/ES, IEMA/ES, SEMARH/GO, AGMA/GO, SEMA/MA, SEMA/MT, SEMA/MS, IMASUL/MS,
SEMAD/MG, IGAM/MG, SEMA/PA, SECTMA/PB, AESA/PB, SUDEMA/PB, SEMA/PR, IAP/PR, ÁGUAS PARANÁ/PR, SRHE/PE, CPRH/PE, SEMAR/PI, SEA/RJ, INEA/RJ,
SEMARH/RN, EMPARN/RN, IDEMA/RN, IGARN/RN, SEMA/RS, FEPAM/RS, SEDAM/RO, FEMACT/RR, SDS/SC,
SMA/SP, CETESB/SP, DAEE/SP, SEMARH/SE, SEMADES/TO, NATURATINS/TO, SANEATINS/TO.
IBGE
MI/Senir
Ibama
/
State
Water Resources and
� Result of the integration of multiple institutional partners in a complex process of information appropriation� Federal – SRHU/MMA, Inmet, DNOCS,
SBF/MMA, Ibama/MMA, ICMBio/MMA, IBGE
� Over 50 state water resources and environment institutions
Context of the 2013 Report
� Use of the results of the 2008 National Survey on Water Supply and Sanitation -PNSB, 2010 Demographic Census (IBGE) 2006 Agricultural and Live Stock Census (IBGE)
� Use of the results of recent river basin plans (MDA, Verde Grande, Doce, Tocantins-Araguaia e Paranaíba) and Atlas Brazil: Urban Water Supply.

State Report
Thematic Division Brazilian WaterBrazilian Water
Resources ReportResources Report
Critical Analysis of Critical Analysis of
both water resources both water resources
overviews: status overviews: status
and managementand management
Water Water
resources resources
status status
overviewoverview
WaterWater
resources resources
managementmanagement
overviewoverview
Availabilities: water availability
and water quality
Uses: demands and multiple
uses
Water balance (uses x
availabilities)
Vulnerabilities: critical events
(flood and drought)
Institutional and legal
framework
Hydrometeorological
monitoring
Water resources planning
Water resources regulation
Inspection/supervising of
water resources uses
Charge/Charging for the
water resources use
Information system
National approach
Systematization by
Hydrographic Region and by
State
Informations that can support
the National Environmental
Accounts


Water Availability (m3/s)
Up to 0,008
0,008 to 1
1 to 10
10 to 100
100 to 500
>500
Superficial Water Availability
Brazil has 12% of World`s Total Water Availability
(18%, if the water contribution of neighbor
countries is summed up)
Overview of Water Resources
The aggregate value does not reflect the reality of Brazil. Knowledge on the superficial water spatial distribution ensures the identification of critical areas.
!

Reservoirs => water stock in rainy season to
guarantee water in dry period / flood control
/ hydroenergy / and others .
Storage capacity - Brasil = 3607 (m³/ habitant)
Artificial reservoirs
Water stock / storage capacity / reservation - artificial
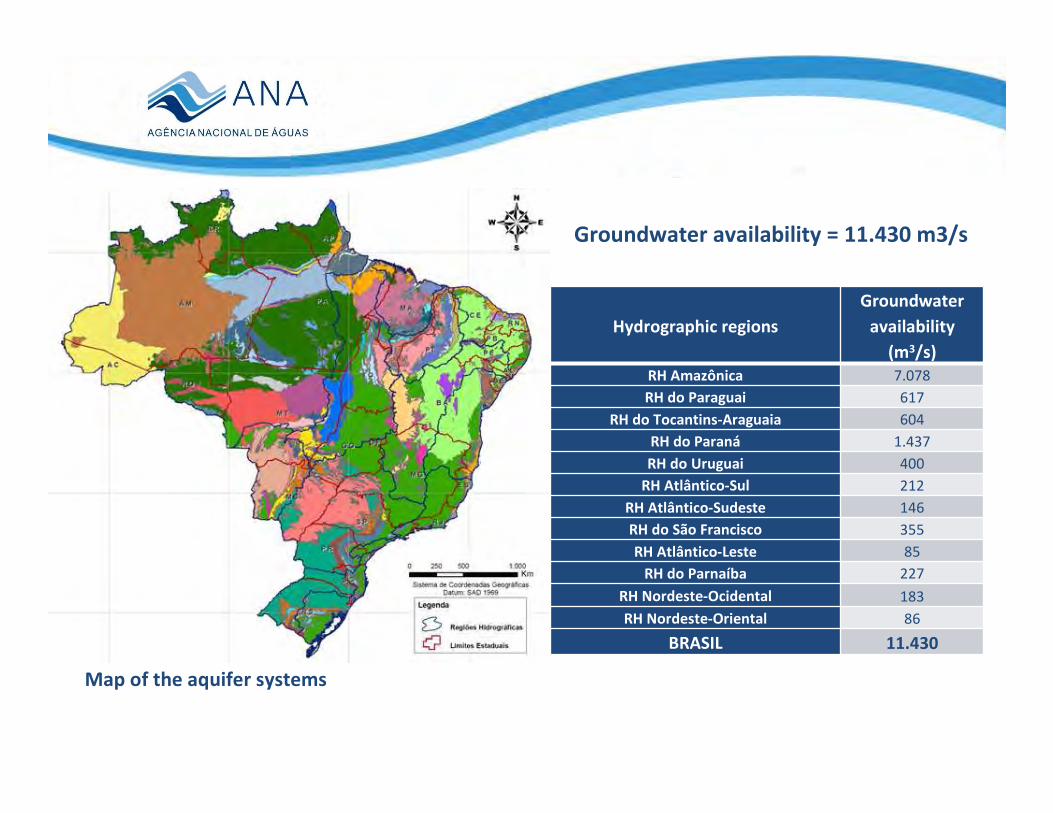
Hydrographic regions
Groundwater
availability
(m3/s)
RH Amazônica 7.078
RH do Paraguai 617
RH do Tocantins-Araguaia 604
RH do Paraná 1.437
RH do Uruguai 400
RH Atlântico-Sul 212
RH Atlântico-Sudeste 146
RH do São Francisco 355
RH Atlântico-Leste 85
RH do Parnaíba 227
RH Nordeste-Ocidental 183
RH Nordeste-Oriental 86
BRASIL 11.430
Map of the aquifer systems
Groundwater availability = 11.430 m3/s

Update of the Consumptive Demand
Brazil Total Water
Withdrawal = 2.373 m³/s
0,000 – 0,005
0,006 – 0,100
0,101 – 0,250
0,251 – 0,500
0,501 – 3,000
3,001 – 9,700
Hydrographic Region
Total Demand per Watershed (m3/s)
1
2
3
7 6
8
4
5
9
1. High Urban Demand – Manaus Metropolitan Region (MR)
2. High Demand for Irrigation – Formoso, Pium and Urubu Projects
3. High Demand for Irrigation – Paranaíba River Basin4. High Demand for Irrigation – Petrolina-Juazeiro
Center5. High Demand for Irrigation – West Bahia6. High Urban and Industrial Demand – Rio de Janeiro
MR7. High Urban and Industrial Demand – Sao Paulo MR8. High Demand for Irrigation of Rice Crops9. High Urban Demand – Porto Alegre MR
Overview of Water Resources

Irrigation
Irrigation area in Brazil – annual evolution (1970 to
2012)
Irrigation area = 4,5 millon hectares (2006) and 5,8
million hectares (2012)

WATER SUPPLY AND SANITATION: INVESTMENTS CONTRIBUTED TO THE IMPROVEMENT OF THESE NUMBERS.!
URBAN URBAN
WATER WATER
SUPPLYSUPPLY
SEWAGE SEWAGE
COLLECTIONCOLLECTION
89,76%
53,47%
90,88%
61,76%
2000
2010
2000
2010
Evolution of the Water Supply and Sanitation Sector in the Last DecadeOverview of Water Resources
Source: IBGE and ANA

Cities that present
significant increase in
sewage treatment
Load (tonDBO/day)
Metropolitan Regions that present high remaining domestic organic load, even with the increase in
sewage treatment:
São Paulo, Belo Horizonte, Rio de Janeiro, Brasília, Goiânia, Curitiba,
Londrina, Maringá
Places where the increase in sewage treatment did not reflect the increase in domestic sewage
production:
Metropolitan Regions of Manaus, Cuiabá, Macapá, Florianópolis, Belém e São Luís, and the following cities:
Palmas (TO), Porto Velho (RO) e Campo Grade (MT).
THE INVESTMENTS IN SEWAGE
TREATMENT SHOULD BE EQUIVALENT TO
CITY GROWTH.
Percentage of treated sewage
in comparison to total sewage
generated
2000 20,67 %
2008 29,94 %
Source: IBGE (PNSB 2000/2008 and 2007 Population Count)
!
Remaining Organic Load (2008) and Evolution of Sewage Treatment (2000-2008)Overview of Water Resources

Total points => 658
Tendency analisys - WQI
PONTOS MOSTRADOS NÃO SÃO NECESSARIAMENTE OS PIORES CASOS!
(2001-2011)
Monitoring and measurement points
Water Quality Index - WQI
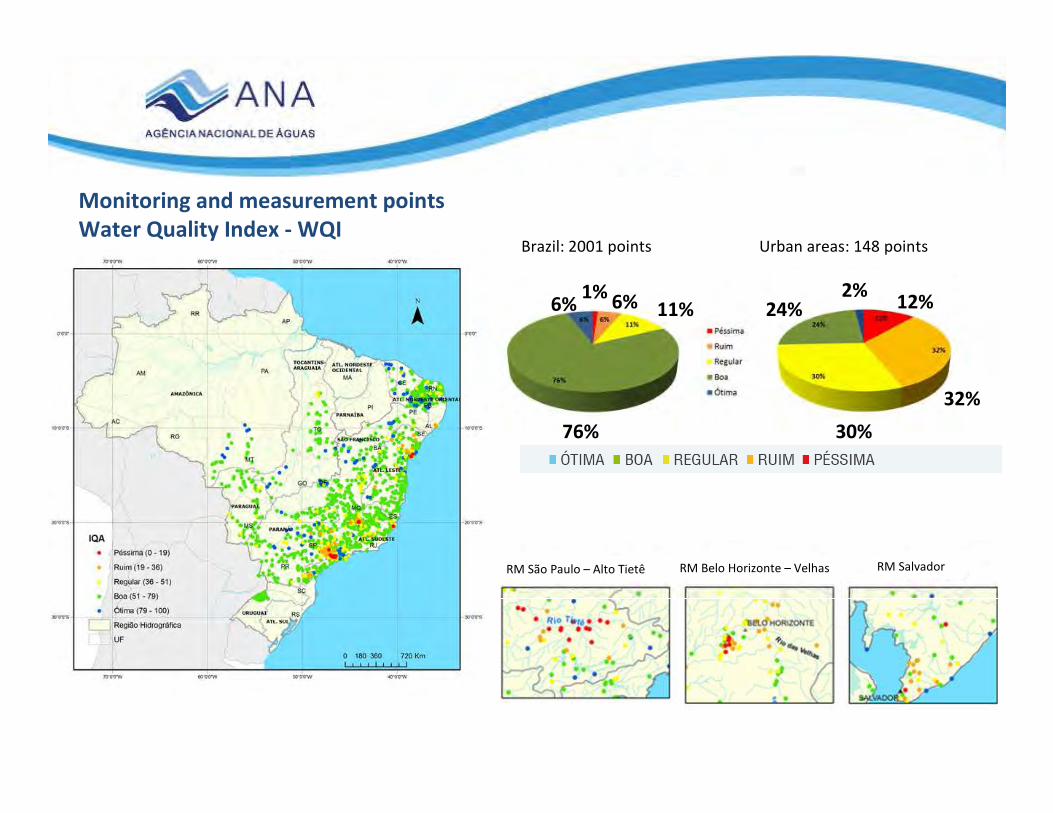
30%
11%
76%
32%
24% 12%
Urban areas: 148 pointsBrazil: 2001 points
1%6%6%
2%
RM São Paulo – Alto Tietê RM Belo Horizonte – Velhas RM Salvador
Monitoring and measurement points
Water Quality Index - WQI
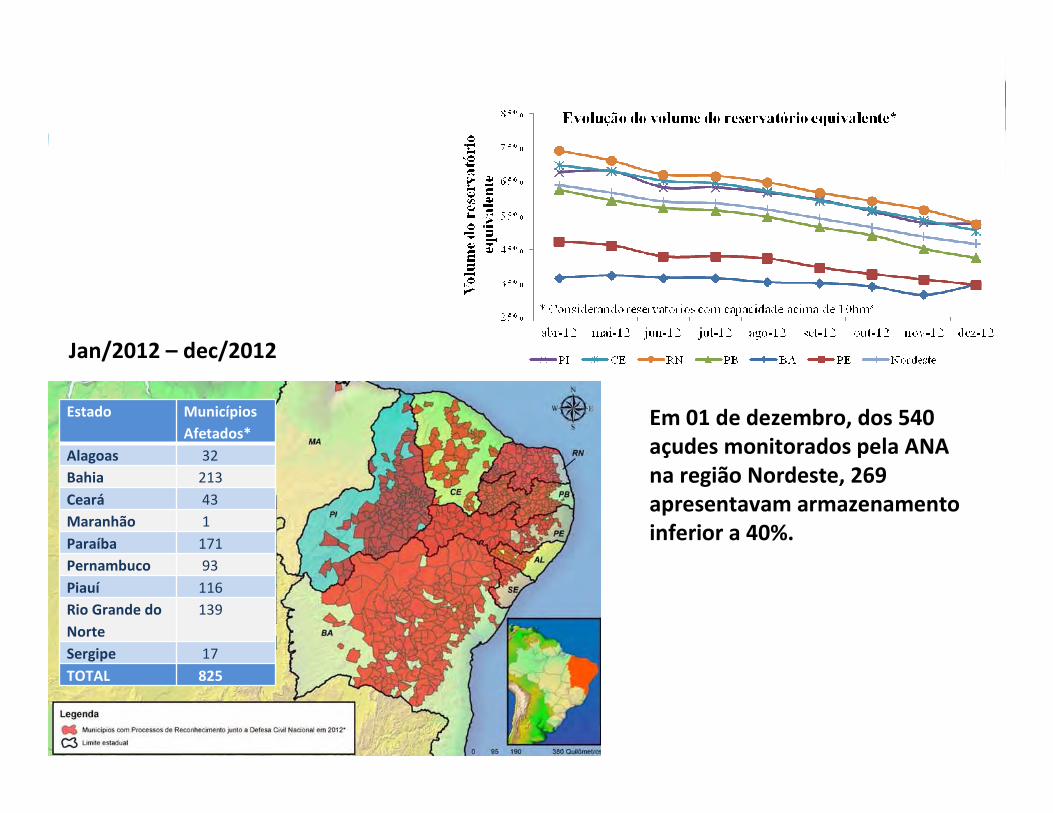
Jan/2012 – dec/2012
Em 01 de dezembro, dos 540
açudes monitorados pela ANA
na região Nordeste, 269
apresentavam armazenamento
inferior a 40%.
Estado Municípios
Afetados*
Alagoas 32
Bahia 213
Ceará 43
Maranhão 1
Paraíba 171
Pernambuco 93
Piauí 116
Rio Grande do
Norte
139
Sergipe 17
TOTAL 825


Water Resources Management History
Overview of Water Resources Management
State Water Resources
Management Policies
State Water Resources
Management Councils
Hydrographic Regions
State Water Resources Policies
Hydrographic Regions
State Water Resources Councils Created

Water Resources Management History
Overview of Water Resources Management
River Basin Committees
Total Number
174 State River Basin Committees
10 Interstate River Basin Committees
ADVANCES IN WATER RESOURCES MANAGEMENT AFTER THE CREATION OF THE WATER LAW AND THE ESTABLISHEMENT OF THE NATIONAL WATER AGENCY.!

Water Resources Plans
Overview of Water Resources Management
In Execution
Executed
To Be Hired
53% of the territory covered by
Interstate River Basin Plans (executed)
INCREASE OF THE KNOWLEDGE ABOUT WATER RESOURCES MANAGEMENT => SUPPORT TO DECISION MAKING AND IMPLEMENTATION OF ADDITIONAL WATER RESOURCES MANAGEMENT INSTRUMENTS => IWRM!
State Water Resources Regions that executed their
River Basin Plans (blue shades)
States that did not executed river basin plans or
that are currently executing their plans.
96 River Basin Plans Executed in
State Water Resources Regions

Critical basins x water resources management
Water resources manegement stage
Estágio da gestão


Background
�Interministerial ordinance nº 236/2012 – created the Committee for
Environment-Economic Accounting for Water (IBGE, ANA and SRHU/MMA)
� Goal – assess the National Environment-Economic Accounting for
Water
�Meetings between IBGE, ANA and SRHU/MMA (2012-2013)
� Analysis of the International Recommendations for Water Statistics
(IRWS)
� Identification of the institutional framework necessary to the
assessment of the National Environment-Economic Accounting for
Water
� Work plan and time series data: aprovement in August 2013
Implementation of SEEA-Water in Brazil
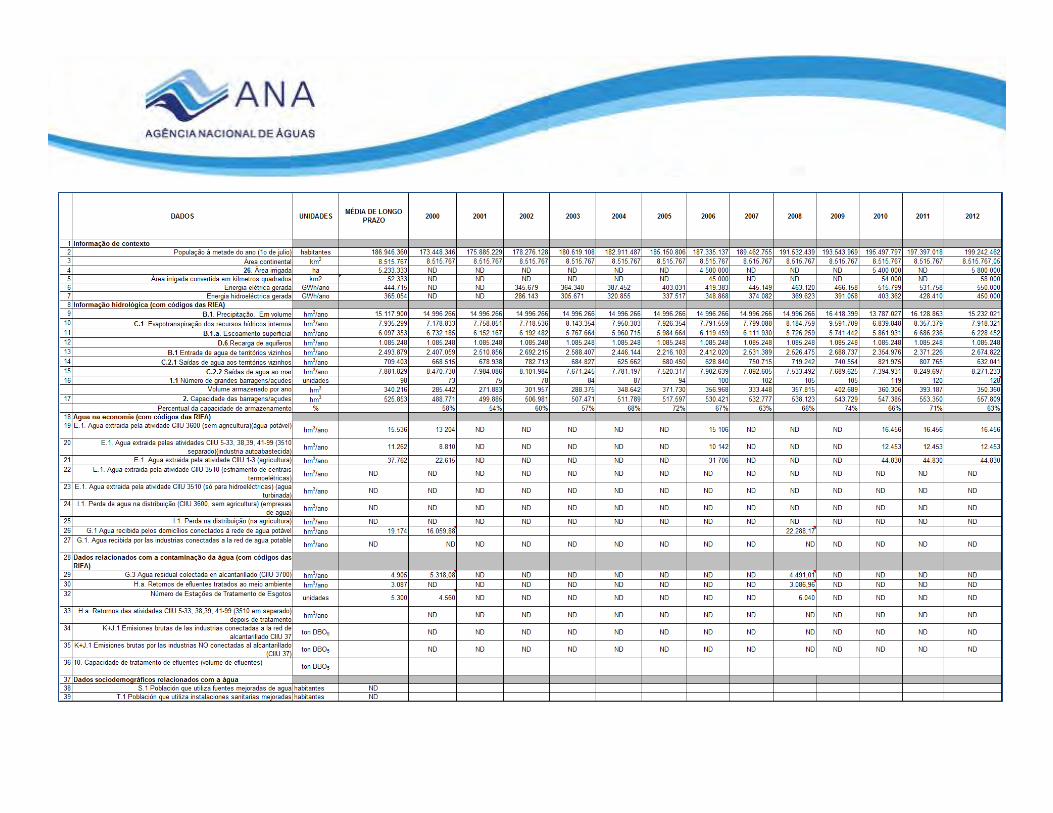

DATA ITEM UNITS 2012
Contextual Information
Mid-year population of the country (1st January) inhabitant 199.242.462
Continental surface area km2 8.515.767
26. Land area irrigated ha 5.800.00
Irrigated area converted to square Km² 58.000
Electric energy generated GWh/year 550.000
Hydroelectricity generated GWh/year 450.000
Hydrologic Information (with IRWS code)
B.1. Precipitation. In volume hm³/year 15.232.021
C.1. Evapotranspiration from inland water resources hm³/year 7.918.321
B.1.a. Surface runoff hm³/year 6.228.452
D.6.Aquifer recharge hm³/year 1.085.248
B.1 Inflow from neighbouring territories hm³/year 2.674.822
C.2.1 Outflow to neighbouring territories hm³/year 632.041
C.2.2. Outflow to the sea hm³/year 8.271.233
1.1 Number of large artificial reservoirs unidades 128
2. Artificial reservoir capacity hm3 557.809

DATA ITEM UNITS 2012
Water in the economy (with IRWS code)
E.1. Water abstracted by ISIC 36 (no agriculture) (drinking water) hm³/year 16.456
E.1. Water abstracted by ISIC 5-33, 38,39, 41-99 (3510 to be separated)(self supplied
industries)hm³/year 12.453
E.1. Water abstracted for ISIC 1-3 (agriculture) hm³/year 44.830
E.1. Water abstracted by ISIC 3510 (only cooling)hm³/year
ND
E.1. Water abstracted by ISIC 3510 (only hydropower)(turbinated water) hm³/year ND
I.1. Losses of water by utilities (ISIC 36 no agriculture) (water utilities) hm³/year ND
I.1. Losses of water in distribution (in agriculture) hm³/year ND
G.1 Water received by households connected to the water supply network hm³/year ND
G.1. Water received by industries connected to the water supply network hm³/year ND
Pollution related data items (with IRWS code)
G.3. Wastewater collected by sewerage (ISIC 37) hm³/year 4.491,01
H.a. Returns from sewerage after treatment hm³/year 3.086,96
15. Number of wastewater treatment plants unidades 6.040
H.a. Returns from ISIC 5-33, 38,39, 41-99 (3510 to be separated) after treatment hm³/year ND
K+J.1 Gross emissions by industries connected to ISIC 37 ton DBO5 ND
K+J.1 Gross emissions by industries NOT connected to ISIC 37 ton DBO5 ND
10. Wastewater treated by ISIC 37 (emissions collected) hm³/year ND

INDICADOR OU DADO INTERMEDIÁRIO DERIVADO UNIDADESMÉDIA DE
LONGO PRAZO
2000 2001 2002 2003 2004 2005 2006 2007 2008 2009 2010 2011 2012
Informação de contextoDensidade Populacional hab/km2 22 20 21 21 21 21 22 22 22 22 23 23 23 23
Hidroelectricidade como proporção da energía elétrica gerada % 82% #VALOR! #VALOR! 83% 84% 83% 84% 83% 84% 80% 84% 78% 81% 82%Electricidade gerada por habitante kWh/hab 2.379 #VALOR! #VALOR! 1.939 2.017 2.118 2.177 2.239 2.350 2.418 2.409 2.638 2.694 2.760
Informação hidrológicaPrecipitação (lâmina) mm/ano 1.775 1.761 1.761 1.761 1.761 1.761 1.761 1.761 1.761 1.761 1.928 1.619 1.894 1.789
Evapotranspiração como proporção da precipitação % 52% 48% 52% 51% 54% 53% 53% 52% 52% 55% 58% 50% 52% 52%Recursos Hídricos Internos Renovables hm3/ano 7.182.601 7.817.433 7.237.415 7.277.730 6.852.912 7.045.963 7.069.912 7.204.707 7.197.178 6.811.507 6.826.690 6.947.179 7.771.484 7.313.700
Recursos Hídricos Renováveis Totais (RHRT) hm3/ano 9.676.480 10.224.492 9.748.271 9.969.945 9.441.319 9.492.107 9.286.015 9.616.727 9.728.567 9.337.982 9.515.427 9.302.155 10.142.710 9.988.522Grau de dependência (Entrada de água de territórios vizinhos/RHRT) % 26% 24% 26% 27% 27% 26% 24% 25% 26% 27% 28% 25% 23% 27%
Recursos Hídricos Renováveis Totais por habitante m3/hab/ano 51.761 58.948 55.424 55.924 52.272 51.895 50.154 51.334 51.348 48.754 49.164 47.582 51.382 50.132Capacidade das barragens/açudes em relação ao escoamento superficial + entrada de água de
territorios vizinhos% 6% 5% 6% 6% 6% 6% 6% 6% 6% 7% 6% 7% 6% 6%
Capacidad de armazenamento por habitante m3/hab 2.813 2.818 2.842 2.844 2.810 2.798 2.796 2.831 2.812 2.810 2.809 2.800 2.803 2.800
INDICATOR OR INTERMEDIATE DERIVED DATA UNITSLONG TERM
AVERAGE
Contextual Information
Population density Inhab/km2 22
Hydroeletricity as proportion of energy gerenated % 82%
Eletricity generated per capita KWh/inhab 2.379
Hydrologic Information
Precipitation in height mm/year 1.775
Evapotranspiration as a proportion of precipitation % 52%
Internal Renewable Water Resources (IRWR) hm3/year 7.182.601
Total Renewable Water Resources (TRWR) hm3/year 9.676.480
Dependency ratio % 26%
Total Renewable Water Resources per capita m3/inhab/year 51.761
Artificial reservoir capacity as proportion of surface runof and inflows from neighbouring countries
% 6%
Artificial reservoir capacity per capita m3/inhab 2.813

Final Comments
� Brazil has been implementing the IWRM approach for more than 20 years
� The National Water Resources Management System was created in 1997
(institucional network approach)
� The National Water Resources Plan was aproved in 2006 and revised in 2010 by
National Water Council
� The first Brazilian Water Resources Report was edited in 2009 and has been
improving year by year. It will be a important support for the SEEA-Water
implementation process.
� The agreement signed by IBGE-SRHU/MMA-ANA in 2012 was an important step to the
Brazil SEEA-Water Project
� The UN DESA support (International Recommendations for Water Statistics, System of
Environmental-Economic Accounting for Water, courses, etc.) is fundamental for the
Brazil SEEA-Water Project sucess
www.youtube.com/anagovbrwww.twitter.com/anagovbr
Thank you!
Alexandre Teixeira
[email protected] | (+55) (61) 2109 –5365
www.ana.gov.br