Embed Size (px)
Citation preview
Breadboard of a Fourier-transform spectrometerfor the Radiation Explorer in the Far Infraredatmospheric mission
Luca Palchetti, Giovanni Bianchini, Francesco Castagnoli, Bruno Carli, Carmine Serio,Francesco Esposito, Vincenzo Cuomo, Rolando Rizzi, and Tiziano Maestri
In preparation for a possible space mission, a breadboard version named REFIR-BB of the RadiationExplorer in the Far Infrared (REFIR) instrument has been built. The REFIR is a Fourier-transformspectrometer with a new optical layout operating in the spectral range 100–1100 cm�1 with a resolutionof 0.5 cm�1, a 7-s acquisition time, and a signal-to-noise ratio of better than 100. Its mission is the spectralmeasurement in the far infrared of the Earth’s outgoing emission, with particular attention to thelong-wavelength spectral region, which is not covered by either current or planned space missions. Thismeasurement is of great importance for deriving an accurate estimate of the radiation budget in bothclear and cloudy conditions. The REFIR-BB permits the trade-off among all instrument parameters to bestudied, the optical layout to be tested, and the data-acquisition strategy to be optimized. The breadboardcould be used for high-altitude ground-based campaigns or could be flown for test flights on aircraft orballoon stratospheric platforms. The breadboard’s design and the experimental results are described,with particular attention to the acquisition strategy and characterization of the interferometer. Testswere performed both in laboratory conditions and in vacuum. Notwithstanding a loss of efficiencyabove 700 cm�1 caused by the poor performance of the photolithographic polarizers used as beamsplitters, the results demonstrate the feasibility of using the spectrometer for space applications. © 2005Optical Society of America
OCIS codes: 300.6300, 300.6270, 120.3180, 010.0010.
1. Introduction
One of the major objectives of Earth science for thecoming decades is the development of complete andaccurate long-term data sets for studying globalchange. The Earth’s radiation budget is an importantissue that is being studied with a large variety ofinstruments and projects. Of these, the Radiation Ex-plorer in the Far Infrared (REFIR) project, which was
funded by the European Union (EU) in 1998–2000,addresses the need to measure the spectral radiancein the 100–1100�cm�1 range, the far-infrared (FIR)portion of the planetary emission to space that is notfully covered by any current or planned space mis-sion. The availability of these measurements wouldimprove our knowledge of the distribution of mid- andupper-tropospheric water vapor through its strongspectral signature in the FIR1–4 and in mid- andupper-tropospheric clouds, such as cirrus.5–7 Thesetwo components to a large extent modulate FIR emis-sion into space.
The REFIR scientific requirements were outlinedpreviously8,9 and were discussed in depth in the finalreport to the EU granting agency.10 They have led tospecification of a package of four instruments:
Y The primary instrument of the REFIR is aFourier-transform spectrometer (FTS) that is capableof resolving the upwelling radiation from the Earthwith a spectral resolution of 0.5 cm�1, a 7-s acquisi-tion time, and signal-to-noise ratio of �100 in broad-band operation �100–1100 cm�1�.
L. Palchetti ([email protected]), G. Bianchini, F. Castagnoli,and B. Carli are with the Istituto di Fisica Applicata “Nello Carrara,”Consiglio Nazionale delle Ricerche, Via Panciatichi 64, 50127 Flo-rence, Italy. C. Serio and F. Esposito are with the Dipartimento diIngegneria e Fisica dell’Ambiente, Università della Basilicata,Contrada Macchia Romana, 85100 Potenza, Italy. V. Cuomo iswith the Istituto di Metodologie per l’Analisi Ambientale, ConsiglioNazionale delle Ricerche, Contrada S. Loja, 85050 Tito Scalo, Po-tenza, Italy. R. Rizzi and T. Maestri are with the AtmosphericDynamics Group Bologna, Dipartimento di Fisica, Università diBologna, Viale Berti Pichat 6�2, 40127 Bologna, Italy.
Received 14 June 2004; accepted 19 November 2004.0003-6935/05/142870-09$15.00/0© 2005 Optical Society of America
2870 APPLIED OPTICS � Vol. 44, No. 14 � 10 May 2005
Y An embedded snapshot single-channel imager,which operates in the thermal IR atmospheric win-dow, provides square images that share the sameboresight as the FTS for scene–cloud identification.
Y A multiband push-broom imager provides si-multaneous multichannel imagery for characteriza-tion of clouds and has a ground swath that issomewhat larger than the FTS’s footprint.
Y An absolute broadband radiometer measurestotal radiation within the FTS footprint.
The FTS is a polarizing interferometer with a newoptical layout11,12 that attains high efficiency in theoperating spectral range by measuring both planes ofpolarization of the input source. In preparation for afuture space mission, a prototype of the FTS, knownas the REFIR breadboard (REFIR-BB), was devel-oped in house with the financial support of the ItalianSpace Agency. The breadboard was designed for usein studying the trade-off among all instrument pa-rameters, to test the novel optical layout, and to op-timize the data-acquisition strategy. In perspective,this prototype could be used for applications on boardstratospheric platforms, such as aircraft and bal-loons, and could be operated in synergy with otherfield FTS instruments.13–15
In this paper the preliminary results obtained inlaboratory conditions with the REFIR-BB are given.In Section 2 we describe the instrument breadboard,with particular attention to the design and develop-ment of the optomechanical and electronic systems.In Section 3 some laboratory tests and the achievedperformance are reviewed. Lastly, in Section 4 anexample of measurement of air transmittance per-formed in laboratory conditions is reported.
2. Design and Development of the Fourier-TransformSpectrometer Breadboard
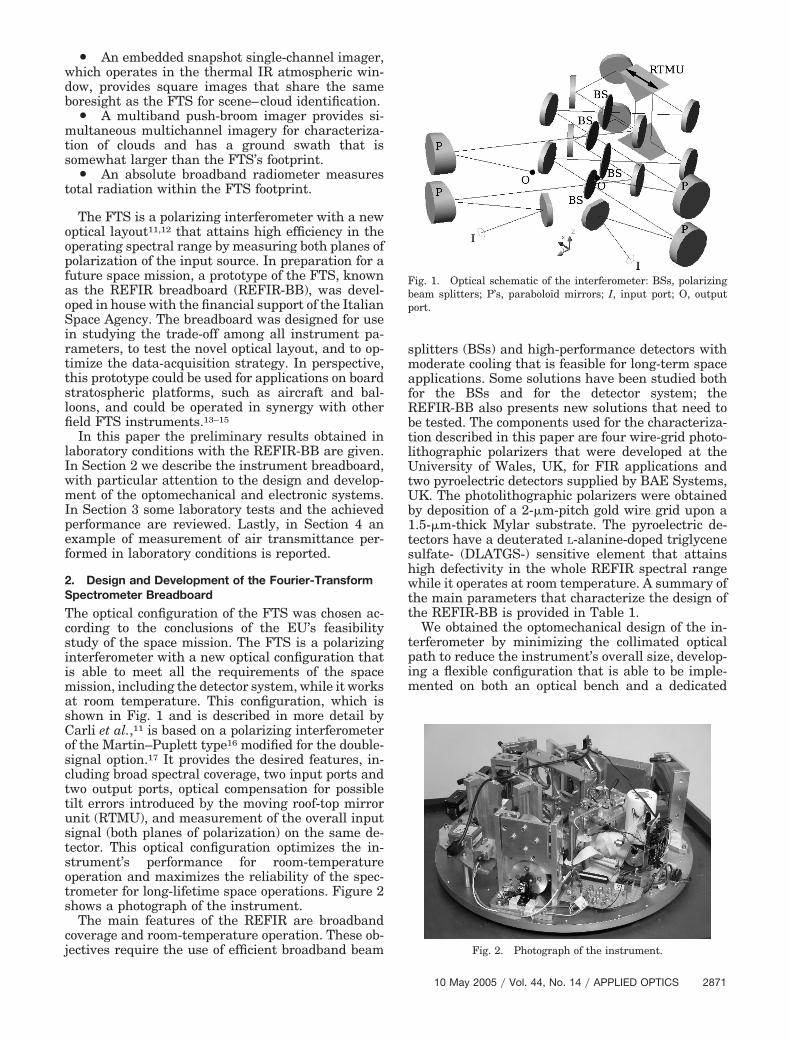
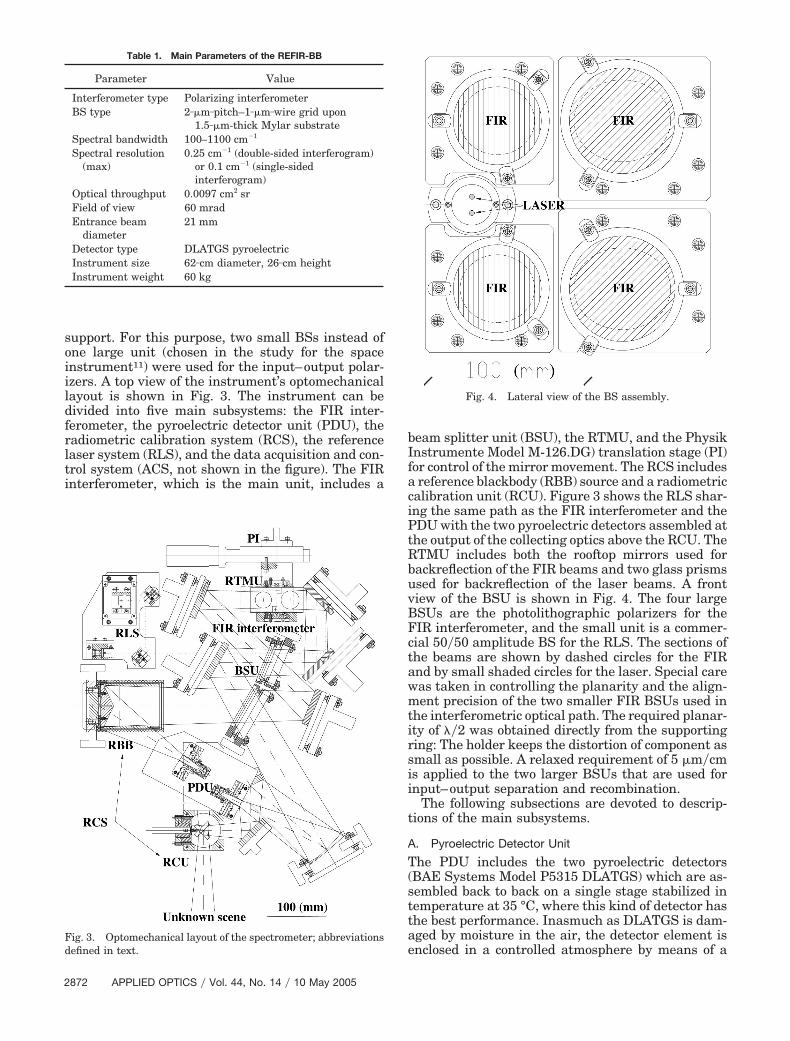
The optical configuration of the FTS was chosen ac-cording to the conclusions of the EU’s feasibilitystudy of the space mission. The FTS is a polarizinginterferometer with a new optical configuration thatis able to meet all the requirements of the spacemission, including the detector system, while it worksat room temperature. This configuration, which isshown in Fig. 1 and is described in more detail byCarli et al.,11 is based on a polarizing interferometerof the Martin–Puplett type16 modified for the double-signal option.17 It provides the desired features, in-cluding broad spectral coverage, two input ports andtwo output ports, optical compensation for possibletilt errors introduced by the moving roof-top mirrorunit (RTMU), and measurement of the overall inputsignal (both planes of polarization) on the same de-tector. This optical configuration optimizes the in-strument’s performance for room-temperatureoperation and maximizes the reliability of the spec-trometer for long-lifetime space operations. Figure 2shows a photograph of the instrument.
The main features of the REFIR are broadbandcoverage and room-temperature operation. These ob-jectives require the use of efficient broadband beam
splitters (BSs) and high-performance detectors withmoderate cooling that is feasible for long-term spaceapplications. Some solutions have been studied bothfor the BSs and for the detector system; theREFIR-BB also presents new solutions that need tobe tested. The components used for the characteriza-tion described in this paper are four wire-grid photo-lithographic polarizers that were developed at theUniversity of Wales, UK, for FIR applications andtwo pyroelectric detectors supplied by BAE Systems,UK. The photolithographic polarizers were obtainedby deposition of a 2-�m-pitch gold wire grid upon a1.5-�m-thick Mylar substrate. The pyroelectric de-tectors have a deuterated L-alanine-doped triglycenesulfate- (DLATGS-) sensitive element that attainshigh defectivity in the whole REFIR spectral rangewhile it operates at room temperature. A summary ofthe main parameters that characterize the design ofthe REFIR-BB is provided in Table 1.
We obtained the optomechanical design of the in-terferometer by minimizing the collimated opticalpath to reduce the instrument’s overall size, develop-ing a flexible configuration that is able to be imple-mented on both an optical bench and a dedicated
Fig. 1. Optical schematic of the interferometer: BSs, polarizingbeam splitters; P’s, paraboloid mirrors; I, input port; O, outputport.
Fig. 2. Photograph of the instrument.
10 May 2005 � Vol. 44, No. 14 � APPLIED OPTICS 2871
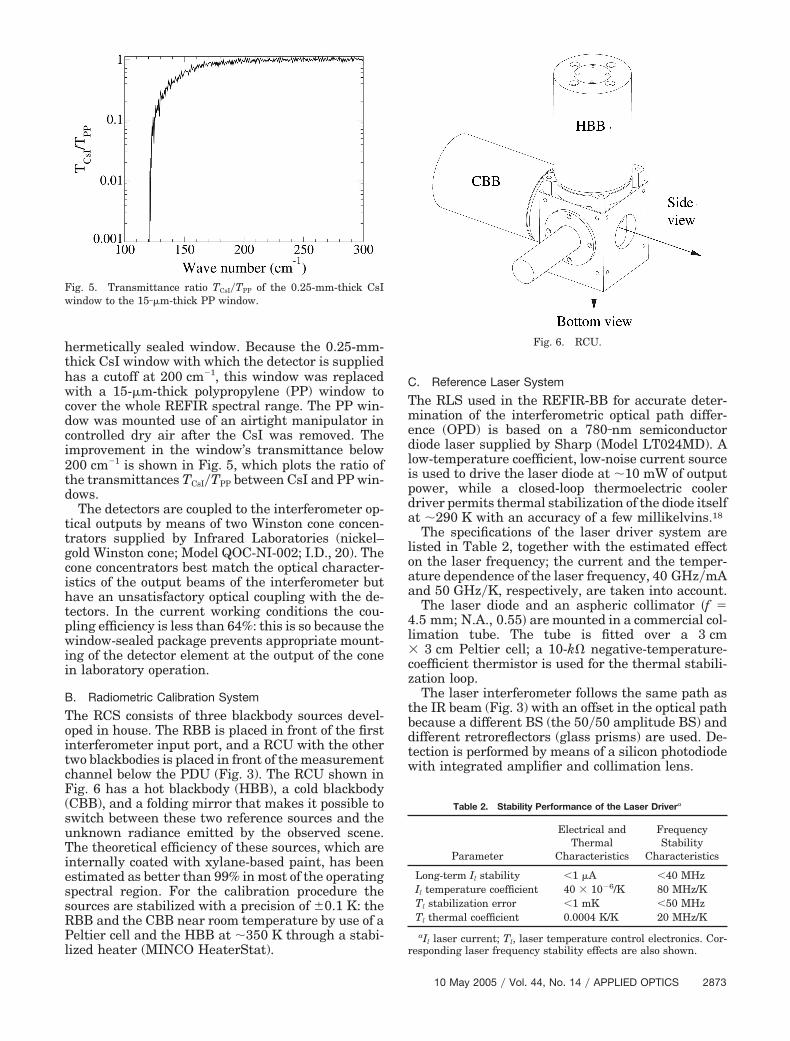
support. For this purpose, two small BSs instead ofone large unit (chosen in the study for the spaceinstrument11) were used for the input–output polar-izers. A top view of the instrument’s optomechanicallayout is shown in Fig. 3. The instrument can bedivided into five main subsystems: the FIR inter-ferometer, the pyroelectric detector unit (PDU), theradiometric calibration system (RCS), the referencelaser system (RLS), and the data acquisition and con-trol system (ACS, not shown in the figure). The FIRinterferometer, which is the main unit, includes a
beam splitter unit (BSU), the RTMU, and the PhysikInstrumente Model M-126.DG) translation stage (PI)for control of the mirror movement. The RCS includesa reference blackbody (RBB) source and a radiometriccalibration unit (RCU). Figure 3 shows the RLS shar-ing the same path as the FIR interferometer and thePDU with the two pyroelectric detectors assembled atthe output of the collecting optics above the RCU. TheRTMU includes both the rooftop mirrors used forbackreflection of the FIR beams and two glass prismsused for backreflection of the laser beams. A frontview of the BSU is shown in Fig. 4. The four largeBSUs are the photolithographic polarizers for theFIR interferometer, and the small unit is a commer-cial 50�50 amplitude BS for the RLS. The sections ofthe beams are shown by dashed circles for the FIRand by small shaded circles for the laser. Special carewas taken in controlling the planarity and the align-ment precision of the two smaller FIR BSUs used inthe interferometric optical path. The required planar-ity of ��2 was obtained directly from the supportingring: The holder keeps the distortion of component assmall as possible. A relaxed requirement of 5 �m�cmis applied to the two larger BSUs that are used forinput–output separation and recombination.
The following subsections are devoted to descrip-tions of the main subsystems.
A. Pyroelectric Detector Unit
The PDU includes the two pyroelectric detectors(BAE Systems Model P5315 DLATGS) which are as-sembled back to back on a single stage stabilized intemperature at 35 °C, where this kind of detector hasthe best performance. Inasmuch as DLATGS is dam-aged by moisture in the air, the detector element isenclosed in a controlled atmosphere by means of a
Table 1. Main Parameters of the REFIR-BB
Parameter Value
Interferometer type Polarizing interferometerBS type 2��m�pitch–1��m�wire grid upon
1.5��m-thick Mylar substrateSpectral bandwidth 100–1100 cm�1
Spectral resolution(max)
0.25 cm�1 (double-sided interferogram)or 0.1 cm�1 (single-sidedinterferogram)
Optical throughput 0.0097 cm2 srField of view 60 mradEntrance beam
diameter21 mm
Detector type DLATGS pyroelectricInstrument size 62�cm diameter, 26�cm heightInstrument weight 60 kg
Fig. 3. Optomechanical layout of the spectrometer; abbreviationsdefined in text.
Fig. 4. Lateral view of the BS assembly.
2872 APPLIED OPTICS � Vol. 44, No. 14 � 10 May 2005
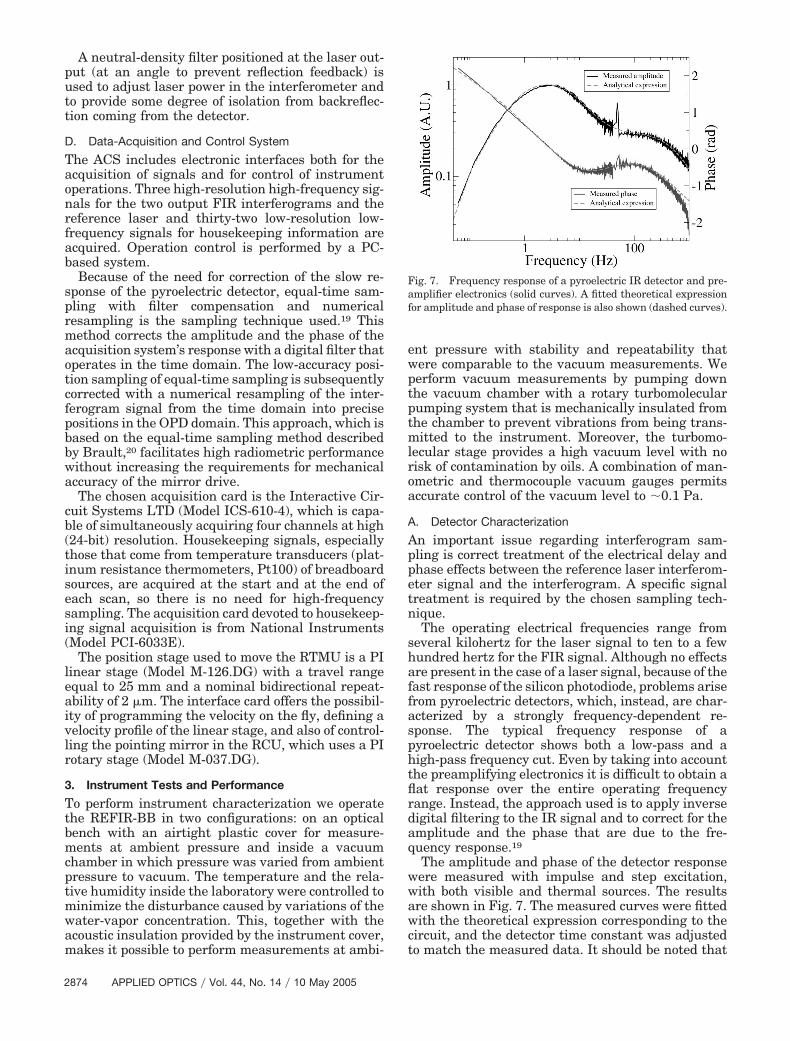
hermetically sealed window. Because the 0.25-mm-thick CsI window with which the detector is suppliedhas a cutoff at 200 cm�1, this window was replacedwith a 15-�m-thick polypropylene (PP) window tocover the whole REFIR spectral range. The PP win-dow was mounted use of an airtight manipulator incontrolled dry air after the CsI was removed. Theimprovement in the window’s transmittance below200 cm�1 is shown in Fig. 5, which plots the ratio ofthe transmittances TCsI�TPP between CsI and PP win-dows.
The detectors are coupled to the interferometer op-tical outputs by means of two Winston cone concen-trators supplied by Infrared Laboratories (nickel–gold Winston cone; Model QOC-NI-002; I.D., 20). Thecone concentrators best match the optical character-istics of the output beams of the interferometer buthave an unsatisfactory optical coupling with the de-tectors. In the current working conditions the cou-pling efficiency is less than 64%: this is so because thewindow-sealed package prevents appropriate mount-ing of the detector element at the output of the conein laboratory operation.
B. Radiometric Calibration System
The RCS consists of three blackbody sources devel-oped in house. The RBB is placed in front of the firstinterferometer input port, and a RCU with the othertwo blackbodies is placed in front of the measurementchannel below the PDU (Fig. 3). The RCU shown inFig. 6 has a hot blackbody (HBB), a cold blackbody(CBB), and a folding mirror that makes it possible toswitch between these two reference sources and theunknown radiance emitted by the observed scene.The theoretical efficiency of these sources, which areinternally coated with xylane-based paint, has beenestimated as better than 99% in most of the operatingspectral region. For the calibration procedure thesources are stabilized with a precision of �0.1 K: theRBB and the CBB near room temperature by use of aPeltier cell and the HBB at �350 K through a stabi-lized heater (MINCO HeaterStat).
C. Reference Laser System
The RLS used in the REFIR-BB for accurate deter-mination of the interferometric optical path differ-ence (OPD) is based on a 780�nm semiconductordiode laser supplied by Sharp (Model LT024MD). Alow-temperature coefficient, low-noise current sourceis used to drive the laser diode at �10 mW of outputpower, while a closed-loop thermoelectric coolerdriver permits thermal stabilization of the diode itselfat �290 K with an accuracy of a few millikelvins.18
The specifications of the laser driver system arelisted in Table 2, together with the estimated effecton the laser frequency; the current and the temper-ature dependence of the laser frequency, 40 GHz�mAand 50 GHz�K, respectively, are taken into account.
The laser diode and an aspheric collimator �f �4.5 mm; N.A., 0.55� are mounted in a commercial col-limation tube. The tube is fitted over a 3 cm� 3 cm Peltier cell; a 10-k negative-temperature-coefficient thermistor is used for the thermal stabili-zation loop.
The laser interferometer follows the same path asthe IR beam (Fig. 3) with an offset in the optical pathbecause a different BS (the 50�50 amplitude BS) anddifferent retroreflectors (glass prisms) are used. De-tection is performed by means of a silicon photodiodewith integrated amplifier and collimation lens.
Fig. 5. Transmittance ratio TCsI�TPP of the 0.25-mm-thick CsIwindow to the 15��m-thick PP window.
Fig. 6. RCU.
Table 2. Stability Performance of the Laser Drivera
Parameter
Electrical andThermal
Characteristics
FrequencyStability
Characteristics
Long-term Il stability �1 �A �40 MHzIl temperature coefficient 40 � 10�6/K 80 MHz/KTl stabilization error �1 mK �50 MHzTl thermal coefficient 0.0004 K/K 20 MHz/K
aIl laser current; Tl, laser temperature control electronics. Cor-responding laser frequency stability effects are also shown.
10 May 2005 � Vol. 44, No. 14 � APPLIED OPTICS 2873
A neutral-density filter positioned at the laser out-put (at an angle to prevent reflection feedback) isused to adjust laser power in the interferometer andto provide some degree of isolation from backreflec-tion coming from the detector.
D. Data-Acquisition and Control System
The ACS includes electronic interfaces both for theacquisition of signals and for control of instrumentoperations. Three high-resolution high-frequency sig-nals for the two output FIR interferograms and thereference laser and thirty-two low-resolution low-frequency signals for housekeeping information areacquired. Operation control is performed by a PC-based system.
Because of the need for correction of the slow re-sponse of the pyroelectric detector, equal-time sam-pling with filter compensation and numericalresampling is the sampling technique used.19 Thismethod corrects the amplitude and the phase of theacquisition system’s response with a digital filter thatoperates in the time domain. The low-accuracy posi-tion sampling of equal-time sampling is subsequentlycorrected with a numerical resampling of the inter-ferogram signal from the time domain into precisepositions in the OPD domain. This approach, which isbased on the equal-time sampling method describedby Brault,20 facilitates high radiometric performancewithout increasing the requirements for mechanicalaccuracy of the mirror drive.
The chosen acquisition card is the Interactive Cir-cuit Systems LTD (Model ICS-610-4), which is capa-ble of simultaneously acquiring four channels at high(24-bit) resolution. Housekeeping signals, especiallythose that come from temperature transducers (plat-inum resistance thermometers, Pt100) of breadboardsources, are acquired at the start and at the end ofeach scan, so there is no need for high-frequencysampling. The acquisition card devoted to housekeep-ing signal acquisition is from National Instruments(Model PCI-6033E).
The position stage used to move the RTMU is a PIlinear stage (Model M-126.DG) with a travel rangeequal to 25 mm and a nominal bidirectional repeat-ability of 2 �m. The interface card offers the possibil-ity of programming the velocity on the fly, defining avelocity profile of the linear stage, and also of control-ling the pointing mirror in the RCU, which uses a PIrotary stage (Model M-037.DG).
3. Instrument Tests and Performance
To perform instrument characterization we operatethe REFIR-BB in two configurations: on an opticalbench with an airtight plastic cover for measure-ments at ambient pressure and inside a vacuumchamber in which pressure was varied from ambientpressure to vacuum. The temperature and the rela-tive humidity inside the laboratory were controlled tominimize the disturbance caused by variations of thewater-vapor concentration. This, together with theacoustic insulation provided by the instrument cover,makes it possible to perform measurements at ambi-
ent pressure with stability and repeatability thatwere comparable to the vacuum measurements. Weperform vacuum measurements by pumping downthe vacuum chamber with a rotary turbomolecularpumping system that is mechanically insulated fromthe chamber to prevent vibrations from being trans-mitted to the instrument. Moreover, the turbomo-lecular stage provides a high vacuum level with norisk of contamination by oils. A combination of man-ometric and thermocouple vacuum gauges permitsaccurate control of the vacuum level to �0.1 Pa.
A. Detector Characterization
An important issue regarding interferogram sam-pling is correct treatment of the electrical delay andphase effects between the reference laser interferom-eter signal and the interferogram. A specific signaltreatment is required by the chosen sampling tech-nique.
The operating electrical frequencies range fromseveral kilohertz for the laser signal to ten to a fewhundred hertz for the FIR signal. Although no effectsare present in the case of a laser signal, because of thefast response of the silicon photodiode, problems arisefrom pyroelectric detectors, which, instead, are char-acterized by a strongly frequency-dependent re-sponse. The typical frequency response of apyroelectric detector shows both a low-pass and ahigh-pass frequency cut. Even by taking into accountthe preamplifying electronics it is difficult to obtain aflat response over the entire operating frequencyrange. Instead, the approach used is to apply inversedigital filtering to the IR signal and to correct for theamplitude and the phase that are due to the fre-quency response.19
The amplitude and phase of the detector responsewere measured with impulse and step excitation,with both visible and thermal sources. The resultsare shown in Fig. 7. The measured curves were fittedwith the theoretical expression corresponding to thecircuit, and the detector time constant was adjustedto match the measured data. It should be noted that
Fig. 7. Frequency response of a pyroelectric IR detector and pre-amplifier electronics (solid curves). A fitted theoretical expressionfor amplitude and phase of response is also shown (dashed curves).
2874 APPLIED OPTICS � Vol. 44, No. 14 � 10 May 2005
this kind of measurement must be performed for eachdetector if maximum accuracy is to be obtained, assome degree of sample variability is present amongdetectors.
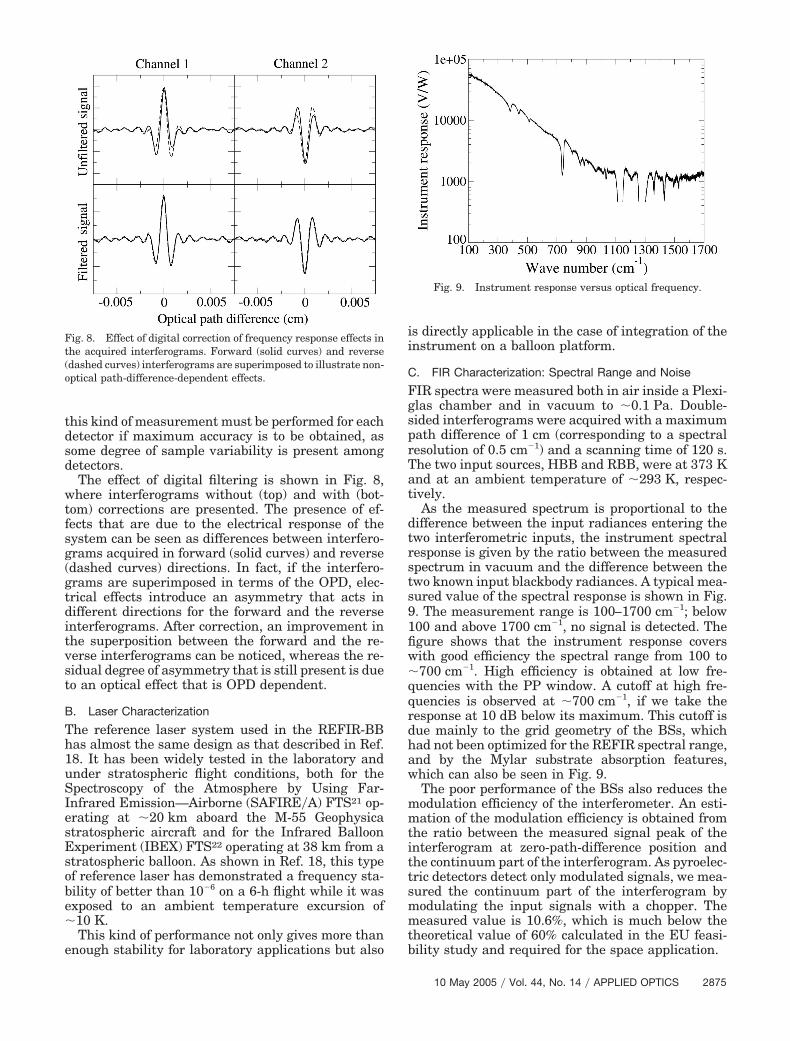
The effect of digital filtering is shown in Fig. 8,where interferograms without (top) and with (bot-tom) corrections are presented. The presence of ef-fects that are due to the electrical response of thesystem can be seen as differences between interfero-grams acquired in forward (solid curves) and reverse(dashed curves) directions. In fact, if the interfero-grams are superimposed in terms of the OPD, elec-trical effects introduce an asymmetry that acts indifferent directions for the forward and the reverseinterferograms. After correction, an improvement inthe superposition between the forward and the re-verse interferograms can be noticed, whereas the re-sidual degree of asymmetry that is still present is dueto an optical effect that is OPD dependent.
B. Laser Characterization
The reference laser system used in the REFIR-BBhas almost the same design as that described in Ref.18. It has been widely tested in the laboratory andunder stratospheric flight conditions, both for theSpectroscopy of the Atmosphere by Using Far-Infrared Emission—Airborne (SAFIRE�A) FTS21 op-erating at �20 km aboard the M-55 Geophysicastratospheric aircraft and for the Infrared BalloonExperiment (IBEX) FTS22 operating at 38 km from astratospheric balloon. As shown in Ref. 18, this typeof reference laser has demonstrated a frequency sta-bility of better than 10�6 on a 6-h flight while it wasexposed to an ambient temperature excursion of�10 K.
This kind of performance not only gives more thanenough stability for laboratory applications but also
is directly applicable in the case of integration of theinstrument on a balloon platform.
C. FIR Characterization: Spectral Range and Noise
FIR spectra were measured both in air inside a Plexi-glas chamber and in vacuum to �0.1 Pa. Double-sided interferograms were acquired with a maximumpath difference of 1 cm (corresponding to a spectralresolution of 0.5 cm�1) and a scanning time of 120 s.The two input sources, HBB and RBB, were at 373 Kand at an ambient temperature of �293 K, respec-tively.
As the measured spectrum is proportional to thedifference between the input radiances entering thetwo interferometric inputs, the instrument spectralresponse is given by the ratio between the measuredspectrum in vacuum and the difference between thetwo known input blackbody radiances. A typical mea-sured value of the spectral response is shown in Fig.9. The measurement range is 100–1700 cm�1; below100 and above 1700 cm�1, no signal is detected. Thefigure shows that the instrument response coverswith good efficiency the spectral range from 100 to�700 cm�1. High efficiency is obtained at low fre-quencies with the PP window. A cutoff at high fre-quencies is observed at �700 cm�1, if we take theresponse at 10 dB below its maximum. This cutoff isdue mainly to the grid geometry of the BSs, whichhad not been optimized for the REFIR spectral range,and by the Mylar substrate absorption features,which can also be seen in Fig. 9.
The poor performance of the BSs also reduces themodulation efficiency of the interferometer. An esti-mation of the modulation efficiency is obtained fromthe ratio between the measured signal peak of theinterferogram at zero-path-difference position andthe continuum part of the interferogram. As pyroelec-tric detectors detect only modulated signals, we mea-sured the continuum part of the interferogram bymodulating the input signals with a chopper. Themeasured value is 10.6%, which is much below thetheoretical value of 60% calculated in the EU feasi-bility study and required for the space application.
Fig. 8. Effect of digital correction of frequency response effects inthe acquired interferograms. Forward (solid curves) and reverse(dashed curves) interferograms are superimposed to illustrate non-optical path-difference-dependent effects.
Fig. 9. Instrument response versus optical frequency.
10 May 2005 � Vol. 44, No. 14 � APPLIED OPTICS 2875
These findings have justified the study of new pho-tolithographic BSs to cover the required spectralbandwidth with better efficiency.
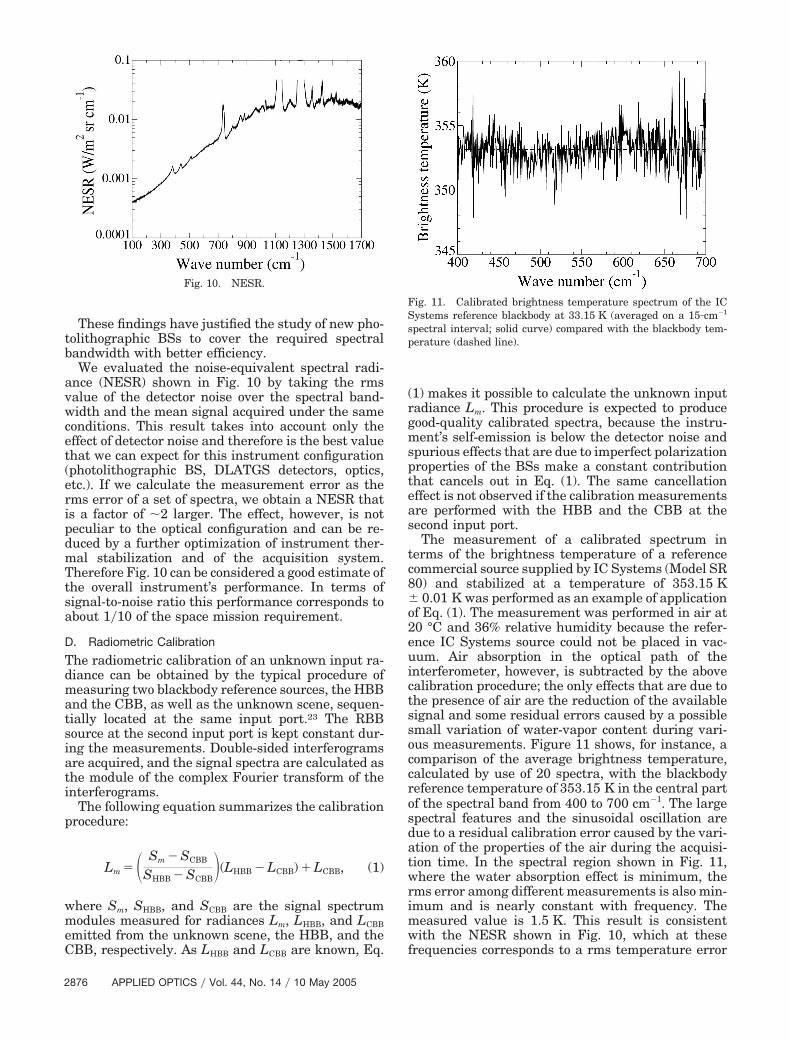
We evaluated the noise-equivalent spectral radi-ance (NESR) shown in Fig. 10 by taking the rmsvalue of the detector noise over the spectral band-width and the mean signal acquired under the sameconditions. This result takes into account only theeffect of detector noise and therefore is the best valuethat we can expect for this instrument configuration(photolithographic BS, DLATGS detectors, optics,etc.). If we calculate the measurement error as therms error of a set of spectra, we obtain a NESR thatis a factor of �2 larger. The effect, however, is notpeculiar to the optical configuration and can be re-duced by a further optimization of instrument ther-mal stabilization and of the acquisition system.Therefore Fig. 10 can be considered a good estimate ofthe overall instrument’s performance. In terms ofsignal-to-noise ratio this performance corresponds toabout 1�10 of the space mission requirement.
D. Radiometric Calibration
The radiometric calibration of an unknown input ra-diance can be obtained by the typical procedure ofmeasuring two blackbody reference sources, the HBBand the CBB, as well as the unknown scene, sequen-tially located at the same input port.23 The RBBsource at the second input port is kept constant dur-ing the measurements. Double-sided interferogramsare acquired, and the signal spectra are calculated asthe module of the complex Fourier transform of theinterferograms.
The following equation summarizes the calibrationprocedure:
Lm � � Sm � SCBB
SHBB � SCBB�(LHBB � LCBB) LCBB, (1)
where Sm, SHBB, and SCBB are the signal spectrummodules measured for radiances Lm, LHBB, and LCBBemitted from the unknown scene, the HBB, and theCBB, respectively. As LHBB and LCBB are known, Eq.
(1) makes it possible to calculate the unknown inputradiance Lm. This procedure is expected to producegood-quality calibrated spectra, because the instru-ment’s self-emission is below the detector noise andspurious effects that are due to imperfect polarizationproperties of the BSs make a constant contributionthat cancels out in Eq. (1). The same cancellationeffect is not observed if the calibration measurementsare performed with the HBB and the CBB at thesecond input port.
The measurement of a calibrated spectrum interms of the brightness temperature of a referencecommercial source supplied by IC Systems (Model SR80) and stabilized at a temperature of 353.15 K� 0.01 K was performed as an example of applicationof Eq. (1). The measurement was performed in air at20 °C and 36% relative humidity because the refer-ence IC Systems source could not be placed in vac-uum. Air absorption in the optical path of theinterferometer, however, is subtracted by the abovecalibration procedure; the only effects that are due tothe presence of air are the reduction of the availablesignal and some residual errors caused by a possiblesmall variation of water-vapor content during vari-ous measurements. Figure 11 shows, for instance, acomparison of the average brightness temperature,calculated by use of 20 spectra, with the blackbodyreference temperature of 353.15 K in the central partof the spectral band from 400 to 700 cm�1. The largespectral features and the sinusoidal oscillation aredue to a residual calibration error caused by the vari-ation of the properties of the air during the acquisi-tion time. In the spectral region shown in Fig. 11,where the water absorption effect is minimum, therms error among different measurements is also min-imum and is nearly constant with frequency. Themeasured value is 1.5 K. This result is consistentwith the NESR shown in Fig. 10, which at thesefrequencies corresponds to a rms temperature error
Fig. 10. NESR.
Fig. 11. Calibrated brightness temperature spectrum of the ICSystems reference blackbody at 33.15 K (averaged on a 15�cm�1
spectral interval; solid curve) compared with the blackbody tem-perature (dashed line).
2876 APPLIED OPTICS � Vol. 44, No. 14 � 10 May 2005
that is nearly constant and equals 1.5 K. We calcu-lated the absolute calibration error by taking themean values over the 400–700 cm�1 range for eachmeasurement; it is �1 K. Outside this region, spec-tral errors increase because of the signal reductionabove 700 cm�1 caused by the loss of instrument ef-ficiency and below 400 cm�1 by the absorption of therotational band of the water vapor.
If the interferometer is measuring a combination ofinterferograms that have different phases amongthemselves, as in presence of a BS’s self-emission,23,24
the calibration procedure of Eq. (1) is no longer validand the complex spectra measured with a commonsampling grid (absolute OPD acquisition) must beconsidered. Apart from some effect that is observed inthe spectral regions that are affected by BS absorp-tion properties, no significant phase errors are ob-served in the measurements. The use of a calibrationprocedure with complex spectra is not required. Nev-ertheless, also for diagnostic purposes, the implemen-tation of an absolute OPD measurement capabilityfor acquiring complex spectra is a planned upgrade.
4. Air Transmittance Measurements
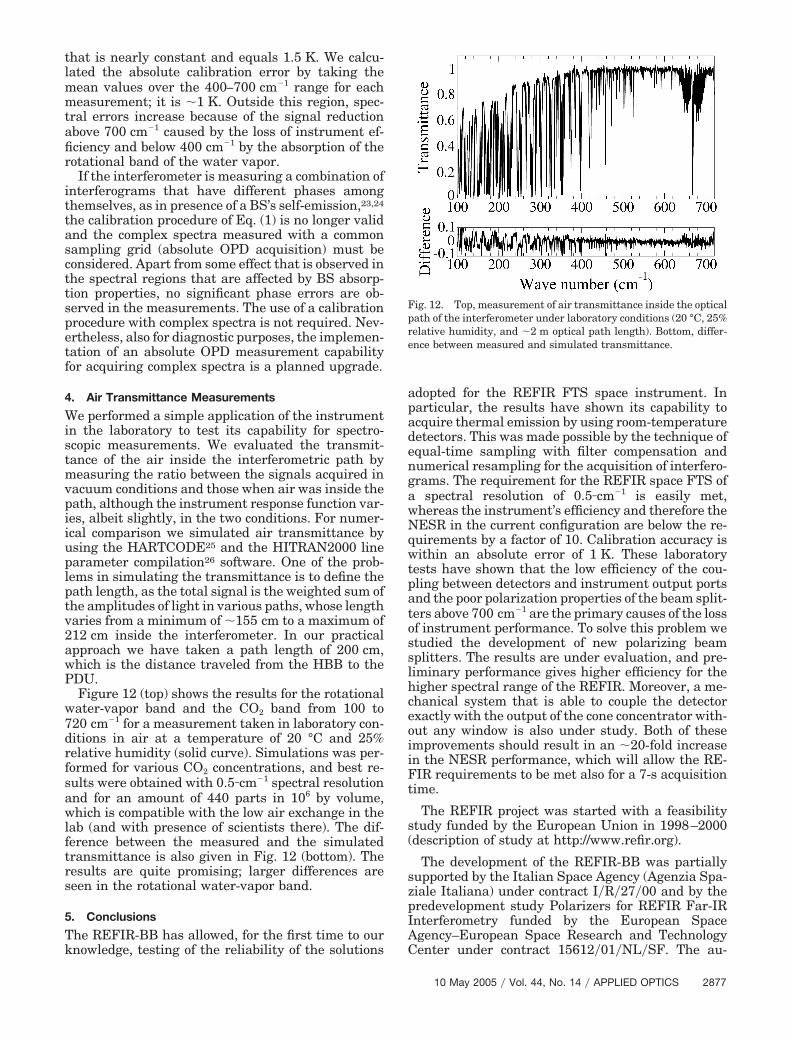
We performed a simple application of the instrumentin the laboratory to test its capability for spectro-scopic measurements. We evaluated the transmit-tance of the air inside the interferometric path bymeasuring the ratio between the signals acquired invacuum conditions and those when air was inside thepath, although the instrument response function var-ies, albeit slightly, in the two conditions. For numer-ical comparison we simulated air transmittance byusing the HARTCODE25 and the HITRAN2000 lineparameter compilation26 software. One of the prob-lems in simulating the transmittance is to define thepath length, as the total signal is the weighted sum ofthe amplitudes of light in various paths, whose lengthvaries from a minimum of �155 cm to a maximum of212 cm inside the interferometer. In our practicalapproach we have taken a path length of 200 cm,which is the distance traveled from the HBB to thePDU.
Figure 12 (top) shows the results for the rotationalwater-vapor band and the CO2 band from 100 to720 cm�1 for a measurement taken in laboratory con-ditions in air at a temperature of 20 °C and 25%relative humidity (solid curve). Simulations was per-formed for various CO2 concentrations, and best re-sults were obtained with 0.5�cm�1 spectral resolutionand for an amount of 440 parts in 106 by volume,which is compatible with the low air exchange in thelab (and with presence of scientists there). The dif-ference between the measured and the simulatedtransmittance is also given in Fig. 12 (bottom). Theresults are quite promising; larger differences areseen in the rotational water-vapor band.
5. Conclusions
The REFIR-BB has allowed, for the first time to ourknowledge, testing of the reliability of the solutions
adopted for the REFIR FTS space instrument. Inparticular, the results have shown its capability toacquire thermal emission by using room-temperaturedetectors. This was made possible by the technique ofequal-time sampling with filter compensation andnumerical resampling for the acquisition of interfero-grams. The requirement for the REFIR space FTS ofa spectral resolution of 0.5�cm�1 is easily met,whereas the instrument’s efficiency and therefore theNESR in the current configuration are below the re-quirements by a factor of 10. Calibration accuracy iswithin an absolute error of 1 K. These laboratorytests have shown that the low efficiency of the cou-pling between detectors and instrument output portsand the poor polarization properties of the beam split-ters above 700 cm�1 are the primary causes of the lossof instrument performance. To solve this problem westudied the development of new polarizing beamsplitters. The results are under evaluation, and pre-liminary performance gives higher efficiency for thehigher spectral range of the REFIR. Moreover, a me-chanical system that is able to couple the detectorexactly with the output of the cone concentrator with-out any window is also under study. Both of theseimprovements should result in an �20-fold increasein the NESR performance, which will allow the RE-FIR requirements to be met also for a 7-s acquisitiontime.
The REFIR project was started with a feasibilitystudy funded by the European Union in 1998–2000(description of study at http://www.refir.org).
The development of the REFIR-BB was partiallysupported by the Italian Space Agency (Agenzia Spa-ziale Italiana) under contract I�R�27�00 and by thepredevelopment study Polarizers for REFIR Far-IRInterferometry funded by the European SpaceAgency–European Space Research and TechnologyCenter under contract 15612�01�NL�SF. The au-
Fig. 12. Top, measurement of air transmittance inside the opticalpath of the interferometer under laboratory conditions (20 °C, 25%relative humidity, and �2 m optical path length). Bottom, differ-ence between measured and simulated transmittance.
10 May 2005 � Vol. 44, No. 14 � APPLIED OPTICS 2877
thors thank P. A. R. Ade and C. Lee (University ofWales, Cardiff, UK) for furnishing the photolitho-graphic polarizer beam splitters currently in use inthe prototype. The authors gratefully acknowledgethe technical support of M. G. Baldecchi (Istituto diFisica Applicata, “Nello Carrara,” Consiglio Nazion-ale delle Ricerche, Florence, Italy).
References1. S. A. Clough, M. J. Iacono, and J. L. Moncet, “Line-by-line
calculations of atmospheric fluxes and cooling rates: applica-tion to water vapor,” J. Geophys. Res. 97, 15761–15785 (1992).
2. S. A. Clough and M. J. Iacono, “Line-by-line calculation ofatmospheric fluxes and cooling rates. 2. Application to carbondioxide, ozone, methane, nitrous oxide and the halocarbons,” J.Geophys. Res. 100, 16519–16535 (1995).
3. A. Sinha and J. E. Harries, “Water vapor greenhouse trapping:the role of the far infrared absorption,” Geophys. Res. Lett. 22,2147–2150 (1995).
4. H. E. Brindley and J. E. Harries, “The impact of far I. R.absorption on clear sky greenhouse forcing: sensitivity studiesat high spectral resolution,” J. Quant. Spectrosc. Radiat.Transfer 60, 151–180 (1998).
5. T. Maestri and R. Rizzi, “A study of infrared diabatic forcing ofice clouds in the tropical atmosphere,” J. Geophys. Res. 108,4139–4154 (2003).
6. R. Rizzi and T. Maestri, “Some considerations on far infraredemission in the presence of clouds,” J. Geophys. Res. 108,4403–4408 (2003).
7. P. Yang, M. G. Mlynczak, H. Wei, D. P. Kratz, B. A. Baum, Y.X. Hu, W. J. Wiscombe, A. Heidinger, and M. I. Mishchenko,“Spectral signature of ice clouds in the far-infrared region:single-scattering calculations and radiative sensitivity study,”J. Geophys. Res. 108, 4569–4583 (2003).
8. R. Rizzi, B. Carli, J. E. Harries, J. Leotin, C. Serio, A. Sutera,B. Bizzarri, R. Bonsignori, and S. Peskett, “Mission objectivesand instrument requirements for the REFIR (Radiation Ex-plorer in the Far Infrared) Mission: an outline after the end ofphase B0,” in Current Problems in Atmospheric Radiation, W.L. Smith and Yu. M. Timofeyev, eds., Proceedings of the In-ternational Radiation Symposium IRS 2000 (Deepak, Hamp-ton, Va., 2001), pp. 567–570.
9. R. Rizzi, L. Palchetti, B. Carli, R. Bonsignori, J. E. Harries, J.Leotin, S. Peskett, C. Serio, and A. Sutera, “Feasibility study ofthe space-borne Radiation Explorer in the Far InfraRed (RE-FIR),” in Optical Spectroscopic Techniques, Remote Sensingand Instrumentation for Atmospheric and Space Research IV,A. M. Larar and M. G. Mlynczak, eds., Proc. SPIE 4485, 202–209 (2002).
10. European Commission, “REFIR—Radiation Explorer in theFar InfraRed,” Final Rep. ENV4-CT6-0344 (European Com-mission, Brussels, Belgium, 2000).
11. B. Carli, A. Barbis, J. E. Harries, and L. Palchetti, “Design ofan efficient broadband far infrared FT spectrometer,” Appl.Opt. 38, 3945–3950 (1999).
12. L. Palchetti, A. Barbis, J. E. Harries, and D. Lastrucci, “Designand mathematical modelling of the space-borne far-infrared
Fourier transform spectrometer for REFIR experiment,” In-frared Phys. Technol. 40, 367–377 (1999).
13. T. A. Canas, J. E. Murray, and J. E. Harries, “Troposphericairborne Fourier transform spectrometer (TAFTS),” in Satel-lite Remote Sensing of Clouds and the Atmosphere II, J. D.Haigh, ed., Proc. SPIE 3220, 91–102 (1997).
14. Y. Té P. Jeseck, C. Camy-Peyret, S. Payan, G. Perron, and G.Aubertin, “Balloonborne calibrated spectroradiometer for at-mospheric nadir sounding,” Appl. Opt. 41, 6431–6441 (2002).
15. F. Friedl-Vallon, G. Maucher, M. Seefeldner, O. Trieschmann,A. Kleinert, A. Lengel, C. Keim, H. Oelhaf, and H. Fischer,“Design and characterization of the balloonborne MichelsonInterferometer for Passive Atmospheric Sounding (MIPAS-B2),” Appl. Opt. 43, 3335–3355 (2004).
16. D. H. Martin and E. Puplett, “Polarised interferometric spec-trometry for the millimetre and submillimetre spectrum,” In-frared Phys. Technol. 10, 105–109 (1969).
17. B. Carli and F. Mencaraglia, “Signal doubling in the Martin–Puplett interferometer,” Int. J. Infrared Millim. Waves 2,1045–1051 (1981).
18. G. Bianchini, M. Lanfranchi, and U. Cortesi, “Flight qualifi-cation of a diode laser for path difference determination of ahigh-resolution Fourier transform spectrometer,” Appl. Opt.39, 962–965 (2000).
19. L. Palchetti and D. Lastrucci, “Spectral noise due to samplingerror in Fourier transform spectroscopy,” Appl. Opt. 40, 3235–3243 (2001).
20. J. W. Brault, “New approach to high-precision Fourier trans-form spectrometer design,” Appl. Opt. 35, 2891–2896 (1996).
21. G. Bianchini, U. Cortesi, L. Palchetti, and E. Pascale,“SAFIRE�A (Spectroscopy of the Atmosphere by Far-InfraRedEmission—Airborne): optimized instrument configuration andnew assessment of spectroscopic performances,” Appl. Opt. 43,2962–2977 (2004).
22. B. Carli, F. Mencaraglia, and A. Bonetti, “Submillimiter high-resolution FT spectrometer for atmospheric studies,” Appl.Opt. 23, 2594–2603 (1984).
23. H. E. Revercomb, H. Buijs, H. B. Howell, D. D. LaPorte, W. L.Smith, and L. A. Sromovsky, “Radiometric calibration of IRFourier transform spectrometers: solution to a problem withthe High-Resolution Interferometer Sounder,” Appl. Opt. 27,3210–3218 (1988).
24. B. Carli, L. Palchetti, and P. Raspollini, “Effect of beam splitteremission in Fourier-transform spectroscopy,” Appl. Opt. 38,7475–7480 (1999).
25. R. Rizzi, M. Matricardi, and F. Miskolczi, “On the simulationof up-looking and down-looking high-resolution radiance spec-tra using two different radiative transfer models,” Appl. Opt.41, 940–956 (2002).
26. L. S. Rothman, A. Barbe, D. Chris Benner, L. R. Brown, C.Camy-Peyret, M. R. Carleer, K. Chance, C. Clerbaux, V. Dana,V. M. Devi, A. Fayt, J.-M. Flaud, R. R. Gamache, A. Goldman,D. Jacquemart, K. W. Jucks, W. J. Lafferty, J.-Y. Mandin, S. T.Massie, V. Nemtchinov, D. A. Newnham, A. Perrin, C. P. Rin-sland, J. Schroeder, K. M. Smith, M. A. H. Smith, K. Tang, R.A. Toth, J. Vander Auwera, P. Varanasi, and K. Yoshino, “TheHITRAN molecular spectroscopic database: edition of 2000including updates through 2001,” J. Quant. Spectrosc. Radiat.Transfer 82, 5–44 (2003).
2878 APPLIED OPTICS � Vol. 44, No. 14 � 10 May 2005


![HERSCHEL-SPIRE FOURIER TRANSFORM SPECTROMETER … · 2020. 10. 12. · HERSCHEL-SPIRE FOURIER TRANSFORM SPECTROMETER OBSERVATIONS OF EXCITED CO AND [Ci] IN THE ANTENNAE (NGC 4038/39):](https://img.pdfslide.net/doc/110x75/60de72d1a836221d6a62e755/herschel-spire-fourier-transform-spectrometer-2020-10-12-herschel-spire-fourier.jpg)