Embed Size (px)
Citation preview
Hindawi Publishing CorporationInternational Journal of CorrosionVolume 2011, Article ID 824676, 10 pagesdoi:10.1155/2011/824676
Research Article
Breakdown and Evolution of the ProtectiveOxide Scales of AISI 304 and AISI 316 StainlessSteels under High-Temperature Oxidation
K. A. Habib, M. S. Damra, J. J. Saura, I. Cervera, and J. Belles
Departamento de Ingenierıa de Sistemas Industriales y Diseno, Universitat Jaume I, 12071 Castellon, Spain
Correspondence should be addressed to K. A. Habib, [email protected]
Received 11 April 2011; Accepted 15 June 2011
Academic Editor: Ravin Kumar Dayal
Copyright © 2011 K. A. Habib et al. This is an open access article distributed under the Creative Commons Attribution License,which permits unrestricted use, distribution, and reproduction in any medium, provided the original work is properly cited.
The failure of the protective oxide scales of AISI 304 and AISI 316 stainless steels has been studied and compared at 1,000◦C insynthetic air. First, the isothermal thermogravimetric curves of both stainless steels were plotted to determine the time needed toreach the breakdown point. The different resistance of each stainless steel was interpreted on the basis of the nature of the crystallinephases formed, the morphology, and the surface structure as well as the cross-section structure of the oxidation products. Theweight gain of AISI 304 stainless steel was about 8 times greater than that of AISI 316 stainless steel, and AISI 316 stainlesssteel reached the breakdown point about 40 times more slowly than AISI 304 stainless steel. In both stainless steels, reachingthe breakdown point meant the loss of the protective oxide scale of Cr2O3, but whereas in AISI 304 stainless steel the Cr2O3 scaletotally disappeared and exclusively Fe2O3 was formed, in AISI 316 stainless steel some Cr2O3 persisted and Fe3O4 was mainlyformed, which means that AISI 316 stainless steel is more resistant to oxidation after the breakdown.
1. Introduction
Austenitic stainless steels can be found in a wide range ofapplications, such as superheaters, reheater tubes, turbineblades, and equipment components which are subjected tothermal fluctuations under normal operation conditions;therefore, protection against degradation caused by hightemperatures is necessary. This protection can be achievedthanks to the formation of a protective scale of Cr2O3
which slows down the degradation of the metal substrate.This protective scale is maintained under mildly oxidiz-ing conditions, with its growth kinetics approximating aparabolic relationship until 900◦C. Under severe conditionsof oxidation or at temperatures above 900◦C, a fast increaseof scale growth may occur; this is known as breakdownand depends on the material, the oxidation environment,the temperature, and the time. This breakdown correspondsto the formation of a duplex layer consisting of an innerscale of a spinel and an exterior scale of Fe2O3. Dependingon the material and the environment, this fast oxidationcan continue or, on the contrary, the oxidation velocitycan decrease [1–5]. There has been little work on thebreakdown and the subsequent degradation of these types
of stainless steels at 1,000◦C. At temperatures above 800◦C,the evaporation of chromium can occur, and this tendsto convert the 50–200 μm thick protective scale of Cr2O3
which was formed initially to a less protective scale, richin iron oxides (Fe2O3/Fe3O4) and less thick [6]. For theinterpretation of the breakdown failure mechanism, thereare two recommended possibilities: “chemical failure” ofthe protective Cr2O3 scale and “mechanical failure” of theprotective Cr2O3 scale [7].
High-temperature oxidation of stainless steels has alreadybeen studied in the literature; however, the objective of thisstudy was to evaluate and compare the characteristics of thebreakdown at 1,000◦C in a synthetic air environment and theproducts formed in AISI 304 and AISI 316 stainless steels,emphasizing the differences found.
2. Experimental Procedures
Two stainless steels, AISI 304 and AISI 316, were investigatedat 1,000◦C in a synthetic air environment. Table 1 shows thechemical composition of the stainless steels used as the metalbase.
2 International Journal of Corrosion
Table 1: The chemical composition of the stainless steel used as metal base.
AISI 304
Cr Ni Mn Cu Co Mo Si C P S N V Nb Ti
18.21 8.18 1.51 0.30 0.12 0.21 0.42 0.065 0.032 0.002 0.0389 0.083 0.009 0.003
AISI 316
Cr Ni Mn Cu Co Mo Si C P S N V Nb Ti
17.02 10.7 1.17 0.41 0.17 2.8 0.32 0.03 0.029 0.006 0.0473 0.078 0.014 0.022
Tests specimens of 20 × 10 × 1 mm3 were cut fromcold-rolled sheet in the austenitic tempering state (hyper-tempering), and all sides were ground to SiC no. 600. Thetop surfaces of the base metal sample were polished withdiamond paste in three sequential steps, namely, 6-, 3- and1-μm-grade diamond lapping to achieve a mirror-like finish.Prior to oxidation, the samples were ultrasonically degreasedin acetone for 15 min and cleaned with ethanol.
The samples were isothermally oxidized in a ther-mobalance (TGA 92-16 Setaram) with synthetic air (1-bar pressure) from room temperature to 1,000◦C at a rateof 40◦C min−1, held for 100 h, and then cooled to roomtemperature at a rate of 40◦C min−1.
The techniques used to characterize the structure andthe composition of the oxidation products formed includedoptical metallography, X-ray diffraction (XRD), scanningelectron microscopy (SEM), and energy dispersive X-ray(EDX) analysis.
3. Results and Discussion
3.1. Thermogravimetric Results. It was very important tocarry out the experiment on the stainless steels at 1,000◦Cto reach the breakdown point.
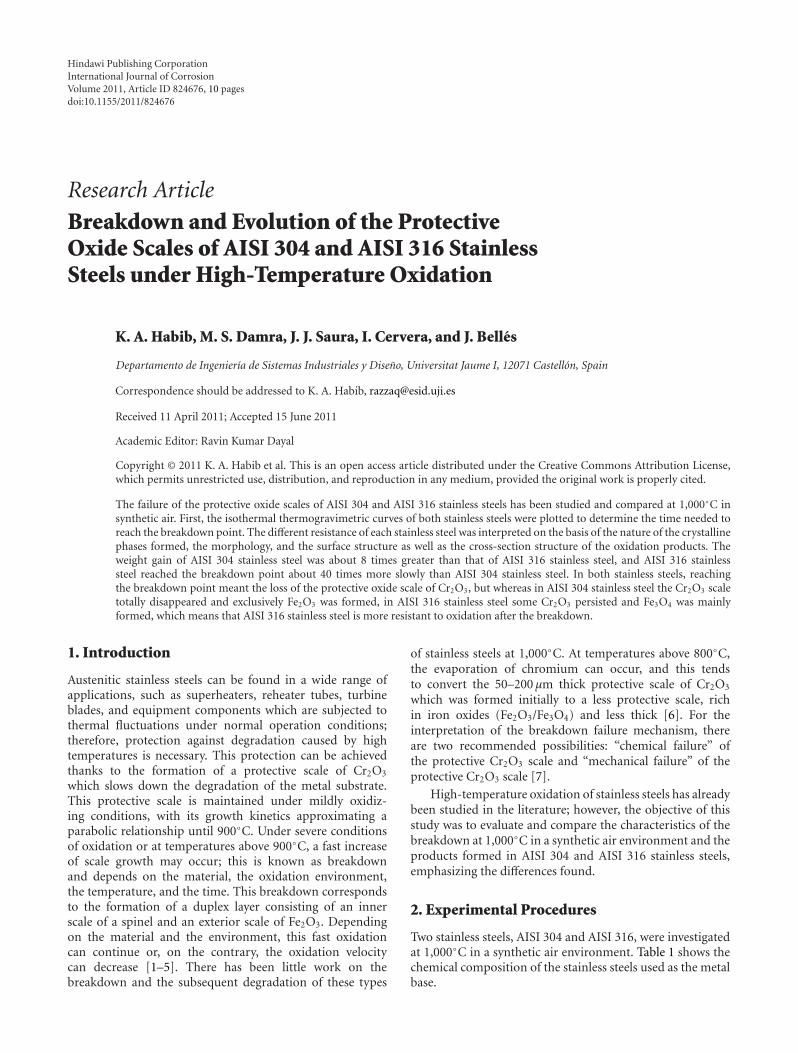
Figure 1 shows the kinetics of the oxidation of AISI 304stainless steel. The sample reaches the breakdown state afteralmost 2 h of oxidation. The curve in Figure 1 passes from theparabolic case to the linear case. The severity of the oxidationcould be observed on the steel surface.
The temperature of 1,000◦C was critical and crucial inthe running tests because at 900◦C the oxidation behaviourwas parabolic [8].
The stresses start accumulating with the oxide growthprocess as the weight increases due to oxidation. However,at a certain point, the scale thickness is unable to bear theincreased stress and the stress is released. The release ofstress may be due to either cracking in the scale or creepof the substrate metal (base metal) [1–5]. Figure 1 shows inour case the curve before and after the breakdown. Afterapproximately 8,000 s, or 2 h, the transition state startedand the curve changed from parabolic to linear, indicatingthat the protective layer started to break and the oxidationincreased. The mass gain obtained was 0.1569 mg mm−2.
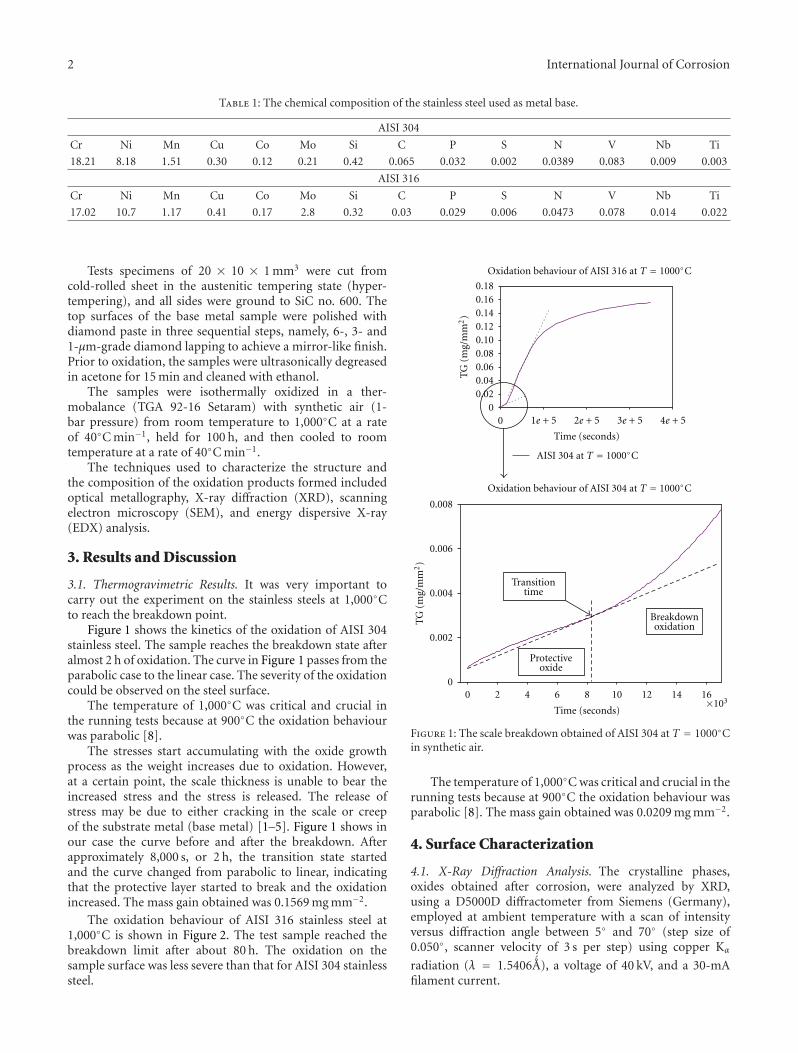
The oxidation behaviour of AISI 316 stainless steel at1,000◦C is shown in Figure 2. The test sample reached thebreakdown limit after about 80 h. The oxidation on thesample surface was less severe than that for AISI 304 stainlesssteel.
1e + 5 2e + 5 3e + 5 4e + 5
TG
(mg/
mm
2)
TG
(mg/
mm
2)
Time (seconds)
Time (seconds)
0
0
00.020.040.060.080.100.120.140.160.18
0.008
0.006
0.004
0.002
0 2 4 6 10 12 14 168×103
Transitiontime
Breakdownoxidation
Protectiveoxide
Oxidation behaviour of AISI 316 at T = 1000◦C
Oxidation behaviour of AISI 304 at T = 1000◦C
AISI 304 at T = 1000◦C
Figure 1: The scale breakdown obtained of AISI 304 at T = 1000◦Cin synthetic air.
The temperature of 1,000◦C was critical and crucial in therunning tests because at 900◦C the oxidation behaviour wasparabolic [8]. The mass gain obtained was 0.0209 mg mm−2.
4. Surface Characterization
4.1. X-Ray Diffraction Analysis. The crystalline phases,oxides obtained after corrosion, were analyzed by XRD,using a D5000D diffractometer from Siemens (Germany),employed at ambient temperature with a scan of intensityversus diffraction angle between 5◦ and 70◦ (step size of0.050◦, scanner velocity of 3 s per step) using copper Kα
radiation (λ = 1.5406 ´A), a voltage of 40 kV, and a 30-mAfilament current.
International Journal of Corrosion 3
00
0.005
0.01
0.015
0.02
0.025
0.014
0.016
0.018
0.02
0.022
2e+
5
2.2e
+5
2.4e
+5
2.6e
+5
2.8e
+5
3e+
5
3.2e
+5
3.4e
+5
3.6e
+5
3.8e
+5
Breakdown
Time (seconds)
Time (seconds)
1e + 5 2e + 5 3e + 5 4e + 5
TG
(mg/
mm
2)
TG
(mg/
mm
2)
Oxidation behaviour of AISI 316 at T = 1000◦C
AISI 316 at T = 1000◦C
AISI 316 at T = 1000◦C
Figure 2: The scale breakdown obtained of AISI 316 at T = 1000◦Cin synthetic air.
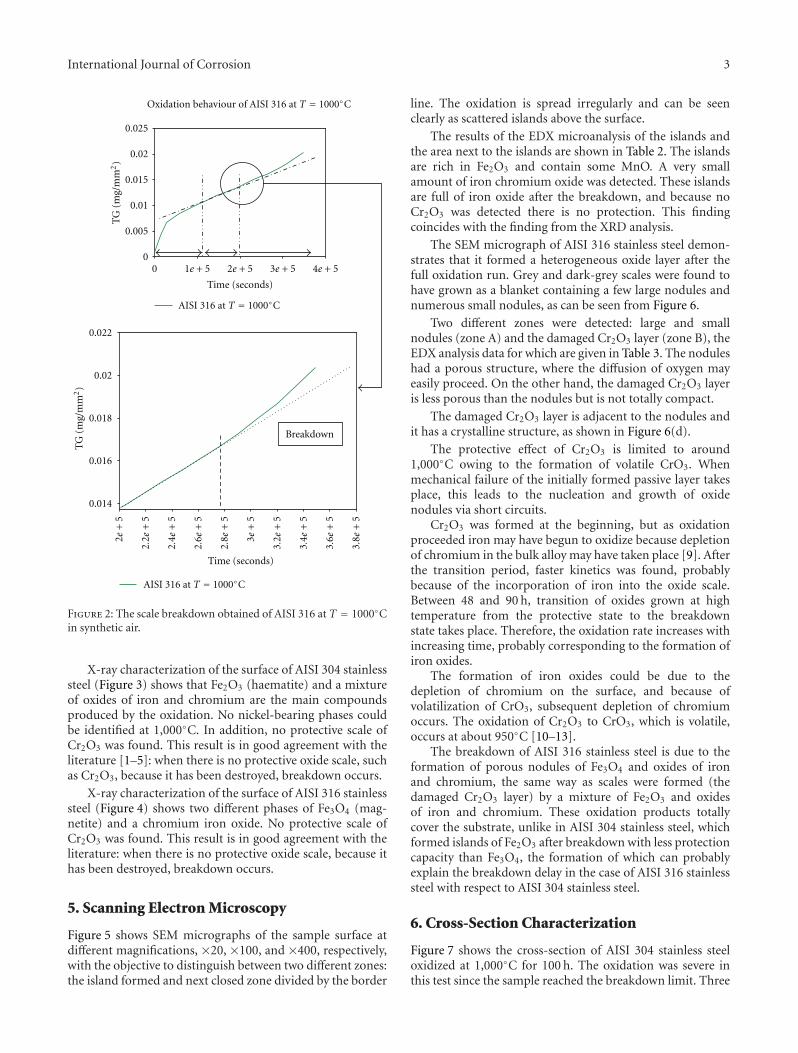
X-ray characterization of the surface of AISI 304 stainlesssteel (Figure 3) shows that Fe2O3 (haematite) and a mixtureof oxides of iron and chromium are the main compoundsproduced by the oxidation. No nickel-bearing phases couldbe identified at 1,000◦C. In addition, no protective scale ofCr2O3 was found. This result is in good agreement with theliterature [1–5]: when there is no protective oxide scale, suchas Cr2O3, because it has been destroyed, breakdown occurs.
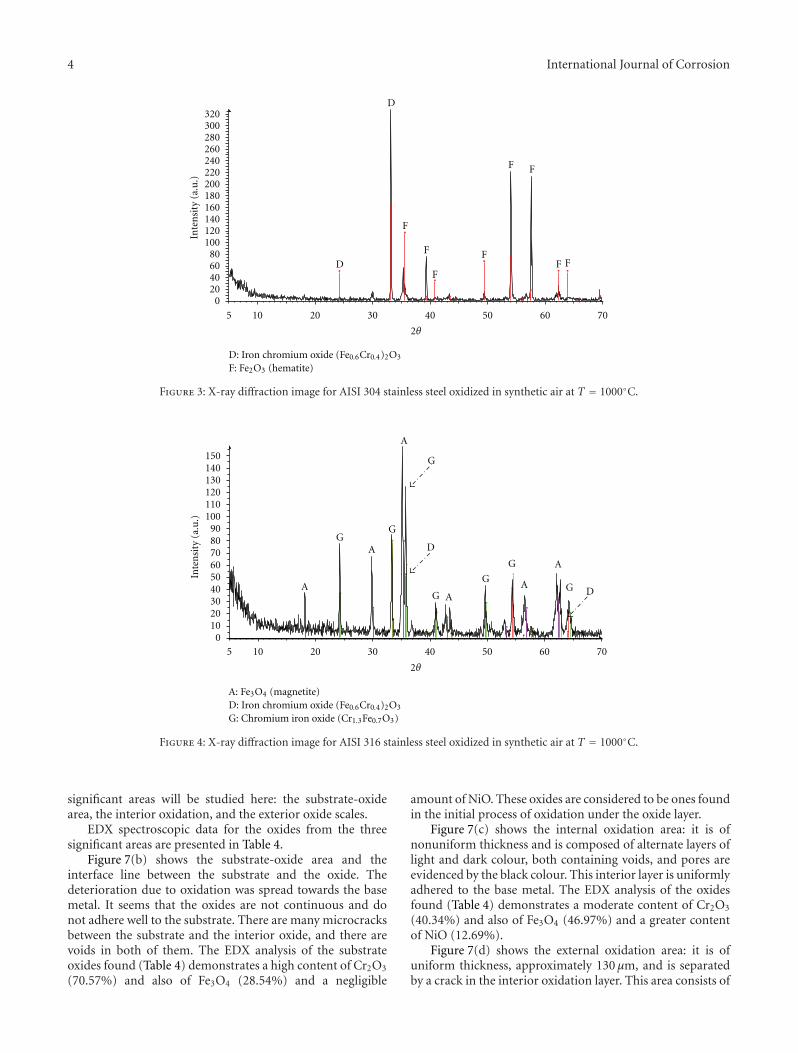
X-ray characterization of the surface of AISI 316 stainlesssteel (Figure 4) shows two different phases of Fe3O4 (mag-netite) and a chromium iron oxide. No protective scale ofCr2O3 was found. This result is in good agreement with theliterature: when there is no protective oxide scale, because ithas been destroyed, breakdown occurs.
5. Scanning Electron Microscopy
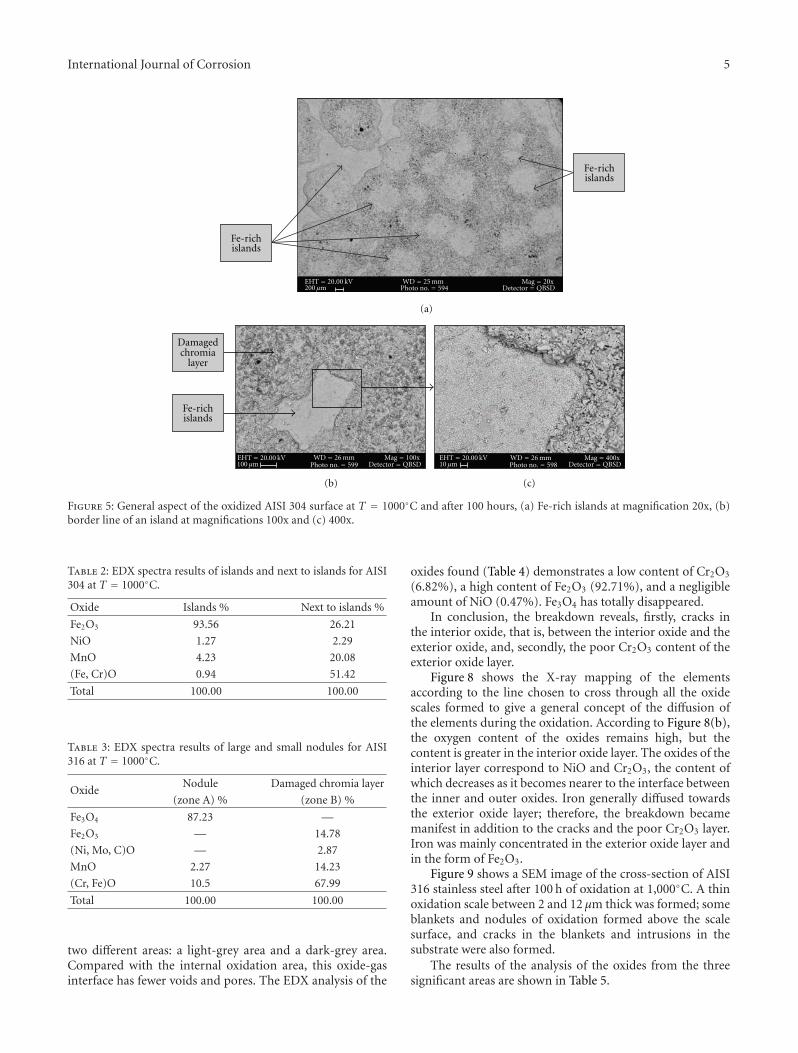
Figure 5 shows SEM micrographs of the sample surface atdifferent magnifications, ×20, ×100, and ×400, respectively,with the objective to distinguish between two different zones:the island formed and next closed zone divided by the border
line. The oxidation is spread irregularly and can be seenclearly as scattered islands above the surface.
The results of the EDX microanalysis of the islands andthe area next to the islands are shown in Table 2. The islandsare rich in Fe2O3 and contain some MnO. A very smallamount of iron chromium oxide was detected. These islandsare full of iron oxide after the breakdown, and because noCr2O3 was detected there is no protection. This findingcoincides with the finding from the XRD analysis.
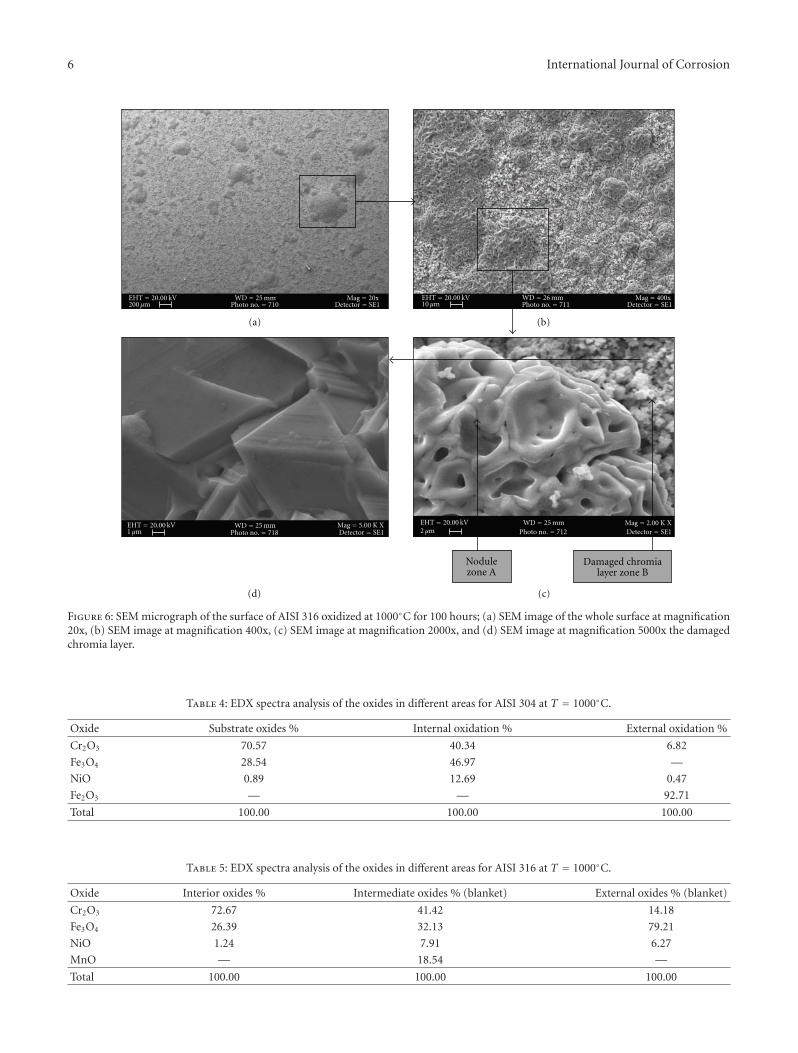
The SEM micrograph of AISI 316 stainless steel demon-strates that it formed a heterogeneous oxide layer after thefull oxidation run. Grey and dark-grey scales were found tohave grown as a blanket containing a few large nodules andnumerous small nodules, as can be seen from Figure 6.
Two different zones were detected: large and smallnodules (zone A) and the damaged Cr2O3 layer (zone B), theEDX analysis data for which are given in Table 3. The noduleshad a porous structure, where the diffusion of oxygen mayeasily proceed. On the other hand, the damaged Cr2O3 layeris less porous than the nodules but is not totally compact.
The damaged Cr2O3 layer is adjacent to the nodules andit has a crystalline structure, as shown in Figure 6(d).
The protective effect of Cr2O3 is limited to around1,000◦C owing to the formation of volatile CrO3. Whenmechanical failure of the initially formed passive layer takesplace, this leads to the nucleation and growth of oxidenodules via short circuits.
Cr2O3 was formed at the beginning, but as oxidationproceeded iron may have begun to oxidize because depletionof chromium in the bulk alloy may have taken place [9]. Afterthe transition period, faster kinetics was found, probablybecause of the incorporation of iron into the oxide scale.Between 48 and 90 h, transition of oxides grown at hightemperature from the protective state to the breakdownstate takes place. Therefore, the oxidation rate increases withincreasing time, probably corresponding to the formation ofiron oxides.
The formation of iron oxides could be due to thedepletion of chromium on the surface, and because ofvolatilization of CrO3, subsequent depletion of chromiumoccurs. The oxidation of Cr2O3 to CrO3, which is volatile,occurs at about 950◦C [10–13].
The breakdown of AISI 316 stainless steel is due to theformation of porous nodules of Fe3O4 and oxides of ironand chromium, the same way as scales were formed (thedamaged Cr2O3 layer) by a mixture of Fe2O3 and oxidesof iron and chromium. These oxidation products totallycover the substrate, unlike in AISI 304 stainless steel, whichformed islands of Fe2O3 after breakdown with less protectioncapacity than Fe3O4, the formation of which can probablyexplain the breakdown delay in the case of AISI 316 stainlesssteel with respect to AISI 304 stainless steel.
6. Cross-Section Characterization
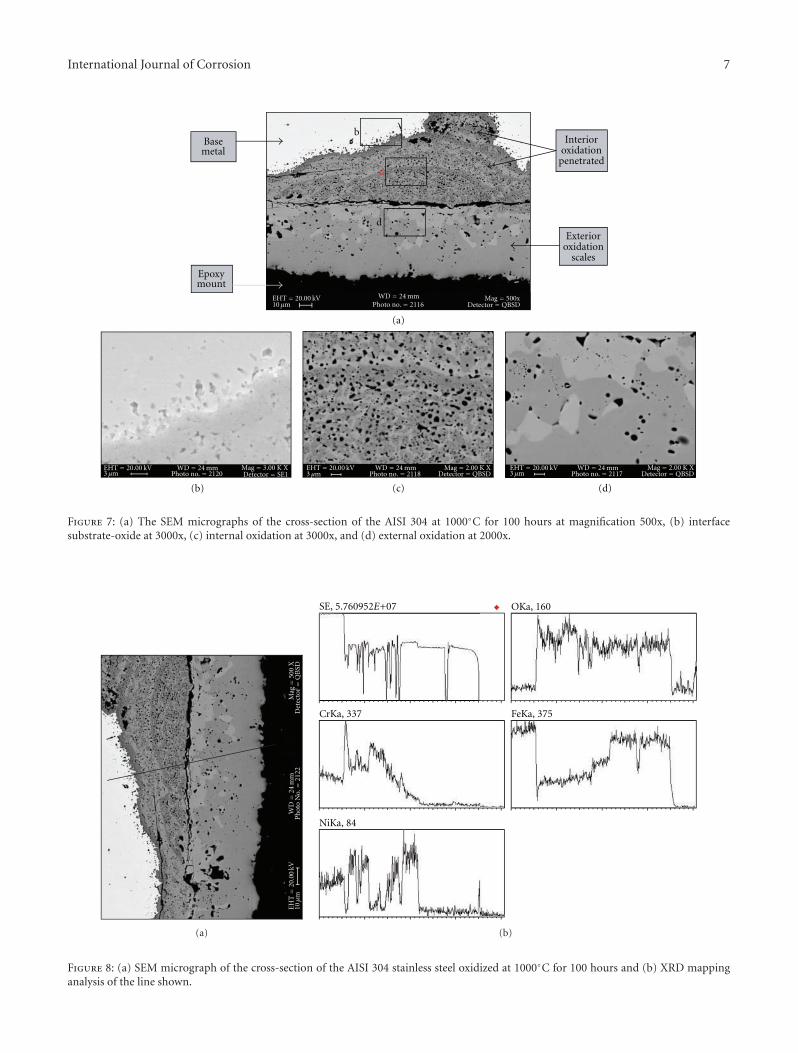
Figure 7 shows the cross-section of AISI 304 stainless steeloxidized at 1,000◦C for 100 h. The oxidation was severe inthis test since the sample reached the breakdown limit. Three
4 International Journal of Corrosion
100
20
20
40
40
60
60
80
120140160180200220240260280300320
0
10 30 50 70
D
D
F
F
F
F
F F
F F
5
D: Iron chromium oxide (Fe0.6Cr0.4)2O3
Inte
nsi
ty(a
.u.)
2θ
F: Fe2O3 (hematite)
Figure 3: X-ray diffraction image for AISI 304 stainless steel oxidized in synthetic air at T = 1000◦C.
0102030405060708090
100110120130140150
20 40 6010 30 50 705
D: Iron chromium oxide (Fe0.6Cr0.4)2O3
A
A
A
AA
A
D
D
GG
G
G
G
GG
Inte
nsi
ty(a
.u.)
2θ
A: Fe3O4 (magnetite)
G: Chromium iron oxide (Cr1.3Fe0.7O3)
Figure 4: X-ray diffraction image for AISI 316 stainless steel oxidized in synthetic air at T = 1000◦C.
significant areas will be studied here: the substrate-oxidearea, the interior oxidation, and the exterior oxide scales.
EDX spectroscopic data for the oxides from the threesignificant areas are presented in Table 4.
Figure 7(b) shows the substrate-oxide area and theinterface line between the substrate and the oxide. Thedeterioration due to oxidation was spread towards the basemetal. It seems that the oxides are not continuous and donot adhere well to the substrate. There are many microcracksbetween the substrate and the interior oxide, and there arevoids in both of them. The EDX analysis of the substrateoxides found (Table 4) demonstrates a high content of Cr2O3
(70.57%) and also of Fe3O4 (28.54%) and a negligible
amount of NiO. These oxides are considered to be ones foundin the initial process of oxidation under the oxide layer.
Figure 7(c) shows the internal oxidation area: it is ofnonuniform thickness and is composed of alternate layers oflight and dark colour, both containing voids, and pores areevidenced by the black colour. This interior layer is uniformlyadhered to the base metal. The EDX analysis of the oxidesfound (Table 4) demonstrates a moderate content of Cr2O3
(40.34%) and also of Fe3O4 (46.97%) and a greater contentof NiO (12.69%).
Figure 7(d) shows the external oxidation area: it is ofuniform thickness, approximately 130 μm, and is separatedby a crack in the interior oxidation layer. This area consists of
International Journal of Corrosion 5
EHT = 20.00 kV WD = 25 mm200 μm Detector = QBSD
Fe-rich
Damagedchromia
layer
(a)
EHT = 20.00 kV WD = 26 mm100 μm Detector = QBSD
EHT = 20.00 kV WD = 26 mm10 μm Detector = QBSD
(b) (c)
Mag = 20x
Mag = 100x Mag = 400x
Photo no. = 599Photo no. = 594
Photo no. = 599 Photo no. = 598
islands
Fe-richislands
Fe-richislands
Figure 5: General aspect of the oxidized AISI 304 surface at T = 1000◦C and after 100 hours, (a) Fe-rich islands at magnification 20x, (b)border line of an island at magnifications 100x and (c) 400x.
Table 2: EDX spectra results of islands and next to islands for AISI304 at T = 1000◦C.
Oxide Islands % Next to islands %
Fe2O3 93.56 26.21
NiO 1.27 2.29
MnO 4.23 20.08
(Fe, Cr)O 0.94 51.42
Total 100.00 100.00
Table 3: EDX spectra results of large and small nodules for AISI316 at T = 1000◦C.
OxideNodule Damaged chromia layer
(zone A) % (zone B) %
Fe3O4 87.23 —
Fe2O3 — 14.78
(Ni, Mo, C)O — 2.87
MnO 2.27 14.23
(Cr, Fe)O 10.5 67.99
Total 100.00 100.00
two different areas: a light-grey area and a dark-grey area.Compared with the internal oxidation area, this oxide-gasinterface has fewer voids and pores. The EDX analysis of the
oxides found (Table 4) demonstrates a low content of Cr2O3
(6.82%), a high content of Fe2O3 (92.71%), and a negligibleamount of NiO (0.47%). Fe3O4 has totally disappeared.
In conclusion, the breakdown reveals, firstly, cracks inthe interior oxide, that is, between the interior oxide and theexterior oxide, and, secondly, the poor Cr2O3 content of theexterior oxide layer.
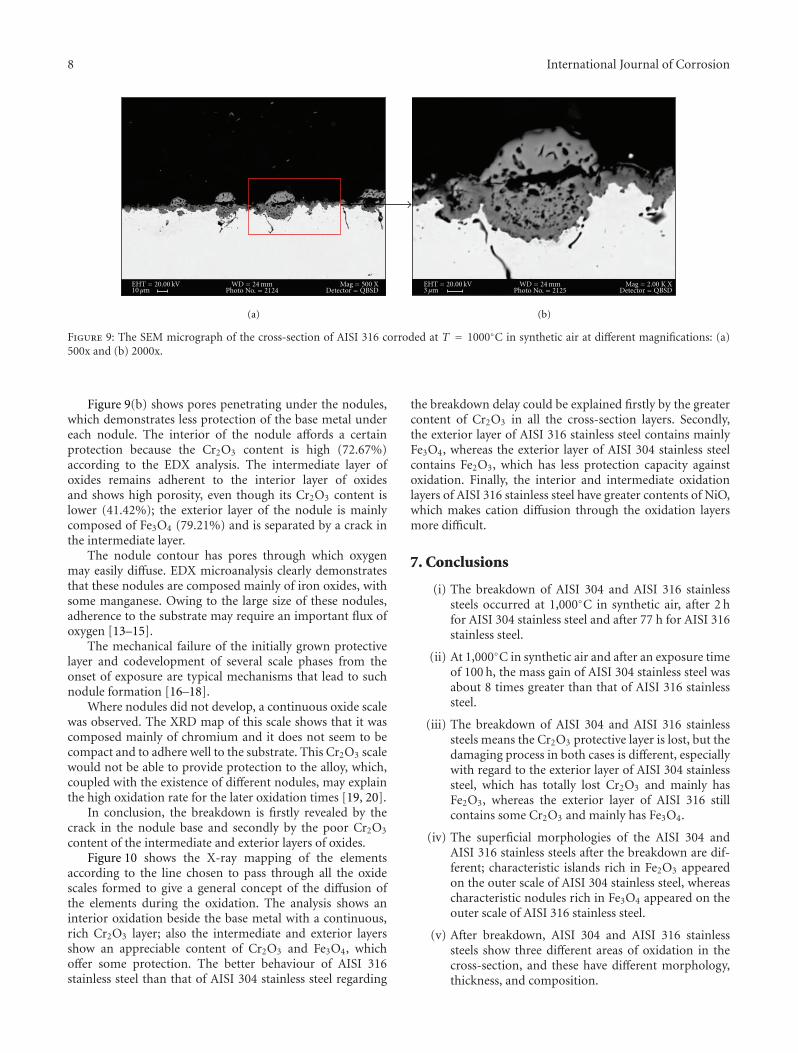
Figure 8 shows the X-ray mapping of the elementsaccording to the line chosen to cross through all the oxidescales formed to give a general concept of the diffusion ofthe elements during the oxidation. According to Figure 8(b),the oxygen content of the oxides remains high, but thecontent is greater in the interior oxide layer. The oxides of theinterior layer correspond to NiO and Cr2O3, the content ofwhich decreases as it becomes nearer to the interface betweenthe inner and outer oxides. Iron generally diffused towardsthe exterior oxide layer; therefore, the breakdown becamemanifest in addition to the cracks and the poor Cr2O3 layer.Iron was mainly concentrated in the exterior oxide layer andin the form of Fe2O3.
Figure 9 shows a SEM image of the cross-section of AISI316 stainless steel after 100 h of oxidation at 1,000◦C. A thinoxidation scale between 2 and 12 μm thick was formed; someblankets and nodules of oxidation formed above the scalesurface, and cracks in the blankets and intrusions in thesubstrate were also formed.
The results of the analysis of the oxides from the threesignificant areas are shown in Table 5.
6 International Journal of Corrosion
EHT = 20.00 kV WD = 25 mm200 μm Detector = SE1
EHT = 20.00 kV WD = 26 mm10 μm Detector = SE1
EHT = 20.00 kV WD = 25 mm Mag = 5.00 K X1 μm Detector = SE1
EHT = 20.00 kV WD = 25 mm Mag = 2.00 K X2 μm Detector = SE1
Nodulezone A
Damaged chromialayer zone B
(a) (b)
(c)(d)
Mag = 20xPhoto no. = 710
Mag = 400xPhoto no. = 711
Photo no. = 718 Photo no. = 712
Figure 6: SEM micrograph of the surface of AISI 316 oxidized at 1000◦C for 100 hours; (a) SEM image of the whole surface at magnification20x, (b) SEM image at magnification 400x, (c) SEM image at magnification 2000x, and (d) SEM image at magnification 5000x the damagedchromia layer.
Table 4: EDX spectra analysis of the oxides in different areas for AISI 304 at T = 1000◦C.
Oxide Substrate oxides % Internal oxidation % External oxidation %
Cr2O3 70.57 40.34 6.82
Fe3O4 28.54 46.97 —
NiO 0.89 12.69 0.47
Fe2O3 — — 92.71
Total 100.00 100.00 100.00
Table 5: EDX spectra analysis of the oxides in different areas for AISI 316 at T = 1000◦C.
Oxide Interior oxides % Intermediate oxides % (blanket) External oxides % (blanket)
Cr2O3 72.67 41.42 14.18
Fe3O4 26.39 32.13 79.21
NiO 1.24 7.91 6.27
MnO — 18.54 —
Total 100.00 100.00 100.00
International Journal of Corrosion 7
EHT = 20.00 kV WD = 24 mm10 μm Detector = QBSD
EHT = 20.00 kV WD = 24 mm Mag = 3.00 K XDetector = SE1
EHT = 20.00 kV WD = 24 mm Mag = 2.00 K X3 μm Detector = QBSD
EHT = 20.00 kV WD = 24 mm Mag = 2.00 K X3 μm Detector = QBSD
Basemetal
Epoxymount
Interioroxidation
penetrated
Exterioroxidation
scales
(a)
(b) (c) (d)
b
c
d
Mag = 500xPhoto no. = 2116
Photo no. = 21203 μm Photo no. = 2118 Photo no. = 2117
Figure 7: (a) The SEM micrographs of the cross-section of the AISI 304 at 1000◦C for 100 hours at magnification 500x, (b) interfacesubstrate-oxide at 3000x, (c) internal oxidation at 3000x, and (d) external oxidation at 2000x.
EH
T=
20.0
0kV
WD=
24m
mD
etec
tor=
QB
SDM
ag=
500
X10
μm
Ph
oto
No.=
2122
(a)
OKa, 160
CrKa, 337 FeKa, 375
NiKa, 84
SE, 5.760952E+07
(b)
Figure 8: (a) SEM micrograph of the cross-section of the AISI 304 stainless steel oxidized at 1000◦C for 100 hours and (b) XRD mappinganalysis of the line shown.
8 International Journal of Corrosion
(a) (b)
EHT = 20.00 kV WD = 24 mmPhoto No. = 21253 μm
Mag = 2.00 K XDetector = QBSD
EHT = 20.00 kV WD = 24 mm Mag = 500 X10 μm Photo No. = 2124 Detector = QBSD
Figure 9: The SEM micrograph of the cross-section of AISI 316 corroded at T = 1000◦C in synthetic air at different magnifications: (a)500x and (b) 2000x.
Figure 9(b) shows pores penetrating under the nodules,which demonstrates less protection of the base metal undereach nodule. The interior of the nodule affords a certainprotection because the Cr2O3 content is high (72.67%)according to the EDX analysis. The intermediate layer ofoxides remains adherent to the interior layer of oxidesand shows high porosity, even though its Cr2O3 content islower (41.42%); the exterior layer of the nodule is mainlycomposed of Fe3O4 (79.21%) and is separated by a crack inthe intermediate layer.
The nodule contour has pores through which oxygenmay easily diffuse. EDX microanalysis clearly demonstratesthat these nodules are composed mainly of iron oxides, withsome manganese. Owing to the large size of these nodules,adherence to the substrate may require an important flux ofoxygen [13–15].
The mechanical failure of the initially grown protectivelayer and codevelopment of several scale phases from theonset of exposure are typical mechanisms that lead to suchnodule formation [16–18].
Where nodules did not develop, a continuous oxide scalewas observed. The XRD map of this scale shows that it wascomposed mainly of chromium and it does not seem to becompact and to adhere well to the substrate. This Cr2O3 scalewould not be able to provide protection to the alloy, which,coupled with the existence of different nodules, may explainthe high oxidation rate for the later oxidation times [19, 20].
In conclusion, the breakdown is firstly revealed by thecrack in the nodule base and secondly by the poor Cr2O3
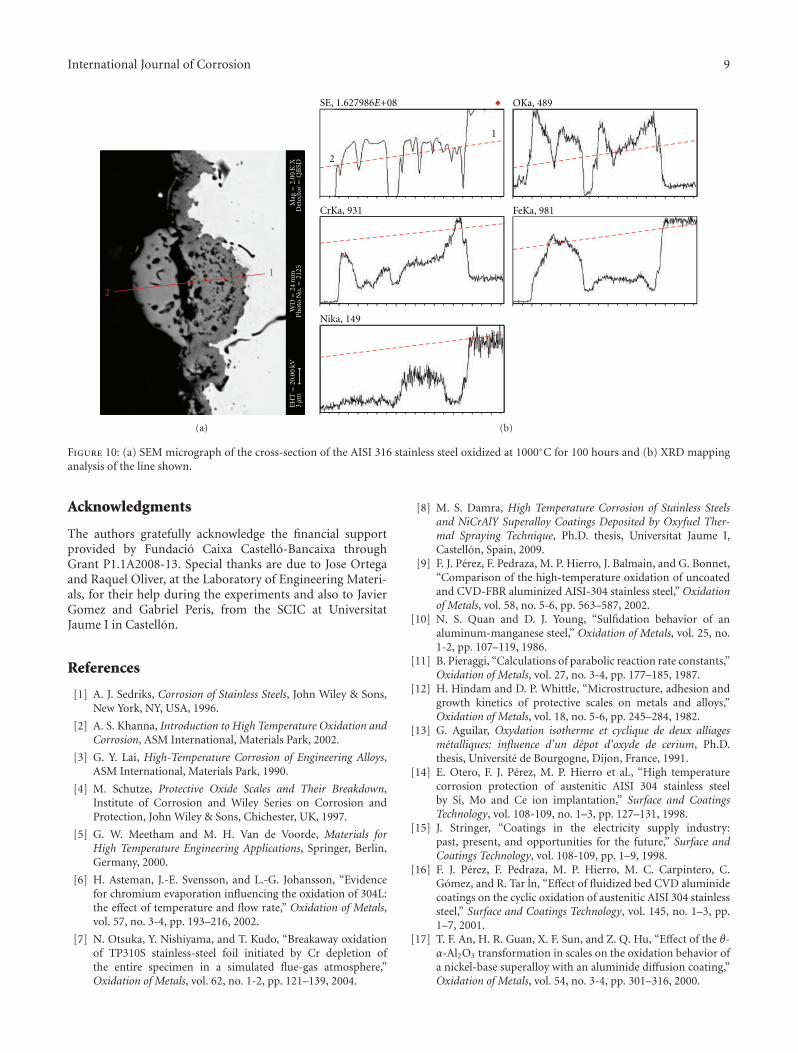
content of the intermediate and exterior layers of oxides.Figure 10 shows the X-ray mapping of the elements
according to the line chosen to pass through all the oxidescales formed to give a general concept of the diffusion ofthe elements during the oxidation. The analysis shows aninterior oxidation beside the base metal with a continuous,rich Cr2O3 layer; also the intermediate and exterior layersshow an appreciable content of Cr2O3 and Fe3O4, whichoffer some protection. The better behaviour of AISI 316stainless steel than that of AISI 304 stainless steel regarding
the breakdown delay could be explained firstly by the greatercontent of Cr2O3 in all the cross-section layers. Secondly,the exterior layer of AISI 316 stainless steel contains mainlyFe3O4, whereas the exterior layer of AISI 304 stainless steelcontains Fe2O3, which has less protection capacity againstoxidation. Finally, the interior and intermediate oxidationlayers of AISI 316 stainless steel have greater contents of NiO,which makes cation diffusion through the oxidation layersmore difficult.
7. Conclusions
(i) The breakdown of AISI 304 and AISI 316 stainlesssteels occurred at 1,000◦C in synthetic air, after 2 hfor AISI 304 stainless steel and after 77 h for AISI 316stainless steel.
(ii) At 1,000◦C in synthetic air and after an exposure timeof 100 h, the mass gain of AISI 304 stainless steel wasabout 8 times greater than that of AISI 316 stainlesssteel.
(iii) The breakdown of AISI 304 and AISI 316 stainlesssteels means the Cr2O3 protective layer is lost, but thedamaging process in both cases is different, especiallywith regard to the exterior layer of AISI 304 stainlesssteel, which has totally lost Cr2O3 and mainly hasFe2O3, whereas the exterior layer of AISI 316 stillcontains some Cr2O3 and mainly has Fe3O4.
(iv) The superficial morphologies of the AISI 304 andAISI 316 stainless steels after the breakdown are dif-ferent; characteristic islands rich in Fe2O3 appearedon the outer scale of AISI 304 stainless steel, whereascharacteristic nodules rich in Fe3O4 appeared on theouter scale of AISI 316 stainless steel.
(v) After breakdown, AISI 304 and AISI 316 stainlesssteels show three different areas of oxidation in thecross-section, and these have different morphology,thickness, and composition.
International Journal of Corrosion 9
EH
T=
20.0
0kV
WD=
24m
mP
hot
oN
o.=
2125
3μ
mM
ag=
2.00
KX
Det
ecto
r=
QB
SD
1
2
(a)
1
2
OKa, 489
CrKa, 931 FeKa, 981
Nika, 149
SE, 1.627986E+08
(b)
Figure 10: (a) SEM micrograph of the cross-section of the AISI 316 stainless steel oxidized at 1000◦C for 100 hours and (b) XRD mappinganalysis of the line shown.
Acknowledgments
The authors gratefully acknowledge the financial supportprovided by Fundacio Caixa Castello-Bancaixa throughGrant P1.1A2008-13. Special thanks are due to Jose Ortegaand Raquel Oliver, at the Laboratory of Engineering Materi-als, for their help during the experiments and also to JavierGomez and Gabriel Peris, from the SCIC at UniversitatJaume I in Castellon.
References
[1] A. J. Sedriks, Corrosion of Stainless Steels, John Wiley & Sons,New York, NY, USA, 1996.
[2] A. S. Khanna, Introduction to High Temperature Oxidation andCorrosion, ASM International, Materials Park, 2002.
[3] G. Y. Lai, High-Temperature Corrosion of Engineering Alloys,ASM International, Materials Park, 1990.
[4] M. Schutze, Protective Oxide Scales and Their Breakdown,Institute of Corrosion and Wiley Series on Corrosion andProtection, John Wiley & Sons, Chichester, UK, 1997.
[5] G. W. Meetham and M. H. Van de Voorde, Materials forHigh Temperature Engineering Applications, Springer, Berlin,Germany, 2000.
[6] H. Asteman, J.-E. Svensson, and L.-G. Johansson, “Evidencefor chromium evaporation influencing the oxidation of 304L:the effect of temperature and flow rate,” Oxidation of Metals,vol. 57, no. 3-4, pp. 193–216, 2002.
[7] N. Otsuka, Y. Nishiyama, and T. Kudo, “Breakaway oxidationof TP310S stainless-steel foil initiated by Cr depletion ofthe entire specimen in a simulated flue-gas atmosphere,”Oxidation of Metals, vol. 62, no. 1-2, pp. 121–139, 2004.
[8] M. S. Damra, High Temperature Corrosion of Stainless Steelsand NiCrAlY Superalloy Coatings Deposited by Oxyfuel Ther-mal Spraying Technique, Ph.D. thesis, Universitat Jaume I,Castellon, Spain, 2009.
[9] F. J. Perez, F. Pedraza, M. P. Hierro, J. Balmain, and G. Bonnet,“Comparison of the high-temperature oxidation of uncoatedand CVD-FBR aluminized AISI-304 stainless steel,” Oxidationof Metals, vol. 58, no. 5-6, pp. 563–587, 2002.
[10] N. S. Quan and D. J. Young, “Sulfidation behavior of analuminum-manganese steel,” Oxidation of Metals, vol. 25, no.1-2, pp. 107–119, 1986.
[11] B. Pieraggi, “Calculations of parabolic reaction rate constants,”Oxidation of Metals, vol. 27, no. 3-4, pp. 177–185, 1987.
[12] H. Hindam and D. P. Whittle, “Microstructure, adhesion andgrowth kinetics of protective scales on metals and alloys,”Oxidation of Metals, vol. 18, no. 5-6, pp. 245–284, 1982.
[13] G. Aguilar, Oxydation isotherme et cyclique de deux alliagesmetalliques: influence d’un depot d’oxyde de cerium, Ph.D.thesis, Universite de Bourgogne, Dijon, France, 1991.
[14] E. Otero, F. J. Perez, M. P. Hierro et al., “High temperaturecorrosion protection of austenitic AISI 304 stainless steelby Si, Mo and Ce ion implantation,” Surface and CoatingsTechnology, vol. 108-109, no. 1–3, pp. 127–131, 1998.
[15] J. Stringer, “Coatings in the electricity supply industry:past, present, and opportunities for the future,” Surface andCoatings Technology, vol. 108-109, pp. 1–9, 1998.
[16] F. J. Perez, F. Pedraza, M. P. Hierro, M. C. Carpintero, C.Gomez, and R. Tar ln, “Effect of fluidized bed CVD aluminidecoatings on the cyclic oxidation of austenitic AISI 304 stainlesssteel,” Surface and Coatings Technology, vol. 145, no. 1–3, pp.1–7, 2001.
[17] T. F. An, H. R. Guan, X. F. Sun, and Z. Q. Hu, “Effect of the θ-α-Al2O3 transformation in scales on the oxidation behavior ofa nickel-base superalloy with an aluminide diffusion coating,”Oxidation of Metals, vol. 54, no. 3-4, pp. 301–316, 2000.

10 International Journal of Corrosion
[18] F. H. Stott, G. C. Wood, and J. Stringer, “The influence ofalloying elements on the development and maintenance ofprotective scales,” Oxidation of Metals, vol. 44, no. 1-2, pp.113–145, 1995.
[19] S. C. Tsai, A. M. Huntz, and C. Dolin, “Growth mechanismof Cr2O3 scales: oxygen and chromium diffusion, oxidationkinetics and effect of yttrium,” Materials Science and Engineer-ing A, vol. 212, no. 1, pp. 6–13, 1996.
[20] P. Tomaszewicz and G. R. Wallwork, “Observations of nodulegrowth during the oxidation of pure binary iron-aluminumalloys,” Oxidation of Metals, vol. 19, no. 5-6, pp. 165–185, 1983.

Submit your manuscripts athttp://www.hindawi.com
ScientificaHindawi Publishing Corporationhttp://www.hindawi.com Volume 2014
CorrosionInternational Journal of
Hindawi Publishing Corporationhttp://www.hindawi.com Volume 2014
Polymer ScienceInternational Journal of
Hindawi Publishing Corporationhttp://www.hindawi.com Volume 2014
Hindawi Publishing Corporationhttp://www.hindawi.com Volume 2014
CeramicsJournal of
Hindawi Publishing Corporationhttp://www.hindawi.com Volume 2014
CompositesJournal of
NanoparticlesJournal of
Hindawi Publishing Corporationhttp://www.hindawi.com Volume 2014
Hindawi Publishing Corporationhttp://www.hindawi.com Volume 2014
International Journal of
Biomaterials
Hindawi Publishing Corporationhttp://www.hindawi.com Volume 2014
NanoscienceJournal of
TextilesHindawi Publishing Corporation http://www.hindawi.com Volume 2014
Journal of
NanotechnologyHindawi Publishing Corporationhttp://www.hindawi.com Volume 2014
Journal of
CrystallographyJournal of
Hindawi Publishing Corporationhttp://www.hindawi.com Volume 2014
The Scientific World JournalHindawi Publishing Corporation http://www.hindawi.com Volume 2014
Hindawi Publishing Corporationhttp://www.hindawi.com Volume 2014
CoatingsJournal of
Advances in
Materials Science and EngineeringHindawi Publishing Corporationhttp://www.hindawi.com Volume 2014
Smart Materials Research
Hindawi Publishing Corporationhttp://www.hindawi.com Volume 2014
Hindawi Publishing Corporationhttp://www.hindawi.com Volume 2014
MetallurgyJournal of
Hindawi Publishing Corporationhttp://www.hindawi.com Volume 2014
BioMed Research International
MaterialsJournal of
Hindawi Publishing Corporationhttp://www.hindawi.com Volume 2014
Nano
materials
Hindawi Publishing Corporationhttp://www.hindawi.com Volume 2014
Journal ofNanomaterials