Embed Size (px)
Citation preview

Alexandre Elias / 05-14-2014Alexandre Elias / 05-14-2014
Breakout SessionBreakout SessionBringing Renewable Elastomers to MarketBringing Renewable Elastomers to Market

BRASKEM’S EVOLUTION TIMELINEA 12 years old company that started locally and have expanded nationally and internationally
2 2
Inauguration of Brazil’s first petrochemical complex
19781979
Investments by Odebrecht in the
sector
Start of industry integration
19902002
Creation of Braskem
Acquisition of Grupo Ipiranga assets. Launch of Green
Polyethylene
20072008
Inauguration of first
greenfield plant
Announcement of project in partnership with Idesa in Mexico
20092010
Acquisition of Quattor, consolidating the
industry in Brazil. Acquisition of Sunoco’s
polypropylene assets, marking the first plants
outside Brazil.
Inauguration of green ethylene
plant
Acquisition of Dow’spolypropylene assets
20112012
Inauguration of two new plants.
Construction begins on Mexico
project
2013
Acquisition of Solvay’sAssets in Argentina

3 3
REACHING THE CURRENT STRUCTURE SIZE
*December 2012/2013
36INDUSTRIAL UNITS
TEAM MEMBERS8096
INVESTED ININNOVATION
92US$
MM
22GROSS REVENUE OF
USS$ BI
CLIENTSIN OVER
70COUNTRIES
EXPORT REVENUE OF
8,1NET REVENUE OF
US$19BI
EBITDA OF
US$2,2BI
BIUS$

BAHIABRAZIL
1 CRACKER4 PE1 PP1 PVC1 CHLOR-ALKALI
ALAGOASBRAZIL
2 PVC1 CHLOR-ALKALI
SAO PAULOBRAZIL
2 PE2 PP1 CRACKER
RIO DE JANEIROBRAZIL
1 CRACKER 1 PE 1 PP
RIO GRANDE DO SULBRAZIL
2 CRACKER5 PE 2 PP
BRAZIL (KTA)BASIC: 3,752PE: 3,025PP: 1,975PVC: 710
USA (KTA)PP: 1,425
EUROPE (KTA)PP: 545
INDUSTRIAL PRESENCE
PROJECTS
4 4
36 INDUSTRIAL UNITS WORLDWIDE
PENNSYLVANIAUNITED STATES
1 PP
WEST VIRGINIAUNITED STATES
1 PP
NORTH RHINE-WESTPHALIAGERMANY
1 PP
SAXONY-ANHALTGERMANY
1 PP
TEXASUNITED STATES
3 PP
PROJECTS IN CONSTRUCTION
WITH INTERNATIONAL INDUSTRIAL FOOTPRINT

BRAZIL
SALVADORSAO PAULORIO DE JANEIROPORTO ALEGRE
UNITED STATES
PHILADELPHIAHOUSTON
LATIN AMERICA
VENEZUELACARACASPERULIMACHILESANTIAGO
ASIA
Serving the markets of SINGAPORE, CHINA, INDIA, INDONESIA, SOUTH KOREA AND JAPAN
5 5
AND INTERCONTINENTAL COMMERCIAL PRESENCE
ARGENTINABUENOS AIRESCOLOMBIABOGOTAMEXICOMEXICO CITY
EUROPE
GERMANYFRANKFURTNETHERLANDSROTTERDAMAUSTRIAVIENNA
OFFICES AND COUNTRIES
COMMERCIAL MEMBERS
SPAINENGLANDPOLANDITALY

BRASKEM’S GROWTH IS STRUCTURED AROUND THREE MAIN DRIVERS:
GROWTH IN THE BRAZILIAN MARKET
6 6
INTERNATIONAL EXPANSION FOCUSED
ON THE AMERICAS
RENEWABLE CHEMISTRY
WORKING ON STRATEGIC EXPANSION
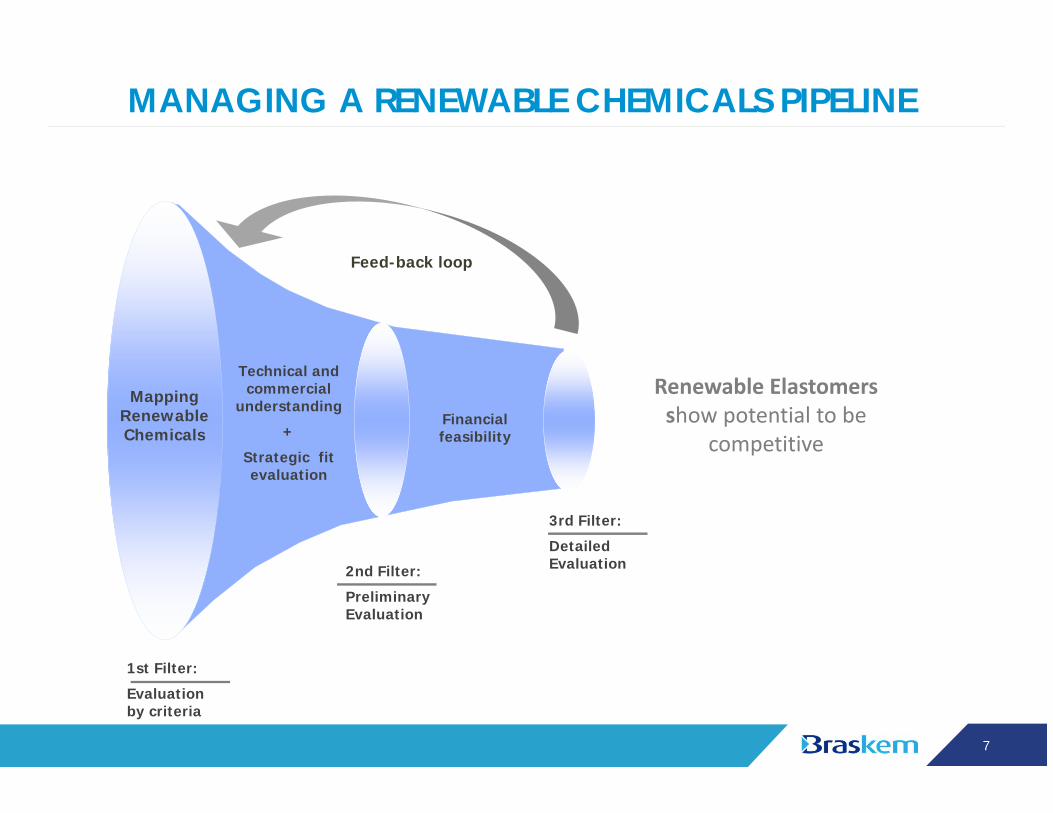
MANAGING A RENEWABLE CHEMICALS PIPELINE
7 7
Technical and commercial
understanding
+
Strategic fit evaluation
Mapping Renewable Chemicals
1st Filter:
Evaluation by criteria
2nd Filter:
Preliminary Evaluation
Feed-back loop
3rd Filter:
Detailed Evaluation
Financial feasibility
Renewable Elastomers show potential to be
competitive

88Note: Sources: CEH 2012 Natural Rubber – SRI consulting
World Natural and synthetic rubber consumption (MM tons)
CAGAR (a.a.) 1981 to 2004 2004 to 20113,8%1,4%
1,0%0,9%
1980 1982 1984 1986 1988 1990 1992 1994 1996 1998 2000 2002 2004 2006 2008 2010 2012
5
15
10
0
4
76
3
12
89
11121314 Synthetic Rubber
Natural Rubber
Elastomers demand is over 20 MM tons and synthetic rubber accounts for 70%

99
Most representative sorts of synthetic rubber produced have the tire industry as main destination
Synthetic rubber is mainly represented by butadiene derivatives
Note: Sources: CEH 2012 Natural Rubber – SRI consulting
PolybutadieneApplications: About 70% tire
Industry
Capacity: 3,7 MM (2011)
Main Producers: China and USA
11%
13%
18%
5%
3%3%
47%
Other
South America
Southeast Asia
West Europe
Cis & Baltic States
North América
Northeast Asia
Styrene ButadieneMain Applications
• EPM: Insulator for high‐voltage cables Nitrile: Hoses, seals and gaskets
(mainly for automobiles)• Polyisoprene: Tires, Mechanical Goods,
Footwear• PClR: Mechanical rubber and
automotive components
Capacity: 3,3 MM (2011)
Other Syntetic Ruber
9%
11%
6%
8%
18%
48%
Other
West Europe
South America
Cis & Baltic States
Norht America
Northeast Asia
Main Producers: China and USA
Capacity: 6,0 MM (2011)
Applications: About 70 ~ 75% destined to tire industry
NITRILE
RUBB
ER
1,2
0,5
0,10,2
0,30,1
ETHY
LENE
PROPYLENE
RUBB
ER
1,3
0,4
0,5
0,4
0,1
0,4
0,0
0,2
0,20,1
0,6
POLYISOPR
ENE
0,1
0,30,10,0
POLYCH
LORO
PREN
ERU
BBER
(neo
pren
e)
0,0
Cent East Europe
Other North America
Southeast Asia
West Europe
Northeast Asia

1010
Almost half of butadiene consumption is represented by tire industries applications
And elastomers are the larger butadiene demand driver
Butadiene Global Demand (2011) MM tons
1,4(13%)
0,6(6%)
1,0(9%)
1,2(12%) 0,2
(2%)0,5(5%)
2,8(27%)
2,8(27%)
OtherAdiponitrile (HMDA)
Styrene‐Butadiene LatexesABSPolychloroprene (PCR)
Nitrile (NBR)Styrene‐Butadiene (SBR)Polybutadiene (PBR)
Source: CEH ‐ Butadiene (2011); PERP ‐ Isoprene/Bioisoprene (2012)
Total Global Market Demand: 10,5 MM tons
Tire Industry Influence:
~ 70% of Polybutadieneand Styrene-butadiene production goes to tire industry (~46% of total
butadiene production)
Elastomers Other
Approximately 60% of total’s budatiene
consumption goes to elastomers applications

1111
Necessity to search for alternative ways to produce butadiene
It is forecasted a shortage on butadiene chain
19
55 52 53 51 50 50 49 47 47 46 45
29 29 30 32 32 34 35 35 35 36
19191817181819191919
27
2013E20122011201020092008200720062005 2015E2014E
OthersNaphthaEthane
21
149
62
Gas OilNaphtan‐ButanePropaneEthane
Butadiene average content from steam cracking using different feedstock (kg Butadiene content / 100 kg Ethylene)Butadiene is currently
almost entirely produced as a by‐product of ethylene steam cracking of naphtha or gas oil feedstock, the
cheapest process
A switch to lighter feedstock has
reduced the amount of butadiene available from
ethylene cracking
Source: CMAI; SRI PEP Report 35E ON‐PURPOSE BUTADIENE PRODUCTION
Probable Butadiene Shortage
Feedstock distribution for Ethylene World Production (in %)

1212
In the last ten years the ratio of crude oil to natural gas prices has expanded almost four times
Caused by the evolution of US gas and oil prices trends
0
10
20
30
40
50
60
70
80
90
100
950
2
4
6
8
10
12
14
16
18
08070605040302010099989796 11YTD
1009
1 Assume 5.8 MMTBTU per barrel crude oil
SOURCE: IHS
Henry Hub natural gas, $/MMBTU
WTI crude oil, $/Bbl
06
1.7
05
1.1
02
1.8
1.0
04
1.2
0301
1.1
00
1.2 1.4
3.1
10
4.0
11YTD
09
2.7
08
1.9
0799
1.4
98
1.2
97
1.4
96
1.4
95
1.9
$/Bbl $/MMBTURatio of crude oil (in MMBTU equivalents1) to natural gas price
US oil and gas prices

1313
Butadiene forecast indicates that the demand will growhigher ( 3p.p.) than historic average...
SOURCE: IHS
3.8 MM t
CAGR 1%CAGR 4%
Region Demand 2012(million t)
CAGR2012‐2020
Northeast Asia 4.9 4%
North America 1.8 1%
Brazil 0.3 4%
West Europe 1.8 0,4%
Others 1.4 8%
Source: IHS Chemical, analysis Braskem
Represents, on average, 45% of world demand
• The world recession during2008‐2009 resulted in adowntrend growth for thebutadiene demand: this factpushed down the last 5 yearsaverage.
• There’s a growth expectationfor the car industry, speciallyin China and India,consequently for butadieneas well.
• These two facts togetherbring an indication that thebutadiene demand will grow3 p.p more than the past.

1414
Due to switch to lighter feedstocks, the butadiene production through Naphta cracker will stay lower than demand...
Resulting in a probable pressure on butadiene supply
Source: CMAI, analysis Braskem*Considering only actual production
12
1
2019
13
11
1
2018
13
11
1
2017
12
11
1
2016
9
9
1
2007
10
9
1
2008
10
10
1
2011
10
10
1
2010
10
9
1
2009
9
8
1
‐1MM tonsShortage of Butadiene
2020
1312
2014
11
1010
2015
10 111
2013
10
11
11
1
2012
Butadiene Demand
Butadiene Extraction(Naphta Cracker)
On Purpose Production*
Butadiene World Production x Demand (in Million tons per year)
Forecast
Butadiene Extraction Production CAGR 2013 – 2022 = 3%
Butadiene DemandCAGR 2013 – 2022 = 4%
Butadiene on‐purpose productionneeds to grow 9% CAGR 2013 –2022 to supply outpace demand

1515
Renewable Butadiene positive potentials
A sustainable portfolio of products
Developing a Sustainable Portfolio
Cost Competitive
Lower production cost through a fermentation route
Social Impact
Agricultural industry growth and social development
Renewable Source
Produced from sugar

1616
Genomatica
Differentiated technology platform Strong patents portfolio on C4 products Proven scale up capacity (1,3 BDO process)

Thank YouThank You