Embed Size (px)
Citation preview
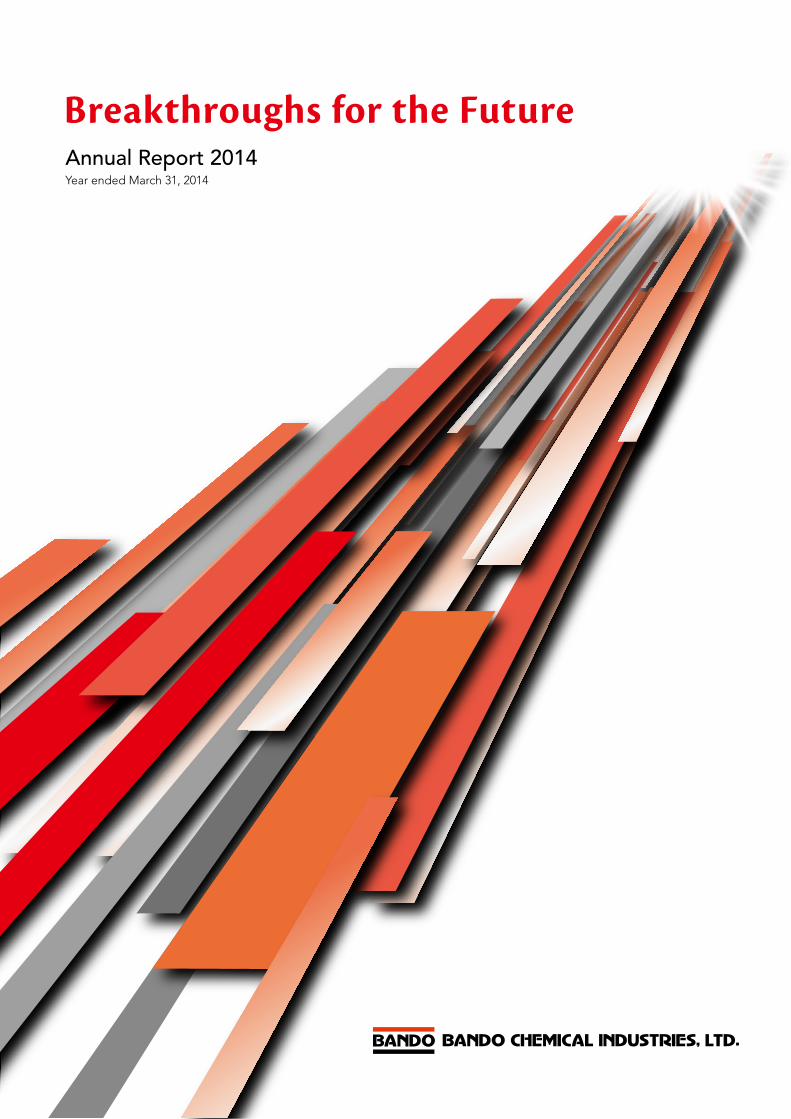
Annual Report 2014Year ended March 31, 2014
Breakthroughs for the Future

With a spirit of harmony and in good faith,
and to ensure the company’s growth,
the Bando Group will work to earn the trust
of our customers and society
by creating and providing products and services
of added value and high quality.
With pride as members of the Bando Group,
we will contribute to society as a whole.
Management Philosophy
Profile
Snapshot 2
Products 4
History 6
Global Network 8
Highlights 10
To Our Stakeholders and Investors 14
Message from the President 16
New Challenges 22
Review of Operations 26
CSR 30
Corporate Governance 32
Management 35
Message from Bando’s External Director 36
Profile
Contents
Financial Section 3737 Management’s Discussion and Analysis
40 Business Risks
41 Message from the CFO
42 Consolidated Balance Sheets
44 Consolidated Statements of Income and Consolidated Statements of Comprehensive Income
45 Consolidated Statements of Changes in Net Assets
46 Consolidated Statements of Cash Flows
47 Notes to Consolidated Financial Statements
Corporate Data / Investor Information 60
In the 100-plus years since its founding in Japan in 1906, Bando Chemical Industries, Ltd. has been pursuing industrial development by making various contributions to rubber and plastic processing technologies in such areas as power transmission belts and systems, belts used in precision equipment, and multimedia parts made from urethane and resins.
We are highly regarded by customers throughout the world owing to our efforts to develop new technologies and products that meet today’s needs while manufacturing and stably supplying people- and environmentally-friendly products of unsurpassed performance and quality.
Possessing an unwavering spirit spanning back to our foundation, we will create a brighter future through the ceaseless innovation of our business.
Cautionary Note Concerning Forward-Looking Statements
This annual report includes forward-looking statements related to the Company’s future performance
forecasts. These statements are rationally determined by management based on information avail-
able at the time and therefore are subject to risk and uncertainty. Actual performance may differ from
targets due to such factors as changes in the operating environment.
Annual Report 2014 1
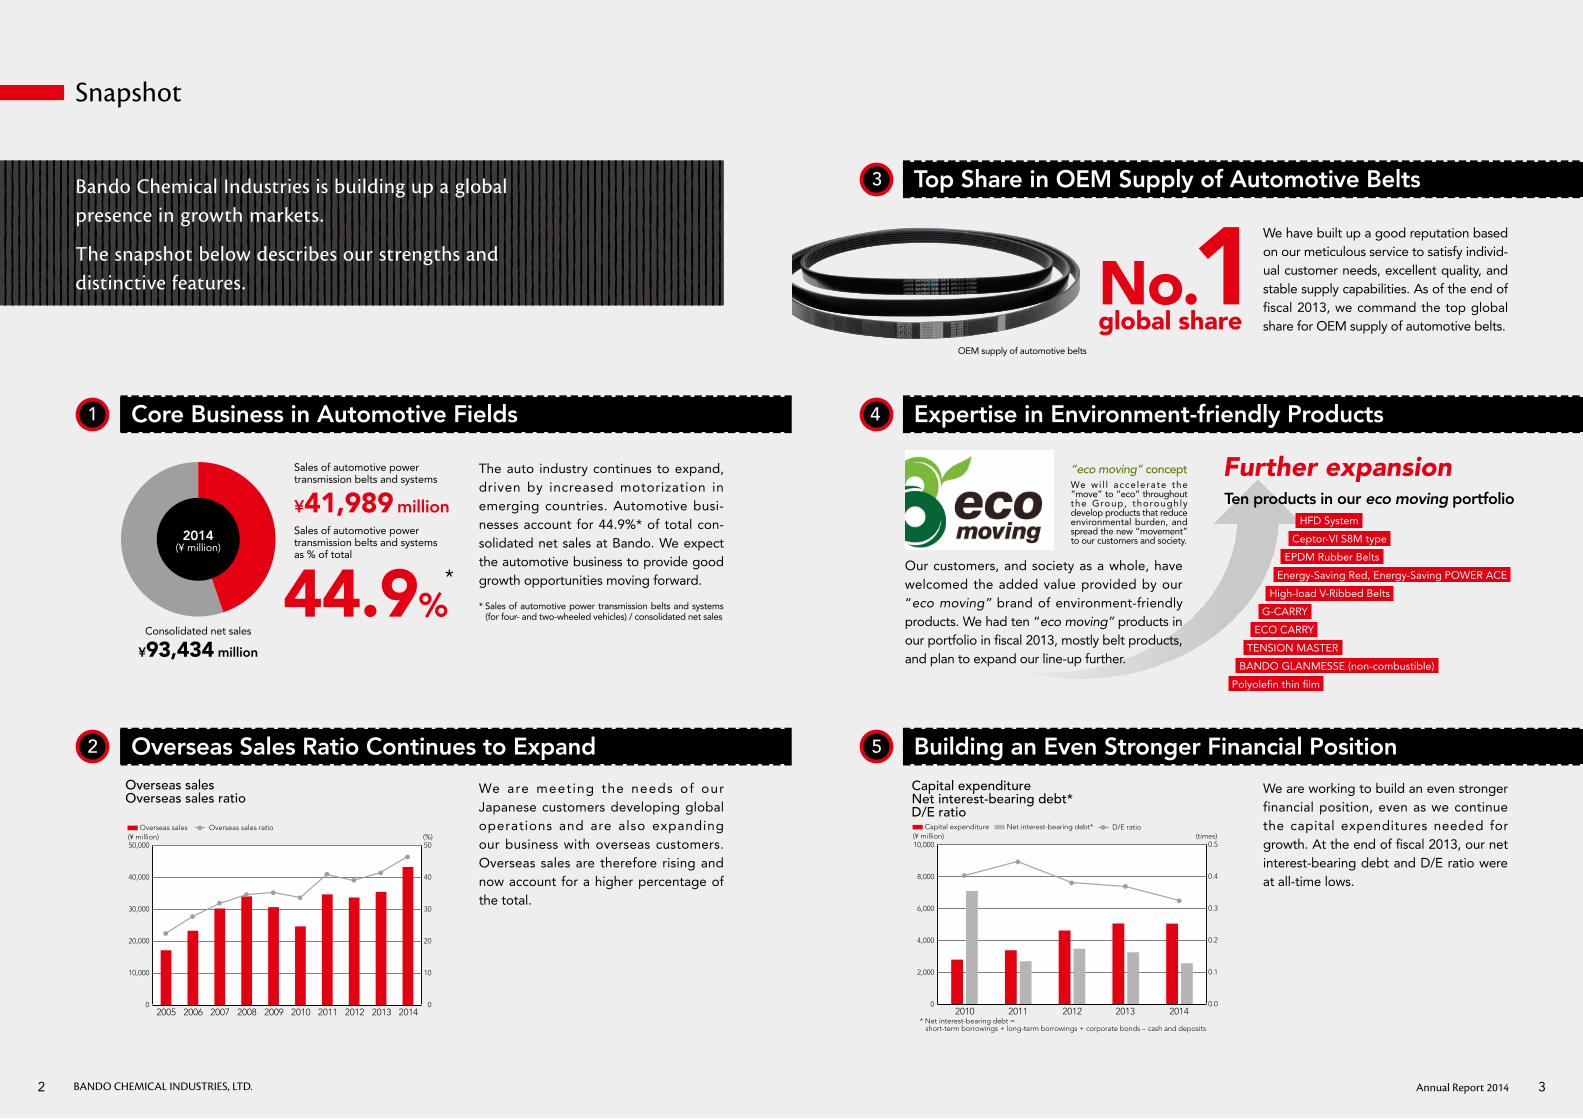
Snapshot
Top Share in OEM Supply of Automotive Belts
No.1 global share
The auto industry continues to expand, driven by increased motorization in emerging countries. Automotive busi-nesses account for 44.9%* of total con-solidated net sales at Bando. We expect the automotive business to provide good growth opportunities moving forward.
Sales of automotive power transmission belts and systems as % of total
Consolidated net sales
*
Sales of automotive power transmission belts and systems
We are meeting the needs of our Japanese customers developing global operations and are also expanding our business with overseas customers. Overseas sales are therefore rising and now account for a higher percentage of the total.
We have built up a good reputation based on our meticulous service to satisfy individ-ual customer needs, excellent quality, and stable supply capabilities. As of the end of fiscal 2013, we command the top global share for OEM supply of automotive belts.
Our customers, and society as a whole, have welcomed the added value provided by our “eco moving” brand of environment-friendly products. We had ten “eco moving” products in our portfolio in fiscal 2013, mostly belt products, and plan to expand our line-up further.
We are working to build an even stronger financial position, even as we continue the capital expenditures needed for growth. At the end of fiscal 2013, our net interest-bearing debt and D/E ratio were at all-time lows.
* Sales of automotive power transmission belts and systems (for four- and two-wheeled vehicles) / consolidated net sales
“eco moving” conceptWe wi l l acce lerate the “move” to “eco” throughout the Group, thoroughly develop products that reduce environmental burden, and spread the new “movement” to our customers and society.
Bando Chemical Industries is building up a global presence in growth markets.
The snapshot below describes our strengths and distinctive features.
1
2
3
4
5
2005 2006 2007 2008 2009 2010 2011 2012 2013 2014
(¥ million) (%)
Overseas salesOverseas sales ratio
Overseas sales Overseas sales ratio
0
10,000
20,000
30,000
40,000
50,000
0
10
20
30
40
50
2010 2011 2012 2013 2014
(¥ million) (times)
Capital expenditure Net interest-bearing debt* D/E ratio
Capital expenditure
* Net interest-bearing debt = short-term borrowings + long-term borrowings + corporate bonds – cash and deposits
Net interest-bearing debt* D/E ratio
0
2,000
4,000
6,000
8,000
10,000
0.0
0.1
0.2
0.3
0.4
0.5
Ten products in our eco moving portfolioHFD System
Ceptor-VI S8M type
EPDM Rubber Belts
Energy-Saving Red, Energy-Saving POWER ACE
High-load V-Ribbed Belts
G-CARRY
ECO CARRY
TENSION MASTER
BANDO GLANMESSE (non-combustible)
Polyolefin thin film
2014(¥ million)
44.9%
¥41,989 million
¥93,434 million
Further expansion
OEM supply of automotive belts
Core Business in Automotive Fields Expertise in Environment-friendly Products
Building an Even Stronger Financial PositionOverseas Sales Ratio Continues to Expand
Annual Report 20142 3BANDO CHEMICAL INDUSTRIES, LTD.
Products
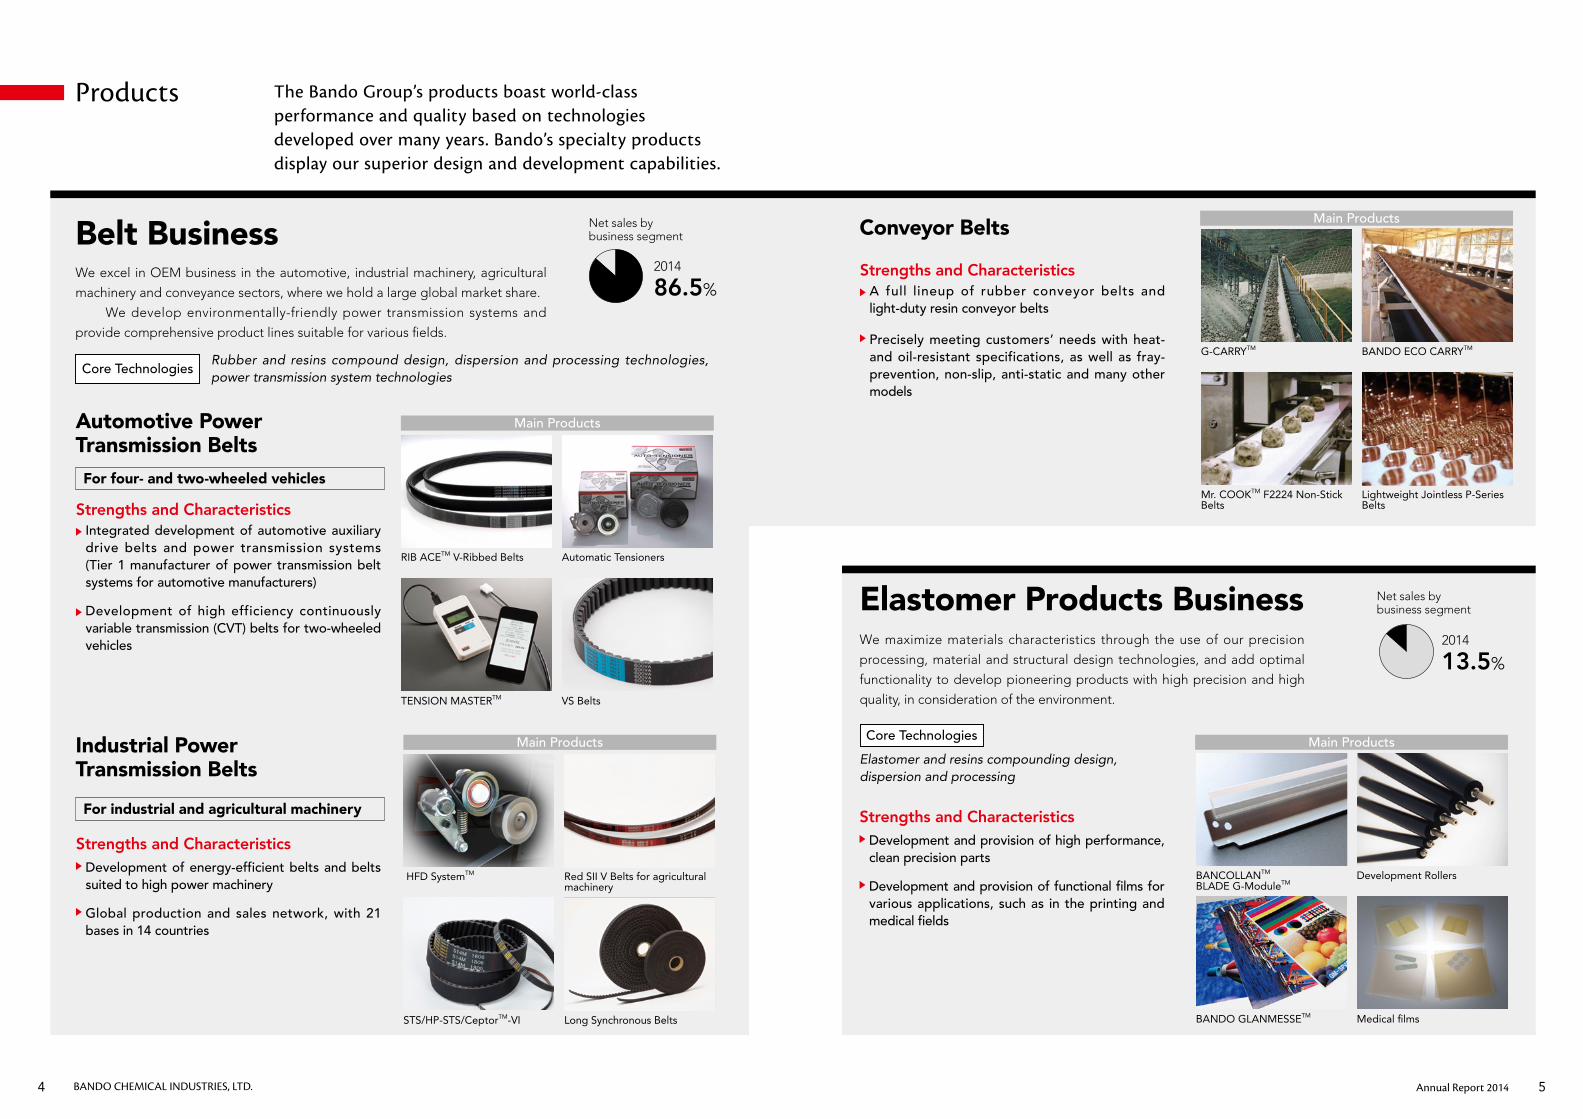
Belt Business
Elastomer Products Business
Automotive Power Transmission BeltsFor four- and two-wheeled vehicles
Strengths and Characteristics Integrated development of automotive auxiliary drive belts and power transmission systems (Tier 1 manufacturer of power transmission belt systems for automotive manufacturers)
Development of high efficiency continuously variable transmission (CVT) belts for two-wheeled vehicles
Conveyor Belts
Strengths and Characteristics A full lineup of rubber conveyor belts and light-duty resin conveyor belts
Precisely meeting customers’ needs with heat- and oil-resistant specifications, as well as fray- prevention, non-slip, anti-static and many other models
Strengths and Characteristics Development and provision of high performance, clean precision parts
Development and provision of functional films for various applications, such as in the printing and medical fields
For industrial and agricultural machinery
Industrial Power Transmission Belts
Strengths and Characteristics Development of energy-efficient belts and belts suited to high power machinery
Global production and sales network, with 21 bases in 14 countries
Main Products
VS Belts
Automatic TensionersRIB ACETM V-Ribbed Belts
TENSION MASTERTM
Main Products
Lightweight Jointless P-Series Belts
BANDO ECO CARRYTMG-CARRYTM
Mr. COOKTM F2224 Non-Stick Belts
Main Products
Medical films
Development RollersBANCOLLANTM BLADE G-ModuleTM
BANDO GLANMESSETM
Main Products
Long Synchronous Belts
Red SII V Belts for agricultural machinery
HFD SystemTM
STS/HP-STS/CeptorTM-VI
We excel in OEM business in the automotive, industrial machinery, agricultural
machinery and conveyance sectors, where we hold a large global market share.
We develop environmentally-friendly power transmission systems and
provide comprehensive product lines suitable for various fields.
Rubber and resins compound design, dispersion and processing technologies, power transmission system technologies
We maximize materials characteristics through the use of our precision
processing, material and structural design technologies, and add optimal
functionality to develop pioneering products with high precision and high
quality, in consideration of the environment.
Elastomer and resins compounding design, dispersion and processing
The Bando Group’s products boast world-class performance and quality based on technologies developed over many years. Bando’s specialty products display our superior design and development capabilities.
Core Technologies
Core Technologies
Net sales by business segment
2014
86.5%
Net sales by business segment
2014
13.5%
Annual Report 20144 5BANDO CHEMICAL INDUSTRIES, LTD.
History
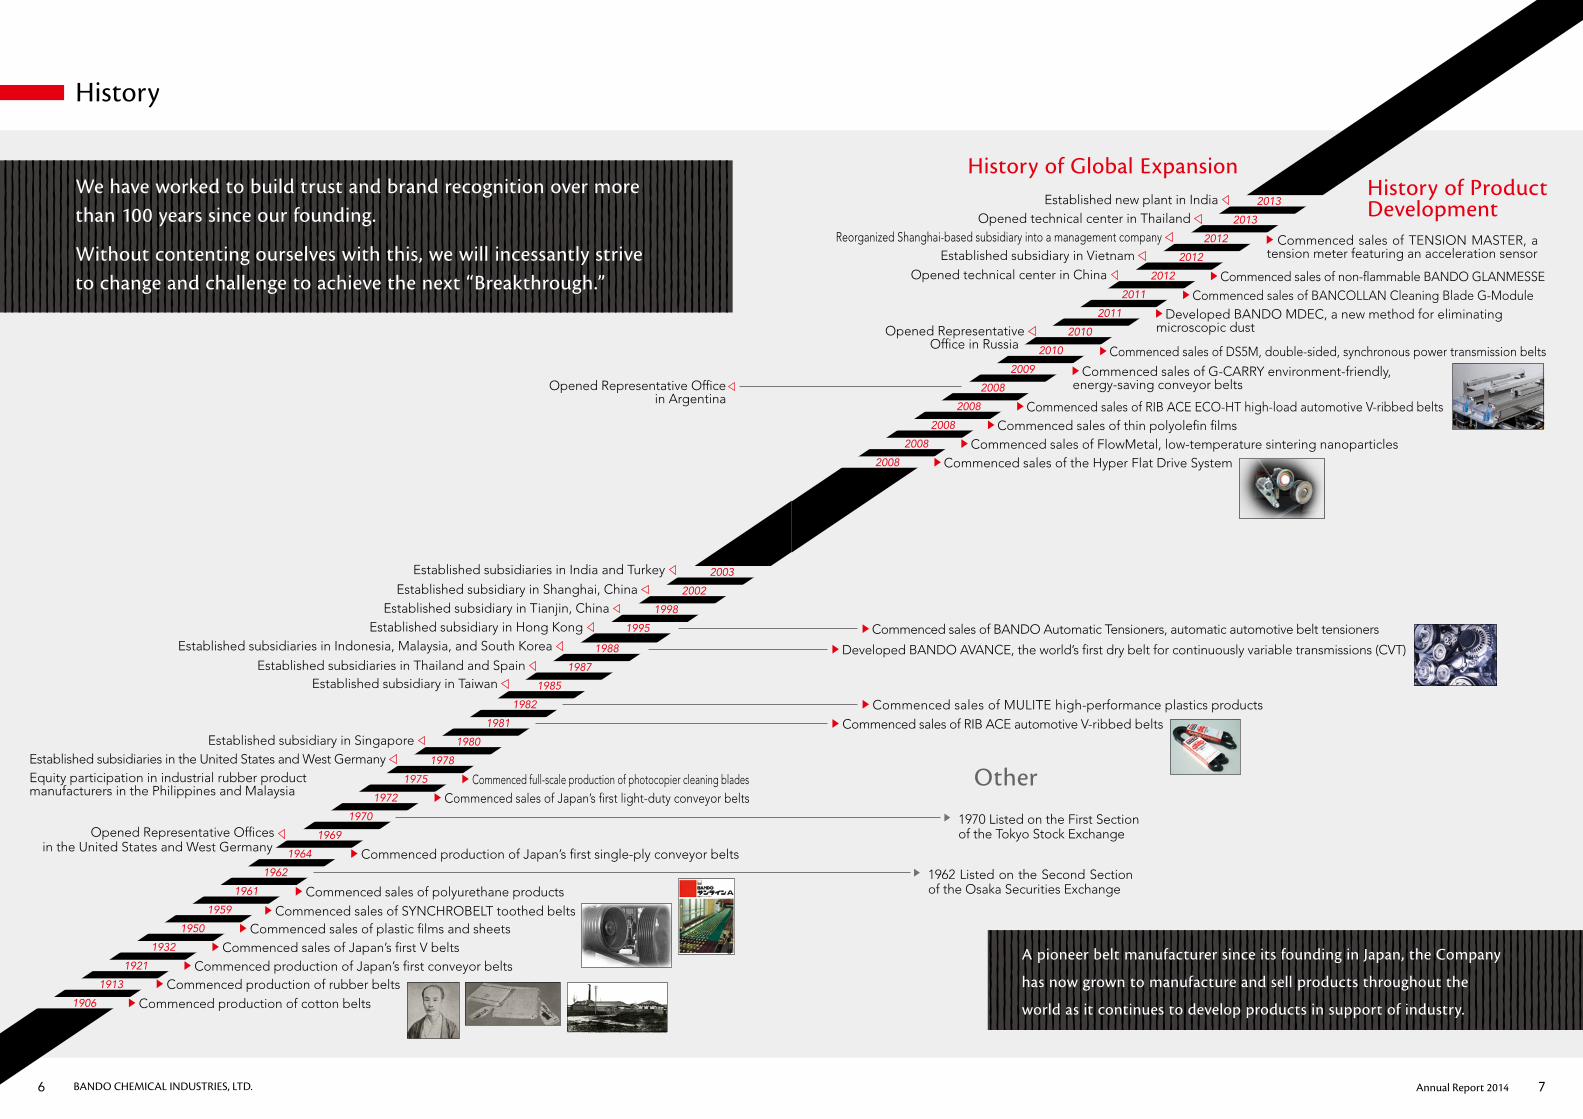
We have worked to build trust and brand recognition over more than 100 years since our founding.
Without contenting ourselves with this, we will incessantly strive to change and challenge to achieve the next “Breakthrough.”
A pioneer belt manufacturer since its founding in Japan, the Company
has now grown to manufacture and sell products throughout the
world as it continues to develop products in support of industry.
1988
1987
1985
1982
1981
1980
1978
1975
1972
1970
1969
1964
1962
1961
1959
1950
1932
1921
1913
1906
1970 Listed on the First Section of the Tokyo Stock Exchange
1962 Listed on the Second Section of the Osaka Securities Exchange
Other
Commenced production of cotton belts
Commenced production of rubber belts
Commenced production of Japan’s first conveyor belts
Commenced sales of Japan’s first V belts
Commenced sales of plastic films and sheets
Commenced sales of SYNCHROBELT toothed belts
Commenced sales of polyurethane products
Commenced production of Japan’s first single-ply conveyor belts
Commenced sales of Japan’s first light-duty conveyor belts
Commenced full-scale production of photocopier cleaning blades
Commenced sales of RIB ACE automotive V-ribbed belts
Commenced sales of MULITE high-performance plastics products
Developed BANDO AVANCE, the world’s first dry belt for continuously variable transmissions (CVT)
Opened Representative Offices in the United States and West Germany
Established subsidiaries in the United States and West Germany Established subsidiary in Singapore
Established subsidiary in Taiwan Established subsidiaries in Thailand and Spain
Established subsidiaries in Indonesia, Malaysia, and South Korea
2013
2012
2012
2012
2011
2011
2010
2010
2009
2008
2008
2008
2008
2008
1995 Commenced sales of BANDO Automatic Tensioners, automatic automotive belt tensioners
Commenced sales of the Hyper Flat Drive System
Commenced sales of FlowMetal, low-temperature sintering nanoparticles
Commenced sales of thin polyolefin films
Commenced sales of G-CARRY environment-friendly, energy-saving conveyor belts
Commenced sales of DS5M, double-sided, synchronous power transmission belts
Developed BANDO MDEC, a new method for eliminating microscopic dust
Commenced sales of BANCOLLAN Cleaning Blade G-Module
Commenced sales of non-flammable BANDO GLANMESSE
Commenced sales of RIB ACE ECO-HT high-load automotive V-ribbed belts
2003
2002
1998
Established subsidiary in Shanghai, China
Established subsidiary in Tianjin, China
Established subsidiary in Hong Kong
Established subsidiaries in India and Turkey
Opened Representative Office in Argentina
Opened Representative Office in Russia
Opened technical center in China Established subsidiary in Vietnam
Reorganized Shanghai-based subsidiary into a management company
2013
Opened technical center in Thailand Established new plant in India
Equity participation in industrial rubber product manufacturers in the Philippines and Malaysia
History of Global ExpansionHistory of Product Development
Commenced sales of TENSION MASTER, a tension meter featuring an acceleration sensor
Annual Report 20146 7BANDO CHEMICAL INDUSTRIES, LTD.
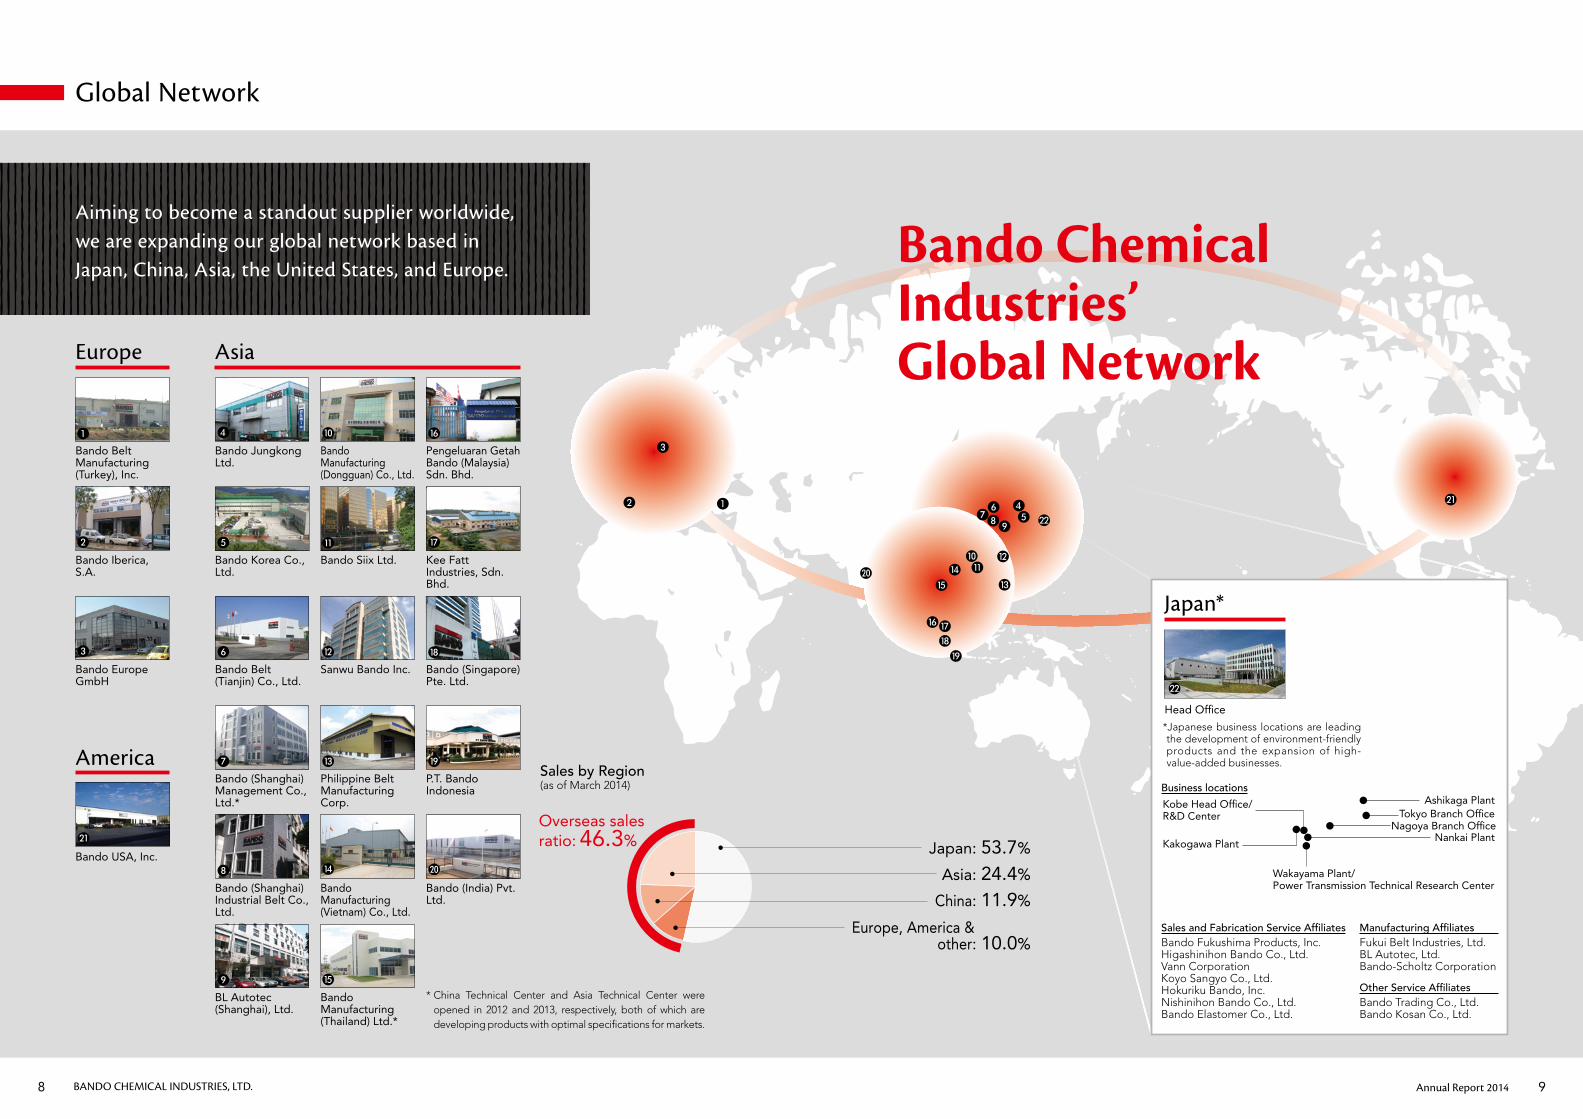
Japan: 53.7%
Overseas sales ratio: 46.3%
Asia: 24.4%
China: 11.9%
Europe, America & other: 10.0%
Global Network
Europe Asia
Aiming to become a standout supplier worldwide, we are expanding our global network based in Japan, China, Asia, the United States, and Europe.
Bando Jungkong Ltd.
Bando Belt Manufacturing (Turkey), Inc.
Bando Manufacturing (Dongguan) Co., Ltd.
Pengeluaran Getah Bando (Malaysia) Sdn. Bhd.
Bando Korea Co., Ltd.
Sales by Region(as of March 2014)
Bando Iberica, S.A.
Bando Siix Ltd. Kee Fatt Industries, Sdn. Bhd.
Bando Belt (Tianjin) Co., Ltd.
Bando Europe GmbH
Sanwu Bando Inc. Bando (Singapore) Pte. Ltd.
Bando (Shanghai) Management Co., Ltd.*
Philippine Belt Manufacturing Corp.
P.T. Bando Indonesia
Bando (Shanghai) Industrial Belt Co., Ltd.
Bando Manufacturing (Vietnam) Co., Ltd.
Bando (India) Pvt. Ltd.
BL Autotec (Shanghai), Ltd.
Bando Manufacturing (Thailand) Ltd.*
* China Technical Center and Asia Technical Center were opened in 2012 and 2013, respectively, both of which are developing products with optimal specifications for markets.
Bando Chemical Industries’ Global Network
Bando USA, Inc.
America
Sales and Fabrication Service Affiliates Bando Fukushima Products, Inc.Higashinihon Bando Co., Ltd.Vann CorporationKoyo Sangyo Co., Ltd.Hokuriku Bando, Inc.Nishinihon Bando Co., Ltd. Bando Elastomer Co., Ltd.
Business locations
*Japanese business locations are leading the development of environment-friendly products and the expansion of high-value-added businesses.
Head Office
Japan*
Manufacturing AffiliatesFukui Belt Industries, Ltd.BL Autotec, Ltd. Bando-Scholtz Corporation
Other Service AffiliatesBando Trading Co., Ltd.Bando Kosan Co., Ltd.
Kobe Head Office/ R&D Center
Kakogawa Plant
Wakayama Plant/Power Transmission Technical Research Center
Nankai Plant
Tokyo Branch OfficeNagoya Branch Office
Ashikaga Plant
Annual Report 20148 9BANDO CHEMICAL INDUSTRIES, LTD.
Highlights
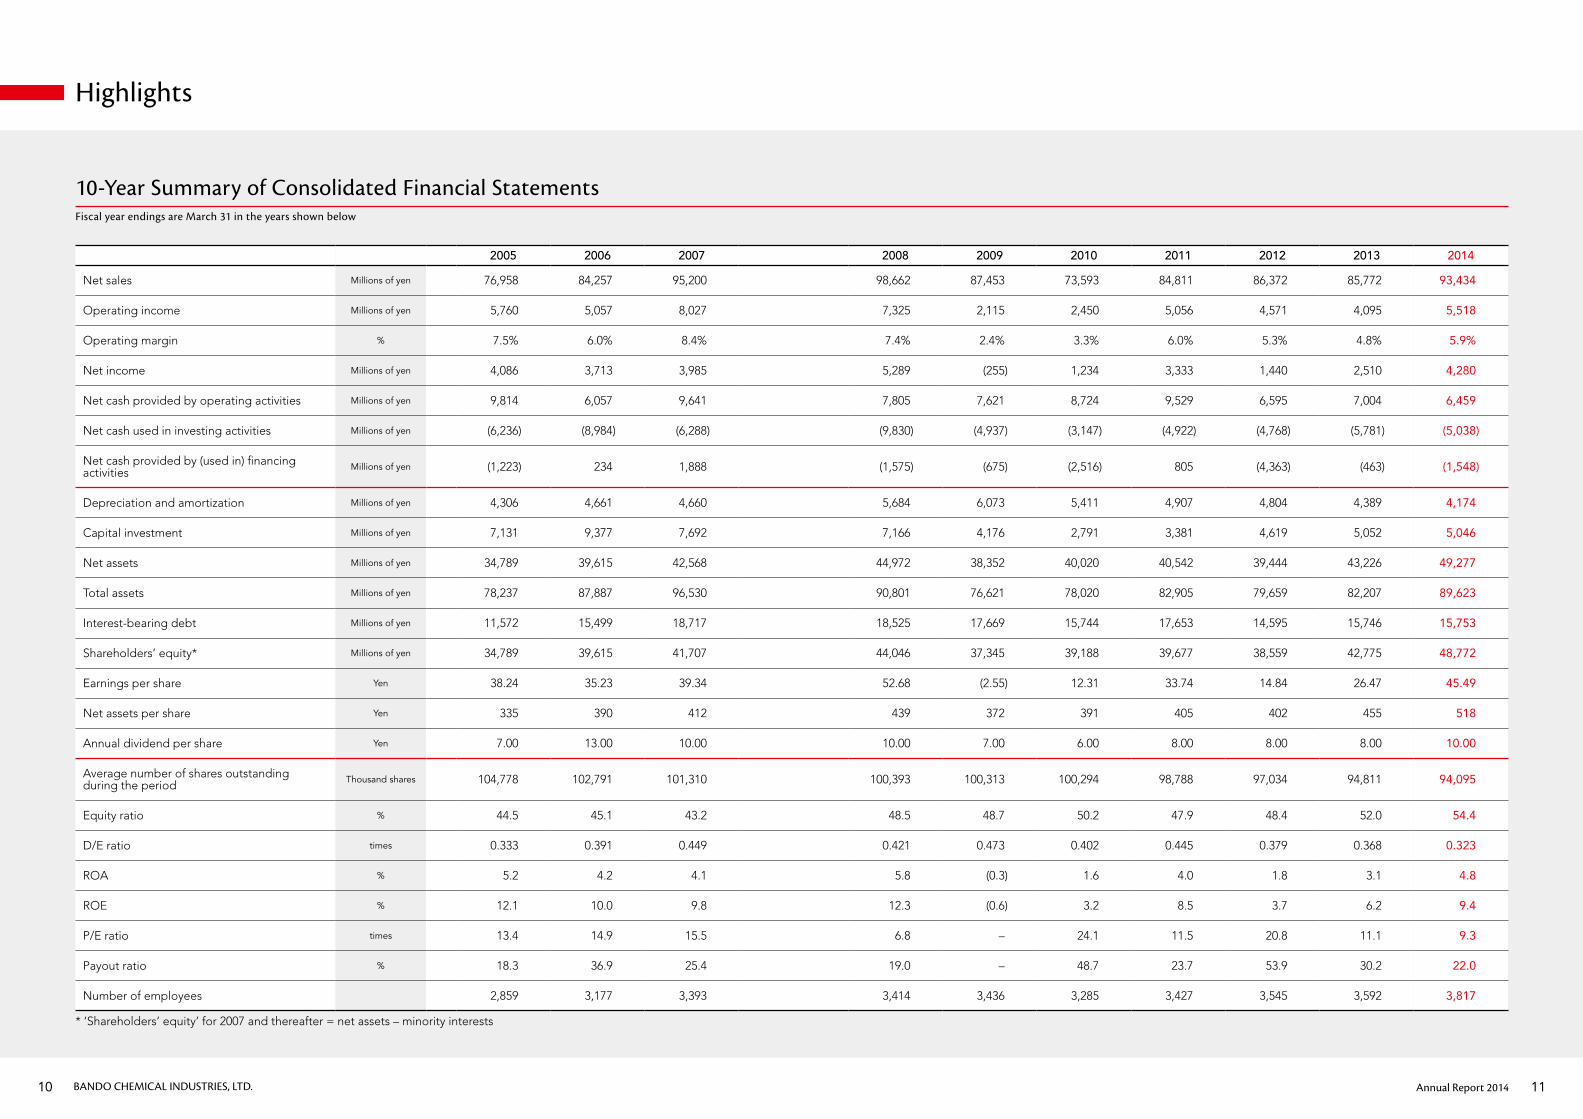
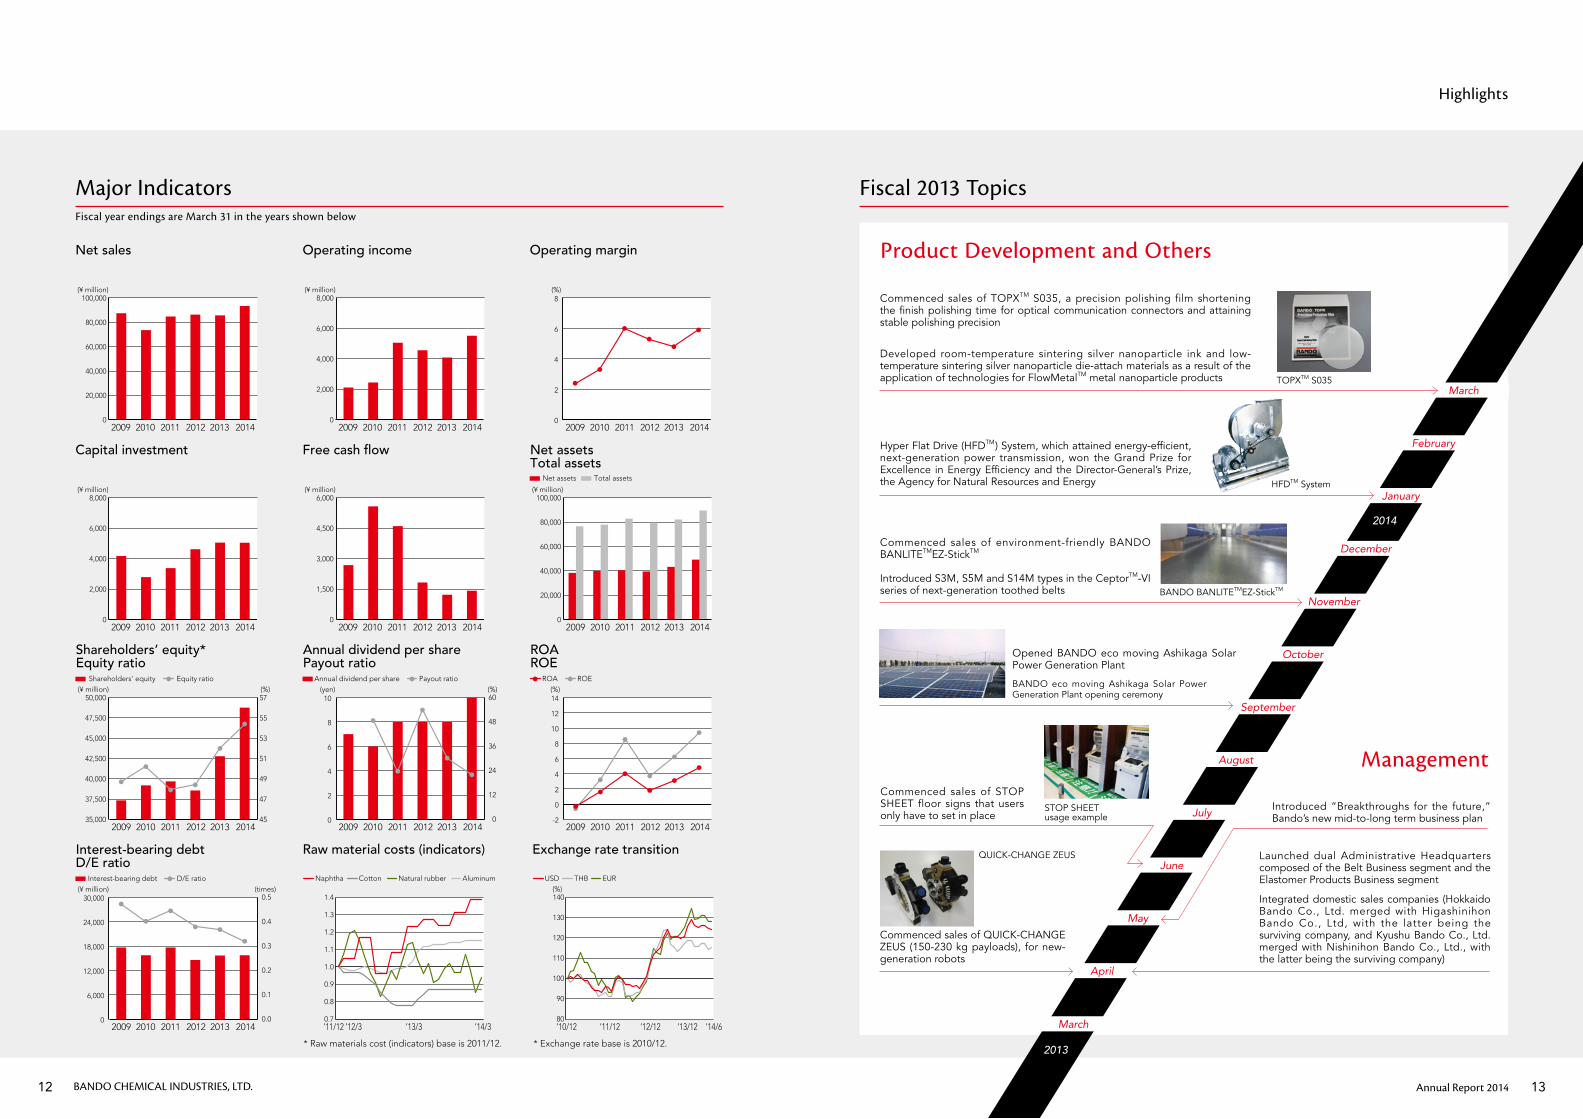
10–Year Summary of Consolidated Financial StatementsFiscal year endings are March 31 in the years shown below
2005 2006 2007 2008 2009 2010 2011 2012 2013 2014
Net sales Millions of yen 76,958 84,257 95,200 98,662 87,453 73,593 84,811 86,372 85,772 93,434
Operating income Millions of yen 5,760 5,057 8,027 7,325 2,115 2,450 5,056 4,571 4,095 5,518
Operating margin % 7.5% 6.0% 8.4% 7.4% 2.4% 3.3% 6.0% 5.3% 4.8% 5.9%
Net income Millions of yen 4,086 3,713 3,985 5,289 (255) 1,234 3,333 1,440 2,510 4,280
Net cash provided by operating activities Millions of yen 9,814 6,057 9,641 7,805 7,621 8,724 9,529 6,595 7,004 6,459
Net cash used in investing activities Millions of yen (6,236) (8,984) (6,288) (9,830) (4,937) (3,147) (4,922) (4,768) (5,781) (5,038)
Net cash provided by (used in) financing activities Millions of yen (1,223) 234 1,888 (1,575) (675) (2,516) 805 (4,363) (463) (1,548)
Depreciation and amortization Millions of yen 4,306 4,661 4,660 5,684 6,073 5,411 4,907 4,804 4,389 4,174
Capital investment Millions of yen 7,131 9,377 7,692 7,166 4,176 2,791 3,381 4,619 5,052 5,046
Net assets Millions of yen 34,789 39,615 42,568 44,972 38,352 40,020 40,542 39,444 43,226 49,277
Total assets Millions of yen 78,237 87,887 96,530 90,801 76,621 78,020 82,905 79,659 82,207 89,623
Interest-bearing debt Millions of yen 11,572 15,499 18,717 18,525 17,669 15,744 17,653 14,595 15,746 15,753
Shareholders’ equity* Millions of yen 34,789 39,615 41,707 44,046 37,345 39,188 39,677 38,559 42,775 48,772
Earnings per share Yen 38.24 35.23 39.34 52.68 (2.55) 12.31 33.74 14.84 26.47 45.49
Net assets per share Yen 335 390 412 439 372 391 405 402 455 518
Annual dividend per share Yen 7.00 13.00 10.00 10.00 7.00 6.00 8.00 8.00 8.00 10.00
Average number of shares outstanding during the period Thousand shares 104,778 102,791 101,310 100,393 100,313 100,294 98,788 97,034 94,811 94,095
Equity ratio % 44.5 45.1 43.2 48.5 48.7 50.2 47.9 48.4 52.0 54.4
D/E ratio times 0.333 0.391 0.449 0.421 0.473 0.402 0.445 0.379 0.368 0.323
ROA % 5.2 4.2 4.1 5.8 (0.3) 1.6 4.0 1.8 3.1 4.8
ROE % 12.1 10.0 9.8 12.3 (0.6) 3.2 8.5 3.7 6.2 9.4
P/E ratio times 13.4 14.9 15.5 6.8 – 24.1 11.5 20.8 11.1 9.3
Payout ratio % 18.3 36.9 25.4 19.0 – 48.7 23.7 53.9 30.2 22.0
Number of employees 2,859 3,177 3,393 3,414 3,436 3,285 3,427 3,545 3,592 3,817
* ‘Shareholders’ equity’ for 2007 and thereafter = net assets – minority interests
Annual Report 201410 11BANDO CHEMICAL INDUSTRIES, LTD.
2009 2010 2011 2012 2013 2014
(¥ million)
Net sales
0
20,000
40,000
60,000
80,000
100,000
2009 2010 2011 2012 2013 2014
(¥ million)
Capital investment
0
2,000
4,000
6,000
8,000
2009 2010 2011 2012 2013 2014
(¥ million) (times)
Interest-bearing debtD/E ratio
0.0
0.1
0.2
0.3
0.4
0.5
0
6,000
12,000
18,000
24,000
30,000
Interest-bearing debt D/E ratio
2009 2010 2011 2012 2013 2014
(¥ million)
Operating income
0
2,000
4,000
6,000
8,000
2009 2010 2011 2012 2013 2014
(¥ million)
Free cash �ow
0
1,500
3,000
4,500
6,000
2009 2010 2011 2012 2013 2014
(yen) (%)
Annual dividend per sharePayout ratio
0
12
24
36
48
60
0
2
4
6
8
10
Annual dividend per share Payout ratio
’12/3 ’13/3’11/12 ’14/3
Raw material costs (indicators)
Naphtha Cotton Natural rubber Aluminum
0.7
0.8
0.9
1.0
1.1
1.2
1.3
1.4
’10/12 ’11/12 ’12/12 ’13/12 ’14/6
(%)
Exchange rate transition
USD THB EUR
80
90
100
110
120
130
140
2009 2010 2011 2012 2013 2014
(%)
Operating margin
0
2
4
6
8
2009 2010 2011 2012 2013 2014
(¥ million)
Net assetsTotal assets
0
20,000
40,000
60,000
80,000
100,000
Net assets Total assets
2009 2010 2011 2012 2013 2014
(%)
ROAROE
-2
0
2
6
4
10
8
14
12
ROA ROE
2009 2010 2011 2012 2013 2014
(¥ million) (%)
Shareholders’ equity*Equity ratio
Shareholders’ equity Equity ratio
35,000
37,500
40,000
42,500
45,000
47,500
50,000
45
47
49
51
53
55
57
Major Indicators Fiscal 2013 TopicsFiscal year endings are March 31 in the years shown below
* Raw materials cost (indicators) base is 2011/12. * Exchange rate base is 2010/12.
Highlights
Product Development and Others
Commenced sales of TOPXTM S035, a precision polishing film shortening the finish polishing time for optical communication connectors and attaining stable polishing precision
Developed room-temperature sintering silver nanoparticle ink and low- temperature sintering silver nanoparticle die-attach materials as a result of the application of technologies for FlowMetalTM metal nanoparticle products
March
February
January
December
November
October
September
August
July
June
May
April
March
2013
2014
Introduced “Breakthroughs for the future,” Bando’s new mid-to-long term business plan
Launched dual Administrative Headquarters composed of the Belt Business segment and the Elastomer Products Business segment
Integrated domestic sales companies (Hokkaido Bando Co., Ltd. merged with Higashinihon Bando Co., Ltd, with the latter being the surviving company, and Kyushu Bando Co., Ltd. merged with Nishinihon Bando Co., Ltd., with the latter being the surviving company)
Management
TOPXTM S035
Commenced sales of environment-friendly BANDO BANLITETMEZ-StickTM
Introduced S3M, S5M and S14M types in the CeptorTM-VI series of next-generation toothed belts BANDO BANLITETMEZ-StickTM
Hyper Flat Drive (HFDTM) System, which attained energy-efficient, next-generation power transmission, won the Grand Prize for Excellence in Energy Efficiency and the Director-General’s Prize, the Agency for Natural Resources and Energy
Opened BANDO eco moving Ashikaga Solar Power Generation Plant
Commenced sales of STOP SHEET floor signs that users only have to set in place
Commenced sales of QUICK-CHANGE ZEUS (150-230 kg payloads), for new- generation robots
STOP SHEET usage example
BANDO eco moving Ashikaga Solar Power Generation Plant opening ceremony
QUICK-CHANGE ZEUS
HFDTM System
Annual Report 201412 13BANDO CHEMICAL INDUSTRIES, LTD.
To Our Stakeholders and Investors
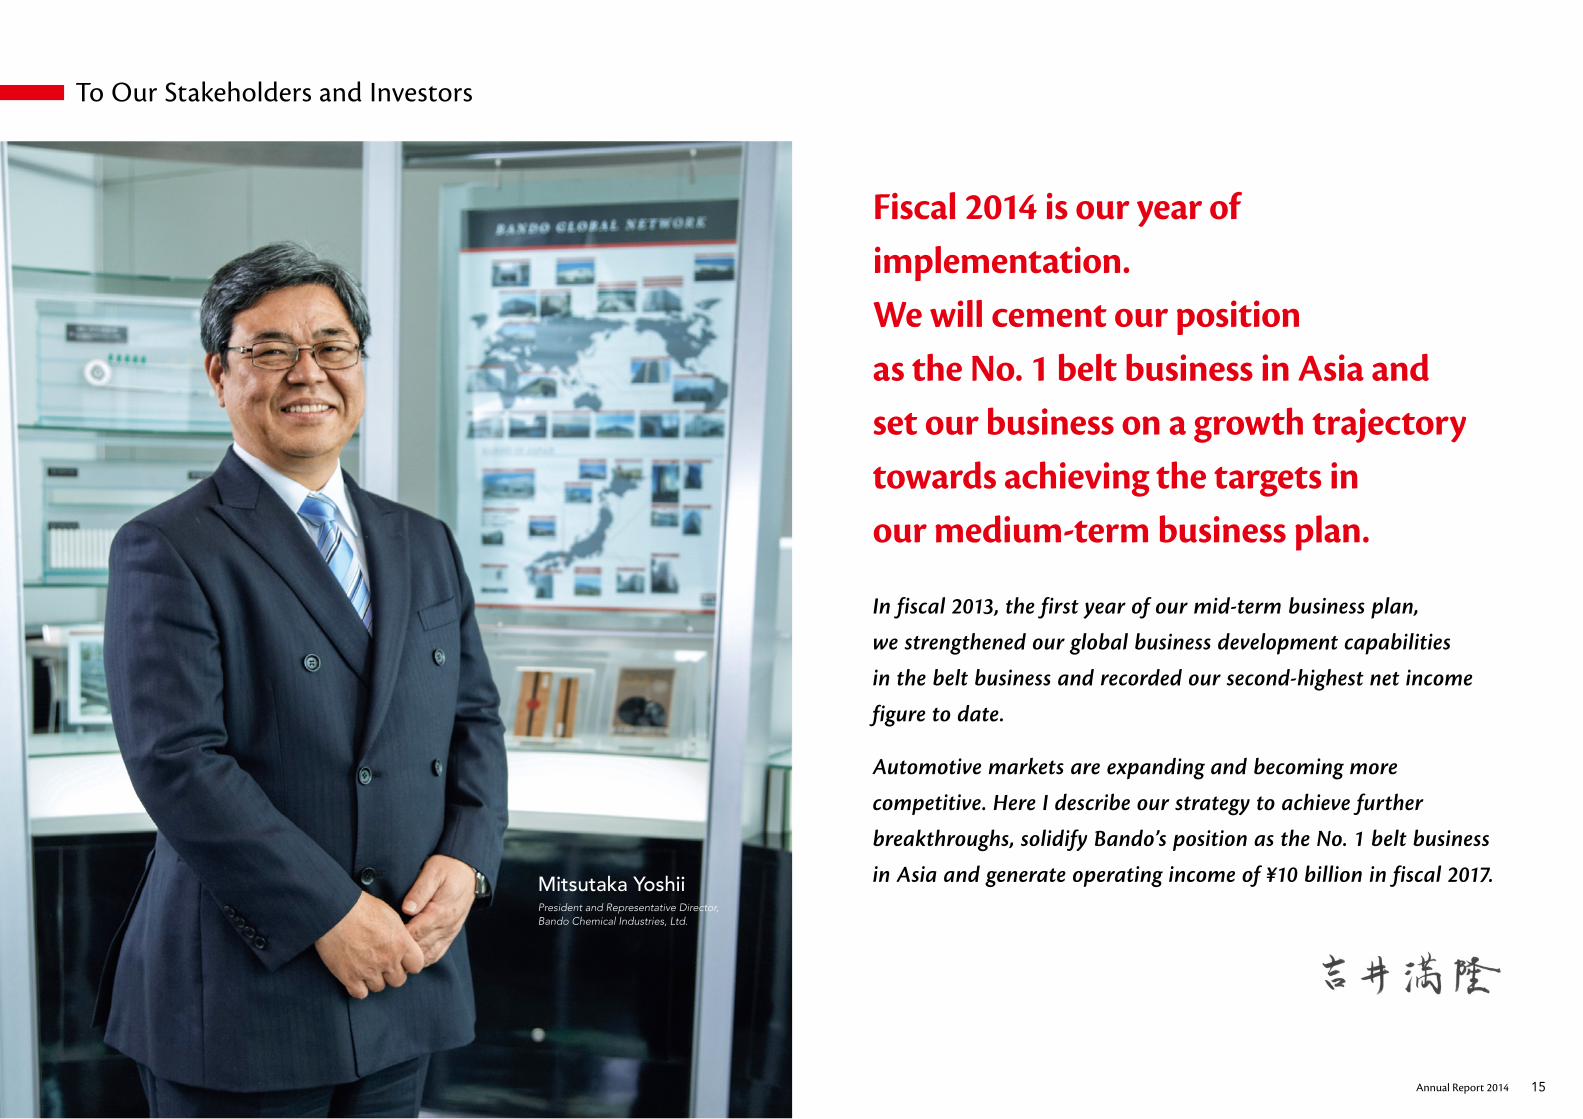
Fiscal 2014 is our year of implementation. We will cement our position as the No. 1 belt business in Asia and set our business on a growth trajectory towards achieving the targets in our medium-term business plan.
In fiscal 2013, the first year of our mid-term business plan,
we strengthened our global business development capabilities
in the belt business and recorded our second-highest net income
figure to date.
Automotive markets are expanding and becoming more
competitive. Here I describe our strategy to achieve further
breakthroughs, solidify Bando’s position as the No. 1 belt business
in Asia and generate operating income of ¥10 billion in fiscal 2017.Mitsutaka YoshiiPresident and Representative Director,Bando Chemical Industries, Ltd.
Annual Report 2014 15
Message from the President
Fiscal 2013 was the first year in our mid-to-long term
business plan “Breakthroughs for the future.” Belt
Business sales grew 10.7% year-on-year to ¥80,034
million and segment profit grew 18.8% year-on-year
to ¥5,161 million, primarily due to sales growth over-
seas for our automotive power transmission belts,
industrial power transmission belts, and conveyor
belts. We attribute this to our efforts to implement
the guidelines set out in the business plan.
In our Elastomer Products Business, where we
have focused on transforming our product portfolio,
sales rose 0.5% year-on-year to ¥12,438 million and
segment profit improved by ¥174 million, moving from
an operating loss last year to profit of ¥12 million.
As a result, consolidated operating income
improved 34.8% year-on-year to ¥5,518 million. Forex
gains and the absence of extraordinary losses booked
last year meant net income rose 70.5% to ¥4,280
million. This is our second-highest net income figure
after the record-breaking ¥5,289 million we recorded
in fiscal 2007 shortly before the collapse of Lehman
Brothers.
We increased the dividend for the first time in
three years to an annual dividend of ¥10 per share,
which is on a par with the dividend paid in fiscal 2007
before the global financial crisis.
The “Breakthroughs for the future” mid-to-long term
business plan, which runs from fiscal 2013 to fiscal
2022, aims to further refine our core technologies
and reliable product quality in the fields of rubber,
elastomers, and resins—where we have built up an
extensive fund of expertise since the Company’s
founding—to become a standout supplier of belts
and high-performance products in the global market.
In the first stage of the plan, from fiscal 2013 to
fiscal 2017, we will work to expand the Group’s over-
seas operations, particularly in the belt business, and
strengthen earnings structures while also focusing
on new product development. In the second stage,
from fiscal 2018 to fiscal 2022, we will create new
business to make a contribution equal in importance
to our belt business. Leveraging the two earnings
drivers, we will concentrate on expanding earnings
to become a truly global supplier with net sales of
around ¥150 billion.
In fiscal 2013 in the first stage, operating income
was slightly below the initial target due to inventory
valuation losses, but sales were above target due to
focused business development in China and Asia
and new products that utilize our core technologies
starting to generate results. From the second year
of the plan in fiscal 2014, we recognize that the
Company will need to work harder, as earnings will
no longer receive a boost from forex factors. The
steady implementation of the guidelines in the mid-
to-long term business plan should set our business
on a growth trajectory towards our targets.
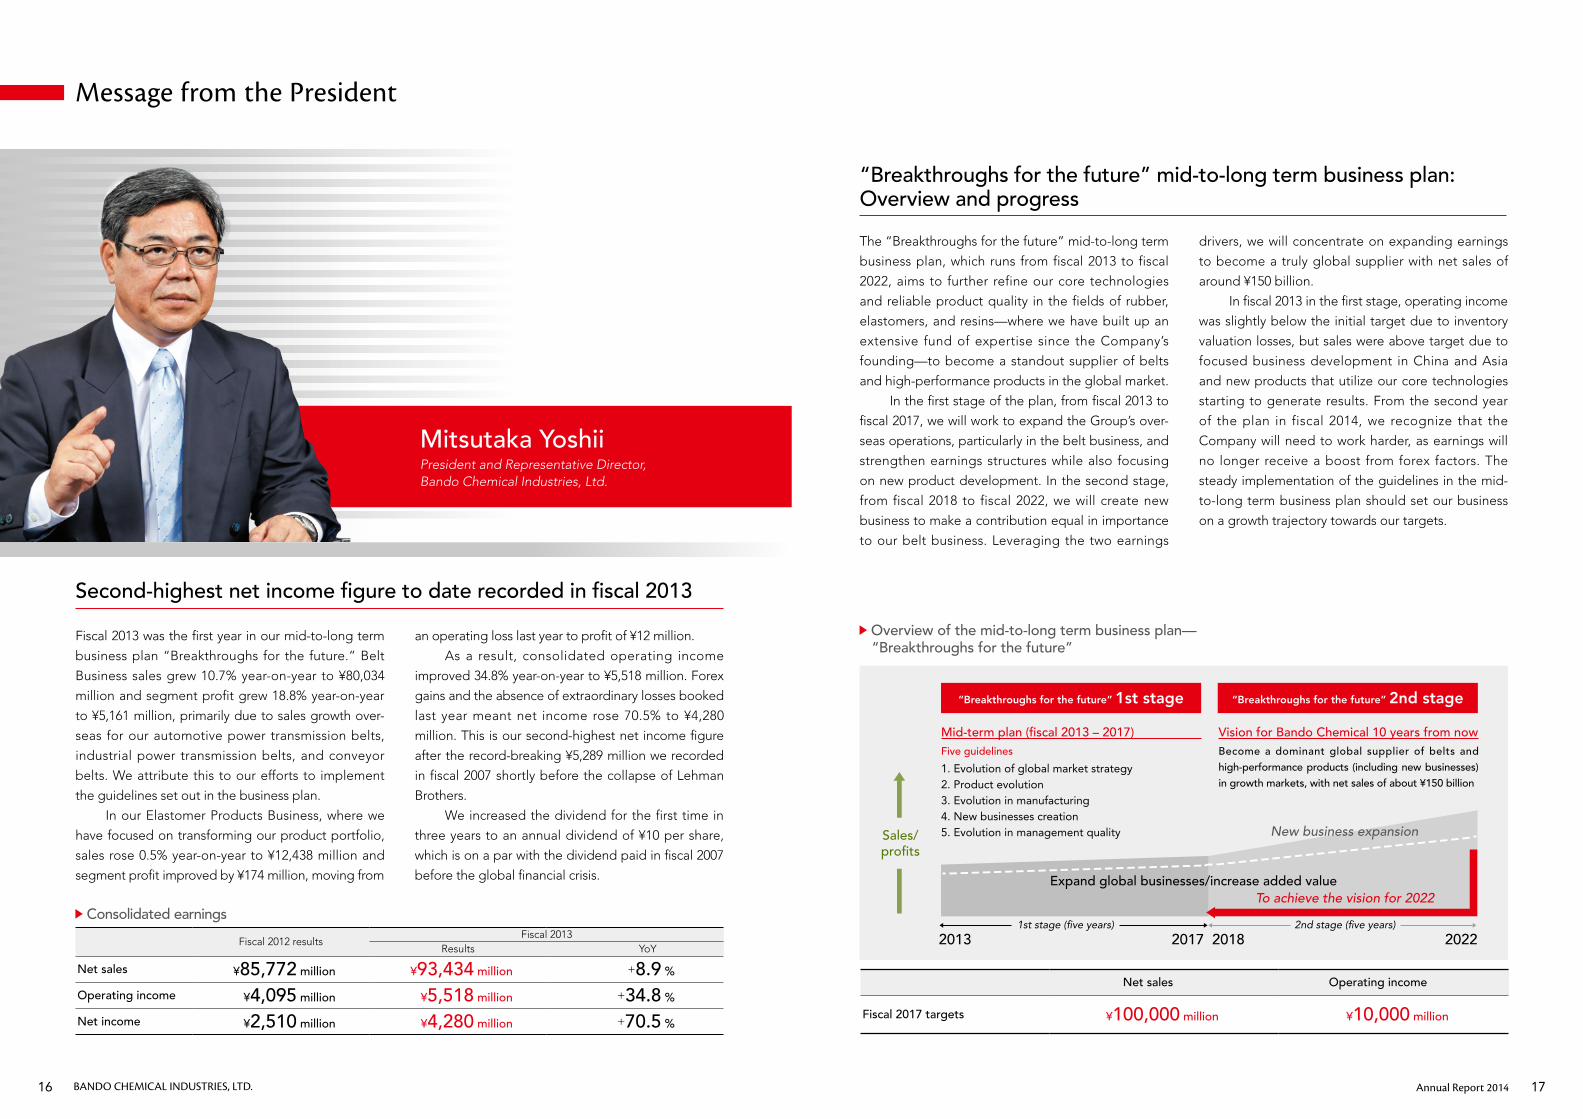
Consolidated earnings
Fiscal 2012 resultsFiscal 2013
Results YoY
Net sales ¥85,772 million ¥93,434 million +8.9 %
Operating income ¥4,095 million ¥5,518 million +34.8 %
Net income ¥2,510 million ¥4,280 million +70.5 %
Net sales Operating income
Fiscal 2017 targets ¥100,000 million ¥10,000 million
Mitsutaka YoshiiPresident and Representative Director,Bando Chemical Industries, Ltd.
Overview of the mid-to-long term business plan— “Breakthroughs for the future”
“Breakthroughs for the future” 1st stage “Breakthroughs for the future” 2nd stage
Mid-term plan (fiscal 2013 – 2017) Five guidelines
1. Evolution of global market strategy2. Product evolution3. Evolution in manufacturing4. New businesses creation5. Evolution in management quality
Vision for Bando Chemical 10 years from nowBecome a dominant global supplier of belts and high-performance products (including new businesses) in growth markets, with net sales of about ¥150 billion
Expand global businesses/increase added valueTo achieve the vision for 2022
Sales/profits
2013 2017 2018 20221st stage (five years) 2nd stage (five years)
New business expansion
Second-highest net income figure to date recorded in fiscal 2013
“Breakthroughs for the future” mid-to-long term business plan: Overview and progress
Annual Report 201416 17BANDO CHEMICAL INDUSTRIES, LTD.
Message from the President
Bando’s portfolio includes many products with the
top share of the global market, including automotive
belts for OEM supply, CVT belts for two-wheeled
vehicles, and polyurethane rubber parts for printers.
Sales of our agricultural machinery belts are also
growing in China and Asia because of the excellent
quality of our products. Our ¥10 billion target for
operating income in fiscal 2017 may appear rather
ambitious, but we think it is within range if we focus
on the measures discussed below and leverage our
competitive capabilities backed by our high global
share.
In the first stage, we aim to accelerate sales in
the growth markets of China and Asia. Fiscal 2013
sales rose 45.2% year-on-year to ¥11,092 million in
China and 13.7% to ¥22,781 million in Asia, helped
by volume manufacturing as new production
facilities started operating in China, Thailand, India,
Vietnam, and Indonesia. We plan to expand our pro-
duction capacity further and increase total sales in
China and Asia by an additional ¥20 billion by fiscal
2017, laying the foundations for Bando to solidify
our top position in Asian markets.
As well as focusing on greater “volume,” the
Company must also make further improvements
in “quality” (added value, profitability) if we are to
make our operating income target of ¥10 billion.
To achieve this, we are working on guidelines 2
and 3, namely product evolution and evolution in
manufacturing, and are working to expand aftermar-
ket sales to improve profitability.
In terms of product evolution, we are stepping
up development of environmentally friendly, energy-
efficient, and high-performance products, such as
our BANDO MDECTM cleaning system, our precision
polishing product TOPXTM S035, and our HFD
SystemTM that has been awarded the Grand Prize for
Excellence in Energy Efficiency. We are also working
to develop and launch products with optimal
specifications for particular markets in shorter time
frames. We are expanding services at our technical
centers in China and Thailand to strengthen our
local marketing presence and enhancing assessment
facilities to satisfy local needs. We therefore expect
to grow operating income by around ¥1 billion by
fiscal 2017.
In terms of evolution in manufacturing, we
have established the Cost Planning Department and
improved the accuracy of cost control to make our
products more cost competitive. We also reduced
costs by updating manufacturing methods and
production facilities. In material purchasing, we are
promoting development purchasing* for functional
materials (e.g., carbon, urethane, EPDM, and CR).
Through these efforts, we aim to achieve the cost
ratio below 70% and grow operating income by
around ¥1.5 billion by fiscal 2017.
As well as efforts to reduce costs, we are also
focusing on aftermarkets. Along with our OEM sales
expansion we have established distributor networks
in China, Asia, and elsewhere to expand high-margin
aftermarket sales (repair and replacement), and raise
profitability in the automotive power transmission
belt business as a whole.* Procurement Department involvement from the development stages, so
that decisions on materials are made in consideration of supply stability and cost.
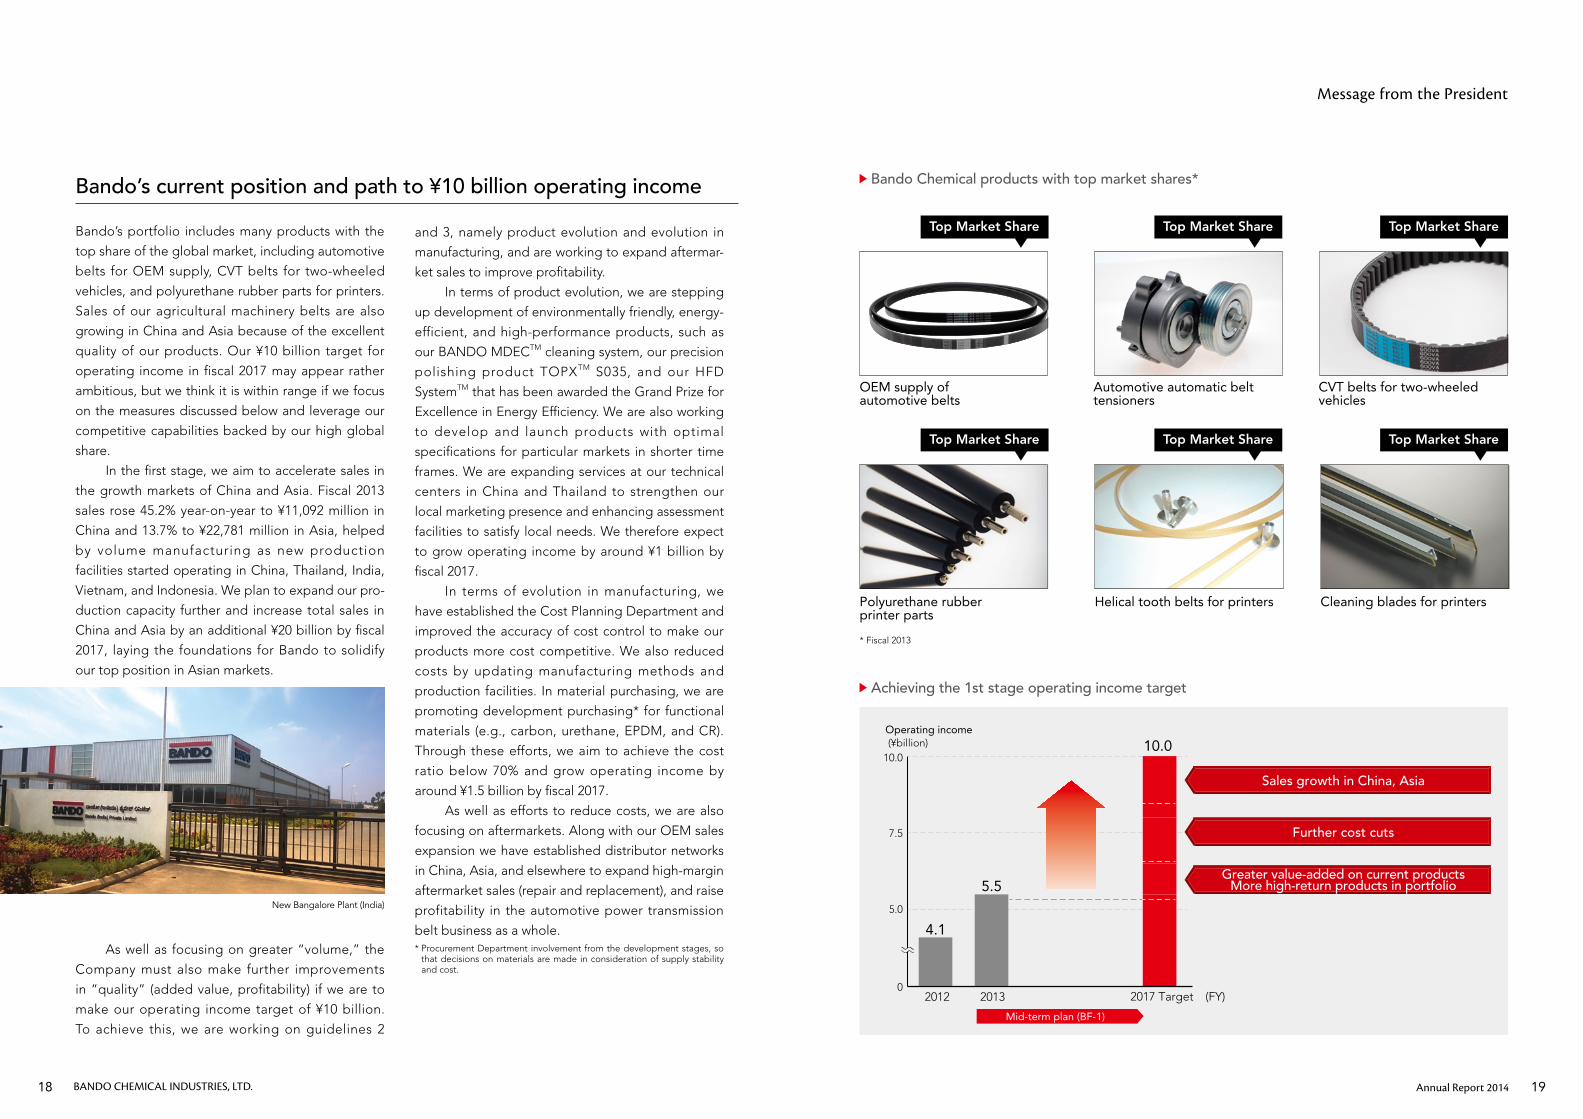
Operating income (¥billion)
0
5.0
7.5
10.0
2012 2013
4.1
5.5
10.0
2017 Target (FY)
Mid-term plan (BF-1)
Sales growth in China, Asia
Further cost cuts
Greater value-added on current productsMore high-return products in portfolio
OEM supply of automotive belts
CVT belts for two-wheeled vehicles
Automotive automatic belt tensioners
Polyurethane rubber printer parts
Helical tooth belts for printers Cleaning blades for printers
Bando’s current position and path to ¥10 billion operating income Bando Chemical products with top market shares*
Achieving the 1st stage operating income target
* Fiscal 2013
Top Market Share
Top Market Share
Top Market Share
Top Market Share
Top Market Share
Top Market Share
New Bangalore Plant (India)
Annual Report 201418 19BANDO CHEMICAL INDUSTRIES, LTD.
Message from the President
During the five-year first stage, Bando Chemical will
invest ¥5 billion in R&D to create new businesses.
We will focus on “environmentally-friendly, energy-
efficient, and high performance” businesses in the
priority markets of optoelectronics, automotive/
transport, energy, and robots and the priority fields
of power electronics, printing electronics, and public
welfare/nursing care. In fiscal 2013, we conducted
R&D mainly at our R&D Center, Manufacturing
Planning Center, and Power Transmission Technical
Research Center, investing ¥3.59 billion in research
and development including projects to develop
improvements overall.
As part of our drive to create new businesses,
we established the BF (Breakthroughs for the Future)
Promotion Department in fiscal 2013 to enable
both marketing and technical staff to collect and
analyze information related to new products and
new businesses. Also, in October 2013, we started
the “Venture Cup” as a way to promote proposals
on new products and enterprises. This system is a
more effective way to tap into creative ideas and
information from our employees.
Through these initiatives, new products that
utilize our core technologies have started to gener-
ate results. Fiscal 2014 should pave the way for the
commercialization of these new business ideas as
profitable products.
Taking on the challenge of developing profitable new businesses
Priority market Priority field
Optoelectronics Printed electronics
Power electronics
Exterior/interior materials
Display, illumination
Automotive/ transportation
Power electronics
Exterior/interior materials
Other
Energy Power electronics
Other
Robots Public welfare/nursing care
Other
Key markets for new business development
R&D Center
Power Transmission Technical Research Center
Display, illumination Printed electronics
We will focus on “environmentally-friendly, energy-efficient, and high performance” businesses
Annual Report 201420 21BANDO CHEMICAL INDUSTRIES, LTD.
New Challenges
Opening up the Future through “Product Evolution” and “New Businesses Creation”In its mid-to-long term business plan “Breakthroughs for the Future,” Bando is implementing incremental innovation in order to realize “product evolution” and is also aiming to realize radical innovation toward “new business creation.”
Product evolution — implementing incremental innovation New business creation — taking on the challenge of radical innovation
For Guideline No. 2 “Product evolution” in our mid-to-long term business plan, we are pursuing the develop-
ment of products with “optimal specifications for markets” so that they match market needs in each region of
the world.
Through incremental innovation to continuously create products that will help our customers to “reduce their
environmental burden, increase efficiency, and shift to compact designs and functional composites,” we are
advancing our conversion to a portfolio consisting of high value-added products.
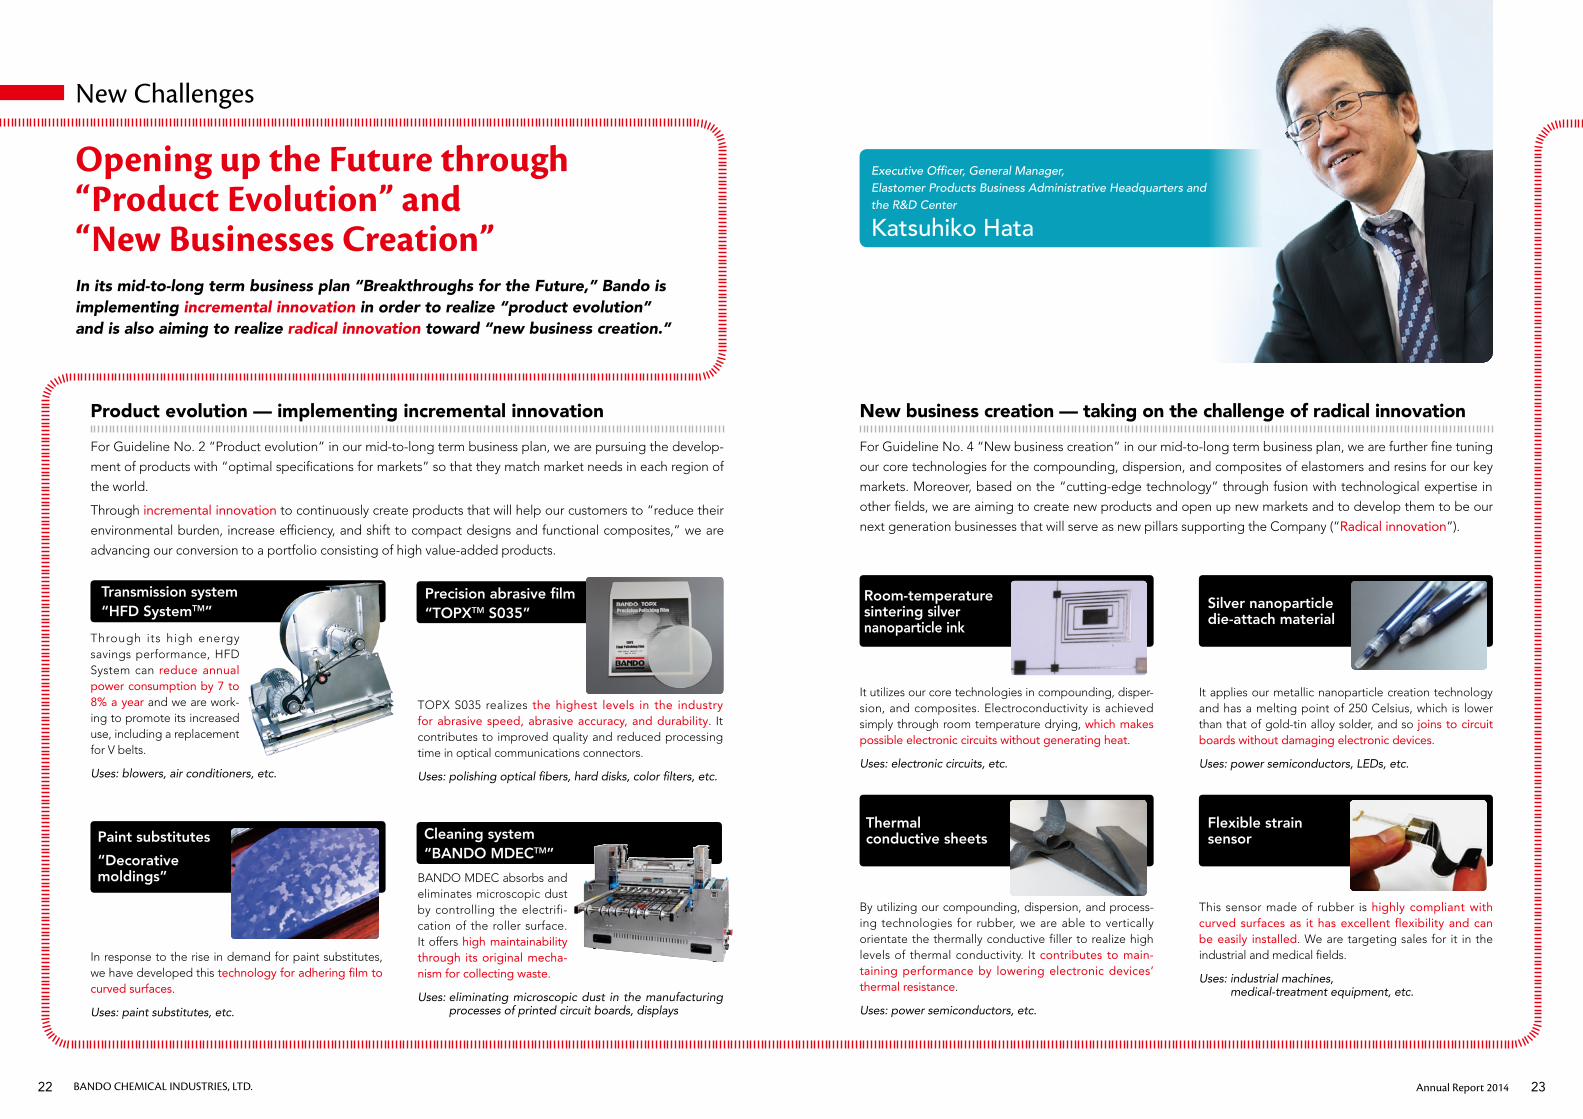
For Guideline No. 4 “New business creation” in our mid-to-long term business plan, we are further fine tuning
our core technologies for the compounding, dispersion, and composites of elastomers and resins for our key
markets. Moreover, based on the “cutting-edge technology” through fusion with technological expertise in
other fields, we are aiming to create new products and open up new markets and to develop them to be our
next generation businesses that will serve as new pillars supporting the Company (“Radical innovation”).
TOPX S035 realizes the highest levels in the industry for abrasive speed, abrasive accuracy, and durability. It contributes to improved quality and reduced processing time in optical communications connectors.
Uses: polishing optical fibers, hard disks, color filters, etc.
It applies our metallic nanoparticle creation technology and has a melting point of 250 Celsius, which is lower than that of gold-tin alloy solder, and so joins to circuit boards without damaging electronic devices.
Uses: power semiconductors, LEDs, etc.
BANDO MDEC absorbs and eliminates microscopic dust by controlling the electrifi-cation of the roller surface. It offers high maintainability through its original mecha-nism for collecting waste.
Uses: eliminating microscopic dust in the manufacturing processes of printed circuit boards, displays
This sensor made of rubber is highly compliant with curved surfaces as it has excellent flexibility and can be easily installed. We are targeting sales for it in the industrial and medical fields.
Uses: industrial machines, medical-treatment equipment, etc.
Through its high energy savings performance, HFD System can reduce annual power consumption by 7 to 8% a year and we are work-ing to promote its increased use, including a replacement for V belts.
Uses: blowers, air conditioners, etc.
It utilizes our core technologies in compounding, disper-sion, and composites. Electroconductivity is achieved simply through room temperature drying, which makes possible electronic circuits without generating heat.
Uses: electronic circuits, etc.
In response to the rise in demand for paint substitutes, we have developed this technology for adhering film to curved surfaces.
Uses: paint substitutes, etc.
By utilizing our compounding, dispersion, and process-ing technologies for rubber, we are able to vertically orientate the thermally conductive filler to realize high levels of thermal conductivity. It contributes to main-taining performance by lowering electronic devices’ thermal resistance.
Uses: power semiconductors, etc.
Room-temperature sintering silver nanoparticle ink
Paint substitutes
“Decorative moldings”
Thermal conductive sheets
Precision abrasive film “TOPXTM S035”
Silver nanoparticle die-attach material
Flexible strain sensorCleaning system
“BANDO MDECTM”
Transmission system“HFD SystemTM”
Executive Officer, General Manager, Elastomer Products Business Administrative Headquarters and the R&D Center
Katsuhiko Hata
Annual Report 201422 23BANDO CHEMICAL INDUSTRIES, LTD.
New Challenges
Steadily realizing incremental innovationOur company’s Hyper Flat Drive (HFD) System was award-ed the “Grand Prize for Excellence in Energy Efficiency”*1 from the “Director-General of the Agency for Natural Resources and Energy”*2 in the fiscal 2013. HFD System is a leading example of how we achieve high added-value by implementing incremental innovation. We will continue to develop these types of high value- added products and increase our competitive advantage through the provision of unique products.
HFD System’s breakthrough point
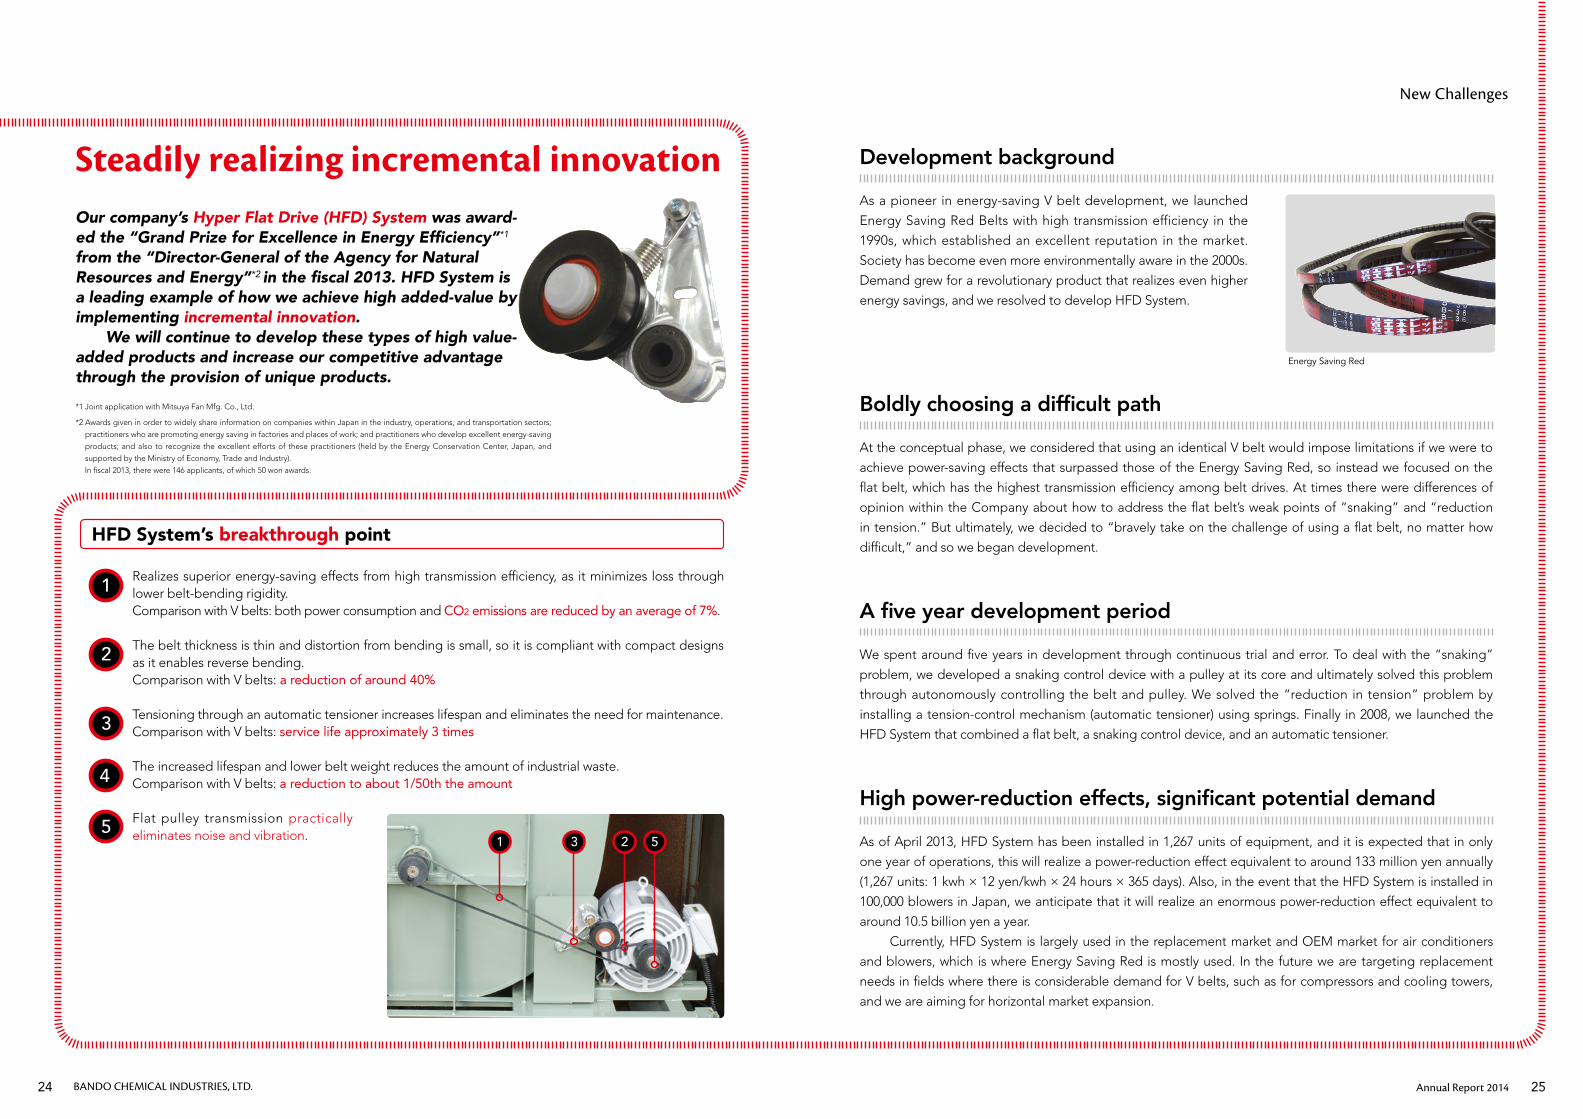
Realizes superior energy-saving effects from high transmission efficiency, as it minimizes loss through lower belt-bending rigidity. Comparison with V belts: both power consumption and CO2 emissions are reduced by an average of 7%.
The belt thickness is thin and distortion from bending is small, so it is compliant with compact designs as it enables reverse bending. Comparison with V belts: a reduction of around 40%
Tensioning through an automatic tensioner increases lifespan and eliminates the need for maintenance. Comparison with V belts: service life approximately 3 times
The increased lifespan and lower belt weight reduces the amount of industrial waste. Comparison with V belts: a reduction to about 1/50th the amount
Flat pulley transmission practically eliminates noise and vibration.
Development background
As a pioneer in energy-saving V belt development, we launched
Energy Saving Red Belts with high transmission efficiency in the
1990s, which established an excellent reputation in the market.
Society has become even more environmentally aware in the 2000s.
Demand grew for a revolutionary product that realizes even higher
energy savings, and we resolved to develop HFD System.
Boldly choosing a difficult path
At the conceptual phase, we considered that using an identical V belt would impose limitations if we were to
achieve power-saving effects that surpassed those of the Energy Saving Red, so instead we focused on the
flat belt, which has the highest transmission efficiency among belt drives. At times there were differences of
opinion within the Company about how to address the flat belt’s weak points of “snaking” and “reduction
in tension.” But ultimately, we decided to “bravely take on the challenge of using a flat belt, no matter how
difficult,” and so we began development.
A five year development period
We spent around five years in development through continuous trial and error. To deal with the “snaking”
problem, we developed a snaking control device with a pulley at its core and ultimately solved this problem
through autonomously controlling the belt and pulley. We solved the “reduction in tension” problem by
installing a tension-control mechanism (automatic tensioner) using springs. Finally in 2008, we launched the
HFD System that combined a flat belt, a snaking control device, and an automatic tensioner.
High power-reduction effects, significant potential demand
As of April 2013, HFD System has been installed in 1,267 units of equipment, and it is expected that in only
one year of operations, this will realize a power-reduction effect equivalent to around 133 million yen annually
(1,267 units: 1 kwh × 12 yen/kwh × 24 hours × 365 days). Also, in the event that the HFD System is installed in
100,000 blowers in Japan, we anticipate that it will realize an enormous power-reduction effect equivalent to
around 10.5 billion yen a year.
Currently, HFD System is largely used in the replacement market and OEM market for air conditioners
and blowers, which is where Energy Saving Red is mostly used. In the future we are targeting replacement
needs in fields where there is considerable demand for V belts, such as for compressors and cooling towers,
and we are aiming for horizontal market expansion.
*1 Joint application with Mitsuya Fan Mfg. Co., Ltd.
*2 Awards given in order to widely share information on companies within Japan in the industry, operations, and transportation sectors;
practitioners who are promoting energy saving in factories and places of work; and practitioners who develop excellent energy-saving
products; and also to recognize the excellent efforts of these practitioners (held by the Energy Conservation Center, Japan, and
supported by the Ministry of Economy, Trade and Industry).
In fiscal 2013, there were 146 applicants, of which 50 won awards.
1
2
3
4
5
Energy Saving Red
1 3 2 5
Annual Report 201424 25BANDO CHEMICAL INDUSTRIES, LTD.
Review of Operations Helping to strengthen the foundations for growth as the Company’s greatest earnings driver
The Belt Business segment serves as the Company’s greatest earnings driver, which is helping the Group achieve its mid-to-long term business plan Breakthroughs for the future. Especially in the first five years of the plan (BF-1, from the fiscal year ended March 31, 2014 to the fiscal year
ending March 31, 2018), we will unfailingly achieve earnings growth centered on this segment in a bid to solidify our growth foundation for the five-year period of BF-2 (from the fiscal year ending March 31, 2019 to the fiscal year ending March 31, 2023) and beyond.
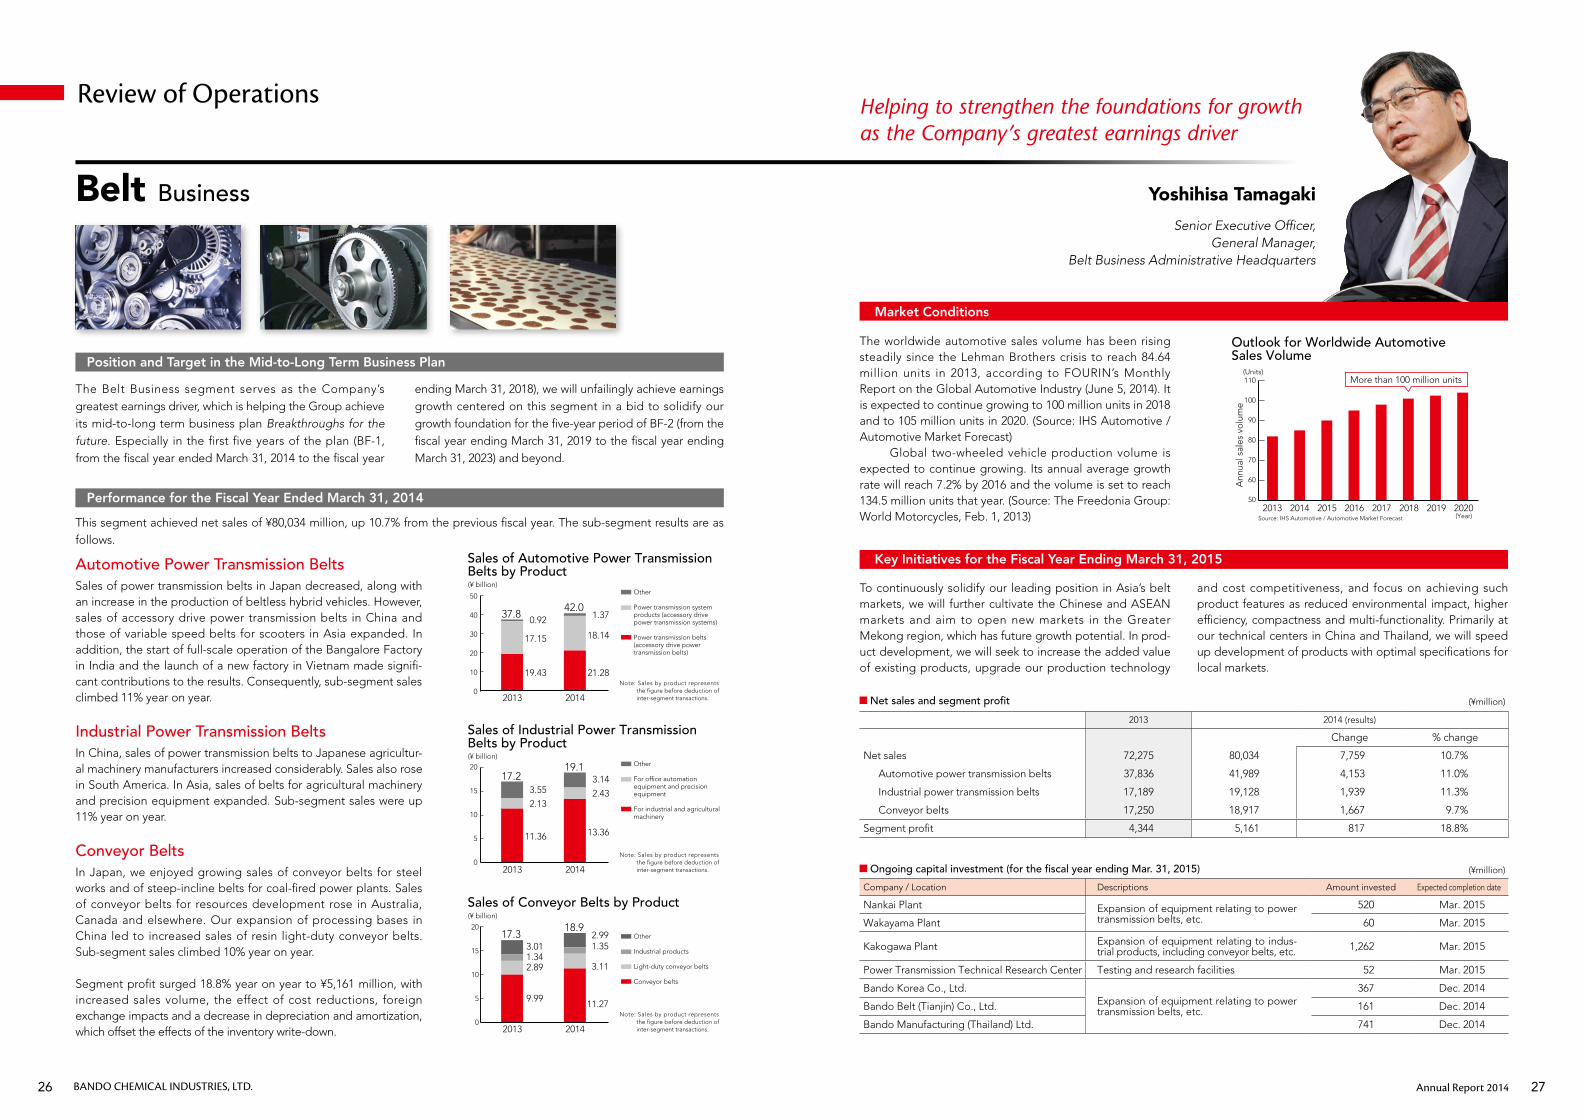
Automotive Power Transmission BeltsSales of power transmission belts in Japan decreased, along with an increase in the production of beltless hybrid vehicles. However, sales of accessory drive power transmission belts in China and those of variable speed belts for scooters in Asia expanded. In addition, the start of full-scale operation of the Bangalore Factory in India and the launch of a new factory in Vietnam made signifi-cant contributions to the results. Consequently, sub-segment sales climbed 11% year on year.
Industrial Power Transmission BeltsIn China, sales of power transmission belts to Japanese agricultur-al machinery manufacturers increased considerably. Sales also rose in South America. In Asia, sales of belts for agricultural machinery and precision equipment expanded. Sub-segment sales were up 11% year on year.
Conveyor Belts In Japan, we enjoyed growing sales of conveyor belts for steel works and of steep-incline belts for coal-fired power plants. Sales of conveyor belts for resources development rose in Australia, Canada and elsewhere. Our expansion of processing bases in China led to increased sales of resin light-duty conveyor belts. Sub-segment sales climbed 10% year on year.
Segment profit surged 18.8% year on year to ¥5,161 million, with increased sales volume, the effect of cost reductions, foreign exchange impacts and a decrease in depreciation and amortization, which offset the effects of the inventory write-down.
The worldwide automotive sales volume has been rising steadily since the Lehman Brothers crisis to reach 84.64 million units in 2013, according to FOURIN’s Monthly Report on the Global Automotive Industry (June 5, 2014). It is expected to continue growing to 100 million units in 2018 and to 105 million units in 2020. (Source: IHS Automotive / Automotive Market Forecast) Global two-wheeled vehicle production volume is expected to continue growing. Its annual average growth rate will reach 7.2% by 2016 and the volume is set to reach 134.5 million units that year. (Source: The Freedonia Group: World Motorcycles, Feb. 1, 2013)
To continuously solidify our leading position in Asia’s belt markets, we will further cultivate the Chinese and ASEAN markets and aim to open new markets in the Greater Mekong region, which has future growth potential. In prod-uct development, we will seek to increase the added value of existing products, upgrade our production technology
and cost competitiveness, and focus on achieving such product features as reduced environmental impact, higher efficiency, compactness and multi-functionality. Primarily at our technical centers in China and Thailand, we will speed up development of products with optimal specifications for local markets.
This segment achieved net sales of ¥80,034 million, up 10.7% from the previous fiscal year. The sub-segment results are as follows.
Belt Business Yoshihisa Tamagaki
Market Conditions
Key Initiatives for the Fiscal Year Ending March 31, 2015
Senior Executive Officer, General Manager,
Belt Business Administrative Headquarters
Position and Target in the Mid-to-Long Term Business Plan
Performance for the Fiscal Year Ended March 31, 2014
(¥ billion)
Sales of Automotive Power Transmission Belts by Product
0
10
20
30
40
50
2013 2014
21.28
18.14
1.3742.0
19.43
17.15
0.9237.8
Note: Sales by product represents the �gure before deduction of inter-segment transactions.
Other
Power transmission system products (accessory drive power transmission systems)
Power transmission belts (accessory drive power transmission belts)
(Units)
Ann
ual s
ales
vo
lum
e
Outlook for Worldwide Automotive Sales Volume
More than 100 million units
50
60
70
80
90
100
110
2013 2014 2015 2016 2017 2018 2019 (Year)2020
Source: IHS Automotive / Automotive Market Forecast
(¥ billion)
Sales of Industrial Power Transmission Belts by Product
2013 2014
13.36
2.43
3.1419.1
11.36
2.13
3.5517.2
Note: Sales by product represents the �gure before deduction of inter-segment transactions.
Other
For of�ce automation equipment and precision equipment
For industrial and agricultural machinery
0
5
10
15
20
(¥ billion)
Sales of Conveyor Belts by Product
2013 2014
11.27
3.11
1.352.99
9.99
2.891.343.01
Note: Sales by product represents the �gure before deduction of inter-segment transactions.
Other
Industrial products
Light-duty conveyor belts
Conveyor belts
0
5
10
15
20 18.917.3
2013 2014 (results)
Change % change
Net sales 72,275 80,034 7,759 10.7%
Automotive power transmission belts 37,836 41,989 4,153 11.0%
Industrial power transmission belts 17,189 19,128 1,939 11.3%
Conveyor belts 17,250 18,917 1,667 9.7%
Segment profit 4,344 5,161 817 18.8%
Net sales and segment profit
Company / Location Descriptions Amount invested Expected completion date
Nankai Plant Expansion of equipment relating to power transmission belts, etc.
520 Mar. 2015
Wakayama Plant 60 Mar. 2015
Kakogawa Plant Expansion of equipment relating to indus-trial products, including conveyor belts, etc. 1,262 Mar. 2015
Power Transmission Technical Research Center Testing and research facilities 52 Mar. 2015
Bando Korea Co., Ltd.Expansion of equipment relating to power transmission belts, etc.
367 Dec. 2014
Bando Belt (Tianjin) Co., Ltd. 161 Dec. 2014
Bando Manufacturing (Thailand) Ltd. 741 Dec. 2014
Ongoing capital investment (for the fiscal year ending Mar. 31, 2015)
(¥million)
(¥million)
Annual Report 201426 27BANDO CHEMICAL INDUSTRIES, LTD.
Elastomer Products Business
Review of Operations
Katsuhiko Hata
Executive Officer, General Manager, Elastomer Products Business Administrative Headquarters
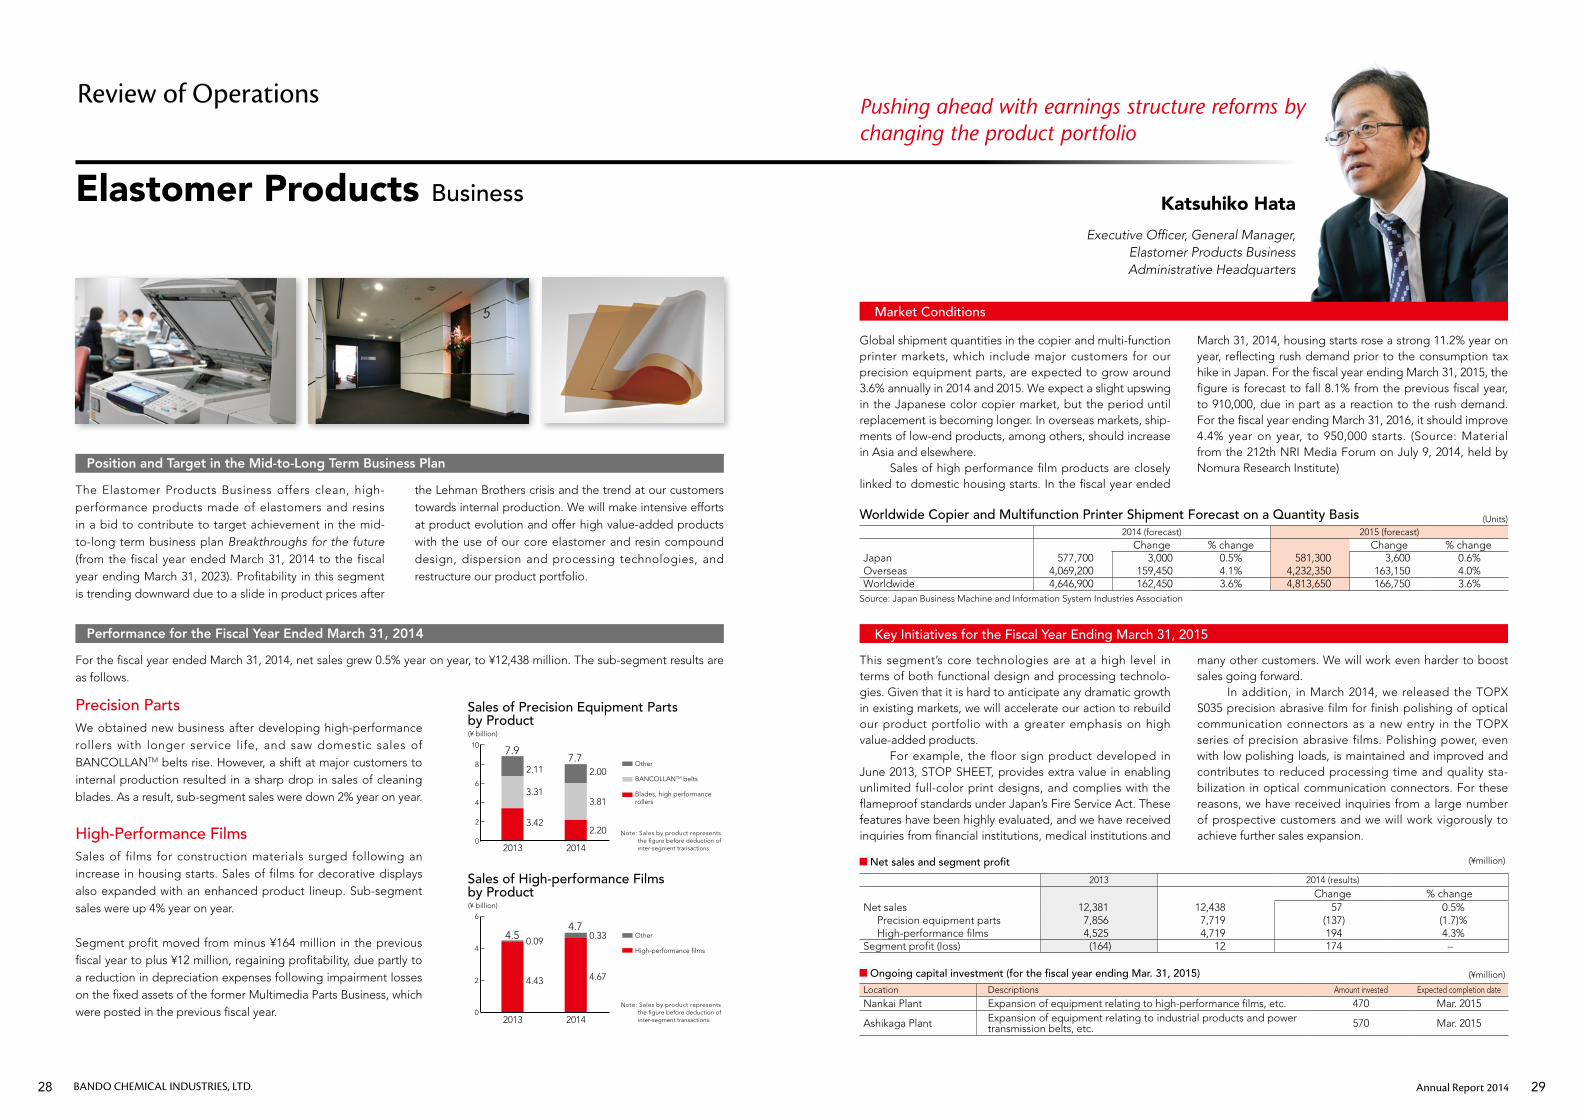
Pushing ahead with earnings structure reforms by changing the product portfolio
The Elastomer Products Business offers clean, high- performance products made of elastomers and resins in a bid to contribute to target achievement in the mid-to-long term business plan Breakthroughs for the future (from the fiscal year ended March 31, 2014 to the fiscal year ending March 31, 2023). Profitability in this segment is trending downward due to a slide in product prices after
the Lehman Brothers crisis and the trend at our customers towards internal production. We will make intensive efforts at product evolution and offer high value-added products with the use of our core elastomer and resin compound design, dispersion and processing technologies, and restructure our product portfolio.
Precision PartsWe obtained new business after developing high-performance rollers with longer service life, and saw domestic sales of BANCOLLANTM belts rise. However, a shift at major customers to internal production resulted in a sharp drop in sales of cleaning blades. As a result, sub-segment sales were down 2% year on year.
High-Performance FilmsSales of films for construction materials surged following an increase in housing starts. Sales of films for decorative displays also expanded with an enhanced product lineup. Sub-segment sales were up 4% year on year.
Segment profit moved from minus ¥164 million in the previous fiscal year to plus ¥12 million, regaining profitability, due partly to a reduction in depreciation expenses following impairment losses on the fixed assets of the former Multimedia Parts Business, which were posted in the previous fiscal year.
2013 2014 (results)
Change % changeNet sales 12,381 12,438 57 0.5% Precision equipment parts 7,856 7,719 (137) (1.7)% High-performance films 4,525 4,719 194 4.3%Segment profit (loss) (164) 12 174 –
Global shipment quantities in the copier and multi-function printer markets, which include major customers for our precision equipment parts, are expected to grow around 3.6% annually in 2014 and 2015. We expect a slight upswing in the Japanese color copier market, but the period until replacement is becoming longer. In overseas markets, ship-ments of low-end products, among others, should increase in Asia and elsewhere. Sales of high performance film products are closely linked to domestic housing starts. In the fiscal year ended
March 31, 2014, housing starts rose a strong 11.2% year on year, reflecting rush demand prior to the consumption tax hike in Japan. For the fiscal year ending March 31, 2015, the figure is forecast to fall 8.1% from the previous fiscal year, to 910,000, due in part as a reaction to the rush demand. For the fiscal year ending March 31, 2016, it should improve 4.4% year on year, to 950,000 starts. (Source: Material from the 212th NRI Media Forum on July 9, 2014, held by Nomura Research Institute)
This segment’s core technologies are at a high level in terms of both functional design and processing technolo-gies. Given that it is hard to anticipate any dramatic growth in existing markets, we will accelerate our action to rebuild our product portfolio with a greater emphasis on high value-added products. For example, the floor sign product developed in June 2013, STOP SHEET, provides extra value in enabling unlimited full-color print designs, and complies with the flameproof standards under Japan’s Fire Service Act. These features have been highly evaluated, and we have received inquiries from financial institutions, medical institutions and
many other customers. We will work even harder to boost sales going forward. In addition, in March 2014, we released the TOPX S035 precision abrasive film for finish polishing of optical communication connectors as a new entry in the TOPX series of precision abrasive films. Polishing power, even with low polishing loads, is maintained and improved and contributes to reduced processing time and quality sta-bilization in optical communication connectors. For these reasons, we have received inquiries from a large number of prospective customers and we will work vigorously to achieve further sales expansion.
For the fiscal year ended March 31, 2014, net sales grew 0.5% year on year, to ¥12,438 million. The sub-segment results are as follows.
Market Conditions
Key Initiatives for the Fiscal Year Ending March 31, 2015
Position and Target in the Mid-to-Long Term Business Plan
Performance for the Fiscal Year Ended March 31, 2014
Worldwide Copier and Multifunction Printer Shipment Forecast on a Quantity Basis
Net sales and segment profit
2014 (forecast) 2015 (forecast)Change % change Change % change
Japan 577,700 3,000 0.5% 581,300 3,600 0.6%Overseas 4,069,200 159,450 4.1% 4,232,350 163,150 4.0%Worldwide 4,646,900 162,450 3.6% 4,813,650 166,750 3.6%
(¥million)
Location Descriptions Amount invested Expected completion date
Nankai Plant Expansion of equipment relating to high-performance films, etc. 470 Mar. 2015
Ashikaga Plant Expansion of equipment relating to industrial products and power transmission belts, etc. 570 Mar. 2015
Ongoing capital investment (for the fiscal year ending Mar. 31, 2015) (¥million)
(Units)
(¥ billion)
Sales of Precision Equipment Parts by Product
2013 2014
2.20
3.81
2.007.7
3.42
3.31
2.11
7.9
Note: Sales by product represents the �gure before deduction of inter-segment transactions.
Other
BANCOLLANTM belts
Blades, high performance rollers
0
2
4
6
8
10
(¥ billion)
Sales of High-performance Films by Product
2013 2014
4.67
0.334.7
4.43
0.094.5
Note: Sales by product represents the �gure before deduction of inter-segment transactions.
Other
High-performance �lms
0
2
4
6
Source: Japan Business Machine and Information System Industries Association
Annual Report 201428 29BANDO CHEMICAL INDUSTRIES, LTD.
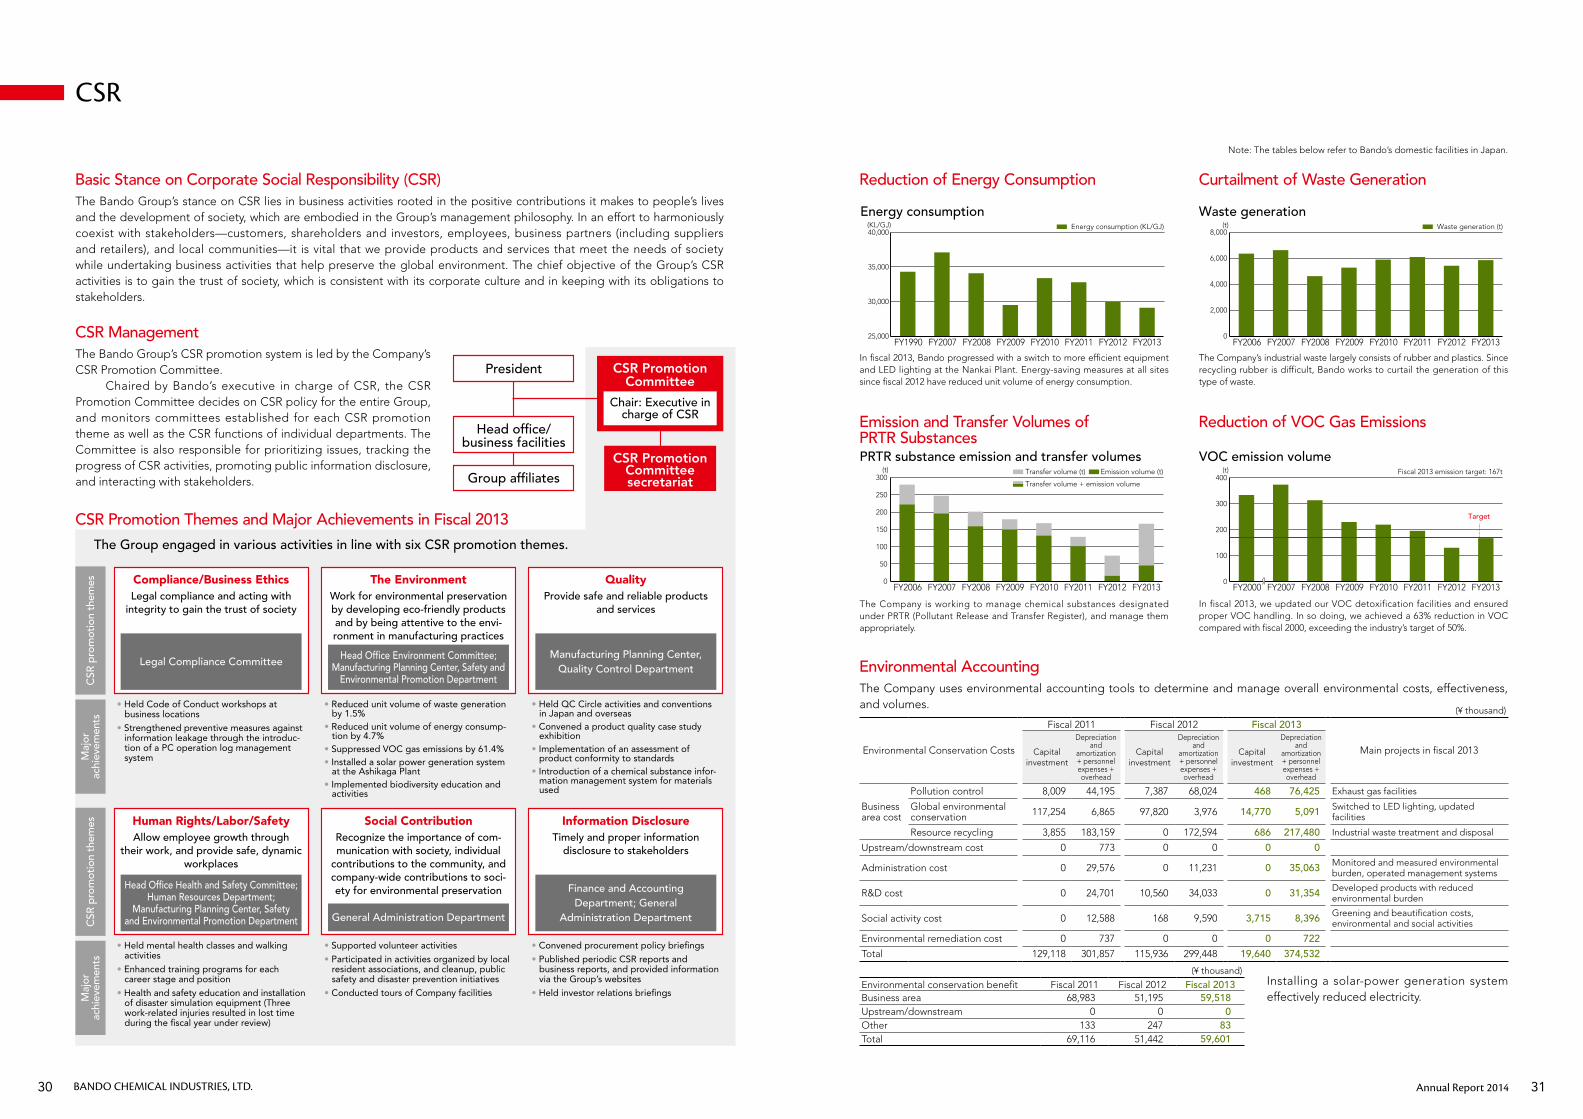
Reduction of Energy Consumption
In fiscal 2013, Bando progressed with a switch to more efficient equipment and LED lighting at the Nankai Plant. Energy-saving measures at all sites since fiscal 2012 have reduced unit volume of energy consumption.
Emission and Transfer Volumes of PRTR Substances
The Company is working to manage chemical substances designated under PRTR (Pollutant Release and Transfer Register), and manage them appropriately.
Curtailment of Waste Generation
The Company’s industrial waste largely consists of rubber and plastics. Since recycling rubber is difficult, Bando works to curtail the generation of this type of waste.
Reduction of VOC Gas Emissions
In fiscal 2013, we updated our VOC detoxification facilities and ensured proper VOC handling. In so doing, we achieved a 63% reduction in VOC compared with fiscal 2000, exceeding the industry’s target of 50%.
CSR
Basic Stance on Corporate Social Responsibility (CSR)The Bando Group’s stance on CSR lies in business activities rooted in the positive contributions it makes to people’s lives and the development of society, which are embodied in the Group’s management philosophy. In an effort to harmoniously coexist with stakeholders—customers, shareholders and investors, employees, business partners (including suppliers and retailers), and local communities—it is vital that we provide products and services that meet the needs of society while undertaking business activities that help preserve the global environment. The chief objective of the Group’s CSR activities is to gain the trust of society, which is consistent with its corporate culture and in keeping with its obligations to stakeholders.
Environmental AccountingThe Company uses environmental accounting tools to determine and manage overall environmental costs, effectiveness, and volumes.
Installing a solar-power generation system effectively reduced electricity.
CSR ManagementThe Bando Group’s CSR promotion system is led by the Company’s CSR Promotion Committee. Chaired by Bando’s executive in charge of CSR, the CSR Promotion Committee decides on CSR policy for the entire Group, and monitors committees established for each CSR promotion theme as well as the CSR functions of individual departments. The Committee is also responsible for prioritizing issues, tracking the progress of CSR activities, promoting public information disclosure, and interacting with stakeholders.
CSR Promotion Themes and Major Achievements in Fiscal 2013
The Group engaged in various activities in line with six CSR promotion themes.
• Held Code of Conduct workshops at business locations
• Strengthened preventive measures against information leakage through the introduc-tion of a PC operation log management system
• Held mental health classes and walking activities
• Enhanced training programs for each career stage and position
• Health and safety education and installation of disaster simulation equipment (Three work-related injuries resulted in lost time during the fiscal year under review)
• Supported volunteer activities
• Participated in activities organized by local resident associations, and cleanup, public safety and disaster prevention initiatives
• Conducted tours of Company facilities
• Held QC Circle activities and conventions in Japan and overseas
• Convened a product quality case study exhibition
• Implementation of an assessment of product conformity to standards
• Introduction of a chemical substance infor-mation management system for materials used
• Convened procurement policy briefings
• Published periodic CSR reports and business reports, and provided information via the Group’s websites
• Held investor relations briefings
CSR
pro
mot
ion
them
esC
SR p
rom
otio
n th
emes
Maj
or
achi
evem
ents
Maj
or
achi
evem
ents
Compliance/Business EthicsLegal compliance and acting with
integrity to gain the trust of society
Human Rights/Labor/SafetyAllow employee growth through
their work, and provide safe, dynamic workplaces
The EnvironmentWork for environmental preservation by developing eco-friendly products and by being attentive to the envi-ronment in manufacturing practices
Social ContributionRecognize the importance of com-munication with society, individual
contributions to the community, and company-wide contributions to soci-ety for environmental preservation
QualityProvide safe and reliable products
and services
Information DisclosureTimely and proper information
disclosure to stakeholders
Legal Compliance Committee
Head Office Health and Safety Committee; Human Resources Department;
Manufacturing Planning Center, Safety and Environmental Promotion Department
Head Office Environment Committee; Manufacturing Planning Center, Safety and
Environmental Promotion Department
General Administration Department
Manufacturing Planning Center, Quality Control Department
Finance and Accounting Department; General
Administration Department
CSR Promotion Committee
CSR Promotion Committee secretariat
Chair: Executive in charge of CSR
President
Group affiliates
Head office/business facilities
(¥ thousand)
Environmental Conservation Costs
Fiscal 2011 Fiscal 2012 Fiscal 2013
Main projects in fiscal 2013Capital investment
Depreciation and
amortization + personnel expenses + overhead
Capital investment
Depreciation and
amortization + personnel expenses + overhead
Capital investment
Depreciation and
amortization + personnel expenses + overhead
Business area cost
Pollution control 8,009 44,195 7,387 68,024 468 76,425 Exhaust gas facilities
Global environmental conservation 117,254 6,865 97,820 3,976 14,770 5,091 Switched to LED lighting, updated
facilities
Resource recycling 3,855 183,159 0 172,594 686 217,480 Industrial waste treatment and disposal
Upstream/downstream cost 0 773 0 0 0 0
Administration cost 0 29,576 0 11,231 0 35,063 Monitored and measured environmental burden, operated management systems
R&D cost 0 24,701 10,560 34,033 0 31,354 Developed products with reduced environmental burden
Social activity cost 0 12,588 168 9,590 3,715 8,396 Greening and beautification costs, environmental and social activities
Environmental remediation cost 0 737 0 0 0 722
Total 129,118 301,857 115,936 299,448 19,640 374,532
(¥ thousand)
Environmental conservation benefit Fiscal 2011 Fiscal 2012 Fiscal 2013Business area 68,983 51,195 59,518Upstream/downstream 0 0 0Other 133 247 83 Total 69,116 51,442 59,601
(t)
PRTR substance emission and transfer volumesTransfer volume (t) Emission volume (t)
Transfer volume + emission volume
FY2006 FY2007 FY2008 FY2009 FY2010 FY2011 FY2012 FY20130
50
100
150
200
250
300
(KL/GJ)
Energy consumptionEnergy consumption (KL/GJ)
FY1990 FY2007 FY2008 FY2009 FY2010 FY2011 FY2012 FY201325,000
30,000
35,000
40,000
(t)
VOC emission volumeFiscal 2013 emission target: 167t
Target
FY2000 FY2007 FY2008 FY2009 FY2010 FY2011 FY2012 FY20130
100
200
300
400
(t)
Waste generationWaste generation (t)
FY2006 FY2007 FY2008 FY2009 FY2010 FY2011 FY2012 FY20130
2,000
4,000
6,000
8,000
Note: The tables below refer to Bando’s domestic facilities in Japan.
• Reduced unit volume of waste generation by 1.5%
• Reduced unit volume of energy consump-tion by 4.7%
• Suppressed VOC gas emissions by 61.4%• Installed a solar power generation system
at the Ashikaga Plant• Implemented biodiversity education and
activities
Annual Report 201430 31BANDO CHEMICAL INDUSTRIES, LTD.
Corporate Governance
Basic Stance on Corporate Governance
In order to improve corporate value, the actions of
the Company are based on an adherence to the law
and social norms as a member of society. In addition,
the Company recognizes the importance of building
positive relationships with customers (end users),
current and potential investors, business partners, local
communities and others. Accordingly, the Company
focuses on ensuring sound, transparent and efficient
management by enhancing its corporate governance
system.
Board of Directors
The Company maintains a system centered on
directors and audit & supervisory board members
to ensure management efficiency and to strengthen
its audit and supervisory functions. The Company’s
Board of Directors consists of five directors, including
one external director. The Board makes decisions
concerning basic management policies, important
management issues, and legally stipulated matters, as
well as monitoring the work performance of directors
and corporate executive officers. As a rule, the Board
meets once per month. In addition, the Company
maintains a corporate executive officer system to
improve operational efficiency and speed, and has
established the Management Advisory Council to assist
the president with management decisions. In the fiscal
year ended March 31, 2014, Board of Directors Meetings
were held 15 times, with the external director attending
100% of those meetings.
Audit & Supervisory Board
The Company has adopted an audit & supervisory
board member system. The Audit & Supervisory Board
consists of four audit & supervisory board members,
including three external audit & supervisory board
members. The internal audit & supervisory board mem-
ber and one external audit & supervisory board member
serve on a full-time basis. The Audit & Supervisory
Board Meeting is held every month. All of the
Company’s audit & supervisory board members attend
Board of Directors’ meetings and monthly management
conferences. Moreover, the Audit & Supervisory Board
assigns individual audit & supervisory board members
to attend various internal committee meetings and
conduct hearings to determine the operational status
of subsidiaries when deemed necessary. Through these
and other actions, the audit & supervisory board mem-
ber system is able to fully monitor the performance of
directors and corporate executive officers. In the fiscal
year ended March 31, 2014, the Audit & Supervisory
Board met 12 times, with the three external audit &
supervisory board members attending 97% of those
meetings.
Nominating Committee and Compensation Committee
Despite having no legal obl igation under the
Companies Act, the Company has established the
Nominating Committee and Compensation Committee
to serve as consultative bodies of the Board of
Directors in an effort to further strengthen corporate
governance.
Decisions regarding director appointments and
compensation are made by a resolution of the Board
of Directors following deliberations by the Nominating
and Compensation committees. In addition, these
committees include the external director and external
audit & supervisory board members who have been
designated as independent executives to maintain
a highly transparent system for making decisions
about director nominations and compensation. In the
fiscal year ended March 31, 2014, the total amount
of director and audit & supervisory board member
compensation is shown below.
Internal Control
To meet the requirements stipulated in the Financial
Instruments and Exchange Act pertaining to financial
reporting performed by internal control reporting
systems, the Bando Group maintains internal control in
accordance with the basic frameworks for internal con-
trol outlined in Financial Services Agency criteria, and
undertakes evaluations and reporting as defined by
said criteria. The Company will work to further improve
the effectiveness of internal control primarily through
the Internal Control Promotion Office and based on
the four objectives of internal control: (1) reliability of
financial reporting, (2) operational effectiveness and
efficiency, (3) legal compliance regarding business
activities, and (4) asset protection.
Basic Stance on the Elimination of Antisocial Forces
The Group takes stringent measures to eliminate
antisocial forces by investigating prospective business
partners prior to commencing new transactions based
on relevant Group policies and the Bando Group Code
of Conduct, which stresses the overriding importance
of adhering to the law and corporate ethics. In
addition, the Group maintains an internal reporting
Notes:
1. Six directors as of March 31, 2014 (including one external director)
2. Four audit & supervisory board members as of March 31, 2014 (including three external audit & supervisory board members)
3. The total amount of external director and external audit & supervisory board member compensation listed above is as follows.
One external director: ¥6 million Three external audit & supervisory board members: ¥34 million
4. The total amount of director compensation includes performance-related salary based on the Company’s performance-related salary criteria (for full-time based directors only) for the fiscal year ended March 31, 2014.
5. In addition to the above-listed information, salaries and bonuses for employees who concurrently serve as directors are as follows.
Two employee salaries: ¥30 million Two employee bonuses: ¥11 million
Number of
Persons
Total Compensation
Compensation Limit
Directors 7 ¥162 million¥240 million or less annually
Audit & Supervisory Board Members
5 ¥54 million¥7 million or less monthly
Total 12 ¥216 million
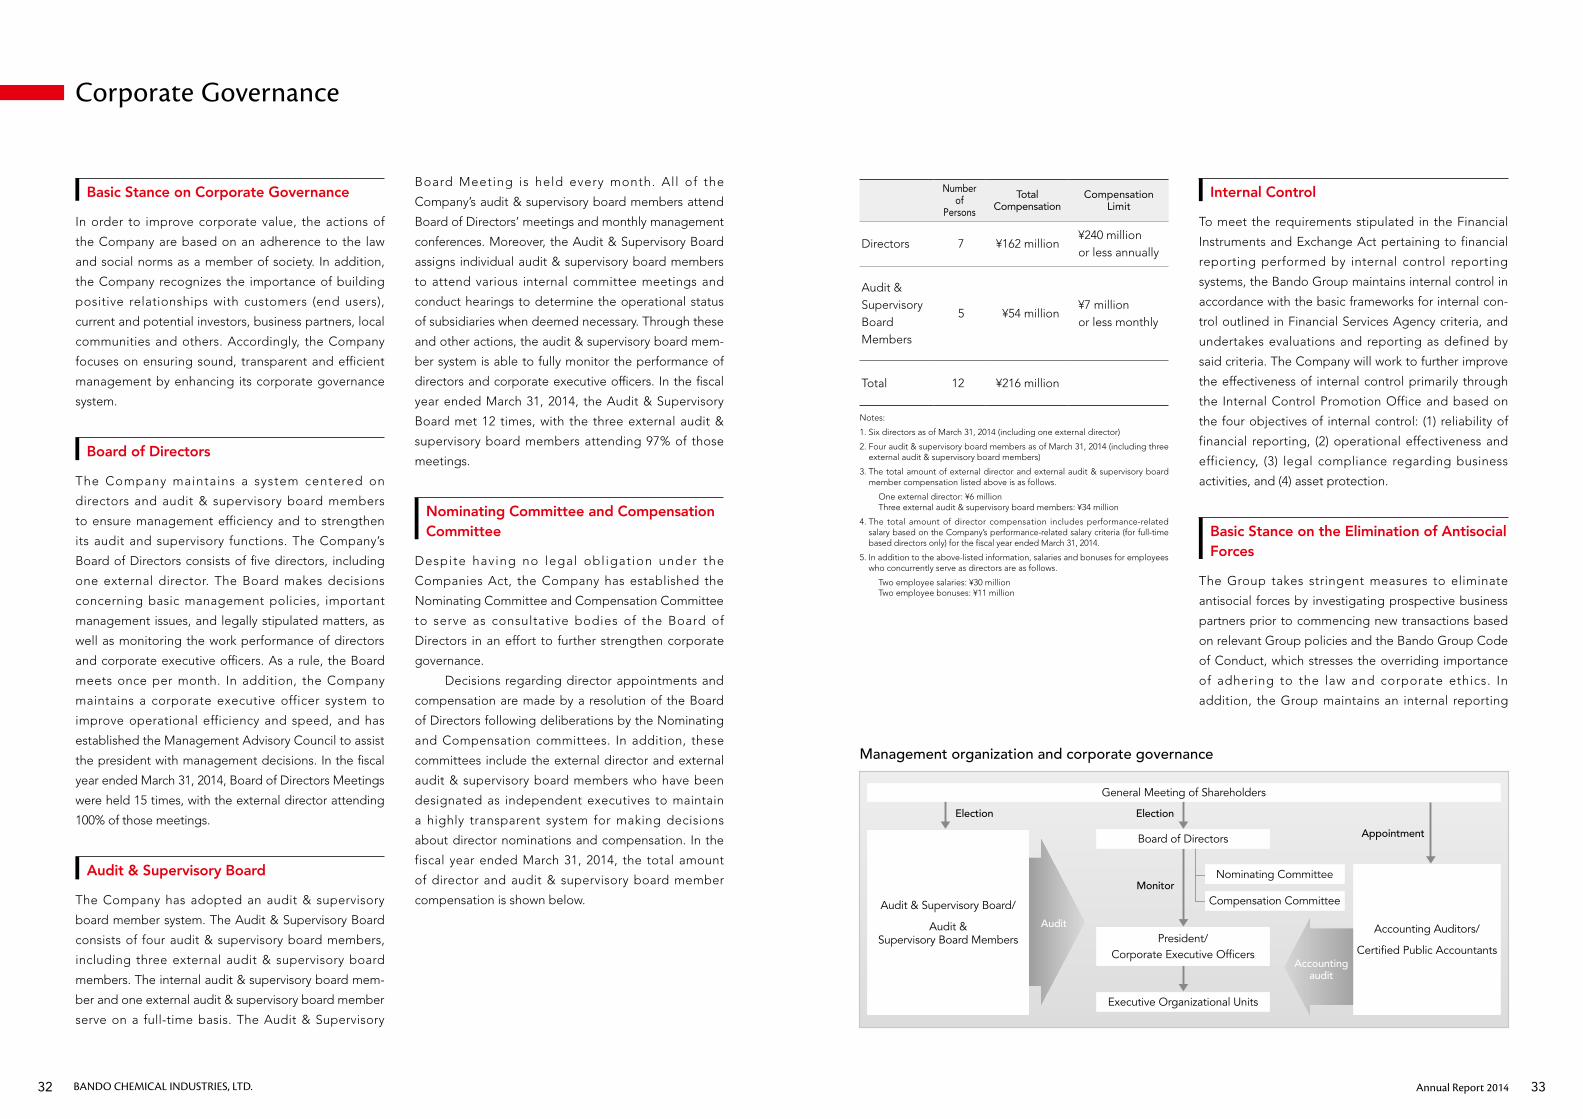
Election
Monitor
Election
Audit
Accounting audit
Appointment
Management organization and corporate governance
Board of Directors
President/ Corporate Executive Officers
Executive Organizational Units
Nominating Committee
Compensation Committee
General Meeting of Shareholders
Audit & Supervisory Board/
Audit & Supervisory Board Members
Accounting Auditors/
Certified Public Accountants
Annual Report 201432 33BANDO CHEMICAL INDUSTRIES, LTD.
Management (As of June 24, 2014)
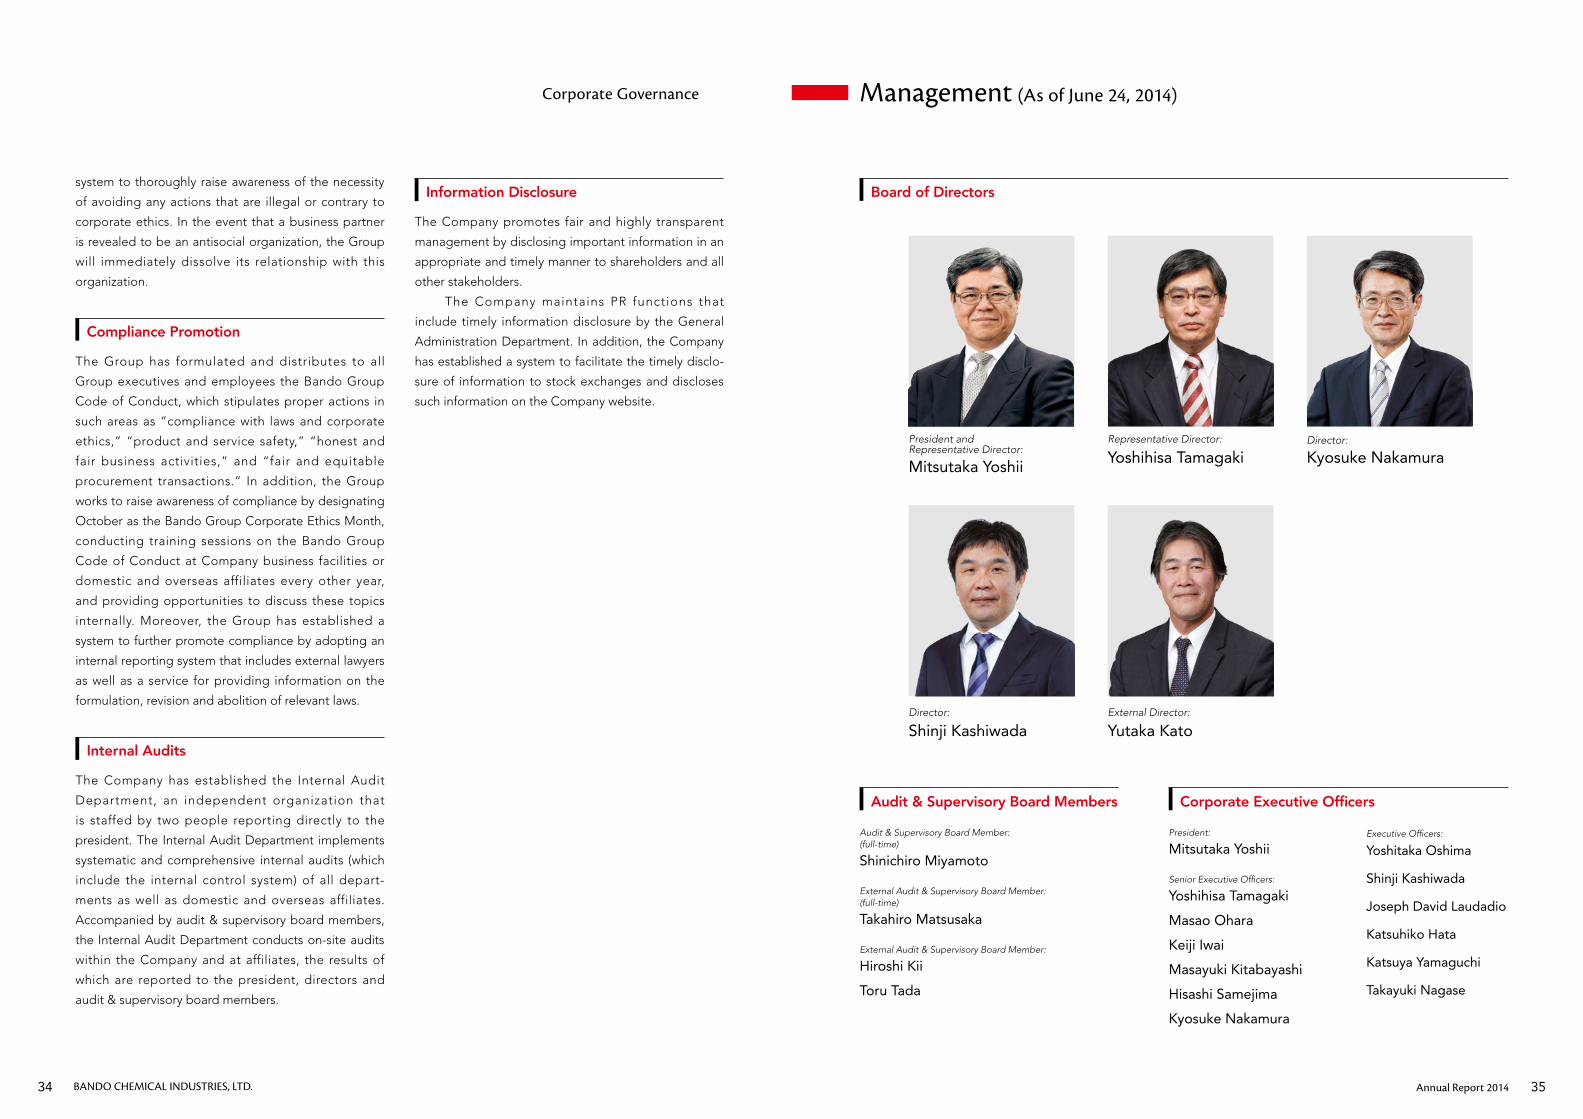
Board of Directors
Audit & Supervisory Board Members Corporate Executive Officers
Audit & Supervisory Board Member: (full-time)
Shinichiro Miyamoto
External Audit & Supervisory Board Member: (full-time)
Takahiro Matsusaka
External Audit & Supervisory Board Member:
Hiroshi Kii
Toru Tada
President:
Mitsutaka Yoshii
Senior Executive Officers:
Yoshihisa Tamagaki
Masao Ohara
Keiji Iwai
Masayuki Kitabayashi
Hisashi Samejima
Kyosuke Nakamura
system to thoroughly raise awareness of the necessity
of avoiding any actions that are illegal or contrary to
corporate ethics. In the event that a business partner
is revealed to be an antisocial organization, the Group
will immediately dissolve its relationship with this
organization.
Compliance Promotion
The Group has formulated and distributes to all
Group executives and employees the Bando Group
Code of Conduct, which stipulates proper actions in
such areas as “compliance with laws and corporate
ethics,” “product and service safety,” “honest and
fair business activities,” and “fair and equitable
procurement transactions.” In addition, the Group
works to raise awareness of compliance by designating
October as the Bando Group Corporate Ethics Month,
conducting training sessions on the Bando Group
Code of Conduct at Company business facilities or
domestic and overseas affiliates every other year,
and providing opportunities to discuss these topics
internally. Moreover, the Group has established a
system to further promote compliance by adopting an
internal reporting system that includes external lawyers
as well as a service for providing information on the
formulation, revision and abolition of relevant laws.
Internal Audits
The Company has established the Internal Audit
Department, an independent organization that
is staffed by two people reporting directly to the
president. The Internal Audit Department implements
systematic and comprehensive internal audits (which
include the internal control system) of all depart-
ments as well as domestic and overseas affiliates.
Accompanied by audit & supervisory board members,
the Internal Audit Department conducts on-site audits
within the Company and at affiliates, the results of
which are reported to the president, directors and
audit & supervisory board members.
Corporate Governance
Representative Director:
Yoshihisa TamagakiDirector:
Kyosuke NakamuraPresident and Representative Director:
Mitsutaka Yoshii
Director:
Shinji KashiwadaExternal Director:
Yutaka Kato
Executive Officers:
Yoshitaka Oshima
Shinji Kashiwada
Joseph David Laudadio
Katsuhiko Hata
Katsuya Yamaguchi
Takayuki Nagase
Information Disclosure
The Company promotes fair and highly transparent
management by disclosing important information in an
appropriate and timely manner to shareholders and all
other stakeholders.
The Company maintains PR functions that
include timely information disclosure by the General
Administration Department. In addition, the Company
has established a system to facilitate the timely disclo-
sure of information to stock exchanges and discloses
such information on the Company website.
Annual Report 201434 35BANDO CHEMICAL INDUSTRIES, LTD.
Management’s Discussion and Analysis
Operating Environment
During the fiscal year ended March 31, 2014, the Chinese economy began to show signs of recovery, while some Asian economies experienced a slowing of growth, notably in South Korea, Thailand and India. In the United States, personal consumption firmed up amid an improved employment environment, and the economy appeared to have entered a phase of sustained recovery with solid corporate earnings and stable growth. Signs of recovery also appeared in Europe. In Japan, moderate overall recovery momentum set in, with the overvaluation of the yen correcting in response to financial easing and government fiscal measures, and capital investment picking up. Personal spending was also robust, due in part to last-minute buying ahead of an increase in the consumption tax.
Business Overview
The year ended March 31, 2014 was the first year of the first phase in our mid-to-long term business plan “Breakthroughs for the future.” The Bando Group aggressively worked to meet targets in the plan based on five guidelines which were designed to chart our course as a company over the next 10 years, such as “evolution of global market strategy.” Specific mea-sures included the introduction of dual Administrative Headquarters comprising our reorganized Belt and Elastomer Products Business segments. We now have a business model in which it will be easier to generate synergies and execute business strategy taking a global
perspective. We also established a special office for new business development, integrated marketing companies in Japan, strengthened production capacity in the Asian region, promoted market and product development, and worked to reduce costs to strengthen profitability.
Operating Results
As a result of our efforts, consolidated net sales in the fiscal year ended March 31, 2014 increased 8.9% year on year to ¥93,434 million, buoyed by effects of weaker Japanese yen exchange rates. Operating income increased 34.8% to ¥5,518 million. Cost-cutting measures and an increase in sales volumes combined with the weaker yen and reduced depreciation and amortization more than offset rising raw materials prices and valuation losses on inventory.The cost to sales ratio improved 0.3 point from 73.8% to 73.5%. The SG&A ratio improved by 0.8 point from 21.4% to 20.6%. The operating margin rose 1.1 point from 4.8% to 5.9%. Net income increased 70.5% year-on-year to ¥4,280 million, mainly due to booking of foreign exchange gains and a rebound from the impairment loss booked in the previous fiscal year.
Operating Results by Business Segment Belt Business
Sales of automotive power transmission belt products improved for accessory drive power transmission belt and system products, due to growth in demand in
Net sales*
2010 2011 2012 2013 20140
20,000
40,000
60,000
80,000
100,000(¥ million)
73,593
93,43484,811 86,372 85,772
Operating income*
2010 2011 2012 2013 2014
(¥ million)
0
2,000
4,000
6,000
2,450
5,0564,571
4,095
5,518
* Fiscal year endings are March 31.
Message from Bando’s External Director
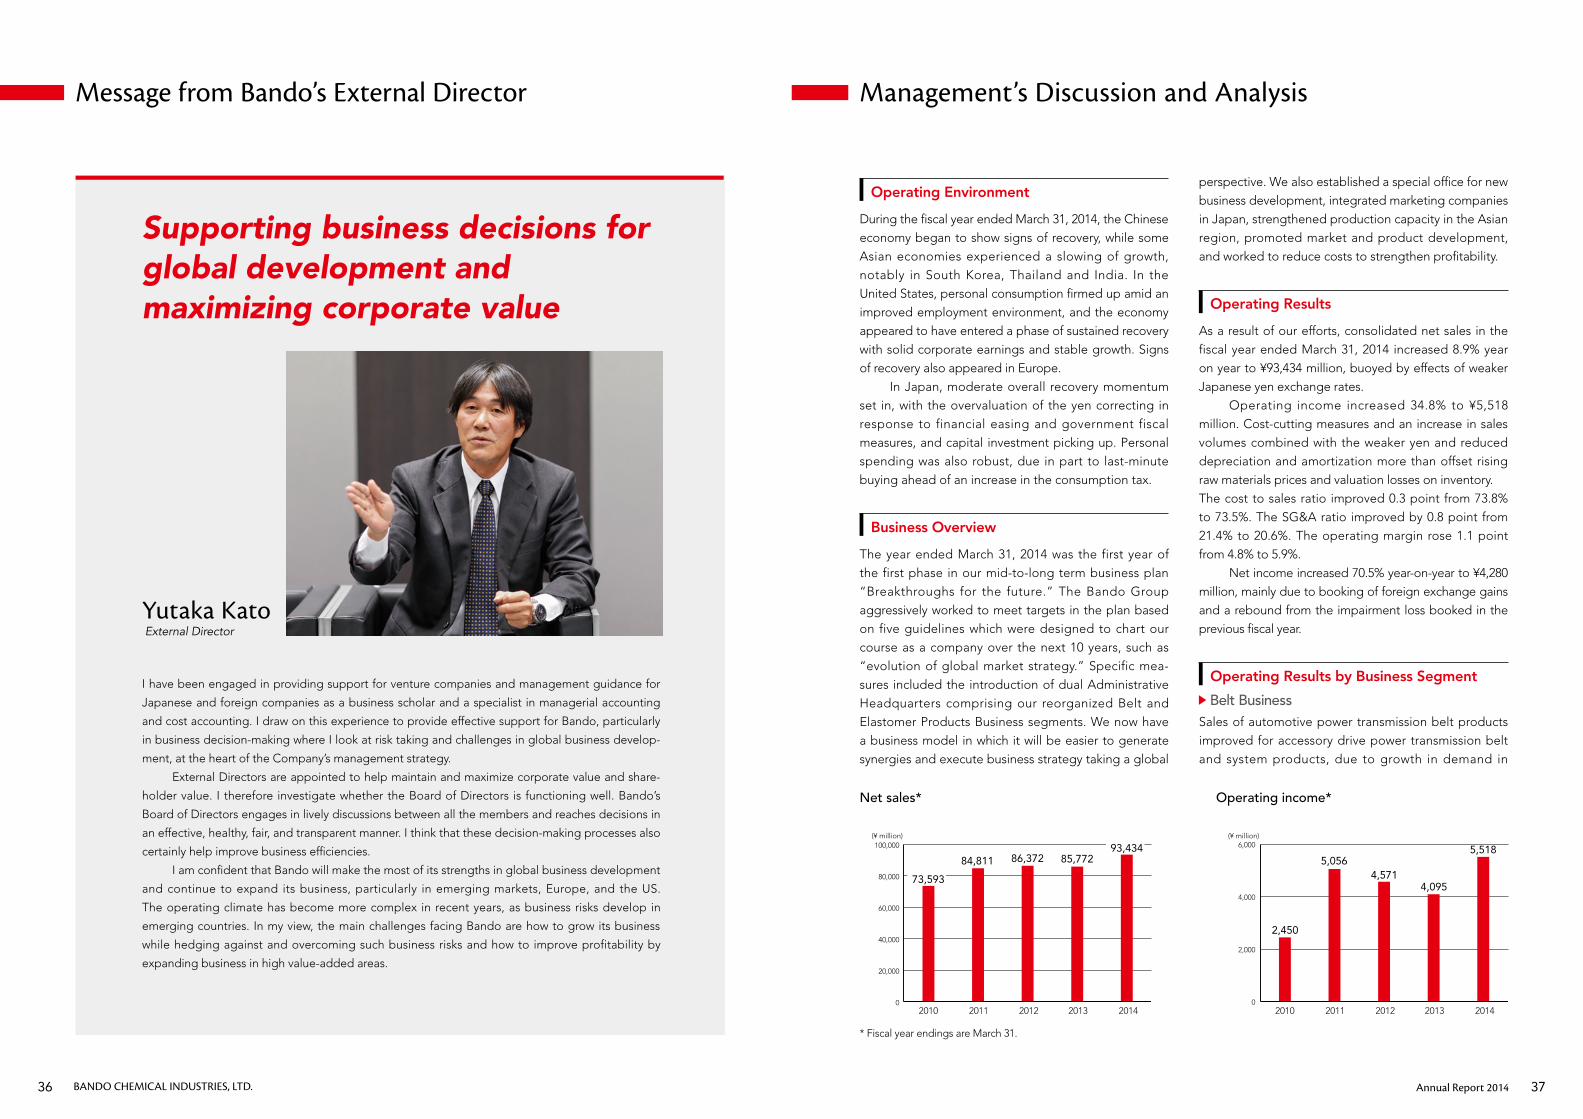
I have been engaged in providing support for venture companies and management guidance for
Japanese and foreign companies as a business scholar and a specialist in managerial accounting
and cost accounting. I draw on this experience to provide effective support for Bando, particularly
in business decision-making where I look at risk taking and challenges in global business develop-
ment, at the heart of the Company’s management strategy.
External Directors are appointed to help maintain and maximize corporate value and share-
holder value. I therefore investigate whether the Board of Directors is functioning well. Bando’s
Board of Directors engages in lively discussions between all the members and reaches decisions in
an effective, healthy, fair, and transparent manner. I think that these decision-making processes also
certainly help improve business efficiencies.
I am confident that Bando will make the most of its strengths in global business development
and continue to expand its business, particularly in emerging markets, Europe, and the US.
The operating climate has become more complex in recent years, as business risks develop in
emerging countries. In my view, the main challenges facing Bando are how to grow its business
while hedging against and overcoming such business risks and how to improve profitability by
expanding business in high value-added areas.
External Director
Supporting business decisions for global development and maximizing corporate value
Yutaka Kato
Annual Report 201436 37BANDO CHEMICAL INDUSTRIES, LTD.
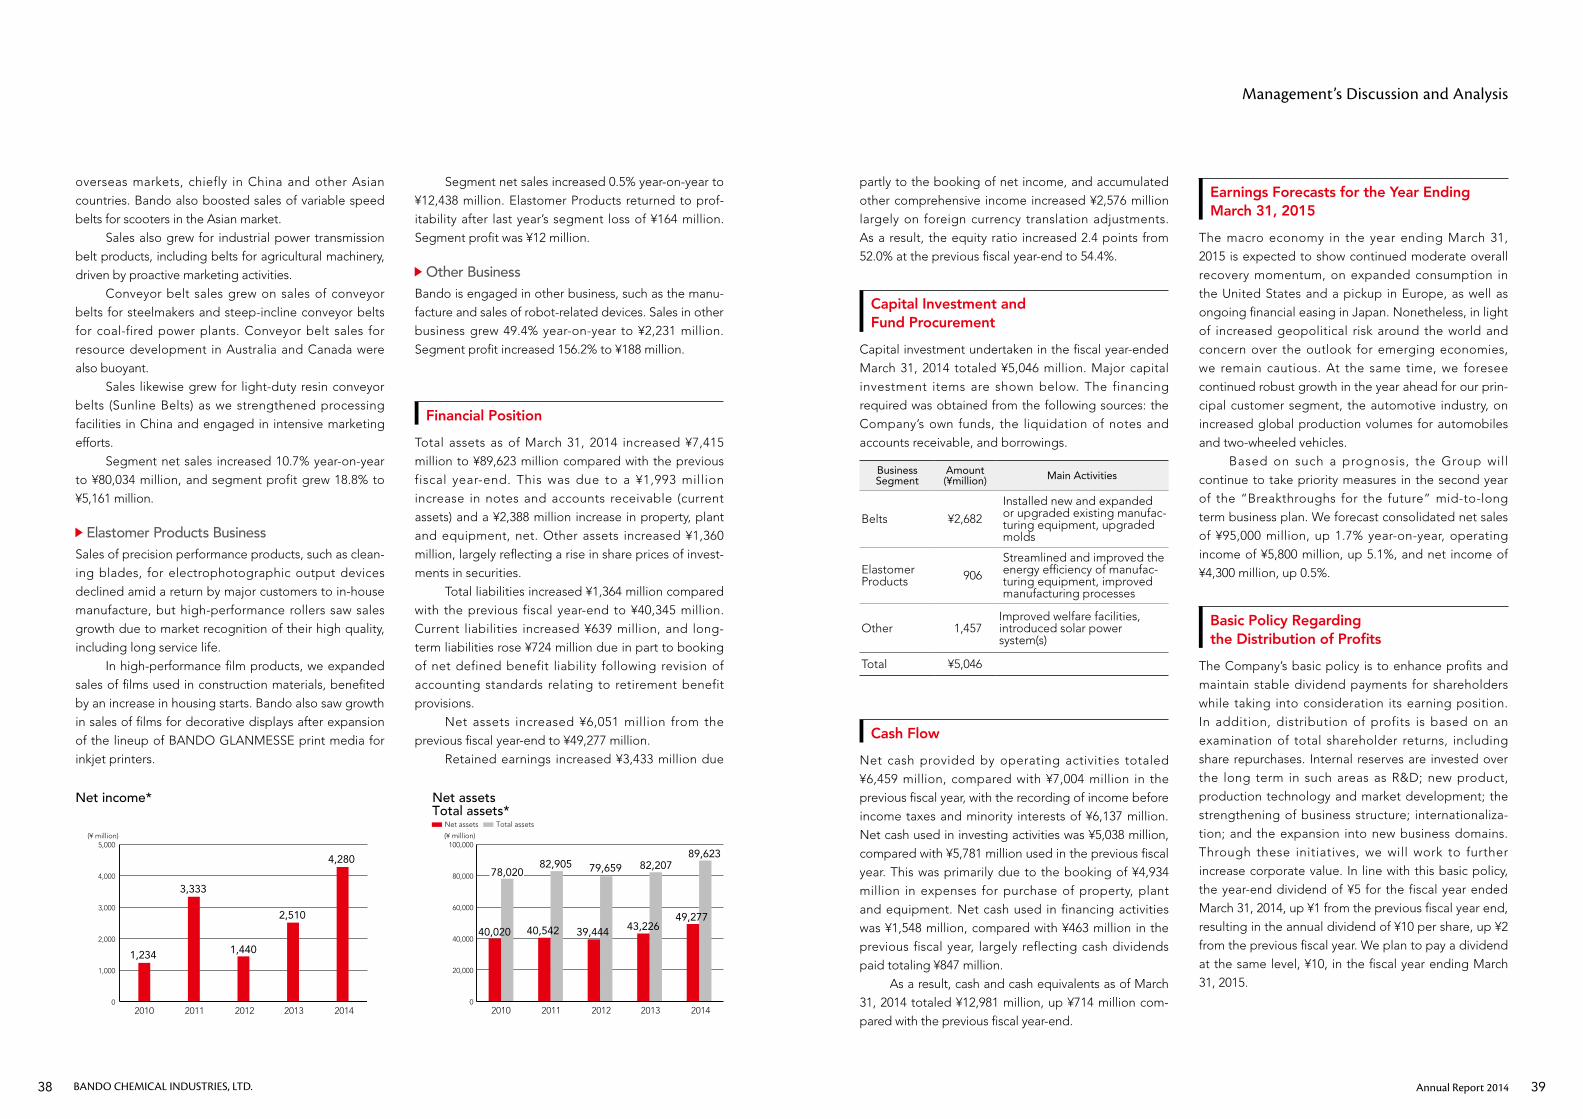
partly to the booking of net income, and accumulated other comprehensive income increased ¥2,576 million largely on foreign currency translation adjustments. As a result, the equity ratio increased 2.4 points from 52.0% at the previous fiscal year-end to 54.4%.
Capital Investment and Fund Procurement
Capital investment undertaken in the fiscal year-ended March 31, 2014 totaled ¥5,046 million. Major capital investment items are shown below. The financing required was obtained from the following sources: the Company’s own funds, the liquidation of notes and accounts receivable, and borrowings.
Business Segment
Amount(¥million) Main Activities
Belts ¥2,682
Installed new and expanded or upgraded existing manufac-turing equipment, upgraded molds
Elastomer Products 906
Streamlined and improved the energy efficiency of manufac-turing equipment, improved manufacturing processes
Other 1,457Improved welfare facilities, introduced solar power system(s)
Total ¥5,046
Cash Flow
Net cash provided by operating activities totaled ¥6,459 million, compared with ¥7,004 million in the previous fiscal year, with the recording of income before income taxes and minority interests of ¥6,137 million. Net cash used in investing activities was ¥5,038 million, compared with ¥5,781 million used in the previous fiscal year. This was primarily due to the booking of ¥4,934 million in expenses for purchase of property, plant and equipment. Net cash used in financing activities was ¥1,548 million, compared with ¥463 million in the previous fiscal year, largely reflecting cash dividends paid totaling ¥847 million. As a result, cash and cash equivalents as of March 31, 2014 totaled ¥12,981 million, up ¥714 million com-pared with the previous fiscal year-end.
Earnings Forecasts for the Year Ending March 31, 2015
The macro economy in the year ending March 31, 2015 is expected to show continued moderate overall recovery momentum, on expanded consumption in the United States and a pickup in Europe, as well as ongoing financial easing in Japan. Nonetheless, in light of increased geopolitical risk around the world and concern over the outlook for emerging economies, we remain cautious. At the same time, we foresee continued robust growth in the year ahead for our prin-cipal customer segment, the automotive industry, on increased global production volumes for automobiles and two-wheeled vehicles. Based on such a prognosis, the Group will continue to take priority measures in the second year of the “Breakthroughs for the future” mid-to-long term business plan. We forecast consolidated net sales of ¥95,000 million, up 1.7% year-on-year, operating income of ¥5,800 million, up 5.1%, and net income of ¥4,300 million, up 0.5%.
Basic Policy Regarding the Distribution of Profits
The Company’s basic policy is to enhance profits and maintain stable dividend payments for shareholders while taking into consideration its earning position. In addition, distribution of profits is based on an examination of total shareholder returns, including share repurchases. Internal reserves are invested over the long term in such areas as R&D; new product, production technology and market development; the strengthening of business structure; internationaliza-tion; and the expansion into new business domains. Through these initiatives, we will work to further increase corporate value. In line with this basic policy, the year-end dividend of ¥5 for the fiscal year ended March 31, 2014, up ¥1 from the previous fiscal year end, resulting in the annual dividend of ¥10 per share, up ¥2 from the previous fiscal year. We plan to pay a dividend at the same level, ¥10, in the fiscal year ending March 31, 2015.
Management’s Discussion and Analysis
overseas markets, chiefly in China and other Asian countries. Bando also boosted sales of variable speed belts for scooters in the Asian market. Sales also grew for industrial power transmission belt products, including belts for agricultural machinery, driven by proactive marketing activities. Conveyor belt sales grew on sales of conveyor belts for steelmakers and steep-incline conveyor belts for coal-fired power plants. Conveyor belt sales for resource development in Australia and Canada were also buoyant. Sales likewise grew for light-duty resin conveyor belts (Sunline Belts) as we strengthened processing facilities in China and engaged in intensive marketing efforts. Segment net sales increased 10.7% year-on-year to ¥80,034 million, and segment profit grew 18.8% to ¥5,161 million.
Elastomer Products BusinessSales of precision performance products, such as clean-ing blades, for electrophotographic output devices declined amid a return by major customers to in-house manufacture, but high-performance rollers saw sales growth due to market recognition of their high quality, including long service life. In high-performance film products, we expanded sales of films used in construction materials, benefited by an increase in housing starts. Bando also saw growth in sales of films for decorative displays after expansion of the lineup of BANDO GLANMESSE print media for inkjet printers.
Segment net sales increased 0.5% year-on-year to ¥12,438 million. Elastomer Products returned to prof-itability after last year’s segment loss of ¥164 million. Segment profit was ¥12 million.
Other BusinessBando is engaged in other business, such as the manu-facture and sales of robot-related devices. Sales in other business grew 49.4% year-on-year to ¥2,231 million. Segment profit increased 156.2% to ¥188 million.
Financial Position
Total assets as of March 31, 2014 increased ¥7,415 million to ¥89,623 million compared with the previous fiscal year-end. This was due to a ¥1,993 million increase in notes and accounts receivable (current assets) and a ¥2,388 million increase in property, plant and equipment, net. Other assets increased ¥1,360 million, largely reflecting a rise in share prices of invest-ments in securities. Total liabilities increased ¥1,364 million compared with the previous fiscal year-end to ¥40,345 million. Current liabilities increased ¥639 million, and long-term liabilities rose ¥724 million due in part to booking of net defined benefit liability following revision of accounting standards relating to retirement benefit provisions. Net assets increased ¥6,051 million from the previous fiscal year-end to ¥49,277 million. Retained earnings increased ¥3,433 million due
Net income*
2010 2011 2012 2013 2014
(¥ million)
0
1,000
2,000
3,000
4,000
5,000
1,234
3,333
1,440
2,510
4,280
Net assetsTotal assets*
2010 2011 2012 2013 2014
(¥ million)
Net assets Total assets
0
20,000
40,000
60,000
80,000
100,000
40,020
78,020
40,542
82,905
39,444
79,659
43,226
82,207
49,277
89,623
Annual Report 201438 39BANDO CHEMICAL INDUSTRIES, LTD.
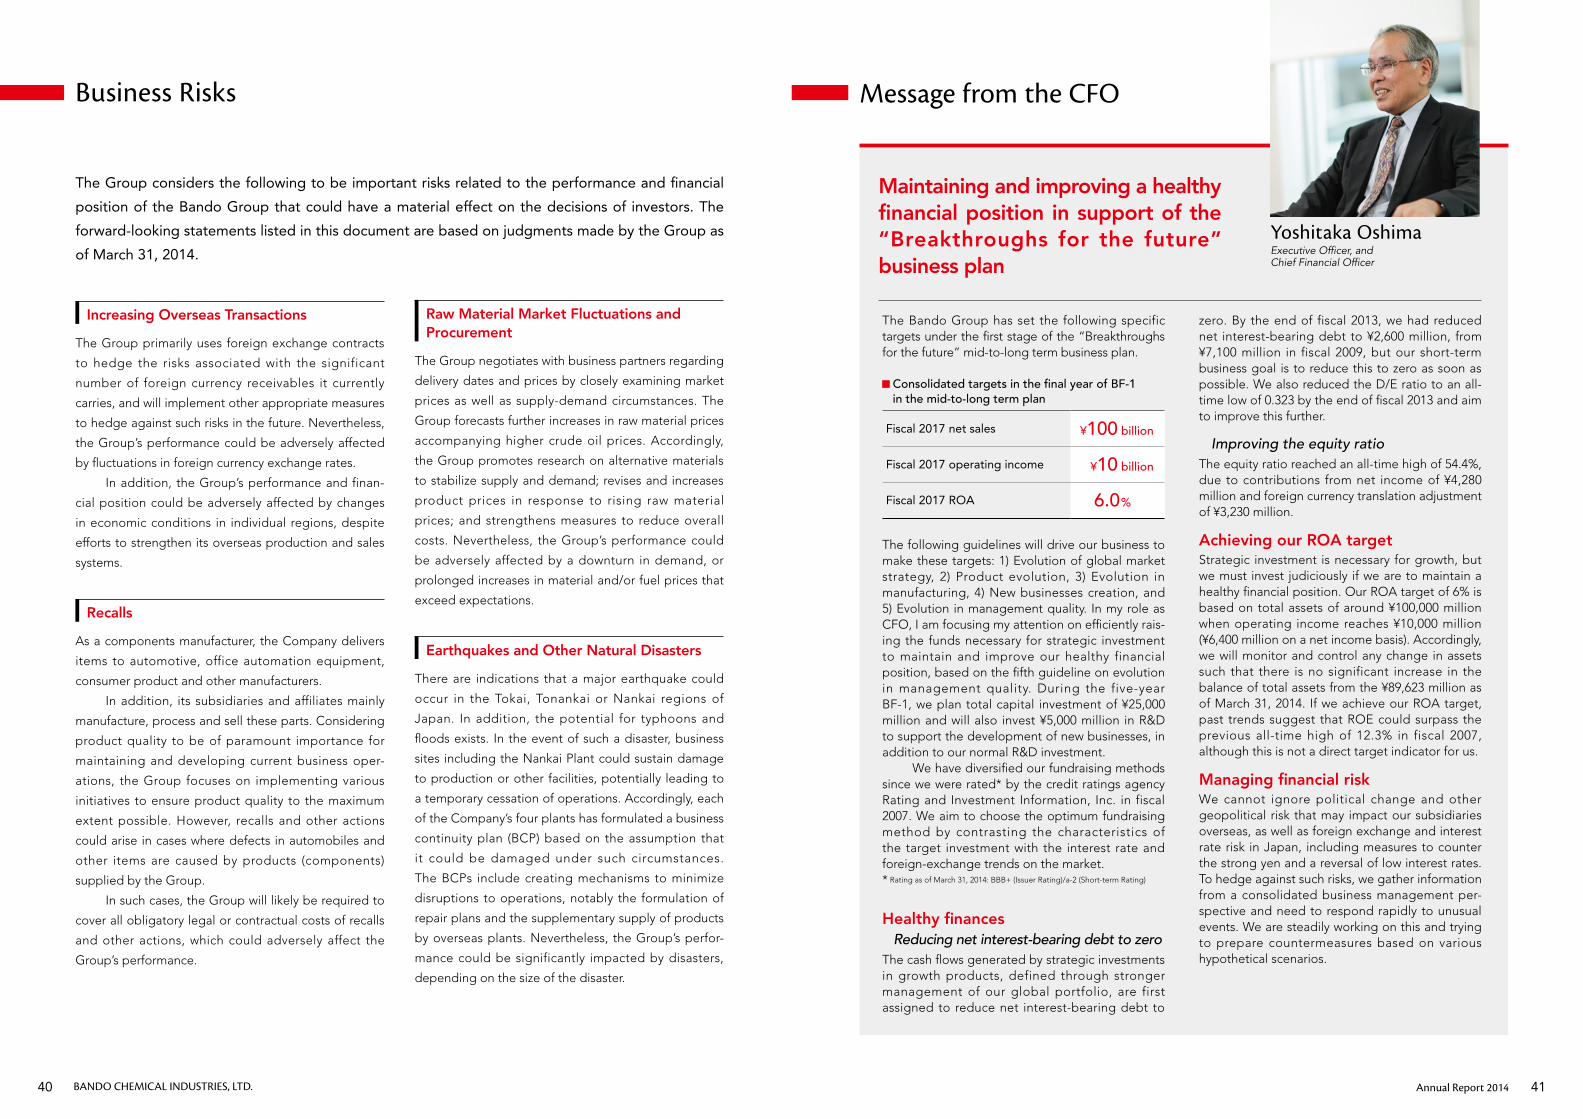
Business Risks
Increasing Overseas Transactions
The Group primarily uses foreign exchange contracts
to hedge the risks associated with the significant
number of foreign currency receivables it currently
carries, and will implement other appropriate measures
to hedge against such risks in the future. Nevertheless,
the Group’s performance could be adversely affected
by fluctuations in foreign currency exchange rates.
In addition, the Group’s performance and finan-
cial position could be adversely affected by changes
in economic conditions in individual regions, despite
efforts to strengthen its overseas production and sales
systems.
Recalls
As a components manufacturer, the Company delivers
items to automotive, office automation equipment,
consumer product and other manufacturers.
In addition, its subsidiaries and affiliates mainly
manufacture, process and sell these parts. Considering
product quality to be of paramount importance for
maintaining and developing current business oper-
ations, the Group focuses on implementing various
initiatives to ensure product quality to the maximum
extent possible. However, recalls and other actions
could arise in cases where defects in automobiles and
other items are caused by products (components)
supplied by the Group.
In such cases, the Group will likely be required to
cover all obligatory legal or contractual costs of recalls
and other actions, which could adversely affect the
Group’s performance.
Raw Material Market Fluctuations and Procurement
The Group negotiates with business partners regarding
delivery dates and prices by closely examining market
prices as well as supply-demand circumstances. The
Group forecasts further increases in raw material prices
accompanying higher crude oil prices. Accordingly,
the Group promotes research on alternative materials
to stabilize supply and demand; revises and increases
product prices in response to rising raw material
prices; and strengthens measures to reduce overall
costs. Nevertheless, the Group’s performance could
be adversely affected by a downturn in demand, or
prolonged increases in material and/or fuel prices that
exceed expectations.
Earthquakes and Other Natural Disasters
There are indications that a major earthquake could
occur in the Tokai, Tonankai or Nankai regions of
Japan. In addition, the potential for typhoons and
floods exists. In the event of such a disaster, business
sites including the Nankai Plant could sustain damage
to production or other facilities, potentially leading to
a temporary cessation of operations. Accordingly, each
of the Company’s four plants has formulated a business
continuity plan (BCP) based on the assumption that
it could be damaged under such circumstances.
The BCPs include creating mechanisms to minimize
disruptions to operations, notably the formulation of
repair plans and the supplementary supply of products
by overseas plants. Nevertheless, the Group’s perfor-
mance could be significantly impacted by disasters,
depending on the size of the disaster.
The Group considers the following to be important risks related to the performance and financial
position of the Bando Group that could have a material effect on the decisions of investors. The
forward-looking statements listed in this document are based on judgments made by the Group as
of March 31, 2014.
Message from the CFO
Executive Officer, andChief Financial Officer
Yoshitaka Oshima
The Bando Group has set the following specific targets under the first stage of the “Breakthroughs for the future” mid-to-long term business plan.
Consolidated targets in the final year of BF-1 in the mid-to-long term plan
Fiscal 2017 net sales ¥100 billion
Fiscal 2017 operating income ¥10 billion
Fiscal 2017 ROA 6.0%
The following guidelines will drive our business to make these targets: 1) Evolution of global market strategy, 2) Product evolution, 3) Evolution in manufacturing, 4) New businesses creation, and 5) Evolution in management quality. In my role as CFO, I am focusing my attention on efficiently rais-ing the funds necessary for strategic investment to maintain and improve our healthy financial position, based on the fifth guideline on evolution in management quality. During the five-year BF-1, we plan total capital investment of ¥25,000 million and will also invest ¥5,000 million in R&D to support the development of new businesses, in addition to our normal R&D investment. We have diversified our fundraising methods since we were rated* by the credit ratings agency Rating and Investment Information, Inc. in fiscal 2007. We aim to choose the optimum fundraising method by contrasting the characteristics of the target investment with the interest rate and foreign-exchange trends on the market. * Rating as of March 31, 2014: BBB+ (Issuer Rating)/a-2 (Short-term Rating)
Healthy finances Reducing net interest-bearing debt to zeroThe cash flows generated by strategic investments in growth products, defined through stronger management of our global portfolio, are first assigned to reduce net interest-bearing debt to
zero. By the end of fiscal 2013, we had reduced net interest-bearing debt to ¥2,600 million, from ¥7,100 million in fiscal 2009, but our short-term business goal is to reduce this to zero as soon as possible. We also reduced the D/E ratio to an all-time low of 0.323 by the end of fiscal 2013 and aim to improve this further.
Improving the equity ratioThe equity ratio reached an all-time high of 54.4%, due to contributions from net income of ¥4,280 million and foreign currency translation adjustment of ¥3,230 million.
Achieving our ROA targetStrategic investment is necessary for growth, but we must invest judiciously if we are to maintain a healthy financial position. Our ROA target of 6% is based on total assets of around ¥100,000 million when operating income reaches ¥10,000 million (¥6,400 million on a net income basis). Accordingly, we will monitor and control any change in assets such that there is no significant increase in the balance of total assets from the ¥89,623 million as of March 31, 2014. If we achieve our ROA target, past trends suggest that ROE could surpass the previous all-time high of 12.3% in fiscal 2007, although this is not a direct target indicator for us.
Managing financial riskWe cannot ignore political change and other geopolitical risk that may impact our subsidiaries overseas, as well as foreign exchange and interest rate risk in Japan, including measures to counter the strong yen and a reversal of low interest rates. To hedge against such risks, we gather information from a consolidated business management per-spective and need to respond rapidly to unusual events. We are steadily working on this and trying to prepare countermeasures based on various hypothetical scenarios.
Maintaining and improving a healthy financial position in support of the “Breakthroughs for the future” business plan
Annual Report 201440 41BANDO CHEMICAL INDUSTRIES, LTD.
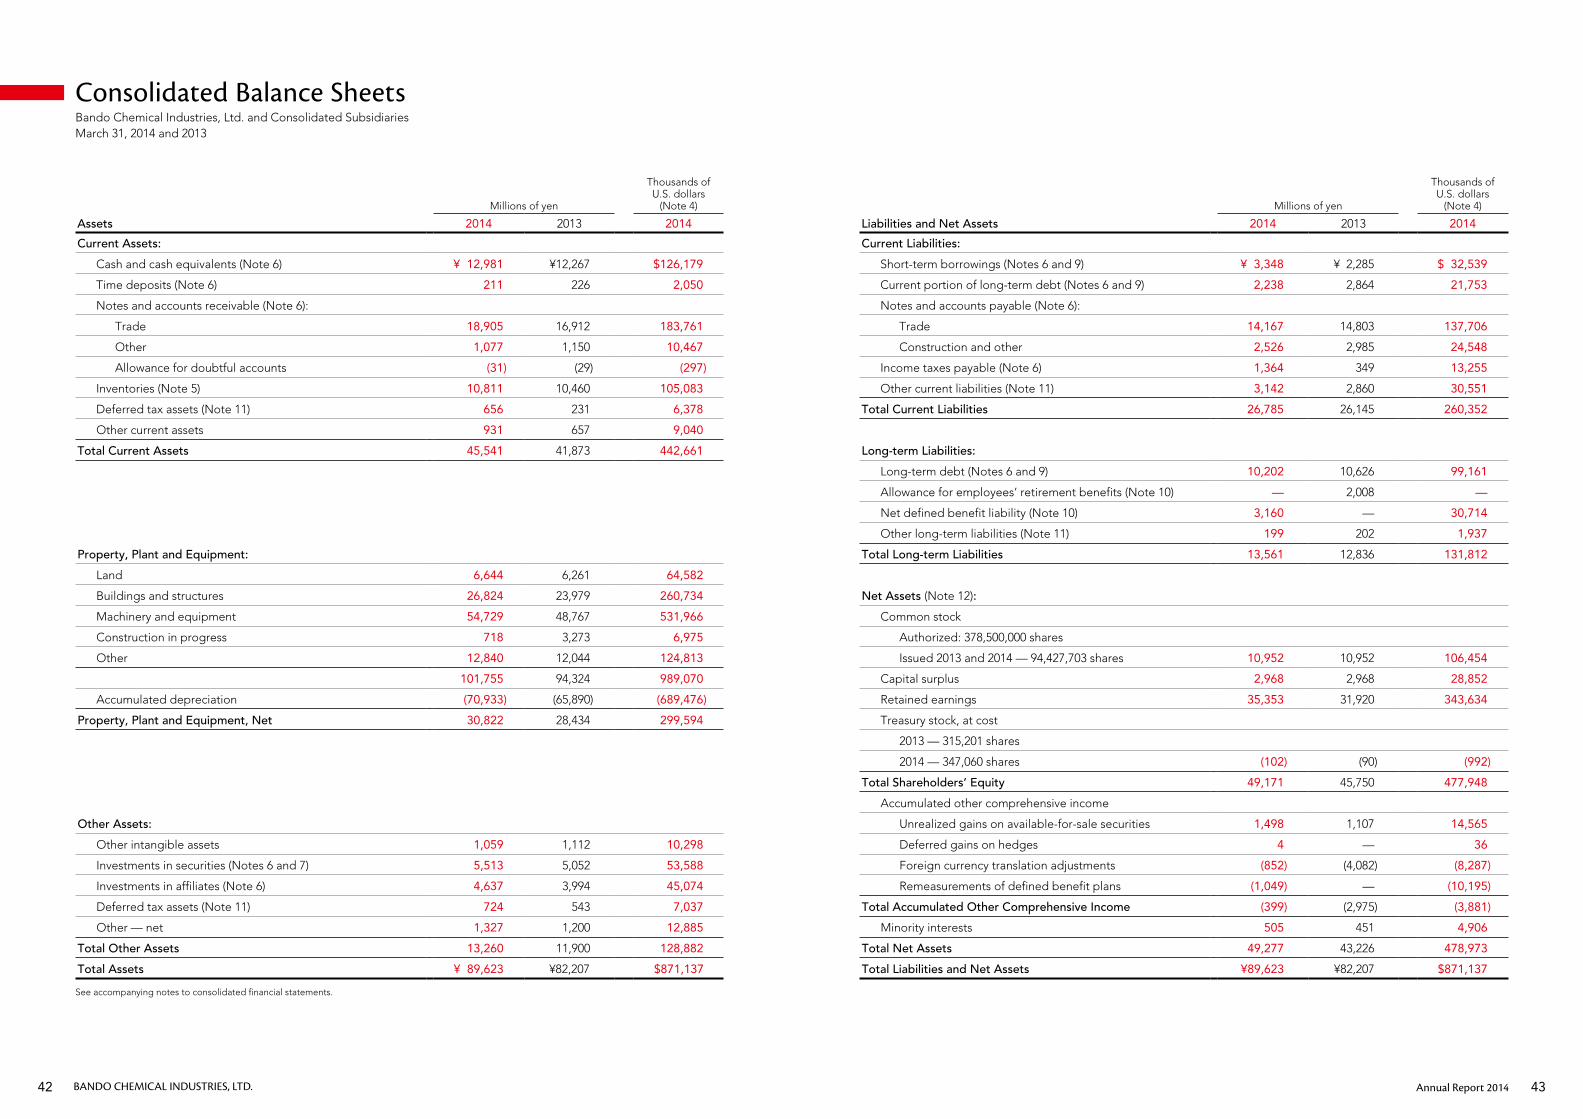
Millions of yen
Thousands of U.S. dollars
(Note 4)
Liabilities and Net Assets 2014 2013 2014
Current Liabilities:
Short-term borrowings (Notes 6 and 9) ¥ 3,348 ¥ 2,285 $ 32,539
Current portion of long-term debt (Notes 6 and 9) 2,238 2,864 21,753
Notes and accounts payable (Note 6):
Trade 14,167 14,803 137,706
Construction and other 2,526 2,985 24,548
Income taxes payable (Note 6) 1,364 349 13,255
Other current liabilities (Note 11) 3,142 2,860 30,551
Total Current Liabilities 26,785 26,145 260,352
Long-term Liabilities:
Long-term debt (Notes 6 and 9) 10,202 10,626 99,161
Allowance for employees’ retirement benefits (Note 10) — 2,008 —
Net defined benefit liability (Note 10) 3,160 — 30,714
Other long-term liabilities (Note 11) 199 202 1,937
Total Long-term Liabilities 13,561 12,836 131,812
Net Assets (Note 12):
Common stock
Authorized: 378,500,000 shares
Issued 2013 and 2014 — 94,427,703 shares 10,952 10,952 106,454
Capital surplus 2,968 2,968 28,852
Retained earnings 35,353 31,920 343,634
Treasury stock, at cost
2013 — 315,201 shares
2014 — 347,060 shares (102) (90) (992)
Total Shareholders’ Equity 49,171 45,750 477,948
Accumulated other comprehensive income
Unrealized gains on available-for-sale securities 1,498 1,107 14,565
Deferred gains on hedges 4 — 36
Foreign currency translation adjustments (852) (4,082) (8,287)
Remeasurements of defined benefit plans (1,049) — (10,195)
Total Accumulated Other Comprehensive Income (399) (2,975) (3,881)
Minority interests 505 451 4,906
Total Net Assets 49,277 43,226 478,973
Total Liabilities and Net Assets ¥89,623 ¥82,207 $871,137
Consolidated Balance Sheets
Millions of yen
Thousands of U.S. dollars
(Note 4)
Assets 2014 2013 2014
Current Assets:
Cash and cash equivalents (Note 6) ¥ 12,981 ¥12,267 $126,179
Time deposits (Note 6) 211 226 2,050
Notes and accounts receivable (Note 6):
Trade 18,905 16,912 183,761
Other 1,077 1,150 10,467
Allowance for doubtful accounts (31) (29) (297)
Inventories (Note 5) 10,811 10,460 105,083
Deferred tax assets (Note 11) 656 231 6,378
Other current assets 931 657 9,040
Total Current Assets 45,541 41,873 442,661
Property, Plant and Equipment:
Land 6,644 6,261 64,582
Buildings and structures 26,824 23,979 260,734
Machinery and equipment 54,729 48,767 531,966
Construction in progress 718 3,273 6,975
Other 12,840 12,044 124,813
101,755 94,324 989,070
Accumulated depreciation (70,933) (65,890) (689,476)
Property, Plant and Equipment, Net 30,822 28,434 299,594
Other Assets:
Other intangible assets 1,059 1,112 10,298
Investments in securities (Notes 6 and 7) 5,513 5,052 53,588
Investments in affiliates (Note 6) 4,637 3,994 45,074
Deferred tax assets (Note 11) 724 543 7,037
Other — net 1,327 1,200 12,885
Total Other Assets 13,260 11,900 128,882
Total Assets ¥ 89,623 ¥82,207 $871,137
See accompanying notes to consolidated financial statements.
Bando Chemical Industries, Ltd. and Consolidated SubsidiariesMarch 31, 2014 and 2013
Annual Report 201442 43BANDO CHEMICAL INDUSTRIES, LTD.
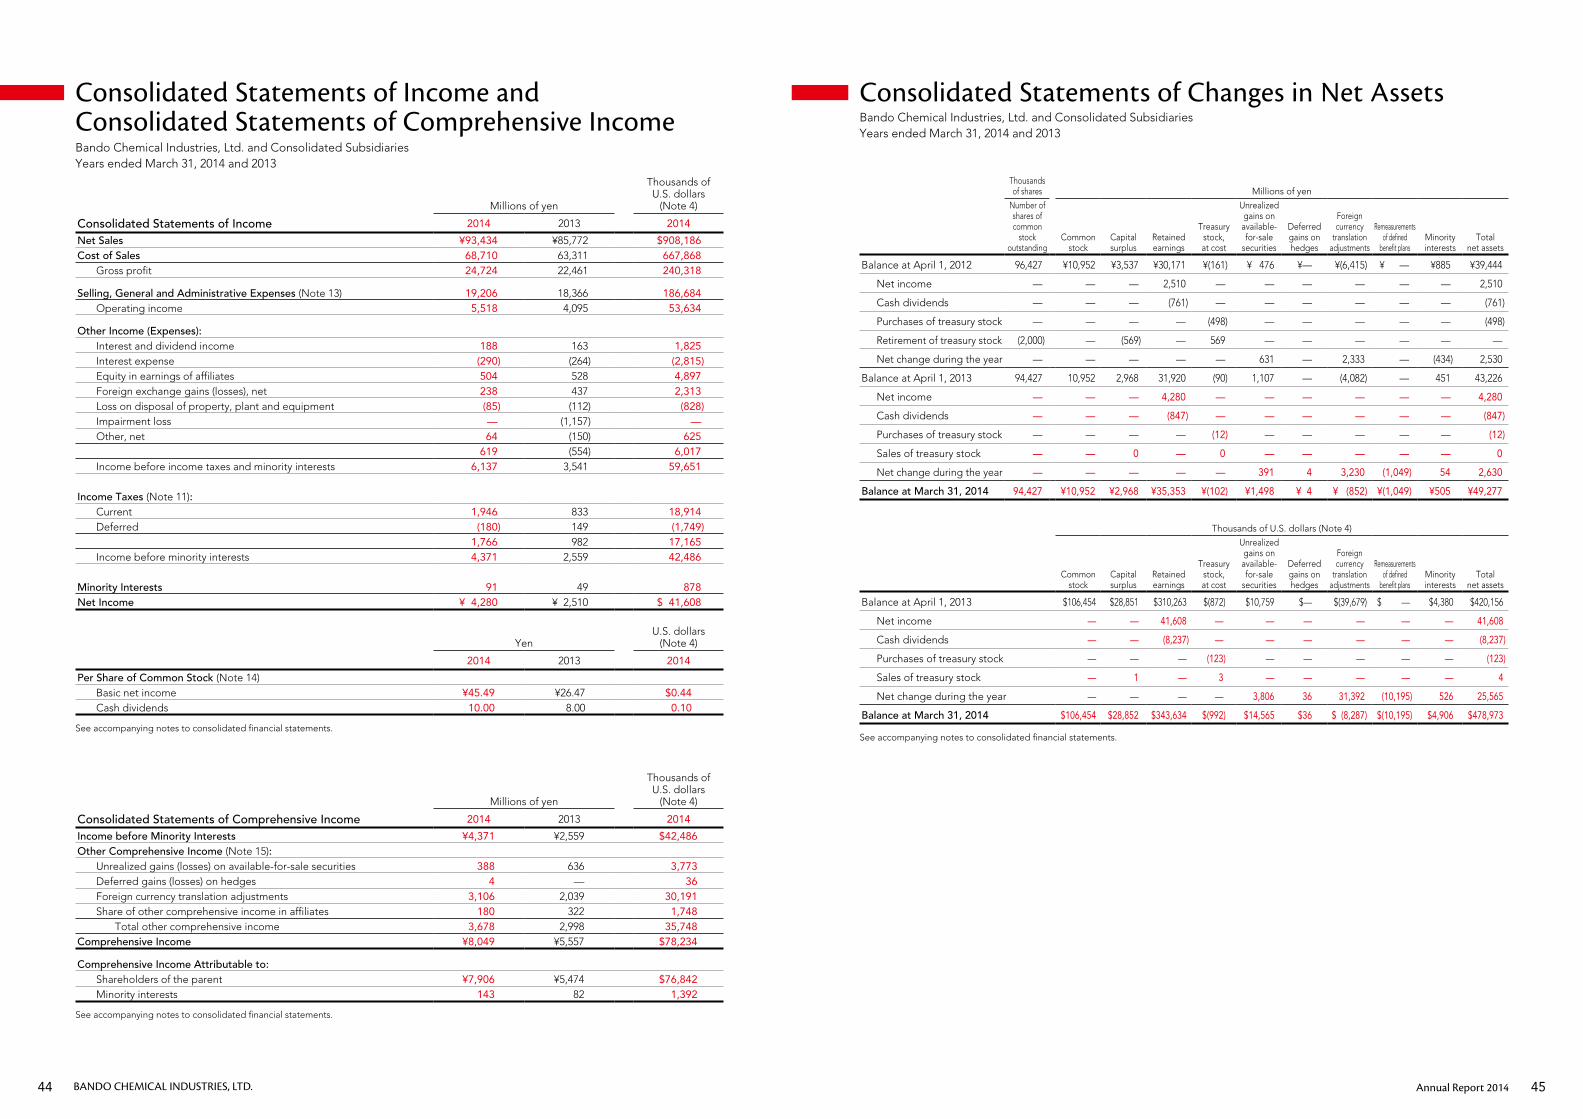
Consolidated Statements of Income andConsolidated Statements of Comprehensive IncomeBando Chemical Industries, Ltd. and Consolidated SubsidiariesYears ended March 31, 2014 and 2013
Millions of yen
Thousands of U.S. dollars
(Note 4)
Consolidated Statements of Income 2014 2013 2014
Net Sales ¥93,434 ¥85,772 $908,186Cost of Sales 68,710 63,311 667,868
Gross profit 24,724 22,461 240,318
Selling, General and Administrative Expenses (Note 13) 19,206 18,366 186,684Operating income 5,518 4,095 53,634
Other Income (Expenses):Interest and dividend income 188 163 1,825Interest expense (290) (264) (2,815)Equity in earnings of affiliates 504 528 4,897Foreign exchange gains (losses), net 238 437 2,313Loss on disposal of property, plant and equipment (85) (112) (828)Impairment loss — (1,157) —Other, net 64 (150) 625
619 (554) 6,017Income before income taxes and minority interests 6,137 3,541 59,651
Income Taxes (Note 11):Current 1,946 833 18,914Deferred (180) 149 (1,749)
1,766 982 17,165Income before minority interests 4,371 2,559 42,486
Minority Interests 91 49 878Net Income ¥ 4,280 ¥ 2,510 $ 41,608
YenU.S. dollars
(Note 4)
2014 2013 2014
Per Share of Common Stock (Note 14)Basic net income ¥45.49 ¥26.47 $0.44Cash dividends 10.00 8.00 0.10
See accompanying notes to consolidated financial statements.
Millions of yen
Thousands of U.S. dollars
(Note 4)
Consolidated Statements of Comprehensive Income 2014 2013 2014
Income before Minority Interests ¥4,371 ¥2,559 $42,486Other Comprehensive Income (Note 15):
Unrealized gains (losses) on available-for-sale securities 388 636 3,773Deferred gains (losses) on hedges 4 — 36Foreign currency translation adjustments 3,106 2,039 30,191Share of other comprehensive income in affiliates 180 322 1,748
Total other comprehensive income 3,678 2,998 35,748Comprehensive Income ¥8,049 ¥5,557 $78,234
Comprehensive Income Attributable to:Shareholders of the parent ¥7,906 ¥5,474 $76,842Minority interests 143 82 1,392
See accompanying notes to consolidated financial statements.
Consolidated Statements of Changes in Net AssetsBando Chemical Industries, Ltd. and Consolidated SubsidiariesYears ended March 31, 2014 and 2013
Thousands of shares Millions of yen
Number of shares of common
stock outstanding
Common stock
Capital surplus
Retained earnings
Treasury stock, at cost
Unrealized gains on available-for-sale
securities
Deferred gains on hedges
Foreign currency
translation adjustments
Remeasurements of defined
benefit plansMinority interests
Total net assets
Balance at April 1, 2012 96,427 ¥10,952 ¥3,537 ¥30,171 ¥(161) ¥ 476 ¥— ¥(6,415) ¥ — ¥885 ¥39,444
Net income — — — 2,510 — — — — — — 2,510
Cash dividends — — — (761) — — — — — — (761)
Purchases of treasury stock — — — — (498) — — — — — (498)
Retirement of treasury stock (2,000) — (569) — 569 — — — — — —
Net change during the year — — — — — 631 — 2,333 — (434) 2,530
Balance at April 1, 2013 94,427 10,952 2,968 31,920 (90) 1,107 — (4,082) — 451 43,226
Net income — — — 4,280 — — — — — — 4,280
Cash dividends — — — (847) — — — — — — (847)
Purchases of treasury stock — — — — (12) — — — — — (12)
Sales of treasury stock — — 0 — 0 — — — — — 0
Net change during the year — — — — — 391 4 3,230 (1,049) 54 2,630
Balance at March 31, 2014 94,427 ¥10,952 ¥2,968 ¥35,353 ¥(102) ¥1,498 ¥ 4 ¥ (852) ¥(1,049) ¥505 ¥49,277
Thousands of U.S. dollars (Note 4)
Common stock
Capital surplus
Retained earnings
Treasury stock, at cost
Unrealized gains on available-for-sale
securities
Deferred gains on hedges
Foreign currency
translation adjustments
Remeasurements of defined
benefit plansMinority interests
Total net assets
Balance at April 1, 2013 $106,454 $28,851 $310,263 $(872) $10,759 $— $(39,679) $ — $4,380 $420,156
Net income — — 41,608 — — — — — — 41,608
Cash dividends — — (8,237) — — — — — — (8,237)
Purchases of treasury stock — — — (123) — — — — — (123)
Sales of treasury stock — 1 — 3 — — — — — 4
Net change during the year — — — — 3,806 36 31,392 (10,195) 526 25,565
Balance at March 31, 2014 $106,454 $28,852 $343,634 $(992) $14,565 $36 $ (8,287) $(10,195) $4,906 $478,973
See accompanying notes to consolidated financial statements.
Annual Report 201444 45BANDO CHEMICAL INDUSTRIES, LTD.
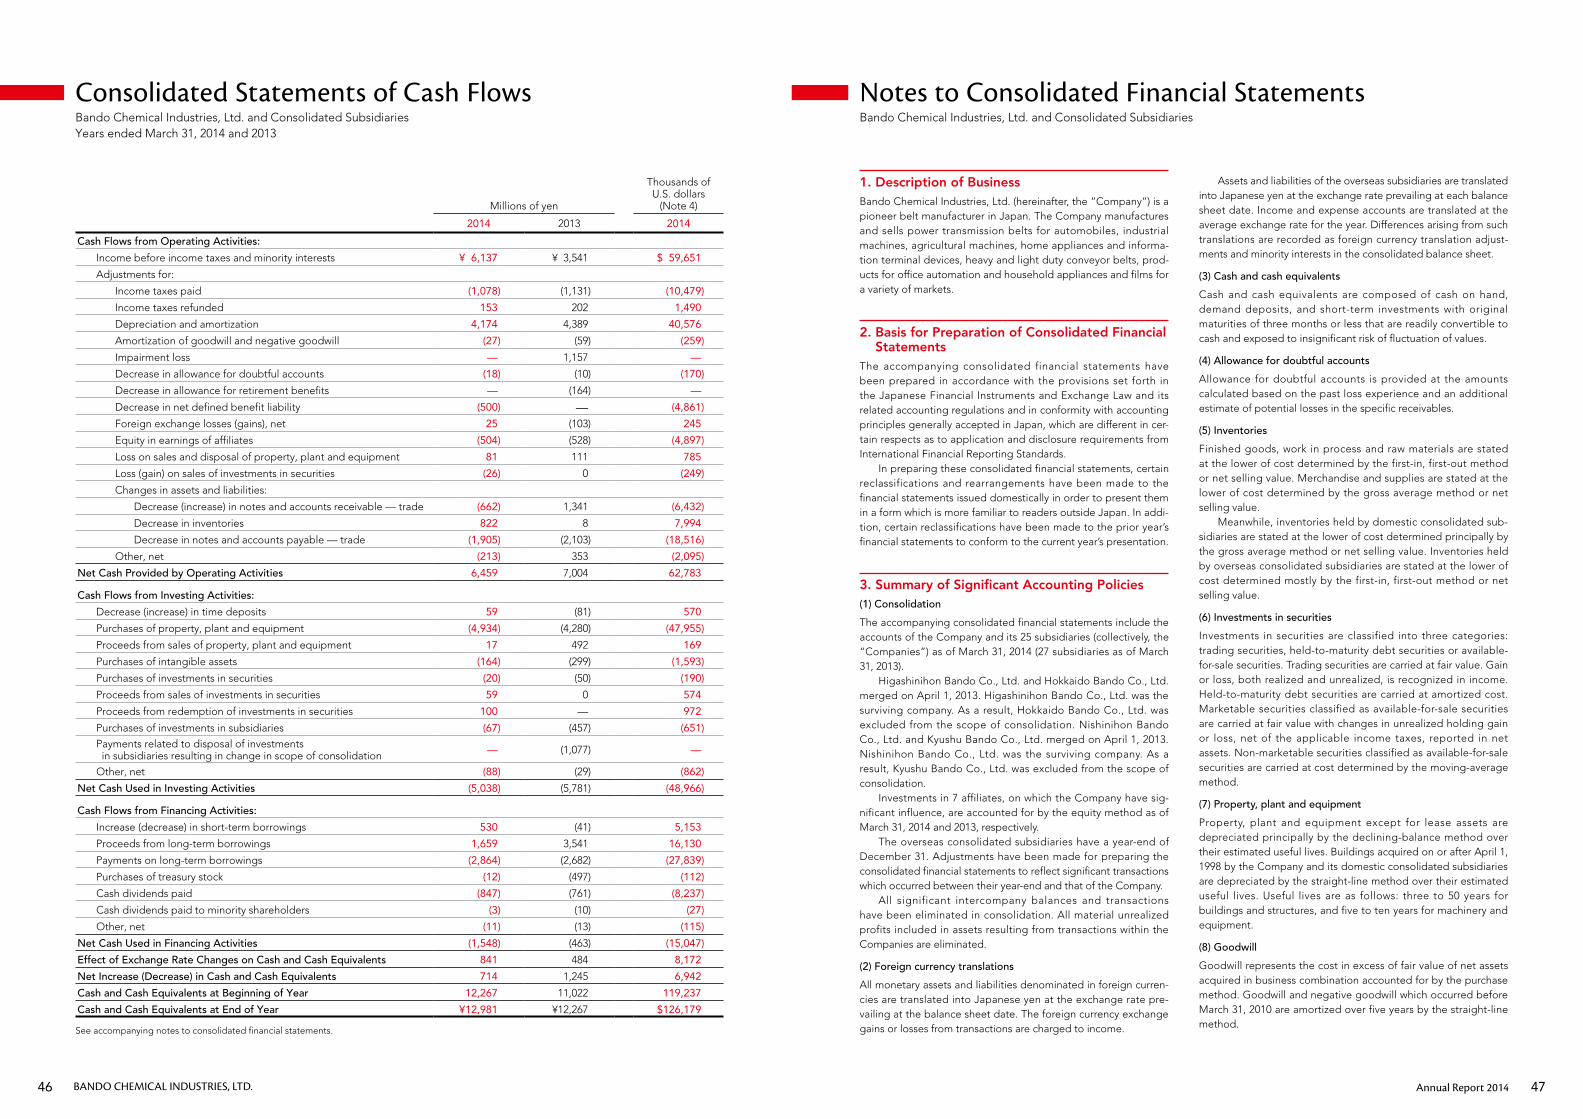
Notes to Consolidated Financial StatementsBando Chemical Industries, Ltd. and Consolidated Subsidiaries
1. Description of BusinessBando Chemical Industries, Ltd. (hereinafter, the “Company”) is a pioneer belt manufacturer in Japan. The Company manufactures and sells power transmission belts for automobiles, industrial machines, agricultural machines, home appliances and informa-tion terminal devices, heavy and light duty conveyor belts, prod-ucts for office automation and household appliances and films for a variety of markets.
2. Basis for Preparation of Consolidated Financial
StatementsThe accompanying consolidated financial statements have been prepared in accordance with the provisions set forth in the Japanese Financial Instruments and Exchange Law and its related accounting regulations and in conformity with accounting principles generally accepted in Japan, which are different in cer-tain respects as to application and disclosure requirements from International Financial Reporting Standards. In preparing these consolidated financial statements, certain reclassifications and rearrangements have been made to the financial statements issued domestically in order to present them in a form which is more familiar to readers outside Japan. In addi-tion, certain reclassifications have been made to the prior year’s financial statements to conform to the current year’s presentation.
3. Summary of Significant Accounting Policies(1) Consolidation
The accompanying consolidated financial statements include the accounts of the Company and its 25 subsidiaries (collectively, the “Companies”) as of March 31, 2014 (27 subsidiaries as of March 31, 2013). Higashinihon Bando Co., Ltd. and Hokkaido Bando Co., Ltd. merged on April 1, 2013. Higashinihon Bando Co., Ltd. was the surviving company. As a result, Hokkaido Bando Co., Ltd. was excluded from the scope of consolidation. Nishinihon Bando Co., Ltd. and Kyushu Bando Co., Ltd. merged on April 1, 2013. Nishinihon Bando Co., Ltd. was the surviving company. As a result, Kyushu Bando Co., Ltd. was excluded from the scope of consolidation. Investments in 7 affiliates, on which the Company have sig-nificant influence, are accounted for by the equity method as of March 31, 2014 and 2013, respectively. The overseas consolidated subsidiaries have a year-end of December 31. Adjustments have been made for preparing the consolidated financial statements to reflect significant transactions which occurred between their year-end and that of the Company. All significant intercompany balances and transactions have been eliminated in consolidation. All material unrealized profits included in assets resulting from transactions within the Companies are eliminated.
(2) Foreign currency translations
All monetary assets and liabilities denominated in foreign curren-cies are translated into Japanese yen at the exchange rate pre-vailing at the balance sheet date. The foreign currency exchange gains or losses from transactions are charged to income.
Assets and liabilities of the overseas subsidiaries are translated into Japanese yen at the exchange rate prevailing at each balance sheet date. Income and expense accounts are translated at the average exchange rate for the year. Differences arising from such translations are recorded as foreign currency translation adjust-ments and minority interests in the consolidated balance sheet.
(3) Cash and cash equivalents
Cash and cash equivalents are composed of cash on hand, demand deposits, and short-term investments with original maturities of three months or less that are readily convertible to cash and exposed to insignificant risk of fluctuation of values.
(4) Allowance for doubtful accounts
Allowance for doubtful accounts is provided at the amounts calculated based on the past loss experience and an additional estimate of potential losses in the specific receivables.
(5) Inventories
Finished goods, work in process and raw materials are stated at the lower of cost determined by the first-in, first-out method or net selling value. Merchandise and supplies are stated at the lower of cost determined by the gross average method or net selling value. Meanwhile, inventories held by domestic consolidated sub-sidiaries are stated at the lower of cost determined principally by the gross average method or net selling value. Inventories held by overseas consolidated subsidiaries are stated at the lower of cost determined mostly by the first-in, first-out method or net selling value.
(6) Investments in securities
Investments in securities are classified into three categories: trading securities, held-to-maturity debt securities or available-for-sale securities. Trading securities are carried at fair value. Gain or loss, both realized and unrealized, is recognized in income. Held-to-maturity debt securities are carried at amortized cost. Marketable securities classified as available-for-sale securities are carried at fair value with changes in unrealized holding gain or loss, net of the applicable income taxes, reported in net assets. Non-marketable securities classified as available-for-sale securities are carried at cost determined by the moving-average method.
(7) Property, plant and equipment
Property, plant and equipment except for lease assets are depreciated principally by the declining-balance method over their estimated useful lives. Buildings acquired on or after April 1, 1998 by the Company and its domestic consolidated subsidiaries are depreciated by the straight-line method over their estimated useful lives. Useful lives are as follows: three to 50 years for buildings and structures, and five to ten years for machinery and equipment.
(8) Goodwill
Goodwill represents the cost in excess of fair value of net assets acquired in business combination accounted for by the purchase method. Goodwill and negative goodwill which occurred before March 31, 2010 are amortized over five years by the straight-line method.
Consolidated Statements of Cash FlowsBando Chemical Industries, Ltd. and Consolidated SubsidiariesYears ended March 31, 2014 and 2013
Millions of yen
Thousands of U.S. dollars
(Note 4)
2014 2013 2014
Cash Flows from Operating Activities:
Income before income taxes and minority interests ¥ 6,137 ¥ 3,541 $ 59,651
Adjustments for:
Income taxes paid (1,078) (1,131) (10,479)
Income taxes refunded 153 202 1,490
Depreciation and amortization 4,174 4,389 40,576
Amortization of goodwill and negative goodwill (27) (59) (259)
Impairment loss — 1,157 —
Decrease in allowance for doubtful accounts (18) (10) (170)
Decrease in allowance for retirement benefits — (164) —
Decrease in net defined benefit liability (500) — (4,861)
Foreign exchange losses (gains), net 25 (103) 245
Equity in earnings of affiliates (504) (528) (4,897)
Loss on sales and disposal of property, plant and equipment 81 111 785
Loss (gain) on sales of investments in securities (26) 0 (249)
Changes in assets and liabilities:
Decrease (increase) in notes and accounts receivable — trade (662) 1,341 (6,432)
Decrease in inventories 822 8 7,994
Decrease in notes and accounts payable — trade (1,905) (2,103) (18,516)
Other, net (213) 353 (2,095)
Net Cash Provided by Operating Activities 6,459 7,004 62,783
Cash Flows from Investing Activities:
Decrease (increase) in time deposits 59 (81) 570
Purchases of property, plant and equipment (4,934) (4,280) (47,955)
Proceeds from sales of property, plant and equipment 17 492 169
Purchases of intangible assets (164) (299) (1,593)
Purchases of investments in securities (20) (50) (190)
Proceeds from sales of investments in securities 59 0 574
Proceeds from redemption of investments in securities 100 — 972
Purchases of investments in subsidiaries (67) (457) (651)
Payments related to disposal of investments in subsidiaries resulting in change in scope of consolidation — (1,077) —
Other, net (88) (29) (862)
Net Cash Used in Investing Activities (5,038) (5,781) (48,966)
Cash Flows from Financing Activities:
Increase (decrease) in short-term borrowings 530 (41) 5,153
Proceeds from long-term borrowings 1,659 3,541 16,130
Payments on long-term borrowings (2,864) (2,682) (27,839)
Purchases of treasury stock (12) (497) (112)
Cash dividends paid (847) (761) (8,237)
Cash dividends paid to minority shareholders (3) (10) (27)
Other, net (11) (13) (115)
Net Cash Used in Financing Activities (1,548) (463) (15,047)
Effect of Exchange Rate Changes on Cash and Cash Equivalents 841 484 8,172
Net Increase (Decrease) in Cash and Cash Equivalents 714 1,245 6,942
Cash and Cash Equivalents at Beginning of Year 12,267 11,022 119,237
Cash and Cash Equivalents at End of Year ¥12,981 ¥12,267 $126,179
See accompanying notes to consolidated financial statements.
Annual Report 201446 47BANDO CHEMICAL INDUSTRIES, LTD.
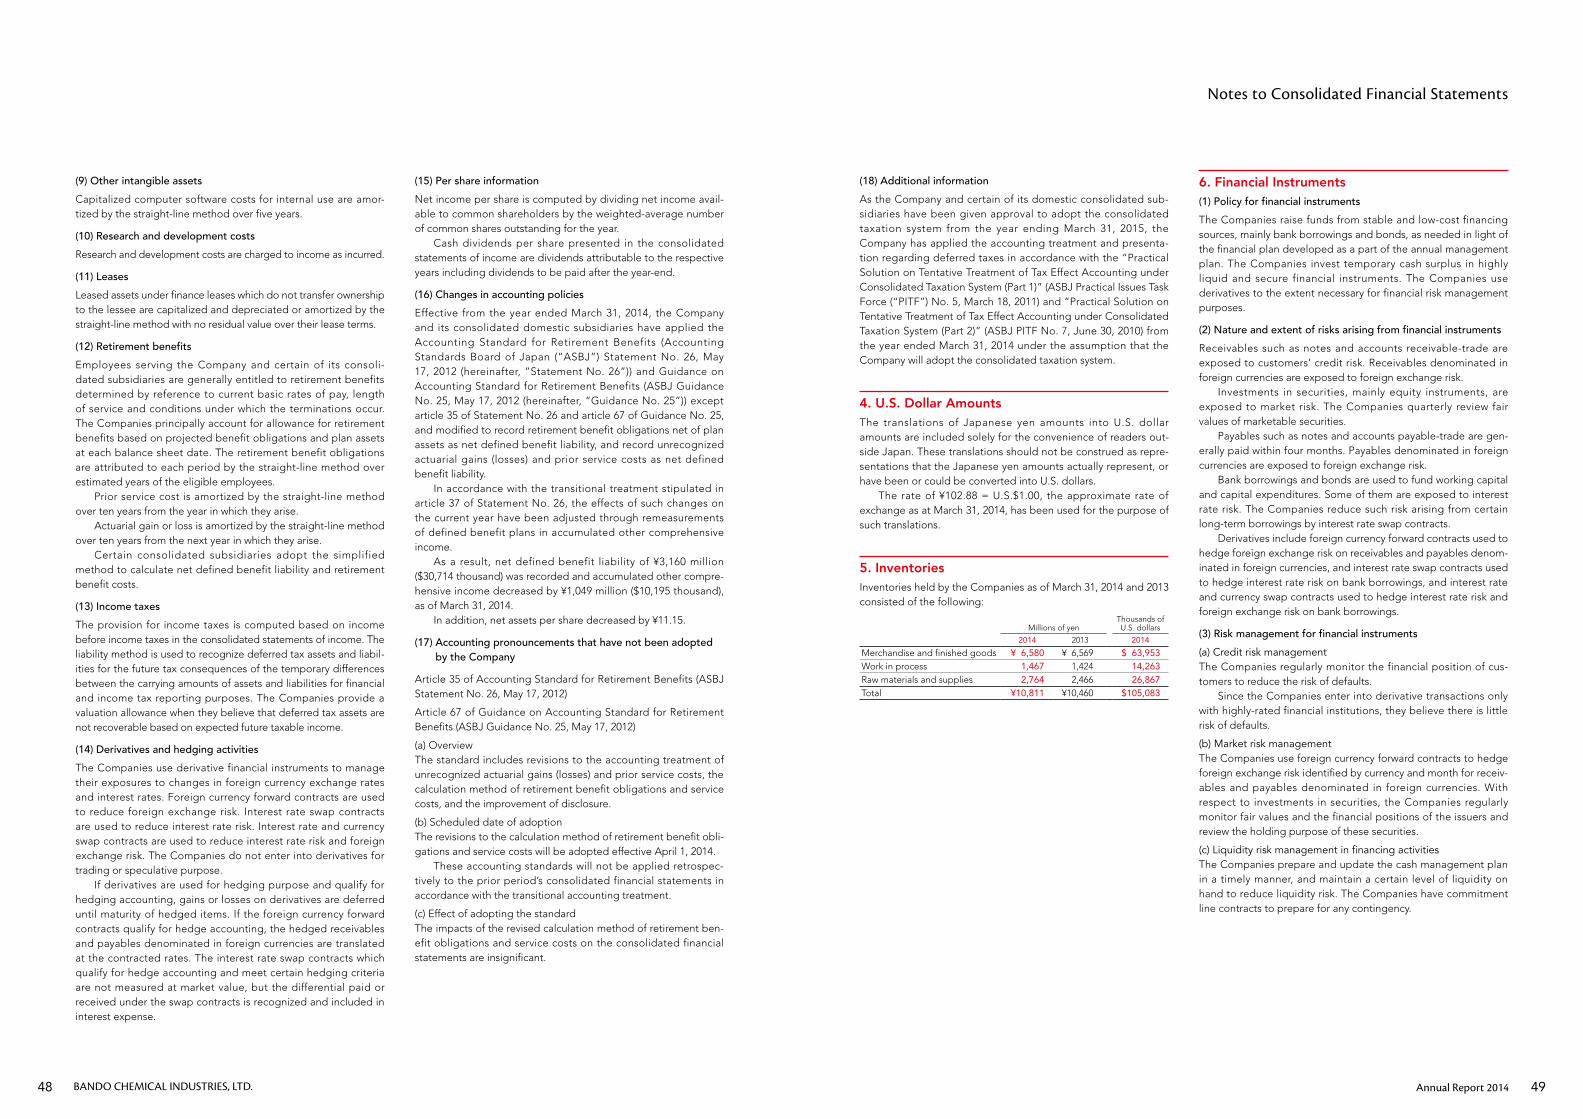
(9) Other intangible assets
Capitalized computer software costs for internal use are amor-tized by the straight-line method over five years.
(10) Research and development costs
Research and development costs are charged to income as incurred.
(11) Leases
Leased assets under finance leases which do not transfer ownership to the lessee are capitalized and depreciated or amortized by the straight-line method with no residual value over their lease terms.
(12) Retirement benefits
Employees serving the Company and certain of its consoli-dated subsidiaries are generally entitled to retirement benefits determined by reference to current basic rates of pay, length of service and conditions under which the terminations occur. The Companies principally account for allowance for retirement benefits based on projected benefit obligations and plan assets at each balance sheet date. The retirement benefit obligations are attributed to each period by the straight-line method over estimated years of the eligible employees. Prior service cost is amortized by the straight-line method over ten years from the year in which they arise. Actuarial gain or loss is amortized by the straight-line method over ten years from the next year in which they arise. Certain consolidated subsidiaries adopt the simplified method to calculate net defined benefit liability and retirement benefit costs.
(13) Income taxes
The provision for income taxes is computed based on income before income taxes in the consolidated statements of income. The liability method is used to recognize deferred tax assets and liabil-ities for the future tax consequences of the temporary differences between the carrying amounts of assets and liabilities for financial and income tax reporting purposes. The Companies provide a valuation allowance when they believe that deferred tax assets are not recoverable based on expected future taxable income.
(14) Derivatives and hedging activities
The Companies use derivative financial instruments to manage their exposures to changes in foreign currency exchange rates and interest rates. Foreign currency forward contracts are used to reduce foreign exchange risk. Interest rate swap contracts are used to reduce interest rate risk. Interest rate and currency swap contracts are used to reduce interest rate risk and foreign exchange risk. The Companies do not enter into derivatives for trading or speculative purpose. If derivatives are used for hedging purpose and qualify for hedging accounting, gains or losses on derivatives are deferred until maturity of hedged items. If the foreign currency forward contracts qualify for hedge accounting, the hedged receivables and payables denominated in foreign currencies are translated at the contracted rates. The interest rate swap contracts which qualify for hedge accounting and meet certain hedging criteria are not measured at market value, but the differential paid or received under the swap contracts is recognized and included in interest expense.
(18) Additional information
As the Company and certain of its domestic consolidated sub-sidiaries have been given approval to adopt the consolidated taxation system from the year ending March 31, 2015, the Company has applied the accounting treatment and presenta-tion regarding deferred taxes in accordance with the “Practical Solution on Tentative Treatment of Tax Effect Accounting under Consolidated Taxation System (Part 1)” (ASBJ Practical Issues Task Force (“PITF”) No. 5, March 18, 2011) and “Practical Solution on Tentative Treatment of Tax Effect Accounting under Consolidated Taxation System (Part 2)” (ASBJ PITF No. 7, June 30, 2010) from the year ended March 31, 2014 under the assumption that the Company will adopt the consolidated taxation system.
4. U.S. Dollar AmountsThe translations of Japanese yen amounts into U.S. dollar amounts are included solely for the convenience of readers out-side Japan. These translations should not be construed as repre-sentations that the Japanese yen amounts actually represent, or have been or could be converted into U.S. dollars. The rate of ¥102.88 = U.S.$1.00, the approximate rate of exchange as at March 31, 2014, has been used for the purpose of such translations.
5. InventoriesInventories held by the Companies as of March 31, 2014 and 2013 consisted of the following:
Millions of yenThousands of U.S. dollars
2014 2013 2014
Merchandise and finished goods ¥ 6,580 ¥ 6,569 $ 63,953Work in process 1,467 1,424 14,263Raw materials and supplies 2,764 2,466 26,867Total ¥10,811 ¥10,460 $105,083
(15) Per share information
Net income per share is computed by dividing net income avail-able to common shareholders by the weighted-average number of common shares outstanding for the year. Cash dividends per share presented in the consolidated statements of income are dividends attributable to the respective years including dividends to be paid after the year-end.
(16) Changes in accounting policies
Effective from the year ended March 31, 2014, the Company and its consolidated domestic subsidiaries have applied the Accounting Standard for Retirement Benefits (Accounting Standards Board of Japan (“ASBJ”) Statement No. 26, May 17, 2012 (hereinafter, “Statement No. 26”)) and Guidance on Accounting Standard for Retirement Benefits (ASBJ Guidance No. 25, May 17, 2012 (hereinafter, “Guidance No. 25”)) except article 35 of Statement No. 26 and article 67 of Guidance No. 25, and modified to record retirement benefit obligations net of plan assets as net defined benefit liability, and record unrecognized actuarial gains (losses) and prior service costs as net defined benefit liability. In accordance with the transitional treatment stipulated in article 37 of Statement No. 26, the effects of such changes on the current year have been adjusted through remeasurements of defined benefit plans in accumulated other comprehensive income. As a result, net defined benefit liability of ¥3,160 million ($30,714 thousand) was recorded and accumulated other compre-hensive income decreased by ¥1,049 million ($10,195 thousand), as of March 31, 2014. In addition, net assets per share decreased by ¥11.15.
(17) Accounting pronouncements that have not been adopted by the Company
Article 35 of Accounting Standard for Retirement Benefits (ASBJ Statement No. 26, May 17, 2012)
Article 67 of Guidance on Accounting Standard for Retirement Benefits (ASBJ Guidance No. 25, May 17, 2012)
(a) OverviewThe standard includes revisions to the accounting treatment of unrecognized actuarial gains (losses) and prior service costs, the calculation method of retirement benefit obligations and service costs, and the improvement of disclosure.
(b) Scheduled date of adoptionThe revisions to the calculation method of retirement benefit obli-gations and service costs will be adopted effective April 1, 2014. These accounting standards will not be applied retrospec-tively to the prior period’s consolidated financial statements in accordance with the transitional accounting treatment.
(c) Effect of adopting the standardThe impacts of the revised calculation method of retirement ben-efit obligations and service costs on the consolidated financial statements are insignificant.
6. Financial Instruments(1) Policy for financial instruments
The Companies raise funds from stable and low-cost financing sources, mainly bank borrowings and bonds, as needed in light of the financial plan developed as a part of the annual management plan. The Companies invest temporary cash surplus in highly liquid and secure financial instruments. The Companies use derivatives to the extent necessary for financial risk management purposes.
(2) Nature and extent of risks arising from financial instruments
Receivables such as notes and accounts receivable-trade are exposed to customers’ credit risk. Receivables denominated in foreign currencies are exposed to foreign exchange risk. Investments in securities, mainly equity instruments, are exposed to market risk. The Companies quarterly review fair values of marketable securities. Payables such as notes and accounts payable-trade are gen-erally paid within four months. Payables denominated in foreign currencies are exposed to foreign exchange risk. Bank borrowings and bonds are used to fund working capital and capital expenditures. Some of them are exposed to interest rate risk. The Companies reduce such risk arising from certain long-term borrowings by interest rate swap contracts. Derivatives include foreign currency forward contracts used to hedge foreign exchange risk on receivables and payables denom-inated in foreign currencies, and interest rate swap contracts used to hedge interest rate risk on bank borrowings, and interest rate and currency swap contracts used to hedge interest rate risk and foreign exchange risk on bank borrowings.
(3) Risk management for financial instruments
(a) Credit risk managementThe Companies regularly monitor the financial position of cus-tomers to reduce the risk of defaults. Since the Companies enter into derivative transactions only with highly-rated financial institutions, they believe there is little risk of defaults.
(b) Market risk managementThe Companies use foreign currency forward contracts to hedge foreign exchange risk identified by currency and month for receiv-ables and payables denominated in foreign currencies. With respect to investments in securities, the Companies regularly monitor fair values and the financial positions of the issuers and review the holding purpose of these securities.
(c) Liquidity risk management in financing activitiesThe Companies prepare and update the cash management plan in a timely manner, and maintain a certain level of liquidity on hand to reduce liquidity risk. The Companies have commitment line contracts to prepare for any contingency.
Notes to Consolidated Financial Statements
Annual Report 201448 49BANDO CHEMICAL INDUSTRIES, LTD.
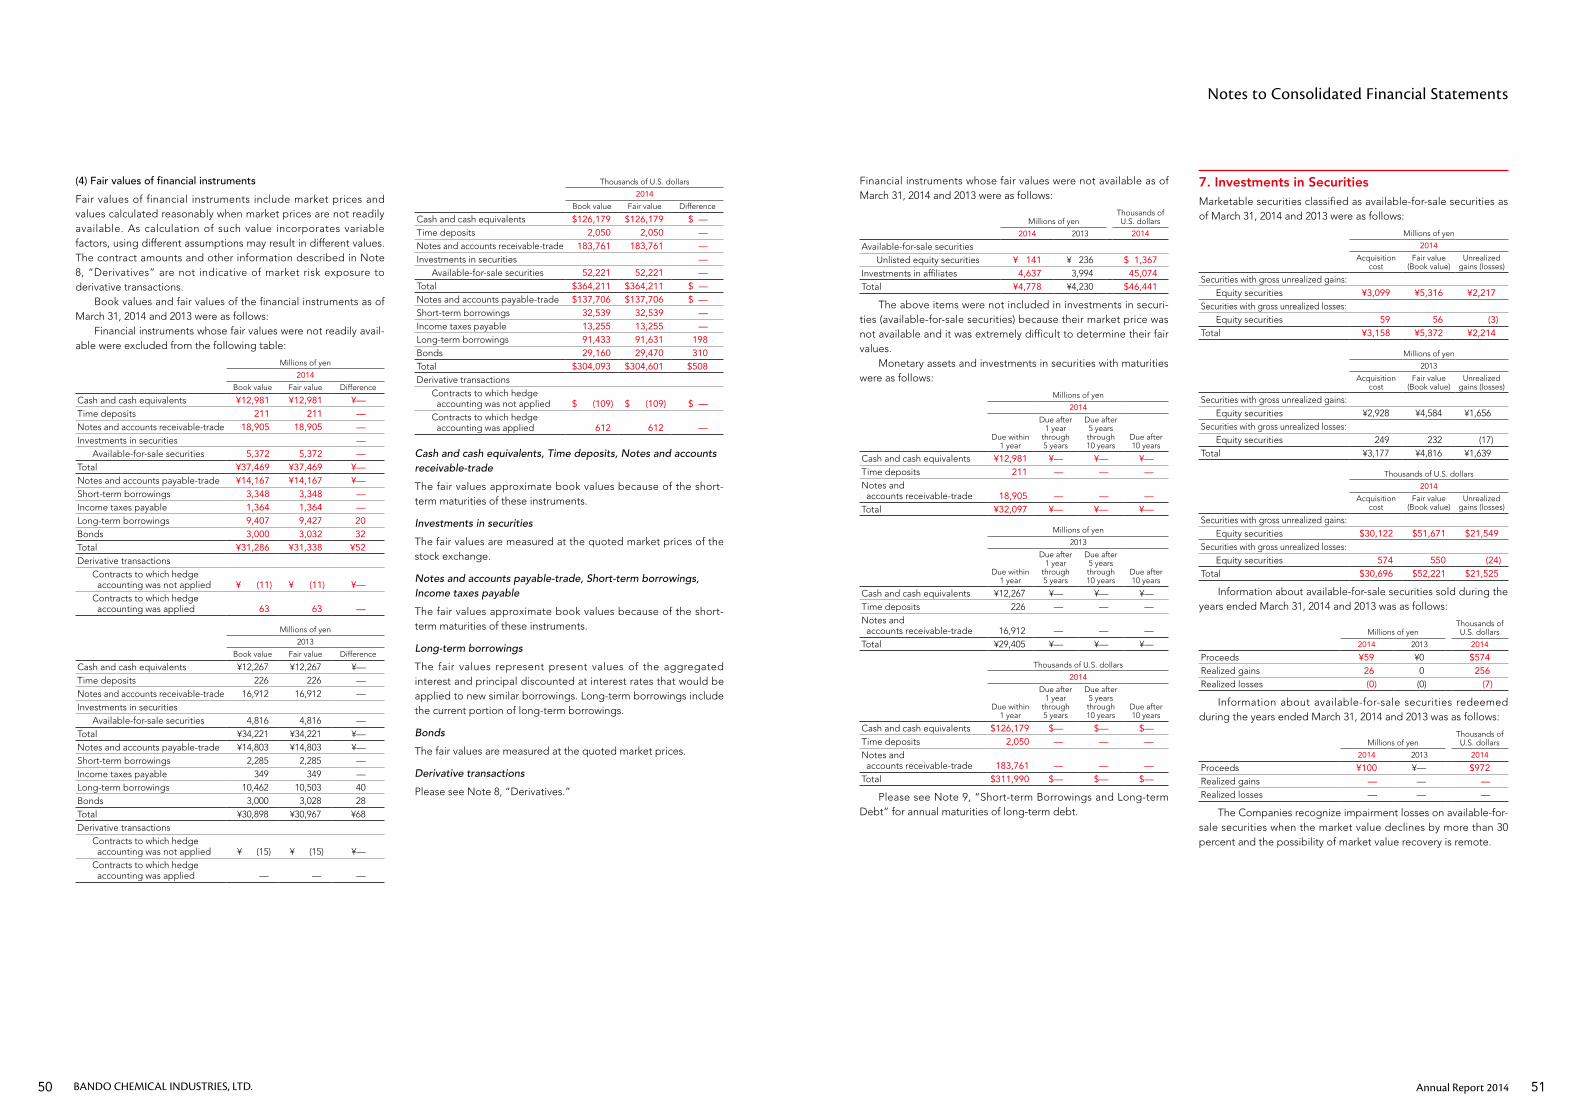
(4) Fair values of financial instruments
Fair values of financial instruments include market prices and values calculated reasonably when market prices are not readily available. As calculation of such value incorporates variable factors, using different assumptions may result in different values. The contract amounts and other information described in Note 8, “Derivatives” are not indicative of market risk exposure to derivative transactions. Book values and fair values of the financial instruments as of March 31, 2014 and 2013 were as follows: Financial instruments whose fair values were not readily avail-able were excluded from the following table:
Millions of yen
2014
Book value Fair value Difference
Cash and cash equivalents ¥12,981 ¥12,981 ¥—Time deposits 211 211 —Notes and accounts receivable-trade 18,905 18,905 —Investments in securities —
Available-for-sale securities 5,372 5,372 —Total ¥37,469 ¥37,469 ¥—Notes and accounts payable-trade ¥14,167 ¥14,167 ¥—Short-term borrowings 3,348 3,348 —Income taxes payable 1,364 1,364 —Long-term borrowings 9,407 9,427 20Bonds 3,000 3,032 32Total ¥31,286 ¥31,338 ¥52Derivative transactions
Contracts to which hedge accounting was not applied ¥ (11) ¥ (11) ¥—Contracts to which hedge accounting was applied 63 63 —
Millions of yen
2013
Book value Fair value Difference
Cash and cash equivalents ¥12,267 ¥12,267 ¥—Time deposits 226 226 —Notes and accounts receivable-trade 16,912 16,912 —Investments in securities
Available-for-sale securities 4,816 4,816 —Total ¥34,221 ¥34,221 ¥—Notes and accounts payable-trade ¥14,803 ¥14,803 ¥—Short-term borrowings 2,285 2,285 —Income taxes payable 349 349 —Long-term borrowings 10,462 10,503 40Bonds 3,000 3,028 28Total ¥30,898 ¥30,967 ¥68Derivative transactions
Contracts to which hedge accounting was not applied ¥ (15) ¥ (15) ¥—Contracts to which hedge accounting was applied — — —
Financial instruments whose fair values were not available as of March 31, 2014 and 2013 were as follows:
Millions of yenThousands of U.S. dollars
2014 2013 2014
Available-for-sale securitiesUnlisted equity securities ¥ 141 ¥ 236 $ 1,367
Investments in affiliates 4,637 3,994 45,074Total ¥4,778 ¥4,230 $46,441
The above items were not included in investments in securi-ties (available-for-sale securities) because their market price was not available and it was extremely difficult to determine their fair values. Monetary assets and investments in securities with maturities were as follows:
Millions of yen
2014
Due within 1 year
Due after 1 year
through 5 years
Due after 5 years through 10 years
Due after 10 years
Cash and cash equivalents ¥12,981 ¥— ¥— ¥—Time deposits 211 — — —Notes and accounts receivable-trade 18,905 — — —Total ¥32,097 ¥— ¥— ¥—
Millions of yen
2013
Due within 1 year
Due after 1 year
through 5 years
Due after 5 years through 10 years
Due after 10 years
Cash and cash equivalents ¥12,267 ¥— ¥— ¥—Time deposits 226 — — —Notes and accounts receivable-trade 16,912 — — —Total ¥29,405 ¥— ¥— ¥—
Thousands of U.S. dollars
2014
Due within 1 year
Due after 1 year
through 5 years
Due after 5 years through 10 years
Due after 10 years
Cash and cash equivalents $126,179 $— $— $—Time deposits 2,050 — — —Notes and accounts receivable-trade 183,761 — — —Total $311,990 $— $— $—
Please see Note 9, “Short-term Borrowings and Long-term Debt” for annual maturities of long-term debt.
7. Investments in SecuritiesMarketable securities classified as available-for-sale securities as of March 31, 2014 and 2013 were as follows:
Millions of yen
2014
Acquisition cost
Fair value (Book value)
Unrealized gains (losses)
Securities with gross unrealized gains:Equity securities ¥3,099 ¥5,316 ¥2,217
Securities with gross unrealized losses:Equity securities 59 56 (3)
Total ¥3,158 ¥5,372 ¥2,214
Millions of yen
2013
Acquisition cost
Fair value (Book value)
Unrealized gains (losses)
Securities with gross unrealized gains:Equity securities ¥2,928 ¥4,584 ¥1,656
Securities with gross unrealized losses:Equity securities 249 232 (17)
Total ¥3,177 ¥4,816 ¥1,639
Thousands of U.S. dollars
2014
Acquisition cost
Fair value (Book value)
Unrealized gains (losses)
Securities with gross unrealized gains:Equity securities $30,122 $51,671 $21,549
Securities with gross unrealized losses:Equity securities 574 550 (24)
Total $30,696 $52,221 $21,525
Information about available-for-sale securities sold during the years ended March 31, 2014 and 2013 was as follows:
Millions of yenThousands of U.S. dollars
2014 2013 2014
Proceeds ¥59 ¥0 $574Realized gains 26 0 256Realized losses (0) (0) (7)
Information about available-for-sale securities redeemed during the years ended March 31, 2014 and 2013 was as follows:
Millions of yenThousands of U.S. dollars
2014 2013 2014
Proceeds ¥100 ¥— $972Realized gains — — —Realized losses — — —
The Companies recognize impairment losses on available-for-sale securities when the market value declines by more than 30 percent and the possibility of market value recovery is remote.
Thousands of U.S. dollars
2014
Book value Fair value Difference
Cash and cash equivalents $126,179 $126,179 $ —Time deposits 2,050 2,050 —Notes and accounts receivable-trade 183,761 183,761 —Investments in securities —
Available-for-sale securities 52,221 52,221 —Total $364,211 $364,211 $ —Notes and accounts payable-trade $137,706 $137,706 $ —Short-term borrowings 32,539 32,539 —Income taxes payable 13,255 13,255 —Long-term borrowings 91,433 91,631 198Bonds 29,160 29,470 310Total $304,093 $304,601 $508Derivative transactions
Contracts to which hedge accounting was not applied $ (109) $ (109) $ —Contracts to which hedge accounting was applied 612 612 —
Cash and cash equivalents, Time deposits, Notes and accounts receivable-trade
The fair values approximate book values because of the short-term maturities of these instruments.
Investments in securities
The fair values are measured at the quoted market prices of the stock exchange.
Notes and accounts payable-trade, Short-term borrowings, Income taxes payable
The fair values approximate book values because of the short-term maturities of these instruments.
Long-term borrowings
The fair values represent present values of the aggregated interest and principal discounted at interest rates that would be applied to new similar borrowings. Long-term borrowings include the current portion of long-term borrowings.
Bonds
The fair values are measured at the quoted market prices.
Derivative transactions
Please see Note 8, “Derivatives.”
Notes to Consolidated Financial Statements
Annual Report 201450 51BANDO CHEMICAL INDUSTRIES, LTD.
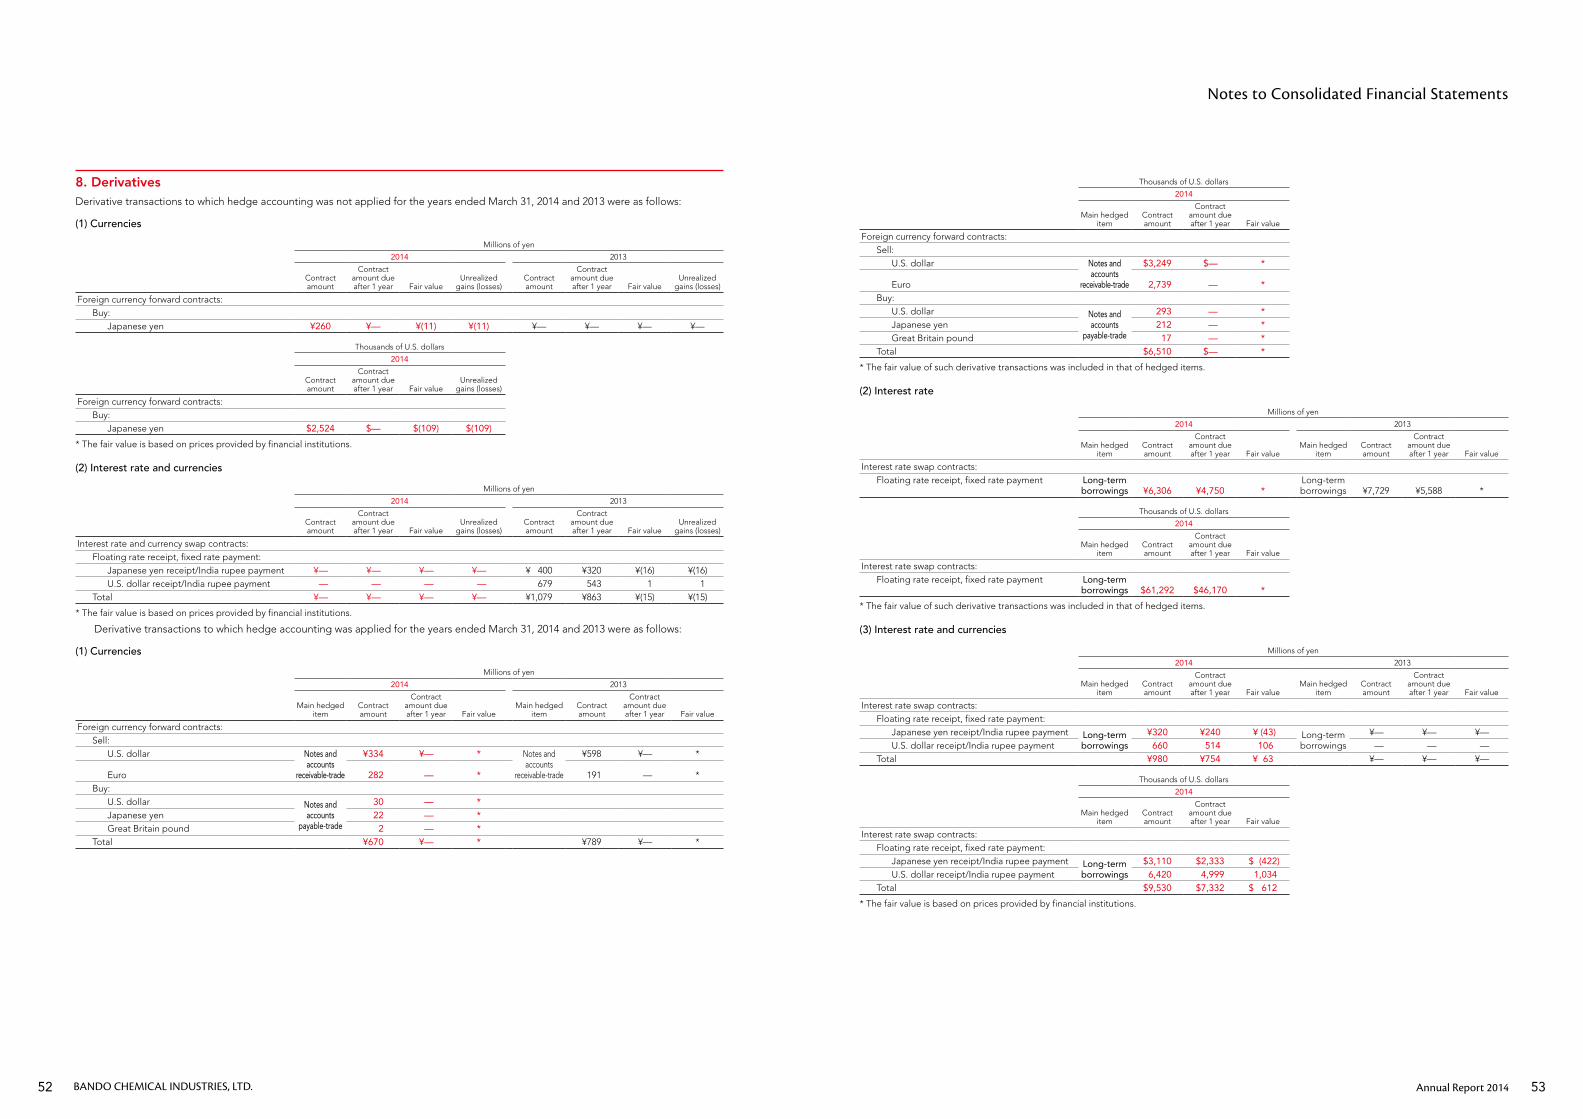
8. DerivativesDerivative transactions to which hedge accounting was not applied for the years ended March 31, 2014 and 2013 were as follows:
(1) Currencies
Millions of yen
2014 2013
Contract amount
Contract amount due after 1 year Fair value
Unrealized gains (losses)
Contract amount
Contract amount due after 1 year Fair value
Unrealized gains (losses)
Foreign currency forward contracts:Buy:
Japanese yen ¥260 ¥— ¥(11) ¥(11) ¥— ¥— ¥— ¥—
Thousands of U.S. dollars
2014
Contract amount
Contract amount due after 1 year Fair value
Unrealized gains (losses)
Foreign currency forward contracts:Buy:
Japanese yen $2,524 $— $(109) $(109)
* The fair value is based on prices provided by financial institutions.
(2) Interest rate and currencies
Millions of yen
2014 2013
Contract amount
Contract amount due after 1 year Fair value
Unrealized gains (losses)
Contract amount
Contract amount due after 1 year Fair value
Unrealized gains (losses)
Interest rate and currency swap contracts:Floating rate receipt, fixed rate payment:
Japanese yen receipt/India rupee payment ¥— ¥— ¥— ¥— ¥ 400 ¥320 ¥(16) ¥(16)U.S. dollar receipt/India rupee payment — — — — 679 543 1 1
Total ¥— ¥— ¥— ¥— ¥1,079 ¥863 ¥(15) ¥(15)
* The fair value is based on prices provided by financial institutions.
Derivative transactions to which hedge accounting was applied for the years ended March 31, 2014 and 2013 were as follows:
(1) Currencies
Millions of yen
2014 2013
Main hedged item
Contract amount
Contract amount due after 1 year Fair value
Main hedged item
Contract amount
Contract amount due after 1 year Fair value
Foreign currency forward contracts:Sell:
U.S. dollar Notes and accounts
receivable-trade
¥334 ¥— * Notes and accounts
receivable-trade
¥598 ¥— *
Euro 282 — * 191 — *Buy:
U.S. dollar Notes and accounts
payable-trade
30 — *Japanese yen 22 — *Great Britain pound 2 — *
Total ¥670 ¥— * ¥789 ¥— *
Thousands of U.S. dollars
2014
Main hedged item
Contract amount
Contract amount due after 1 year Fair value
Foreign currency forward contracts:Sell:
U.S. dollar Notes and accounts
receivable-trade
$3,249 $— *
Euro 2,739 — *Buy:
U.S. dollar Notes and accounts
payable-trade
293 — *Japanese yen 212 — *Great Britain pound 17 — *
Total $6,510 $— *
* The fair value of such derivative transactions was included in that of hedged items.
(2) Interest rate
Millions of yen
2014 2013
Main hedged item
Contract amount
Contract amount due after 1 year Fair value
Main hedged item
Contract amount
Contract amount due after 1 year Fair value
Interest rate swap contracts:Floating rate receipt, fixed rate payment Long-term
borrowings ¥6,306 ¥4,750 *Long-term borrowings ¥7,729 ¥5,588 *
Thousands of U.S. dollars
2014
Main hedged item
Contract amount
Contract amount due after 1 year Fair value
Interest rate swap contracts:Floating rate receipt, fixed rate payment Long-term
borrowings $61,292 $46,170 *
* The fair value of such derivative transactions was included in that of hedged items.
(3) Interest rate and currencies
Millions of yen
2014 2013
Main hedged item
Contract amount
Contract amount due after 1 year Fair value
Main hedged item
Contract amount
Contract amount due after 1 year Fair value
Interest rate swap contracts:Floating rate receipt, fixed rate payment:
Japanese yen receipt/India rupee payment Long-term borrowings
¥320 ¥240 ¥ (43) Long-term borrowings
¥— ¥— ¥—U.S. dollar receipt/India rupee payment 660 514 106 — — —
Total ¥980 ¥754 ¥ 63 ¥— ¥— ¥—
Thousands of U.S. dollars
2014
Main hedged item
Contract amount
Contract amount due after 1 year Fair value
Interest rate swap contracts:Floating rate receipt, fixed rate payment:
Japanese yen receipt/India rupee payment Long-term borrowings
$3,110 $2,333 $ (422)U.S. dollar receipt/India rupee payment 6,420 4,999 1,034
Total $9,530 $7,332 $ 612
* The fair value is based on prices provided by financial institutions.
Notes to Consolidated Financial Statements
Annual Report 201452 53BANDO CHEMICAL INDUSTRIES, LTD.
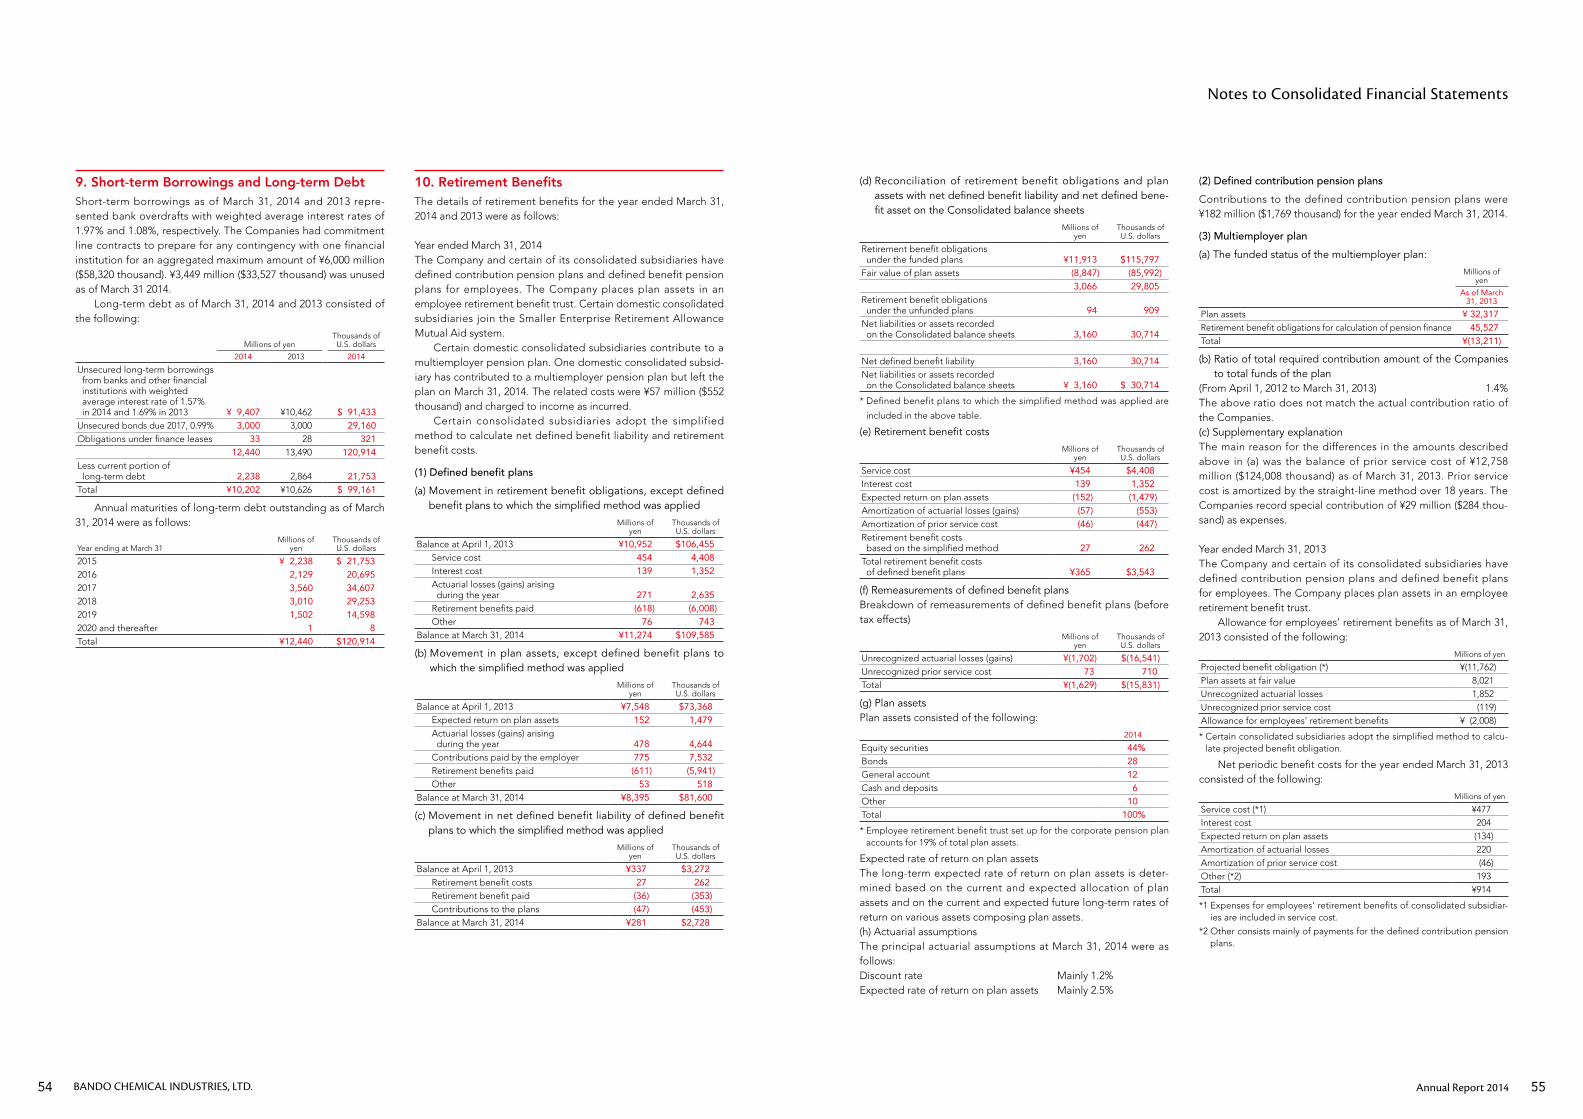
9. Short-term Borrowings and Long-term DebtShort-term borrowings as of March 31, 2014 and 2013 repre-sented bank overdrafts with weighted average interest rates of 1.97% and 1.08%, respectively. The Companies had commitment line contracts to prepare for any contingency with one financial institution for an aggregated maximum amount of ¥6,000 million ($58,320 thousand). ¥3,449 million ($33,527 thousand) was unused as of March 31 2014. Long-term debt as of March 31, 2014 and 2013 consisted of the following:
Millions of yenThousands of U.S. dollars
2014 2013 2014
Unsecured long-term borrowings from banks and other financial institutions with weighted average interest rate of 1.57% in 2014 and 1.69% in 2013 ¥ 9,407 ¥10,462 $ 91,433Unsecured bonds due 2017, 0.99% 3,000 3,000 29,160Obligations under finance leases 33 28 321
12,440 13,490 120,914Less current portion of long-term debt 2,238 2,864 21,753Total ¥10,202 ¥10,626 $ 99,161
Annual maturities of long-term debt outstanding as of March 31, 2014 were as follows:
Year ending at March 31Millions of
yenThousands of U.S. dollars
2015 ¥ 2,238 $ 21,7532016 2,129 20,6952017 3,560 34,6072018 3,010 29,2532019 1,502 14,5982020 and thereafter 1 8Total ¥12,440 $120,914
10. Retirement BenefitsThe details of retirement benefits for the year ended March 31, 2014 and 2013 were as follows:
Year ended March 31, 2014The Company and certain of its consolidated subsidiaries have defined contribution pension plans and defined benefit pension plans for employees. The Company places plan assets in an employee retirement benefit trust. Certain domestic consolidated subsidiaries join the Smaller Enterprise Retirement Allowance Mutual Aid system. Certain domestic consolidated subsidiaries contribute to a multiemployer pension plan. One domestic consolidated subsid-iary has contributed to a multiemployer pension plan but left the plan on March 31, 2014. The related costs were ¥57 million ($552 thousand) and charged to income as incurred. Certain consolidated subsidiaries adopt the simplified method to calculate net defined benefit liability and retirement benefit costs.
(1) Defined benefit plans
(a) Movement in retirement benefit obligations, except defined benefit plans to which the simplified method was applied
Millions of yen
Thousands of U.S. dollars
Balance at April 1, 2013 ¥10,952 $106,455Service cost 454 4,408Interest cost 139 1,352Actuarial losses (gains) arising during the year 271 2,635Retirement benefits paid (618) (6,008)Other 76 743
Balance at March 31, 2014 ¥11,274 $109,585
(b) Movement in plan assets, except defined benefit plans to which the simplified method was applied
Millions of yen
Thousands of U.S. dollars
Balance at April 1, 2013 ¥7,548 $73,368Expected return on plan assets 152 1,479Actuarial losses (gains) arising during the year 478 4,644Contributions paid by the employer 775 7,532Retirement benefits paid (611) (5,941)Other 53 518
Balance at March 31, 2014 ¥8,395 $81,600
(c) Movement in net defined benefit liability of defined benefit plans to which the simplified method was applied
Millions of yen
Thousands of U.S. dollars
Balance at April 1, 2013 ¥337 $3,272Retirement benefit costs 27 262Retirement benefit paid (36) (353)Contributions to the plans (47) (453)
Balance at March 31, 2014 ¥281 $2,728
(d) Reconciliation of retirement benefit obligations and plan assets with net defined benefit liability and net defined bene-fit asset on the Consolidated balance sheets
Millions of yen
Thousands of U.S. dollars
Retirement benefit obligations under the funded plans ¥11,913 $115,797Fair value of plan assets (8,847) (85,992)
3,066 29,805Retirement benefit obligations under the unfunded plans 94 909Net liabilities or assets recorded on the Consolidated balance sheets 3,160 30,714
Net defined benefit liability 3,160 30,714Net liabilities or assets recorded on the Consolidated balance sheets ¥ 3,160 $ 30,714
* Defined benefit plans to which the simplified method was applied are
included in the above table.
(e) Retirement benefit costs
Millions of yen
Thousands of U.S. dollars
Service cost ¥454 $4,408Interest cost 139 1,352Expected return on plan assets (152) (1,479)Amortization of actuarial losses (gains) (57) (553)Amortization of prior service cost (46) (447)Retirement benefit costs based on the simplified method 27 262Total retirement benefit costs of defined benefit plans ¥365 $3,543
(f) Remeasurements of defined benefit plansBreakdown of remeasurements of defined benefit plans (before tax effects)
Millions of yen
Thousands of U.S. dollars
Unrecognized actuarial losses (gains) ¥(1,702) $(16,541)Unrecognized prior service cost 73 710Total ¥(1,629) $(15,831)
(g) Plan assetsPlan assets consisted of the following:
2014
Equity securities 44%Bonds 28General account 12Cash and deposits 6Other 10Total 100%
* Employee retirement benefit trust set up for the corporate pension plan accounts for 19% of total plan assets.
Expected rate of return on plan assetsThe long-term expected rate of return on plan assets is deter-mined based on the current and expected allocation of plan assets and on the current and expected future long-term rates of return on various assets composing plan assets.(h) Actuarial assumptionsThe principal actuarial assumptions at March 31, 2014 were as follows:Discount rate Mainly 1.2%Expected rate of return on plan assets Mainly 2.5%
(2) Defined contribution pension plans
Contributions to the defined contribution pension plans were ¥182 million ($1,769 thousand) for the year ended March 31, 2014.
(3) Multiemployer plan
(a) The funded status of the multiemployer plan:
Millions of yen
As of March 31, 2013
Plan assets ¥ 32,317Retirement benefit obligations for calculation of pension finance 45,527Total ¥(13,211)
(b) Ratio of total required contribution amount of the Companies to total funds of the plan
(From April 1, 2012 to March 31, 2013) 1.4%The above ratio does not match the actual contribution ratio of the Companies.(c) Supplementary explanationThe main reason for the differences in the amounts described above in (a) was the balance of prior service cost of ¥12,758 million ($124,008 thousand) as of March 31, 2013. Prior service cost is amortized by the straight-line method over 18 years. The Companies record special contribution of ¥29 million ($284 thou-sand) as expenses.
Year ended March 31, 2013The Company and certain of its consolidated subsidiaries have defined contribution pension plans and defined benefit plans for employees. The Company places plan assets in an employee retirement benefit trust. Allowance for employees’ retirement benefits as of March 31, 2013 consisted of the following:
Millions of yen
Projected benefit obligation (*) ¥(11,762)Plan assets at fair value 8,021Unrecognized actuarial losses 1,852Unrecognized prior service cost (119)Allowance for employees’ retirement benefits ¥ (2,008)
* Certain consolidated subsidiaries adopt the simplified method to calcu-late projected benefit obligation.
Net periodic benefit costs for the year ended March 31, 2013 consisted of the following:
Millions of yen
Service cost (*1) ¥477Interest cost 204Expected return on plan assets (134)Amortization of actuarial losses 220Amortization of prior service cost (46)Other (*2) 193Total ¥914
*1 Expenses for employees’ retirement benefits of consolidated subsidiar-ies are included in service cost.
*2 Other consists mainly of payments for the defined contribution pension plans.
Notes to Consolidated Financial Statements
Annual Report 201454 55BANDO CHEMICAL INDUSTRIES, LTD.
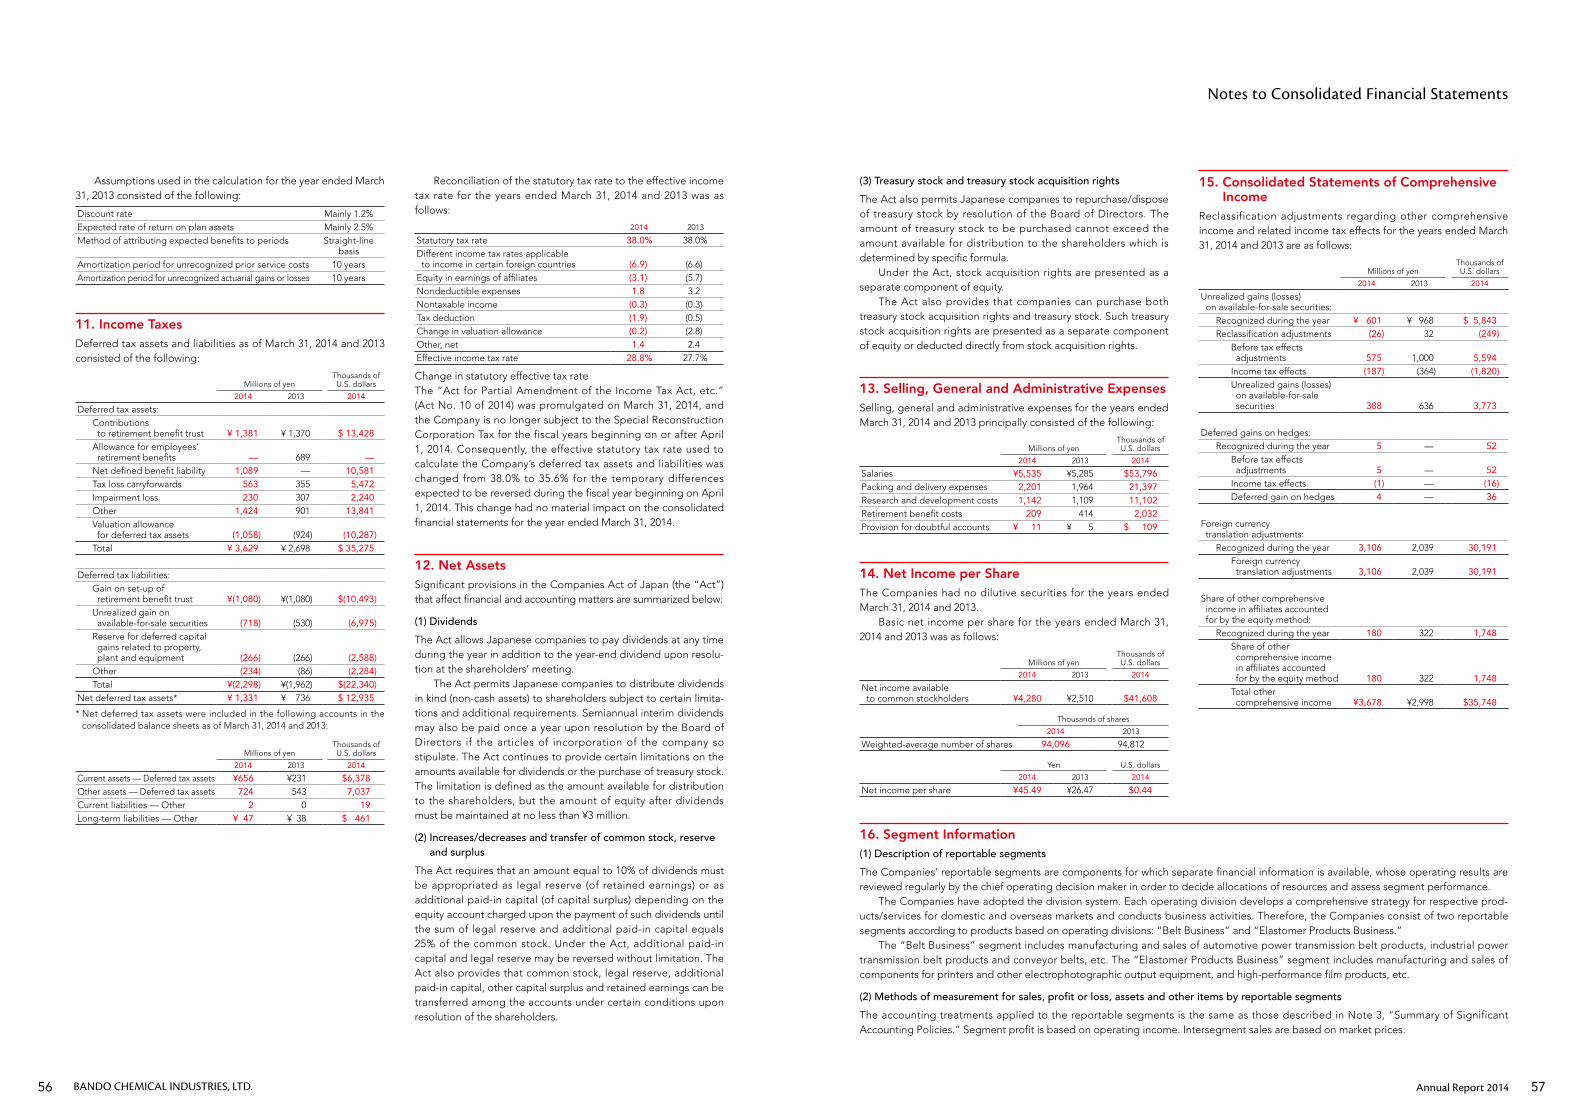
Assumptions used in the calculation for the year ended March 31, 2013 consisted of the following:
Discount rate Mainly 1.2%Expected rate of return on plan assets Mainly 2.5%Method of attributing expected benefits to periods Straight-line
basisAmortization period for unrecognized prior service costs 10 yearsAmortization period for unrecognized actuarial gains or losses 10 years
11. Income TaxesDeferred tax assets and liabilities as of March 31, 2014 and 2013 consisted of the following:
Millions of yenThousands of U.S. dollars
2014 2013 2014
Deferred tax assets:Contributions to retirement benefit trust ¥ 1,381 ¥ 1,370 $ 13,428Allowance for employees’ retirement benefits — 689 —Net defined benefit liability 1,089 — 10,581Tax loss carryforwards 563 355 5,472Impairment loss 230 307 2,240Other 1,424 901 13,841Valuation allowance for deferred tax assets (1,058) (924) (10,287)Total ¥ 3,629 ¥ 2,698 $ 35,275
Deferred tax liabilities:Gain on set-up of retirement benefit trust ¥(1,080) ¥(1,080) $(10,493)Unrealized gain on available-for-sale securities (718) (530) (6,975)Reserve for deferred capital gains related to property, plant and equipment (266) (266) (2,588)Other (234) (86) (2,284)Total ¥(2,298) ¥(1,962) $(22,340)
Net deferred tax assets* ¥ 1,331 ¥ 736 $ 12,935
* Net deferred tax assets were included in the following accounts in the consolidated balance sheets as of March 31, 2014 and 2013:
Millions of yenThousands of U.S. dollars
2014 2013 2014
Current assets — Deferred tax assets ¥656 ¥231 $6,378Other assets — Deferred tax assets 724 543 7,037Current liabilities — Other 2 0 19Long-term liabilities — Other ¥ 47 ¥ 38 $ 461
(3) Treasury stock and treasury stock acquisition rights
The Act also permits Japanese companies to repurchase/dispose of treasury stock by resolution of the Board of Directors. The amount of treasury stock to be purchased cannot exceed the amount available for distribution to the shareholders which is determined by specific formula. Under the Act, stock acquisition rights are presented as a separate component of equity. The Act also provides that companies can purchase both treasury stock acquisition rights and treasury stock. Such treasury stock acquisition rights are presented as a separate component of equity or deducted directly from stock acquisition rights.
13. Selling, General and Administrative ExpensesSelling, general and administrative expenses for the years ended March 31, 2014 and 2013 principally consisted of the following:
Millions of yenThousands of U.S. dollars
2014 2013 2014
Salaries ¥5,535 ¥5,285 $53,796Packing and delivery expenses 2,201 1,964 21,397Research and development costs 1,142 1,109 11,102Retirement benefit costs 209 414 2,032Provision for doubtful accounts ¥ 11 ¥ 5 $ 109
14. Net Income per ShareThe Companies had no dilutive securities for the years ended March 31, 2014 and 2013. Basic net income per share for the years ended March 31, 2014 and 2013 was as follows:
Millions of yenThousands of U.S. dollars
2014 2013 2014
Net income available to common stockholders ¥4,280 ¥2,510 $41,608
Thousands of shares
2014 2013
Weighted-average number of shares 94,096 94,812
Yen U.S. dollars
2014 2013 2014
Net income per share ¥45.49 ¥26.47 $0.44
Reconciliation of the statutory tax rate to the effective income tax rate for the years ended March 31, 2014 and 2013 was as follows:
2014 2013
Statutory tax rate 38.0% 38.0%Different income tax rates applicable to income in certain foreign countries (6.9) (6.6)Equity in earnings of affiliates (3.1) (5.7)Nondeductible expenses 1.8 3.2Nontaxable income (0.3) (0.3)Tax deduction (1.9) (0.5)Change in valuation allowance (0.2) (2.8)Other, net 1.4 2.4Effective income tax rate 28.8% 27.7%
Change in statutory effective tax rateThe “Act for Partial Amendment of the Income Tax Act, etc.” (Act No. 10 of 2014) was promulgated on March 31, 2014, and the Company is no longer subject to the Special Reconstruction Corporation Tax for the fiscal years beginning on or after April 1, 2014. Consequently, the effective statutory tax rate used to calculate the Company’s deferred tax assets and liabilities was changed from 38.0% to 35.6% for the temporary differences expected to be reversed during the fiscal year beginning on April 1, 2014. This change had no material impact on the consolidated financial statements for the year ended March 31, 2014.
12. Net AssetsSignificant provisions in the Companies Act of Japan (the “Act”) that affect financial and accounting matters are summarized below:
(1) Dividends
The Act allows Japanese companies to pay dividends at any time during the year in addition to the year-end dividend upon resolu-tion at the shareholders’ meeting. The Act permits Japanese companies to distribute dividends in kind (non-cash assets) to shareholders subject to certain limita-tions and additional requirements. Semiannual interim dividends may also be paid once a year upon resolution by the Board of Directors if the articles of incorporation of the company so stipulate. The Act continues to provide certain limitations on the amounts available for dividends or the purchase of treasury stock. The limitation is defined as the amount available for distribution to the shareholders, but the amount of equity after dividends must be maintained at no less than ¥3 million.
(2) Increases/decreases and transfer of common stock, reserve and surplus
The Act requires that an amount equal to 10% of dividends must be appropriated as legal reserve (of retained earnings) or as additional paid-in capital (of capital surplus) depending on the equity account charged upon the payment of such dividends until the sum of legal reserve and additional paid-in capital equals 25% of the common stock. Under the Act, additional paid-in capital and legal reserve may be reversed without limitation. The Act also provides that common stock, legal reserve, additional paid-in capital, other capital surplus and retained earnings can be transferred among the accounts under certain conditions upon resolution of the shareholders.
15. Consolidated Statements of Comprehensive Income
Reclassification adjustments regarding other comprehensive income and related income tax effects for the years ended March 31, 2014 and 2013 are as follows:
Millions of yenThousands of U.S. dollars
2014 2013 2014
Unrealized gains (losses) on available-for-sale securities:
Recognized during the year ¥ 601 ¥ 968 $ 5,843Reclassification adjustments (26) 32 (249)
Before tax effects adjustments 575 1,000 5,594Income tax effects (187) (364) (1,820)Unrealized gains (losses) on available-for-sale securities 388 636 3,773
Deferred gains on hedges:Recognized during the year 5 — 52
Before tax effects adjustments 5 — 52Income tax effects (1) — (16)Deferred gain on hedges 4 — 36
Foreign currency translation adjustments:
Recognized during the year 3,106 2,039 30,191Foreign currency translation adjustments 3,106 2,039 30,191
Share of other comprehensive income in affiliates accounted for by the equity method:
Recognized during the year 180 322 1,748Share of other comprehensive income in affiliates accounted for by the equity method 180 322 1,748Total other comprehensive income ¥3,678 ¥2,998 $35,748
16. Segment Information(1) Description of reportable segments
The Companies’ reportable segments are components for which separate financial information is available, whose operating results are reviewed regularly by the chief operating decision maker in order to decide allocations of resources and assess segment performance. The Companies have adopted the division system. Each operating division develops a comprehensive strategy for respective prod-ucts/services for domestic and overseas markets and conducts business activities. Therefore, the Companies consist of two reportable segments according to products based on operating divisions: “Belt Business” and “Elastomer Products Business.” The “Belt Business” segment includes manufacturing and sales of automotive power transmission belt products, industrial power transmission belt products and conveyor belts, etc. The “Elastomer Products Business” segment includes manufacturing and sales of components for printers and other electrophotographic output equipment, and high-performance film products, etc.
(2) Methods of measurement for sales, profit or loss, assets and other items by reportable segments
The accounting treatments applied to the reportable segments is the same as those described in Note 3, “Summary of Significant Accounting Policies.” Segment profit is based on operating income. Intersegment sales are based on market prices.
Notes to Consolidated Financial Statements
Annual Report 201456 57BANDO CHEMICAL INDUSTRIES, LTD.
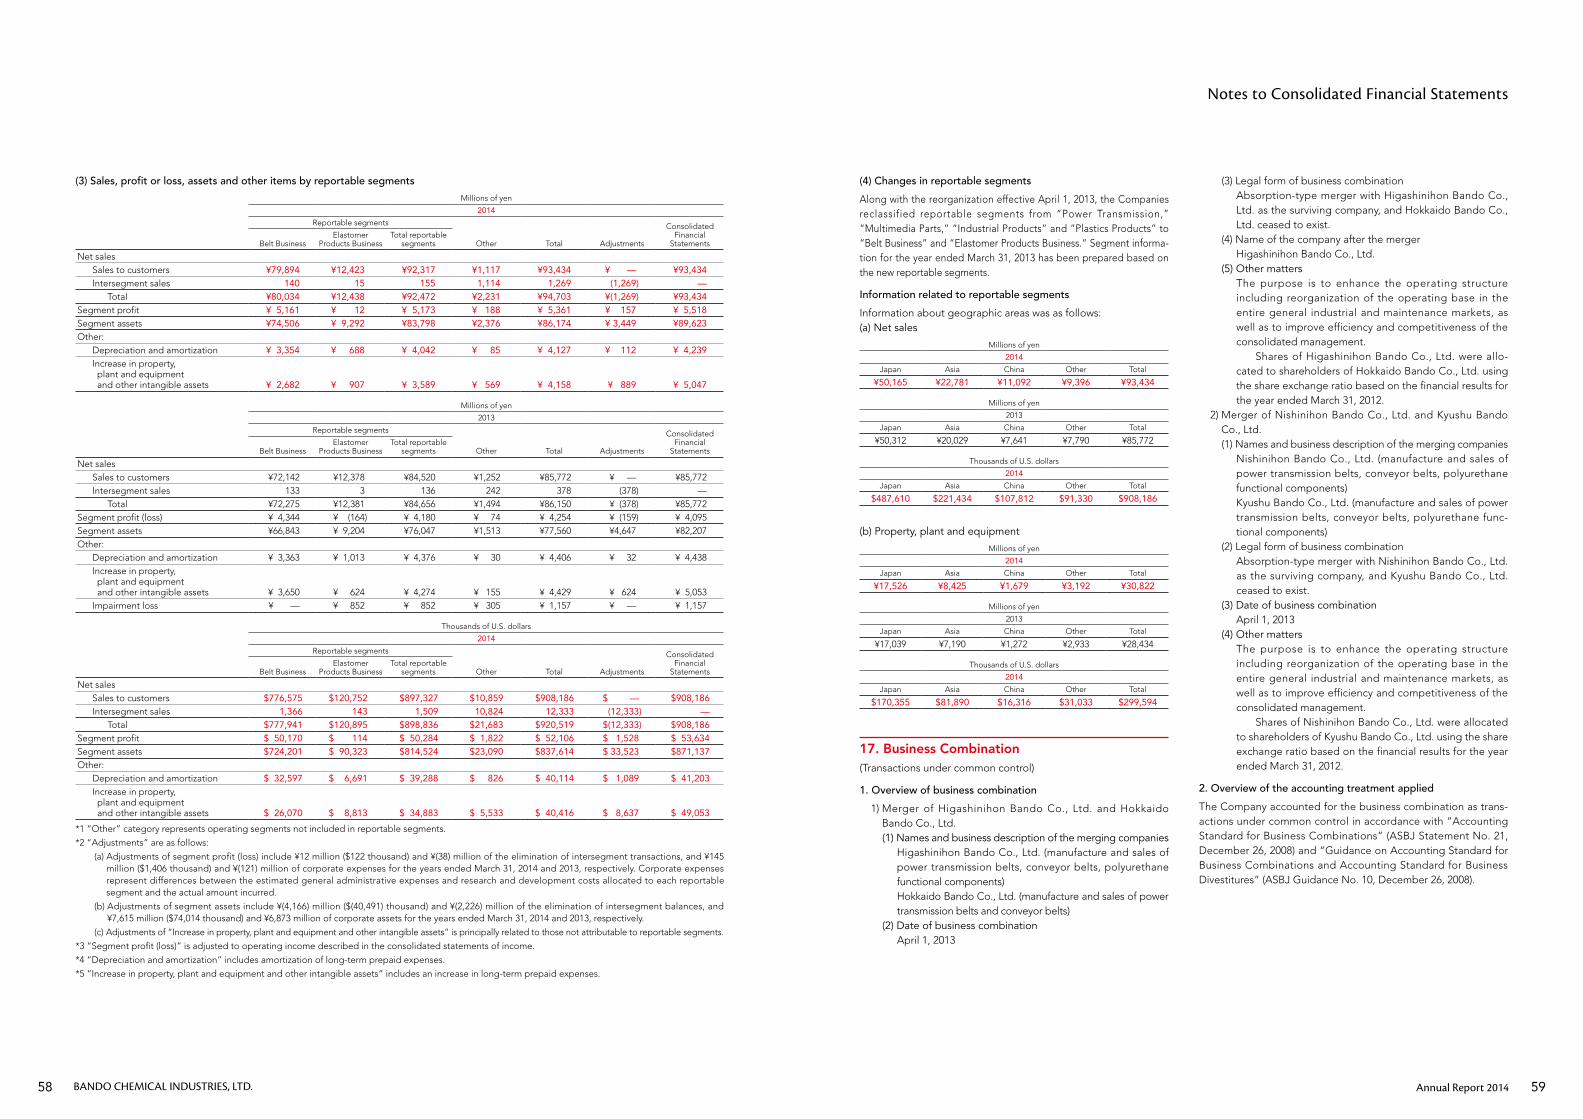
(3) Sales, profit or loss, assets and other items by reportable segments
Millions of yen
2014
Reportable segments Consolidated Financial
StatementsBelt BusinessElastomer
Products BusinessTotal reportable
segments Other Total Adjustments
Net salesSales to customers ¥79,894 ¥12,423 ¥92,317 ¥1,117 ¥93,434 ¥ — ¥93,434Intersegment sales 140 15 155 1,114 1,269 (1,269) —
Total ¥80,034 ¥12,438 ¥92,472 ¥2,231 ¥94,703 ¥(1,269) ¥93,434Segment profit ¥ 5,161 ¥ 12 ¥ 5,173 ¥ 188 ¥ 5,361 ¥ 157 ¥ 5,518Segment assets ¥74,506 ¥ 9,292 ¥83,798 ¥2,376 ¥86,174 ¥ 3,449 ¥89,623Other:
Depreciation and amortization ¥ 3,354 ¥ 688 ¥ 4,042 ¥ 85 ¥ 4,127 ¥ 112 ¥ 4,239Increase in property, plant and equipment and other intangible assets ¥ 2,682 ¥ 907 ¥ 3,589 ¥ 569 ¥ 4,158 ¥ 889 ¥ 5,047
Millions of yen
2013
Reportable segments Consolidated Financial
StatementsBelt BusinessElastomer
Products BusinessTotal reportable
segments Other Total Adjustments
Net salesSales to customers ¥72,142 ¥12,378 ¥84,520 ¥1,252 ¥85,772 ¥ — ¥85,772Intersegment sales 133 3 136 242 378 (378) —
Total ¥72,275 ¥12,381 ¥84,656 ¥1,494 ¥86,150 ¥ (378) ¥85,772Segment profit (loss) ¥ 4,344 ¥ (164) ¥ 4,180 ¥ 74 ¥ 4,254 ¥ (159) ¥ 4,095Segment assets ¥66,843 ¥ 9,204 ¥76,047 ¥1,513 ¥77,560 ¥4,647 ¥82,207Other:
Depreciation and amortization ¥ 3,363 ¥ 1,013 ¥ 4,376 ¥ 30 ¥ 4,406 ¥ 32 ¥ 4,438Increase in property, plant and equipment and other intangible assets ¥ 3,650 ¥ 624 ¥ 4,274 ¥ 155 ¥ 4,429 ¥ 624 ¥ 5,053Impairment loss ¥ — ¥ 852 ¥ 852 ¥ 305 ¥ 1,157 ¥ — ¥ 1,157
Thousands of U.S. dollars
2014
Reportable segments Consolidated Financial
StatementsBelt BusinessElastomer
Products BusinessTotal reportable
segments Other Total Adjustments
Net salesSales to customers $776,575 $120,752 $897,327 $10,859 $908,186 $ — $908,186Intersegment sales 1,366 143 1,509 10,824 12,333 (12,333) —
Total $777,941 $120,895 $898,836 $21,683 $920,519 $(12,333) $908,186Segment profit $ 50,170 $ 114 $ 50,284 $ 1,822 $ 52,106 $ 1,528 $ 53,634Segment assets $724,201 $ 90,323 $814,524 $23,090 $837,614 $ 33,523 $871,137Other:
Depreciation and amortization $ 32,597 $ 6,691 $ 39,288 $ 826 $ 40,114 $ 1,089 $ 41,203Increase in property, plant and equipment and other intangible assets $ 26,070 $ 8,813 $ 34,883 $ 5,533 $ 40,416 $ 8,637 $ 49,053
*1 “Other” category represents operating segments not included in reportable segments.
*2 “Adjustments” are as follows:
(a) Adjustments of segment profit (loss) include ¥12 million ($122 thousand) and ¥(38) million of the elimination of intersegment transactions, and ¥145 million ($1,406 thousand) and ¥(121) million of corporate expenses for the years ended March 31, 2014 and 2013, respectively. Corporate expenses represent differences between the estimated general administrative expenses and research and development costs allocated to each reportable segment and the actual amount incurred.
(b) Adjustments of segment assets include ¥(4,166) million ($(40,491) thousand) and ¥(2,226) million of the elimination of intersegment balances, and ¥7,615 million ($74,014 thousand) and ¥6,873 million of corporate assets for the years ended March 31, 2014 and 2013, respectively.
(c) Adjustments of “Increase in property, plant and equipment and other intangible assets” is principally related to those not attributable to reportable segments.
*3 “Segment profit (loss)” is adjusted to operating income described in the consolidated statements of income.
*4 “Depreciation and amortization” includes amortization of long-term prepaid expenses.
*5 “Increase in property, plant and equipment and other intangible assets” includes an increase in long-term prepaid expenses.
(4) Changes in reportable segments
Along with the reorganization effective April 1, 2013, the Companies reclassified reportable segments from “Power Transmission,” “Multimedia Parts,” “Industrial Products” and “Plastics Products” to “Belt Business” and “Elastomer Products Business.” Segment informa-tion for the year ended March 31, 2013 has been prepared based on the new reportable segments.
Information related to reportable segments
Information about geographic areas was as follows:(a) Net sales
Millions of yen
2014
Japan Asia China Other Total
¥50,165 ¥22,781 ¥11,092 ¥9,396 ¥93,434
Millions of yen
2013
Japan Asia China Other Total
¥50,312 ¥20,029 ¥7,641 ¥7,790 ¥85,772
Thousands of U.S. dollars
2014
Japan Asia China Other Total
$487,610 $221,434 $107,812 $91,330 $908,186
(b) Property, plant and equipment
Millions of yen
2014
Japan Asia China Other Total
¥17,526 ¥8,425 ¥1,679 ¥3,192 ¥30,822
Millions of yen
2013
Japan Asia China Other Total
¥17,039 ¥7,190 ¥1,272 ¥2,933 ¥28,434
Thousands of U.S. dollars
2014
Japan Asia China Other Total
$170,355 $81,890 $16,316 $31,033 $299,594
17. Business Combination(Transactions under common control)
1. Overview of business combination
1) Merger of Higashinihon Bando Co., Ltd. and Hokkaido Bando Co., Ltd.(1) Names and business description of the merging companies
Higashinihon Bando Co., Ltd. (manufacture and sales of power transmission belts, conveyor belts, polyurethane functional components)Hokkaido Bando Co., Ltd. (manufacture and sales of power transmission belts and conveyor belts)
(2) Date of business combinationApril 1, 2013
(3) Legal form of business combinationAbsorption-type merger with Higashinihon Bando Co., Ltd. as the surviving company, and Hokkaido Bando Co., Ltd. ceased to exist.
(4) Name of the company after the mergerHigashinihon Bando Co., Ltd.
(5) Other mattersThe purpose is to enhance the operating structure including reorganization of the operating base in the entire general industrial and maintenance markets, as well as to improve efficiency and competitiveness of the consolidated management. Shares of Higashinihon Bando Co., Ltd. were allo-cated to shareholders of Hokkaido Bando Co., Ltd. using the share exchange ratio based on the financial results for the year ended March 31, 2012.
2) Merger of Nishinihon Bando Co., Ltd. and Kyushu Bando Co., Ltd.(1) Names and business description of the merging companies
Nishinihon Bando Co., Ltd. (manufacture and sales of power transmission belts, conveyor belts, polyurethane functional components)Kyushu Bando Co., Ltd. (manufacture and sales of power transmission belts, conveyor belts, polyurethane func-tional components)
(2) Legal form of business combinationAbsorption-type merger with Nishinihon Bando Co., Ltd. as the surviving company, and Kyushu Bando Co., Ltd. ceased to exist.
(3) Date of business combinationApril 1, 2013
(4) Other mattersThe purpose is to enhance the operating structure including reorganization of the operating base in the entire general industrial and maintenance markets, as well as to improve efficiency and competitiveness of the consolidated management. Shares of Nishinihon Bando Co., Ltd. were allocated to shareholders of Kyushu Bando Co., Ltd. using the share exchange ratio based on the financial results for the year ended March 31, 2012.
2. Overview of the accounting treatment applied
The Company accounted for the business combination as trans-actions under common control in accordance with “Accounting Standard for Business Combinations” (ASBJ Statement No. 21, December 26, 2008) and “Guidance on Accounting Standard for Business Combinations and Accounting Standard for Business Divestitures” (ASBJ Guidance No. 10, December 26, 2008).
Notes to Consolidated Financial Statements
Annual Report 201458 59BANDO CHEMICAL INDUSTRIES, LTD.
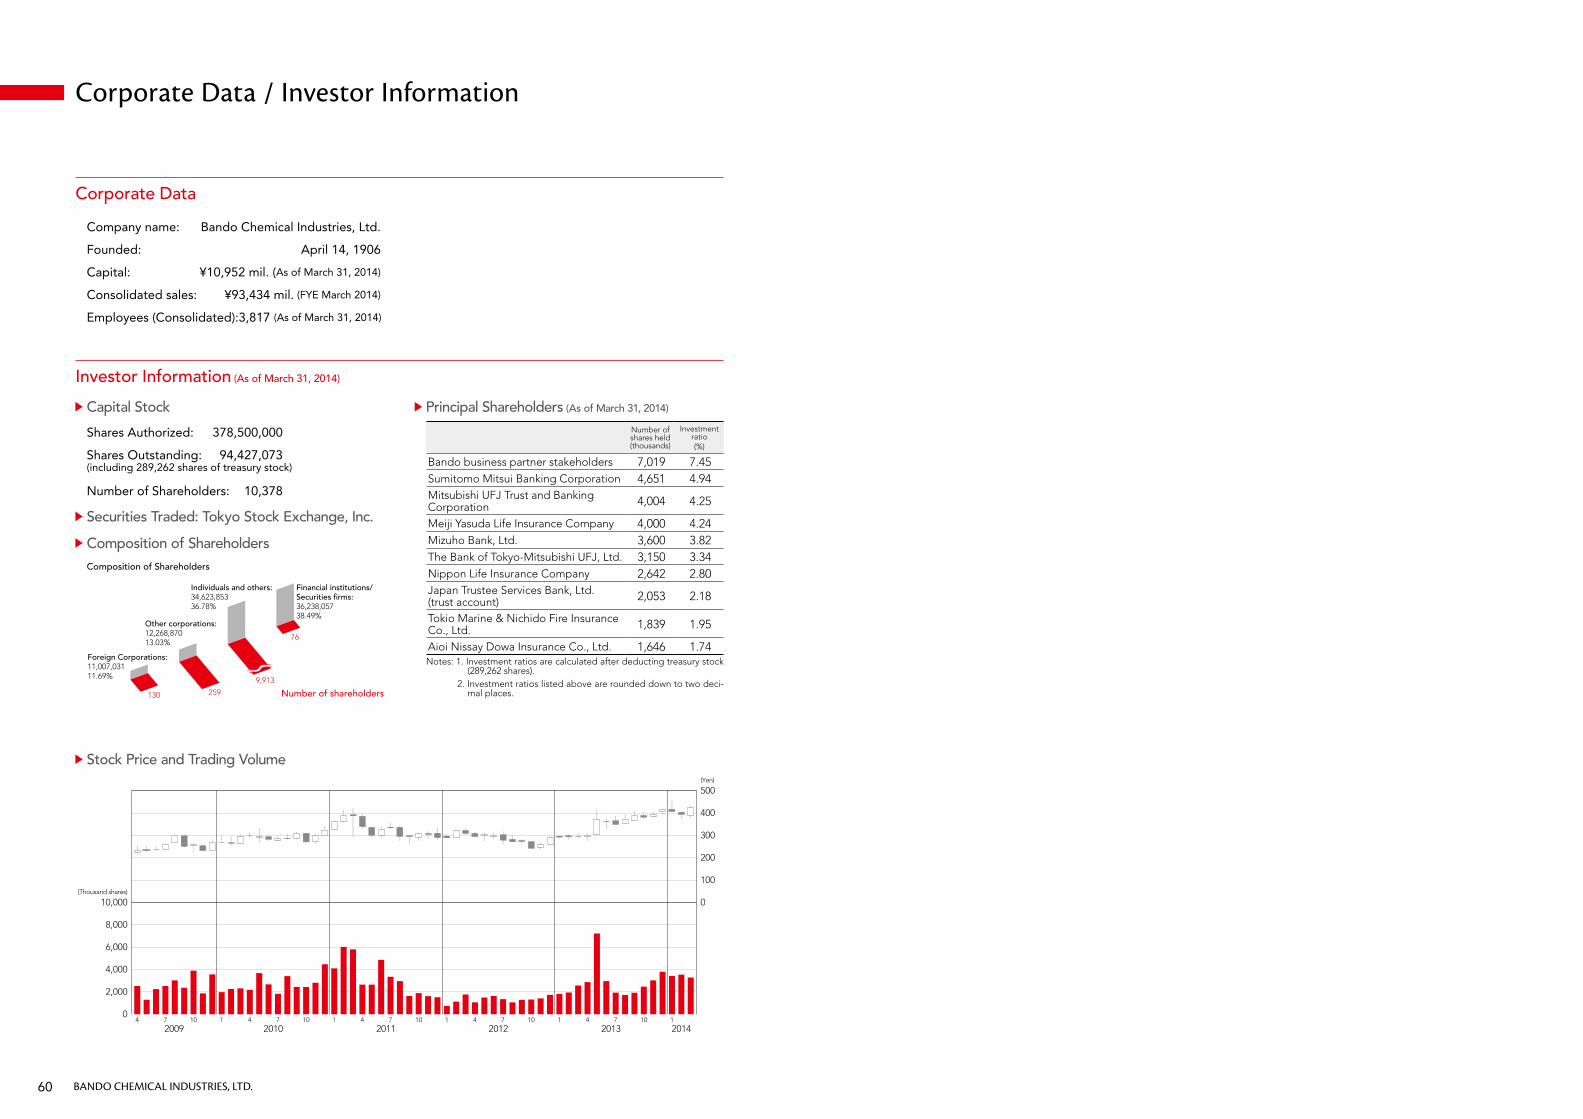
Corporate Data / Investor Information
Corporate Data
Company name: Bando Chemical Industries, Ltd.
Founded: April 14, 1906
Capital: ¥10,952 mil. (As of March 31, 2014)
Consolidated sales: ¥93,434 mil. (FYE March 2014)
Employees (Consolidated): 3,817 (As of March 31, 2014)
Investor Information (As of March 31, 2014)
Capital Stock
Shares Authorized: 378,500,000
Shares Outstanding: 94,427,073(including 289,262 shares of treasury stock)
Number of Shareholders: 10,378
Securities Traded: Tokyo Stock Exchange, Inc.
Composition of Shareholders
Principal Shareholders (As of March 31, 2014)
Stock Price and Trading Volume
Number of shares held (thousands)
Investment ratio(%)
Bando business partner stakeholders 7,019 7.45Sumitomo Mitsui Banking Corporation 4,651 4.94Mitsubishi UFJ Trust and Banking Corporation 4,004 4.25
Meiji Yasuda Life Insurance Company 4,000 4.24Mizuho Bank, Ltd. 3,600 3.82The Bank of Tokyo-Mitsubishi UFJ, Ltd. 3,150 3.34Nippon Life Insurance Company 2,642 2.80Japan Trustee Services Bank, Ltd. (trust account) 2,053 2.18
Tokio Marine & Nichido Fire Insurance Co., Ltd. 1,839 1.95
Aioi Nissay Dowa Insurance Co., Ltd. 1,646 1.74Notes: 1. Investment ratios are calculated after deducting treasury stock
(289,262 shares). 2. Investment ratios listed above are rounded down to two deci-
mal places.
Financial institutions/ Securities �rms: 36,238,05738.49%
Individuals and others: 34,623,85336.78%
Other corporations:12,268,87013.03%
Foreign Corporations:11,007,03111.69%
76
9,913
259130
Composition of Shareholders
Number of shareholders
0
2,000
4,000
6,000
8,000
10,000(Thousand shares)
0
100
200
300
400
500(Yen)
4 72009 2010 2011 2012 2013 2014
10 1 4 7 10 1 4 7 10 1 4 7 10 1 4 7 10 1
60 BANDO CHEMICAL INDUSTRIES, LTD.

6-6, Minatojima Minamimachi 4-chome, Chuo-ku, Kobe, 650-0047, Japan
www.bando.co.jp