Embed Size (px)
Citation preview
Physics in Medicine & Biology
PAPER
Breast tissue stiffness estimation for surgicalguidance using gravity-induced excitationTo cite this article: Rebekah H Griesenauer et al 2017 Phys. Med. Biol. 62 4756
View the article online for updates and enhancements.
Related contentA review of biomechanically informedbreast image registrationJohn H Hipwell, Vasileios Vavourakis,Lianghao Han et al.
-
Development of patient-specificbiomechanical models for predicting largebreast deformationLianghao Han, John H Hipwell, ChristineTanner et al.
-
Towards an in-plane methodology to trackbreast lesions using mammograms andpatient-specific finite-element simulationsAndrés Lapuebla-Ferri, José Cegoñino-Banzo, Antonio-José Jiménez-Mocholí etal.
-
Recent citationsCharacterizing viscoelastic properties ofbreast cancer tissue in a mouse modelusing indentationSuhao Qiu et al
-
This content was downloaded from IP address 129.59.93.171 on 16/03/2018 at 20:33
4756
Physics in Medicine & Biology
Breast tissue stiffness estimation for surgical guidance using gravity-induced excitation
Rebekah H Griesenauer1,2, Jared A Weis1,2, Lori R Arlinghaus3, Ingrid M Meszoely4 and Michael I Miga1,2,5,6
1 Department of Biomedical Engineering, Vanderbilt University, 5824 Stevenson Center, Nashville, TN 37235, United States of America2 Vanderbilt Institute in Surgery and Engineering (VISE), Nashville, TN, United States of America3 Vanderbilt University Institute of Imaging Science, 1161 21st Avenue South, Nashville, TN 37235, United States of America4 Department of Surgery, Vanderbilt University Medical Center, Nashville, TN, United States of America5 Department of Neurological Surgery, Vanderbilt University Medical Center, Nashville, TN, United States of America6 Department of Radiology and Radiological Sciences, Vanderbilt University Medical Center, Nashville, TN, United States of America
E-mail: [email protected] (M Miga)
Received 1 December 2016, revised 10 April 2017Accepted for publication 28 April 2017Published 18 May 2017
AbstractTissue stiffness interrogation is fundamental in breast cancer diagnosis and treatment. Furthermore, biomechanical models for predicting breast deformations have been created for several breast cancer applications. Within these applications, constitutive mechanical properties must be defined and the accuracy of this estimation directly impacts the overall performance of the model. In this study, we present an image-derived computational framework to obtain quantitative, patient specific stiffness properties for application in image-guided breast cancer surgery and interventions. The method uses two MR acquisitions of the breast in different supine gravity-loaded configurations to fit mechanical properties to a biomechanical breast model. A reproducibility assessment of the method was performed in a test–retest study using healthy volunteers and was further characterized in simulation. In five human data sets, the within subject coefficient of variation ranged from 10.7% to 27% and the intraclass correlation coefficient ranged from 0.91–0.944 for assessment of fibroglandular and adipose tissue stiffness. In simulation, fibroglandular
R H Griesenauer et al
Printed in the UK
4756
PHMBA7
© 2017 Institute of Physics and Engineering in Medicine
62
Phys. Med. Biol.
PMB
10.1088/1361-6560/aa700a
Paper
12
4756
4776
Physics in Medicine & Biology
Institute of Physics and Engineering in Medicine
IOP
2017
1361-6560
1361-6560/17/124756+21$33.00 © 2017 Institute of Physics and Engineering in Medicine Printed in the UK
Phys. Med. Biol. 62 (2017) 4756–4776 https://doi.org/10.1088/1361-6560/aa700a
4757
content and deformation magnitude were shown to have significant effects on the shape and convexity of the objective function defined by image similarity. These observations provide an important step forward in characterizing the use of nonrigid image registration methodologies in conjunction with biomechanical models to estimate tissue stiffness. In addition, the results suggest that stiffness estimation methods using gravity-induced excitation can reliably and feasibly be implemented in breast cancer surgery/intervention workflows.
Keywords: mechanical properties, breast cancer, lumpectomy, elastography, biomechanical model, magnetic resonance imaging, registration
(Some figures may appear in colour only in the online journal)
1. Introduction
Tissue stiffness interrogation plays a critical role in breast cancer from self-examinations and tumor staging to palpation guided biopsies and surgery. Unfortunately, not all clinically rel-evant breast lesions are palpable. For example, ductal carcinoma in situs are rarely palpable and are usually diagnosed by microcalcifications seen in x-ray mammography (Hofvind et al 2011). These early stage cancers and other clinically occult breast lesions make tumor local-ization difficult for biopsies and surgical tumor removal (Pleijhuis et al 2009). These local-ization complications directly contribute to unacceptably high reoperation rates for breast conserving surgery (20–40% (Landercasper et al 2014)). For this reason, enhanced tumor localization strategies have been suggested and include using image guidance systems that rely on patient specific biomechanical breast models to predict tumor locations for biopsies and surgical removal (Carter et al 2005, Conley et al 2015). Image guided breast surgery (IGBS) is performed by registering pre-surgical images to the same 3D coordinate space as the operating room. The fundamental concept of IGBS is to track the position of surgical instruments using optical or electromagnetic sensors and determine their location with respect to the physical position of the tumor as determined by registered preoperative imaging data, i.e. an image-to-physical registration. For procedures involving soft tissue, such as the breast, deformation between the preoperative image and the operating room position is inevitable; the preoperative images no longer match the surgical reality. For this reason, IGBS relies on a nonrigid alignment between image and patient. One such methodology relies on patient specific biomechanical models to deform the preoperative data to match the geometric config-uration of the breast in the operating room. The term patient-specific often implies that highly resolved geometric models are created from individual patient anatomy. In an extension to this broad definition, we have developed a method to further incorporate patient specific mechani-cal property parameters by estimating the stiffness of the underlying breast tissue to improve the accuracy of these models.
Mechanical models for breast deformation have also been created for needle path and biopsy planning (Misra et al 2008, Vancamberg et al 2010), breast augmentation planning and simulation (Roose et al 2005, del Palomar et al 2008, de Heras Ciechomski et al 2012), and radiation therapy targeting (Eiben et al 2016). Within these applications, various material constitutive models have been employed. For example, breast tissue has been modeled as non-linear or linear elastic, isotropic or anisotropic, and homogenous or heterogeneous depending on the application, deformation magnitude, and desired accuracy.
R H Griesenauer et alPhys. Med. Biol. 62 (2017) 4756
4758
With respect to applications, many biomechanical models have been used for predicting breast deformation in biopsy and simulating mammographic compressions. These applica-tions are usually driven by displacement boundary conditions that compress the breast into biopsy and/or mammogram geometries (Azar et al 2002). An estimate of relative stiffness for different breast tissue types is usually sufficient for these applications due to the indeterminate nature of displacement boundary conditions. However, when contact forces or gravitational loading conditions are applied, absolute material property values are required. There are sev-eral models that incorporate gravitational loading and/or contact forces for applications in aligning prone and supine images (Eiben et al 2016), modeling mammographic compressions (Chung et al 2008b), and performing image-to-physical space registration of preoperative breast image volumes for use in guiding surgery (Conley et al 2015). In many of these stud-ies, the material properties are estimated using literature values and are not patient specific. In addition, a recent review of the biomechanical properties of breast tissue (Ramião et al 2016) reported a large variation in stiffness properties for fibroglandular, adipose, ductal carcinoma in situ, and invasive ductal carcinomas. Variations in reported stiffness properties are mainly due to differences in testing methodologies, continuum assumptions, measurement errors, and natural inter and intra patient differences in tissue elasticity. Breast material properties vary greatly between subjects so generalized applications of mechanical properties in biome-chanical models used for clinical guidance is not ideal. For example, variations in material properties among subjects have been attributed to age (more adipose, less fibroglandular tissue (Lee et al 1997) and breakdown of connective tissue), genetic factors, and hormonal changes (Lorenzen et al 2003). Therefore, for procedure planning and guidance purposes, patient specific in vivo mechanical property estimation is likely to result in improved accuracy.
In most conventional techniques to estimate absolute stiffness properties, a known force or pressure must be applied followed by an observed measurement of tissue deformation. In the methodology described in this study, changes in the direction of gravitational load-ing are used as the known excitation force and magnetic resonance imaging (MRI) is used to quantify tissue deformation. One advantage to the methodology is that breast mechanical properties are being determined in a testing configuration that is extremely close to its surgical counterpart. Others have also made similar investigations. In Chung et al (2008a), a method is reported that estimates material properties using gravity induced deformations within the context of modeling mammographic compression. With that work, a gel phantom with a sim-plistic breast shape was imaged in two gravity loaded configurations (0° and 10.5° inclines off the superior–inferior axis). A single optimal material parameter was found by minimizing the root mean square (RMS) distance error between model predicted and experientially acquired surface points. In similar work, the concept of using multiple gravity-loaded configurations to estimate mechanical properties was further reported in Gamage et al (2011) using a two-layered gel cantilever beam. In vivo realizations of generating stiffness estimates by fitting model parameters to observed deformations due to changes in gravitational loading have been performed (del Palomar et al 2008, Rajagopal et al 2008, Carter et al 2009). In del Palomar et al (2008), a single material constant was iteratively adjusted to minimize residual errors of 7 surface landmarks between supine and standing breast configurations. In Rajagopal et al (2008), MR image volumes of the prone breast submerged in water were used to represent a gravity-free mechanical reference state. In this configuration, buoyancy forces were esti-mated to counteract the effects of gravity. Neutral buoyancy images (gravity-free) and prone images (gravity-loaded) were used to estimate a single material property. A similar study using submerged and unsubmerged prone breast images reproduced this technique (Carter et al 2009), except individual stiffness properties for fibroglandular and adipose tissue were used as opposed to a single material definition for the whole breast. In Rajagopal et al (2008),
R H Griesenauer et alPhys. Med. Biol. 62 (2017) 4756
4759
the purpose was to validate a computational approach for estimating the gravity-free reference state of the breast for applications in prone to supine registration. In both studies, the authors concede that submerging the breast in water during the MRI exam is not clinically practical for routine study.
While mechanical property estimations using gravity induced deformations have been per-formed in gel phantoms, there is a lack of data showing feasibility of this concept in human subjects in terms of reliable tissue stiffness identification with techniques amenable to clinical settings. In (Rajagopal et al 2008, Carter et al 2009), the gravity-induced excitation (submerged/unsubmerged prone breasts) is not clinically feasible. In (del Palomar et al 2008), errors induced by nonlinearity and gravitational pre-stress may have been compounded by very large deforma-tions between supine and standing breast configurations. Overall, while estimates of mechani-cal properties in vivo have been produced using gravitational excitation, they represent only a feasibility sampling of one to two subjects with no sense of methodological repeatability and reproducibility (del Palomar et al 2008, Rajagopal et al 2008, Carter et al 2009). We address these limitations and challenges in this paper by developing a stiffness estimation framework that is based on two supine gravity loaded configurations of the breast. Our method takes advantage of image registration principles to capture the driving deformation source (i.e. a change in the direc-tion of gravitational loading). We use rich image similarity data rather than spare point displace-ment errors used in all previously reported gravity-based stiffness estimation methods. Validation work has been performed in phantoms using image similarity to drive mechanical property esti-mation (Weis et al 2013, 2014, 2015a). In (Weis et al 2015a), stiffness ratios as determined by mechanical testing of the phantom material were compared with stiffness ratios as determined by an in vivo stiffness estimation that relies on the same image similarity parameters used in this cur-rent study. The percent errors between the mechanical testing ratios and image-derived stiffness estimations were 8–12%. In this study, we demonstrate feasibility of this approach in humans using ten unique stiffness estimates of fibroglandular and adipose tissue in healthy volunteers and measure reproducibility in five test–retest datasets. To our knowledge, we are the first to perform in vivo reproducibility studies of a gravity-based stiffness estimation method.
2. Methods
2.1. Theory
Before describing each component of our novel stiffness estimation algorithm, an overview is outlined in figure 1, beginning with the acquisition of two supine volumetric images. The first image is acquired with the subject in the supine position. The subject is then slightly rotated along the longitudinal axis of the body by placing a support wedge posterior to the breast and imaged again. Gravity-induced deformations occur due to a change in tissue weight distribu-tion. A biomechanical model is used to simulate breast deformations that occur between the two image acquisitions. The forward model is solved with a range of stiffness properties for each tissue type. An image similarity metric is used to calculate the residual error between the model deformed and experimentally acquired image. Patient specific stiffness property values are selected by optimizing the image similarity metric.
2.2. Image acquisition and processing
Magnetic resonance (MR) images of the breast are typically acquired using a dedicated breast coil with the patient lying in the prone position with freely hanging breasts. However, supine MR images are desirable within the context of surgical navigation because they more closely
R H Griesenauer et alPhys. Med. Biol. 62 (2017) 4756
4760
represent the surgical position. This position also readily allows for gravity induced deforma-tions amenable to the proposed stiffness estimation method. After informed written consent in an IRB approved study, the study volunteer was positioned in a 3T Achieva MR scanner (Philips Healthcare, Best, The Netherlands). A 16-channel sensitivity encoding torso coil (SENSE XL Torso Coil, Philips Healthcare) was situated carefully as to not induce unnatu-ral deformations to the breast. The ipsilateral arm was placed above the volunteer’s head as to not deform or provide external support to the breast (somewhat similar to the lateral arm extension that occurs during lumpectomy procedures). The healthy subject image data was acquired with: TR = 7.422 ms, TE = 3.91 ms, and flip angle = 10 degrees using SENSE paral-lel imaging (acceleration factor = 2). High resolution anatomical images were acquired with a T1-weighted, 3D turbo field echo sequence with fat suppression, a field of view of 200 mm × 200 mm × 160 mm, and a reconstructed voxel size of 0.391 mm × 0.391 mm × 1 mm. The duration of each image volume acquisition was 120.6 s.
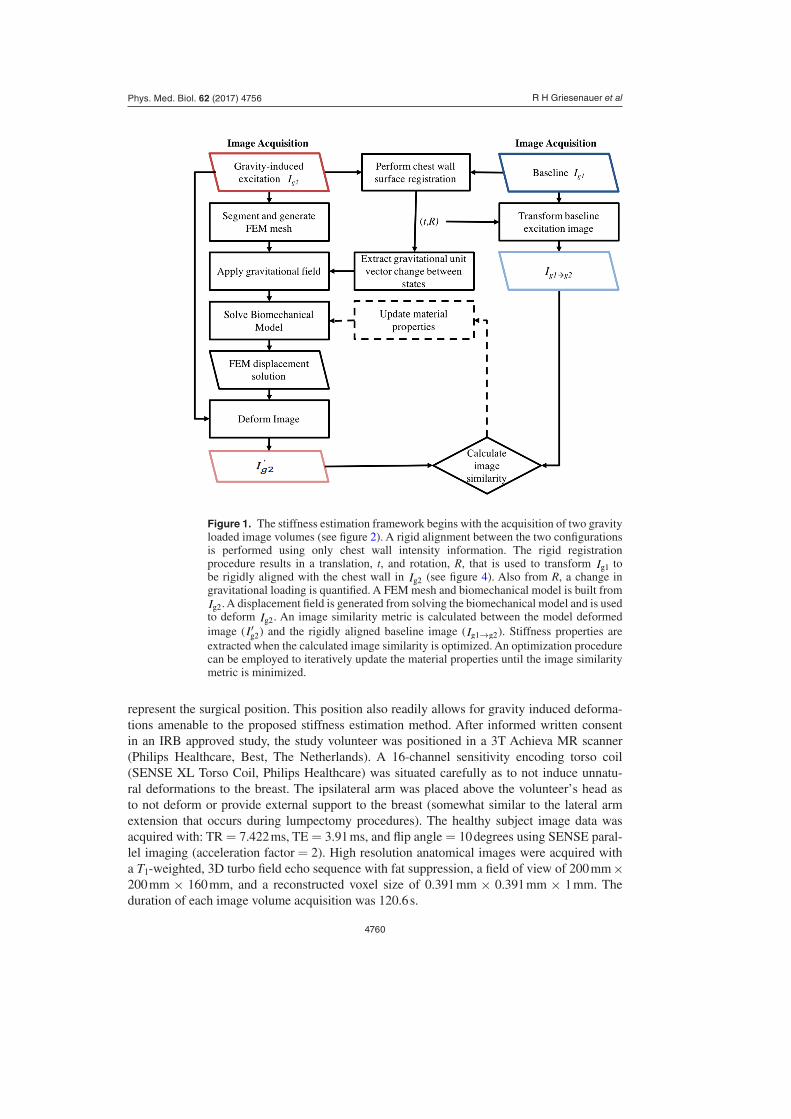
Figure 1. The stiffness estimation framework begins with the acquisition of two gravity loaded image volumes (see figure 2). A rigid alignment between the two configurations is performed using only chest wall intensity information. The rigid registration procedure results in a translation, t, and rotation, R, that is used to transform Ig1 to be rigidly aligned with the chest wall in Ig2 (see figure 4). Also from R, a change in gravitational loading is quantified. A FEM mesh and biomechanical model is built from Ig2. A displacement field is generated from solving the biomechanical model and is used to deform Ig2. An image similarity metric is calculated between the model deformed image ( I′g2) and the rigidly aligned baseline image ( Ig1→g2). Stiffness properties are extracted when the calculated image similarity is optimized. An optimization procedure can be employed to iteratively update the material properties until the image similarity metric is minimized.
R H Griesenauer et alPhys. Med. Biol. 62 (2017) 4756
4761
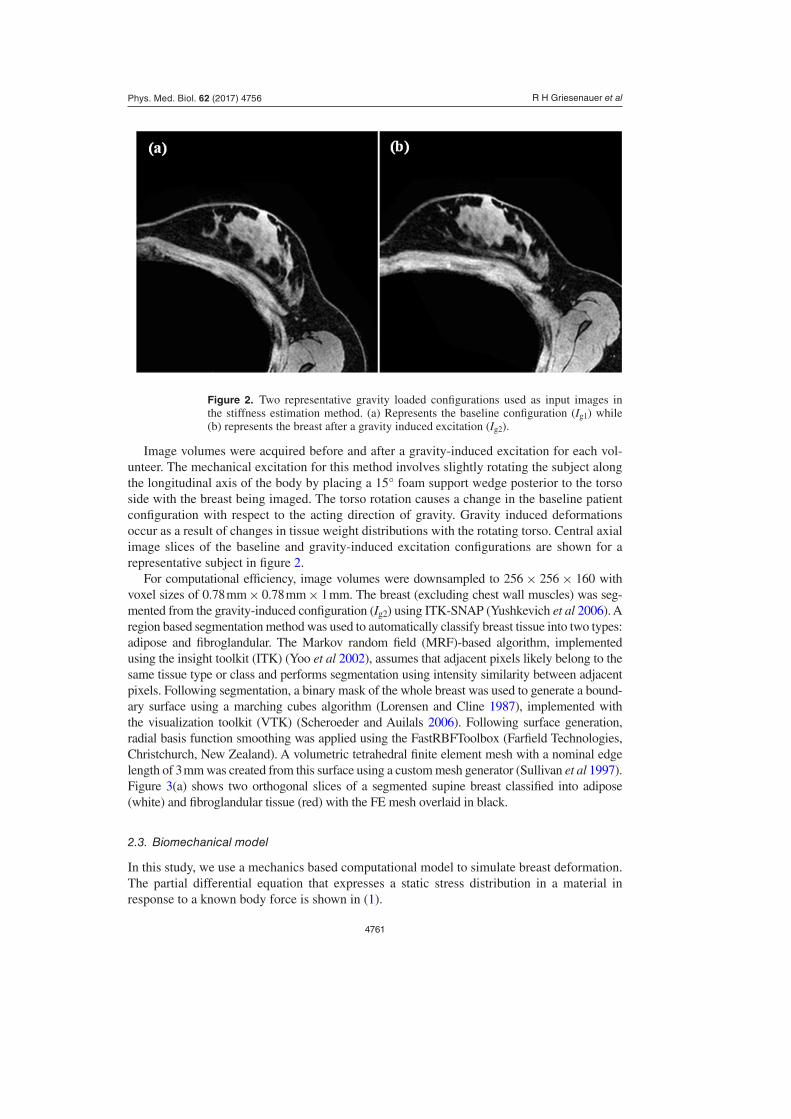
Image volumes were acquired before and after a gravity-induced excitation for each vol-unteer. The mechanical excitation for this method involves slightly rotating the subject along the longitudinal axis of the body by placing a 15° foam support wedge posterior to the torso side with the breast being imaged. The torso rotation causes a change in the baseline patient configuration with respect to the acting direction of gravity. Gravity induced deformations occur as a result of changes in tissue weight distributions with the rotating torso. Central axial image slices of the baseline and gravity-induced excitation configurations are shown for a representative subject in figure 2.
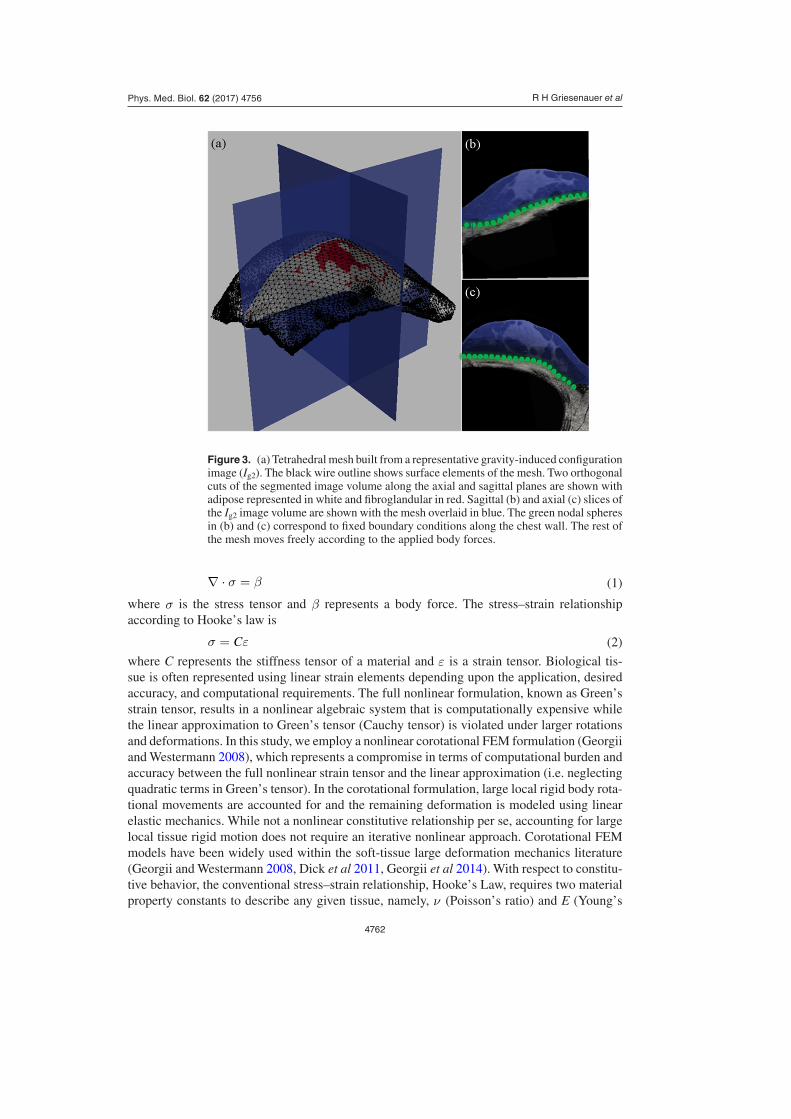
For computational efficiency, image volumes were downsampled to 256 × 256 × 160 with voxel sizes of 0.78 mm × 0.78 mm × 1 mm. The breast (excluding chest wall muscles) was seg-mented from the gravity-induced configuration (Ig2) using ITK-SNAP (Yushkevich et al 2006). A region based segmentation method was used to automatically classify breast tissue into two types: adipose and fibroglandular. The Markov random field (MRF)-based algorithm, implemented using the insight toolkit (ITK) (Yoo et al 2002), assumes that adjacent pixels likely belong to the same tissue type or class and performs segmentation using intensity similarity between adjacent pixels. Following segmentation, a binary mask of the whole breast was used to generate a bound-ary surface using a marching cubes algorithm (Lorensen and Cline 1987), implemented with the visualization toolkit (VTK) (Scheroeder and Auilals 2006). Following surface generation, radial basis function smoothing was applied using the FastRBFToolbox (Farfield Technologies, Christchurch, New Zealand). A volumetric tetrahedral finite element mesh with a nominal edge length of 3 mm was created from this surface using a custom mesh generator (Sullivan et al 1997). Figure 3(a) shows two orthogonal slices of a segmented supine breast classified into adipose (white) and fibroglandular tissue (red) with the FE mesh overlaid in black.
2.3. Biomechanical model
In this study, we use a mechanics based computational model to simulate breast deformation. The partial differential equation that expresses a static stress distribution in a material in response to a known body force is shown in (1).
Figure 2. Two representative gravity loaded configurations used as input images in the stiffness estimation method. (a) Represents the baseline configuration (Ig1) while (b) represents the breast after a gravity induced excitation (Ig2).
R H Griesenauer et alPhys. Med. Biol. 62 (2017) 4756
4762
∇ · σ = β (1)
where σ is the stress tensor and β represents a body force. The stress–strain relationship according to Hooke’s law is
σ = Cε (2)
where C represents the stiffness tensor of a material and ε is a strain tensor. Biological tis-sue is often represented using linear strain elements depending upon the application, desired accuracy, and computational requirements. The full nonlinear formulation, known as Green’s strain tensor, results in a nonlinear algebraic system that is computationally expensive while the linear approximation to Green’s tensor (Cauchy tensor) is violated under larger rotations and deformations. In this study, we employ a nonlinear corotational FEM formulation (Georgii and Westermann 2008), which represents a compromise in terms of computational burden and accuracy between the full nonlinear strain tensor and the linear approximation (i.e. neglecting quadratic terms in Green’s tensor). In the corotational formulation, large local rigid body rota-tional movements are accounted for and the remaining deformation is modeled using linear elastic mechanics. While not a nonlinear constitutive relationship per se, accounting for large local tissue rigid motion does not require an iterative nonlinear approach. Corotational FEM models have been widely used within the soft-tissue large deformation mechanics literature (Georgii and Westermann 2008, Dick et al 2011, Georgii et al 2014). With respect to constitu-tive behavior, the conventional stress–strain relationship, Hooke’s Law, requires two material property constants to describe any given tissue, namely, ν (Poisson’s ratio) and E (Young’s
Figure 3. (a) Tetrahedral mesh built from a representative gravity-induced configuration image (Ig2). The black wire outline shows surface elements of the mesh. Two orthogonal cuts of the segmented image volume along the axial and sagittal planes are shown with adipose represented in white and fibroglandular in red. Sagittal (b) and axial (c) slices of the Ig2 image volume are shown with the mesh overlaid in blue. The green nodal spheres in (b) and (c) correspond to fixed boundary conditions along the chest wall. The rest of the mesh moves freely according to the applied body forces.
R H Griesenauer et alPhys. Med. Biol. 62 (2017) 4756
4763
modulus). Young’s modulus represents the stiffness of a material and is optimized during the stiffness estimation process. Poisson’s ratio is the negative ratio of lateral to longitudinal strain in an axially loaded material and represents a characterization of compressibility. Since biological soft tissue is generally quite hydrated, we assume breast tissue to be slightly to nearly incompressible. Largely due to the challenge in soft-tissue material testing, there is sparse data on ν for breast tissue. As a result, ν was added as another degree of freedom in the model varying over the range of ν = 0.40–0.47. Equation (3) shows the stress–strain relation-ship for a linear elastic, isotropic material.
σ1σ2σ3σ23σ12σ13
=
E(1 + v) (1 − 2v)
1 − v v v 0 0 0v 1 − v v 0 0 0v v 1 − v 0 0 00 0 0 1−2v
2 0 00 0 0 0 1−2v
2 00 0 0 0 0 1−2v
2
ε1ε2ε3
2ε232ε122ε13
(3)
Furthermore, the relationship between strain and displacement is εi,j = 1/2(ui,j + uj,i) where u defines a 3D displacement field. Using linear basis functions defined on tetrahedral finite elements, we performed the Galerkin Method of Weighted Residuals to obtain a system of equations to resolve the unknown displacement coefficients. Ultimately, we are interested in finding the mechanical properties of breast tissue that produce a displacement field that when used to deform the gravity excited image (Ig2) matches the baseline configuration image ( Ig1→g2).
2.4. Boundary conditions
In our model, the chest wall is assumed to be a reliably rigid structure in relation to breast tissue. Therefore, rigid alignment using chest wall intensity information was performed to extract the relative rotation that occurred between the baseline configuration and the torso rotated image configuration. The following image processing steps were performed to extract the geometric change of the breast relative to the direction of gravity:
1. Segment the chest wall muscles in each image: The chest wall was semi-automatically segmented in each image using ITK-SNAP’s
implementation of the Snake’s algorithm (Kass et al 1988). 2. Rigidly register the baseline and gravity-induced images: A standard rigid registration (Viola and Wells 1997) was performed using image contrast
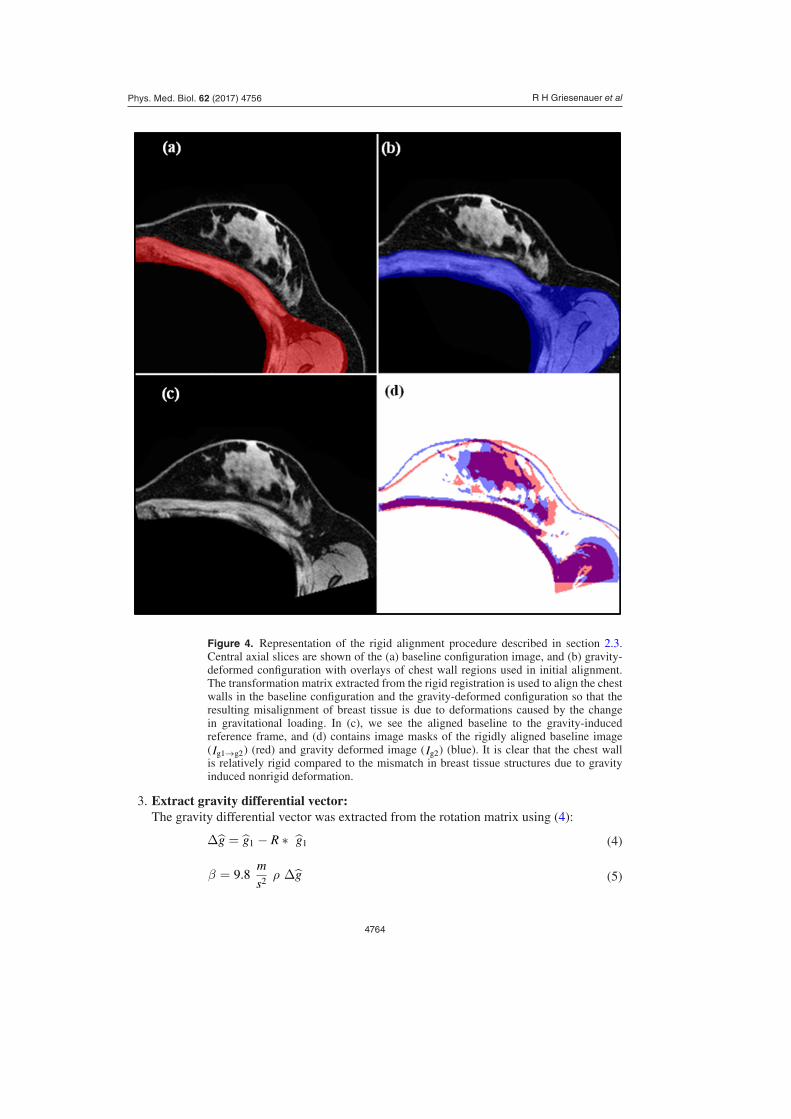
patterns of the chest walls in the two image volumes to transform the baseline image ( Ig1) into the gravity-induced configuration space ( Ig2). Figure 4 displays a representative result of such a registration. Ig1 and Ig2 chest wall image masks are highlighted to show the driving components of the registration (figures 4(a) and (b)). The transformation matrix (containing translation, t and rotation, R) is used to rigidly align the baseline image to the gravity-induced configuration image (figure 4(c)). An overlay of the gravity-induced image ( Ig2) and registered baseline image ( Ig1→g2) is shown in figure 4(d) and visually confirms that the chest wall muscle beneath the breast rigidly aligns compared to the breast tissue above that has deformed due to the difference in gravitational loading. Once aligned, rigid translational components are accounted for and the remaining tissue dis-similarity is due to rotational components that arise from gravity-induced deformations.
R H Griesenauer et alPhys. Med. Biol. 62 (2017) 4756
4764
3. Extract gravity differential vector: The gravity differential vector was extracted from the rotation matrix using (4):
∆g = g1 − R ∗ g1 (4)
β = 9.8ms2 ρ ∆g (5)
Figure 4. Representation of the rigid alignment procedure described in section 2.3. Central axial slices are shown of the (a) baseline configuration image, and (b) gravity-deformed configuration with overlays of chest wall regions used in initial alignment. The transformation matrix extracted from the rigid registration is used to align the chest walls in the baseline configuration and the gravity-deformed configuration so that the resulting misalignment of breast tissue is due to deformations caused by the change in gravitational loading. In (c), we see the aligned baseline to the gravity-induced reference frame, and (d) contains image masks of the rigidly aligned baseline image ( Ig1→g2) (red) and gravity deformed image ( Ig2) (blue). It is clear that the chest wall is relatively rigid compared to the mismatch in breast tissue structures due to gravity induced nonrigid deformation.
R H Griesenauer et alPhys. Med. Biol. 62 (2017) 4756
4765
where g1 is assumed to be unit vector normal to the MR table. In (5), β is subsequently applied as a body force of tissue weight in the biomechanical model (1). The tissue density, ρ, is assumed to be uniform and approximately equal to water, 1000 kg m−3. The model nodes associated with the chest wall are fixed in the x, y, and z directions, i.e. applied Dirichlet boundary conditions set to zero. Figures 3(b) and (c) show central sagittal and axial image slices with the volumetric mesh overlaid in blue. The green spherical nodes represent the fixed posterior surface along the chest wall.
2.5. Stiffness estimation
The stiffness estimation process first begins with generating an eroded binary mask of the torso-rotated image volume for the purpose of designating a zone in which to compute an image similarity metric between the model deformed image and the chest wall aligned base-line image. The Young’s modulus values for adipose and fibroglandular tissue were then esti-mated by performing an exhaustive search of the parameter space and selecting the set of properties that optimized the image similarity metric defined by (6).
S = (1 − CC) (6)
where S is the similarity metric to be minimized and CC is the image correlation coefficient defined by (7).
CC =
∑i(I′|g2|i − I′|g2| )( I|g1→g2|i − I|g1→g2|)
√∑i(I′|g2|i − I′|g2|)
√∑i( I|g1→g2|i − I|g1→g2|)
(7)
where I′|g2|i and I|g1→g2|i are the intensity values at pixel i for the model deformed and chest wall aligned baseline images, respectively. I′|g2| and I|g1→g2| are the mean intensity values of the model deformed and chest wall aligned baseline images. CC has a value of 1 if two images are identical and a value of zero if completely uncorrelated.
2.6. Experiments
2.6.1. Test–retest reproducibility in human subjects. In an IRB approved study with informed written consent, healthy female volunteers over the age of 18 without evidence of pregnancy were recruited for a test–retest study to measure the reproducibility of this stiffness estimation technique. The five test–retest datasets are comprised of three healthy volunteers ages 21–36, with the left and right breasts of two volunteers and the left breast of a third volunteer. Due to differences in right/left breast volumes, fibroglandular content (Zheng et al 2012), tissue hydration levels (Hennessey et al 2014), and a lack of data to suggest symmetry in material properties (Boyd et al 2014), we consider each breast to be an individual dataset. Therefore, this work presents a total of ten stiffness estimates and five test–retest datasets to determine method reproducibility.
A reproducibility assessment was performed using a test–retest approach in which vol-unteers were scanned in a baseline position and re-set between the two-consecutive gravity-loaded configuration scans. Independent stiffness estimations were then performed for each baseline-gravity-deformed dataset using the methodology described above. The parameter search space used in human subjects is summarized in table 1. The lower and upper bounds of the parameter search space for each tissue type was determined by encompassing the range
R H Griesenauer et alPhys. Med. Biol. 62 (2017) 4756
4766
of previously reported tissue stiffness values in quasi-static/low frequency shear wave MRE studies (Sinkus et al 2000, Lorenzen et al 2002, Chen et al 2013, Ramião et al 2016).
The test–retest variability was calculated as the absolute value of the difference between test–retest stiffness values expressed as a percentage of the mean of both stiffness values:
∆E (%) =|E1 − E2|
(E1 + E2)/2× 100 (8)
Where E1 and E2 are the test and retest stiffness estimations, respectively. Test–retest vari-ability was calculated for each tissue type and is commonly reported in quantitative imaging studies (Parsey et al 2000, Abi-Dargham et al 2000) as a measure of standardized variability in measurement errors across subjects. The mean test–retest variability across all datasets is reported as m∆E. The between subject standard deviation (SD) and within subject standard deviation (wSD) was reported to further assess variability and reproducibility. The wSD was calculated according to (Bland and Altman 1999) as follows:
wSD =
√n∑
i=1(E1i−E2i)
2
n√2
(9)
where n represents the number of test–retest datasets. The coefficient of variation (CV) and within subject coefficient of variation (wCV) was calculated by dividing SD and wSD by the overall parameter mean for each tissue type. We calculated the intraclass correlation coeffi-cient (ICC) (Bartlett and Frost 2008), which relates the magnitude of measurement error to the inherent variability between subjects using equation (10). High ICC values indicate that the measurement errors are low in comparison to the true difference between subjects and takes a value between 0 and 1.
ICC =(SD)
2
(SD)2+ (wSD)
2 (10)
2.6.2. Simulation. Simulations were performed to investigate the sensitivity of the objective function to two aspects of the testing framework, (1) adipose-to-fibroglandular tissue vol-ume content, and (2) torso rotation extent. In the simulation framework, a model with known material properties, boundary conditions, and gravity-induced excitation was used to create model-deformed images from baseline image volumes. Material properties for adipose and fibroglandular tissue were selected using the approximate average stiffness values from the human subjects study (adipose and fibroglandular stiffness of 0.25 kPa and 2 kPa, respectively were used as ground truth). For each subsequent simulation set, stiffness property values were incrementally assigned based on the parameter search space with bounds described in table 2, a forward corotational linear elastic model was solved to obtain the displacement field, and the field was interpolated onto the baseline image to create a simulated gravity-deformed image. The image-intensity similarity metric described by equation (7) was then calculated between
Table 1. Parameter space used in human subjects study.
Tissue type Lower bound Upper bound Step size
Adipose 0.05 kPa 2.5 kPa 0.05 kPaFibroglandular 0.05 kPa 12 kPa 0.05 kPaPoisson’s ratio 0.40 0.47 0.01
R H Griesenauer et alPhys. Med. Biol. 62 (2017) 4756
4767
the baseline and model-deformed image volumes. In addition to similarity, a displacement error metric (equation (11)), was also calculated as a measure of difference.
RMS Displacement Error =1N
N∑i=1
|dtrue,i − dmodel,i|2 (11)
where N is the number of nodes in the FEM mesh, dtrue,i are the true nodal displacements provided by the FEM simulation in this case, and dmodel,i are the FEM nodal displacements generated by the current mechanical property model parameters.
To study the effect of adipose-to-fibroglandular tissue volume, baseline image volumes from four healthy volunteers were chosen to represent breasts with low (12%), moderate (24%), and high (33 & 39%) fibroglandular contents. A parameter sweep was performed for each simulation set with an applied body force generated from an approximate 30° rotation about the longitudinal axis of the body.
Investigations on the extent of torso-rotation were performed using the moderate level fibroglandular content image volume. The effect of gravity induced deformation magnitude was explored by performing simulation parameter estimations using three angles of rotation corresponding to approximately 15°, 30°. and 45° rotations along the longitudinal axis.
3. Results
3.1. Healthy volunteers
A representative summary of the parameter sweep search results are shown in figure 5 for two test–retest datasets. A central axial slice of the baseline image is shown in figure 5(a) for each stiffness estimation procedure. Masked overlays of the baseline image (gray), gravity-induced configuration image (blue), and model-optimized image (red) are shown to the right of the anatomical baseline image. While single axial image slices are shown for display pur-poses, property estimations and error calculations were volumetric. Qualitative assessment of these images show a significant improvement in image alignment when stiffness properties are optim ized. Below each image set are the image similarity error maps (d). The contour plots show the value of the image similarity metric for each adipose (x-axis)—fibroglandular (y-axis) combination sampled. Each has an elongated minimum region suggesting greater sensitivity to adipose value contrast.
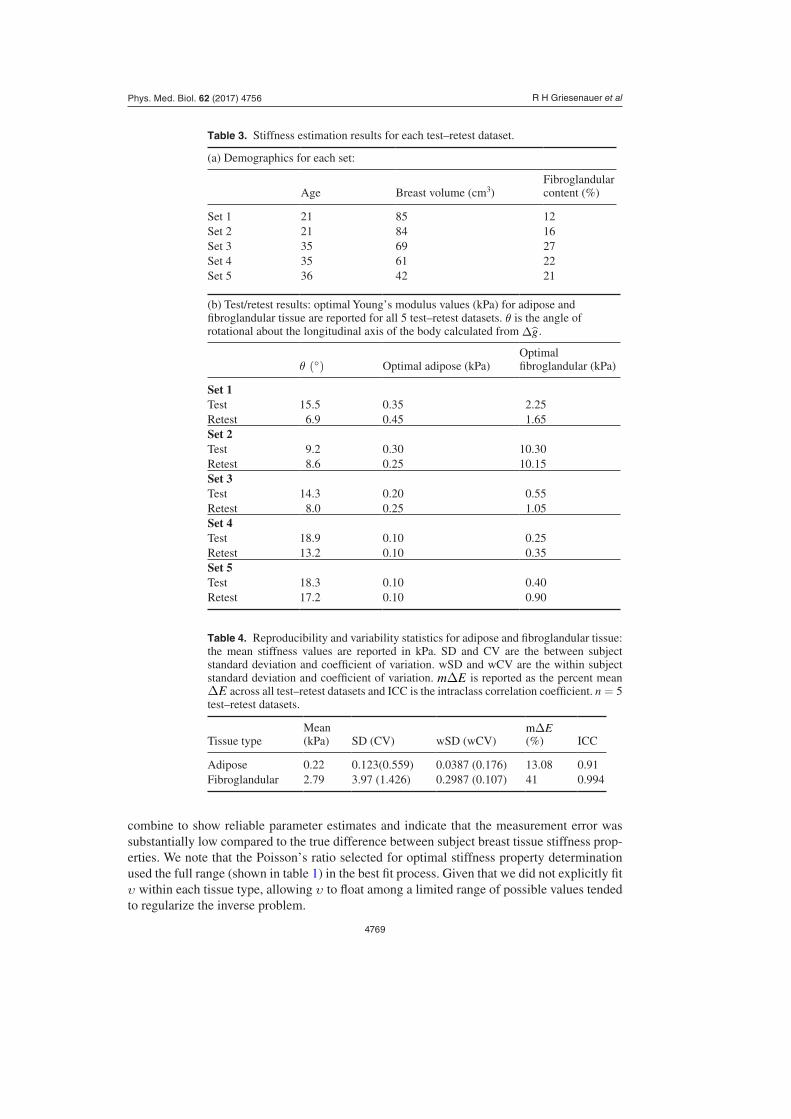
Quantitatively, the method provides reliable stiffness values for both adipose and fibrog-landular tissue. The demographic information and test–retest stiffness estimations are sum-marized in table 3. The optimal Young’s modulus values for adipose and fibroglandular tissue were determined by selecting the parameters responsible for producing the best image similar-ity metric. Among the five test–retest datasets, the highest stiffness properties came from the youngest volunteer (Sets 1 and 2). The ratio of adipose tissue between the left (Set 1) and right (Set 2) breasts ranged from 1.16 to 1.8. The ratio of fibroglandular tissue between the left (Set 1) and right (Set 2) breasts ranged from 4.5–6.2. Set 3 and Set 4 also represent the left and right
Table 2. Parameter space used in simulation study. Ground truth is 0.25 kPa and 2 kPa for adipose and fibroglandular tissue, respectively.
Tissue type Lower bound (kPa) Upper bound (kPa) Step size (kPa)
Adipose 0.1 0.5 0.05Fibroglandular 1 4 0.05
R H Griesenauer et alPhys. Med. Biol. 62 (2017) 4756

4768
breasts from the same subject with adipose ratios ranging from 2 to 2.5 and fibroglandular ratios ranging from 1.4–4.2.
Reproducibility and variability statistics for the five test–retest datasets are summarized in table 4. Test–retest statistics were calculated for the optimal stiffness parameters. The wCV for fibroglandular tissue was 10.7% with respect to optimal parameter selection. The wCV for adipose tissue was 17.6%. A high reliability parameter (ICC) was observed for fibroglandular tissue at 0.994 and adipose at 0.91 using optimal properties. Overall, the wCV and ICC values
Figure 5. Summary of the stiffness estimation results for Set 1 and Set 5. Image alignment comparisons are displayed in panels (a)–(c) for each test–retest set. In (a), axial anatomical image slices are shown for the baseline configurations. (b) Contains masked versions of the baseline configuration image (gray) and gravity-induced configuration image (blue). In (c), masked image slices of the model-deformed configuration with optimized stiffness values are shown in red overlaid with the baseline configuration (gray). Qualitatively, there is significant improvement in the baseline image alignment when model-optimized stiffness parameters are used. Similarity metric maps are shown in (d) where the diamond in each map represents the minimum value of the contour plot (i.e. the optimal stiffness parameters). Contours represent the error in image similarity for each adipose-glandular value sampled.
R H Griesenauer et alPhys. Med. Biol. 62 (2017) 4756
4769
combine to show reliable parameter estimates and indicate that the measurement error was substantially low compared to the true difference between subject breast tissue stiffness prop-erties. We note that the Poisson’s ratio selected for optimal stiffness property determination used the full range (shown in table 1) in the best fit process. Given that we did not explicitly fit υ within each tissue type, allowing υ to float among a limited range of possible values tended to regularize the inverse problem.
Table 3. Stiffness estimation results for each test–retest dataset.
(a) Demographics for each set:
Age Breast volume (cm3)Fibroglandular content (%)
Set 1 21 85 12Set 2 21 84 16Set 3 35 69 27Set 4 35 61 22Set 5 36 42 21
(b) Test/retest results: optimal Young’s modulus values (kPa) for adipose and fibroglandular tissue are reported for all 5 test–retest datasets. θ is the angle of rotational about the longitudinal axis of the body calculated from ∆g.
θ (◦) Optimal adipose (kPa)Optimal fibroglandular (kPa)
Set 1Test 15.5 0.35 2.25Retest 6.9 0.45 1.65Set 2Test 9.2 0.30 10.30Retest 8.6 0.25 10.15Set 3Test 14.3 0.20 0.55Retest 8.0 0.25 1.05Set 4Test 18.9 0.10 0.25Retest 13.2 0.10 0.35Set 5Test 18.3 0.10 0.40Retest 17.2 0.10 0.90
Table 4. Reproducibility and variability statistics for adipose and fibroglandular tissue: the mean stiffness values are reported in kPa. SD and CV are the between subject standard deviation and coefficient of variation. wSD and wCV are the within subject standard deviation and coefficient of variation. m∆E is reported as the percent mean ∆E across all test–retest datasets and ICC is the intraclass correlation coefficient. n = 5 test–retest datasets.
Tissue typeMean (kPa) SD (CV) wSD (wCV)
m∆E (%) ICC
Adipose 0.22 0.123(0.559) 0.0387 (0.176) 13.08 0.91Fibroglandular 2.79 3.97 (1.426) 0.2987 (0.107) 41 0.994
R H Griesenauer et alPhys. Med. Biol. 62 (2017) 4756
4770
3.2. Simulations
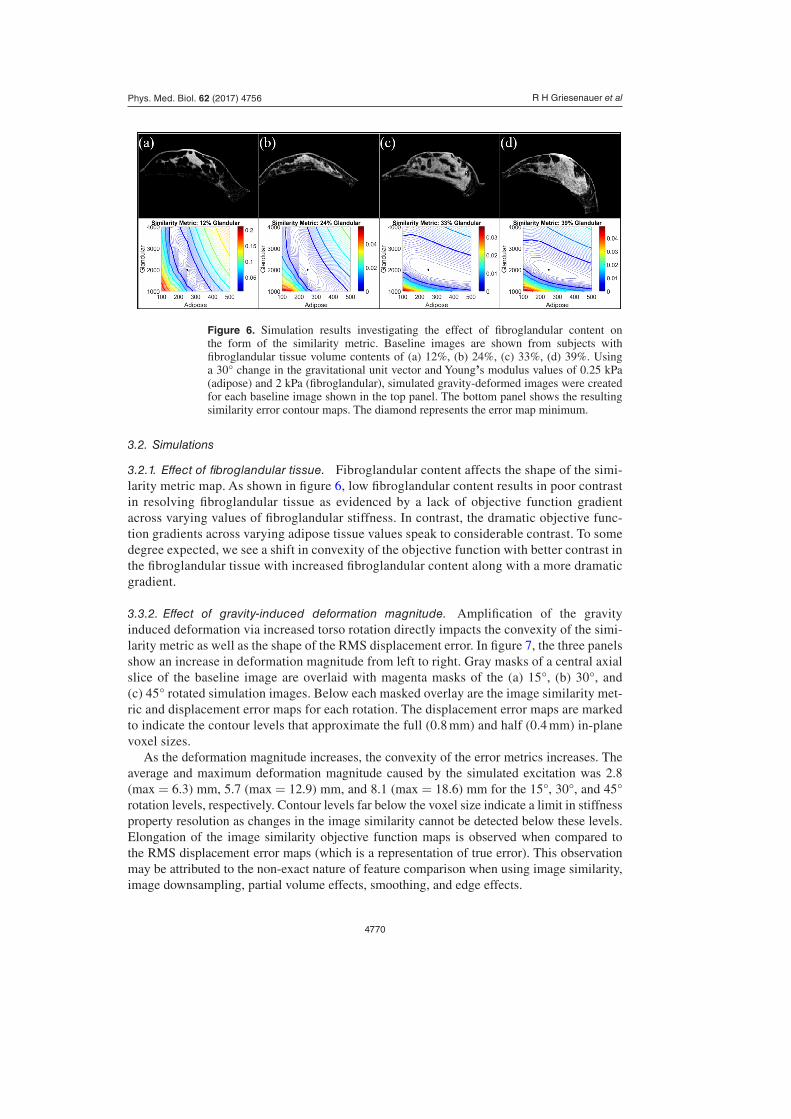
3.2.1. Effect of fibroglandular tissue. Fibroglandular content affects the shape of the simi-larity metric map. As shown in figure 6, low fibroglandular content results in poor contrast in resolving fibroglandular tissue as evidenced by a lack of objective function gradient across varying values of fibroglandular stiffness. In contrast, the dramatic objective func-tion gradients across varying adipose tissue values speak to considerable contrast. To some degree expected, we see a shift in convexity of the objective function with better contrast in the fibroglandular tissue with increased fibroglandular content along with a more dramatic gradient.
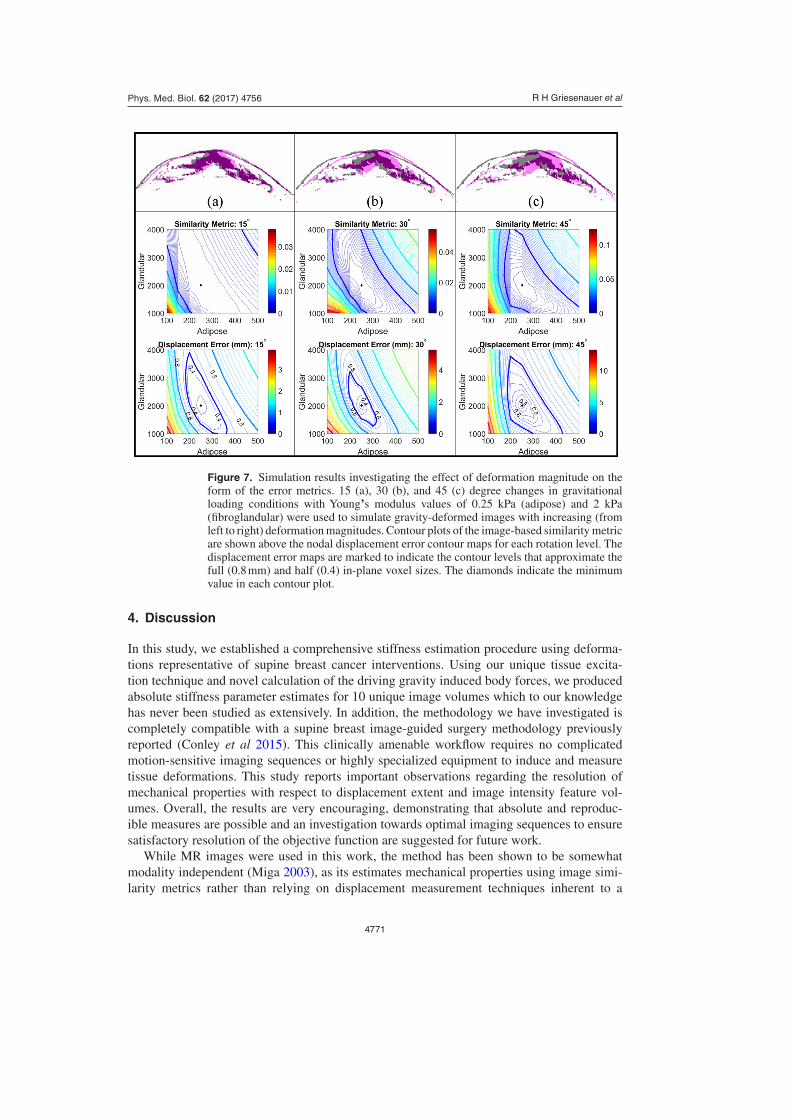
3.3.2. Effect of gravity-induced deformation magnitude. Amplification of the gravity induced deformation via increased torso rotation directly impacts the convexity of the simi-larity metric as well as the shape of the RMS displacement error. In figure 7, the three panels show an increase in deformation magnitude from left to right. Gray masks of a central axial slice of the baseline image are overlaid with magenta masks of the (a) 15°, (b) 30°, and (c) 45° rotated simulation images. Below each masked overlay are the image similarity met-ric and displacement error maps for each rotation. The displacement error maps are marked to indicate the contour levels that approximate the full (0.8 mm) and half (0.4 mm) in-plane voxel sizes.
As the deformation magnitude increases, the convexity of the error metrics increases. The average and maximum deformation magnitude caused by the simulated excitation was 2.8 (max = 6.3) mm, 5.7 (max = 12.9) mm, and 8.1 (max = 18.6) mm for the 15°, 30°, and 45° rotation levels, respectively. Contour levels far below the voxel size indicate a limit in stiffness property resolution as changes in the image similarity cannot be detected below these levels. Elongation of the image similarity objective function maps is observed when compared to the RMS displacement error maps (which is a representation of true error). This observation may be attributed to the non-exact nature of feature comparison when using image similarity, image downsampling, partial volume effects, smoothing, and edge effects.
Figure 6. Simulation results investigating the effect of fibroglandular content on the form of the similarity metric. Baseline images are shown from subjects with fibroglandular tissue volume contents of (a) 12%, (b) 24%, (c) 33%, (d) 39%. Using a 30° change in the gravitational unit vector and Young’s modulus values of 0.25 kPa (adipose) and 2 kPa (fibroglandular), simulated gravity-deformed images were created for each baseline image shown in the top panel. The bottom panel shows the resulting similarity error contour maps. The diamond represents the error map minimum.
R H Griesenauer et alPhys. Med. Biol. 62 (2017) 4756
4771
4. Discussion
In this study, we established a comprehensive stiffness estimation procedure using deforma-tions representative of supine breast cancer interventions. Using our unique tissue excita-tion technique and novel calculation of the driving gravity induced body forces, we produced absolute stiffness parameter estimates for 10 unique image volumes which to our knowledge has never been studied as extensively. In addition, the methodology we have investigated is completely compatible with a supine breast image-guided surgery methodology previously reported (Conley et al 2015). This clinically amenable workflow requires no complicated motion-sensitive imaging sequences or highly specialized equipment to induce and measure tissue deformations. This study reports important observations regarding the resolution of mechanical properties with respect to displacement extent and image intensity feature vol-umes. Overall, the results are very encouraging, demonstrating that absolute and reproduc-ible measures are possible and an investigation towards optimal imaging sequences to ensure satisfactory resolution of the objective function are suggested for future work.
While MR images were used in this work, the method has been shown to be somewhat modality independent (Miga 2003), as its estimates mechanical properties using image simi-larity metrics rather than relying on displacement measurement techniques inherent to a
Figure 7. Simulation results investigating the effect of deformation magnitude on the form of the error metrics. 15 (a), 30 (b), and 45 (c) degree changes in gravitational loading conditions with Young’s modulus values of 0.25 kPa (adipose) and 2 kPa (fibroglandular) were used to simulate gravity-deformed images with increasing (from left to right) deformation magnitudes. Contour plots of the image-based similarity metric are shown above the nodal displacement error contour maps for each rotation level. The displacement error maps are marked to indicate the contour levels that approximate the full (0.8 mm) and half (0.4) in-plane voxel sizes. The diamonds indicate the minimum value in each contour plot.
R H Griesenauer et alPhys. Med. Biol. 62 (2017) 4756
4772
specific imaging modality (the method has been used previously with CT images and optical images (Miga et al 2005, Ou et al 2007)). However, this work goes further than the closely-related investigations of the elastography method called modality independent elastography (MIE) (Miga 2003, Miga et al 2005, Ou et al 2007, Pheiffer et al 2011, Weis et al 2013, 2015a). More specifically, previous MIE investigations were only successful in predicting soft-tissue stiffness ratios between adipose, fibroglandular, and tumor due to the use of inde-terminate displacement boundary conditions. In this study, we deploy an adaptation that uses gravitational body forces for excitation, which as equation (1) shows, transforms the approach to generating absolute quantitative stiffness tissue values.
To our knowledge, this study reports the first test–retest reproducibility assessment of an MRI- derived, absolute quantitative breast tissue stiffness estimation method using gravity-induced excitations. Our test–retest wCV (wCV-10.7% and 17.6% for fibroglandular and adi-pose, respectively) and ICC (ICC-0.994 and 0.91 fibroglandular and adipose, respectively) values are comparable to other quantitative imaging reproducibility studies. In Weis et al (2015a), the reproducibility of the MIE method in murine breast cancer models was stud-ied. The wCV ranged from 13% at the bulk level to 32% at the voxel level. The ICC values reported in Weis et al (2015a) ranged from 0.70–0.99. Due to our modest sample size, robust statistical analysis for true significance is limited; however, this work is suggestive and quite encouraging.
From the perspective of clinical workflow, this work suggests various improvements to the image acquisition and mechanical excitation procedure that can be adapted to improve the performance of the method. The shifts in convexity of the similarity objective function maps shown in figures 6 and 7 was a significant finding in the simulation studies. These results indicate that a lack of signal (or decreased image volume texture) in either tissue type will cause the objective function to provide less contrasting gradients with respect to the tissue-type of decreasing signal content. In future studies, weighting schemes and adjustment of image acquisition sequences will need to be studied to further investigate this observation and perhaps develop novel image acquisition frameworks to maximize contrast performance. For example, in previous MIE studies, simultaneous MRI acquisitions of fat-only and water-only images were performed using a commercially available Dixon sequence (Weis et al 2015b). We can utilize these image sequences to improve objective function sensitivity depending on tissue-type content. Similarly, we also observed in this study that amplifying the deformation magnitude by increased torso rotation will better condition the objective function for future inverse property reconstruction methods. The degree of rotation in the volunteer study over-all best corresponds to the 15° rotation in the simulation study. We experimentally observed that increased torso rotations are particularly important for small and/or stiff breast volumes. Therefore, we can customize our image acquisition protocol to accommodate breast density. Lastly, all of these observations will be particularly important as we use this information to advance the performance of inverse reconstruction procedures based on similarity (e.g. MIE).
With respect to limitations of this work, in addition to our modest sample sizes, the average volunteer age was 30, which is relatively young compared to the average breast cancer patient. It is likely that additional work would be needed to resolve aspects that vary with age. Across all subject types, it is likely that more advanced nonlinear constitutive relationships will be needed in the future to further improve accuracy of such methods. Similarly, quasi-static excitation neglects a potentially rich source of time-varying viscoelastic effects that may be important for interactive IGBS systems. Additionally, we also need to consider the accuracy of boundary conditions. While the model accounts for gravity induced deformations, it ignores contributions from Cooper’s ligaments, pectoral muscle forces, and rigid registration errors during the initial alignment procedure. Understanding the impact of these missing factors and
R H Griesenauer et alPhys. Med. Biol. 62 (2017) 4756
4773
sources of error is an important direction for improving performance. Clearly, another limita-tion is that we prescribe the tissue types as isotropic and homogeneous. In future work, spa-tially discretized region-based mechanical property reconstructions, similar to that of the MIE methodology, may be needed to create better geometric maps of tissue stiffness. With this last item, these capabilities tend to be goals within diagnostic elastography applications. In terms of image acquisition protocols, there are areas to be improved. The image acquisition methods performed in this study were adapted from an existing prone imaging protocol (Li et al 2015). For a healthy volunteer, the signal to noise ratio (SNR) calculated according to (Janssen et al 2017) was measured in a prone and supine setup using the image parameters defined in section 2.2. In the prone acquisition, a dedicated breast coil (16-channel receive double-breast coil, Philips Healthcare, Best, The Netherlands) was used. The SNR in the prone images was 55.8 while the supine image SNR was 27.2. The reduced SNR in the supine images is due to respiratory and motion artifacts while also compounded by the fact that the torso coil used in the study is not optimized for breast imaging. An avenue worth pursuing in the future is to use respiratory-triggered MR acquisitions, which have been shown to improve the SNR of supine breast images (Janssen et al 2017).
As the work moves forward, we must establish which features are most important for the accurate execution of IGBS. Nevertheless, it is encouraging that our preliminary stiffness values are within range of low frequency, minimal pre-compression elastography methods. For example, in Chen et al (2013), a non-compressive elastography system with relatively low frequency shear waves (40 Hz) was tested in 7 healthy subjects. The stiffness range for adipose tissue was 0.25–0.41 kPa and 0.46–0.9 kPa for fibroglandular tissue. In (Lorenzen et al 2002), MR elastography values for 20 patients and 15 healthy volunteers were reported with 0.5–4 kPa (median = 1.7 kPa) for adipose tissue and 1–15 kPa (median = 2.5 kPa) for fibroglandular tissue. Traditionally, magnetic resonance elastography studies report stiffness values in terms of shear modulus (G), which can be approximated to Young’s modulus by E = 3G. With our quasi-static study herein, we report mean Young’s modulus values of adi-pose tissue to be 0.2 ± 0.1 kPa and 2.8 ± 4.0 kPa for fibroglandular tissue. As breast tissue properties have been shown to be frequency dependent (increased reported stiffness values with increased frequency and precompression (Barr and Zhang 2012, Liu et al 2016, Ramião et al 2016)), we report lower stiffness values in this study than measured by dynamic based excitation methods.
5. Conclusion
In summary, we have established a novel quantitative breast tissue stiffness estimation frame-work amenable to clinical workflows associated with interventional/surgical image-guided environments. We characterized the performance of the method in simulation and established the test–retest reproducibility of the resulting stiffness values in vivo in healthy volunteers. The feasibility and reproducibility of the stiffness estimation method presented here is encour-aging and several future opportunities for improvement and implementation into other appli-cations exist. The framework suggested in this work can be seamlessly integrated and adds only a single additional 2 min scan to a supine imaging procedure. With this single additional scan, we realize an ability to develop patient-specific breast geometric models with appropri-ate quantitative stiffness estimates for use within novel image guided-breast surgery systems with no specialized equipment and using standard imaging sequences available on traditional clinical MR scanners.
R H Griesenauer et alPhys. Med. Biol. 62 (2017) 4756
4774
Acknowledgments
This work was supported by the National Institutes of Health through K25CA204599, R21EB022380 and by a National Science Foundation Graduate Research Fellowship awarded to R H G. We would like to acknowledge and thank the support of the Vanderbilt Institute of Imaging Science (VUIIS). We would also like to graciously thank those who volunteered to be part of our study.
Disclosures
The authors disclose no conflicts of interest.
References
Abi-Dargham A et al 2000 Measurement of striatal and extrastriatal dopamine D1 receptor binding potential with [11C]NNC 112 in humans: validation and reproducibility J. Cereb. Blood Flow Metab. 20 225–43
Azar F S, Metaxas D N and Schnall M D 2002 Methods for modeling and predicting mechanical deformations of the breast under external perturbations Med. Image Anal. 6 1–27
Barr R G and Zhang Z 2012 Effects of precompression on elasticity imaging of the breast development of a clinically useful semiquantitative method of precompression assessment J. Ultrasound Med. 31 895–902
Bartlett J W and Frost C 2008 Reliability, repeatability and reproducibility: analysis of measurement errors in continuous variables Ultrasound Obstet. Gynecol. 31 466–75
Bland J M and Altman D G 1999 Measuring agreement in method comparison studies Stat. Methods Med. Res. 8 135–60
Boyd N F et al 2014 Evidence that breast tissue stiffness is associated with risk of breast cancer PLoS One 9 e100937
Carter T J, Sermesant M, Cash D M, Barratt D C, Tanner C and Hawkes D J 2005 Application of soft tissue modelling to image-guided surgery Med. Eng. Phys. 27 893–909
Carter T J, Tanner C and Hawkes D J 2009 Determining material properties of the breast for image-guided surgery SPIE Medical Imaging p 726124
Chen J et al 2013 Non compressive MR elastography of breasts Proc. of the Int. Society for Magnetic Resonance in Medicine (Salt Lake City, USA)
Chung J H, Rajagopal V, Nielsen P M F and Nash M P 2008a A biomechanical model of mammographic compressions Biomech. Model. Mechanobiol. 7 43–52
Chung J-H, Rajagopal V, Laursen T A, Nielsen P M F and Nash M P 2008b Frictional contact mechanics methods for soft materials: application to tracking breast cancers J. Biomech. 41 69–77
Conley R H et al 2015 Realization of a biomechanical model-assisted image guidance system for breast cancer surgery using supine MRI Int. J. Comput. Assist. Radiol. Surg. 10 1985–96
de Heras Ciechomski P et al 2012 Development and implementation of a web-enabled 3D consultation tool for breast augmentation surgery based on 3D-image reconstruction of 2D pictures J. Med. Internet Res. 14 e21
del Palomar A P, Calvo B, Herrero J, López J and Doblaré M 2008 A finite element model to accurately predict real deformations of the breast Med. Eng. Phys. 30 1089–97
Dick C, Georgii J and Westermann R 2011 A real-time multigrid finite hexahedra method for elasticity simulation using CUDA Simul. Model. Pract. Theory 19 801–16
Eiben B et al 2016 Symmetric biomechanically guided prone-to-supine breast image registration Ann. Biomed. Eng. 44 154–73
Gamage B, Thiranja P, Rajagopal V, Ehrgott M, Nash M P and Nielsen P M F 2011 Identification of mechanical properties of heterogeneous soft bodies using gravity loading Int. J. Numer. Method Biomed. Eng. 27 391–407
Georgii J and Westermann R 2008 Corotated finite elements made fast and stable VRIPHYS 8 11–9
R H Griesenauer et alPhys. Med. Biol. 62 (2017) 4756
4775
Georgii J et al 2014 A computational tool for preoperative breast augmentation planning in aesthetic plastic surgery IEEE J. Biomed. Health Inform. 18 907–19
Hennessey S et al 2014 Bilateral symmetry of breast tissue composition by magnetic resonance in young women and adults Cancer Causes Control 25 491–7
Hofvind S, Iversen B F, Eriksen L, Styr B M, Kjellevold K and Kurz K D 2011 Mammographic morphology and distribution of calcifications in ductal carcinoma in situ diagnosed in organized screening Acta Radiol. 52 481–7
Janssen N N Y et al 2017 Supine breast MRI using respiratory triggering Acad. Radiol. (https://doi.org/10.1016/j.acra.2017.01.003)
Kass M, Witkin A and Terzopoulos D 1988 Snakes: active contour models Int. J. Comput. Vis. 1 321–31Landercasper J, Whitacre E, Degnim A C and Al-Hamadani M 2014 Reasons for re-excision after
lumpectomy for breast cancer: insight from the american society of breast surgeons masterysm database Ann. Surg. Oncol. 21 3185–91
Lee N A et al 1997 Fatty and fibroglandular tissue volumes in the breasts of women 20–83 years old: comparison of x-ray mammography and computer-assisted MR imaging AJR Am. J. Roentgenol. 168 501–6
Li X et al 2015 Multiparametric magnetic resonance imaging for predicting pathological response after the first cycle of neoadjuvant chemotherapy in breast cancer Invest. Radiol. 50 195–204
Liu B et al 2016 Breast lesions: quantitative diagnosis using ultrasound shear wave elastography—a systematic review and meta-analysis Ultrasound Med. Biol. 42 835–47
Lorenzen J et al 2002 MR elastography of the breast: preliminary clinical results RöFo 174 830–4Lorenzen J, Sinkus R, Biesterfeldt M and Adam G 2003 Menstrual-cycle dependence of breast
parenchyma elasticity: estimation with magnetic resonance elastography of breast tissue during the menstrual cycle Invest. Radiol. 38 236–40
Lorensen W E and Cline H E 1987 Marching cubes: a high resolution 3D surface construction algorithm ACM Siggraph Comput. Graph. 21 163–9
Miga M I 2003 A new approach to elastography using mutual information and finite elements Phys. Med. Biol. 48 467
Miga M I, Rothney M P and Ou J J 2005 Modality independent elastography (MIE): potential applications in dermoscopy Med. Phys. 32 1308–20
Misra S, Ramesh K T and Okamura A M 2008 Modeling of tool-tissue interactions for computer-based surgical simulation: a literature review Presence 17 463–91
Ou J J, Ong R E, Yankeelov T E and Miga M I 2007 Evaluation of 3D modality-independent elastography for breast imaging: a simulation study Phys. Med. Biol. 53 147
Parsey R V et al 2000 Validation and reproducibility of measurement of 5-HT1A receptor parameters with [carbonyl-11C]WAY-100635 in humans: comparison of arterial and reference tissue input functions J. Cereb. Blood Flow Metab. 20 1111–33
Pheiffer T S, Ou J J, Ong R E and Miga M I 2011 Automatic generation of boundary conditions using demons nonrigid image registration for use in 3D modality-independent elastography IEEE Trans. Biomed. Eng. 58 2607–16
Pleijhuis R G, Graafland M, de Vries J, Bart J, de Jong J S and van Dam G M 2009 Obtaining adequate surgical margins in breast-conserving therapy for patients with early-stage breast cancer: current modalities and future directions Ann. Surg. Oncol. 16 2717–30
Rajagopal V et al 2008 Creating individual-specific biomechanical models of the breast for medical image analysis Acad. Radiol. 15 1425–36
Ramião N G, Martins P S, Rynkevic R, Fernandes A A, Barroso M and Santos D C 2016 Biomechanical properties of breast tissue, a state-of-the-art review Biomech. Model. Mechanobiol. 15 1307–23
Roose L, De Maerteleire W, Mollemans W and Suetens P 2005 Validation of different soft tissue simulation methods for breast augmentation Int. Congr. Ser. 1281 485–90
Scheroeder W J and Auilals H W A 2006 The Visualization Toolkit User’s Guide (New York: Kitware Inc.)
Sinkus R, Lorenzen J, Schrader D, Lorenzen M, Dargatz M and Holz D 2000 High-resolution tensor MR elastography for breast tumour detection Phys. Med. Biol. 45 1649
Sullivan J M Jr, Charron G and Paulsen K D 1997 A three-dimensional mesh generator for arbitrary multiple material domains Finite Elem. Anal. Des. 25 219–41
Vancamberg L, Sahbani A, Muller S and Morel G 2010 Needle path planning for digital breast tomosynthesis biopsy Robotics and Automation (ICRA), 2010 IEEE Int. Conf. pp 2062–7
Viola P and Wells W M III 1997 Alignment by maximization of mutual information Int. J. Comput. Vis. 24 137–54
R H Griesenauer et alPhys. Med. Biol. 62 (2017) 4756
4776
Weis J A et al 2013 A consistent pre-clinical/clinical elastography approach for assessing tumor mechanical properties in therapeutic systems SPIE Medical Imaging p 86721F
Weis J A, Flint K M, Sanchez V, Yankeelov T E and Miga M I 2015a Assessing the accuracy and reproducibility of modality independent elastography in a murine model of breast cancer J. Med. Imaging 2 36001
Weis J A, Johnsen A M, Wile G E, Yankeelov T E, Abramson R G and Miga M I 2015b Development of a diaphragmatic motion-based elastography framework for assessment of liver stiffness SPIE Medical Imaging p 941703
Weis J A, Kim D K, Yankeelov T E and Miga M I 2014 Validation and reproducibility assessment of modality independent elastography in a pre-clinical model of breast cancer SPIE Medical Imaging p 90381I
Yoo T S et al 2002 Engineering and algorithm design for an image processing API: a technical report on ITK-the insight toolkit Stud. Health Technol. Inform. 85 586–92
Yushkevich P A et al 2006 User-guided 3D active contour segmentation of anatomical structures: significantly improved efficiency and reliability Neuroimage 31 1116–28
Zheng B, Sumkin J H, Zuley M L, Wang X, Klym A H and Gur D 2012 Bilateral mammographic density asymmetry and breast cancer risk: a preliminary assessment Eur. J. Radiol. 81 3222–8
R H Griesenauer et alPhys. Med. Biol. 62 (2017) 4756