Embed Size (px)
Citation preview

February 13, 2003, DRAFT
1
Breeding Season Survey Techniques for Seabirds and Colonial Waterbirds throughout North
America
Steinkamp, M., B. Peterjohn, V. Byrd, H. Carter, and R. Lowe
Introduction
For a continent-wide monitoring program to succeed, it is essential that methods be developed
and agreed upon that are consistent and comparable. This manual is the first step towards standardizing
monitoring methods for breeding colonial waterbirds in continental North America. Standardized methods
also need to be developed for monitoring populations outside of the breeding season and for monitoring
habitats at multiple geographic and temporal scales.
This manual synthesizes information from existing monitoring programs and the literature on
seabird and colonial waterbird surveys for estimating breeding populations, examines the weaknesses and
strengths of each technique, the habitats and species best suited for specific techniques, and wherever
possible, describes approaches for estimating detection probabilities associated with each method. The
methods proposed by this manual are for developing reliable, comparable estimates of population size to
establish trend information. While this manual addresses only breeding season methodologies, there is a
recognized need for information on methodologies for estimating numbers of colonial waterbirds outside
of the breeding season. We have not included methods for measuring other population parameters such as
growth rates and reproductive success during the breeding season, nor have we included methods for
estimating numbers during migration or for monitoring changes within waterbird habitats. A separate
manual will address these methods.
For the purposes of this manual, colonial waterbirds are defined as those birds represented by the
families listed in Table One. Definitions of terms used throughout this document are found in Appendix
A.
Table 1. List of avian families included in the North American Colonial Waterbird Monitoring Manual.
Family Species Family Species
Diomedeidae albatrosses Anhingidae darters, anghinga
Procellariidae shearwaters, petrels, fulmars Fregatidae frigatebirds
Hydrobatidae storm-petrels Ardeidae herons, egrets, bitterns
Phaethontidae tropicbirds Threskiornithidae ibises, spoonbills
Sulidae boobies, gannets Ciconiidae storks
Pelicanidae pelicans Phoenicopteridea flamingos
Phalacrocoracidae cormorants Laridae skuas, gulls, terns, skimmers
Alcidae auks, murres, puffins
_________________________________________________________________________________________________

February 13, 2003, DRAFT
2
Purpose
The purpose of this manual is to provide managers and biologists with the tools necessary to
develop standardized data collection methods for monitoring colonial waterbirds throughout North
America. We hope that by providing standardized methodologies, better coordination can be
accomplished amongst agencies and individuals monitoring colonial waterbirds throughout Mexico,
Meso-America, Canada, the Caribbean Nations, and the United States. Our ability to manage and
conserve many of these species is presently hampered by a lack of reliable information on the status and
trends of their populations, information that can best be obtained through the use of standardized data
collection techniques. As habitats become increasingly pressured by multiple uses, it has become critical
to be able to make informed management decisions for colonial waterbird conservation, and this will
require coordinated data collection efforts at the local, regional, and continental scales. It is important to
recognize that when designing monitoring programs, we must think beyond a goal of measuring change in
numbers over time. This has been termed “surveillance” (Perry et al. 1987), not monitoring. When
designing monitoring programs, we must incorporate being able to use information on change over time
to evaluate management practices and to make management decisions. These factors are all important to
consider when laying out the purpose of your monitoring program. Throughout the introduction of this
manual are questions that should be addressed when beginning the process of designing a monitoring
program.
The first of these questions is why is it important to count colonial waterbirds using standardized
methods? What benefit is there to adopting a set of standardized methods to count species within your
area of interest? To make informed management decisions about colonial waterbird populations, we must
understand the status and trends of their populations at various geographic scales. If site-specific data are
collected using different methodologies without quantifying the error associated with each method, the
results can be difficult to use in the determination of population trends at larger geographic scales. This
information is needed both to identify problems with species and to evaluate their responses to
management actions.
The second question is whether you have enough information on the distribution, locations,
species composition, and approximate sizes of the colonial waterbird breeding colonies within your area
of interest to design your monitoring program. Without this information, choosing the appropriate survey
technique and designing a sampling scheme for your monitoring program will be difficult. Is there a
breeding atlas, report, or are other data sources available delineating colonies within the area of interest
which have been completed within the past 10 years? If not, you will need to conduct an inventory to
determine the distribution and species composition of colonies within your area of interest.

February 13, 2003, DRAFT
3
Conducting Inventories
The main purpose of an inventory is to find all of the waterbird colonies within the area of
interest. Complete inventories can be conducted within a single breeding season for small geographic
areas, such as a wildlife refuge or national park. Large regional inventories, for a state, province, or island
nation, for example, may require several years to locate the majority of colonies, and it is likely that some
small colonies may be overlooked. Maintaining a current atlas of known and historic colony sites is an
important component of any colonial waterbird monitoring program. Inventorying a large area may
require utilization of more than one resource. The method chosen will be dependent on the resources
available, the degree of habitat heterogeneity within the area to be surveyed, and the biological
characteristics of the species to be sampled. Aerial surveys may be adequate for large conspicuous
species. However, most inventories require locating colonies on the ground, using boats to survey along
waterways and other aquatic habitats that are inaccessible from roads. Timing of the inventories will be
based on the breeding chronology of the species in the area, and should occur during the peak of breeding
activities to better establish the absence of species from colonies. The exceptions are those species that
leave conspicuous nests that can be counted outside of the breeding season. For example, in the
Northeastern United States, colonies of Great Blue Herons could be inventoried during the non-breeding
season as their large conspicuous nests can be seen once the trees drop their leaves in the fall.
Nocturnal burrowing species are especially difficult to inventory and may require either nighttime
or daytime surveys specific for them. Some potential tools to use to inventory areas for these species
include nocturnal mist netting, combined with the use of tape playbacks during one or a few nights. This
may be an efficient method for determining the species composition of nocturnal species at multi-species
colonies without causing undue disturbance to the nesting birds. You may want to use the help of
volunteers to conduct an inventory (see below).
Steps for conducting an inventory
Regardless of the size of the survey area, the first step in conducting an inventory is to thoroughly
search all existing sources to obtain information on the species composition at known colony locations.
The amount of information will vary from area to area depending upon the extent of previous surveys.
Possible sources of information include:
1) The Published Literature: An atlas of waterbird colonies and a Breeding Bird Atlas are
excellent sources if available. The colonial waterbird monitoring database at the USGS
Patuxent Wildlife Research Center site may provide some information on historic and current
colonies (URL www.mp2-pwrc.usgs.gov/cwb). Other potential sources include summaries

February 13, 2003, DRAFT
4
published in state bird journals and the peer-reviewed literature, and various “gray” literature
sources such as unpublished reports prepared for various governmental agencies.
2) Unpublished Information: The Natural Resource agencies of many states and provinces
maintain unpublished information on the status of waterbird colonies and other non-game
birds. Other governmental and non-governmental wildlife/natural resource management
agencies may maintain similar information for the lands under their responsibility.
Even if the existing information is fairly exhaustive, another consideration is the potential presence of
species that may have been overlooked by previous surveys. Field guides, state bird books, and similar
references should be consulted to develop a complete list of species that might be expected to occur in an
area.
In addition to collecting distributional information, the literature search should also focus on
obtaining relevant data on the breeding biology and chronology of the species that will be the subject of
the inventory. The most important information includes the specific characteristics of the preferred and
secondary habitats associated with known colony locations, and the timing of each stage of nesting for
each species. Region- specific data are preferred, but more general information will suffice if region-
specific data are not available. Information on the general breeding biology will also be helpful,
especially for crepuscular and nocturnal species or those with very specific habitat preferences or
breeding behaviors. The best sources of this information include:
1) The Birds of North America species accounts published by the AOU summarize the available
information on the breeding biology and nesting habitat preferences for these species.
2) State bird books, breeding bird atlases, and/or information in state bird journals may provide
the most specific information on the timing of nesting activities in an area. If little
information is available for a particular state, data from adjacent states will have to suffice.
Once the background information has been collected, the next step is to conduct the inventory. The
two components to an inventory consist of visits to known colony sites and attempts to discover new
locations. The amount of effort devoted to each component depends upon the extent of previous surveys
and the size of the area under consideration.
In most cases, the first step is an attempt to relocate all of the historic colony sites that have been
identified. For relatively small geographic areas, a single field crew may be sufficient to conduct these
surveys. If large geographic areas are under consideration, such as a state or large sections of coastline,
then several field crews combined with organized efforts by volunteers may be necessary.

February 13, 2003, DRAFT
5
These surveys should be conducted during the period of the year when nesting pairs are present at
their colonies in order to confirm that the sites are still active. For most species, the activities of breeding
adults will be obvious when a site is visited. For burrowing species active during daylight hours, the
regular flights of adults provide sufficient evidence that a colony is present. Nocturnal burrowing species
pose the greatest challenges, and confirming their presence normally requires visits during the nighttime
or the physical examination of burrows.
Some burrowing species are very vocal at their colonies, and their presence can be detected by
these vocalizations. Storm-petrels and other nocturnal species may require the use of tape playbacks
around mist nets to capture individuals for positive identification. In this method, mist nets are erected at
a site where the birds are thought to be nesting, usually within or very close to the habitats where their
nests are likely to be located. After dark, taped calls of the species are broadcast from tape players placed
adjacent to the nets in an attempt to lure the birds into the nets for capture and specific identification. Net
placement is a critical consideration in the success of this method, and where multiples species are
present, the nets may have to be placed in multiple habitats to effectively sample each of them. A detailed
literature search and/or consultation with experts may provide helpful information on specific capture
techniques for these species. For other species, the nocturnal playback of tapes at burrow entrances can be
used to determine the presence of nesting individuals (Burger and Lawrence 2000). Use of a
“burrowscope” (Dyer and Aldworth 1998) or similar technology may assist in establishing the presence of
nesting adults within burrows.
Identifying new colony locations requires greater efforts under most circumstances. These
surveys require visits to all sites providing potential breeding habitats for the species. Knowledge of the
breeding habitat preferences of the potential species will prove valuable to target the most likely possible
colony locations. If they are available, land use or habitat maps are invaluable for locating preferred
habitat types and reducing the amount of time searching for colonies on the ground.
The logistical support necessary to accomplish these inventories will vary with the size of the
area under consideration. Relatively small, accessible sites may be completely surveyed from the ground
or by boat in coastal areas. For large geographic areas, aerial surveys may be required; these surveys are
relatively expensive but can cover large areas quickly and are useful for detecting species that are visible
from the air. For inventories of large areas, aerial surveys may be preferred to identify sites with bird
activity patterns suggesting the existence of a colony. Ground surveys can then be concentrated at these
sites to confirm the presence of nesting birds.
Contacts with active birders and local birding clubs may also be very helpful, since these
individuals may know of new colonies or areas where bird activity patterns suggest that a colony may
exist. This information may also help to concentrate the efforts required for ground surveys.

February 13, 2003, DRAFT
6
For most species these surveys should be conducted during periods of the year when the adults
are likely to be in attendance at the colonies. An exception may be surveys for Great Blue Herons and
other wide-ranging species that build large conspicuous nests that are most visible during those months
when leaves are not present to obscure them. Surveys from the air or ground during the non-breeding
season can detect nests, and these colonies can be visited at other times to confirm the presence of
breeding adults.
For species that cannot be seen from aircraft, the discovery of new colony sites requires the
extensive use of ground surveys within potentially suitable habitats. Nocturnal burrow-nesting species are
the most difficult to inventory, because they normally occupy habitats that are difficult to access and may
require several nighttime visits in order to obtain sufficient evidence that breeding adults are present or
absent. These surveys are labor-intensive and can require considerable resources.
Most inventories employ an area-search technique to locate colonies. Knowledge of the breeding
biology and chronology of the species likely to occur in an area is combined with knowledge of habitat
availability to determine the sites that are likely to support breeding colonies. Developing an appropriate
systematic approach to habitat coverage is preferable under most circumstances. But where breeding
habitats are extensive, observations of flight lines or possibly chance sightings may help narrow the focus
on specific potential breeding areas. The use of tape playbacks has been described previously for use in
locating some burrow-nesting species. Point count methods (Ralph et al. 1993) may be helpful for
locating Marbled Murrelets and possibly other dispersed nesters that are vocal in the vicinity of their
breeding sites.
Data collected during inventories include the longitude/latitude coordinates and approximate size
of the colonies, the identity of all species that are present, and an estimate of the numbers of adults
observed for each species. Some inventories may also include actual counts of nests or burrows, using
some of the methods described in later sections of this manual, although in most cases extensive nest
counts are not undertaken during inventories.
Opportunities for Conducting Inventories:
Use of Volunteer Birding Groups – Often local birding groups have considerable knowledge of
the status and locations of breeding waterbird colonies in their area. This information is frequently useful
to help determine where the inventories should be conducted. Individuals within these groups can be
organized to survey specific areas and report on the presence or absence of colonies, the species present,
and approximate numbers of nesting pairs. This local knowledge can be very important in developing an
understanding of the locations of the colony sites within your area of interest.

February 13, 2003, DRAFT
7
In developing countries, where no birding groups exist, local fishermen often have considerable
knowledge on where birds breed and should be used as a resource.
Designing a Monitoring Program: Establishing Goals and Objectives
The key to setting up a successful population monitoring program is first determining the purpose of
your survey. Why are you interested in establishing changes in the abundance of a population? One
purpose of region-wide monitoring is to detect population declines, a signal that increased conservation
management might be needed. Another purpose of monitoring which might be, but isn’t necessarily at a
more local scale, is to detect the response of populations to management actions (e.g. habitat restoration
or predator removal). Is your main interest in the locations of colonies? If so, surveys will not need to
result in precise counts of individual birds or nests, just species presence or absence. Another important
consideration is the scale at which you are trying to determine status or trends. Are you interested in
population status within a park or refuge, or within a state or region?
The goal of a monitoring program must be more than determining whether changes in numbers are
occurring over time. A monitoring program should be designed to use survey information from year to
year to evaluate waterbird management actions and make decisions. When designing a new monitoring
program, or improving an existing program, we recommend answering the following questions before
selecting specific survey methodologies.
(1) What information exists or is known about the resources you’re interested in monitoring?
Often the first step is to collate all existing information on the resources of interest. This has
been covered under the section above (Inventory). See this section for a list of potential
resources.
(2) Are there species or populations that have priority needs? Once you’ve compiled all the
existing information on the species of interest, you must identify priority species or populations.
This will allow you to focus your efforts and use resources in the most efficient manner.
(3) At what scale do you want to detect population trends? First, you must determine the
landscape scale at which you are interested in obtaining population estimates. Will you monitor
all populations at that scale? Or, will you sample or select populations to monitor? Do you wish
to develop trend estimates for an individual colony? Do you wish to know the numbers of
breeding pairs of a particular species on all state lands? Within a watershed? Do you wish to
have an estimate of a number of species for a group of colonies at a local level (i.e., a refuge or
park), or are you developing a state/provincial or regional monitoring program? The geographic
scale and objectives of the monitoring program will greatly influence the design of your

February 13, 2003, DRAFT
8
program. Trends at individual colonies may not be very informative for some species. For
example, nomadic species such as White-faced Ibis or Least Terns nesting on sand bars within
rivers exhibit limited site fidelity and large numbers of breeding pairs frequently move from one
colony to another within and between years in response to changing habitat conditions. As a
result changes in numbers of pairs at a particular colony do not reflect population trends.
Regional surveys are more likely to provide reliable population trend estimates for these species
and others, such as Gull-billed Terns nesting in coastal habitats.
(4) What is an appropriate time scale for detecting population trends? Listed here are factors to
consider when determining timescale: (a) Many species of colonial waterbirds are long-lived,
frequently with life spans of 10-25+ years under normal circumstances; because of this, the
appropriate timescale for evaluating population change may be decades, rather than years, (b)
nevertheless, species could experience dramatic declines due to an abnormal mortality event
over a fairly short time, therefore, periodic surveys at wide intervals would likely be insufficient
to detect these events, (c) there is often a time lag between a dramatic change in a habitat and the
effect of such a change on the adult population of a species. While desired levels of precision
and ability to detect trends strongly influence the sampling effort, resource limitations will
dictate the frequency of surveys. For species with relatively short life spans, nomadic species,
and others that exhibit considerable annual variability in numbers of breeding pairs at their
colonies, annual surveys are preferred. For long-lived species with high rates of site fidelity to
their breeding colonies, surveys every 2-3 years should be sufficient under most circumstances.
(5) What magnitude of change should be estimated each year, with reasonable precision, by a
monitoring program? In general, detecting smaller rates of population change over shorter
periods of time requires greater survey effort, both in terms of frequency of surveys and
improving the accuracy and precision of the annual counts of individuals. In most circumstances,
the availability of resources dictate the levels of survey effort, and in effect, the magnitude of
change that can be detected by a monitoring program. A practical approach is to use an adaptive
management approach and focus efforts on being able to successfully estimate change in
population numbers with reasonable precision. Each year, the population is estimated and
management decisions are made, based on the estimate and degree of uncertainty. If population
numbers or indices are estimated with reasonable precision each year, over time, reasonable
trend estimates can be produced. A more traditional goal is to detect a percent change in
numbers over a specified time period. For example, the World Conservation Union uses a goal
of detecting greater than 50% change over 10 years or 3 generations to identify species at risk.

February 13, 2003, DRAFT
9
Designing a Monitoring Program – Three sources of error to consider:
Even when monitoring programs are carefully designed and data are collected using standard
methods, they will rarely be able to detect every individual of a population. There are three general
sources of potential error in the estimates of population size obtained from surveys: (1) spatial variability,
(2) temporal variability, and (3) detection probability. When designing a monitoring program, we must be
aware of these sources of error and develop protocols to reduce their affects on population estimates.
Spatial Variability
Spatial variability results from sampling animal abundance over space in an uncontrolled
environment. A number of factors contribute to this source of error. The main source of error resulting
from spatial variability is when we can’t survey every square meter of the area of interest but wish to
make an estimate of a population for the entire area. To reduce this error, statistically valid sampling
frameworks can be developed. For example, sample sites can be selected in a manner (randomly) that
permits inferences about the whole area, including those areas that were not sampled.
Suppose we don’t have the resources to survey every colony within a state so we decide to survey
only colonies visible from roadsides. This is not a randomly selected set of sample sites but is biased
towards roadsides. Trend information gained from our roadside colony surveys is limited in it’s
applicability. If we saw a decreasing number of roadside colonies over time, it would be difficult to
ascertain that colonies within state or national parks were similarly declining. Colonies next to roads
might be exposed to different risks or benefits than colonies within state or national parks. The important
point is that selecting sites in a nonrandom manner does not allow us to make inferences about the whole
population – and our goal is to design our sampling framework so that we can make inferences about the
entire area of interest from our selection of sites (sample).
There are a number of methods for randomly selecting sites. For surveys conducted over large
geographic scales where every colony cannot be visited annually, the sampling design should stratify by
habitat type and possibly other characteristics believed to influence the density of the nesting waterbirds.
By stratifying, important landscape features are incorporated into the sample design and the selection of
colonies will be more representative of the types of breeding sites across the landscape. Surveys can also
be stratified by colony size or by density of nests within large colonies. This approach may be useful if
the goal is population trend (Erwin et al. 1985). At small geographic scales, every colony can be visited
each year and these problems are avoided. Sampling a representative selection of colonies in an area
rather than attempting to survey every colony may be an efficient approach but, as indicated above, for
species that shift colony locations, broader area surveys will be necessary.

February 13, 2003, DRAFT
10
Temporal variability
The second source of potential error is temporal variability. Previous studies have demonstrated
that for many species, the numbers of individuals present in a colony will vary markedly with the stage of
the breeding cycle. Even at the same stage of nesting, counts can vary with the time of day, weather
conditions, observer, and other factors. Colony attendance patterns must be known relative to timing of
nesting events. The seasonal movements of adults must also be factored into survey designs. For terns
and some other species, failed breeders may move to another colony and initiate a second nesting attempt
during the breeding season and could be counted more than once if surveys are conducted over a long
period of time.
Many previous regional surveys of breeding colonial waterbirds have failed to control for these
factors, and temporal variability associated with the surveys has limited our ability to estimate
populations or determine trends for some species. To produce comparable data, every effort should be
made to conduct surveys at different sites during the same stage of the nesting cycle. The timing of annual
surveys should coincide with the same stage of nesting each year. The nesting cycle may be very
predictable in some habitats and geographic areas, but in others, there could be up to a several week
difference between years in the timing of nesting activities or greater. Timing of surveys is more difficult
in warmer climates, such as the Southeast region of the United States. Decisions on the timing of surveys
should be based on actual observations of nesting behavior and not solely on calendar date. This factor
complicates surveys conducted over large geographic areas, since these surveys will require greater
numbers of participants to survey the colonies within a relatively short time period.
Standardizing for time of day and weather conditions is more important for some methods,
especially flight line counts, counts of alcids in attendance at colonies, or similar approaches based on
observations of birds near the colony sites as opposed to counts of nests at colonies.) Recommendations
on the most appropriate times and weather conditions for conducting these surveys are detailed in the
description of the methods below but may frequently require knowledge of local colony attendance
patterns and faithfulness of adults to nesting areas. Avoiding adverse weather is also important an
important consideration to reduce exposure of eggs or chicks to inclement conditions if the adults are
flushed from their nests during the survey.
Detection Probability
The third source of variability is caused by differences in the probability of detecting birds that
occurs within and among species and habitats and over time (Thompson et al. 1998). Many methods use
observed counts to estimate abundance, such as aerial surveys, and assume that the numbers of
individuals detected represent a constant proportion of actual numbers present across space and time
(Thompson 2002). In other words, if the true number of Great Blue Herons at a site increased by 10%

February 13, 2003, DRAFT
11
from one survey to the next, the assumption is that the number of Great Blue Herons counted at that site
increased by 10%. Detection probability is influenced by a number of factors including, landscape,
vegetation, species color, species behavior, and observer experience.
Our ability to detect species will vary from one habitat to another and will vary based on visibility
or weather conditions. Habitat heterogeneity is evident in most landscapes, and very few species are
equally numerous in all available habitat types; if detection probabilities are not incorporated into survey
methodologies, one cannot assume that differences in counts obtained from two different habitats are due
to different population sizes in each habitat. Many species are also very adept at remaining hidden from
view. Hence, an unknown proportion of the entire population will be detected during these surveys, and
this proportion may vary from one habitat to another across a species’ range. Without measuring the
detection probability associated with an observer counting a particular species at a particular site, it is
difficult to correlate changes in numbers of individuals observed to actual changes in number of
individuals at that site. This difficulty is compounded if birds, being highly mobile, move into and out of
the sample area while counts are being conducted.
The knowledge and skills of the observers are another important factor influencing detection
probabilities. Even when training is provided before surveys are conducted, different observers may vary
significantly in their ability to estimate the sizes of large flocks, identify individuals of similar species,
and locate nests. Observer skill levels may improve (or decline) over time, and establishing detection
probabilities will distinguish between actual population changes and changes in counts resulting from
changes in skill levels. Because more than one observer will be involved in collecting data for all long-
term monitoring programs for colonial waterbirds, determining observer-specific, colony-specific, and
species-specific detection probabilities is critical for producing data that can be compared at multiple
geographic scales.
Experience with other monitoring programs, especially waterfowl surveys, indicate that if we
select sample sites using robust protocol designed to reduce bias wherever possible, standardize the
timing of the surveys during the nesting cycle, and estimate detection probabilities for each survey, our
data will have higher precision and thus enable the detection of smaller changes in abundance over space
and time.
Survey Parameter
Results of surveys of nesting colonial waterbirds have been reported using several parameters:
occupied nests, nests, numbers of breeding adults present (not distinguishing between pairs and single
birds present during the survey), and numbers of adults present (not distinguishing between breeders and
non-breeders). These parameters are not directly comparable, which greatly complicates any attempts to
develop estimates of population trends at larger geographic scales. To avoid these problems, the specific

February 13, 2003, DRAFT
12
parameter to be estimated are identified for each colonial waterbird survey. Some parameters may be
species specific, while others will be used for groups of taxa.
For most colonial waterbird species the total number of nests should be counted, especially for
studies conducted at local scales involving a small number of colonies or at all colonies hosting small
numbers of breeding pairs. For some species, such as cormorants, it is worthwhile to categorize nests into
poor-built, fair-built and well-built nests which gives an indication of the stage of breeding – useful for
interpreting results. While the total number of nests, even if counted during the peak of the season,
underestimates the total nesting effort for the year by missing early failed egg laying attempts and late
nesters, this parameter provides a more reliable estimate of the total nesting effort for the year than the
total number of adults. Counts of the total number of birds includes both breeders and non-breeders and
must be distinguished from the number of breeders. The proportion of non-breeders to breeders in
attendance at colonies varies daily, hourly, seasonally, and between years, making comparisons of these
counts problematical. However, some species, such as the cliff-nesting alcids, do not build nests and
require that all birds be counted. The most important thing is to be consistent in the unit measured over
time and space.
For many species of colonial waterbirds, such as kittiwakes and cormorants, different proportions
of the breeding population build nests each year. For these species the number of adults may be the best
indicator of population trend because it’s less likely to be confounded by productivity.
Scale of Surveys (sampling or complete colony counts)
Three factors influence the decision on whether or not to survey complete colonies - colony size
and accessibility, the resources available to conduct the surveys each year, and if the surveys can be
completed with an acceptable level (or lack thereof) of disturbance to the nesting adults. The areas
sampled must be consistent between years. The size of many colonies and sometimes the geographical
spread of colonies makes monitoring all birds impractical. In these instances, samples of a colony or
colonies within a geographic area are used to represent the entire colony or geographic area, respectively.
For large colonies were accurate or frequent complete counts are not practical, sample plots or units
selected to represent the entire colony may be twofold in objectives: (1) detection and quantification of
population change in samples which are representative of the entire colony, and (2) inference to whole
colony estimates from counts at sample plots.
Before a sampling scheme can be designed, an inventory of the total area of interest must be
conducted. As indicated above, information collected during an inventory includes colony locations and
size, and wherever possible, species composition and an approximate number of nests. This inventory
will provide the framework for choosing the sampling sites. To select sites, we recommend two methods:

February 13, 2003, DRAFT
13
(1) simple random sampling or (2) stratified random sampling. We’ve included a third method, systematic
sampling, which may useful in some instances, but do not recommend it because it leads to potential bias
in sites selected.
Simple Random Sampling:
If the area of interest is homogeneous in character, a simple random sampling approach is the
recommended approach to use to select your sample sites. Homogeneous is defined as similar in habitat,
landscape characteristics (e.g. flat, rocky,) breeding density (e.g. breeding birds are equally distributed
throughout the colony) or breeding productivity. Non random sampling is likely to bias plot selection so
that the samples do not reflect the population as a whole. For example, if your sites were selected based
on convenience, and only sites at the edge of the colony were selected, your samples might be biased
towards lower breeding densities. Simple random sampling consists of selecting a group of sample sites
in such a way that each sampling site has the same chance of being selected.
One method of selecting sites is to overlay a grid onto a map of the area of interest, number each
square in the grid, and use a table of random numbers or a random number generator to choose squares or
colonies within grid squares to survey. Ideally, all birds or breeding sites in the colony or area should
have an equal probability of being selected for inclusion in the sample plot. Safety considerations, site
access, or potential disturbance to the birds may exclude a site from being included. This compromises
strict randomness, but its effect may be negligible as long as most areas of the colony or area of interest
are including in the sample sites. If after choosing sample sites, sites are clumped, leaving portions of the
colony or area unrepresented, use a stratified random sampling design.
The figure below is taken from the Seabird Monitoring Handbook for Britain and Ireland (Walsh
et al. 1995). Its purpose is to illustrate the techniques for positioning sample plots along a seabird cliff
using a simple random sampling design. In this example, a preliminary survey has identified 50 suitable
potential plots and has divided the coastline into 10 sections, each holding similar numbers of birds.
Within each section, plots have been randomly selected using a random number generator. The drawback
to using a simple random design is that you run some risk that not all your sections will be represented.

February 13, 2003, DRAFT
14
Stratified Random Sampling: If your area is not homogeneous, it is best to use a stratified random
sampling approach. In this approach, the area of interest is first divided into groups or strata, as defined
by common variables. Colonies can be stratified according to habitat type or by the density of nests (e.g.
high, medium and low density). For example, in a coastal state, colonial waterbirds are far more likely to
be found along the coastal counties, as opposed to inland counties. You might divide the state into coastal
and interior strata, and then take simple random samples from each stratum. Within each of these strata,
or divisions, plots are randomly selected. This insures that each stratum is being represented by at least
one plot.
Stratification by colony size may also be necessary, especially in situations where there are large
numbers of small colonies and only a few large colonies for a species as may typify Great Blue Heron
colonies in inland areas.
The figure below, taken from Walsh et al. 1995, illustrates the selection of plots within sections,
using a stratified random design. Here, a preliminary survey identified 50 suitable plots and 10 strata,
based on density. Using a random number generator, one plot per stratum was randomly selected.
Systematic Sampling
Systematic sampling is another approach, where study-plots or quadrants are placed at fixed,
regular intervals throughout a colony, usually of ground-nesting or burrow-nesting species. A colony may
be divided into plots delineated by transect lines radiating from the center of the colony, or divided into
grid-squares of equal size. There are varying opinions about the ability to statistically analyze data
collected. However, systematic sampling is easier to carry out than random sampling and it can provide
information on the extent of a colony at the same time.
The figure below, taken from Walsh et al. 1995, illustrates systematic selection of plots within 10
strata. Here, the 3rd plot within every stratum is selected.

February 13, 2003, DRAFT
15
Dual Frame Sampling
One approach that may have great utility for colony surveys is the dual-frame sampling method.
This method is useful for monitoring wildlife populations with breeding individuals that return to highly
visible nesting territories over many years and reduces the bias associated with returns to known nesting
sites (Haines and Pollock 1998). Colonial waterbird monitoring programs almost always call for surveys
that revisit known colony sites each year. The dual frame method consists of two sampling frames called
the list frame and area frame. The list frame consists of sampling units with historical colony sites (e.g.
sites visited the previous year) and is incomplete. The area frame includes all the sampling units within
the area of interest and is assumed to be complete. The overlap domain contains sampling units that occur
in both the list and the area frames. Both the list and the area frames’ sampling units are selected using a
simple or stratified random sampling design, but the list frame has a higher proportion of sites sampled
(80%) than the area frame (10%). “Unduplication” then occurs by removing the overlap domain units
from the area frame. The equation is as follows:
N = total nests/colonies
NA = nonoverlap domain of area frame
NL = list frame total nests/colonies
N̂ = Estimate of total nests/colonies
LA NNN ˆˆˆ +=
( ) ( ) ( )LA NNN ˆvarˆvarˆvar += where var is the variance of N̂
For more detailed information on this methodology, see Haines and Pollock 1998.

February 13, 2003, DRAFT
16
Data Recording
It is vital to record observer, year, month, date and breeding phenology (nest courtship/building,
egg laying, incubation, hatching/chick-rearing, fledging), and detection probability for interpretation of
the counts and to allow comparisons over time and space.
Timing of Counts/Breeding Phenology
Specific recommendations are provided with each method described below. In general, the most
effective time to count nests is during the mid- to late incubation stage of nesting, recognizing that even if
counts are conducted at the peak of the nesting season, the total number of nests attempted over the entire
breeding season are is underestimated. The mid-to-late incubation stage is the most desirable because
disturbance during early incubation or nest building stages can cause nest desertion.
Disturbance
The effect of observer disturbance on the breeding success of colonial waterbirds remains a
controversial topic. Carney and Sydeman (1999) conducted a partial summary of the available literature
on the topic. Nisbet (2000) challenged some of their conclusions. While disturbance is a potential
problem at every colony, each species may react differently depending upon the source and proximity of
the disturbance and the birds’ ability to acclimate to it.
A number of factors contribute to defining acceptable levels of disturbance at a colony, including
status as a listed species of management concern, proximity of potential predators that will prey upon the
eggs or chicks if the adults leave the nests, weather conditions that will lead to the deaths of chicks or
developing embryos in relatively short periods of time, and the behavioral traits of the species. In general,
acceptable levels of disturbance should not cause the individual adults to leave nests for a period of time
that places young or eggs at risk. This time will differ for species, breeding phenology, site
characteristics, and survey date but factors to consider are weather conditions (e.g., exposing young or
eggs to heat stress or cold), and presence of predators (e.g. gulls present to take eggs). In large colonies
where only a portion of the adults will leave their nests due to the presence of observers, the surveys
should be completed within 2 hours. A review of the literature on disturbance of colonial waterbirds
should be performed prior to designing a monitoring program. Appendix C provides a short list of the
more recent literature on disturbance to waterbirds.
Data Storage
A centralized location for storing information on colonial waterbirds is key to their conservation.
Centralized databases support analyses of long-term trends of waterbirds and document population status

February 13, 2003, DRAFT
17
and shifts in distribution and habitat use; this information helps (1) document the present and future
problems facing colonial waterbirds and, (2) better defines the management actions necessary to support
their long-term conservation. The Pacific Seabird Group pioneered a database for archiving records on
Pacific seabird surveys and is housed at US Geological Survey’s Alaska Science Center. This database
will, in the near future, be accessible over the Internet.
Modeled after a database created by the Pacific Seabird Group, US Geological Survey Patuxent
Wildlife Research Center has developed a centralized colonial waterbird database as part the National
Bird Population Data Center. This database is designed to store time-series data on populations of
colonial waterbirds from monitoring surveys and will allow for trends analyses across regions, provinces,
and states. As part of the National Bird Population Data Center, this database will contribute to all-bird
conservation. This centralized database stores both raw and analyzed data and provides a convenient
vehicle for data submission and dissemination through the Internet. The database is accessible over the
Internet for both data submission and retrieval (www.mp-2.pwrc.usgs.gov/cwb) and will hopefully be
linked to the Pacific Seabird Database at the Alaska Science Center in the future. Data from seabird
monitoring programs in the Pacific should be sent to the "Pacific Seabird Monitoring Database", a
database maintained by the Pacific Seabird Group (Form attached in Appendix E).
Preparatory Work – Before you Conduct a Survey (From Bibby et al. 2000)
Before conducting a survey, two factors need to be recorded :
(1) A description of the study area should be documented. Aerial photographs can be used as a
base-map to mark locations of colonies, or a GPS can be used to record locations and then
geographic coordinates entered into a mapping program, such as ARC-VIEW.
(2) A description of the breeding colony must be provided. A colony is defined as a single
location supporting breeding birds located close enough in distance to interact socially (Gochfield
1980). For each colony, record colony name (including previous/historic names), location
(descriptive and geographic reference), land ownership, detailed description of the site, including
geology and vegetation, access instructions, including landowner name and address, GPS
coordinates delineating the boundary (if possible), history of counts, difficulties encountered
while counting, and any other notes. If the colony is expanding or shrinking in size, or is located
on unstable habitats that may shift in response to storms or other conditions (such as sand/gravel
bars in a river), then the GPS coordinates should be provided every time the colony is surveyed.
While all of this information will not fit on a field form, it is important to have a detailed
description of each site that can be linked to field sheets for that particular site.

February 13, 2003, DRAFT
18
The amount of information will depend upon the size and complexity of the colony site.
If transects are needed, their locations should be indicated (possibly accompanied by GPS
coordinates) in the colony description. If a survey requires viewing the colony from multiple sites
or through the use of multiple methods (i.e. aerial survey combined with a ground count), then
each viewing should be described including recording obvious landmarks.
Choosing a Survey Method
We have divided this portion of the manual into methods pertaining to species groups based on
nesting behavior and nesting habitats, and have listed the recommended standardized methods for each
group. More detailed protocols may need to be developed for each monitoring program using the general
concepts in the manual but gearing the specifics of the survey, appropriately.
Cliff (Ledge) Nesting Species
Northern Fulmar, Northern Gannet, Brandt’s Cormorant, Double-crested Cormorant, Great Cormorant, Red-faced
Cormorant, Pelagic Cormorant, Herring Gull, Thayer’s Gull, Iceland Gull, Black-legged Kittiwake, Red-legged
Kittiwake, Common Murre, Thick-billed Murre, Razorbill
The following protocol was designed to count Common Murres and Brandt’s Cormorants, but can
be applied to other cliff-nesting species. The protocol is from Carter et al. (1996) and Roy Lowe, USFWS
(pers. comm.).
Timing of Surveys:
Surveys should coincide with peak nest numbers, which for most cliff nesters, occurs during the
mid-incubation to early chick-rearing stage of the breeding cycle, but the dates may vary among species,
years, and locations. The timing of counts is best determined by the bird’s biology at each individual
colony (Rothery et al. 1988).
I. Aerial Photographs (either fixed-wing or helicopter)
Purpose: Obtain population estimates with acceptable precision. The goal may be to detect ≤ 20%
changes in the numbers of birds present at monitoring plots between years.
Target Population: Total number of viewable/photographable bird and nests within a colony from the
air. Using aerial photography to count birds allows a large proportion of the colonies to be surveyed. The
extent of your surveys will be dependent on available resources and safety considerations.
February 13, 2003, DRAFT
19
Survey Design:
Aerial Surveillance
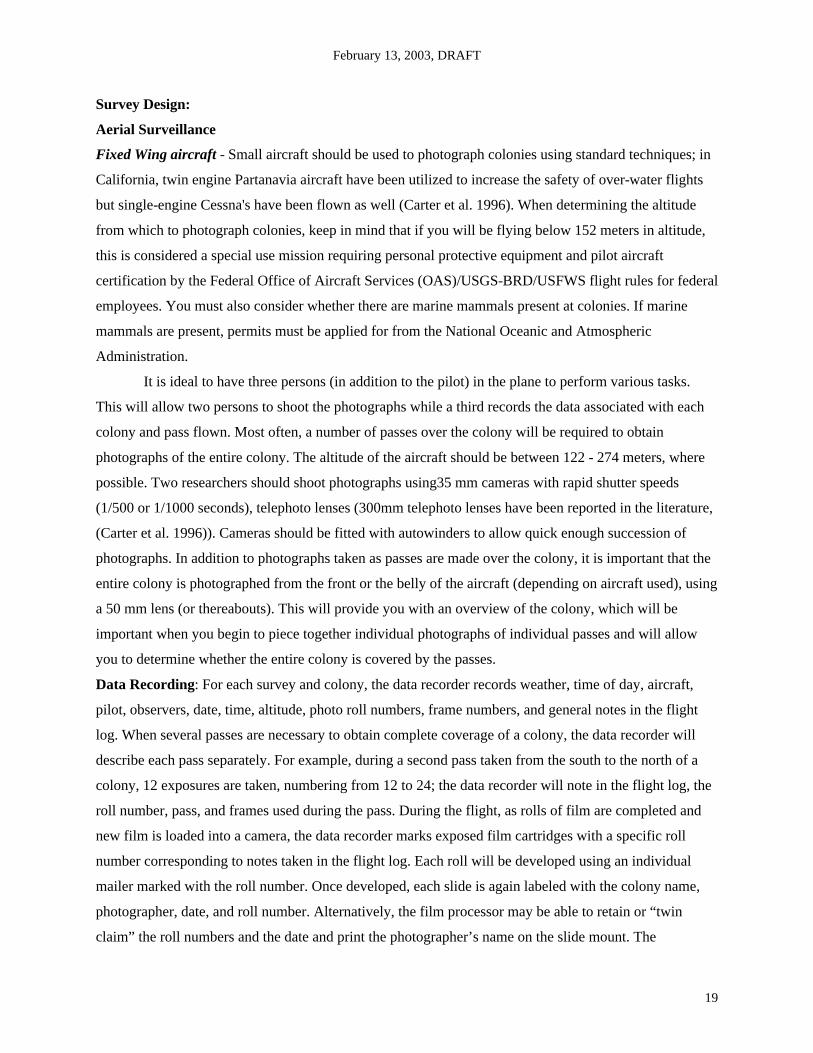
Fixed Wing aircraft - Small aircraft should be used to photograph colonies using standard techniques; in
California, twin engine Partanavia aircraft have been utilized to increase the safety of over-water flights
but single-engine Cessna's have been flown as well (Carter et al. 1996). When determining the altitude
from which to photograph colonies, keep in mind that if you will be flying below 152 meters in altitude,
this is considered a special use mission requiring personal protective equipment and pilot aircraft
certification by the Federal Office of Aircraft Services (OAS)/USGS-BRD/USFWS flight rules for federal
employees. You must also consider whether there are marine mammals present at colonies. If marine
mammals are present, permits must be applied for from the National Oceanic and Atmospheric
Administration.
It is ideal to have three persons (in addition to the pilot) in the plane to perform various tasks.
This will allow two persons to shoot the photographs while a third records the data associated with each
colony and pass flown. Most often, a number of passes over the colony will be required to obtain
photographs of the entire colony. The altitude of the aircraft should be between 122 - 274 meters, where
possible. Two researchers should shoot photographs using35 mm cameras with rapid shutter speeds
(1/500 or 1/1000 seconds), telephoto lenses (300mm telephoto lenses have been reported in the literature,
(Carter et al. 1996)). Cameras should be fitted with autowinders to allow quick enough succession of
photographs. In addition to photographs taken as passes are made over the colony, it is important that the
entire colony is photographed from the front or the belly of the aircraft (depending on aircraft used), using
a 50 mm lens (or thereabouts). This will provide you with an overview of the colony, which will be
important when you begin to piece together individual photographs of individual passes and will allow
you to determine whether the entire colony is covered by the passes.
Data Recording: For each survey and colony, the data recorder records weather, time of day, aircraft,
pilot, observers, date, time, altitude, photo roll numbers, frame numbers, and general notes in the flight
log. When several passes are necessary to obtain complete coverage of a colony, the data recorder will
describe each pass separately. For example, during a second pass taken from the south to the north of a
colony, 12 exposures are taken, numbering from 12 to 24; the data recorder will note in the flight log, the
roll number, pass, and frames used during the pass. During the flight, as rolls of film are completed and
new film is loaded into a camera, the data recorder marks exposed film cartridges with a specific roll
number corresponding to notes taken in the flight log. Each roll will be developed using an individual
mailer marked with the roll number. Once developed, each slide is again labeled with the colony name,
photographer, date, and roll number. Alternatively, the film processor may be able to retain or “twin
claim” the roll numbers and the date and print the photographer’s name on the slide mount. The

February 13, 2003, DRAFT
20
photographers then sort the slides, label them by colony and place them in polyproplyene sheets and cases
for archiving.
Helicopters – Small helicopters have been used in Oregon since 1987 to conduct aerial photographic
surveys of Common Murre and Brandt’s Cormorant colonies. Helicopters have been found to be a good
platform because of their slow speed, ability to circumnavigate individual rocks, decreasing time at each
colony, increasing platform stability in turbulence resulting in clear photographs and great visibility with
doors removed. The platform of choice is the multi-bladed Hughes 500 series helicopter. When this
platform is not available, a Bell Jet Ranger is used. To meet OAS safety requirements these single engine
helicopters must be fitted with standard fixed floats or pop-out floats for over water flights. Surveys are
flown at an altitude ranging from 244-305 meters. A pilot and two photographers constitute the crew. All
occupants of the aircraft wear Mac-10 Aviation coveralls and crash helmets and a 4-person inflatable life
raft is carried onboard. Both right doors of the aircraft are removed for the survey and photographers are
positioned in the front and back seats. Both photographers use 35mm cameras with autowinders and try to
obtain minimum shutter speeds of 1/1000 second. The front seat photographer uses a 200-400 mm zoom
lens to obtain close-up, over lapping photographs and the back seat photographer uses a 70-120 mm lens
to obtain colony overview photos. Attempt are made to take near vertical photographs as the colony is
circled.
Data Recording: Both photographers have maps of the colonies on clipboards and mark the roll (pre-
labeled) and frame numbers shot at each colony site. Time at the colony is noted on the maps and any
disturbance to birds and mammals is recorded. Film used on the survey includes 100 or 200 ASA slide
film and it is pushed one stop when light conditions are low. Film is developed by a commercial
processor. The processor retains or “twin claims” the roll numbers and the date and the photographer’s
name is printed on the slide mount. The photographers then sort the slides, label them by colony and place
them in polyproplyene sheets and cases for archiving.
Disturbance: Aircraft can disturb birds, leading to increased nesting failure or colony abandonment. Care
should be taken to note agitated behaviors. In some cases, ground observers in radio contact with aircraft
personnel might be required during initial surveys. Signs of agitation might include head bobbing (for
Common Murres only) and birds being flushed off the nests. If agitated behaviors are noted, increase the
altitude of the aircraft and note whether the behavior disappears. If agitation continues to be a problem,
surveys of that colony should be discontinued.

February 13, 2003, DRAFT
21
Counting Aerial Photographs
Slides of individual colonies are removed from archival sheets and placed on a light table. If
colony overview photographs were taken, overview photos are used to line up the close-up photographs
and insure that complete coverage of the colony has been obtained. The clearest images that represent the
entire colony are then selected for counting. Photographs are projected onto a white wall or large pieces
of white paper with acetate over them. Three projectors may be used simultaneously to make it easier to
overview the entire colony at once. Boundaries between count areas are drawn using landmarks or
individual birds or nests.
Parameter: Total number of nests and birds within a colony: Two observers intensively search the
projected images for birds and nests. One observer counts and marks individual nests or individual birds
on the acetate sheet. Once the first observer is finished, the acetate sheet is replaced by a clean sheet and a
second observer counts nests or birds. These differences are recorded and will be used to determine the
detection probability for each counter (independent double-observer approach). Each individual bird is
circled on the paper and recorded on a hand held counter. Individual nests are uniquely marked and
counted in a similar fashion. If time or resources are limited, 2 observers can count sections of the colony
at the same time, with the second observer marking nests/individuals missed by the first observer. The
observers would then switch roles, with observer number 2 conducting the primary count and observer
number 1 adding nests/individuals missed by observer number 2. This is a dependent double observer
approach to measuring detection probability. The counters then work through all of the slides insuring
that no bird or nest is double counted until the entire colony count is complete.
Each bird and nest is marked by a felt tip marker, using different colors and symbols for birds and nests
(and, in some cases, "sites" and empty nests) of all species present, including nesting and roosting birds.
Where nest material is not visible, nests may be inferred from incubation posture of attending adults. For
those species that do not build nests (such as Common Murres), you must count all birds. Often these
species nest in close proximity to one another, making it difficult to distinguish between incubation
posture and other postures or behaviors. Sometimes it is difficult to distinguish between species in a
mixed-species colony. Usually, species will nest within the same region of a colony in "species groups"
and birds counted within these regions can be assumed to be a species. However, when species cannot be
discerned in mixed colonies, these birds should be counted and identified as unidentified species.
Unidentified species are not included in colony totals but can be considered when assessing changes in
colonies over time. Note, however, a more favorable approach would be to establish several sample plots
on the ground, if logistically possible. Visits to these colonies would allow a species ratio to be
established. This ratio could then be used to assign “unidentified” nests or birds, accordingly.

February 13, 2003, DRAFT
22
Sample Size: The sample size is a complete count of all birds in all passes for a colony.
Distinguishing between species:
There are multiple factors that can be used to distinguish between species. Differences in species
behaviors, nesting phenology, nest materials and types, and known historical use of specific nesting areas
can be used to delineate between species. For example, cormorant species can be distinguished using
throat color, nesting habitats, nest materials and types, breeding phenology, and known historical use of
specific nesting areas. In California, Brandts Cormorants build nests from seaweed or other vegetation,
and Double-crested Cormorants often use large sticks. This detail may show up on quality photographs.
Often breeding phenology can be used within regions, with one species nesting earlier than another.
Advantages: One advantage of using aerial photographs is that counts over a large area can be completed
during a short period of time, allowing counts during the same or similar nesting stage. Another
advantage is that often, aerial photographs are less disruptive to the colony and result in the adults
spending less time off the nest. Finally, aerial photographs can be more economical than direct counts.
Disadvantages: The level of precision associated with aerial photographs may be less than that of direct
counts. It is difficult to distinguish between species at some sites, nests are hidden by ledges, and, as
mentioned above, it is difficult or impossible, (e.g. Common Murre) to distinguish breeders from
nonbreeders.
Measuring detection probability – To measure detection probability - As written above, two observers
should count the same units of the colony. The most preferable method is to use a sheet of clear acetate
for each observer. Each observer independently counts the numbers of nests/individuals. The counts are
compared and nests missed by each observer are recorded. Alternatively, one observer can mark
nests/individuals on a sheet of paper on the wall while the second observer marks nests/individuals
missed by the first observer. Observers switch roles for different units of the colony.
II. Counts from Land
The following protocol were developed for Murres and Kittiwakes in Alaska, but can be applied to other
cliff-nesting species. The nest is defined as any structure to which vegetation has been added that year.
Purpose: Population estimates within an acceptable level of precision. The goal is to detect ≤ 20%
changes in the numbers of birds present at monitoring plots between years.

February 13, 2003, DRAFT
23
Target Population - viewable population from land. To get at population trend indices, we don’t need
to target the whole population at breeding colonies. Instead, the “viewable” population, defined as the
portion of breeding birds that can be seen from land, is used as the target population for trend monitoring.
Assumption: The proportion viewable is constant through time.
Survey Design: For many seabird colonies, it is too expensive to conduct replicate counts of large
colonies. Therefore, index plots consistently measured over time may provide a reasonable basis for
assessing trends. An index plot is defined as a segment of cliff-nesting habitat which; (1) may be viewed
from the same location repeatedly, (2) has readily identifiable boundaries by any person conducting the
survey, and (3) contains fewer than 300 birds. It is not necessary to attempt to randomly select plots from
a colony, but, where the viewable portion of a colony allows the option, plots should be selected
systematically for thorough geographic coverage. On small colonies, it may be desirable to count the
entire viewable population, but at large colonies, as little as 10% of the viewable population might be
included in the survey. Cliff sections, viewable from above or below on a beach are good candidates for
plots. Continuous coverage is fine, but the cliffs should be subdivided to create segments supporting
fewer than 300 birds. It is ideal to have 20-30 plots per monitoring site; if you have a small number of
plots, the loss of any one plot over the course of your monitoring reduces the area of coverage
significantly. Observation points must be carefully marked to allow year-to-year repeatability of counts
from the same location. The most reliable method is to physically mark the location and record the GPS
coordinates. For boat counts, GPS coordinates should be recorded for observation points.
Parameter (unit measured): Due to variability in attendance of ledge-nesting seabirds at cliffs, the
average number of birds present during the "count" period on the index plots is the parameter of interest
for population trend monitoring. Day to day changes in counts at plots is one of the most important
sources of variation in counts. This is influenced by daily changes in attendance at plots. Components of
variation include hourly differences and daily differences within a given year, but the daily differences are
much greater than hourly differences as long as counts are conducted during the middle portion of the
day.
Sample Size: A complete count of birds or nests on all plots is one sample. Multiple counts on the same
day likely are not independent (i.e. pseudoreplicates) and should not be considered as additional samples.
It is better to count again on a different day. To attain the objective of detecting between-year differences
as small as 20%, 5-10 replicate samples on different but continuous days (provided good
weather)(complete counts of all plots) are needed. The exact number of replicates needed depends on the
variability among count days, which may vary among sites and years.
Data Collection
To minimize variability and standardize counts the following protocols should be followed:

February 13, 2003, DRAFT
24
1. Make counts during the mid-incubation to early chick-rearing stage of the reproductive cycle.
2. Make all counts between 1100 - 1800 hours ( if conditions necessitate counting outside these
periods it may be worth doing, but variability likely will increase. Note: This may change
regionally!
3. Complete 5 - 10 separate counts (replicate samples) of birds on all plots during the time period
listed above. Ideally, complete counts of all plots on a single day, however, if that is not possible,
complete one replicate within as short a period as possible, and finish it before starting a second.
An exception may be where most ( e.g. 90%) of the plots or birds have been counted, but fog
precludes finishing the replicate. In such cases missing values may be estimated, and it would be
wise to start a second replicate.
4. At each plot, record the number of birds and the number of nests. For cormorant nests, distinguish
between well-built nests (WBN), fair-built nests (FBN) and poor-built nests (PBN) (This gives an
indication of different breeding stages which are useful for interpreting results). Count birds and
nests at least twice at each visit to insure that counts are within 5% of each other (generally the
only reason for more divergent counts is observer error). Record the average of clustered counts
for each plot on each count date or dates. Gaston et al. (1983) determined that there was little
improvement to increased observation hours beyond two hours per day at a site.
5. Don’t conduct counts when winds are severe (e.g. wind speed � 22 knots), or visibility is � 400
meters.
Advantages: The advantage is that such data as these are useful in ecosystem monitoring. In fact,
monitoring for population trends in seabirds is becoming an objective of conservation biologists
concerned with marine ecosystems worldwide. Seabirds are seen as relatively inexpensive indicators of
change in this complex ecosystem. In Alaska, ledge-nesting seabirds have been identified as important
indicators. As such, trends will be used to track the response of target populations to natural and man-
caused events. These data will be used with information gathered on other components of the ecosystem

February 13, 2003, DRAFT
25
(e.g., forage fish, marine mammals, oceanography) to try to understand processes, an integral part of
ecosystem management.
Disadvantages: A disadvantage of this type of monitoring is that it is labor intensive and therefore costly.
Data Analysis and Reporting
Data Analysis: A completed data set for each year would be composed of daily counts of each plot, and
daily totals for the system of plots. These are used to estimate that fraction of the population represented
by the sample. It is important to keep track of counts for each plot in case one or more plots or
observation points are lost in the future, making it necessary to use a smaller subset for multi-year
comparisons.
Measuring Detection Probability: During the first count at each plot, one observer is designated as the
“primary” observer, who verbally describes the specific portion of the plot they are counting and the
number of individuals of each species present. At the same time, the second observer counts individuals at
the same portion of the plot, and independently records individuals that are missed by the “primary”
observer. This process is followed throughout the entire count. The observers switch roles during the
second count at each plot. By recording individuals detected by both observers and those missed by each
observer, detection probabilities can be calculated for both observers.
Burrow Nesting Species Bermuda Petrel, Manx Shearwater, Black-vented Shearwater, Fork-tailed Storm-Petrel, Leach’s Storm-Petrel, Ashy Storm-Petrel, Black Storm-Petrel, Ancient Murrelet, Cassin’s Auklet, Rhinoceros Auklet, Atlantic Puffin, Horned Puffin, Tufted Puffin [Note: Some of these species also nest in crevices (natural holes in rock piles). Crevice nesters are discussed in the next section.] Definition of burrow – A hole at least 10 cm long apparently dug by a bird (see below for size
descriptions for species).
There are a few factors, which must be considered before beginning to design your monitoring program
for burrow nesters.
(1) Timing – The timing of the surveys must be considered. Most species of burrow-nesting seabirds are
prone to abandon nests if disturbed early in incubation, but then tolerate disturbance much better after
mid-incubation. Ideally, burrows should be counted in plots as early as possible, but not until incubation
is well underway (for those species where observers will reach into nest chambers, and then rechecked
after chicks hatch). For Cassin’s Auklets and Rhinoceros Auklets in colonies with long and complex
burrows, evidence of occupancy is very difficult to find during incubation. Therefore, surveys for these
species on colonies should be conducted during mid chick-rearing stage. During the chick rearing stage
the presence of eggshell fragments, euphausiids/fish and fecal deposits at the burrow entrances are signs
of occupancy.

February 13, 2003, DRAFT
26
(2) Species Identification – Many burrow-nester colonies contain more than one species; the most diverse
containing 5-6 species. Where index plots are subjectively placed, an effort should be made to minimize
diversity, especially of species similar in size. When transects are used, multiple species often cannot be
avoided. In such cases, it will be necessary to assign burrows to species groups based partially on
entrance sizes. The following divisions are suggested:
There is considerable overlap in the size of burrow entrance widths for some species. Therefore,
in mixed species colonies other signs in combination with burrow entrance width should be used to
distinguish between the burrows of different species. For example, on at least 2 colonies in the Pacific,
storm-petrels have been found using acid burrows (Gaston and Masselink 1997). The Canadian Wildlife
Service has develop a set of criteria for distinguishing burrows of storm-petrels, Ancient Murrelets,
Cassin’s Auklets and Rhinoceros Auklets. The criteria, including presence of eggshell fragments,
feathers, fecal deposits and odor, are as follows (taken from Rodway et al. 1988):
(Cerorhinca monocerata): size of entrance; wear at the entrance; droppings in and around the burrow
entrance; regurgitated food (for Cassin's Auklet); feathers found in the burrow; eggshell fragments found
in the burrow; and odor.
Storm-petrels often nest in conjunction with Cassin's Auklets and less often with Ancient
Murrelets. The burrows of these species are easy to distinguish by their size (5-7cm wide). The musty
odor associated with storm-petrels can be an helpful burrow identifier. However, petrels have been found
nesting in old Cassin's Auklet burrows (Skedans Islands), which made identification more complicated. In
this case odor and the lack of typical Cassin's Auklet signs may be used to help identify petrel burrows.
Ancient Murrelets, Cassin's Auklets, and Rhinoceros Auklets can be found nesting in the same
areas, although the most frequent associations are Ancient Murrelets and Cassin's Auklets, or Cassin's
Auklets and Rhinoceros Auklets. Ancient Murrelet and Cassin's Auklet burrows are similar in size (10-
12cm wide), while larger burrows (12-15cm wide) generally belong to Rhinoceros Auklets. Droppings,
regurgitated food, eggshell fragments, and feathers provide more conclusive evidence for differentiating
Tunnel Width Species
< 10 cm storm-petrels
10 to 12 cm Ancient Murrelet,
Cassin's auklet
12 cm to 15 rhinoceros auklet
> 15 cm puffins

February 13, 2003, DRAFT
27
these three species. Ancient Murrelets and Rhinoceros Auklets have relatively clean burrow entrances.
Rhinoceros Auklet burrow entrances are more worn than Ancient Murrelet burrow entrances. Ancient
Murrelet droppings are yellowish-white and are usually placed away from the entrance. The droppings of
Rhinoceros Auklets are larger, generally globular, pale yellow with black, viscous blobs, and are often
deposited to one side of the burrow entrance. Cassin's Auklets leave white fecal streaking along the
approach and into the entrances of their burrows. Cassin's Auklet droppings also have a more arresting
odor, as does their regurgitated food, a small portion, which is lost at the entrance of their burrows when
delivering it. The abdominal feathers (which are often lost in the burrows) of each species can be
distinguished by the color pattern of their plumules (size is not reliable). Ancient Murrelet plumules are
half dark and half white. Cassin's Auklet plumules are mostly dark with a tip of white. The color of the
Rhinoceros Auklet plumule is uniform grayish white and is similar to that of the base of the main feather.
Eggshell fragments of Cassin's Auklets and Rhinoceros Auklets are both white and are indistinguishable
unless a major portion of the shell is present and can be identified by size. Fragments of Ancient Murrelet
eggshell are easily identified by their color, which is pale olive background with dark speckling
throughout.
(3) Occupancy – Many burrows have tunnels so long that observers cannot reach the nest chamber with
their arm, or they are curved which also may restrict access. Furthermore, it is frequently impossible to
see the nest chamber from a burrow entrance with a bright light. Typically, excavating entry ports to
tunnels will not be used for routine monitoring. Remote camera set ups are probably the best tools,
particularly for puffin and Rhinoceros Auklet burrows, to determine the contents of burrows quickly.
Indirect evidence of occupancy should be used for puffins and Rhinoceros Auklets when cameras are not
available, and Cassin’s auklets when burrows are too deep to reach the chambers with a light. Indirect
evidence of an occupied burrow would be the presence of droppings, feathers, or freshly-hatched egg
shell fragments near the burrow entrance, or a freshly dug burrow. Alternatively, a burrow-scope can be
constructed and used to determine burrow occupancy. A burrow scope is an infrared light fitted onto a
flexible fiber optic cable that can be moved down the length of a burrow to determine species and
occupancy. (Insert citation here).
(4) Placement of transects – The influence annual monitoring has on vegetation succession at colony sites
should be considered. Choosing random plots along transect lines instead of going back to the same
burrows each year will have less influence on the vegetation. Transects are lines that are of a specified
length and width within an index plot or sampling unit. Counts are conducted by walking along transects.

February 13, 2003, DRAFT
28
It is important to note that accuracy and precision are both problems for methods developed to
count burrow nesters and methods will be improved as studies are completed to determine the best
methods for counting burrow nesters. We need to better understand the relationship between the number
of burrows and the number of birds, and how much error is associated with these numbers. Recognizing
the lack of information available, the following protocols are recommended for estimating population
numbers.
I. Ground Counts (Whole Colony)
Purpose – Population estimation (entire colony).
Target Population – Number of burrow entrances in an entire colony. Burrow-nesting seabirds are
hidden from view at their nest sites and colony attendance is either highly variable among days and hours
(Tufted Puffin) or it occurs only at night (other species). As a result, it is not feasible to monitor
population trends by counting birds. Instead, the target population is the number of burrow entrances in
an entire colony.
Survey Design – It is seldom possible for observers to get to all burrows without technical climbing gear,
because burrow-nesters often use steep slopes or bluff edges. Therefore, the sampling "universe" would
usually be the portion of the colony that is accessible to observers.
Sample Unit: Strip Transect – If the objective is to estimate entire colony populations (at least the
accessible portion), strip transects are the preferred sample plot. The width of the transects would depend
upon the species involved. For example storm-petrels may occur at such high densities that 2 m wide
transects would be optimal, whereas wider transects may be appropriate for tufted puffins where burrow
densities are lower. Transects would vary in length depending upon the "depth" of the colony in a
particular spot. Transects should run across the gradient of the colony – often perpendicular to the
coastline.
Sample Size: To estimate overall population size, in relatively small colonies, select enough transects to
sample approximately 10% of the area occupied by burrow nesters. The proportion could be as low as
5% in larger colonies, but in any case at least 20 transects should be sampled.
Parameters (units measured): Two parameters are of interest: 1) The number of burrow entrances in the
colony, and 2) the proportion of burrows that are occupied. A burrow is considered occupied if an egg or
a chick is present. This statistic will vary among plots. It is essential to record the units being recorded,
such as eggs or chicks, etc.
Data Collection – Whether the objective calls for estimating the total population in the colony, the
approach is to record the number of burrow entrances in each transect or plot. For the purpose of this

February 13, 2003, DRAFT
29
procedure, a burrow entrance is defined as a hole at least 10 cm long apparently dug by a bird (no
burrowing mammals are present at most locations where burrow-nesting birds would be monitored).
For transects, a systematic sampling design should be employed and may need to be stratified. As
indicated above, 10% of the colony should be sampled. The steps are as follows:
1. Delineate the extent of the colony.
2. Select the transect width that is appropriate for each species.
3. Select the interval between transects based on the percent sample desired (e.g., select every kth
strip to sample 10% of the colony area).
4. Randomly select a start point.
5. Lay out each selected transect with a compass and tape measure.
6. Mark ends of transects with permanent stakes and using a GPS, record the geographic
reference points of the transect endpoints.
7. Count burrow entrances in each transect.
8. Record occupancy in a subsample of transects (e.g., every nth transect)
9. Record information on a standardized data reporting form.
Data Analysis – For estimating the entire colony population, systematic sampling estimators would be
used to calculate the mean density of burrows per transect. The mean and variance would be used to
estimate the total number of burrows in the colony. In a similar way, the mean occupancy rate would be
calculated. It is important to record counts for each transect to allow investigators to determine whether
any observed changes are restricted to certain portions of the colony. Inter-year comparisons would be
made by analysis of variance techniques and long-term trends would be characterized using regression.
II. Ground Counts (Index Plots)
Purpose – Population indices for detecting trends, with an ability to detect ≤ 20% change in the
numbers of birds present at colonies between years.
Target Population – Number of burrow entrances in a series of index plots. Burrow-nesting seabirds
are hidden from view at their nest sites and colony attendance is either highly variable among days and
hours (e.g. Tufted Puffin) or it occurs only at night (e.g Storm Petrels). As a result, it is not feasible to
monitor population trends by counting birds. Instead, the target population is the number of burrow
entrances in a series of index plots.
Survey Design – It is seldom possible for observers to get to all burrows on an island without technical
climbing gear, because burrow-nesters often use steep slopes or bluff edges. Therefore, the sampling
"universe" would usually be the portion of the colony that is accessible to observers.

February 13, 2003, DRAFT
30
Circular Plots: If the objective is to monitor trends, but not necessarily to estimate the overall population
size, a series of permanent circular plots would be appropriate. Circular plots are easier to mark (one
stake) and layout (a line of fixed diameter) than transects or other quadrates. Nevertheless, the
configuration of a colony (e.g., a narrow coastal strip) may lend itself better to quadrates than circular
plots in some cases. Like the transects referred to above, the diameter of the plots would be based on the
species. Plots should be stratified randomly to include areas of high, moderate and low density because
the object is to be sure that both increases and declines are noted (i.e., choosing just high density plots
could result in not seeing increases which are showing up in less saturated areas). For trend monitoring, at
least 10 plots should be monitored in small colonies, and up to 20 plots are needed in large colonies. Plots
should be photographed and mapped in such way to facilitate relocation. GPS coordinates for the center
point also should be recorded. Center stakes need to be tall enough to be seen at a distance even when
vegetation is tall and they should be of a material that will last (plastic, iron).
Important Considerations when setting up plots: Long-term population trend monitoring depends on
standardizing as much as possible. It is critical to mark plots in such a way that they can be resurveyed in
an identical manner. GPS coordinates could be used to get observers into the vicinity, but permanent
obvious plot markers are essential. For circular plots or quadrates, locations should be selected within
density strata to insure that areas with high, medium, and low density are included. Once colonies are
delineated and crude abundance codes have been assigned to general areas, plots could be randomly
selected. The steps are as follows:
1. Delineate the extent of the colony.
2. Assign density codes to different parts of the colony.
3. Select an appropriate plot size and shape.
4. Select sample size (see above).
5. Use a grid to locate plots and permanently mark.
6. Count burrow entrances and record occupancy rate in each plot.
Parameters: Two parameters are of interest: 1) The number of burrow entrances in the index plots, and
2) the proportion of burrows that are occupied in the index plots. The purpose of trend monitoring is to
detect changes in burrow-nester populations, and burrow-entrances are only an indication of all possible
nest sites. Occupancy rate must be estimated to relate burrows to birds. A burrow is considered occupied
if an egg or a chick is present. This statistic will vary among plots. It is essential to record the units being
used.

February 13, 2003, DRAFT
31
Measuring Detection Probability
The first observer would walk the transect line or completely cover the study plot, marking each nest with
an object such as a colored washer or a flag. If multiple species are present at a site, different colors
should be used for the burrows of each species. Different colors should also be used to distinguish
between occupied and unoccupied burrows. After the first observer has finished their survey, a second
observer independently marks each burrow using a different set of colored washers. After the surveys are
completed, one observer would return to the transect/plot and indicate how many burrows each observer
located, and how many were missed (or mis-classified) by each of the observers, and by both of the
observers.
Data Analyses
For index plots, the total numbers of burrows in all plots are summed to get an annual statistic. In
addition, the mean occupancy rate is calculated. Inter-year comparisons are made with non-parametric
paired sample tests. Long-term trends are characterized using regression.
Radar (TO BE ADDED)
Crevice Nesting Species
Audubon’s Shearwater, Least Storm-Petrel, White-tailed Tropicbird, Red-billed Tropicbird, Red-tailed Tropicbird,
Dovkie, Xantus’s Murrelet, Craveri’s Murrelet, Parakeet Auklet, Least Auklet, Whiskered Auklet, Crested Auklet,
Black Guillemot, Pigeon Guillemot, Leach’s Storm Petrel, Ashy Storm Petrel, Rhinoceros Auklet, Horned Puffin,
Tufted Puffin.
[Note: Census methods have been developed for Horned Puffins and will be added to the manual in the
near future]
I. Ground Counts
Purpose: Population estimates with reasonable precision - The purpose of trend monitoring is to
detect changes in crevice-nester populations, but the minimum detectable difference of 20% desired for
ledge-nesters and burrow-nesters may be more difficult to obtain for crevice-nesters due to the high
variability in colony attendance for most species. More research is needed to improve ways of
partitioning this variability before accurate predictions can be made about the minimum detectable
differences with a given sample size. Standard techniques for monitoring population trends of most
species of crevice-nesting seabirds have not yet been developed. Nevertheless, approaches have been
suggested for Pigeon Guillemots (Drent 1965, Ainley and Boekelheide 1990, Sanger and Cody 1993,
Vermeer et al. 1993) and Crested and Least Auklets (Bedard 1969, Byrd et al. 1983, Roby and Brink

February 13, 2003, DRAFT
32
1986, Piatt et al. 1990). Techniques for Crested and Least Auklets could be applied to Horned Puffins,
but no techniques are suggested here for Parakeet Auklets or Whiskered Auklets.
Target Population: Average number of birds counted at index plots during a standard period. The
target population is the average number of birds counted at index plots during a standard period (selected
based on the peak or least variable portion of the diurnal attendance pattern) on a sample of days during
the incubation and/or chick-rearing period. Crevice-nesting seabirds are hidden from view at their nest
sites, and colony attendance patterns vary among species. Some species like Pigeon Guillemots
congregate on the sea near colonies whereas other species like Least and Crested Auklets and Horned
Puffins congregate on the surface of talus slopes. These congregations provide an opportunity to count
birds, but there are a number of variables to consider in interpreting counts. For example, what proportion
of the entire population is visible to the observers, and what proportion of the visible birds are breeders
versus non-breeders?
Survey Design
Pigeon Guillemot
Survey Unit - Pigeon guillemots tend to nest in small coastal colonies allowing total colony counts; the
sample unit is a count of all birds associated with a colony or small island on a particular day.
Parameters - The main parameter of interest is the average number of birds present at a colony during the
sampling period (i.e., incubation and chick-rearing period) in a given year.
Sample Size - Counts should be made on 4-6 mornings each year. Rafts of birds on the water can be
conducted at sunrise or sunset each day until birds begin to attend colonies.
Data Collection - On at least 4-6 different mornings (between dawn and 1000 h) during the incubation
period (local knowledge needed to know timing of nesting events, but generally June to mid-July in
Alaska), count guillemots within about 100 m of shore at selected colonies. Counts should be made on
from a small boat or from land. Weather conditions must be similar. For example counts should be
conducted during similar wind conditions, swell height, and visibility. Typically, guillemots are in small
colonies. If colony locations have not previously been delineated, an initial inventory should be
conducted. If surveys are of entire island coastlines, or large expanses of mainland coastlines,
subdivisions no larger than 1 km should be delineated for the purpose of recording data.
[Note: One of the challenges with counting this species is that during incubation, both individuals of a
breeding pair may leave the egg unattended. This will result in underestimating the total number of birds.
Counts may be conducted before breeding is initiated; however, this will result in some proportion of the
count including non-breeders.]
Measuring Detection Probability - The difficulty with this method is that the individuals are active
during the survey period, and an unknown number of individuals may be below the surface of the water at

February 13, 2003, DRAFT
33
any time. However, at sunrise and sunset these birds spend more time socializing on the surface of the
water and spend little, to no time feeding. A double-observer could be used, with a “primary” and
“secondary” observer scanning the water and counting birds simultaneously. The “primary” observer
would verbally identify the locations of each individual they are counting (including birds that may be
underwater at the time of the “maximum” count). The “secondary” observer would try to locate
individuals missed by the “primary” observer, as well as birds that may be double counted by that
observer. The observer roles can be switched on alternate days. By recording numbers of individuals seen
by both observers and missed by one of the observers, detection probabilities can be estimated. This
method may require additional refinement when attempted in the field.
Data Analyses - The annual means for individual colonies can be compared using a one-way analysis of
variance test. For series of colonies on a particular island, in an island group, or along a stretch of
coastline where a number of sites are surveyed in the same years, inter-year comparisons can be made
with paired sample tests (probably the non-parametric Friedmann test for years > 3). Long-term trends
(e.g., years > 5) can be characterized using regression.
Crested and Least Auklets and Horned Puffin:
Survey Unit -These species often congregate in large colonies, and it is frequently impossible to count all
birds associated with colonies. An appropriate sample unit would be a series of 10 m x 10 m plots on
which birds are counted (during a standard period of time) on one day. The number of plots should vary
based on the size of the colony, but a normal range would be 10-20 plots. Plots should be located
randomly in 3 strata including areas of high, moderate and low density because the object is to be sure
that both increases and declines are noted (i.e., choosing just high density plots could result in not seeing
increases which are showing up in less saturated areas). This process can be facilitated by conducting an
initial day-long survey at new sites to roughly map (use of a digital camera is ideal) the extent of the area
used by birds and to locate potential sites for plots in areas with various densities. Plots and observation
points should be clearly marked to remove confusion about boundaries. Ideally, up to 5 plots could be
viewed from a single observation point. Plots also should be photographed and mapped in such way to
facilitate relocation. GPS coordinates for the center point also should be recorded. Permanent stakes
need to be used to mark plot locations. The objective is to count the number of birds present on the same
plots between years. Long-term population trend monitoring depends on standardizing as much as
possible. It is critical to mark plots in such a way that they can be resurveyed in an identical manner. GPS
coordinates could be used to get observers into the vicinity, but permanent obvious plot markers are
essential.

February 13, 2003, DRAFT
34
Parameters - Because diurnal patterns of attendance include steep peaks (Byrd et al. 1983), an index must
be used to characterize the abundance of birds using the colony. If birds viewable outside of crevices
within the colonies are counted at set intervals (e.g., 15 min) throughout a daily peak, which may last up
to 5 hours, the highest 10 counts can be averaged to provide an estimate for a particular plot on a
particular day. The mean of n daily averages can then be used to determine an annual point estimate for
each plot.
Sample Size--Counts of plots should be conducted on at least 4-6 days each year.
Data Collection - On at least 4-6 different days during the incubation period (usually mid-June to early
July in most locations in Alaska) auklets and/or horned puffins present on the surface of the plots should
be counted at 15-minute intervals (+ 3 minutes) throughout the morning/early afternoon activity peak
(varies among locations but is usually about 5 h long). The purpose of the 15-minute interval is to ensure
counts are taken with some measure of periodicity. Gulls or foxes may cause flyoffs and counts could be
delayed a few minutes to allow birds time to settle down again.
Measuring Detection Probability – It will be difficult to measure detection probability.
Data Analyses - The index values (e.g., average of top 10 counts on each count day) for each plot are
arranged in a repeated measures design for inter-year comparisons (as for guillemots above). Paired
sample tests are used to test for differences. Plot counts are combined in some manner (e.g., index values
are summed over all plots for each year) to use regression methods to test for long-term trends.
Tree and Shrub Nesting Species
Red-footed Booby, Brown Pelican, Neotropic Cormorant, Double-crested Cormorant, Great Cormorant, Anhinga,
Magnificent Frigatebird, Rufescent Tiger-heron, Bare-throated Tiger-heron, Great Blue Heron, Cocoi Heron, Great
Egret, Snowy Egret, Little Blue Heron, Tricolored Heron, Reddish Egret, Cattle Egret, Green Heron, Striated Heron,
Agami Heron, Capped Heron, Black-crowned Night Heron, Yellow-crowned Night Heron, Boat-billed Heron,
White Ibis, Glossy Ibis, White-faced Ibis, Roseate Spoonbill, American Wood Stork, Snail Kite, Bonaparte’s Gull,
Mew Gull, Brown Noddy, Marbled Murrelet
COLONIES IN TREES AND LARGE SHRUBS
I. Ground Surveys
Counts conducted from the ground tend to provide the most reliable estimates of numbers of breeding
individuals. The preferred method is to conduct strip transects through the colony, a method that also
readily allows for a determination of the precision associated with the counts. This method is not
appropriate under all circumstances, however. Strip transects may create an unacceptable level of

February 13, 2003, DRAFT
35
disturbance to the nesting birds in some colonies, because the presence of people within the colony for a
long period of time may produce excessive predation or abandonment of the nests. When disturbance to
the nesting birds must be minimized, a nest count during the non-breeding season provides an alternative
approach for estimating population size for single-species colonies or mixed colonies where the nests of
each species can be readily identified. For mixed colonies supporting species whose nests cannot be
readily identified after the birds have left the colony, a perimeter count during the breeding season
combined with a nest count during the non-breeding season is the preferred approach for establishing
population size. For colony sites with dense vegetation that hides most nests from the perimeter and are
impenetrable on the ground, such as those located on small mangrove islands, flight-line counts provide
the only method for developing an index to population size. Flight-line counts only provide an index to
population size and are not directly comparable to the estimates of total population size derived from the
other methods, so their use should be avoided under most circumstances. Aerial surveys should be
strongly considered as an alternative to flight-line counts for these colonies if they are composed of light-
colored species.
Purpose: Population estimation with precision. An ability to detect ≤ 20% changes in the numbers of
birds within colonies, along transects, or visible from the perimeter between years.
Target Population: The breeding population of each species present in the colony.
Timing of Counts: Within the geographic area or interest, counts should be conducted during the same
stage of the breeding cycle. For example, if you are counting White Ibis in the Great Basin, it is best to
conduct your surveys during the incubation period. During incubation, it is assumed that one of the
parents will remain at the nest (Earnst et al. 1998). During the chick-rearing period, both parents may be
away from or at the nest and making it difficult to determine the number of breeding pairs. The nesting
stage during which to conduct counts should be determined based on the nesting habitat and the species.
Parameter: The number of active nests for each species present in the colony.
Survey Design:
Strip Transects - When considering strip transects of colonies, the first decision is whether to attempt
counting every nest within the colony or to sample only a portion of the colony and extrapolate from this
sample to an estimate of the total population. Under most circumstances, complete counts should be
conducted in colonies totaling 100 or fewer pairs. Complete counts can be conducted for colonies in the
range of 100-500 nests, assuming that sufficient personnel are available to conduct the survey with
relatively minimal disturbance to the birds, preferably spending less than one hour in the colony and
disturbing birds from individual nests for less than 10 minutes. However, sampling may also be

February 13, 2003, DRAFT
36
conducted in colonies of this size. For colonies in the range of 500-1,000 nests, complete counts should
be conducted only when available personnel can complete the census within one hour; otherwise, the
colony should be sampled. Sampling is the preferred approach for most colonies in excess of 1,000 nests.
Strip Transects/Complete nest counts - The objective of these surveys is to accurately count every
nest in the colony without double-counting individual nests. Simply walking a single unmarked
transect and counting every nest may be an appropriate method for many small colonies composed of
50 or fewer pairs. Such simple survey methods may also be employed for larger colonies under
exceptional circumstances, such as colonies located along narrow riparian corridors. But if all nests
are not visible from a single transect, then the more complicated process of marked transect lines
must be used.
Complete nest counts necessitate that transects are established at intervals allowing every nest to
be viewed from one line and no double counting to occur. The transect lines should be created during
the non-breeding season to minimize disturbance to the nesting birds, preferably in late summer or
early autumn when the nest visibility is similar to the conditions during the breeding season.
Transects established during winter may prove to be inadequate when the habitats are fully
vegetated. These transects should be marked with plastic flagging or some other fairly permanent
marker at intervals that will easily allow the surveyor to follow each line through the habitat. The
same transects should be used annually, although new lines may have to be established as colony
size increases or shifts location, or if the vegetation density changes over time. The outer-most
transect lines should always be located beyond the current perimeter of the colony.
Transect width will vary with the density of the vegetation; transects may be only 2-5 m wide
in dense habitats, but widths of 30-60+ m are possible in open woodlands. Transect width can vary
within a colony, especially when the vegetation density is heterogeneous, and should be dictated by
the observer’s ability to see the next transect line in order to accurately determine the boundaries of
the strip being surveyed. Transect length is dictated by colony size, and should always provide a
complete cross-section of the colony. Transect length may expand or contract to reflect changes in
colony size.
Whether an observer chooses to count nests within both strips bordering a transect line or only
one of the strips will depend upon factors such as the vegetation height and density, nest density,
species composition, and the need to minimize disturbance to the nesting birds. When multiple
observers are conducting the survey, the decision on how to count along each transect line should be
made before entering the colony. For nests located in trees or shrubs that extend over the transect
boundary, the nests should be counted only when the base of the supporting tree/shrub is located
within the strip, regardless of the actual position of the nest.

February 13, 2003, DRAFT
37
Strip Transects/Sample Sites - These procedures require knowledge of the size of the entire
colony in order to develop an appropriate sampling scheme. This information can be obtained from
aerial photographs or from the ground, and should be updated each time the colony is surveyed.
Standard colonial waterbird surveys use either 20% or 40% coverage as the basis for extrapolating
the entire colony size; 40% is preferred under most circumstances, because this coverage will
normally produce more accurate estimates of total population size. In extremely large colonies or
habitats that are very difficult to traverse, then 20% coverage is adequate.
Transects used to achieve a 40% sample of a colony should be chosen systematically from the
entire set of possible transects. As long as the colony size and location remains constant, the same
transects can be surveyed for more than one year. However, the random selection process should be
repeated whenever the colony size and distribution of nests changes. For multi-species colonies that
are partially or entirely segregated by species, a random sample approach stratified by species
distribution should be used to ensure that all species are adequately surveyed (i.e. each species
receives 40% coverage). Establishing transects, determining transect width, and conducting the
surveys should follow the methods described in the Complete Nest Counts section.
Measuring Detection Probability – The first observer walks the transect line using plastic tape to mark
every shrub/tree that supports an active nest. Each shrub/tree is individually identified by the tape and the
number of nests for each species is counted. Once the first observer is finished, a second observer
independently repeats this process. After the second observer is finished, the transect is revisited and the
number of shrubs/trees found by both observers and/or missed by one or both are recorded.
For large colonies, this process does not have to be followed for every transect. Depending upon
the number of nests detected along each transect, following this procedure for 5-10 transects should be
sufficient to establish detection probabilities. For small colonies (<5 transects), this procedure should be
followed for every transect.
Nest counts during the non-breeding season - (May be useful for Double-crested Cormorants in the
Great Lakes region and Great Blue Herons in the Northeast)
Nest counts conducted during the non-breeding season are more problematical to accurately
translate into numbers of breeding pairs, because it is impossible to positively establish whether a nest
was actually used during the previous nesting season. These surveys can only count the total number of
nests, and assume that the changes in these counts reflect actual changes in numbers of breeding pairs.
In Florida, colonies may be continuously used for most months of the year. The composition of
the breeding populations will vary seasonally, so that species breeding in late spring and summer may not
be the same as those breeding in late winter. A single nest may be used by two or more species during the

February 13, 2003, DRAFT
38
course of a single year. These colonies will have to be surveyed on multiple dates during the breeding
season in order to accurately assess the changing composition of the breeding communities, and nest
counts during the non-breeding season should not be attempted.
Nest surveys during the non-breeding season should follow the methods described in the
Complete Nest Counts section. Since disturbance to birds is normally not a factor, these surveys should
attempt to count every nest when possible. All nests located in bushes and trees should be counted, even
those that may not be habitable by birds in the future. Nests that have fallen to the ground should also be
counted, and then broken up to avoid counting them again in future years.
Multi-species colonies pose additional challenges, since nests will have to be identified by species
when they are counted. In some colonies, nest identification is straightforward because each species’ nests
are readily segregated by height, size, and type of supporting vegetation. In a Great Blue Heron/Black-
crowned Night-Heron colony, for example, the Great Blue Heron nests are located near the canopies of
tall trees while the Night-Herons are found much lower in the understory, and nest identification is fairly
easy. In many mixed colonies, however, it will not be possible to identify every nest to species. Nests of
large herons can be distinguished from the smaller species, and nest placement and structure may
distinguish some of the smaller species. But Little Blue Herons, Snowy Egrets, and Cattle Egrets build
similar nests in similar locations, and positively identifying them will not be possible under most
circumstances during the non-breeding season. For colonies where all nests cannot be positively identified
during the non-breeding season, surveys must also be conducted during the breeding season to accurately
establish the number of breeding pairs for each species.
Measuring Detection Probability - Same as method described above.
Perimeter Counts – Perimeter counts can be conducted by boat or by locating fixed points around the
perimeter of a colony and conducting counts from these pre-determined stations. Several potential
problems complicate the use of perimeter counts. Under most circumstances, some nests within a colony
will not be visible during perimeter counts. The proportion of undetected nests will vary from colony to
colony depending upon vegetation structure and density, nest location, and other factors, so that
developing a correction factor to compensate for these undetected nests has to be done on a colony by
colony basis. Normally, a complete nest count (using transects or aerial photographs when appropriate) is
performed in addition to the perimeter count, and provides the basis for establishing the proportion of
nests that are undetected from the perimeter. Another problem is that some nests may be counted from
more than one location along the perimeter. In many instances, determining whether or not a nest has
been previously counted is not possible, so that double-counting is a potential source of error in these

February 13, 2003, DRAFT
39
estimates of population size. For these reasons, use of perimeter counts is recommended for colonies
when accurate nest counts are possible only during the non-breeding season and the nests of some species
cannot be distinguished during these surveys. Perimeter counts provide an index to the size of the
breeding populations for each species that can then be combined with the nest counts to provide a more
reasonable estimate of total population size. Perimeter counts are also recommended for small colonies
(<50) nests of Great Blue Herons or other species that build conspicuous nests and return to the colonies
before the nests are concealed by vegetation, especially in areas where access to the colony is difficult.
The number and location of survey points will vary from colony to colony depending upon
vegetation structure and density, colony size and shape, types of species breeding in the colony, and
possibly other factors. The points should be located at sufficient intervals around the colony to allow for
counting the maximum number of nests while minimizing the risk of double-counting nests.
Initially, the survey locations should be established during the non-breeding season when nests
are most visible. The points should be located from positions that allow birds to be counted without
disturbing them from the colony. These points should also provide views of unique “landmarks” within a
colony that can be used to establish which nests to count from each point. The number of nests visible
from each point should be counted. The total number of nests visible from the perimeter can then be
compared with a nest count from within the colony taken at the same time to determine the proportion of
nests that are visible from outside of the colony. Enough points should be established to count at least 50
percent of the nests within the colony, and coverage of 75 percent or greater is preferable. The survey
points should be marked and used during each survey, except when there are changes in colony size, nest
location, and/or vegetation structure which may require periodic adjustments in the locations of the
perimeter survey locations in order to count a comparable proportion of the breeding population of each
species present in the colony.
Measuring Detection Probability
A “primary” observer would verbally count the nests for each species that are visible from each
survey point. The “secondary” observer would independently conduct counts and record nests that were
missed by the primary observer. For large colonies where there are many survey points, the observers can
trade roles between points in order to obtain detection probabilities for each observer.
Flight-Line Counts – This method would be used only for colonies that cannot be surveyed from the
ground, have a large proportion of the nests that are not visible from the perimeter, and the colony
supports populations of dark-colored species that would be poorly sampled by aerial surveys. This
method can also be used if disturbance to the colony by other methods is significant and must be avoided.

February 13, 2003, DRAFT
40
Flight-line counts provide an index of population size at a colony, but tend to under-estimate the numbers
of breeding adults at a colony. Many factors influence the relationship between this index and the actual
number of breeding pairs that are present, including the stage of the nesting cycle, species-specific
patterns in feeding rates, time of day, and tidal stage. The importance of these factors normally varies
from colony to colony. Hence, standardization may allow for comparison of totals between years at a
colony but does not permit comparisons among colonies.
Survey locations for flight-line counts are established at a position that allows for unobstructed
views of birds flying between the colony and their foraging habitats. A single observer or multiple
observers may conduct these counts if birds are returning to the colony from all directions. The flight
directions are generally non-random, and if a single observer is conducting the count, the location should
be selected to detect the greatest number of birds entering or leaving the colony. Multiple observers
should establish points at sites that will not duplicate counts of individual birds. Reference points in two
different directions should be identified from each survey point, and only birds crossing the line between
the observer and these reference points should be counted. Individual birds flying to and from the colony
should be counted separately. Counts are conducted for 3 hours, preferably during the incubation stage of
nesting to reduce the variability associated with repeated visits to feed a brood of hungry young. If tidal
feeding is important, then these counts should be made at low or ebbing tides. These counts should be
conducted during the morning hours (0800-1200) in most areas.
Parameter The number of adults observed flying to/from the colony is used as an index to the overall
population size.
Advantages -This method provides an index to abundance at sites that cannot be sampled by other
methods.
Disadvantages -The relationship between the number of birds counted during these surveys and the total
number present in the colony is unknown, and may vary from colony to colony. Timing of these surveys
is critical for obtaining reasonable counts, and must be based on the local biology and patterns of
movements for the species. All birds are assumed to be breeders, but the proportion of non-breeders in the
population is unknown.
Measuring Detection Probability - The “primary” observer would verbally identify and count all
individuals as they fly to/from the colony. The “secondary” observer would try to find individuals/flocks
that are missed by the “primary” observer, as well as check the identification and counts of birds reported
by the primary observer. Since these counts are frequently taken over a several hour period, the observers

February 13, 2003, DRAFT
41
should change roles half-way through the survey period in order to obtain detection probabilities for both
observers.
II. Aerial Surveys
Purpose: To estimate population numbers and to determine population trends at ≤ 20% between years
(For colonies with <100 nests). At larger colonies, the ability to detect population trends may vary from
site to site depending upon the species composition, numbers of individuals present, and the visibility of
the colony from the air.
Advantages: While ground surveys may provide the most accurate counts of nesting adults, these
techniques may be uneconomical for large-scale monitoring programs, logistic constraints may prevent
access to some colonies or restrict the number of colonies that may be surveyed during a single breeding
season, and are somewhat disruptive of the breeding birds since they frequently require entering the
colony. Since a number of colonies can be visited during a single flight, the cost-effectiveness of these
surveys can be fairly high despite the relatively high cost of using aircraft. For these reasons, aircraft have
been regularly used to survey colonial waterbird colonies.
Disadvantages: Some species are poorly detected by aerial surveys, especially dark-colored species and
those that nest under the canopy or within the vegetation. Visibility of all individuals may be an issue in
some habitats, primarily where the vegetation is relatively dense. Because of these visibility problems,
ground counts must be periodically conducted concurrently with the aerial surveys in order to document
the proportion of individuals that are missed from the air.
Parameter: Number of nesting pairs in a colony
Survey Design: The main problem with aerial surveys is unequal visibility of species from the air. White
birds tend to be very visible since they are normally viewed against a dark background. Dark-colored
birds are frequently significantly under-counted by these surveys. Vegetation density is another factor
influencing the visibility of birds on aerial surveys, especially species that nest under the tree canopy.
For these reasons, aerial surveys provide biased estimates of population sizes for many species.
To correct for the species that are under-counted by aerial surveys, they should be supplemented by
counts conducted on the ground. These ground counts should be made very close to the date of the aerial
surveys, and use an appropriate ground survey method described above. Totals obtained from the ground
surveys can then be used to develop appropriate visibility correction factors for species that are under-
sampled by the aerial surveys, so that appropriate adjustments can be made during years when only aerial
surveys can be conducted at a colony.

February 13, 2003, DRAFT
42
Both fixed-wing aircraft and helicopters have been used for aerial surveys. Disturbance from both
types of aircraft tend to be minor and of short duration. A study comparing the levels of disturbance
associated with each type of aircraft indicated that helicopters caused the same or less disturbance than
fixed-wing aircraft for most of the species (Kushlan 1979). Because of their slower speeds and better
visibility from inside the aircraft, helicopters tend to provide more accurate counts for most species.
These surveys will normally consist of two passes over a colony, one at an altitude of 100-200 m
above the colony and a second pass at 60-80 m altitude. At least ten minutes should separate the two
passes. During both passes, the aircraft should circle the colony three to five times during a 2-3 minute
period until a satisfactory count has been completed. A single pass may be sufficient under some
circumstances, such as for nest counts during the non-breeding season.
Observer variability is one of the main sources of imprecision in aerial surveys. Estimating large
concentrations of birds is always difficult and observers conducting aerial surveys should receive training
in estimation before conducting the surveys. Detecting and identifying species from the air also requires
some training prior to the surveys. Because of the issues associated with observer variability, the use of
methods to determine detection probabilities for each observer is essential for all aerial surveys.
Aerial surveys are not likely to produce precise estimates in most circumstances because of the
problems with unequal visibility from the air. A possible exception would be for colonies composed of
large white species (Great Egrets, Wood Storks) that have widely spaced nests in the tree canopy. Any
attempt at an aerial photographic survey should be combined with ground counts to determine the
precision of the aerial population estimates.
Measuring Detectability - A double observer approach similar to those used in waterfowl surveys would
provide estimates of detection probabilities for these surveys. One observer would be the “primary”
observer, verbally identifying and counting all of the birds that they see. The “secondary” observer would
note all birds that were missed by the “primary” observer. The observers can switch their roles between
colonies, in order to obtain detection probability estimates for both observers. Both observers will need
training in the estimation of flock size, and should be tested to ensure that their abilities are comparable.
Marbled Murrelet
A number of techniques have been established for estimating Marbled Murrelet
population status and trends. The Marbled Murrelet Effectiveness Monitoring Plan for the
Northwest Forest Plan (1999) suggests the use of at-sea survey methods for estimating population
status and trends. Marbled Murrelets are easiest to detect at sea and occur in the highest numbers
within one mile of the shoreline. Surveys can be conducted by boat or air and there is opportunity

February 13, 2003, DRAFT
43
to collect some demographic information, as juvenile plumages are discernable from adults. At
sea counts allow estimates of total population size or density and estimates of productivity as
measured by the ratio of juvenile birds to after hatch-year birds. Becker (1997) recommends
focusing on detecting trends in densities rather than population size.
The Marbled Murrelet Effectiveness Monitoring Plan for the Northwest Forest Plan
(1999) calls for standardizing marine survey protocol after completing studies to resolve the key
logistical and statistical problems facing marine surveyors. Until standardized protocols are
developed for specific at-sea survey techniques, generalized pelagic surveys can be conducted
(see Appendix A).
Radar has also been shown to be an effective tool to monitor Marbled Murrelets. In
British Columbia, high frequency radar has been used as an effective tool to assess populations of
Marbled Murrelets since the early 1990s (Cooper et al. 1991) and has been suggested as the only
reliable method for counting murrelets in watersheds. Radar allows murrelets to be counted as
they are entering large landscape units. Standard protocols have been developed (Burger 2001)
and are listed in Appendix A.
Ground Nesting Species Laysan Albatross, Black-footed Albatross, Masked Booby, Blue-footed Booby, Brown Booby, American White Pelican, Brown Pelican, Double-crested Cormorant, Glossy Ibis, White-faced Ibis, Greater Flamingo, American Oystercatcher, Pomarine Jaeger, Parasitic Jaeger, Long-tailed Jaeger, Laughing Gull, Black-headed Gull, Heerman’s Gull, Mew Gull, Ring-billed Gull, California Gull, Herring Gull, Western Gull, Glaucous Gull, Great Black-backed Gull, Sabine’s Gull, Ross’s Gull, Ivory Gull, Gull-billed Tern, Caspian Tern, Royal Tern, Elegant Tern, Sandwich Tern, Roseate Tern, Common Tern, Arctic Tern, Forster’s Tern, Least Tern, Aleutian Tern, Bridled Tern, Sooty Tern, Glaucous-winged Gull [Note: Aerial photography has been successfully used for some ground nesting gulls and terns. This section discusses ground counts. For information on using aerial photographs, please see section on cliff-nesting species] Purpose: To estimate population numbers with reasonable precision and detect changes in numbers ≤
20% between years.
Target Population: Number of occupied nests within the area of interest.
Ground-nesting Gulls, Terns
Selection of the survey technique should be based on colony accessibility and nest visibility. The
preferred method is a direct nest (ground) count, which is possible only for accessible colonies where all
nests can be readily observed. Where nests are located in dense vegetation and are difficult to locate, or in
very large colonies where a total nest count is not feasible, a sampling procedure is recommended for the

February 13, 2003, DRAFT
44
nest counts. Counts of adults or total individuals should be avoided unless no other options exist, since
these counts include both breeding and non-breeding individuals. The proportion of non-breeders to
breeders may vary hourly, daily, seasonally, and between years, so that comparisons of these counts is
problematical under most circumstances. Additionally, counts of flying birds tend to be inaccurate and do
not allow for the determination of detection probabilities.
Protocols for Gulls - Surveyors should count or develop an estimate of the number of occupied nest sites
at each colony. Defining an occupied nest site varies from species to species, depending upon the
complexity of the nest that is normally constructed. For some species, it may be necessary to distinguish
between the more elaborate nests built by breeding adults from the less well-built structures constructed
by non-breeding individuals. For all species, an occupied nest site should be more than a simple scrape,
but should include a defined built-up edge. The presence of fecal matter may be helpful to distinguish
between occupied nests and sites that were abandoned prior to incubation.
Nest counts should be conducted during the mid- to late incubation period for gulls. Most nesting
pairs should be present at this time, except possibly some adults that failed early during the incubation
period and did not attempt to re-nest. These counts should be made between 0900 and 1600 since colony
attendance is most stable during these hours making it easier to find nests. Heavy rain, fog, and high
winds should be avoided (wind speed � 22 knots or visibility is � 400 meters).
Caution should also be exercised on very hot days, since lengthy exposure to direct sunlight and
high temperatures may kill the developing embryos. Under these conditions, the adults should be kept off
their eggs for only the minimum amount of time needed to count nests, ideally for 20 minutes or less, and
the surveys should be conducted during the relatively cooler morning hours. This time period may be
extended in large colonies if the disturbance is local and birds in adjacent areas remain on their nests.
However, small newly established colonies tend to be very prone to desertion after disturbance and great
caution should be exercised when surveying these colonies.
Protocols for Terns - For terns, an occupied nest site is usually defined as adults that are sitting tight and
apparently incubating eggs or brooding chicks. Most colonies of breeding terns are very difficult to count

February 13, 2003, DRAFT
45
with an acceptable degree of precision. In addition to the problems associated with counting large
numbers of birds, the numbers of terns at colonies vary throughout the breeding season. Unsuccessful
pairs may shift to another colony for a second nesting attempt, hence, numbers may decrease at
unsuccessful colonies during the season and increase at sites where success rates are relatively high. In
bad years, some colonies might be suddenly abandoned and large numbers of birds may not attempt to
breed. A complete count of every pair that attempts to breed at a colony will not be possible under most
circumstances, and the number of nesting pairs counted during a single survey will probably under-
represent the total population for a breeding season.
Some species of terns have a fairly well defined peak of egg laying early in the breeding season,
followed by one or more smaller peaks. Renesting attempts and young birds nesting for the first time
account for the latter peaks. For these species, surveys should be conducted shortly after the main peak of
laying so that the most synchronized group of breeding terns are counted.
Other species of terns may have a fairly prolonged laying peak, or may not have any clearly
defined laying peak. For these species, the surveys should be conducted during the middle of the main
egg laying period, noting the stage of the breeding phenology that exists on the survey date. Future
surveys of these sites should be timed to coincide with a similar stage of the breeding phenology so that
nest counts are comparable from year to year.
Complete Nest Counts. If good vantage points are available, all nests are readily visible, and the colony
contains fewer than approximately 200 pairs, then complete nest counts can be made from the perimeter.
One or more survey points should be established as needed to count all nests within the colony, but
necessary caution should be used to avoid double counting of nests. If more than one survey point is
needed, then clear landmarks should be used to define the nests that are counted from each point. The
same survey points should be used in subsequent surveys, unless the colony location shifts or its visibility
changes and new points are needed to obtain a complete count of nests.

February 13, 2003, DRAFT
46
If perimeter counts are not suitable for counting every nest, then a systematic ground survey
should be conducted. These surveys are possible only at accessible sites. The entire colony is surveyed
and each nest marked with spray paint or by some other means to avoid omission or double counts.
The decision to conduct systematic ground surveys or to use a sampling method will depend upon
the colony size, accessibility of the colony site, ability to find nests within the vegetation, and the number
of people available to conduct the survey without causing unacceptable levels of disturbance to the
nesting birds. Under most circumstances, systematic surveys should be attempted for colonies with fewer
than approximately 200-300 pairs. If accessibility is not an issue and sufficient personnel are available to
conduct the surveys, then colonies of 500-1,000+ pairs can be surveyed by these methods.
Parameter: Total number of nests within the colony
Sampling colonies. For large colonies, generally those in excess of 1,000 pairs, and for colonies where
the nests are hidden in vegetation and more difficult to locate, complete nest counts are not feasible
without causing unacceptable levels of disturbance to the nesting birds. In these situations, a sampling
methodology should be used to develop an estimate of the population size. The sampling procedures
require developing nest density estimates in a portion of the colony, and using these densities to
extrapolate to the total number of nesting pairs at the site.
In order to develop these estimates, the total area occupied by the colony must be established. For
colonies of relatively conspicuous species in open habitats, aerial photographs may be adequate for
establishing colony size. For less conspicuous species or where the nests are hidden by vegetation, the
colony location will have to be mapped on the ground. This process should be repeated every time the
colony is surveyed to develop more reasonable estimates of population change over time.
The number of sampling units (transects or quadrats) will depend upon the colony size, relative
ease of locating nests, and the availability of personnel to conduct the survey. Ideally, 20% to 40% of the
total colony area should be sampled to develop an estimate of population size, assuming that sufficient
personnel are present to conduct the survey without causing unacceptable levels of disturbance to the
nesting birds. A minimum of 10% coverage should be achieved under most circumstances, except for

February 13, 2003, DRAFT
47
huge colonies (tens of thousands of nesting pairs over a large area) or sites where the nests are very
difficult to locate and only a small number of units can be adequately sampled within the appropriate
period of time. In these situations, only 5% coverage may be realistic.
For colonies that are rapidly increasing or decreasing in size, or that frequently move between
years, permanent sampling locations are not practical; the selection of sampling locations will have to be
made before each survey. Where colony sites are stable between years, permanent sampling locations can
be used. Since between-year population changes are more likely to be reflected by changing densities at
the periphery of the colony rather than at the preferred nesting sites within the center of the colony,
stratifying sampling sites by their location within the colony may be important for more accurately
detecting population changes.
The accuracy of the population estimates will reflect the proportion of the colony sampled by
these methods. As the area sampled increases, these estimates will generally become more accurate. A
consistent level of coverage between years is helpful to produce comparable estimates of population sizes
over time. The need to achieve consistent levels of coverage, and the personnel needed to reach these
levels, should be factored into the choice of an appropriate amount of coverage for each colony when they
are initially surveyed.
Parameter: Total number of occupied nests per colony.
Transects. Transects are normally preferred in fairly open and uniform habitats where the nests are
relatively visible. If the vegetation is relatively dense and nests are not easily found, the quadrat method
(see below) would be preferred under most circumstances. If habitats are heterogeneous at a colony, then
both methods may be employed.
Once a colony has been mapped, transects need to be defined in order to obtain a representative
sample of the population. Transects should be placed at 5m intervals. If possible, they should be
permanently marked at both ends of the line and possibly at regular intervals if they are extremely long.
Marking the lines with colored string may facilitate following the transects through the colony. The subset
of transects chosen for the survey should be randomly selected from all possible transects crossing the
February 13, 2003, DRAFT
48
colony. As the colony size varies over the years, the number of transects that are sampled should be
correspondingly adjusted to maintain a consistent level of coverage. The number of occupied nests sites
within 1m on either side of each transect are counted and marked to avoid double counting. Once the area
of the colony and transects are known, then the number of breeding pairs can be estimated.
Quadrats. Choice of quadrat size will reflect the nest density and vegetation density at the colony. The
standard size is 10m x 10m, but a 20m x 20m may be employed where large species (e.g. Great Black-
backed Gulls) are prevalent or the nests are widely spaced. Smaller quadrats may be used where nests are
tightly packed or where the vegetation is fairly dense and the nests are located with some degree of
difficulty.
Quadrat location should be selected at random, although stratification by sub-areas within the
colony may be necessary to ensure that the sites are representative of the entire colony. These locations
can be points placed at equal distances along randomly selected transect lines, or they can be sites
randomly chosen within the colony to include both nests along the periphery and preferred sites in the
center.
Measuring Detection Probability
For the complete nest count, transect, and quadrat methods, a double observer approach can be used to
determine detection probabilities. For all methods, a single observer would conduct the survey method
and mark the nests using a colored washer or some other inconspicuous object. Once this count was
completed, a second observer would independently conduct the same survey and mark each nest with a
different object. At the completion of the second survey, a third observer would record how many nests
were found by both individuals and the number found by only one observer.
For the transect and quadrat methods, detection probabilities do not necessarily have to be calculated for
each plot or transect. Instead, this method would be employed at only enough transects/plots to establish
the detection probabilities for each observer involved in the survey.

February 13, 2003, DRAFT
49
Flush Counts. This method should be used only where colonies are inaccessible or where nest counts
can be accomplished only with unacceptable levels of disturbance. Flush counts can be completed
relatively quickly without entering the colony, but some inaccuracy is inevitable in counts of flying birds
and determining the degree of error is difficult to establish in the field. Detection probabilities also cannot
be determined for counts obtained with this method.
In this method, a flying bird constitutes the counting unit. A group of observers approach the
colony and startle the adults by using a loud horn or some other noise for terns or by waiving their arms
for gulls. The adults are counted while they are flying. Estimates of population size should be made
within the first minute that all of the birds flush; as the birds fly around the colony for longer periods of
time or as the adults return to their nests, the counts become less accurate. These counts should be
conducted between the mid-incubation and early nestling stage of the breeding phenology to count the
peak numbers of birds at a colony.
Flush counts are most appropriate for small colonies (fewer than 200 pairs) occupied by single
species or where the multiple species can be easily identified by sight. In colonies hosting species that are
difficult to distinguish in the field, such as Arctic and Common Terns, accurate estimates of population
sizes for each species may not be possible. Given the inaccuracies associated with counts of flying birds,
multiple observers should produce estimates for each species at a colony. These counts can be averaged to
provide a reasonable estimate of total population size (Prater 1979). A minimum of five observers should
conduct the flush counts, and each observer should receive training on the estimation of numbers of birds
prior to the surveys.
Bullock and Gomersall (1981) developed a nest-attendance index to relate the true numbers of
nesting pairs with the estimates derived from flush counts. Comparing counts of “apparently occupied
nest sites” with flush counts from a small number of tern colonies in the Scottish islands every five days
over the breeding season at 2-hourly intervals between 0800 and 2200 derived this index. At these
colonies, they calculated that three flying birds were the equivalent of two breeding pairs. The

February 13, 2003, DRAFT
50
applicability of this index to other locations and species is uncertain, and similar nest-attendance indices
should be developed for colonies where flush counts are the only acceptable methods for population
estimation.
Parameter: Total number of adults present in the colony. This number includes both breeders and an
unknown proportion of nonbreeders. While counts of individual birds may be possible at small colonies,
the precision of estimates at large colonies is uncertain. At large colonies, only major changes (probably
>25%) in abundance will be evident from year to year.
Measuring Detection Probability
Field testing of a method is necessary, and given the difficulty of attempting to count any flock of birds
milling around a colony site determining detection probabilities is not possible for this method.
Cliff-nesting Gulls
These habitats tend to be inaccessible so that surveys are conducted from vantage points
providing good visibility of the colony, either from land or boats. As a result of the physical structure of
most cliffs, all nests will seldom be visible from the available series of vantage points. Exceptions are
likely to be relatively small colonies, such as those found on small islands that can be circumnavigated by
boats or occupy small cliffs. Complete nest counts are feasible only for those cliffs where every nest can
be observed and have relatively small numbers of nesting pairs that can be accurately counted given the
available resources and personnel. Colonies at most cliffs will have to be surveyed by sampling
representative portions of the nesting population.
The survey methods used for cliff-nesting gull colonies are the same as those described for
nesting kittiwakes in the cliff-nesting species section (see page ). Surveyors should count or develop an
estimate of the number of occupied nest sites at each colony. Unlike breeding kittiwakes that construct
well-defined nests, most gull nests are composed of a relatively loose association of materials with

February 13, 2003, DRAFT
51
conspicuous amounts of whitewash. However, regularly used loafing sites are also characterized by
considerable whitewash, and observers should be careful to distinguish between nests and loafing sites.
Parameter: Estimate the number of occupied nest sites at each colony.
Tree-nesting Gulls
Bonaparte’s Gulls and occasionally Mew Gulls are the only North American gulls that nest in
trees. Their breeding biology has been poorly described in the literature. Bonaparte’s Gulls do not
apparently nest in well-defined colonies and may be rather nomadic during the breeding season. Mew
Gulls nest as solitary individuals and in colonies, with the colonies tending to be located on the ground.
No methodology for monitoring tree-nesting gulls has been proposed to date. Until specific methods are
developed, surveyors can use the same survey methods as are described for tree-nesting herons (see page
).
Marsh-Nesting Species Black-crowned Night Heron, Black Skimmer, Black Tern, Cattle Egret, California Gull, Common Tern, Double-crested Cormorant, Eared Grebe, Forster’s Tern, Franklin’s Gull, Gull-billed Tern, Glossy Ibis, Great Egret, Green Heron, Great Blue Heron, Herring Gull, Laughing Gull, Lesser Black-backed Gull, Little Blue Heron, Least Tern, Little Gull, Magnificent Frigatebird, Neotropic Cormorant, Ring-billed Gull, Roseate Spoonbill, Snowy Egret, Tricolored Heron, Western Grebe, White-faced Ibis, White Ibis In general, methods for monitoring the populations of colonial-nesting birds in wetland habitats
remain poorly developed. Access to the colonies in these habitats is frequently difficult, and many
monitoring methods proposed for terrestrial habitats become inappropriate in wetlands. All methods used
to monitor wetland-nesting species should respect the relative fragility of these habitats and the vegetation
at the colony sites; disturbance to the vegetation should be avoided as much as possible to minimize the
possibility of nest failure and/or colony abandonment in response to the monitoring activities.
Disturbance to the nesting adults should be kept within the guidelines outlined previously. Since observer
movement through the colonies generally requires greater periods of time in wetlands than in uplands,
minimizing disturbance of the breeding pairs becomes a critical factor in the selection of potential
monitoring methods for these species. These factors, combined with the difficulty of locating nests,

February 13, 2003, DRAFT
52
contribute to the relative imprecision associated with the existing methods used to monitor colonial-
nesting species in these habitats.
The following section summarizes the strengths and weaknesses of the methods that have been
used to monitor populations of colonial-nesting birds in wetlands. In some cases, alternative methods are
suggested, although these approaches certainly require testing and verification in the field before they
should be applied across a large geographic area. Methodological development is a critical need before
meaningful population monitoring programs can be initiated for most of these species, and must include
creating approaches for determining the detection probabilities associated with these methods.
HERONS, IBIS
The species that are most frequently found nesting in wetland habitats are Great Egrets, Snowy
Egrets, Black-crowned Night-Herons, and White-faced Ibis. These colonies most frequently occur in the
western half of North America, especially on the Great Plains and Great Basin regions where suitable
nesting trees are relatively scarce. Four survey methods have been used to develop estimates of breeding
populations: direct nest counts, flight-line counts, helicopter surveys that serve as a “flush count”, and
surveys from fixed-wing aircraft.
Direct Nest Counts
Purpose: Population Estimation with reasonable precision: an ability to detect ≤ 20% changes in the
numbers of birds within colonies, along transects, or visible from the perimeter between years.
Parameter: All active nests within the colony.
This method consists of an observer or group of observers traversing a colony on foot or by boat to locate
and count the nests of all breeding pairs. This method has generally been used in relatively small colonies
(<100 nesting pairs) that do not require transects, especially where the colonies are located in discrete
patches of vegetation and can be fairly easily located within the wetland. The habitats must allow for

February 13, 2003, DRAFT
53
access by boat or on foot so that the nests can be counted without causing excessive disturbance to the
adults and young.
The advantage of this method is that it counts the number of nesting pairs, providing estimates
that are comparable to those obtained from the recommended methods for colonies located in upland
habitats. The precision of this method is uncertain and may vary from wetland to wetland; hence,
determining detection probabilities should be incorporated into these surveys.
Use of this method will likely be restricted to relatively small colonies, in order to keep
disturbance of the nesting adults within acceptable levels and since establishing transects may not be
possible in most wetland habitats. Whether this method is appropriate in all habitat types remains to be
determined, especially in wetlands where the vegetation is dense and finding nests may become more
difficult; determining detection probabilities by habitat type will likely indicate those wetlands that are
most appropriate for the use of this method.
For larger colonies, one possible approach would be to conduct direct nest counts in quadrats and
use the density estimates from these quadrats to develop estimates of total population size. Quadrat size
requires additional investigation, and may vary depending upon the species present and vegetation
characteristics. This approach might provide a reasonable alternative to flight-line counts or aerial surveys
for species that may not be well sampled by those methods.
Measuring Detection Probability: Methods for determining detection probabilities still need to be
developed and tested in the field. If transects are created, then methods employed in other transect surveys
may also work in wetlands. If habitats are systematically searched for nests, then a double-observer
method might work in areas with fairly discrete patches of habitats. The first observer could try to locate
as many nests as possible in the colony, marking each nest with plastic flagging or some other marker.
The second observer would independently locate nests, recording how many had been found by the
previous observer and the number of nests found only by the second observer. These data could be used
to estimate detection probabilities.

February 13, 2003, DRAFT
54
Flight-line Counts
Purpose: Given the uncertain relationship between the flight-line counts and the total number of nesting
pairs in a colony, the ability of this method to detect population trends is uncertain and may vary from
colony to colony. Large changes should be evident, but changes in the range of 20% per year may not be
detectable at most sites.
Parameter: The number of adults observed flying to/from the colony is used as an index to the overall
population size. This parameter may include both breeding adults and nonbreeders, and the proportion of
nonbreeders may vary between surveys.
This method has been described previously, and its appropriateness for marsh-nesting species
requires additional study. As in colonies located in other habitats, the primary problem is the relationship
between the numbers of individuals counted by this method with the actual number of pairs nesting in the
colony. This method only provides an index of population size, so comparison with estimates of total
population size become problematical.
At wetland colonies, flight-line counts have generally been conducted “shortly after sunrise”
during the incubation period. Its appropriateness may vary from species to species depending upon the
amount of synchrony in their nesting behavior. For example, large colonies of White-faced Ibis are
composed of highly synchronized sub-colonies that are spatially discrete; one sub-colony may be
incubating while another is feeding young in the nest so that the movement patterns of adults may vary
from one sub-colony to another. Hence, timing of the count with respect to the breeding chronology each
year becomes important if between-year comparisons of population size are needed.
Use of this method to monitor marsh-nesting species requires verification at colonies where
population estimates have been determined by other methods. Determining the most appropriate time of
day and period of the nesting chronology for each species is necessary for developing indices that are
comparable between years.

February 13, 2003, DRAFT
55
Measuring Detection Probability: A double observer approach can be used to determine detection
probabilities. The “primary” observer would verbally identify and count all individuals as they fly to/from
the colony. The “secondary” observer would try to find individuals/flocks that are missed by the
“primary” observer, as well as check the identification and counts of birds reported by the primary
observer. Since these counts are frequently taken over a several hour period, the observers should change
roles half-way through the survey period in order to obtain detection probabilities for both observers.
Surveys by Fixed-Wing Aircraft.
Purpose: To estimate population numbers with reasonable precision; to detect changes in numbers ≤
20% between years. This level of precision would apply only to light-colored species that are readily
visible from the air, and probably for smaller colonies where counts of individual birds are possible.
Parameter: The total number of adult birds present in the colony and visible from the air, either counted
from aerial photographs or by observers in the plane, How this number relates to the total number of
nesting pairs is uncertain, because the counts may include both breeders and nonbreeders.
This method has been described previously and is most appropriate for nesting egrets and other
light-colored species. It will likely underestimate numbers for dark-colored species. This method needs to
be combined with ground counts in order to determine appropriate correction factors for individuals not
visible from the air.
These surveys have generally involved estimating numbers of visible birds from the aircraft. Use
of aerial photography warrants additional study. Aerial photographs would eliminate the observer-related
biases associated with estimating large numbers of birds from the air. Ground counts would still be
necessary for developing appropriate visibility correction factors, but this approach may improve the
accuracy of estimates obtained from these aircraft.

February 13, 2003, DRAFT
56
Measuring Detection Probability: Methods used to estimate detection probabilities for other taxa from
aerial surveys should be used for marsh-nesting birds.
Flush-Counts by Helicopter
Purpose: The precision of this method tends to be poor, especially at large colonies where only very
approximate estimates of total populations are possible. At large colonies, between-year differences of an
order of magnitude should be detectable, but smaller changes may not be evident. At small colonies
where individual birds can be readily counted, the precision will be better but may still be less than the
standard goal for other survey methods.
Parameter: Total number of adults flushed by the helicopter from the colony. How this number relates
to the total number of nesting pairs is uncertain, because the counts may include both breeders and
nonbreeders. The proportion of birds that do not flush is also unknown, and could vary between surveys.
This method has been used for dark-colored species, especially White-faced Ibis that are poorly
represented on surveys by fixed-wing aircraft. In this method, a helicopter is used to flush the birds from
the colony and the numbers of individuals in flight are estimated. Large numbers of birds cannot be
accurately counted in flight as they mill around the colony, so this method provides only a rough estimate
of total population size; determining relatively minor year-to-year changes is not possible in many
instances, especially for common species. Observer-related biases associated with these counts may be
substantial, and comparing estimates between two different observers may not be possible.
Measuring Detection Probability: For small colonies where individual birds can be readily counted, a
double-observer approach might be developed to produce an estimate of detection probabilities. Since
flushed birds may quickly re-settle on their nests or fly away from the colony, a double-observer method
may be difficult to develop, For large colonies where total population size can only be estimated, no

February 13, 2003, DRAFT
57
method for determining detection probabilities is possible. Because of the difficulty in obtaining precise
counts of breeding population size and an inability to determine detection probabilities under most
circumstances, this method should be used only when no other options are available.
GULLS
In North America, two species of gulls are obligate wetland nesters: Franklin’s Gull that is widely
distributed across the northern Great Plains and Little Gull which has a very small breeding population on
this continent. Ross’ Gull also nests at the edge of arctic wetlands, but is a peripheral breeder in North
America. Other species may occasionally nest in wetlands, but these infrequent events do not warrant
specific discussion here.
Franklin’s Gull
Purpose: To estimate populations with reasonable precision; the goal is to detect ≤ 20% changes in the
numbers of birds present at monitoring plots between years.
Parameter: To develop estimates of the numbers of nesting pairs at each colony. Nest counts are needed
to avoid counting nonbreeders.
Franklin’s Gulls breed in large colonies at permanent wetland sites, always nesting over water on
mats of vegetation, muskrat houses, floating debris, and similar structure. They prefer areas with low
vegetation densities and where there are patches of open water of varying size. Their nests are generally
0.5-4.5 m apart, and their nesting behavior tends to be highly synchronous.
Since their colonies normally number in the hundreds or thousands of pairs, they are normally
fairly easy to locate. Developing accurate estimates of numbers of nesting pairs can be difficult at the
larger colonies, and no specific monitoring methods have been proposed. Aerial photography of the
colonies during the early to mid-incubation period (generally during the last half of May or early June)
might be the most promising method for monitoring this species. The adults nest in relatively sparsely

February 13, 2003, DRAFT
58
vegetated habitats, and the adult birds should be visible from photographs taken at low altitudes during
that time of the year. Concurrent ground counts taken at small colonies or portions of large colonies
would be needed to develop a correction factor for birds that are not visible from the air.
Direct nest counts may be possible at smaller colonies (<100-200 pairs), although considerable
care will be needed to accurately count the nests across a relatively featureless habitat. A quadrat method
may also be possible at some larger colonies, although given the relatively broad spacing of the nests,
these quadrats would have to be fairly large (at least 20 X 20m) in order to contain enough nests for
developing a reasonable estimate of total population size. This approach may be feasible at locations that
are consistently occupied by nesting colonies. But colony sites tend to change frequently in response to
fluctuating water levels, hence, establishing quadrats may be difficult at most colonies.
Measuring Detection Probability: Until methods are better defined to adequately survey the breeding
population, developing methods for estimating detection probabilities is not possible. If aerial
photography proves to be a useful survey method , then methods described previously for estimating
detection probabilities for other taxa from aerial photos should also apply to Franklin’s Gulls.
Little Gull
The known breeding population of Little Gulls in North America is very small, probably totaling
no more than 100-200 pairs. Discovering their breeding locations on this continent is much more of a
challenge than counting the numbers of breeding adults at a site, and will likely remain the greatest
challenge for the foreseeable future. Little Gulls tend to nest in the more open and wetter portions of
wetlands, frequently at the edges of dense stands of emergent vegetation, on floating dead vegetation,
muskrat houses, floating debris, and one small rocky islets within marshes. They may occur in small
segregated colonies or among other nesting gulls and terns. If Little Gulls are believed to be nesting at a
wetland, they only approach is to systematically cover all suitable habitats in the marsh in order to find
their nesting locations.

February 13, 2003, DRAFT
59
TERNS
In North America, two species of terns are obligate wetland nesters: Forster’s Tern and Black
Tern. These species tend to nest in small colonies, usually totaling fewer than 50 pairs. Both species
regularly nest as isolated pairs or small groups of 5 or fewer pairs. Direct nest counts are the most
appropriate method for estimating population size, but the most important challenge is actually finding all
of the nesting locations that may be scattered within a large wetland. Their nest site preferences are
described below, and these habitats at potential breeding sites should be systematically searched
(normally by boat) in order to locate all nesting pairs. The defensive behavior of the adults is frequently a
good indicator that an observer is near a nest site. These surveys should be conducted during the
incubation stage of nesting, since some adults may abandon their breeding sites if their nesting attempts
fail during incubation. The timing of the surveys should be consistent from year to year to produce
comparable results. Counts of foraging adults should not be used as an index of breeding population size,
since both species will forage at wetlands away from their nesting locations.
Forster’s Tern. This species only nests in “large” marshes, preferring those is excess of 100
acres in extent with permanent open water. Forster’s Terns regularly occupy freshwater and tidal
wetlands. Their nests are usually located at the edge of large open pools, frequently on muskrat houses,
mats of vegetation, and other sites that are well above normal water levels. They tend to be more social
than Black Terns, and as many as five pairs may nest on a single muskrat house.
Black Tern. Black Terns prefer large freshwater wetlands where 25-75% of the surface is
covered with vegetation and water depths are generally 0.5-1.5m. They frequently nest as isolated pairs,
although clusters of fewer than 50 nests may be found within a relatively small area. The response of the
adults to the presence of the observer is a good indication if more than one pair is present at a site. Their
nests are usually located on floating mats of dead vegetation barely above water level, normally within
February 13, 2003, DRAFT
60
2m of a large expanse of open water. Some nests are hidden within small patches of emergent vegetation,
while others are on floating mats that are completely exposed.
Other terns will occasionally nest in various wetland habitats, generally in small numbers that are
monitored using direct nest counts. Common Terns may form fairly large colonies in some wetland
habitats, and the methods previously discussed for that species will likely prove to be most appropriate for
monitoring their colonies in wetlands.

February 13, 2003, DRAFT
61
Literature Cited
Carter, H.R., G.J. McChesney, J.E. Takekawa, L.K. Ochikubo, D.L. Whitworth, T.W. Keeney, W.R.
McIver, and C.S. Strong. 1996. Population monitoring of seabirds in California: 1993-1995 aerial
photographic surveys of breeding colonies of Common Murres, Brandt's Cormorant, and Double-
crested Cormorants. Unpubl. Final report, U.S. Geological Survey, California Science Center,
Dixon, California.
Bullock, I. D., and C. H.Gomersall. 1981. The breeding populations of terns in Orkney and Shetland in
1980. Bird Study 28: 187-200.
Prater, A.J. 1979. Trends in accuracy of counting birds. Bird Study 26:198-200.
Bailey, R.S. and W.R.P. Bourne. 1972. Counting bird at sea. Ardea 60:124-127.
Tasker, M.L., P. Hope Jones, T. Dixon, and B.F. Blake. 1984. Counting seabirds at sea from ships: a
review of methods employed and a suggestion for a standardized approach. Auk 101:567-577.
Van Franeker, J.A. 1994. A comparison of methods for counting seabirds at sea in the southern ocean. J.
Field Ornithol., 65(1):96-108.
Briggs, K.T., W.B. Tyler, and D.B. Lewis. 1985. Comparison of ship and aerial surveys of birds at sea. J.
Wildl. Manage. 49:405-411.
Burger and Lawrence, 2000.
Cooper, B. A. and T. E. Hamer. 2000. Appendix H: use of radar for marbled murrelet surveys. Pages 28-
34 in D.M. Evans, W.P. Ritchie, S.K. Nelson, E. Kuo-Harrison, P. Harrison, and T.E. Hamer,
editors. Methods for surveying marbled murrelets in forests: a revised protocol for land
management and research. Pacific Seabird Group, Marbled Murrelet Technical Committee,
Technical Paper Number 1, revision. Oregon Cooperative Wildlife Research Unit, Oregon State
University, Corvallis, USA.
Dyer and Aldworth 1998
Rothery et al. 1988
Bibby et al. 2000
Gochfield 1980
Carney and Sydeman 1999
Nisbet 2000
Gaston et al 1983
Drent 1965

February 13, 2003, DRAFT
62
Ainley and Boekelheide 1990
Snager and Cody 1993
Vermeer et al. 1993
Bedard 1969
Byrd et al. 1983
Roby and Brink 1986
Piatt et al. 1990
Gaston and Masselink 1997)
February 13, 2003, DRAFT
63
Appendix A. Survey methodologies conducted outside of the breeding season.
PELAGIC SURVEYS
For some pelagic species, the population cannot be counted at the breeding colonies, or
information on species needs outside of the breeding colonies is desired. For these birds, counts at sea can
be conducted by air or boat. While open ocean surveys are beyond the scope of most cooperating land and
water managers, in some cases, they are the only method available to allow managers to gain insight into
seabird population status and trends. Additionally, managers are beginning to recognize the importance of
changes in ocean habitats, whether caused by shifting ocean regimes, or commercial and/or recreational
fisheries activities on marine and coastal ecosystems. In the past decade, it has become increasingly
important to use pelagic surveys to track ocean habitat use by species whose populations appear to be
declining, such as the Black-capped and Bermuda Petrels, but also for tracking concentrations of species,
such as shearwaters.
There are a number of problems associated with detecting seabirds in the open water. Tasker et al.
(1984) divided detection problems into five interrelated categories: size, color, behavior, weather, and
observer ability. Each of these factors, by themselves or in some combination, can result in significant
bias and variability in counts. For example, larger birds are easier to see than smaller birds at some set
distance; a storm petrel, whose wing span is one-fifth that of sulid is much harder to detect. A dark
colored bird such as a murre, in a dark sea or a kittiwake against a light sky, have less chance of detection
than a light colored bird against a dark sea. The behavior of particular species can make them easier or
more difficult to detect; procellariformes, who spend more time flying or moving through an observer’s
plane of view will be easier to detect than an auk, who spends portions of the time diving or stationary on
the surface of the water. Additionally, flocking birds are easier to detect than species who are solitary
most of the time.

February 13, 2003, DRAFT
64
It has been documented that the presence of the ocean vessel can influence species’ behavior and
bias its Detection Probability (Bailey and Bourne 1972). Some species, such as Northern Fulmars,
albatrosses, and Tufted Puffins, are attracted to ocean vessels while storm petrels and other species avoid
ships. Weather may influence an observer’s ability to detect birds; winds generating waves may obscure
birds sitting on the water from the view of an observer. Sun, glare, and fog may limit may limit visibility.
Weather may also affect bird behaviors; during calm conditions, birds may sit on the water instead of
flying, decreasing their chances of detection. All of these factors, either singly, or in combination, lead to
variability in counts and makes it difficult to interpret whether changes in numbers are the result of bias or
true population change.
Perhaps one of the most important biases influencing counts of birds from ships is caused by
birds flying through the total area surveyed. A count of all birds passing through a count zone within a
count period will overestimate the total number of birds within that zone at any one moment by
incorporating flux. Counting flux overestimates actual bird density. To account for this, coefficients of
detection probabilities should be established for each observer per species. Correction factors derived
from these coefficients of detection probability can be applied to the data.
Transect methods were developed to minimize many of the biases and variables discussed above.
Transects reduce the area of sea examined at any one time so that a substantial proportion of the birds
within the transect are detectable. However, most band-transect methods don’t address the bias associated
with flux, the movement of birds through a transect during a count period. Ideally, the observer should
make an instantaneous count of all birds within the transect band. Tasker et al. (1984) has suggested that
an instantaneous count is impossible to accomplish, especially at higher ship speeds. However, van
Franeker (1996) reported on a snapshot method used for counting seabirds in the southern ocean. We
recommend the snapshot method, below.
As with colony surveys, the pelagic survey design will depend on the objectives of the monitoring
program; if quantitative results are desired, the program must attempt to control for unwanted systematic
Standardization of methodologies must be adopted if data from different surveys are to be comparable.

February 13, 2003, DRAFT
65
Boat Surveys
Purpose – Population Indices for Detecting Trends, with an ability to detect ≤ 20 % change in the
numbers of birds represented by open water transects.
Parameter – Continuous counts of all stationary birds (swimming, sitting on ice, or actively feeding)
within the transect limits and (2) snap-shot counts of all flying birds within the transect limits.
Survey Design: Birds should be observed from an observation post aboard the vessel which give the
greatest angle of clear view and permits the additional use of sound to detect less conspicuous birds. Ten
minute blocks have been the standard count period over the past decade for many pelagic surveys. Count
periods longer than this will make it difficult to record changing conditions with bird numbers. Birds
within a 150 meter transect on one side of the ship should be counted in 10 minute blocks of time.
Although many surveys have used a 300 meter transect, previous work has reported difficulties in
detecting small, inconspicuous birds at distances of greater than 150 meters (Briggs et al. 1985; van
Franeker 1994). A range finder can be used to determine this distance. Detection of birds should be done
with an unaided eye; binoculars (10 x 40 suggested) should be used for species confirmation and for
aging or looking at plumage. Counts should be made: (1) continuously of all stationary birds (swimming,
sitting on ice, or actively feeding) within the transect limits and (2) in a snap-shot fashion for all flying
birds within the transect limits. The speed of the ship determines the forward limit of the snapshot area
within a range of 150 meters. Longer or shorter forward distances are avoided by adapting the frequency
of the snapshot counts. Birds following and circling the ship should be omitted from both snapshot and
continuous counts. If birds arrive and then follow the ship, they should be included in the count only if
their first sighting falls within a normal snapshot or continuous count of the transect area.
Data recording
Ship Information: Information on the ship’s position, course and speed, and the starting time of
observation should be recorded. Also recorded should be the height of the “eye” above the water and
viewing arc. Environmental factors must be recorded such as wind speed and direction, cloud cover,

February 13, 2003, DRAFT
66
barometric pressure and tendency, precipitation type and intensity, visibility, sea state, swell height and
direction, air temperature, and an assessment of the sun’s effect on the observation areas, based on the
strength of the sun and its direction relative to the direction of viewing. Observation notes should be
repeated at least every 100 minutes, with major changes noted as they occur.
Species Information: For each bird observation record species, number of individuals present, activity,
plumage and age of bird where possible, approximation of bird’s flight direction, and notes on other
distinguishing characteristics, such as whether a bird was oiled.
Target Population – number of birds on the sea in a continuous count and a snapshot of the birds flying
within a defined band transect.
Analysis - Densities may be calculated as the sum of stationary plus snapshot birds per surface area.
Radar (from Burger 2001)
Equipment: Two mobile radar units: each 10kW marine surveillance models using 9410 MHz (X-band) transmitting through 2 m scanners (In this case, a Furuno FR-7111 and a Furuno FR-810D were used). Each scanner is tilted upwards and scans a vertical arc of 25 degrees. (This needs to be finished – need paper from Condor – MG Raphael and DE Mack 2001, Condor 103: 219-229.
Beached Bird Surveys (To be added)
Systematic Reconnaissance Flights ( To be added)
Other Methodologies to be added….

February 13, 2003, DRAFT
67
Appendix B: Colonial breeding waterbird species of North America grouped by nesting substrate. Breeding status based on A.O.U.’s Checklist of North American Birds, 7th Edition. Only most
common nesting substrates have been listed, with few species allotted more than one nesting substrate type. Nest substrate types: cl=cliff, bu= burrow, rc=rock crevice, gr=ground, fv=floating
vegetation, lv=low vegetation, tr=tree, sh=shrub.
Burrow or Rock Crevice Nesters Nest
Code Cliff Nesters Nest
Code Ground, Floating Veg, or Low Veg Nesters
Nest Code Tree or Shrub Nesters Nest Code
Bermuda Petrel bu Northern Fulmar cl Eared Grebe fv Red-footed Booby sh
Manx Shearwater bu Northern Gannet cl Western Grebe fv Brown Pelican sh/tr
Black-vented Shearwater bu Brandt's Cormorant cl/gr Clark's Grebe fv Neotropic Cormorant tr
Audubon's Shearwater rc Double-crested Cormorant cl/gr/tr Laysan Albatross gr Double-crested Cormorant tr
Fork-tailed Storm-Petrel bu Great Cormorant cl Black-footed Albatross gr Great Cormorant tr
Leach's Storm-Petrel bu Red-faced Cormorant cl Masked Booby gr Anhinga sh/tr
Ashy Storm-Petrel bu/rc Pelagic Cormorant cl Blue-footed Booby gr Magnificent Frigatebird sh
Black Storm-Petrel bu Herring Gull cl Brown Booby gr Rufescent Tiger-Heron tr
Least Storm-Petrel rc Thayer's Gull cl American White Pelican gr Bare-throated Tiger-Heron tr
White-tailed Tropicbird rc Iceland Gull cl Brown Pelican gr/cl Great Blue Heron tr
Red-billed Tropicbird rc Glaucous-winged Gull cl Double-crested Cormorant gr Cocoi Heron tr
Red-tailed Tropicbird rc Black-legged Kittiwake cl Pinnated Bittern lv Great Egret tr
Dovekie rc Red-legged Kittiwake cl American Bittern lv Snowy Egret tr
Xantus's Murrelet rc Common Murre cl Least Bittern lv Little Blue Heron tr
Craveri's Murrelet rc Thick-billed Murre cl Glossy Ibis gr Tricolored Heron tr
Ancient Murrelet bu Razorbill cl White-faced Ibis gr Reddish Egret tr
Cassin's Auklet bu/rc Greater Flamingo gr Cattle Egret tr
Parakeet Auklet rc Common Eider gr Green Heron tr
Least Auklet rc Snail Kite lv Striated Heron tr
Whiskered Auklet rc American Oystercatcher gr Agami Heron tr
Crested Auklet rc Pomarine Jaeger gr Capped Heron tr
Rhinoceros Auklet bu Parasitic Jaeger gr Black-crowned Night-Heron tr
Atlantic Puffin bu Long-tailed Jaeger gr Yellow-crowned Night-Heron tr
Horned Puffin bu Laughing Gull gr Boat-billed Heron tr
Tufted Puffin bu/rc Franklin's Gull fv White Ibis tr
Black Guillemot rc Little Gull fv Glossy Ibis sh
Pigeon Guillemot rc Black-headed Gull gr White-faced Ibis sh
Bonaparte's Gull gr Green Ibis tr
Heermann's Gull gr Roseate Spoonbill sh/tr

February 13, 2003, DRAFT
68
Burrow or Rock Crevice Nesters Nest Code
Cliff Nesters Nest Code
Ground, Floating Veg, or Low Veg Nesters
Nest Code Tree or Shrub Nesters Nest Code
Mew Gull gr Jabiru tr
Ring-billed Gull gr American Wood Stork tr
California Gull gr Snail Kite sh/tr
Herring Gull gr Bonaparte's Gull tr
Western Gull gr Mew Gull tr
Glaucous Gull gr Brown Noddy sh
Great Black-Backed Gull gr Marbled Murrelet tr
Sabine's Gull Gr
Ross's Gull Gr
Ivory Gull gr
Gull-billed Tern gr
Caspian Tern gr
Royal Tern gr
Elegant Tern gr
Sandwich Tern gr
Roseate Tern gr
Common Tern gr
Arctic Tern Gr
Forster's Tern Gr
Least Tern Gr
Aleutian Tern Gr
Bridled Tern Gr
Sooty Tern Gr
Black Tern Fv
Black Skimmer Gr
Kittlitz's Murrelet Gr

February 13, 2003, DRAFT
69

February 13, 2003, DRAFT
70
Appendix C – A short list of literature related to disturbance of colonial waterbirds. Carney, M. and W. J. Sydeman. 1999. A review of human disturbance effects on nesting colonial
waterbirds. Waterbirds 22: 68-79. Nisbet, I. C. T.. Disturbance, Habituation and Management of Waterbirds. Waterbirds 23:312-332. Rodgers, J.A. Jr., and H.T. Smith.1995. Set-back distances to protect nesting bird colonies from human
disturbance in Florida. Conservation Biology 9: 89-99.

February 13, 2003, DRAFT
71
Appendix D Definitions:
The following are definitions used throughout this document:
POPULATION – a measure of the total population. For the purposes of this manual, population is defined as the total number of birds within the entire area of interest. POPULATION INDEX – an index of the total population useful for establishing population trends. SURVEY – a general term for any type of inventory and monitoring procedure. INVENTORY – a term applied to methods determining presence, relative abundance, and/or distribution of species. MONITORING – a term applied to methods determining population trends or measuring health of populations over space and time. ACCURACY – a measure of the nearness of the data you collect to the actual value of the variable being measured. PRECISION – is a measure of the variability within your data or the closeness to each other of repeated measurements of the same quantity. Variability results from many factors, including observer differences, collecting data during different nesting stages, collecting data during different times of day, changes in weather conditions from year to year or site to site, etc… BIAS – A systematic error associated with the methodology which results in consistently over or under-counting the variable of interest, in our case, number of breeding pairs or number of nests. For example, one might end up including nonbreeders in a count of nesting pairs, including non-targeted pair members, or end up missing targeted pairs; all would lead to consistently over- or under-counting. PARAMETER – Describes or characterizes a population.
DETECTION PROBABILITY –The probability of detecting birds that occurs within and among
species and habitats and over time. Detection probability is influenced by a number of factors including,
landscape, vegetation, species color, species behavior, and observer experience.

February 13, 2003, DRAFT
72
Appendix E Survey Form for Pacific Seabird Database (TO BE ADDED)

February 13, 2003, DRAFT
73
Appendix F CWB Censusing Methods/Errors Literature Matrix Citation Number, Taxa,
Location Error Method Notes
Ground Nest Count 2. hrgg, lbbg, United Kingdom Avg. % nests missed: 16.9±3.3(SE) Range: 5.0-27.3% 2758 and 3651, original and actual, respectively
9 plots Initial count (mark nests), then 2nd count
3. gulls, Massachusetts Range 4-22% error Estimate: Lincoln’s Index (mark/recapt) Xt/Nm = Nt/Nm1 Xt=total # nests, Nm=# nests marked in
1st search, Nt=total nests found in 2nd
search, Nm1=total nests of 2nd search that are marked
8 plots; 0.06-0.73 ha plots Initial count (mark nests), then 2nd count
9. hrgg, New England 5% error duplicate ground count
18. gtbh, South Carolina Only ground counts produced consistent results under variety of conditions. Post-nest ground counts, aerial est. and all transect tech. had acceptable level of precision (+ or – 20% for large colonies (>320 nests).
Compared ground counts to aerial count/estimate, point count, perimeter count, 20% 2m transect, 40% 4 m transect, 20% 4m transect, and post-nesting ground count; completed other techniques w/in 12 days of ground count.
20. statistical models Best method is total ground count. If completeness of count cannot be assumed, map objects from both ground and air.
Danger in applying correction factors determined for one study under specific conditions to another study.
8. greg, sneg, trhe, bche, Gulf Coast
Time intensive—only useful for small colonies that observer can see whole nesting group at once
Estimated number of lete adults flushed from colonies as walked along beach
22,gulls, cormorants, skuas, gbbg, kittiwakes,
"5% margin of error between direct counts and replicates
errors attributed to overlooking nests and poor counting
22., hrgg, gbbg, dcco, ME "5% for gulls, and dcco aerial estimates and aerial photos by 2 obs. from altitude of 150m. At completion of aerial census, ground crew approaced by boat and completed independent estimates (4-6 crew) by circling colony. Then grnd count completed systematic search marking searched areas.
24., Razorbill and Guillemot, Handa Is., Sutherland
Census counts should be made during nestling stage; 46% error for Razorbill, 26% for Guillemot (difference from mean)
warden “visited the cliffs daily for 18-20 days during April-July

February 13, 2003, DRAFT
74
Ground Estimate 22., hrgg, gbbg, dcco, ME "71 % for gulls, and 82% dcco aerial estimates and aerial photos by 2 obs. from altitude of 150m. At completion of aerial census, ground crew approaced by boat and completed independent estimates (4-6 crew) by circling colony. Then grnd count completed systematic search marking searched areas.
27.,common murres, thick-billed murres, AK
wind speed and direction effected daily counts; large plots (>300 birds appear to be disadvantageous (higher variability);
25., thick-billed murre, N.W.T. differences due to observers is small; observations beyond 2 hrs give little more benefit; accuracy of estimates is higher with high hatching success; 3 hrs obs. for plot of 80 prs gives "5%
Five study plots; at 2 plots, daily obs. fixed and same observers; at one plot recorded independently and compared results at second plot
Post-Nesting Ground Count
18. gtbh, South Carolina Accuracy was low in this study but Gibbs et. al. (1988) found close correspondence with midseason ground counts
Compared ground counts to aerial count/estimate, point count, perimeter count, 20% 2m transect, 40% 4 m transect, 20% 4m transect, and post-nesting ground count; completed other techniques w/in 12 days of ground count.
Aerial Count Helicopter
4. wading birds, Everglades NP, Florida
10-16% error for white or dark birds in tree canopy (greg, sneg, whib, anhi, dcco) -inaccurate for small dark birds nesting under the tree canopy (trhe, lbhe) -disturbance to nesting birds # fixed wing surveys
2 colonies (n nests=150 and 1363) 3 tests (2nd colony surveyed 2 times)
5. mainly wading birds, Atl. Coast
helicopter surveys more efficient than ground; also more accurate than fixed-wing aircraft
mainly synopsis of existing literature
9. hrgg, New England 19 – 31% error
23., blsk, cote, LI, NY "5% error from one-time census for blsk; 0.92 multiplicative conversion factor for cote gives error of "-12 to +18%
Aerial Count / Estimates Fixed-Wing Aircraft
4. wading birds, Everglades NP, Florida
32-100% error for white or dark birds in tree canopy (greg, sneg, whib, anhi, dcco) -inaccurate for small dark birds nesting under the tree canopy (trhe, lbhe)
2 colonies (n nests=150 and 1363) 3 tests (2nd colony surveyed 2 times)

February 13, 2003, DRAFT
75
8. wading birds (greg, sneg, trhe, bcnh), N. Gulf of Mexico
greg-4times > than actual, 15times<actual sneg-error: -8.7±92.0 (SD) trhe-error:79.1±25.1 (SD) bcnh-error:-84.4±14.7 (SD)
greg-33colonies, avg col size=511 nests sneg-6colonies, avg col size=1992 nests trhe-8colonies, avg col size=3192 nests bcnh-7colonies, avg col size=573nests
14. wading birds, FL (‘white birds’ =greg, whib, sneg, caeg; ‘dark birds’ = lbhe, trhe, gtbh, bcnh, glib)
Aerial estimates for white wading birds were about 80±18% and 73.5±13.7% of totals (derived from combined aerial and ground counts) for nests and colonies, respectively. Aerial estimates for dark birds were about 17.0±21.8% and 15.0±14.3% of totals for nests and colonies, respectively. The error for these estimates were attributed to inability to detect colonies, as well as underestimation of nests at known colonies.
East-west transects spaced 2.6 km apart were flown, 244m (alt), 185 kph; adult counts converted to nest counts based on nesting chronology (preincubation: 2 adults = 1 nest, incubation: 1 adult = 1 nest). Ground counts conducted by airboat, and on foot if necessary.
18. gtbh, South Carolina -1% error, SD=66; 95% CI for predicting colony size indicated that all tech, were imprecise for colonies <320 nests.
Compared ground counts to aerial count/estimate, point count, perimeter count, 20% 2m transect, 40% 4 m transect, 20% 4m transect, and post-nesting ground count; completed other techniques w/in 12 days of ground ct.
15. wost, FL Range of proportional differences was –73.3-206.1%; 150 nests gave a 95% fiducial interval of 59-634 nests for corresponding ground count; aerial surveys underest. # wost in colonies with high proportion of other white birds; canopy cover no effect on aerial
< 50 nests, all nests accessible for ground count, ground cts were 25 m transects, marked nests—aerial in 2 phases, earlier in south FL.
18. wading birds 25% error with SD = 56;moderately accurate; require a 58% change in nesting to detect difference between annual nest estimate
Compared ground counts to aerial count/estimate, point count, perimeter count, 20% 2m transect, 40% 4 m transect, 20% 4m transect, and post-nesting ground count; completed other techniques w/in 12 days of ground ct
8. greg, sneg, trhe, bcnh trhe and bcnh grossly underestimated (79% and 84% avg error, respectively); greg and sneg 4-8% visual error est.; estimated only 10% of trhe from air (missed 90%); concluded that the wide variation in percent error of visual estimates precluded generation of correction factors.
Used small fixed-wing at 200m altitude and 160 km/hr; averaged the estimates of two observers

February 13, 2003, DRAFT
76
19. gtbh, Maine coast Aerial estimates averaged 87% of ground counts; mean difference betw. grnd counts and aerial est. was 13.2 nests (±25.07 SD).
Four independent observers from fixed-wing aircraft on Jun 20, 1983.
20. cliff-nesting Osprey, Midriff Islands
Used Peterson Estimator. The proportional SE between ground count and aerial counts was 4% (high precision); 51 nests from air, 63 from ground (population estimate using Peterson Estimator N=78.24); Estimated aerial visibility rate of 65%.
Both observers in the plane take independent estimates. Peterson Estimator could never be used for moving objects but may work for nests. If both observers have same vantage point, will have negative bias on estimate of population.
22.,blsk "5% under ideal conditions; "19 percent under some conditions, "67% with human error
22., gulls "50% when compared to aerial photos
22., hrgg, gbbg, dcco, ME " 140% (gulls), "56% (dcco) aerial estimates and aerial photos by 2 obs. from altitude of 150m. At completion of aerial census, ground crew approaced by boat and completed independent estimates (4-6 crew) by circling colony. Then grnd count completed systematic search marking searched areas
21., waterfowl decoys, Mississippi Alluvial Valley
Reducing transect width lessed the effect of changes in use of habitat. Transect width of 100m had a predicted ratio of visibility rate between 0.87 and 1.16; visibility rate was highest for intermediate densities (0.4 or 0.76 decoys/ha).
Used decoys to measure visibility under different conditions.
26., hrgg, gbbg, Kent Island NB, Canada to LI, NY
On average, estimated 0.8 of the counted gulls (comparing visual estimate to grnd count); consistently underestimated (up to 50%)
Conducted aerial estimates, aerial photos and ground counts of gulls.
Aerial Photography 1. pelicans, ND 1368:1355 aer.photo:actual 1%
8. greg, rote, sate, blsk, Gulf Coast
For greg, aerial photography was most reliable est. in fresh water marsh and brackish marsh;
9. hrgg, New England 26 – 35% error
10. waterfowl from photos -effects of observer experience had no sig. effect on accuracy of estimates; inexperienced obs. underestimated more consistently than experienced -with training, 8 of 9 observers were within 10% of actual number.
9 observers, 10 photographs, each of 5 consecutive days 3 levels of observer experience: inexperienced, past experience, recent experience. Reinforced counts in one scenario and did not in a second.

February 13, 2003, DRAFT
77
11,12. Murres, seabirds, Canada correction factors for accessible island-top nesters: count birds on photo, and/or field count adults, then flush adults and count eggs in a defined area. (can take up to 6 weeks for 1 observer to complete)
13. gannets, Canada <20% error 600m, b&w 7X10 or 9X13” photos
18. gtbh, South Carolina Neither precise nor accurate and will not reliably detect fluctuations in popln size
Compared ground counts to aerial count/estimate, point count, perimeter count, 20% 2m transect, 40% 4 m transect, 20% 4m transect, and post-nesting ground count; completed other techniques w/in 12 days of ground count.
19. gtbh, Maine Coast Mean difference between ground counts and aerial photo counts was 16.7 nests (±22.27 SD)
Aerial photos taken of colony sites with hand-held 35 mm camera using color transparency film.
22., gannetts, cormorants, gulls, blk legged kittiwakes, sate, rote, murres, Adelie penguins, coei
"20% error-ring-billed gulls (23,000); "26-35% error for hrrg and gbbg; -2-30% below ground estimates for kittiwakes and guillemots
less direct disturbance to colonies,
22., hrgg, gbbg, dcco, ME "33% (gulls) " 12% (dcco) aerial estimates and aerial photos by 2 obs. from altitude of 150m. At completion of aerial census, ground crew approaced by boat and completed independent estimates (4-6 crew) by circling colony. Then grnd count completed systematic search marking searched areas
26., hrgg, gbbg, Kent Island NB, Canada to LI, NY
" 10% and " 15% for two years;conclude that counts of gulls on aerial photos plus grnd counts of gulls is reliable method for monit. population.
Conducted aerial estimates, aerial photos and ground counts of gulls.
Belt Transects 8. herons, Gulf Coast, USA 95% confidence limits: n=16,880, CI=2,672 (16% of n.e.), mangrove n=14,938, CI=3,090 (21%), mangr. n=14,279, CI=1,809 (13%), mangr. n=12,666, CI=1,337 (11%), mangr. n=3,240, CI=810 (25%), willow
10% of total area sampled
8. LAGU, FOTE, Gulf Coast 95% confidence limits: LAGU n=17,326, CI=2326 (13% of n.e.) FOTE CI within 25% of nest estimate
10% of total area sampled vegetation: Spartina
3. gulls and herons, RI, MA
3-142% error (5 samples were under 11%; one each at 26% and 54% error)
6 gull colonies, 3 heron colonies 10-20% of plot sampled

February 13, 2003, DRAFT
78
18. gtbh, South Carolina 40% transect technique was most accurate and precise of methods tested (95% CI indicated single year fluctuation of 22 % to detect real change in nesting numbers (13% error) BUT was time consuming; 20% transect (2m) for colonies > 550 nests was similar to 40% transect.
Transects were laid out perpendicular to the long axis of the colony with transects (2m or 4 m) chosen at random within each section. Nests recorded within 1 m of transect line (2 m) or within 4 meters (4m).
Point-Centered Quarter
3. gulls and herons, RI, MA
3-400% error performs poorly when nest distribution is clumped
6 gull colonies, 3 heron colonies 8-15 points sampled
Flight Line Count 6. caeg, trhe, sneg, lbhe; FL, (VA,NC)
-high error rates at the colony level (200%) -regional, population predictions were within 10% error -high hour to hour variability (#40%, trhe)
13 colonies -# birds entering/leaving the colony in a 3-hr time pd., observed by 2-3 people surrounding the colony -nest counts performed by total counts or belt transects (12-20% samples)
20. statistical model Future research should look at combining Peterson Model with Flight Line transects.
The detection function is defined as the probability of sighting an animal located at a perpendicular distance from a line transect flown. Assumes all animals present on line are seen and prob. of sighting an animal decreases with distance from the line.
At-Sea line Transect Surveys
28., Marbled Murrelets Density estimates from line transects sig. greater than estimates from strip transects of 100 and 200m and had higher stat. power to detect tends; 83% sighted on 400, 14% on 900m and 85-100% detected on 400 m on 7 of 9 days; suggest shift from estimating popln for large geog. area to changes in popl density within limited areas;
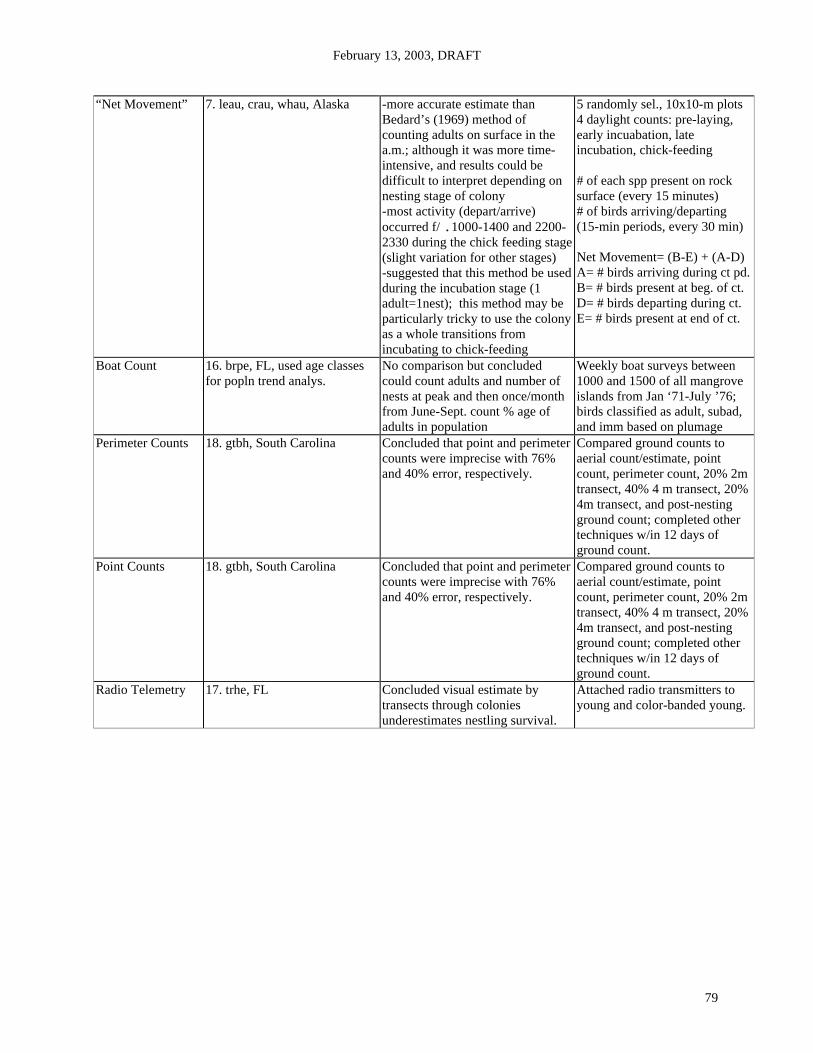
February 13, 2003, DRAFT
79
“Net Movement” 7. leau, crau, whau, Alaska -more accurate estimate than Bedard’s (1969) method of counting adults on surface in the a.m.; although it was more time-intensive, and results could be difficult to interpret depending on nesting stage of colony -most activity (depart/arrive) occurred f/ .1000-1400 and 2200-2330 during the chick feeding stage (slight variation for other stages) -suggested that this method be used during the incubation stage (1 adult=1nest); this method may be particularly tricky to use the colony as a whole transitions from incubating to chick-feeding
5 randomly sel., 10x10-m plots 4 daylight counts: pre-laying, early incuabation, late incubation, chick-feeding # of each spp present on rock surface (every 15 minutes) # of birds arriving/departing (15-min periods, every 30 min) Net Movement= (B-E) + (A-D) A= # birds arriving during ct pd. B= # birds present at beg. of ct. D= # birds departing during ct. E= # birds present at end of ct.
Boat Count 16. brpe, FL, used age classes for popln trend analys.
No comparison but concluded could count adults and number of nests at peak and then once/month from June-Sept. count % age of adults in population
Weekly boat surveys between 1000 and 1500 of all mangrove islands from Jan ‘71-July ’76; birds classified as adult, subad, and imm based on plumage
Perimeter Counts 18. gtbh, South Carolina Concluded that point and perimeter counts were imprecise with 76% and 40% error, respectively.
Compared ground counts to aerial count/estimate, point count, perimeter count, 20% 2m transect, 40% 4 m transect, 20% 4m transect, and post-nesting ground count; completed other techniques w/in 12 days of ground count.
Point Counts 18. gtbh, South Carolina Concluded that point and perimeter counts were imprecise with 76% and 40% error, respectively.
Compared ground counts to aerial count/estimate, point count, perimeter count, 20% 2m transect, 40% 4 m transect, 20% 4m transect, and post-nesting ground count; completed other techniques w/in 12 days of ground count.
Radio Telemetry 17. trhe, FL Concluded visual estimate by transects through colonies underestimates nestling survival.
Attached radio transmitters to young and color-banded young.

February 13, 2003, DRAFT
80
Literature Citations included in CWB Censusing Methods / Errors Matrix
id Authors Year Journal Vol. Title
1 Sidle, J.G. and E.L. Ferguson 1982 Prairie Naturalist 14:13-26 White pelicans populations at Chase Lake, North Dakota, evaluated by aerial photography
2 Ferns, P.N. and G.P. Mudge 1981 Bird Study 28:244-246 Accuracy of nest counts at a mixed colony of herring and lesser black-backed gulls
3 Erwin, R.M. 1980 Trans. Linnaean Soc. New York 9:77-86 Censusing waterbird colonies: Some sampling experiments
4 Kushlan, J.A. 1979 J. Wildl. Manage. 43:756-760 Effects of helicopter censuses on wading bird colonies
5 Erwin, R.M. 1980 Atlantic Naturalist 33:19-22 Censusing colonial waterbirds: Problems and progress
6 Erwin, R.M. 1981 Colonial Waterbirds 4:91-95 Censusing waterbird colonies: An update on "flight line" count method
7 Byrd, G.V., R.H. Day, and E.P. Knudtson 1983 Condor 85:274-280 Patterns of colony attendence and censusing of auklets at Buldir Island, Alaska
8 Portnoy, J.W. 1980 Trans. Linnaean Soc. New York 9:127-134 Censusing methods for gulf coast waterbirds
9 Kadlec, J.A. and W.H. Drury 1968 Ecology 49:644-676 Structure of the New England herring gull population
10 Erwin, R.M. 1982 J. Field Ornithol. 53:159-167.1 Observer variablility in estimatingexperiment
11 Nettleship, D.N. 1980 Can. Wildl. Serv. Occ. Pap. 43 Census methods for murres, approach
12 Nettleship, D.N. 1976 Can. Wildl. Serv. Occ. Pap. 25 Census techniques for seabirds of arctic and eastern Canada
13 Nettleship, D.N. 1975 Can. Field Naturalist 89:125-133 A recent decline of gannets, Bonaventure Island, Quebec
14 Frederick, P.C, T. Towles, R.J. Sawicki, and G.T. Bancroft 1996 Condor 98:837-841
Comparison of aerial and ground tediscovery and census of wading bird (Ciconiiformes) nesting colonies
15 Rodgers, J.A., S.B. Linda, and S. A Nesbitt 1995 J. Wildl. Manage. 59(4):656-666 Comparing aerial estimates with ground counts of nests in wood stork colonies
16 Schreiber, R.W. and E.A. Schreiber 1983 J. Wildl. Manage. 47(1):105-111 Use of age-classes in monitoring population stability of brown pelicans
17 Frederick, P.C., M.G. Spalding, and G.V.N. Powell 1993 J. Wildl. Manage. 57(1):34-41
Evaluating methods to measuretricolored herons
18 Dodd, M.G., and T.M. Murphy 1995 J. Wildl. Manage. 59(4):667-673 Accuracy and precison of techniques for counting great blue heron nests
19 Gibbs, J.P., S. Woodward, M.L. Hunter, and A.E. Hutchinson 1988 J. Field Ornithol 59(2):130-134
Comparison of techinques for censusing great blue heron nests
20 Pollock, K.H., and W.L. Kendall 1987 J. Wildl. Manage. 51(2):502-509 Visibility bias in aerial surveys: A review of estimation procedures
21 Smith, D.R., K.J. Reinecke, M.J. Conroy, M.W. Brown, and J.R. Nassar 1995 J. Wildl. Manage. 59(3):515-527
Factors affecting visibility rate of waterfowl surveys in the Mississippi Alluvial Valley
22 Hutchinson, Alan E. 1979 Proc. Colonial Waterbird Group Vol 3:235-244 Estimating numbers of colonial nesting seabirds: A comparison of techniques
23 Buckley, P.A. M.Gochfeld, and F.G. Buckley
Efficacy and timing of helicopter censuses of black skimmers and common terns on Long Island, NY: A preliminary analysis
24 Lloyd, Clare 1975 Brit. Birds 68:507-513 Timing and freqency of census counts of cliffauks
25 Gaston, A.J., D.G. Noble, and M.A. Purdy 1983 J. Field Ornithology 54(3):275-282 Monitoring breeding biology parameters for Murres spp.:Levels of accuracy and sou

February 13, 2003, DRAFT
81
26 Kadlec, J.A., and W.H. Drury 1968 J.Wildlife Manage. 32(2):287-293 Aerial estimation of the size of gull breeding colonies
27 Hatch, S.A., and M.A. Hatch 1989 J. Wildlife Manage. 53(2):483-493 Attendance patterns of Murres at breeding sitimplications for monitoring
28 Becker, B.H., S.R. Beissinger, and H.R. Carter 1997 The Condor 99:743-755 At-sea density monitoring of marbled murrelet in central california: methodological considerations.
Literature not in matrix
Buckley, and F.G. Buckley 1979 Proc. Colonial Waterbird Group Vol 3:1-15 What constitutes a waterbird colony? Reflections from the Northeastern U.S.
Boyd, W.S., and J.R. Jehl Jr. 1998 Col. Waterbirds 21(2):236-241 Estimating the abundance of eared grebes on mono lake, California, by aerial photography
Jones, Ian L. 1992 The Condor 94:93-100 Colony attendance of least auklets at St. Paul Island, AK: Implications for population monitoring
Hatch, S.A., and M.A. Hatch 1988 The Condor 90:613-620 Colony attendance and population monitoring of blacklegged kittiwakes on the Semidi Islands, Alaska
Piatt, J.F., B.D. Roberts, and S.A. Hatch 1990 The Condor 92:97-106 Colony attendance and population monitoring of least and crested auklets on St. Lawrence Island, Alaska
Rothery, P., S. Wanless, and M.P. Harris 1988 J. of Animal Ecology 57:1-19 Analysis of counts from monitoring guillemots in Britain and Ireland
Caugley, G., and J. Goddard 1972 J. Wildl. Manage. 36(1):135-140 Improving the estimates from innacurate censuses
Routledge, R.D. 1981 J. Wildl. Manage. 45(4):997-1000 The unreliability of population estimates from repeated, incomplete aerial surveys
Magnusson, W.E., and G.J. Caughley 1978 J. Wildl. Manage. 42(1):174-176 A Double-survey estimate of population size from incomplete ground counts
Samuel, M.D. and K.H. Pollock 1981 J. Wildl. Manage. 45(4):993-997 Correction of visibility bias in aerial surveys where animals occur in groups