Embed Size (px)
Citation preview

Janice K. Brewer Governor
Brian C. McNeil Director
ARIZONA DEPARTMENT OF ADMINISTRATION
OFFICE OF THE DIRECTOR
100 NORTH FIFTEENTH AVENUE SUITE 401 PHOENIX, ARIZONA 85007
(602) 542-1500
October 2013
The Honorable Janice K. Brewer
Governor, State of Arizona
The Honorable Andy Biggs
President, Arizona State Senate
The Honorable Andy Tobin
Speaker, Arizona House of Representatives
1700 West Washington
Phoenix, Arizona 85007
Dear Governor Brewer, President Biggs, and Speaker Tobin:
Pursuant to Arizona Revised Statutes § 41-751, the 2013 Advisory Recommendation provides
information concerning the compensation of State employees and an objective assessment of the job
market.
On September 29, 2012, personnel reform became effective and a new personnel system was
implemented. Significant time and effort was invested in this reform effort that is expected to enable the
State to attract and retain top performing employees and instill a culture of high performance. In addition,
last year the need to address State employee salaries was recognized, and the 5% critical retention
payments for eligible employees was converted to a permanent increase to base pay. This action assisted
in closing the gap between State salaries and the prevailing job market, and reversed the trend of the past
five years. It is estimated that a 14.0% salary increase is necessary to get to the job market. Although the
State does provide a competitive benefits package, base salary continues to be the most pressing issue in
need of addressing.
Supporting this year’s recommendation and continuing to address State employee compensation affects
our ability to attract and retain the best employees. This year’s recommendation includes a two-part
strategy:
1. Provide agency funding for merit increases for top performing employees
2. Provide agency funding for market adjustments for critical classifications
These strategies will require a very modest investment of resources yet are expected to generate the
largest return possible given the current economic challenges of the State. This Advisory
Recommendation provides important information needed when making decisions affecting Arizona State
government and its employees’ compensation.
Sincerely,
Brian C. McNeil
Director
1
2013 Advisory Recommendation on State Employees’ Salaries Introduction Every year, the Arizona Department of Administration (ADOA) provides an Advisory Recommendation to the Governor and the Legislature pursuant to A.R.S. §41-751. This document provides an analysis of the State’s current compensation levels compared to other public and private sector employers, and a review of turnover rates, retirement projections, and projected market movement. The report concludes with a recommendation to implement a two-part strategy to adjust salaries for some State employees.
This report reflects the current status of Arizona State employee compensation as
it relates to market conditions at the end of Fiscal Year 2013. The report is
provided as a resource to guide statewide budget considerations during the
preparation of the Fiscal Year 2015 budget. Current Environment – State Government History of Salary Adjustments
Figure 1 History of the State’s Compensation Adjustments
1
Budget Year (Fiscal Year)
Average Salary2
General Salary Adjustments
Merit, Performance, or Retention
Allocations for Selected Classes
1998 N/A 2.5%3 2.5% Merit Yes
1999 N/A -0- 2.5% Merit Yes
2000 N/A -0- 2% Merit Yes
2001 N/A -0- 2% Merit Yes
2002 N/A $1,450 -0- No
2003 N/A -0- -0- No
2004 N/A -0- -0- No
2005 N/A $1,000 -0- Yes4
2006 N/A 1.7% -0- Yes5
2007 N/A $1,650 2.5% Perf Pay Yes6
2008 N/A 3.0% Additional
0.25% Perf Pay Yes
7
2009 $42,251 -0- -0- No
2010 $42,304 -0- -0- No
2011 $42,235 -1.92%8 -2.75%
9 No
2012 $42,322 -0- -0- No
2013 $42,447 -0- One-Time
5% Uncovered Retention Pay
10
No
2014 N/A -0- 5% Uncovered
Retention Pay Added to Base
11
No
1 Source: Joint Legislative Budget Committee Appropriations Reports. Merit Adjustment figures represent the percentage allocated to an agency's
personnel services base. Allocations for Selected Classes are provided to address specific job classes or specific agency needs addressed by legislation. 2 Previous reports included average salary of “covered” employees. As a result of Personnel Reform, implemented September 29, 2012, the majority of the
State’s workforce became uncovered. As a result, the column for average salary has been recalculated to reflect salaries of all employees, both covered and
uncovered. Data for years prior to 2008 are not available. 3 Up to maximum of $1,000 per employee.
4 Includes adjustments above $1,000 for State-employed nurses and for sworn officers in the Department of Public Safety.
5 Includes adjustments above 1.7% for sworn officers in the Department of Public Safety and Assistant Attorneys General. In lieu of the 1.7% general
salary adjustment, correctional officers in the Department of Corrections and the Department of Juvenile Corrections received $1,410. 6 Includes adjustments above the $1,650 per FTE and 2.5% performance adjustment for the Auditor General's Office, State-employed nurses and
corrections officers in the Department of Corrections and the Department of Juvenile Corrections. 7 Includes adjustments above the 3.0% pay adjustments and 0.25% performance adjustment for the General Accounting Office, Assistant Attorney
Generals, supervisor correctional officers at the Department of Corrections, security officers at the Arizona State Hospital, officers at the Department of
Juvenile Corrections, and sworn officers at the Department of Public Safety. 8 Represents 5 furlough days (1.92)% except for certain exempted positions.
9 Represents a (2.75)% performance pay reduction intended to eliminate the FY 2007 and FY 2008 Performance Adjustments.
10 5% Retention Payments were not added to base salary and were authorized for 19 pay periods in FY 2013.
11 5% increase was added to base salary for uncovered employees previously receiving the 5% Retention Payments.
2
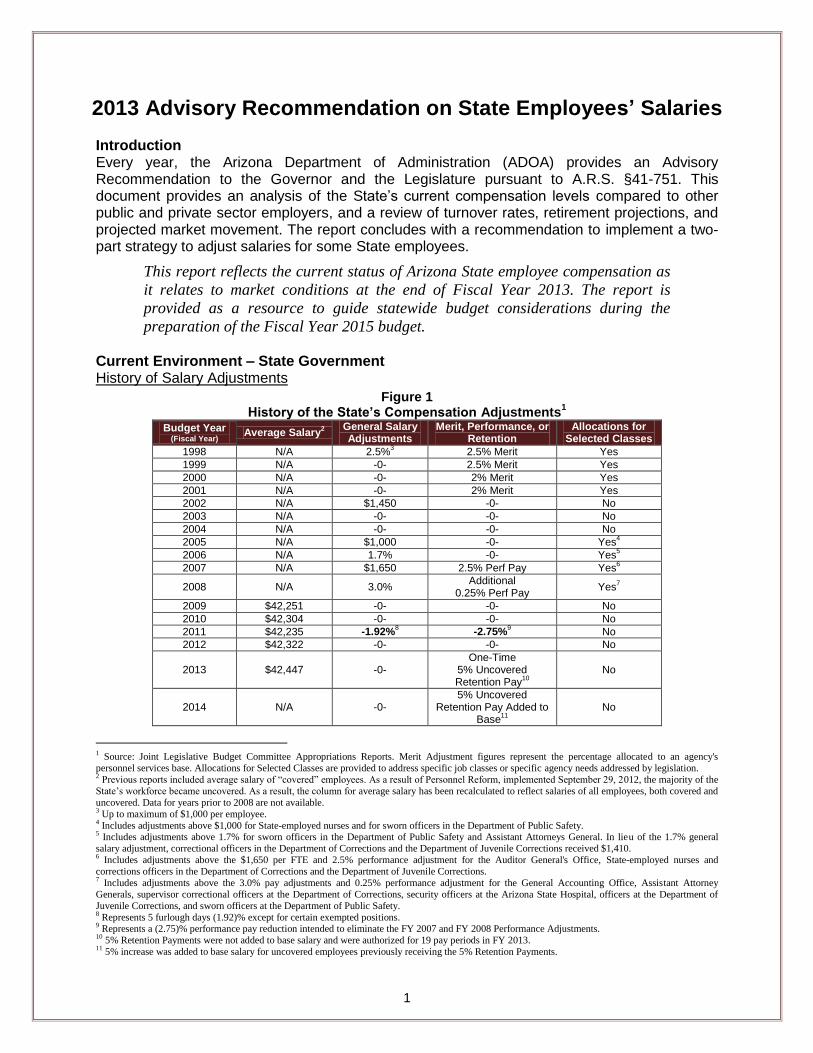
Turnover Rates The turnover rate for both covered and at-will uncovered employees decreased in FY 2013 from 16.4% to 15.8%. The rate in 2012 was elevated due in part to the outsourcing of the Department of Corrections Health Care unit. Involuntary separations in 2013 were almost half the number observed in 2012. The average separation rate for all State Personnel System agencies has been lower than benchmarks since 200912.
Figure 2 Turnover Rates – Arizona Compared to Benchmarks – FY 2009 to FY 2013
12
Table 2.1 – Turnover Rates – Arizona Compared to Benchmarks. Fiscal Year 2009 – 2013. State of Arizona Workforce Report. 2013.
16.4% 15.5% 14.7% 16.4% 15.8%
2009 2010 2011 2012 2013
14%
15%
16%
17%
18%
AZ Turnover State & Local All Govt
3
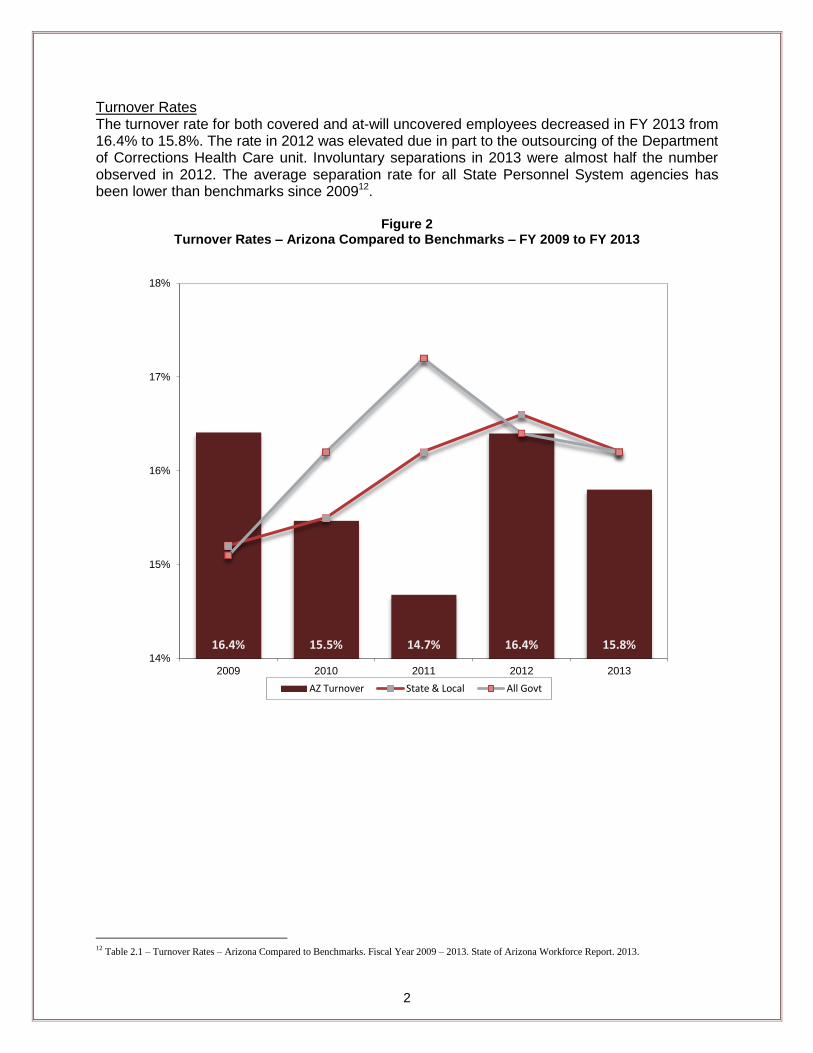
More indicative of the need for the State to improve its competitive position in the market place is the overall increase in the number of voluntary separations from the State. In FY 2013, nearly 10% of the workforce voluntarily separated. Figure 3 illustrates the consistent increase in the number of voluntary separations every year for the past four years, providing further evidence that as the economy improves, more employees are choosing employers other than the State. While overall turnover may have decreased between FY 2012 and FY 2013, the increases each year in voluntary separations since FY 2009 is very concerning.
Figure 313
Turnover Rates – Arizona Compared to Benchmarks – FY 2009 to FY 2013
13
Table 2.2 – Turnover Rates by Type of Separation. Fiscal Year 2009 – 2013. State of Arizona Workforce Report. 2013.
0.0%
2.0%
4.0%
6.0%
8.0%
10.0%
12.0%
14.0%
16.0%
18.0%
2009 2010 2011 2012 2013
4.2%
6.4%
8.4% 8.8% 9.7%
5.8%
3.8%
2.8%
4.4% 2.3% 2.2% 3.3%
2.9%
2.7%
2.8% 4.2% 1.9% 0.6%
0.6% 1.0%
16.4% 15.5%
14.7%
16.4% 15.8%
Voluntary Involuntary Retirement Other

4
Reduction in Total Size of Government The total size of State government was dramatically reduced during the years from 2008 to 2010, as the State managed one of the worst fiscal crises in the nation. During those years, reductions in force and layoffs occurred in most agencies, and a hiring freeze was implemented that ensured further reductions through attrition. Although there were slight increases in the size of the workforce in 2011 and 2012, total staffing levels appear to be leveling off and the size of the workforce decreased slightly (-1.8%) in FY 2013. In FY 2013 the total size of the workforce was 33,621, which represents an 11.4% reduction from the size of the workforce in FY 2008.
Figure 4
Employee Headcount – Arizona State Personnel System14
14
Figure B – State Personnel System Employee Headcount. Fiscal Year 2008 – 2013. State of Arizona Workforce Report. 2013. Although the State
Personnel System was not established until FY 2013, headcount numbers in the chart for prior fiscal years reflect the same agencies that are now include in
the State Personnel System to provided consist analysis over time.
30,000
32,000
34,000
36,000
38,000
40,000
2008 2009 2010 2011 2012 2013
37,956
35,392
33,213
33,906 34,223
33,621
5
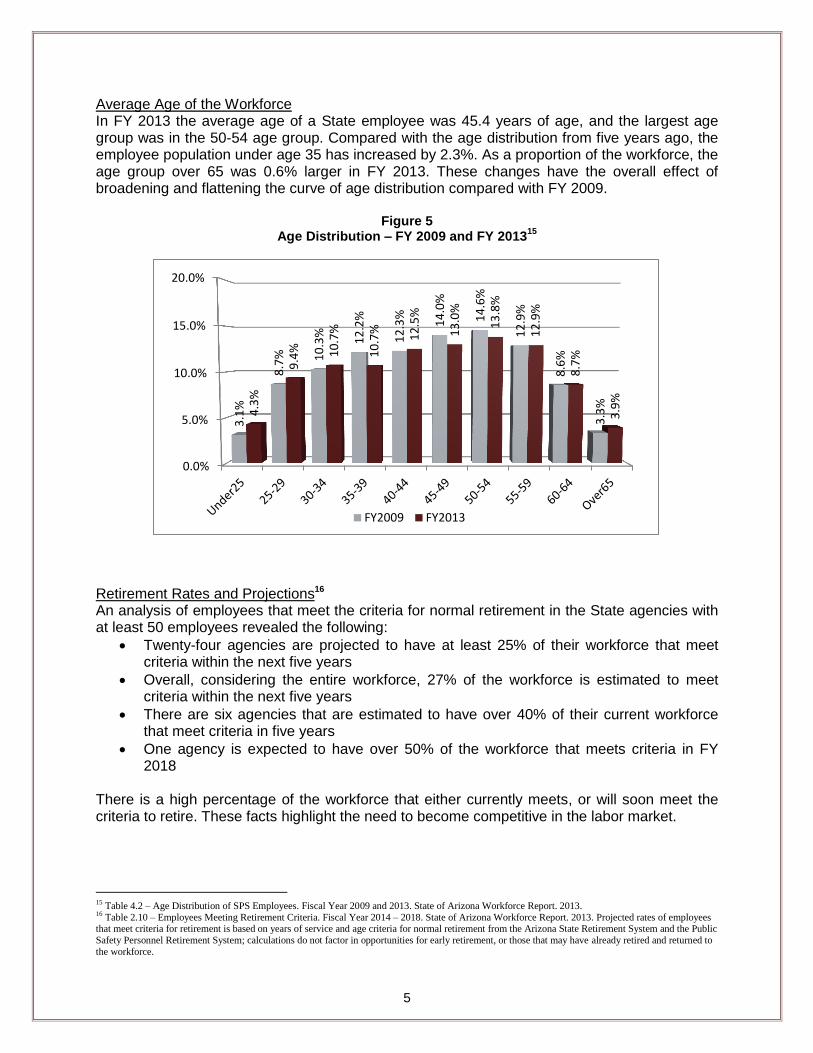
Average Age of the Workforce In FY 2013 the average age of a State employee was 45.4 years of age, and the largest age group was in the 50-54 age group. Compared with the age distribution from five years ago, the employee population under age 35 has increased by 2.3%. As a proportion of the workforce, the age group over 65 was 0.6% larger in FY 2013. These changes have the overall effect of broadening and flattening the curve of age distribution compared with FY 2009.
Figure 5 Age Distribution – FY 2009 and FY 2013
15
Retirement Rates and Projections16 An analysis of employees that meet the criteria for normal retirement in the State agencies with at least 50 employees revealed the following:
Twenty-four agencies are projected to have at least 25% of their workforce that meet criteria within the next five years
Overall, considering the entire workforce, 27% of the workforce is estimated to meet criteria within the next five years
There are six agencies that are estimated to have over 40% of their current workforce that meet criteria in five years
One agency is expected to have over 50% of the workforce that meets criteria in FY 2018
There is a high percentage of the workforce that either currently meets, or will soon meet the criteria to retire. These facts highlight the need to become competitive in the labor market.
15
Table 4.2 – Age Distribution of SPS Employees. Fiscal Year 2009 and 2013. State of Arizona Workforce Report. 2013. 16
Table 2.10 – Employees Meeting Retirement Criteria. Fiscal Year 2014 – 2018. State of Arizona Workforce Report. 2013. Projected rates of employees that meet criteria for retirement is based on years of service and age criteria for normal retirement from the Arizona State Retirement System and the Public
Safety Personnel Retirement System; calculations do not factor in opportunities for early retirement, or those that may have already retired and returned to
the workforce.
0.0%
5.0%
10.0%
15.0%
20.0%
3.1
%
8.7
%
10
.3%
12
.2%
12
.3%
14
.0%
14
.6%
12
.9%
8.6
%
3.3
%
4.3
%
9.4
%
10
.7%
10
.7%
12
.5%
13
.0%
13
.8%
12
.9%
8.7
%
3.9
%
FY2009 FY2013
6
Changes to State Government Workforce Personnel Reform In May 2012, Governor Brewer signed significant personnel reform into law, modernizing the way in which State government manages, hires, and fires employees. This was one of the most extensive changes to Arizona’s governmental infrastructure which began to take effect in FY 2013. With this change, the existing cumbersome personnel system, which had the effect of discouraging the best employees and protecting the weakest performers, was replaced. Consolidation of Personnel Systems At the heart of the personnel reform legislation was the development of a new personnel system. Through consolidating several different personnel systems, implementing consistent human resources practices and eliminating unnecessary redundancies, significant efficiencies are being realized. Transition to At-Will At the time of implementation of personnel reform, a number of employees were transitioned from a covered status to an at-will uncovered status. This change included all new hires, all supervisors, all employees in a grade 19 or higher position, all employees in the attorney salary schedule, all employees in the information technology salary schedule, all employees voluntarily accepting a change in assignment, and all employees that otherwise volunteer to transition to at-will uncovered. Nearly 40% of the employees that were eligible, volunteered to become at-will uncovered. As a result, over 61% of the workforce is now uncovered (over 76% when excluding Correctional Officers and Community Corrections Officers that are required to remain covered). Collectively, consolidating personnel systems, changes to the personnel rules and policies, and transitioning the workforce to an at-will uncovered status, will result in increased productivity, eliminating unnecessary bureaucratic processes, and ultimately saving taxpayers money. The system is based on a model that has been standard practice in the private sector. One of the most meaningful and significant aspects of the system is the shift in the culture of the workforce toward pay for performance. Performance Management An integral part of the reform initiative is the system by which the State will identify top performing employees. The previous performance management system was considered by many to be ineffective, inefficient, and burdensome. The new performance management system ensures that most employees are evaluated on a consistent framework of competencies. Some competencies are uniform across the entire State, and others are specifically defined by each agency. All agencies will have evaluated their employees during FY 2014. Compensation System Many of the compensation strategies that will be available to agency management moving forward will be directly tied to encouraging a performance based approach to compensation. For example, promotional increases will only be available for employees that have received a “meets expectations” rating or better on each competency on their most recent performance review. Other salary options will only be available to employees that meet or exceed expectations, and have not been the subject of certain disciplinary actions.

7
One of the goals of personnel reform is to attract top performers to the State, and to retain the top performers that are currently in the workforce. Given that the size of the overall workforce has been significantly reduced (Figure 4), future success depends on having a highly engaged, high performing team of employees. Compensating these employees appropriately must be a high priority for the State in order to attract and retain top talent in an improving economy. Classification System The current classification system has been in place for several decades, in spite of several past attempts to overhaul and revise it. Over the course of years, it has gradually been changed to become a means of addressing compensation issues. Practices such as establishing “special recruitment rates,” developing special salary schedules, and delineating classifications into narrow bands as an artificial means of providing additional “promotional” opportunities, all have served to increase the bureaucracy and cumbersome nature of managing within the existing classification system. Moving forward, the classification system will be improved through establishing classifications based on reliable, industry-accepted occupational information and job groups, along with consolidating duplicate or overly restrictive classifications. The salary range for each classification will reflect market conditions, and employee performance will be the driving force to move individual salaries toward the market rate. Collectively, these strategies of implementing a consistent foundation of performance management and integrating that information with compensation and classification is expected to transform the State Personnel System to be competitive with the prevailing labor market. Current Environment – Competitive Job Market Market Movement The job market is constantly moving, and the State’s market position must continually be analyzed to assess the competitive position of the State with respect to the market. Market salaries are influenced by the overall economy at the national and local levels as well as the relative demand for a particular skill or job family.
Figure 6
Actual and Projected Base Salary Increases17
Reference 2012
Actual 2013
Actual 2014
Projected
National - Hay 2.8% 3.0% 3.0%
National - Mercer 2.7% 2.8% 2.9%
National - WorldatWork 2.8% 2.9% 3.1%
Local (Private Sector Only) AZ Compensation Survey
2.7% 2.7% 3.0%
Local (Public & Private) AZ Compensation Survey
2.3% 2.3% 2.8%
Local (Public Sector Only) AZ Compensation Survey
1.3% 1.1% 2.2%
State of Arizona 0% 2.5%18
TBD
17
National data from Hay, Mercer, and WorldatWork websites; Arizona data from 2013 Arizona Compensation Survey. 18
Approximately 50% of the workforce received the 5% retention payment increase to base salary
8
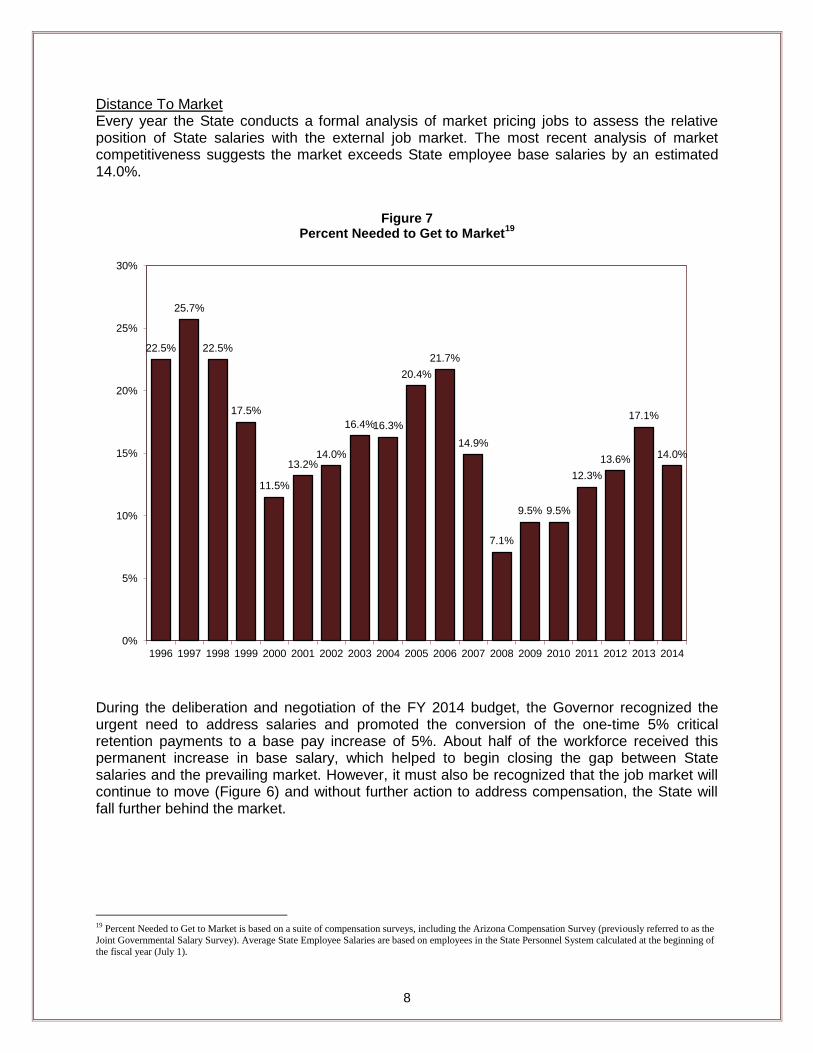
Distance To Market Every year the State conducts a formal analysis of market pricing jobs to assess the relative position of State salaries with the external job market. The most recent analysis of market competitiveness suggests the market exceeds State employee base salaries by an estimated 14.0%.
Figure 7 Percent Needed to Get to Market
19
During the deliberation and negotiation of the FY 2014 budget, the Governor recognized the urgent need to address salaries and promoted the conversion of the one-time 5% critical retention payments to a base pay increase of 5%. About half of the workforce received this permanent increase in base salary, which helped to begin closing the gap between State salaries and the prevailing market. However, it must also be recognized that the job market will continue to move (Figure 6) and without further action to address compensation, the State will fall further behind the market.
19
Percent Needed to Get to Market is based on a suite of compensation surveys, including the Arizona Compensation Survey (previously referred to as the
Joint Governmental Salary Survey). Average State Employee Salaries are based on employees in the State Personnel System calculated at the beginning of
the fiscal year (July 1).
22.5%
25.7%
22.5%
17.5%
11.5%
13.2% 14.0%
16.4% 16.3%
20.4%
21.7%
14.9%
7.1%
9.5% 9.5%
12.3%
13.6%
17.1%
14.0%
0%
5%
10%
15%
20%
25%
30%
1996 1997 1998 1999 2000 2001 2002 2003 2004 2005 2006 2007 2008 2009 2010 2011 2012 2013 2014

9
Critical Classifications The job market is estimated to exceed the average State employee salary by 14.0%; however, there are employees in some classifications that are much further behind than others. Currently the State maintains a classification system with nearly 3,000 different classifications that have active employees assigned to a position within the classification. One of the major initiatives that will be implemented in the near future is the consolidation of classifications and establishment of salary ranges that are benchmarked to the job market. Although this process is not completed, an initial analysis of classification and market position reveals that many job families are significantly further off the market than the overall average. Many of these job families have also experienced turnover rates that exceed the statewide average. The following table lists the job families that have an overall average salary that is exceeded by the market by at least 14%. There are additional specific classifications that are significantly behind the market, yet when consolidated into a job family, the average distance to the market is less than 14%. Those job families that require at least 14% to get to the market are listed below, in descending order of the estimated percentage from market.
Figure 8 List of selected classifications with benchmarks and estimated distance to market and turnover
Classification Series Number of Employees
Estimated % To Market
Estimated Turnover
Statistical Analysis 21 44.0% 8.7%
Auditing 190 43.2% 20.1%
Contract Management 77 40.7% 8.7%
Program Compliance 118 35.9% 8.1%
Equipment Operation 21 32.8% 17.1%
Budget Analysis 42 30.9% 11.0%
Information Technology 1,404 30.1% 11.9%
Program Services Evaluator 2,396 25.4% 26.2%
Skilled Trades 75 24.6% 15.7%
Chaplain 29 24.1% 16.7%
Buyer/Procurement 171 24.0% 12.8%
Construction Inspection 18 23.3% 5.6%
Accounting 257 22.9% 12.9%
Environmental Program 159 22.9% 13.8%
Physical Plant 117 22.5% 11.2%
Public Health Sanitarian 21 22.3% 9.3%
Management Analyst 127 21.9% 8.0%
Supplies and Warehouse 34 21.6% 8.7%
Special Investigator 112 21.4% 19.9%
Human Services 1,058 20.2% 16.2%
Occupational Safety 27 19.7% 18.9%
Building Construction/Maintenance 108 19.5% 13.6%
Equipment Parts 22 19.1% 5.1%
Human Resources 177 19.0% 11.7%
Epidemiology 35 18.7% 38.1%
Community Corrections 132 17.8% 11.4%
Child Protective Services 1,274 16.9% 30.0%
Librarian 26 16.8% 23.3%
Park Ranger/Manager 188 16.7% 10.9%
Planner 70 14.2% 19.0%
10
Conclusion As evident in Figure 7, the market competitiveness of State salaries has fluctuated over the years. As the economy continues to improve at both the national and local levels, it is anticipated that voluntary separations will continue to increase driving an overall increase in turnover rates. Last year, recognizing the urgent need to address salaries, the Governor advocated the previously authorized 5% critical retention payments to eligible employees be converted to a base pay increase of 5%. This ensured a permanent increase in salaries for approximately half of the workforce and demonstrated a commitment to begin closing the gap between State salaries and the prevailing job market. This action reversed the trend of the previous five years. Moving forward, the State should continue to place a high priority on the importance of market competitiveness of salaries. The State is managing a smaller workforce and the demand for its services continues to increase. In order to meet this challenge, the State must attract highly qualified applicants and retain employees that demonstrate high performance and productivity. To reinforce the success of personnel reform and continue moving the State toward the future, a two-pronged approach will be necessary:
1) Address individual employee salaries through merit increases, providing high performing employees with merit increases to reach competitive salaries compared with the prevailing job market.
2) Manage the salary ranges of critical classifications, ensuring the range is based on market pricing of jobs, and providing market adjustments as necessary. The following classifications are recommended due to factors such as high profile, critical importance, distance from market and turnover:
Information Technology
Buyer/Procurement
Contract Management
Child Protective Services
11
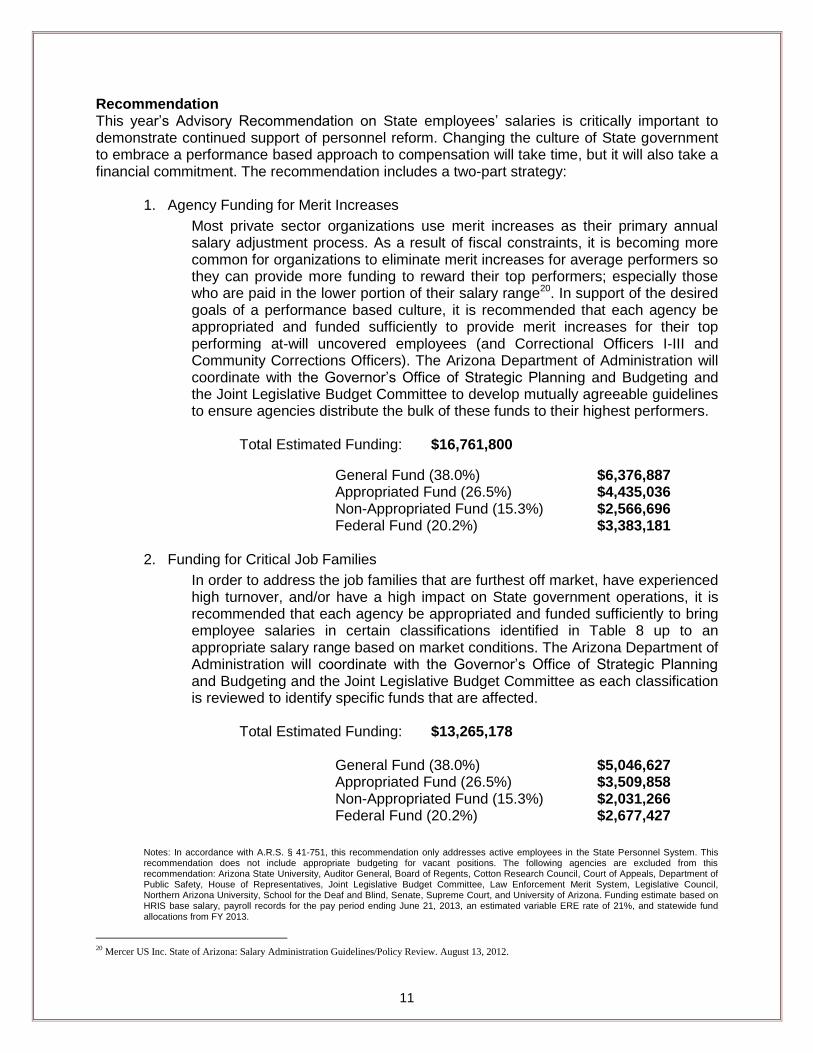
Recommendation This year’s Advisory Recommendation on State employees’ salaries is critically important to demonstrate continued support of personnel reform. Changing the culture of State government to embrace a performance based approach to compensation will take time, but it will also take a financial commitment. The recommendation includes a two-part strategy:
1. Agency Funding for Merit Increases
Most private sector organizations use merit increases as their primary annual salary adjustment process. As a result of fiscal constraints, it is becoming more common for organizations to eliminate merit increases for average performers so they can provide more funding to reward their top performers; especially those who are paid in the lower portion of their salary range20. In support of the desired goals of a performance based culture, it is recommended that each agency be appropriated and funded sufficiently to provide merit increases for their top performing at-will uncovered employees (and Correctional Officers I-III and Community Corrections Officers). The Arizona Department of Administration will coordinate with the Governor’s Office of Strategic Planning and Budgeting and the Joint Legislative Budget Committee to develop mutually agreeable guidelines to ensure agencies distribute the bulk of these funds to their highest performers.
Total Estimated Funding: $16,761,800
General Fund (38.0%) $6,376,887 Appropriated Fund (26.5%) $4,435,036 Non-Appropriated Fund (15.3%) $2,566,696 Federal Fund (20.2%) $3,383,181
2. Funding for Critical Job Families
In order to address the job families that are furthest off market, have experienced high turnover, and/or have a high impact on State government operations, it is recommended that each agency be appropriated and funded sufficiently to bring employee salaries in certain classifications identified in Table 8 up to an appropriate salary range based on market conditions. The Arizona Department of Administration will coordinate with the Governor’s Office of Strategic Planning and Budgeting and the Joint Legislative Budget Committee as each classification is reviewed to identify specific funds that are affected.
Total Estimated Funding: $13,265,178
General Fund (38.0%) $5,046,627 Appropriated Fund (26.5%) $3,509,858 Non-Appropriated Fund (15.3%) $2,031,266 Federal Fund (20.2%) $2,677,427
Notes: In accordance with A.R.S. § 41-751, this recommendation only addresses active employees in the State Personnel System. This recommendation does not include appropriate budgeting for vacant positions. The following agencies are excluded from this recommendation: Arizona State University, Auditor General, Board of Regents, Cotton Research Council, Court of Appeals, Department of Public Safety, House of Representatives, Joint Legislative Budget Committee, Law Enforcement Merit System, Legislative Council, Northern Arizona University, School for the Deaf and Blind, Senate, Supreme Court, and University of Arizona. Funding estimate based on HRIS base salary, payroll records for the pay period ending June 21, 2013, an estimated variable ERE rate of 21%, and statewide fund allocations from FY 2013.
20
Mercer US Inc. State of Arizona: Salary Administration Guidelines/Policy Review. August 13, 2012.