Embed Size (px)
Citation preview
Maine State LibraryDigital Maine
Transportation Documents Transportation
2-26-2016
Bridge-in-a-Backpack™ Task 4: Development ofImproved Arch Concrete Mix to Facilitate FieldUse, 2016Maine Transportation Research Division
Maine Department of Transportation
Keenan GoslinKleinschmidt Associates, [email protected]
Follow this and additional works at: https://digitalmaine.com/mdot_docs
This Text is brought to you for free and open access by the Transportation at Digital Maine. It has been accepted for inclusion in TransportationDocuments by an authorized administrator of Digital Maine. For more information, please contact [email protected].
Recommended CitationMaine Transportation Research Division; Maine Department of Transportation; and Goslin, Keenan, "Bridge-in-a-Backpack™ Task 4:Development of Improved Arch Concrete Mix to Facilitate Field Use, 2016" (2016). Transportation Documents. 109.https://digitalmaine.com/mdot_docs/109

. . . . . .. . . .
. . . . . . . . . .
Transportation Research Division
Technical Report 16-11
Bridge-in-a-Backpack™
Task 4: Development of Improved Arch Concrete Mix to Facilitate Field Use
16 State House Station Augusta, Maine 04333

Technical Report Documentation Page 1. Report No. 2. 3. Recipient’s Accession No.
ME 16-11
4. Title and Subtitle 5. Report Date
Bridge-in-a-BackpackTM Task 4: Development of Improved Arch Concrete Mix to Facilitate Field Use
February 2016
6.
7. Author(s) 8. Performing Organization Report No.
Keenan Goslin Josh Clapp
16-26-1023D
9. Performing Organization Name and Address 10. Project/Task/Work Unit No.
University of Maine Project 17891.00 11. Contract © or Grant (G) No.
Contract # 20111223*2878 12. Sponsoring Organization Name and Address 13. Type of Report and Period Covered
Maine Department of Transportation 16 State House Station Augusta, Maine 04333
14. Sponsoring Agency Code
15. Supplementary Notes
16. Abstract (Limit 200 words)
This report includes fulfillment of Task 4 of a multi-task contract to further enhance concrete filled FRP tubes, or the Bridge in a Backpack. Task 4 investigates the development of improved concrete mixes for filling the FRP tubes. One critical step in the construction of bridges using the Bridge-in-a-Backpack system is filling the hollow tubes with concrete. This step represents a small part of the construction process, but mistakes here can have a tremendous impact on construction schedule and project cost. Problems arising during concrete placement can include inadequate or slow arch filling due to impeded flow and segregation of the mix due to the inclusion of large amounts of superplasticizer. This may result in voids in the arch which must be addressed after the initial filling, changing the arch strength properties and slowing construction. The current mix also uses an expansive admixture to compensate for shrinkage and cause expansion of the concrete while curing. The amount of this additive necessary to ensure adequate arch structural performance is not precisely known. Presently this additive is proportioned according to recommendations from the supplier as well as test data showing positive expansion of the concrete after final set. The objective of this task is to provide AIT and the Department of Transportation with information that will allow them to make informed decisions about arch concrete specifications and bound mix parameters to ensure that concrete arriving on site will perform as expected. The results are highly variable and inconclusive. Additional testing with a larger sample size would be recommended if additional investigation into the bending strength of CFRP tubes filled with varying concrete mixes is of interest. However, it is important to note that while this research topic was of high interest when the project initiated, significant improvements have been realized in the mix design since then. These improvements have addressed the concerns that motivated this research, and a large number of CFFT arch bridges have been successfully constructed with SCC mixes that have performed well. 17. Document Analysis/Descriptors 18. Availability Statement
Concrete filled fiber reinforced polymer tubes, arch bridge, concrete mix
19. Security Class (this report) 20. Security Class (this page) 21. No. of Pages 22. Price
47
UMaine Advanced Structures and Composites Center Telephone: 207-581-2123 35 Flagstaff Rd FAX: 207-581-2074 University of Maine [email protected] Orono, ME 04469 www.composites.umaine.edu
Bridge-in-a-BackpackTM
Task 4: Development of Improved Arch Concrete Mix to Facilitate Field Use
Prepared for: Dale Peabody P.E.
Director Transportation Research Maine Dept. of Transportation
16 State House Station Augusta, ME 04333-0016
University of Maine’s Advanced Structures and Composites Center
Report Number: 16-26-1023D
February 25, 2016 Prepared by: Reviewed by:
Keenan Goslin P.E. Former Structural Engineer
Josh Clapp P.E. Research Engineer
This report shall not be reproduced, except in full, without the written approval of
University of Maine’s Advanced Structures and Composites Center.
An ISO 17025 accredited testing laboratory, accredited by the International Accreditation Service.

UMaine Composites Center Report 16-26-1023D
2
Table of Contents
SCC PARAMETRIC STUDY ................................................................................................................... 4 INTRODUCTION ......................................................................................................................................... 4 SELF-CONSOLIDATING CONCRETE ........................................................................................................... 4
Shrinkage Compensating Cements ....................................................................................................... 5 Fly Ash .................................................................................................................................................. 5 Mix Design ........................................................................................................................................... 6 Aggregates ............................................................................................................................................ 7 Cementitious Materials ........................................................................................................................ 7 Admixtures ............................................................................................................................................ 7 Mix Matrix ............................................................................................................................................ 7 Batching Method .................................................................................................................................. 8 Testing .................................................................................................................................................. 9
RESULTS .................................................................................................................................................. 13 CONCLUSIONS ......................................................................................................................................... 15 RECOMMENDATIONS FOR FUTURE STUDIES ........................................................................................... 16
Aggregate ........................................................................................................................................... 16 Slag ..................................................................................................................................................... 16
BEAM TESTING ...................................................................................................................................... 16 TEST PLAN AND SETUP ........................................................................................................................... 16 RESULTS .................................................................................................................................................. 18 CONCLUSIONS ......................................................................................................................................... 22
REFERENCES .......................................................................................................................................... 22
APPENDIX 1 – PRODUCT TECHNICAL DATA SHEETS ............................................................... 23
APPENDIX 2 – CONCRETE MIX WORKSHEETS ........................................................................... 24
UMaine Composites Center Report 16-26-1023D
3
List of Figures Figure 1 - Contributions of Mixing Water (Wang et al. 2003) ................................................. 6
Figure 2 - Influence of Fly Ash on Filling Water (Wang et al. 2003) ....................................... 6
Figure 3 - Guide to Determining VSI (Gallet 2009) ................................................................. 10
Figure 4 - Settlement Probe (Lange et al. 2008)) ...................................................................... 11
Figure 5 – Expansion Specimen Measurement in Comparator .............................................. 13
Figure 6 – Summary of Set Time Testing ................................................................................. 14
Figure 7 – Summary of Set Time Testing ................................................................................. 15
Figure 8 – Beam Test Layout ..................................................................................................... 17
Figure 9 – Beam Test Setup ....................................................................................................... 17
Figure 10 – Beam Static Test Results ........................................................................................ 19
Figure 11 – Class A_3? Load-Strain Data during Static Test to Failure ............................... 19
Figure 12 – SCC_3? Load-Strain Data during Fatigue Cycle in which Failure Occurred .. 19
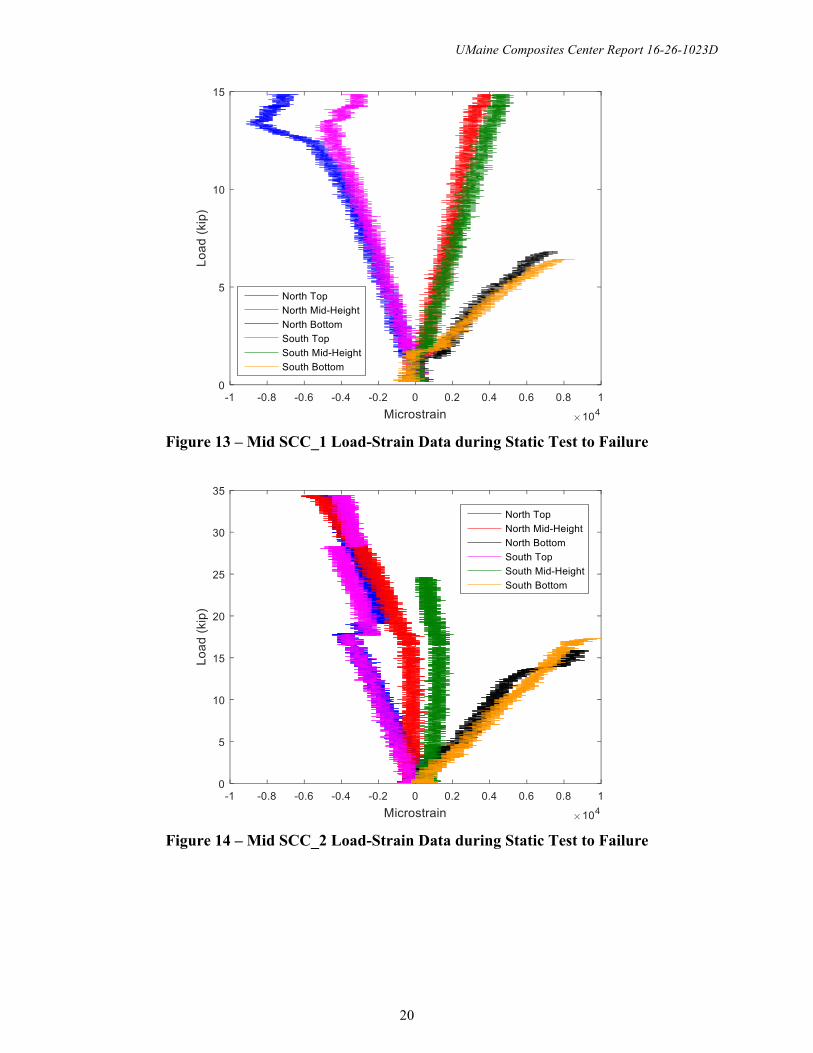
Figure 13 – Mid SCC_1 Load-Strain Data during Static Test to Failure .............................. 20
Figure 14 – Mid SCC_2 Load-Strain Data during Static Test to Failure .............................. 20
Figure 15 – Mid SCC_2 Load-Strain Data during Static Test to Failure .............................. 21
Figure 16 – Tensile Rupture of FRP near Midspan ................................................................. 21
Figure 17 – End of Specimen Class A_1 Post Test ................................................................... 22
Figure 18 – End of Specimen Class A_1 Post Test ................................................................... 22
List of Tables Table 1 - Baseline Mix Design ...................................................................................................... 6
Table 2 - VSI Criteria (Gallet 2009) ............................................................................................ 9
Table 3 - MSI Corresponding to Settlement Depth (Lange et al. 2008) ................................. 11
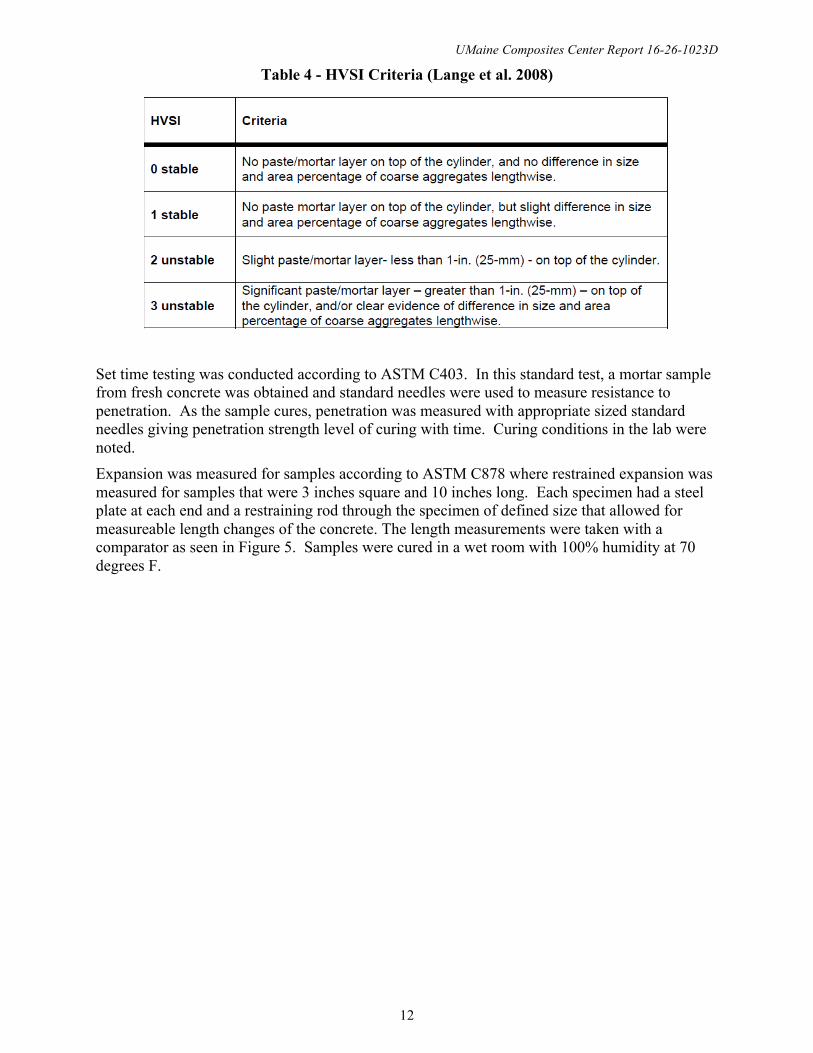
Table 4 - HVSI Criteria (Lange et al. 2008) ............................................................................. 12
Table 5 – Concrete Mixes used for Beam Testing .................................................................... 16
Table 6 – Summary of Beam Testing ........................................................................................ 18
UMaine Composites Center Report 16-26-1023D
4
SCC PARAMETRIC STUDY
INTRODUCTION One critical step in the construction of bridges using the Bridge-in-a-Backpack system is filling the hollow tubes with concrete. This step represents a small part of the construction process, but mistakes here can have a tremendous impact on construction schedule and project cost. Problems arising during concrete placement can include inadequate or slow arch filling due to impeded flow and segregation of the mix due to the inclusion of large amounts of superplasticizer. This may result in voids in the arch which must be addressed after the initial filling, changing the arch strength properties and slowing construction. The current mix also uses an expansive admixture to compensate for shrinkage and cause expansion of the concrete while curing. The amount of this additive necessary to ensure adequate arch structural performance is not precisely known. Presently this additive is proportioned according to recommendations from the supplier as well as test data showing positive expansion of the concrete after final set. The objective of this task is to provide AIT and the Department of Transportation with information that will allow them to make informed decisions about arch concrete specifications and bound mix parameters to ensure that concrete arriving on site will perform as expected.
SELF-CONSOLIDATING CONCRETE Self-consolidating concrete (SCC), also known as self-compacting concrete, is a type of high performance concrete that is designed to flow through formwork and compact itself without the need for external mechanical means (D’Ambrosia et al. 2007). SCC typically has more cementitious materials than ordinary concrete (OC). Aggregate type, size, proportions and gradations are very important for the performance of the mix. Typical SCC mixes have a water to cement (w/c) ratio of 0.41 with a low aggregate content. Smaller aggregate is more common with a tendency toward an increased percentage of fine aggregate for cohesiveness, uniformity and segregation resistance (D’Ambrosia et al. 2007). SCC allows for rapid placement, resulting in lower labor costs because external vibration is not needed. Due to SCC’s low flow resistance, it can be used to form complex shapes, or to flow through tight reinforcing configurations. In addition, since SCC can consolidate without external means, finishing and repair work is minimized due to the elimination of honeycombing and air voids. SCC mix designs can be complex and some mixes can be highly unstable in regards to segregation of the mortar and coarse aggregate. Another major problem with SCC is early age cracking due to shrinkage and creep (D’Ambrosia et al. 2007). Shrinkage includes external drying shrinkage, and internal drying (autogenous) shrinkage. External shrinkage can be minimized by proper curing. Internal shrinkage is the primary concern with SCC. As excess water evaporates from concrete, the volume of material decreases causing shrinkage. If the deformations are restrained, stresses build up and can cause cracking. Cracking reduces the durability of the concrete because cracks allow for water and chemicals to seep into the material causing further degradation or rusting of the reinforcing steel (D’Ambrosia et al. 2007). According to Flax (2012), the ideal w/c ratio for cement hydration is 0.25. Any water in excess of a 0.25 w/c ratio will eventually evaporate and shrinkage will occur. It is important to note that aggregates do not experience volume change and therefore all shrinkage is due to the cement paste.
Many admixtures are beneficial to SCC, especially superplasticizers and viscosity modifying admixtures (VMA). Superplasticizers are admixtures that improve the workability of plastic concrete, without the need for an increased water-cement ratio. Polycarboxylate superplasticizers, also known as “comb” polymers, allow for higher dosage rates without causing set retardation or excessive bleeding (D’Ambrosia et al. 2007). The use of polycarboxylate
UMaine Composites Center Report 16-26-1023D
5
superplasticizers allows plastic concrete to reach the high flow requirements of SCC. These high flow requirements can cause some SCC mixes to be highly susceptible to segregation. Viscosity modifying admixtures (VMAs) aid in the cohesiveness of the material so that at high flows the mix does not segregate.
SHRINKAGE COMPENSATING CEMENTS Shrinkage-compensating concrete is an expansive cement concrete which, when properly restrained by reinforcement or other means, will expand an amount equal to or slightly greater than the anticipated drying shrinkage (Mehta and Monteiro 2013). The magnitude of expansion is small, but can be enough to offset the tensile stresses caused by shrinkage (Mehta and Monteiro 2013). There are four types of expansive cements: M, S, O, and K. Type K, a modified Portland cement clinker, was used for this project. Expansive cements cause expansion by forming additional ettringite in concrete. Due to the water imbibing properties of ettringite, expansive cements may require 10% more water than non-expansive cements (Mehta and Monteiro 2013). Ettringite may result in shorter set times and is prone to rapid slump loss, but produces a more cohesive and workable mix than normal cement (Mehta and Monteiro 2013). To assure adequate expansion and restraint when Type K cement is being used, it is recommended to have a minimum cement content of 515 lb/yd3 (305 kg/m3) concrete with a minimum 0.15 percent reinforcement (Mehta and Monteiro 2013). In his webinar, Dave Flax (Flax 2012) explained that most properties of a given mix design do not change with the use of shrinkage compensating cements. These properties include compressive strength, flexural strength, tensile strength, elastic modulus, freeze/thaw resistance, creep, coefficient of thermal expansion, sulfate resistance, and more. It is important to note that using calcium chloride, excessive fly ash, other pozzolans, or some water reducing agents can result in an imbalance between the rate of strength gain and the rate of ettrignite formation, which can lead to less expansion than expected (Mehta and Monteiro 2013). If using any of these additives, it is important to test strength and expansion properties. FLY ASH Wang et al. (2003) reported many characteristics of fly ash that indicate that it may be desirable in SCC mixes to maintain cohesiveness and flowability. In general, the use of fly ash can produce a more fluid mix without the need for excess water. The fly ash acts like a lubricant so that particles can flow easily without increasing the w/c ratio. One way that fly ash contributes to the flowability of the mix is through the water that is adsorbed onto fly ash particles (Figure 1). Wang explains that the water in the mix can be classified into three categories, filler water, adsorpted layer water and free layer water, as shown in Figure 1. Filler water does not separate particles; it is the water that fills the voids between particles of the concrete mix. Adsorpted layer water is the layer of water adsorbed to the surface of the particles. The adsorpted layer does not help flowability because it stays in direct contact with the particle and moves with the particle. The adsorpted layer behaves like a solid and therefore does not contribute to the fluidity of the mix. The free layer water is the layer that is the key contributor to flowability. The free layer is on the surface of the particle, but not adhered to the surface, therefore it acts as a lubricant and aids in the fluidity of the mixture. The amount of filling water in the mix depends on the mix proportions and the amount of voids present between solid particles. The adsorpted layer is dependent on the specific surface of the particle and its affinity for water. The free layer water depends on the amount of free water available and the specific surface of the particle. To produce a more fluid mix, the free layer water should be maximized (Wang et al. 2003).

UMaine Composites Center Report 16-26-1023D
6
Figure 1 - Contributions of Mixing Water (Wang et al. 2003)
Fly ash is better at producing a more fluid mix than cement because fly ash particles are smaller in size, but have a greater specific surface, resulting in more free layer water (Wang et al. 2003). Since fly ash particles are smaller than cement particles, fly ash particles can fill in voids that would otherwise be filled with filling water, which results in less filling water and more free layer water (Wang et al. 2003). Figure 2 compares the amount of filling water based on fly ash content.
Figure 2 - Influence of Fly Ash on Filling Water (Wang et al. 2003)
It is important to note the difference between milling fly ash and separating fly ash. Both products have similar size and specific surface, but milling fly ash particles are broken into irregular shaped particles, whereas separating fly ash particles are more spherical (Wang et al. 2003). Because of the shape of the particles, milling fly ash does not reduce the water demand for the mix (Wang et al. 2003). If mix lubrication is the purpose for using fly ash, separating fly ash should be used. MIX DESIGN
The baseline mix design, shown in Table 1, used in this study was based on the mix design used on the Caribou Connector project in 2011.
Table 1 - Baseline Mix Design
Constituent Quantity per Cubic Foot
UMaine Composites Center Report 16-26-1023D
7
Cement (lbs.) 32
Komponent (lbs.) 5.8
Water (lbs.) As needed for desired w/c
Fine Aggregate (lbs.) 70.4
3/8” Coarse Aggregate (lbs.)
53.8
ADVA 405 (mL) As needed for desired slump flow
AGGREGATES A 3/8” pea stone gravel was used for coarse aggregate and sand was used for fine aggregate. It is important to note that the 3/8” gravel particles are smooth and rounded. If a more angular material, such as crushed ledge, is used the material may not flow as well and may be more prone to segregation. In order to accurately account for all water in the mix, aggregates were dried in a kiln. The absorption capacity (AC) of the aggregate was calculated and the water content of the mix was adjusted to compensate for the water absorbed by the aggregate. The AC was 0.69% and 2.3% for the fine and coarse aggregates, respectively. CEMENTITIOUS MATERIALS
Cementitious materials used included cement, CTS Komponent, and fly ash. The cement used was type I/II cement supplied by Dragon Products Company. Fifteen percent of the total cementitious material consisted of CTS Komponent. Komponent is a Type K, shrinkage compensating cement. See Appendix 1 for the Komponent technical guide. Avoiding shrinkage is important to the project because the concrete must remain in contact with the FRP tubes. If the concrete shrinks, it may pull away from the tubes and may result in a lack of composite action between the tubes and the concrete. As detailed in the subsequent description of the mix matrix, some mixes included Type F fly ash. Mixes consisted of zero, ten, twenty, or thirty percent fly ash. The percentage of fly ash was based on the percent of cement replaced by fly ash, not on the total cementitious material (i.e. Komponent was excluded). ADMIXTURES
ADVA 405 by Grace combines the advantages of both a superplasticizer, for flowability, and a VMA, for cohesiveness, in one chemical and was used in all mixes for this project. ADVA 405 was chosen after discussion with a Grace representative regarding desirable performance characteristics. ADVA 405 was selected to minimize variables in the mix and avoid the use of two separate chemicals that potentially may work against one another. See Appendix 1 for the ADVA 405 technical guide.
MIX MATRIX From the mix design in Table 1, a mix matrix was created to determine the quantity of ADVA 405 required to produce a target spread diameter of 27” while also investigating the stability of the mix. For each w/c ratio of 0.37, 0.41, 0.42, 0.43, 0.44, and 0.45, up to four different mixes were evaluated, one with no fly ash, and the others with 10%, 20%, or 30% fly ash. The following designation was adopted for the specimens: X-Y, where X is the percentage of fly ash
UMaine Composites Center Report 16-26-1023D
8
and Y is the w/c ratio. For example, 20-0.41 indicates 20% fly ash and a w/c of 0.41. The quantities of fine aggregate, coarse aggregate, and Komponent remained constant for all mixes.
BATCHING METHOD Each mix was batched in the following manner:
1. Add Komponent and water to mixer and allow to mix to create slurry 2. Add cement and fly ash (if using) 3. Add aggregates 4. Add ADVA 405 5. Allow to mix until concrete looks consistent (5-10 minutes)
Each mix was batched in this manner because concrete delivered to the Caribou Connector project was consistently clumpy due to the expansive agent. The concrete supplier found that when constituents were added in the order above, the clumping was eliminated. The ADVA 405 was added incrementally until the mix appeared (in the drum) to have a 27” slump flow. Once confident that the appropriate amount of ADVA 405 was added, a slump flow test was performed. If a 27” slump flow was not achieved, the batch was discarded and re-created. Concrete could not be reused because the slightest loss of cement paste on the slump board greatly affected the performance of the mix in subsequent tests.
UMaine Composites Center Report 16-26-1023D
9
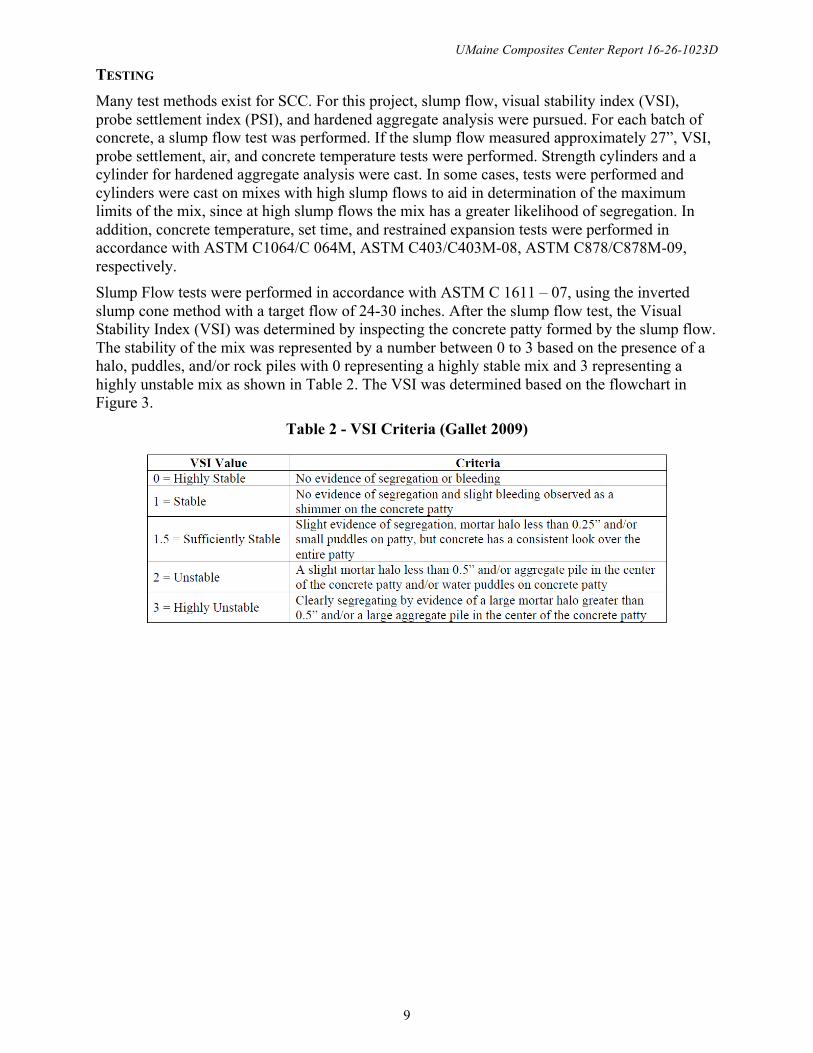
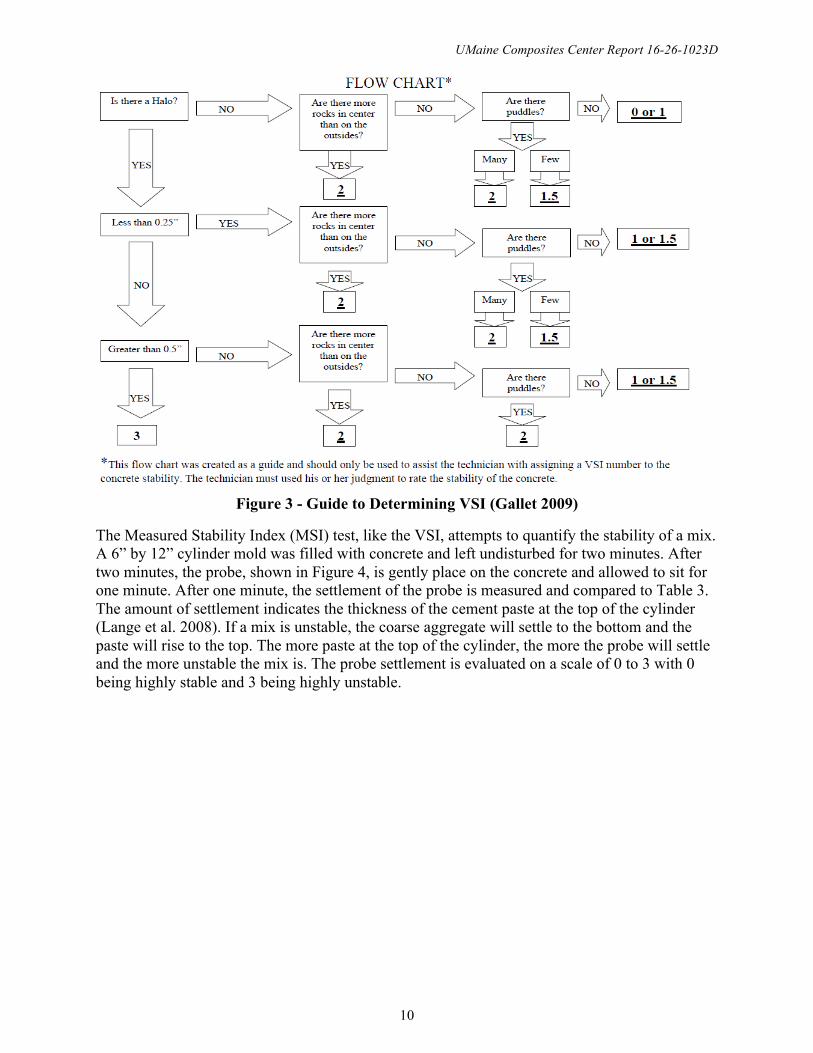
TESTING Many test methods exist for SCC. For this project, slump flow, visual stability index (VSI), probe settlement index (PSI), and hardened aggregate analysis were pursued. For each batch of concrete, a slump flow test was performed. If the slump flow measured approximately 27”, VSI, probe settlement, air, and concrete temperature tests were performed. Strength cylinders and a cylinder for hardened aggregate analysis were cast. In some cases, tests were performed and cylinders were cast on mixes with high slump flows to aid in determination of the maximum limits of the mix, since at high slump flows the mix has a greater likelihood of segregation. In addition, concrete temperature, set time, and restrained expansion tests were performed in accordance with ASTM C1064/C 064M, ASTM C403/C403M-08, ASTM C878/C878M-09, respectively. Slump Flow tests were performed in accordance with ASTM C 1611 – 07, using the inverted slump cone method with a target flow of 24-30 inches. After the slump flow test, the Visual Stability Index (VSI) was determined by inspecting the concrete patty formed by the slump flow. The stability of the mix was represented by a number between 0 to 3 based on the presence of a halo, puddles, and/or rock piles with 0 representing a highly stable mix and 3 representing a highly unstable mix as shown in Table 2. The VSI was determined based on the flowchart in Figure 3.
Table 2 - VSI Criteria (Gallet 2009)
UMaine Composites Center Report 16-26-1023D
10
Figure 3 - Guide to Determining VSI (Gallet 2009)
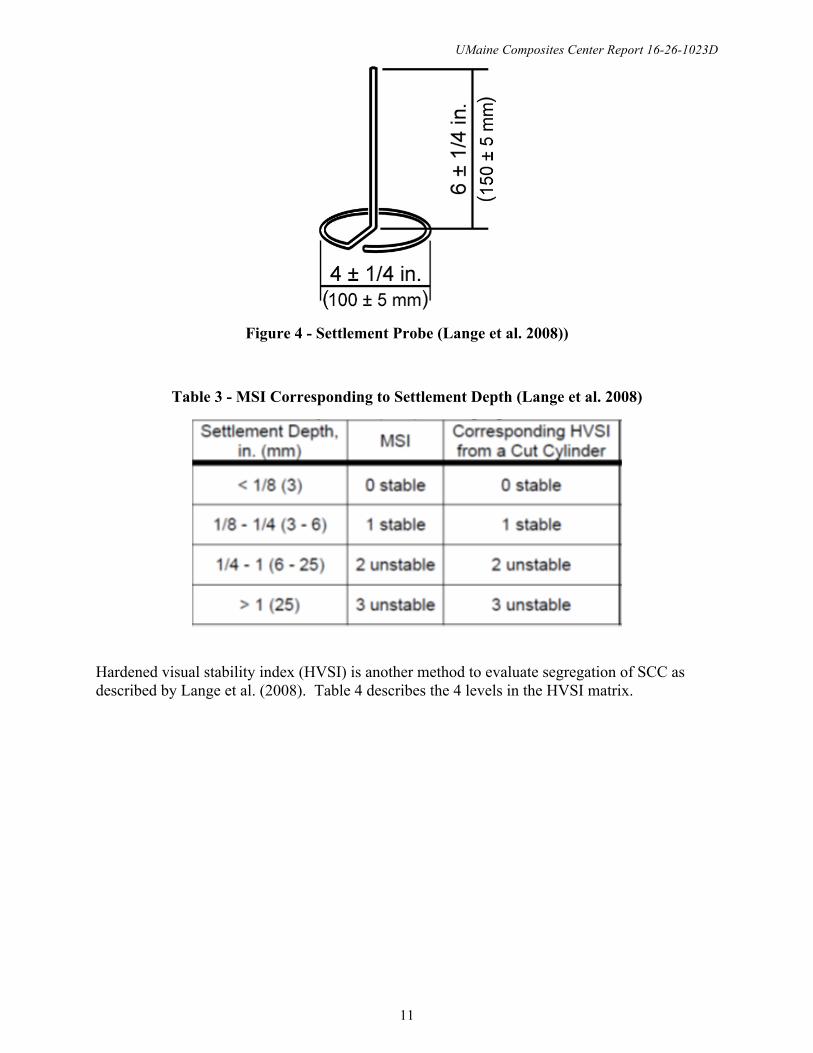
The Measured Stability Index (MSI) test, like the VSI, attempts to quantify the stability of a mix. A 6” by 12” cylinder mold was filled with concrete and left undisturbed for two minutes. After two minutes, the probe, shown in Figure 4, is gently place on the concrete and allowed to sit for one minute. After one minute, the settlement of the probe is measured and compared to Table 3. The amount of settlement indicates the thickness of the cement paste at the top of the cylinder (Lange et al. 2008). If a mix is unstable, the coarse aggregate will settle to the bottom and the paste will rise to the top. The more paste at the top of the cylinder, the more the probe will settle and the more unstable the mix is. The probe settlement is evaluated on a scale of 0 to 3 with 0 being highly stable and 3 being highly unstable.
UMaine Composites Center Report 16-26-1023D
11
Figure 4 - Settlement Probe (Lange et al. 2008))
Table 3 - MSI Corresponding to Settlement Depth (Lange et al. 2008)
Hardened visual stability index (HVSI) is another method to evaluate segregation of SCC as described by Lange et al. (2008). Table 4 describes the 4 levels in the HVSI matrix.
UMaine Composites Center Report 16-26-1023D
12
Table 4 - HVSI Criteria (Lange et al. 2008)
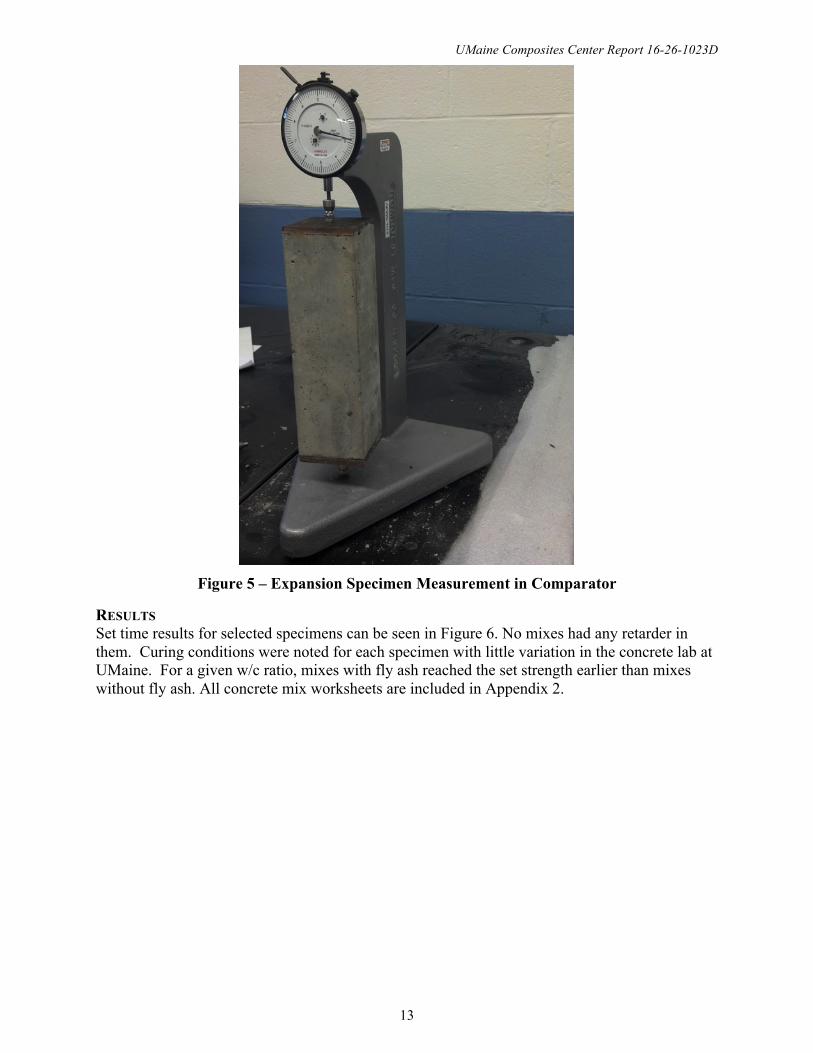
Set time testing was conducted according to ASTM C403. In this standard test, a mortar sample from fresh concrete was obtained and standard needles were used to measure resistance to penetration. As the sample cures, penetration was measured with appropriate sized standard needles giving penetration strength level of curing with time. Curing conditions in the lab were noted. Expansion was measured for samples according to ASTM C878 where restrained expansion was measured for samples that were 3 inches square and 10 inches long. Each specimen had a steel plate at each end and a restraining rod through the specimen of defined size that allowed for measureable length changes of the concrete. The length measurements were taken with a comparator as seen in Figure 5. Samples were cured in a wet room with 100% humidity at 70 degrees F.
UMaine Composites Center Report 16-26-1023D
13
Figure 5 – Expansion Specimen Measurement in Comparator
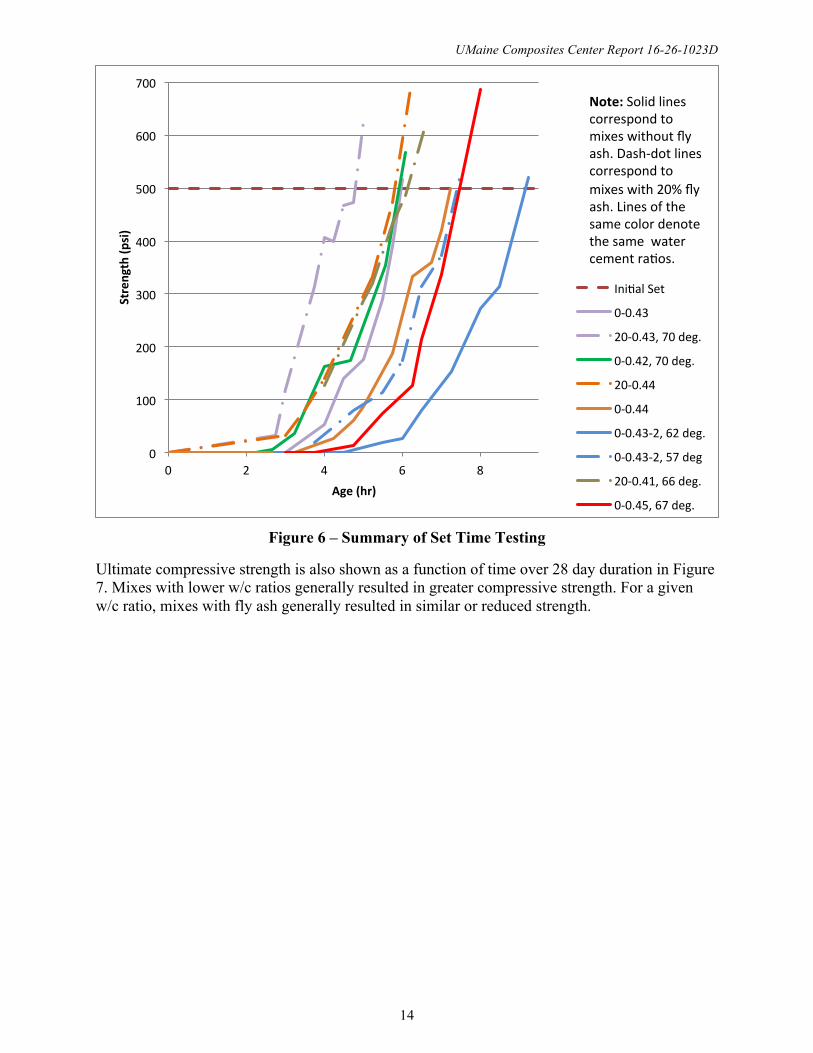
RESULTS Set time results for selected specimens can be seen in Figure 6. No mixes had any retarder in them. Curing conditions were noted for each specimen with little variation in the concrete lab at UMaine. For a given w/c ratio, mixes with fly ash reached the set strength earlier than mixes without fly ash. All concrete mix worksheets are included in Appendix 2.
UMaine Composites Center Report 16-26-1023D
14
Figure 6 – Summary of Set Time Testing
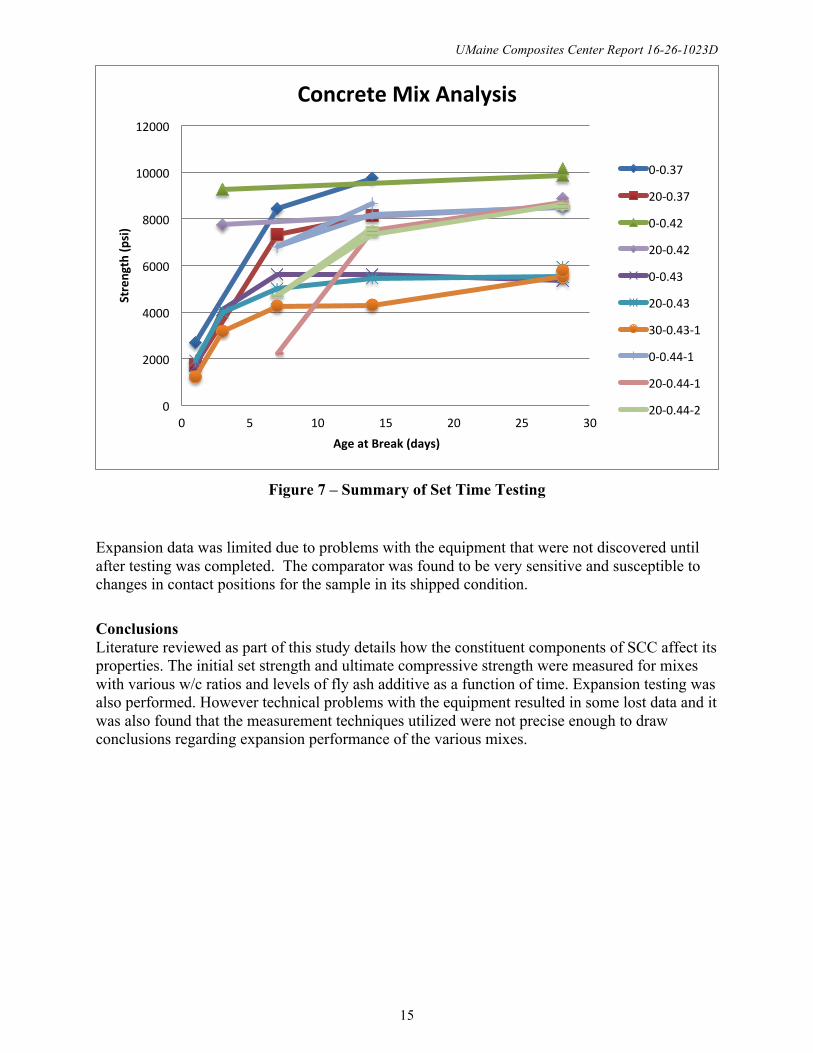
Ultimate compressive strength is also shown as a function of time over 28 day duration in Figure 7. Mixes with lower w/c ratios generally resulted in greater compressive strength. For a given w/c ratio, mixes with fly ash generally resulted in similar or reduced strength.
0
100
200
300
400
500
600
700
0 2 4 6 8
Strength(p
si)
Age(hr)
Ini.alSet
0-0.43
20-0.43,70deg.
0-0.42,70deg.
20-0.44
0-0.44
0-0.43-2,62deg.
0-0.43-2,57deg
20-0.41,66deg.
0-0.45,67deg.
Note:Solidlinescorrespondtomixeswithoutflyash.Dash-dotlinescorrespondtomixeswith20%flyash.Linesofthesamecolordenotethesamewatercementra.os.
UMaine Composites Center Report 16-26-1023D
15
Figure 7 – Summary of Set Time Testing
Expansion data was limited due to problems with the equipment that were not discovered until after testing was completed. The comparator was found to be very sensitive and susceptible to changes in contact positions for the sample in its shipped condition.
Conclusions Literature reviewed as part of this study details how the constituent components of SCC affect its properties. The initial set strength and ultimate compressive strength were measured for mixes with various w/c ratios and levels of fly ash additive as a function of time. Expansion testing was also performed. However technical problems with the equipment resulted in some lost data and it was also found that the measurement techniques utilized were not precise enough to draw conclusions regarding expansion performance of the various mixes.
0
2000
4000
6000
8000
10000
12000
0 5 10 15 20 25 30
Strength(p
si)
AgeatBreak(days)
ConcreteMixAnalysis
0-0.37
20-0.37
0-0.42
20-0.42
0-0.43
20-0.43
30-0.43-1
0-0.44-1
20-0.44-1
20-0.44-2
UMaine Composites Center Report 16-26-1023D
16
RECOMMENDATIONS FOR FUTURE STUDIES
AGGREGATE Flax (2012) pointed out that by minimizing the cement paste, shrinkage can also be minimized. He explained that using more and larger coarse aggregate means less surface area and less void space to fill, which means the mix will require less paste. Less paste means less cement and less water. By reducing the water, there will be less excess water in the mix, which will result in less shrinkage because there is less excess water available to evaporate. Although Flax’s recommendations were based on ordinary concrete, the same principles can be applied to SCC. Since flowability is of high importance in SCC, there will be limits as to how much larger and how much more coarse aggregate can be added to the mix while maintaining appropriate flowability. Since composite action between the FRP tubes and the concrete is critical to the arch structures, it may be useful to look into adding larger aggregate to the mix. If larger aggregate is used, less paste will be required by the mix, which means less shrinkage and less need for a shrinkage compensating admixture. Minimizing the shrinkage compensating admixture will greatly reduce the cost of the mix.
SLAG Due to the scope and budget of this project, the addition of slag to SCC was not tested. It is expected that slag will perform similarly to fly ash, although the quantities required will probably differ. Future studies of the effect of slag on the rheology of the mix would be useful.
BEAM TESTING
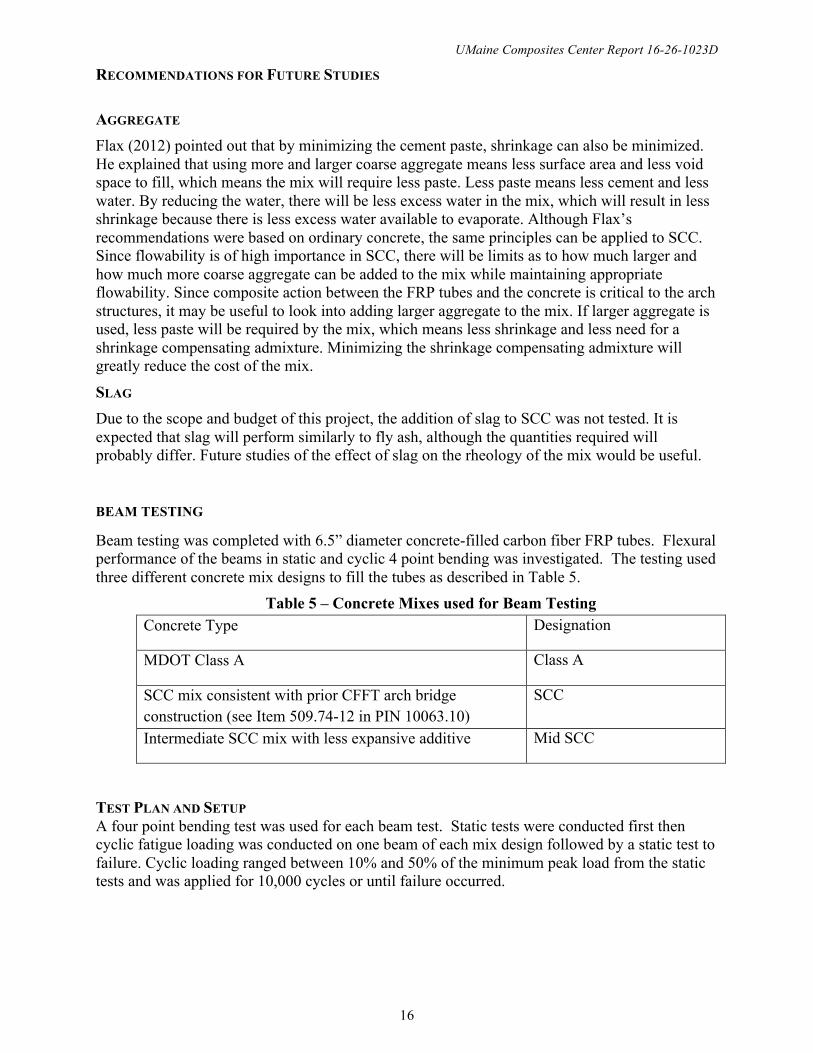
Beam testing was completed with 6.5” diameter concrete-filled carbon fiber FRP tubes. Flexural performance of the beams in static and cyclic 4 point bending was investigated. The testing used three different concrete mix designs to fill the tubes as described in Table 5.
Table 5 – Concrete Mixes used for Beam Testing Concrete Type Designation
MDOT Class A Class A
SCC mix consistent with prior CFFT arch bridge construction (see Item 509.74-12 in PIN 10063.10)
SCC
Intermediate SCC mix with less expansive additive Mid SCC
TEST PLAN AND SETUP A four point bending test was used for each beam test. Static tests were conducted first then cyclic fatigue loading was conducted on one beam of each mix design followed by a static test to failure. Cyclic loading ranged between 10% and 50% of the minimum peak load from the static tests and was applied for 10,000 cycles or until failure occurred.
UMaine Composites Center Report 16-26-1023D
17
Figure 8 – Beam Test Layout
The test setup can also be seen in Figure 9 with roller supports and instrumentation.
Figure 9 – Beam Test Setup
UMaine Composites Center Report 16-26-1023D
18
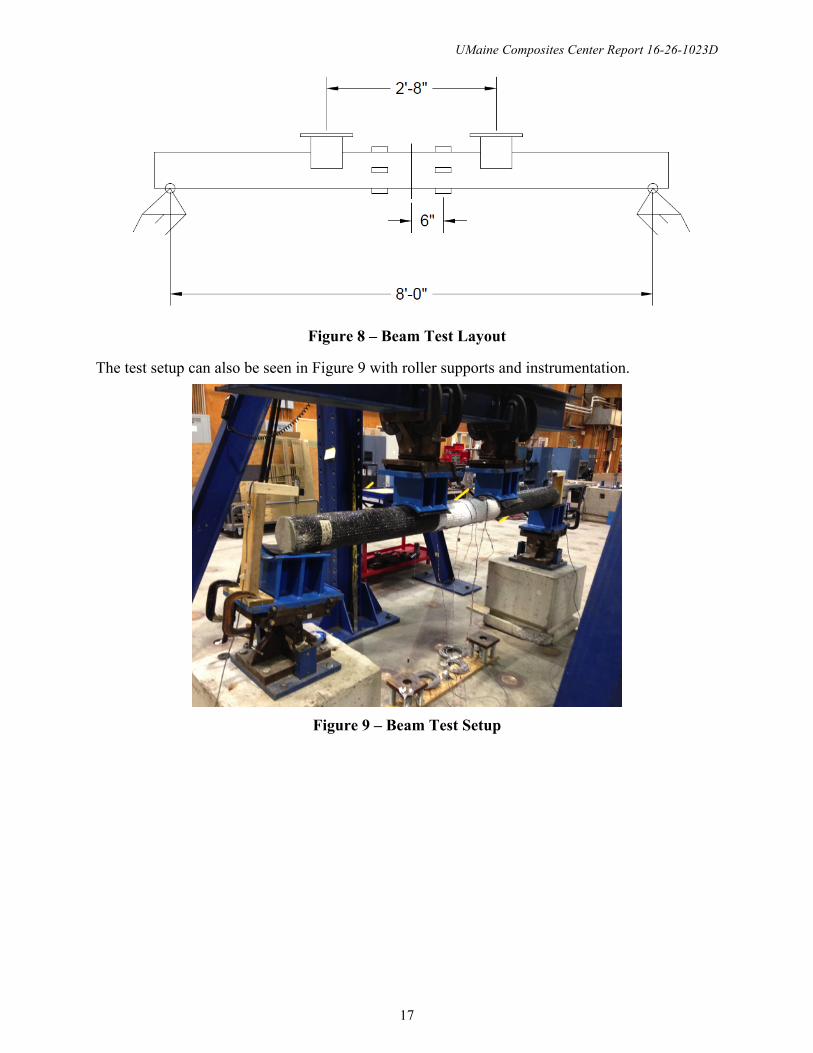
RESULTS Beam tests results are summarized in Table 6 where static and fatigue tested beams are compared. It should be noted that the tubes with Class A and SCC mixes that were subjected to cyclic loading were not labeled and therefore it was not possible to definitively identify them. Cyclic loading was performed over the range of loads of 1500 lbf (positive bending) to 7500 lbf (positive bending). The tube that failed during cyclic loading was at a load of about 7000 lbf when failure occurred. Load-displacement relationships are shown in Figure 10 for all of the beams with available data sets.
Table 6 – Summary of Beam Testing
Peak Load (kip)
Moment (kip-in)
Cure Time (days)
Number of Cycles at 50% Min
Static Load
Class A_1 19.12 306.0 129 N/A
Class A_2 18.51 296.1 129 N/A
SCC_1 18.37 293.9 108 N/A
SCC_2 15.09 241.5 108 N/A
Mid SCC_1 14.85 237.6 >400 N/A
Mid SCC_2 34.38 550.1 >400 N/A
Class A_3? 13.42 214.7 >400 10,000
SCC_3? N/A N/A >400 289
Mid SCC_3 32.60 521.6 >400 10,000
UMaine Composites Center Report 16-26-1023D
19
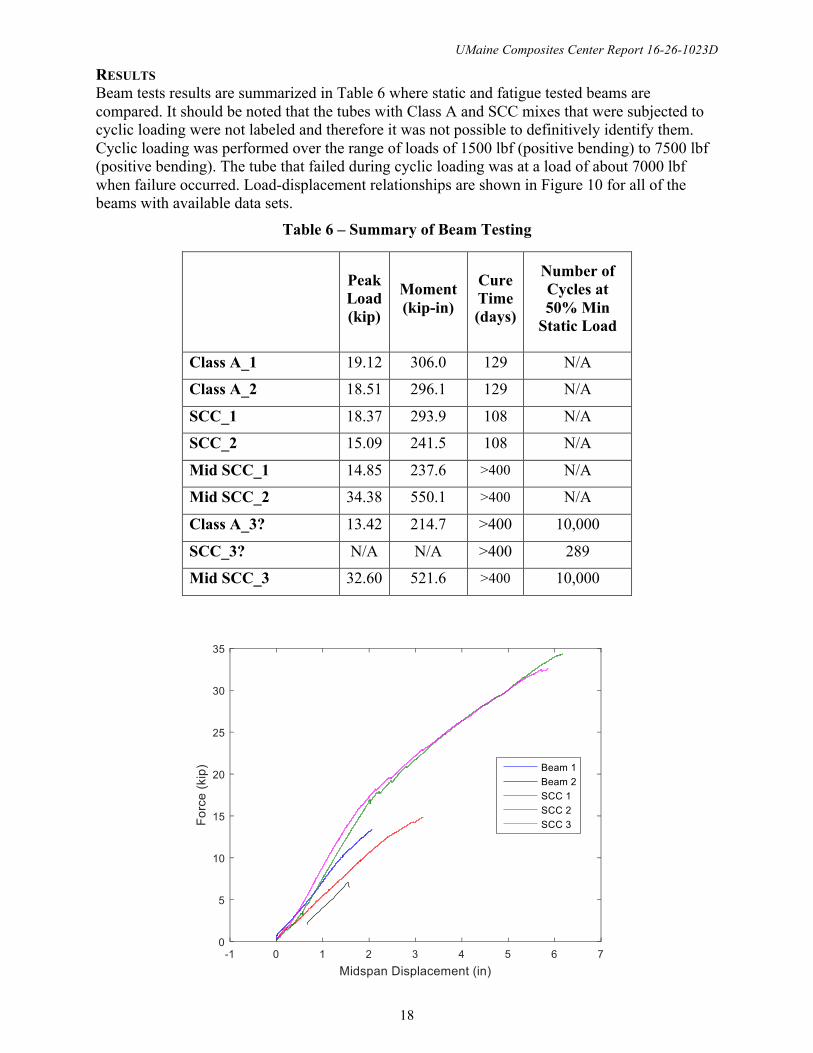
Figure 10 – Beam Static Test Results
Figure 11 – Class A_3? Load-Strain Data during Static Test to Failure
Figure 12 – SCC_3? Load-Strain Data during Fatigue Cycle in which Failure Occurred
UMaine Composites Center Report 16-26-1023D
20
Figure 13 – Mid SCC_1 Load-Strain Data during Static Test to Failure
Figure 14 – Mid SCC_2 Load-Strain Data during Static Test to Failure

UMaine Composites Center Report 16-26-1023D
21
Figure 15 – Mid SCC_2 Load-Strain Data during Static Test to Failure
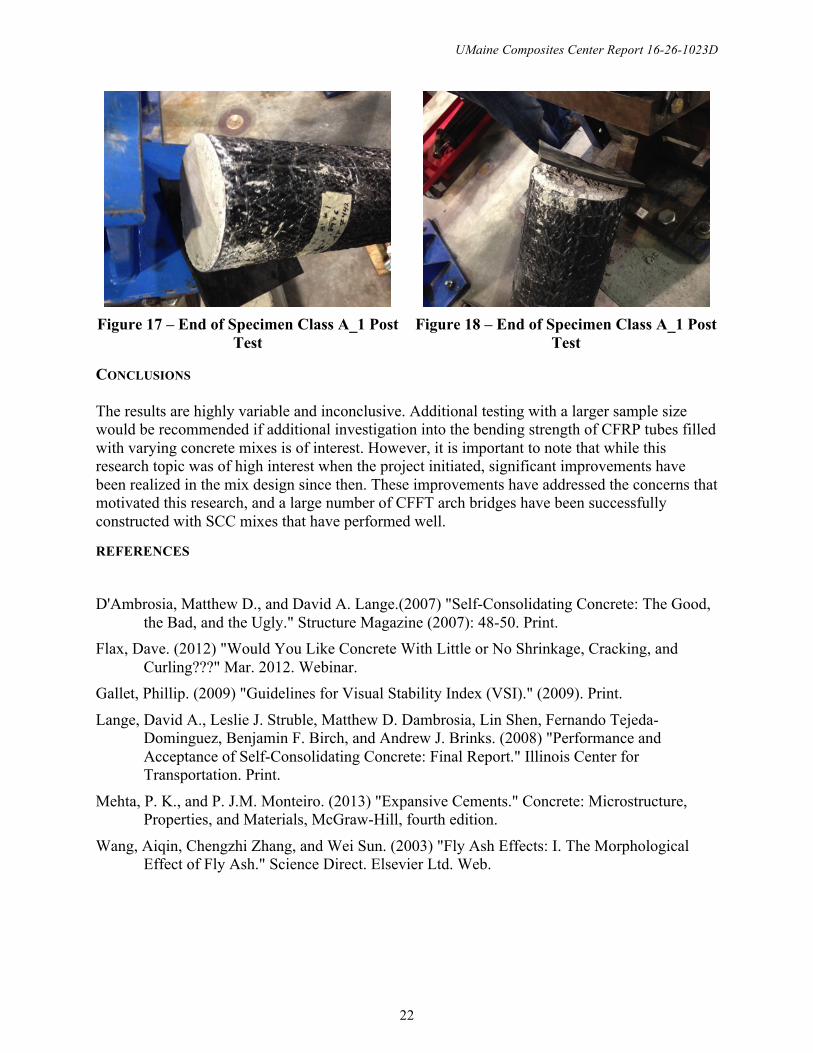
Static tests were conducted on July 16-17, 2014 and May 26-28, 2015. All beams failed in tensile rupture of the FRP laminate near midspan as seen in Figure 16. No loss of composite action was seen with any static test specimen as shown by there being no separation of the concrete core and shell at either end of the beams at failure. This can be seen in Specimen Class A_1 in Figure 17 and Figure 18.
Figure 16 – Tensile Rupture of FRP near Midspan
UMaine Composites Center Report 16-26-1023D
22
Figure 17 – End of Specimen Class A_1 Post
Test
Figure 18 – End of Specimen Class A_1 Post
Test
CONCLUSIONS The results are highly variable and inconclusive. Additional testing with a larger sample size would be recommended if additional investigation into the bending strength of CFRP tubes filled with varying concrete mixes is of interest. However, it is important to note that while this research topic was of high interest when the project initiated, significant improvements have been realized in the mix design since then. These improvements have addressed the concerns that motivated this research, and a large number of CFFT arch bridges have been successfully constructed with SCC mixes that have performed well.
REFERENCES
D'Ambrosia, Matthew D., and David A. Lange.(2007) "Self-Consolidating Concrete: The Good, the Bad, and the Ugly." Structure Magazine (2007): 48-50. Print.
Flax, Dave. (2012) "Would You Like Concrete With Little or No Shrinkage, Cracking, and Curling???" Mar. 2012. Webinar.
Gallet, Phillip. (2009) "Guidelines for Visual Stability Index (VSI)." (2009). Print.
Lange, David A., Leslie J. Struble, Matthew D. Dambrosia, Lin Shen, Fernando Tejeda-Dominguez, Benjamin F. Birch, and Andrew J. Brinks. (2008) "Performance and Acceptance of Self-Consolidating Concrete: Final Report." Illinois Center for Transportation. Print.
Mehta, P. K., and P. J.M. Monteiro. (2013) "Expansive Cements." Concrete: Microstructure, Properties, and Materials, McGraw-Hill, fourth edition.
Wang, Aiqin, Chengzhi Zhang, and Wei Sun. (2003) "Fly Ash Effects: I. The Morphological Effect of Fly Ash." Science Direct. Elsevier Ltd. Web.

UMaine Composites Center Report 16-26-1023D
23
APPENDIX 1 – PRODUCT TECHNICAL DATA SHEETS
Grace ADVA 405 Technical Guide:
https://gcpat.com/construction/en-us/Documents/DC-62A.pdf
Komponent Technical Guide: http://www.ctscement.com/wp-content/uploads/2014/02/KOMPONENT_Datasheet_DS_062_EN_6.pdf

UMaine Composites Center Report 16-26-1023D
24
APPENDIX 2 – CONCRETE MIX WORKSHEETS
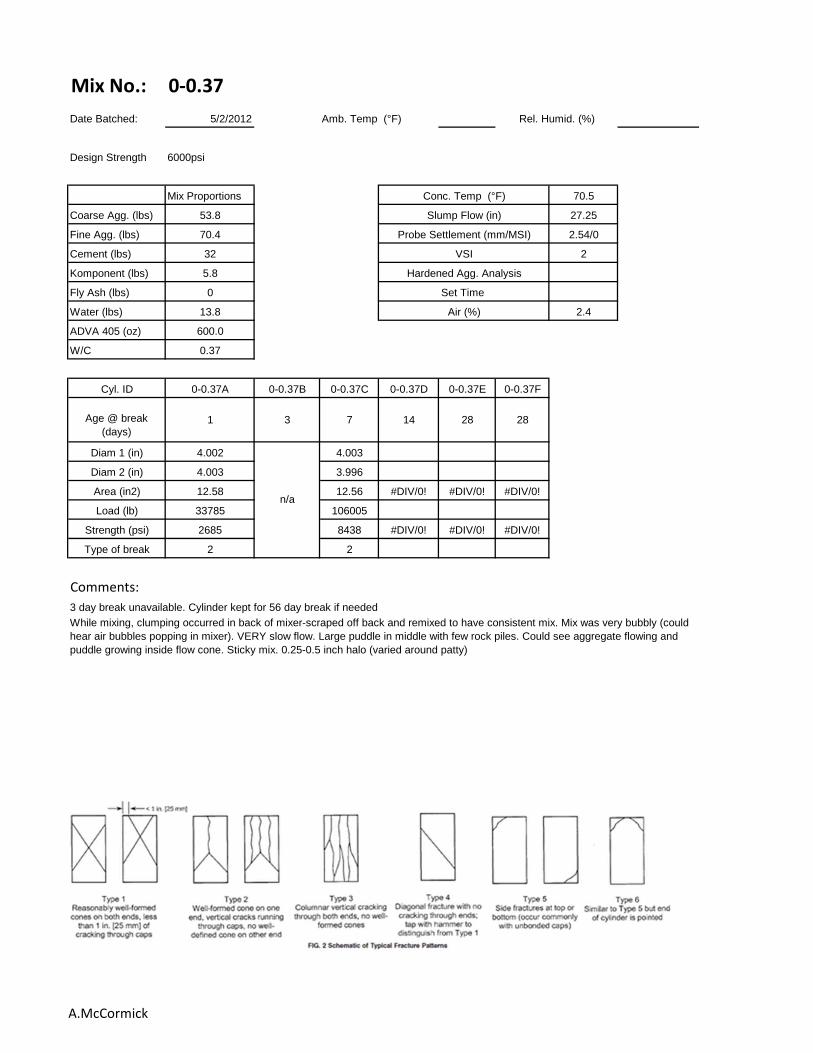
Mix No.: 0‐0.37
Date Batched: 5/2/2012 Amb. Temp (°F)
Design Strength 6000psi
Mix Proportions 70.5
Coarse Agg. (lbs) 53.8 27.25
Fine Agg. (lbs) 70.4 2.54/0
Cement (lbs) 32 2
Komponent (lbs) 5.8
Fly Ash (lbs) 0
Water (lbs) 13.8 2.4
ADVA 405 (oz) 600.0
W/C 0.37
Cyl. ID 0-0.37A 0-0.37B 0-0.37C 0-0.37D 0-0.37E 0-0.37F
Age @ break (days)
1 3 7 14 28 28
Diam 1 (in) 4.002 4.003
Diam 2 (in) 4.003 3.996
Area (in2) 12.58 12.56 #DIV/0! #DIV/0! #DIV/0!
Load (lb) 33785 106005
Strength (psi) 2685 8438 #DIV/0! #DIV/0! #DIV/0!
Type of break 2 2
Comments:
Rel. Humid. (%)
Conc. Temp (°F)
Slump Flow (in)
Probe Settlement (mm/MSI)
VSI
Hardened Agg. Analysis
Set Time
Air (%)
While mixing, clumping occurred in back of mixer-scraped off back and remixed to have consistent mix. Mix was very bubbly (could hear air bubbles popping in mixer). VERY slow flow. Large puddle in middle with few rock piles. Could see aggregate flowing and puddle growing inside flow cone. Sticky mix. 0.25-0.5 inch halo (varied around patty)
n/a
3 day break unavailable. Cylinder kept for 56 day break if needed
A.McCormick
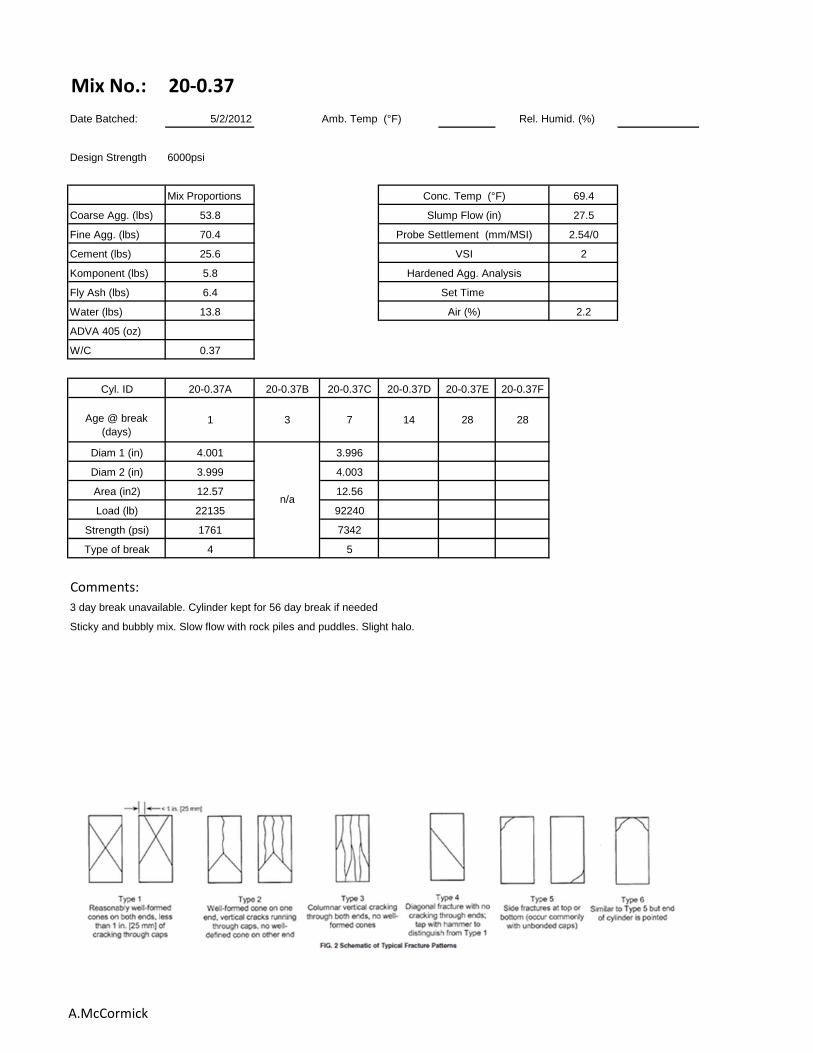
Mix No.: 20‐0.37
Date Batched: 5/2/2012 Amb. Temp (°F)
Design Strength 6000psi
Mix Proportions 69.4
Coarse Agg. (lbs) 53.8 27.5
Fine Agg. (lbs) 70.4 2.54/0
Cement (lbs) 25.6 2
Komponent (lbs) 5.8
Fly Ash (lbs) 6.4
Water (lbs) 13.8 2.2
ADVA 405 (oz)
W/C 0.37
Cyl. ID 20-0.37A 20-0.37B 20-0.37C 20-0.37D 20-0.37E 20-0.37F
Age @ break (days)
1 3 7 14 28 28
Diam 1 (in) 4.001 3.996
Diam 2 (in) 3.999 4.003
Area (in2) 12.57 12.56
Load (lb) 22135 92240
Strength (psi) 1761 7342
Type of break 4 5
Comments:
Rel. Humid. (%)
Conc. Temp (°F)
Slump Flow (in)
Probe Settlement (mm/MSI)
VSI
Hardened Agg. Analysis
Set Time
Air (%)
Sticky and bubbly mix. Slow flow with rock piles and puddles. Slight halo.
n/a
3 day break unavailable. Cylinder kept for 56 day break if needed
A.McCormick

Mix No.: 30‐0.37
Date Batched: Amb. Temp (°F)
Design Strength 6000psi
Mix Proportions
Coarse Agg. (lbs) 53.8
Fine Agg. (lbs) 70.4
Cement (lbs) 22.4
Komponent (lbs) 5.8
Fly Ash (lbs) 9.6
Water (lbs) 13.8
ADVA 405 (oz)
W/C 0.37
Cyl. ID 30-0.37A 30-0.37B 30-0.37C 30-0.37D 30-0.37E 30-0.37F
Age @ break (days)
1 3 7 14 28 28
Diam 1 (in)
Diam 2 (in)
Area (in2)
Load (lb)
Strength (psi)
Type of break
Comments:
Rel. Humid. (%)
Conc. Temp (°F)
Slump Flow (in)
Probe Settlement (mm/MSI)
VSI
Hardened Agg. Analysis
Set Time
Air (%)
A.McCormick

Mix No.: 0‐0.41
Date Batched: Amb. Temp (°F)
Design Strength 6000psi
Mix Proportions
Coarse Agg. (lbs) 53.8
Fine Agg. (lbs) 70.4
Cement (lbs) 32
Komponent (lbs) 5.8
Fly Ash (lbs) 0
Water (lbs) 15.5
ADVA 405 (oz)
W/C 0.41
Cyl. ID 0-0.41A 0-0.41B 0-0.41C 0-0.41D 0-0.41E 0-0.41F
Age @ break (days)
1 3 7 14 28 28
Diam 1 (in)
Diam 2 (in)
Area (in2)
Load (lb)
Strength (psi)
Type of break
Comments:
Rel. Humid. (%)
Conc. Temp (°F)
Slump Flow (in)
Probe Settlement (mm/MSI)
VSI
Hardened Agg. Analysis
Set Time
Air (%)
A.McCormick

Mix No.: 10‐0.41
Date Batched: Amb. Temp (°F)
Design Strength 6000psi
Mix Proportions
Coarse Agg. (lbs) 53.8
Fine Agg. (lbs) 70.4
Cement (lbs) 28.8
Komponent (lbs) 5.8
Fly Ash (lbs) 3.2
Water (lbs) 15.5
ADVA 405 (oz)
W/C 0.41
Cyl. ID 10-0.41A 10-0.41B 10-0.41C 10-0.41D 10-0.41E 10-0.41F
Age @ break (days)
1 3 7 14 28 28
Diam 1 (in)
Diam 2 (in)
Area (in2)
Load (lb)
Strength (psi)
Type of break
Comments:
Rel. Humid. (%)
Conc. Temp (°F)
Slump Flow (in)
Probe Settlement (mm/MSI)
VSI
Hardened Agg. Analysis
Set Time
Air (%)
A.McCormick
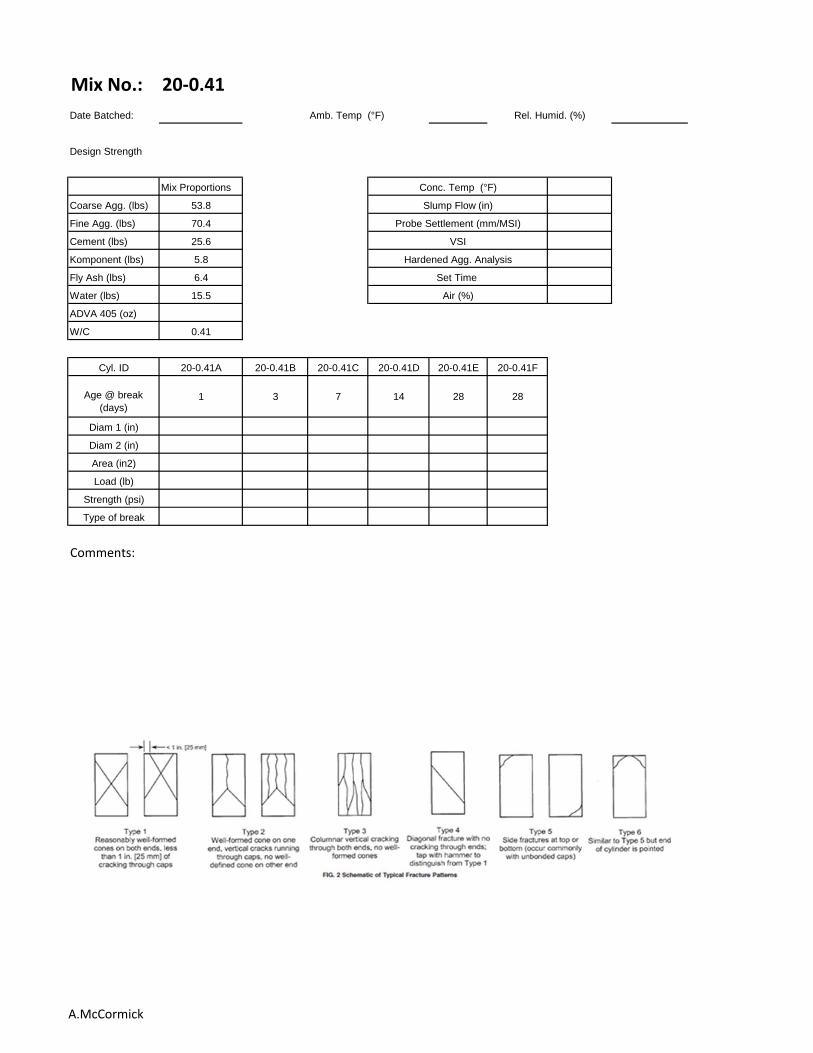
Mix No.: 20‐0.41
Date Batched: Amb. Temp (°F)
Design Strength
Mix Proportions
Coarse Agg. (lbs) 53.8
Fine Agg. (lbs) 70.4
Cement (lbs) 25.6
Komponent (lbs) 5.8
Fly Ash (lbs) 6.4
Water (lbs) 15.5
ADVA 405 (oz)
W/C 0.41
Cyl. ID 20-0.41A 20-0.41B 20-0.41C 20-0.41D 20-0.41E 20-0.41F
Age @ break (days)
1 3 7 14 28 28
Diam 1 (in)
Diam 2 (in)
Area (in2)
Load (lb)
Strength (psi)
Type of break
Comments:
Rel. Humid. (%)
Conc. Temp (°F)
Slump Flow (in)
Probe Settlement (mm/MSI)
VSI
Hardened Agg. Analysis
Set Time
Air (%)
A.McCormick

Mix No.: 30‐0.41
Date Batched: Amb. Temp (°F)
Design Strength
Mix Proportions
Coarse Agg. (lbs) 53.8
Fine Agg. (lbs) 70.4
Cement (lbs) 22.4
Komponent (lbs) 5.8
Fly Ash (lbs) 9.6
Water (lbs) 15.5
ADVA 405 (oz)
W/C 0.41
Cyl. ID 30-0.41A 30-0.41B 30-0.41C 30-0.41D 30-0.41E 30-0.41F
Age @ break (days)1 3 7 14 28 28
Diam 1 (in)
Diam 2 (in)
Area (in2)
Load (lb)
Strength (psi)
Type of break
Comments:
Rel. Humid. (%)
Conc. Temp (°F)
Slump Flow (in)
Probe Settlement (mm/MSI)
VSI
Hardened Agg. Analysis
Set Time
Air (%)
A.McCormick

Mix No.: 0‐0.42
Date Batched: Amb. Temp (°F)
Design Strength 6000psi
Mix Proportions
Coarse Agg. (lbs) 53.8
Fine Agg. (lbs) 70.4
Cement (lbs) 32
Komponent (lbs) 5.8
Fly Ash (lbs) 0
Water (lbs) 15.9
ADVA 405 (oz)
W/C 0.42
Cyl. ID 0-0.42A 0-0.42B 0-0.42C 0-0.42D 0-0.42E 0-0.42F
Age @ break (days)
1 3 7 14 28 28
Diam 1 (in)
Diam 2 (in)
Area (in2)
Load (lb)
Strength (psi)
Type of break
Comments:
Rel. Humid. (%)
Conc. Temp (°F)
Slump Flow (in)
Probe Settlement (mm/MSI)
VSI
Hardened Agg. Analysis
Set Time
Air (%)
A.McCormick

Mix No.: 10‐0.42
Date Batched: Amb. Temp (°F)
Design Strength 6000psi
Mix Proportions
Coarse Agg. (lbs) 53.8
Fine Agg. (lbs) 70.4
Cement (lbs) 28.8
Komponent (lbs) 5.8
Fly Ash (lbs) 3.2
Water (lbs) 15.9
ADVA 405 (oz)
W/C 0.42
Cyl. ID 10-0.42A 10-0.42B 10-0.42C 10-0.42D 10-0.42E 10-0.42F
Age @ break (days)
1 3 7 14 28 28
Diam 1 (in)
Diam 2 (in)
Area (in2)
Load (lb)
Strength (psi)
Type of break
Comments:
Rel. Humid. (%)
Conc. Temp (°F)
Slump Flow (in)
Probe Settlement (mm/MSI)
VSI
Hardened Agg. Analysis
Set Time
Air (%)
A.McCormick

Mix No.: 20‐0.42
Date Batched: Amb. Temp (°F)
Design Strength
Mix Proportions
Coarse Agg. (lbs) 53.8
Fine Agg. (lbs) 70.4
Cement (lbs) 25.6
Komponent (lbs) 5.8
Fly Ash (lbs) 6.4
Water (lbs) 15.9
ADVA 405 (oz)
W/C 0.42
Cyl. ID 20-0.42A 20-0.42B 20-0.42C 20-0.42D 20-0.42E 20-0.42F
Age @ break (days)
1 3 7 14 28 28
Diam 1 (in)
Diam 2 (in)
Area (in2)
Load (lb)
Strength (psi)
Type of break
Comments:
Rel. Humid. (%)
Conc. Temp (°F)
Slump Flow (in)
Probe Settlement (mm/MSI)
VSI
Hardened Agg. Analysis
Set Time
Air (%)
A.McCormick

Mix No.: 30‐0.42
Date Batched: Amb. Temp (°F)
Design Strength
Mix Proportions
Coarse Agg. (lbs) 53.8
Fine Agg. (lbs) 70.4
Cement (lbs) 22.4
Komponent (lbs) 5.8
Fly Ash (lbs) 9.6
Water (lbs) 15.9
ADVA 405 (oz)
W/C 0.42
Cyl. ID 30-0.42A 30-0.42B 30-0.42C 30-0.42D 30-0.42E 30-0.42F
Age @ break (days)1 3 7 14 28 28
Diam 1 (in)
Diam 2 (in)
Area (in2)
Load (lb)
Strength (psi)
Type of break
Comments:
Rel. Humid. (%)
Conc. Temp (°F)
Slump Flow (in)
Probe Settlement (mm/MSI)
VSI
Hardened Agg. Analysis
Set Time
Air (%)
A.McCormick

Mix No.: 0‐0.43
Date Batched: Amb. Temp (°F)
Design Strength 6000psi
Mix Proportions
Coarse Agg. (lbs) 53.8
Fine Agg. (lbs) 70.4
Cement (lbs) 32
Komponent (lbs) 5.8
Fly Ash (lbs) 0
Water (lbs) 16.3
ADVA 405 (oz)
W/C 0.43
Cyl. ID 0-0.43A 0-0.43B 0-0.43C 0-0.43D 0-0.43E 0-0.43F
Age @ break (days)
1 3 7 14 28 28
Diam 1 (in)
Diam 2 (in)
Area (in2)
Load (lb)
Strength (psi)
Type of break
Comments:
Rel. Humid. (%)
Conc. Temp (°F)
Slump Flow (in)
Probe Settlement (mm/MSI)
VSI
Hardened Agg. Analysis
Set Time
Air (%)
A.McCormick

Mix No.: 10‐0.43
Date Batched: Amb. Temp (°F)
Design Strength 6000psi
Mix Proportions
Coarse Agg. (lbs) 53.8
Fine Agg. (lbs) 70.4
Cement (lbs) 28.8
Komponent (lbs) 5.8
Fly Ash (lbs) 3.2
Water (lbs) 16.3
ADVA 405 (oz)
W/C 0.43
Cyl. ID 10-0.43A 10-0.43B 10-0.43C 10-0.43D 10-0.43E 10-0.43F
Age @ break (days)
1 3 7 14 28 28
Diam 1 (in)
Diam 2 (in)
Area (in2)
Load (lb)
Strength (psi)
Type of break
Comments:
Rel. Humid. (%)
Conc. Temp (°F)
Slump Flow (in)
Probe Settlement (mm/MSI)
VSI
Hardened Agg. Analysis
Set Time
Air (%)
A.McCormick

Mix No.: 20‐0.43
Date Batched: Amb. Temp (°F)
Design Strength
Mix Proportions
Coarse Agg. (lbs) 53.8
Fine Agg. (lbs) 70.4
Cement (lbs) 25.6
Komponent (lbs) 5.8
Fly Ash (lbs) 6.4
Water (lbs) 16.3
ADVA 405 (oz)
W/C 0.43
Cyl. ID 20-0.43A 20-0.43B 20-0.43C 20-0.43D 20-0.43E 20-0.43F
Age @ break (days)
1 3 7 14 28 28
Diam 1 (in)
Diam 2 (in)
Area (in2)
Load (lb)
Strength (psi)
Type of break
Comments:
Rel. Humid. (%)
Conc. Temp (°F)
Slump Flow (in)
Probe Settlement (mm/MSI)
VSI
Hardened Agg. Analysis
Set Time
Air (%)
A.McCormick
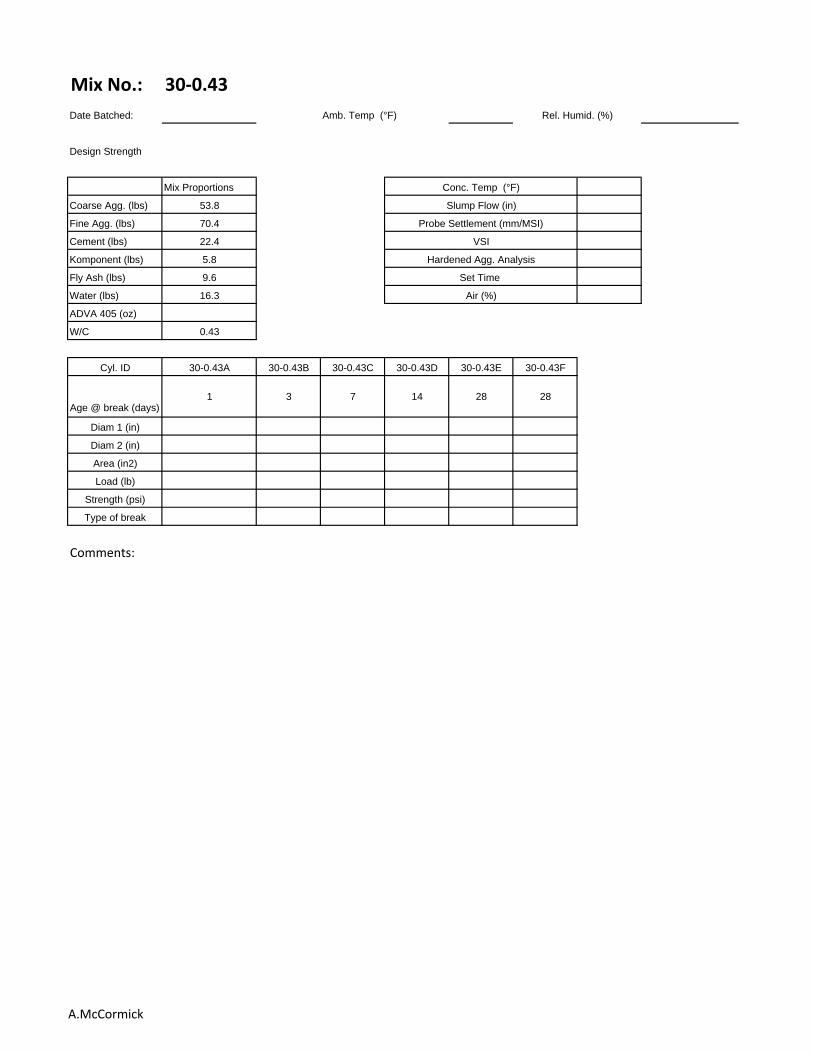
Mix No.: 30‐0.43
Date Batched: Amb. Temp (°F)
Design Strength
Mix Proportions
Coarse Agg. (lbs) 53.8
Fine Agg. (lbs) 70.4
Cement (lbs) 22.4
Komponent (lbs) 5.8
Fly Ash (lbs) 9.6
Water (lbs) 16.3
ADVA 405 (oz)
W/C 0.43
Cyl. ID 30-0.43A 30-0.43B 30-0.43C 30-0.43D 30-0.43E 30-0.43F
Age @ break (days)1 3 7 14 28 28
Diam 1 (in)
Diam 2 (in)
Area (in2)
Load (lb)
Strength (psi)
Type of break
Comments:
Rel. Humid. (%)
Conc. Temp (°F)
Slump Flow (in)
Probe Settlement (mm/MSI)
VSI
Hardened Agg. Analysis
Set Time
Air (%)
A.McCormick
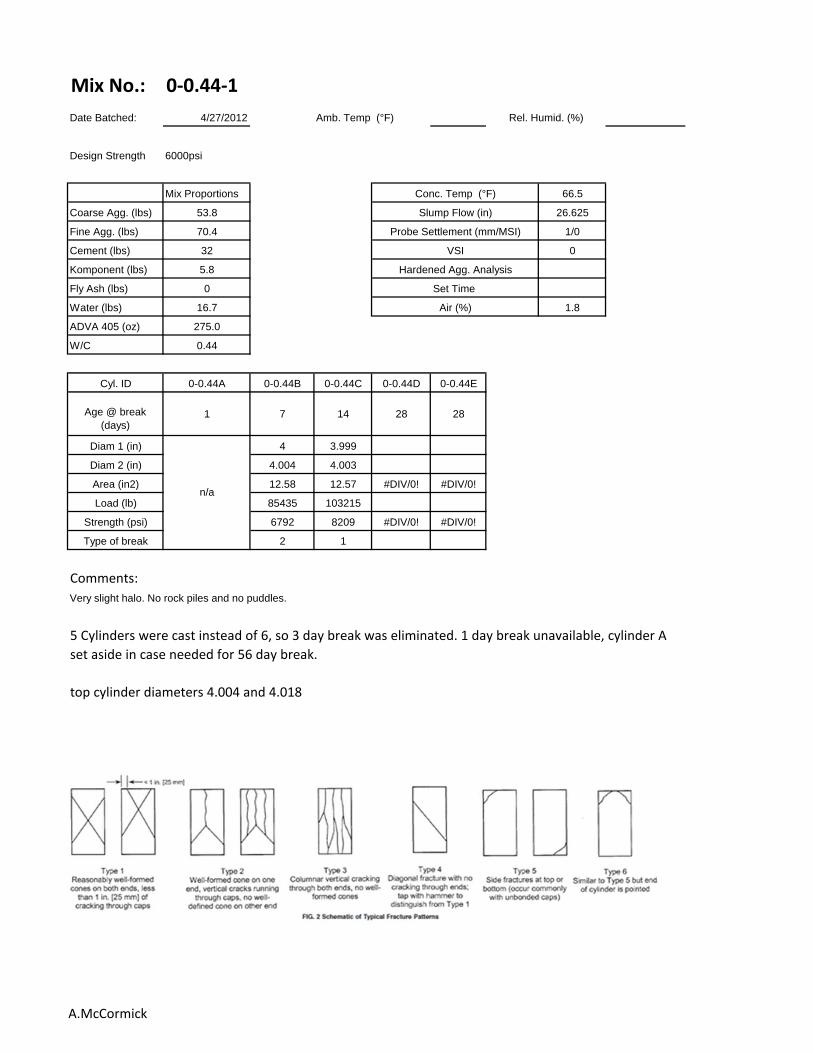
Mix No.: 0‐0.44‐1
Date Batched: 4/27/2012 Amb. Temp (°F)
Design Strength 6000psi
Mix Proportions 66.5
Coarse Agg. (lbs) 53.8 26.625
Fine Agg. (lbs) 70.4 1/0
Cement (lbs) 32 0
Komponent (lbs) 5.8
Fly Ash (lbs) 0
Water (lbs) 16.7 1.8
ADVA 405 (oz) 275.0
W/C 0.44
Cyl. ID 0-0.44A 0-0.44B 0-0.44C 0-0.44D 0-0.44E
Age @ break (days)
1 7 14 28 28
Diam 1 (in) 4 3.999
Diam 2 (in) 4.004 4.003
Area (in2) 12.58 12.57 #DIV/0! #DIV/0!
Load (lb) 85435 103215
Strength (psi) 6792 8209 #DIV/0! #DIV/0!
Type of break 2 1
Comments:
top cylinder diameters 4.004 and 4.018
Rel. Humid. (%)
Conc. Temp (°F)
Slump Flow (in)
Probe Settlement (mm/MSI)
VSI
Hardened Agg. Analysis
Set Time
Air (%)
Very slight halo. No rock piles and no puddles.
n/a
5 Cylinders were cast instead of 6, so 3 day break was eliminated. 1 day break unavailable, cylinder A
set aside in case needed for 56 day break.
A.McCormick

Mix No.: 20‐0.44‐1
Date Batched: 4/27/2012 Amb. Temp (°F)
Design Strength 6000psi
Mix Proportions 68.9
Coarse Agg. (lbs) 53.8 30.125
Fine Agg. (lbs) 70.4 2.54/0
Cement (lbs) 25.6 1.5
Komponent (lbs) 5.8
Fly Ash (lbs) 6.4
Water (lbs) 16.7 1.2
ADVA 405 (oz) 255.0
W/C 0.44
Cyl. ID 20-0.44-1A 20-0.44-1B 20-0.44-1C 20-0.44-1D
Age @ break (days)
7 14 28 28
Diam 1 (in) 4.004 3.993
Diam 2 (in) 3.999 4.003
Area (in2) 12.58 12.55 #DIV/0! #DIV/0!
Load (lb) 28195 93995
Strength (psi) 2242 7487 #DIV/0! #DIV/0!
Type of break 2 2
Comments:
Top cylinder diameters 4.001 and 4.075
Rel. Humid. (%)
Conc. Temp (°F)
Slump Flow (in)
Probe Settlement (mm/MSI)
VSI
Hardened Agg. Analysis
Set Time
Air (%)
Less than 1/4" halo. No rock piles, few puddles. Only 4 cylinders cast since this mix at high end of target flow range.
A.McCormick

Mix No.: 20‐0.44‐2
Date Batched: 4/27/2012 Amb. Temp (°F)
Design Strength
Mix Proportions 67.8
Coarse Agg. (lbs) 53.8 27.875
Fine Agg. (lbs) 70.4 2.54/0
Cement (lbs) 25.6 0
Komponent (lbs) 5.8
Fly Ash (lbs) 6.4
Water (lbs) 16.7 1.5
ADVA 405 (oz) 230.0
W/C 0.44
Cyl. ID 20-0.44-2A 20-0.44-2B 20-0.44-2C 20-0.44-2D 20-0.44-2E 20-0.44-2F
Age @ break (days)
1 3 7 14 28 28
Diam 1 (in) 3.997 3.999
Diam 2 (in) 3.996 4.003
Area (in2) 12.54 12.57 #DIV/0! #DIV/0!
Load (lb) 58910 92020
Strength (psi) 4696 7319 #DIV/0! #DIV/0!
Type of break 2 5
Comments:
1 and 3 day break unavailable, cylinder A set aside in case needed for 56 day break.
Top cylinder diameters 4.004 and 4.018
Rel. Humid. (%)
Conc. Temp (°F)
Slump Flow (in)
Probe Settlement (mm/MSI)
VSI
Hardened Agg. Analysis
Set Time
Air (%)
Possible slight halo, almost non existent. No rock piles or puddles. Holds together nicely.
n/a n/a
A.McCormick

A.McCormick

Mix No.: 0‐0.45
Date Batched: Amb. Temp (°F)
Design Strength 6000psi
Mix Proportions
Coarse Agg. (lbs) 53.8
Fine Agg. (lbs) 70.4
Cement (lbs) 32
Komponent (lbs) 5.8
Fly Ash (lbs) 0
Water (lbs) 17.0
ADVA 405 (oz)
W/C 0.45
Cyl. ID 0-0.45A 0-0.45B 0-0.45C 0-0.45D 0-0.45E 0-0.45F
Age @ break (days)
1 3 7 14 28 28
Diam 1 (in)
Diam 2 (in)
Area (in2)
Load (lb)
Strength (psi)
Type of break
Comments:
Rel. Humid. (%)
Conc. Temp (°F)
Slump Flow (in)
Probe Settlement (mm/MSI)
VSI
Hardened Agg. Analysis
Set Time
Air (%)
A.McCormick

Mix No.: 10‐0.45
Date Batched: Amb. Temp (°F)
Design Strength 6000psi
Mix Proportions
Coarse Agg. (lbs) 53.8
Fine Agg. (lbs) 70.4
Cement (lbs) 28.8
Komponent (lbs) 5.8
Fly Ash (lbs) 3.2
Water (lbs) 17.0
ADVA 405 (oz)
W/C 0.45
Cyl. ID 10-0.45A 10-0.45B 10-0.45C 10-0.45D 10-0.45E 10-0.45F
Age @ break (days)
1 3 7 14 28 28
Diam 1 (in)
Diam 2 (in)
Area (in2)
Load (lb)
Strength (psi)
Type of break
Comments:
Rel. Humid. (%)
Conc. Temp (°F)
Slump Flow (in)
Probe Settlement (mm/MSI)
VSI
Hardened Agg. Analysis
Set Time
Air (%)
A.McCormick

Mix No.: 20‐0.45
Date Batched: Amb. Temp (°F)
Design Strength
Mix Proportions
Coarse Agg. (lbs) 53.8
Fine Agg. (lbs) 70.4
Cement (lbs) 25.6
Komponent (lbs) 5.8
Fly Ash (lbs) 6.4
Water (lbs) 17.0
ADVA 405 (oz)
W/C 0.45
Cyl. ID 20-0.45A 20-0.45B 20-0.45C 20-0.45D 20-0.45E 20-0.45F
Age @ break (days)
1 3 7 14 28 28
Diam 1 (in)
Diam 2 (in)
Area (in2)
Load (lb)
Strength (psi)
Type of break
Comments:
Rel. Humid. (%)
Conc. Temp (°F)
Slump Flow (in)
Probe Settlement (mm/MSI)
VSI
Hardened Agg. Analysis
Set Time
Air (%)
A.McCormick

Mix No.: 30‐0.45
Date Batched: Amb. Temp (°F)
Design Strength
Mix Proportions
Coarse Agg. (lbs) 53.8
Fine Agg. (lbs) 70.4
Cement (lbs) 22.4
Komponent (lbs) 5.8
Fly Ash (lbs) 9.6
Water (lbs) 17.0
ADVA 405 (oz)
W/C 0.45
Cyl. ID 30-0.45A 30-0.45B 30-0.45C 30-0.45D 30-0.45E 30-0.45F
Age @ break (days)1 3 7 14 28 28
Diam 1 (in)
Diam 2 (in)
Area (in2)
Load (lb)
Strength (psi)
Type of break
Comments:
Rel. Humid. (%)
Conc. Temp (°F)
Slump Flow (in)
Probe Settlement (mm/MSI)
VSI
Hardened Agg. Analysis
Set Time
Air (%)
A.McCormick


![Phonetic drill Task 1 Task 2 Task 3 Task 4 [ı] Britain, visit, visit Britain, with, think, building, it, is, this, this is, Westminster, British, bridge,](https://img.pdfslide.net/doc/110x75/56649ca85503460f9496a8c4/phonetic-drill-task-1-task-2-task-3-task-4-i-britain-visit-visit-britain.jpg)