Embed Size (px)
Citation preview

Bridge ManagementBridge Management SystemsSystems
Dr. Hatem ElBehairy13.10.2015
Cairo UniversityBMS - Dr. Hatem ElBehairy 1
Cairo University
Infrastructure Asset ManagementInfrastructure Asset Management Infrastructure asset management is the integrated, multi-
disciplinary set of strategies in sustaining public infrastructure assetsdisciplinary set of strategies in sustaining public infrastructure assets such as: water treatment facilities, sewer lines sewer lines, Transit roads, bridges, and g , railways.
Generally, the process focuses on the later stages of a facility’s life cycle specifically maintenance, rehabilitation, and replacementcycle specifically maintenance, rehabilitation, and replacement(MR&R).
Asset management software tools are used to organize and implement these strategies with the fundamental goal to preserveimplement these strategies with the fundamental goal to preserve and extend the service life of long-term infrastructure assets which are vital underlying components in maintaining the quality of life in
i t d ffi i i th
BMS - Dr. Hatem ElBehairy 2
society and efficiency in the economy.

Infrastructure Asset ManagementInfrastructure Asset Management
In Canada, municipal infrastructure worth $1.1 trillion, approximately , p , pp y
20% of total built asset of $5.5 trillion (NRC)
Municipalities are spending $12 $15 billion/year on maintenance Municipalities are spending $12 - $15 billion/year on maintenance
and rehab (FCM)
Huge backlog
Current funding level will deficit $1 trillion in 60 years (CSCE 2003)0
Infrastructure Backlog
12 2044 57 60.4
-50
0
billio
n
110
-150
-100$ b
1985 1992 1996 2002 2004 2027
BMS - Dr. Hatem ElBehairy 3
1985 1992 1996 2002 2004 2027

Infrastructure Asset ManagementInfrastructure Asset Management
79% useful service life of infrastructure has been used (CSCE 2003)
Condition degradation Condition degradation Infrastructure gap $50 to $125 billion, 6-10 times
of current annual infrastructure budgetof current annual infrastructure budget Estimated cost for upgrading Canadian sewer
i f t t i $11 8 billi (2003)infrastructure is $11.8 billion (2003)
BMS - Dr. Hatem ElBehairy 4

Infrastructure Asset ManagementInfrastructure Asset Management
100McGill Survey 2003 (Mirza and Haider)
708090
epta
bility
)
Good/Acceptable Needs Repair/Not Acceptable
405060
(% o
f Acc
e
102030
Con
ditio
n (
0
Roads
dewalk
Bridges
bution
ment
Sewer
Wasteild
ings
Transit
Parks
C
R
Side BriWater
Distrib
uSew
age T
reatm
Storm Se
Solid W
Build Tr P
BMS - Dr. Hatem ElBehairy 5W Se

ChallengesChallenges…
Infrastructure demand and population growthp p g Aging of infrastructure and condition deterioration Infrastructure deficit Infrastructure deficit Service level improvement Lack of integrated systems/tools and consistent Lack of integrated systems/tools and consistent
approach Inadequate funding Inadequate funding Organizational restructuring
BMS - Dr. Hatem ElBehairy 6

US infrastructure conditionUS infrastructure condition
BMS - Dr. Hatem ElBehairy 7

Step 6
Step 1 to 3 Data orientedStep 5
Decision-making
Step 1 to 3 – Data oriented
Step 4 to 5 – Methodology and policy issues
Step 6 – Decision-making Decision-making
St 3
Step 4
CalculationsCalculations
Step 2
Step 3Models
Protocols
Calculations
Models
Protocols
Step 1
p
A t k l dAsset knowledgeAsset knowledge
BMS - Dr. Hatem ElBehairy 8

Six WhatsSix Whats
What do you own?Asset knowledge
What is it worth? What is the condition? C l l ti
Asset knowledge
What is the condition? What is the deferred maintenance?
Calculations
Models
What is the remaining service life? What do you fix first?
Protocols
Decision-makingy Decision making
BMS - Dr. Hatem ElBehairy 9

What do you own?y• Asset inventory• Database
Paper based
Electronic (relational database and spreadsheets) Integration with GIS and CMMS
What is it worth?• Asset valuation
Book value, historical value, depreciated value, PV Current Replacement Value (CRV) Cost modeling (direct and indirect costs, PSAB, FCA)
Life cycle cost/Whole life cost
BMS - Dr. Hatem ElBehairy 10
• Life cycle cost/Whole life cost

What is the condition?• Condition assessment
Condition grading systems (subjective evaluation, distress based t i d h b id t )matrices and hybrid systems)
• Structural and functional (defects, breaks, hydraulics, blockages etc.)g )
• Protocols (IT tools) PMS, BMS, WRc, NAAPI or homegrown
• Prediction modeling (Markov, survival functions, NN)
What is the deferred maintenance?• Facility Condition Index (FCI)• Maintenance backlog and economic inflation/deflation
BMS - Dr. Hatem ElBehairy 11

What is the remaining service life?g• Service life modeling
Analytical and probabilistic methods Costs for alternative maintenance, repair and renewal
What do you fix first?• Prioritization
Methods: AHP, B/C, weighted factor methods, PAN, MOO d t k l dand expert knowledge
Ranking: Asset by asset or group of assets Costs for alternative maintenance repair and renewal Costs for alternative maintenance, repair and renewal
• Decision-making Combination of all and political agenda
BMS - Dr. Hatem ElBehairy 12
g

Bridge Management SystemBridge Management System
A bridge management system or BMS is a means for managing bridges
throughout design,
construction,
operation and
maintenance of the bridges maintenance of the bridges.
As funds available become tighter, road authorities around the world are facing
challenges related to bridge management and the escalating maintenance g g g g
requirements of large infrastructure assets.
Bridge management systems help agencies to meet their objectives, such as
building inventories and inspection databases, planning for maintenance, repair
and rehabilitation (MR&R) interventions in a systematic way, optimizing the
BMS - Dr. Hatem ElBehairy 13
allocation of financial resources, and increasing the safety of bridge users.

The major tasks in bridge management are:j g g collection of inventory data; inspection; inspection; assessment of condition and strength; repair strengthening or replacement of repair, strengthening or replacement of
components; prioritizing the allocation of funds prioritizing the allocation of funds.
A BMS is a means of managing bridge information to formulate maintenance programsinformation to formulate maintenance programs within cost limitations.
BMS - Dr. Hatem ElBehairy 14

Bridges are important assetsBridges are important assets
BMS - Dr. Hatem ElBehairy 15

Bridges are important assetsBridges are important assets
BMS - Dr. Hatem ElBehairy 16

BMS - Dr. Hatem ElBehairy 17

Increase in Funds required for BridgesIncrease in Funds required for Bridges
BMS - Dr. Hatem ElBehairy 18

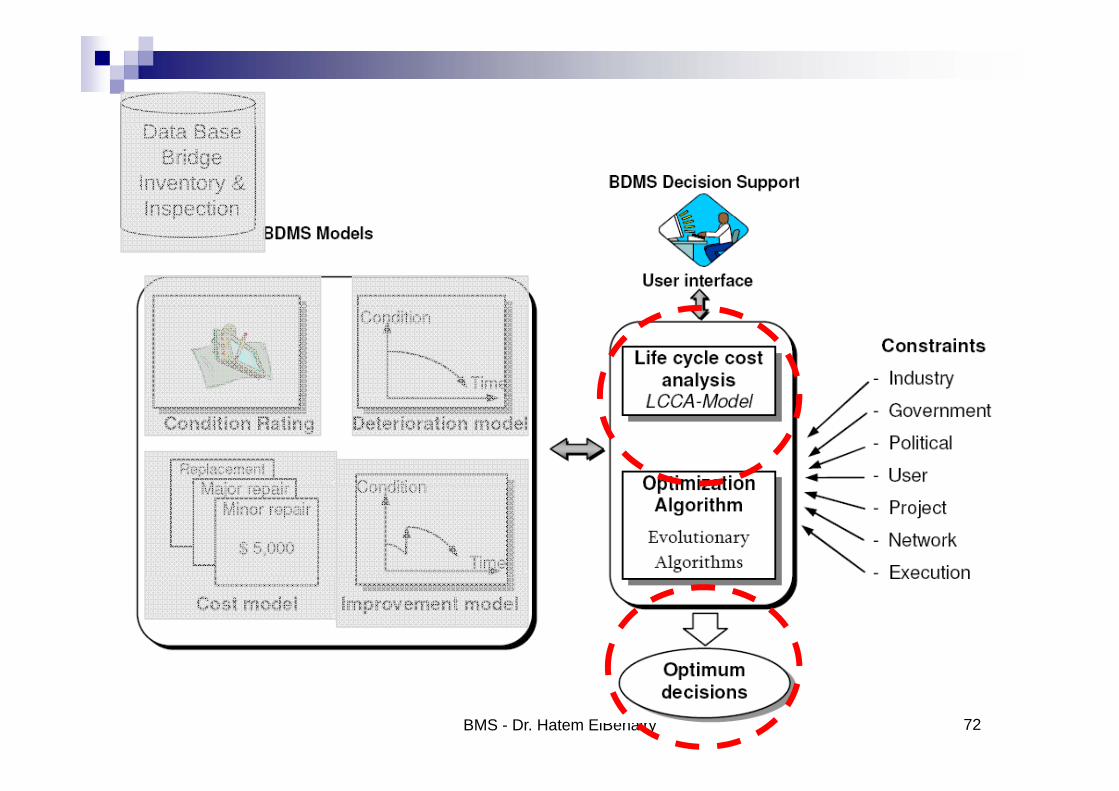
A BMS includes four basic components: data storage, Cost deterioration models, optimization and analysis models, and updating functions updating functions.
BMS - Dr. Hatem ElBehairy 19

Basic Components of a BMS (Modified from AASHTO 2001)Basic Components of a BMS (Modified from AASHTO, 2001)
C diti
Data BaseBridge
Condition Rating Decision
Tools and OptimizationBridge
InventoryOptimization
Models
Deterioration and
Inspection
Deterioration and Improvement
Cost
User cost
MonitoringImprovement
BMS - Dr. Hatem ElBehairy 20

D t BData BaseBridge
Inventory
BMS - Dr. Hatem ElBehairy 21

Bridge InventoryBridge Inventory
Bridge Inventory provides bridge engineers and g y p g gdecision makers a way of tracking and recording the bridges in a network. The information needed to be available in the bridge inventory can be – but not limited to the following items (recording and coding
id f th t t l i t d i l fguide for the structural inventory and appraisal of the nation's bridges, 1995):
BMS - Dr. Hatem ElBehairy 22

Bridge InventoryBridge Inventory
1. Bridge location (province, city, district) Latitude and longitude: expressed in degrees, minutes, seconds Year built Bridge number or code Bridge number or code
2. Route data: whether it is on Highway (connecting providences), intercityg y ( g p ), y route number on the map. directional (west, east, north, or south). Features intersected. Functional classification of the Inventory Route: Main highway,
collector localcollector, local. type of service: highway, railroad, pedestrian.
BMS - Dr. Hatem ElBehairy 23
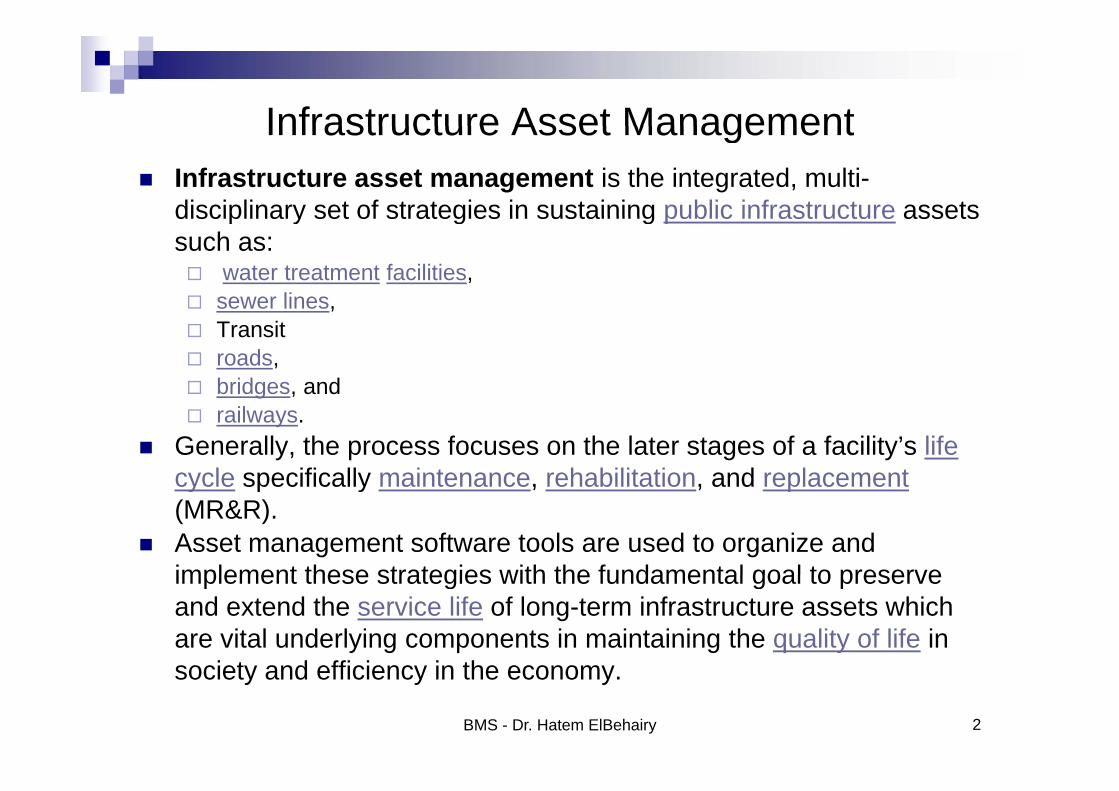
Bridge InventoryBridge Inventory3. Bridge geometry data:
L d d th b id Lanes on and under the bridge. approach roadway width. bridge median: indicates whether the median is non-existent, closed, or
open. Bridge skew angle: the angle between the center line of the a pier and a
line normal to the roadway centerline expressed in degrees.y p g Structure Flared: indicate whether the bridge is flared or not (the bridge
width varies). Navigational Control navigation vertical and horizontal clearance Navigational Control, navigation vertical and horizontal clearance. number of spans in main unit, number of approach spans, length of
maximum span, and structural length curb or width walk width. bridge road a idth and c rb to c rb idth bridge roadway width and curb-to-curb width. desk width, out-to-out. Minimum vertical clearance over bridge roadway and under clearance.
BMS - Dr. Hatem ElBehairy 24

Bridge InventoryBridge Inventory4. Bridge structure data:
d k t t t t t i l t t l deck structure type: concrete cast in-place, concrete pre-cast panels, steel plates.
structure type and system: concrete, steel, or pre-stressed. Wearing surface, protective system. pier or abutment protection. scour critical bridges. scour critical bridges.
5. Traffic data: Average daily traffic (ADT) and the recorded year Detour length: represent the additional distance to be traveled by the
vehicle which would result from bridge closing. Toll: indicates whether the toll status of the bridge. Traffic safety features: bridge railings, transitions, approach guard rail. average daily truck traffic. Future average daily traffic year of estimation: should not be less than
BMS - Dr. Hatem ElBehairy 25
Future average daily traffic, year of estimation: should not be less than 17 years but more than 22 years

Bridge InventoryBridge Inventory6. Design load.7. Historical significance: if the bridge has a historic record.7. Historical significance: if the bridge has a historic record.8. Bridge condition data:
condition rating. bridge posting: indicates the load limit if the bridge is deteriorated or the
design loads are increased. structure open, posted, or closed to traffic.
9. Maintenance data: Maintenance responsibility and owner: indicates the actual names of the
agencies responsible for the maintenance of the structureagencies responsible for the maintenance of the structure. Maintenance and type of work, and included by whom. length of structural improvement. inspection date and designated inspection date. Bridge, roadway improvement cost, and total project cost. year of maintenance cost estimate.
BMS - Dr. Hatem ElBehairy 26
y year reconstructed.
Bridge InventoryBridge Inventory
Pi t10. Pictures
D11. Documents
12. CAD drawings.
BMS - Dr. Hatem ElBehairy 27

FORM IB GENERAL BRIDGE INVENTORYBRIDGE NO: Inspection Leader : pInspection Date
nce
Road No.Distance from Kilometer Post - mChainage at Start of BridgeStructure Number Bridge number
Brid
ge R
efer
en Structure Number Bridge numberLocation DescriptionFeature ID Bridge numberXYZZDistrictContract AreaBridge Type 104No. of Spans 29Type of Abutment Open
etry
Type of Abutment OpenType of Pier Column with cap beam{5}Type & Length of Expansion Joint Steel angle (6) - 240mType & No. of Bearing tar paper (1) - 30Type of Railing/Parapet Concrete with handrail (1)&(2)T f d k i S f Bit i P t 2
Elem
ent G
eom
e Type of deck wearing Surface Bituminouse Pavement 2Slope Protection at Abutment slope Bitching 4No. of Lanes on Structure 2Bridge Roadway Width (Kerb to Kerb) 8Bridge Deck Width (Out to Out) 9.5
Brid
ge E Approach Roadway Width 7.7
Vertical Clearance 3Bridge Curve (Y/N) NBridge Skewed (Y/N) NBridge Sidewalks Type Concrete 1
BMS - Dr. Hatem ElBehairy 28
Kerb Height (cm) 20Bridge Median (Y/N) 1Drainage System (Y/N) YUtility (Y/N) N
Remarks |

Inspection CategoriesInspection Categories
BMS - Dr. Hatem ElBehairy 29

D t BData BaseBridge
Inventory & Inspectionp
BMS - Dr. Hatem ElBehairy 30

Bridge RatingBridge Rating
BMS - Dr. Hatem ElBehairy 31

Bridge RatingBridge Rating
BMS - Dr. Hatem ElBehairy 32

Bridge RatingBridge Rating
BMS - Dr. Hatem ElBehairy 33

Bridge RatingBridge Rating
BMS - Dr. Hatem ElBehairy 34

Bridge RatingBridge Rating
BMS - Dr. Hatem ElBehairy 35

Bridge RatingBridge Rating
BMS - Dr. Hatem ElBehairy 36

Assessment and EvaluationAssessment and Evaluation
Bridge testing methods
Destructive tests
Non-Destructive tests
BMS - Dr. Hatem ElBehairy 37

Non-Destructive Testing MethodsNon-Destructive Testing Methods
Visual inspections are the most common types of p ypinspections when dealing with bridge members. These inspections do not require sophisticated, highly technical apparatus to perform the inspection, and therefore, are the most economical.
BMS - Dr. Hatem ElBehairy 38

Destructive Testing MethodsDestructive Testing Methods
Core sampling is a destructive form of concrete p ginspection, and it can weaken a member. Cores can be used for many of the destructive tests
Strength tests are normally considered destructive tests since they usually involve tests conducted on pieces of steel removed from the bridge
BMS - Dr. Hatem ElBehairy 39

D t BData BaseBridge
Inventory & Inspectionp
BMS - Dr. Hatem ElBehairy 40

Bridge DeteriorationBridge Deterioration
Bridge deterioration is the result of decline in bridge g gcondition resulting from normal operation
Excluding damages from events like earthquake, g g q ,accidents, fire and flood
It is considered a complex phenomena where p pphysical and chemical changes happen
Each element in the bridge has its own deterioration gprocess
Actual prediction of the deterioration is consideredActual prediction of the deterioration is considered critical for the success of a BMS
BMS - Dr. Hatem ElBehairy 41

BMS - Dr. Hatem ElBehairy 42

Very similar to the deterioration models in Pavement yManagement system
But with different elements and loading criteriag Top factors affecting deterioration:
Age Age Average daily traffic Environment Bridge design parameters Quality of construction and material usedy
BMS - Dr. Hatem ElBehairy 43

Parameters affecting deteriorationParameters affecting deterioration
BMS - Dr. Hatem ElBehairy 44

Bridge RatingBridge Rating
BMS - Dr. Hatem ElBehairy 45
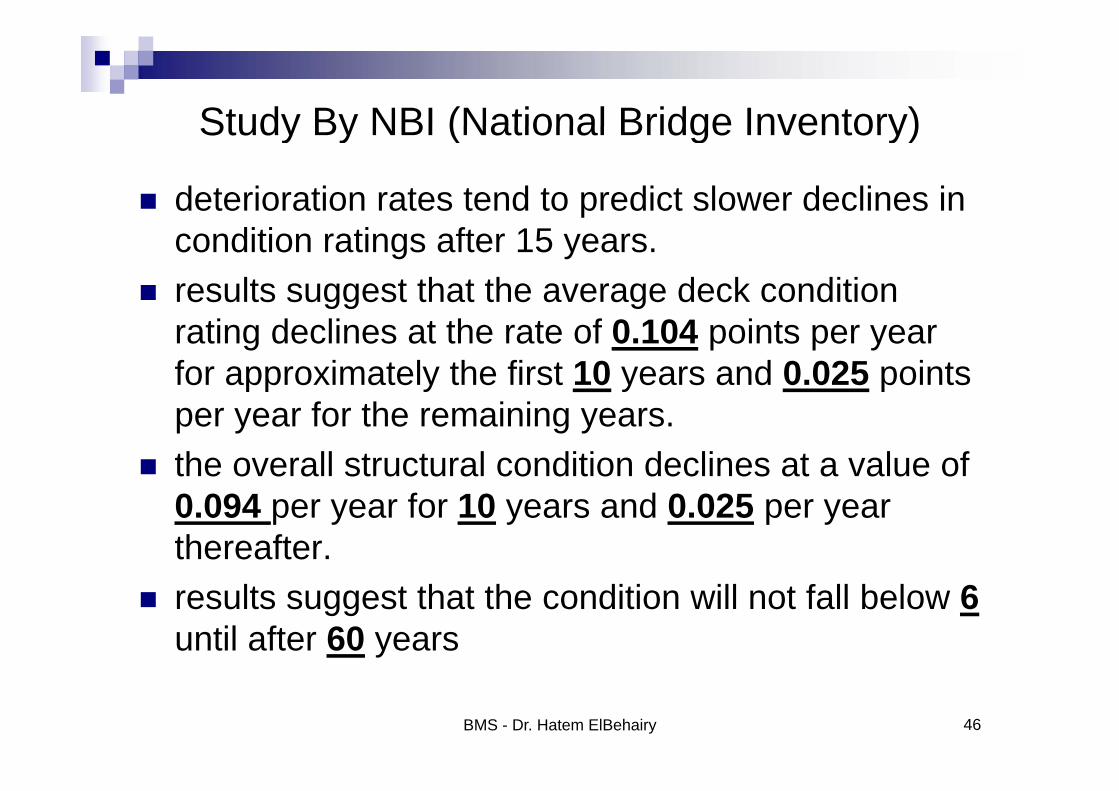
Study By NBI (National Bridge Inventory)Study By NBI (National Bridge Inventory)
deterioration rates tend to predict slower declines in pcondition ratings after 15 years.
results suggest that the average deck condition gg grating declines at the rate of 0.104 points per year for approximately the first 10 years and 0.025 points per year for the remaining years.
the overall structural condition declines at a value of 0.094 per year for 10 years and 0.025 per year thereafter.
results suggest that the condition will not fall below 6until after 60 years
BMS - Dr. Hatem ElBehairy 46

the estimated average deterioration of decks was gabout 1 point in 8 years and 1 point in 10 years for the superstructure and substructure.
This is not the case in real life: bridges deteriorate at a much higher rates
BMS - Dr. Hatem ElBehairy 47

deterioration models can be categorized into four gmain categories: mechanistic models, deterministic models, Stochastic models, and artificial intelligence (AI) models
BMS - Dr. Hatem ElBehairy 48

Mechanistic ModelsMechanistic Models
Mechanistic models are detailed models that describe the specific deterioration mechanisms of particular bridge components
most of these models have not been tested in practice and none of the DOTs uses such models.
BMS - Dr. Hatem ElBehairy 49

Deterministic ModelsDeterministic Models
dependent on a mathematical or statistical formula pfor the relationship between the factors affecting bridge deterioration and the measure of a bridge’s condition.
The models can be categorized as using straight-line extrapolation, regression, and curve-fitting method
BMS - Dr. Hatem ElBehairy 50

Stochastic ModelsStochastic Models
The use of stochastic models has contributed significantly to the field of modeling infrastructure deterioration because of the high uncertainty and randomness involved in the deterioration process
The most commonly used stochastic technique for infrastructure deterioration is the Markov chain model.
BMS - Dr. Hatem ElBehairy 51

Markov chainMarkov chain
based on the concept of defining states in terms of p gbridge condition ratings and obtaining the probabilities of a bridge condition changing from one state to another
Deterioration Matrix
BMS - Dr. Hatem ElBehairy 52

Deterioration Probability MatrixDeterioration Probability MatrixProbability
that the Probability that the bridge will move
to the next conditionbridge will
remain in the same diticondition
BMS - Dr. Hatem ElBehairy 53

Deterioration Probability MatrixDeterioration Probability Matrix
BMS - Dr. Hatem ElBehairy 54

Markov Chain CalculationMarkov Chain CalculationCalculate the condition rating after 6 years
R = [9,8,7,6,5,4,3]
At initial stage
BMS - Dr. Hatem ElBehairy 55

Markov Chain CalculationMarkov Chain Calculation
BMS - Dr. Hatem ElBehairy 56

BMS - Dr. Hatem ElBehairy 57

D t BData BaseBridge
Inventory & Inspectionp
BMS - Dr. Hatem ElBehairy 58

Improvement ModelImprovement Model
It is important that the impact of each repair option p p p pon the condition of a bridge be analyzed.
For example, to raise the condition of the bridge p , gdeck from 3 to 5, a medium repair should be selected, while to raise it to condition 7,extensive repair should be selected
BMS - Dr. Hatem ElBehairy 59

Impact of MR&R actionsImpact of MR&R actions
BMS - Dr. Hatem ElBehairy 60

BMS - Dr. Hatem ElBehairy 61

After RepairAfter Repair
the rate of deterioration of rehabilitated bridges is ggreater than that of newly constructed bridges.
rehabilitated bridges do not revert back to their best gcondition
most BMSs assume that the rate of deterioration after repair is the same as that in effect when the bridge was constructed
The study concluded that a reconstructed deck has at least a 25% shorter life span than new decks
BMS - Dr. Hatem ElBehairy 62

After RepairAfter Repair
BMS - Dr. Hatem ElBehairy 63

Artificial Intelligence Deterioration ModelsArtificial Intelligence Deterioration Models
Artificial neural networks (ANNs)( ) case based reasoning (CBR) machine learning (ML) machine learning (ML)
BMS - Dr. Hatem ElBehairy 64

ANN was utilized to relate the age of the bridge g gsuperstructure (in years) to its condition rating (a numeric value from 1 to 9)
The inspection records for 50 bridge superstructures were utilized to train and test the network; 75% of the data were used for training, while the remaining data were used for testing
The use of this ANN resulted in 79% of the predicted values were with a 15% prediction error
BMS - Dr. Hatem ElBehairy 65

BMS - Dr. Hatem ElBehairy 66

D t BData BaseBridge
Inventory & Inspectionp
BMS - Dr. Hatem ElBehairy 67

Cost ModelCost Model
Repair Intensity Deck Superstructure Substructure
Light 28% 49% 26%
Medium 65% 74% 63%
Extensive 100% 100% 100%Extensive 100% 100% 100%
BMS - Dr. Hatem ElBehairy 68

Life Cycle CostLife Cycle Cost
Sum of all recurring and one-time (non-recurring) g ( g)costs over the full life span or a specified period of a good, service, structure, or system. In includespurchase price/construction cost, installation cost, operating costs, maintenance and upgrade costs,
d i i ( id l l ) l t th dand remaining (residual or salvage) value at the endof ownership or its useful life.
BMS - Dr. Hatem ElBehairy 69

Life Cycle Cost (LCC) as “the total discounted y ( )dollar cost of owning, operating, maintaining, and disposing of a building or a building system” over a period of time. Life Cycle Cost Analysis (LCCA) is an economic evaluation technique that d t i th t t l t f i d tidetermines the total cost of owning and operating a facility over period of time.
BMS - Dr. Hatem ElBehairy 70

BMS - Dr. Hatem ElBehairy 71
D t BData BaseBridge
Inventory & Inspectionp
BMS - Dr. Hatem ElBehairy 72

Bridge Deck Management systemBridge Deck Management system
BMS - Dr. Hatem ElBehairy 73

BMS - Dr. Hatem ElBehairy 74

N b f V i bl N T
4 50
Number of Variables = N x T
Each variable can take an integer from 0 to 3
A simple network of 10 bridges in 5-years plan
BMS - Dr. Hatem ElBehairy 75

BMS - Dr. Hatem ElBehairy 76

2012
BMS - Dr. Hatem ElBehairy 77

Condition ratingCondition rating
BMS - Dr. Hatem ElBehairy 78

Component Weight
1 Bearings 62 Back wall 53 Abutments 84 Wing walls 55 Piers 85 Piers 86 Primary members 107 Secondary members 58 88 Deck 89 Curb 1
10 Wearing surface 410 Wearing surface 411 Bridge seats 612 Sidewalks 213 J i t 4
BMS - Dr. Hatem ElBehairy 79
13 Joints 4

Condition ratingCondition rating
BCE = BRIDGE CONDITION RATING
BMS - Dr. Hatem ElBehairy 80

BMS - Dr. Hatem ElBehairy 81

BMS - Dr. Hatem ElBehairy 82

BMS - Dr. Hatem ElBehairy 83

BMS - Dr. Hatem ElBehairy 84
BMS - Dr. Hatem ElBehairy 85

BMS - Dr. Hatem ElBehairy 86

BMS - Dr. Hatem ElBehairy 87

BMS - Dr. Hatem ElBehairy 88

BMS - Dr. Hatem ElBehairy 89

BMS - Dr. Hatem ElBehairy 90

BMS - Dr. Hatem ElBehairy 91

Ranking TechniquesRanking Techniques
Priority Ranking:y g Choosing the bridges with the worst condition Does not maximize the benefits Do not reduce life cycle cost Do not guarantee optimal selection
BMS - Dr. Hatem ElBehairy 92

Commercial BMSCommercial BMS
Pontis
BMS - Dr. Hatem ElBehairy 93
Commercial BMSCommercial BMS
BMS - Dr. Hatem ElBehairy 94

BMS - Dr. Hatem ElBehairy 95

User CostUser Cost
the first one estimates the user cost for a network of bridges under service conditions,
the other estimates the user costs incurred when crossing work zones during repair activities and optimizes the work zone strategies in order to minimize the user costs
BMS - Dr. Hatem ElBehairy 96

BMS - Dr. Hatem ElBehairy 97

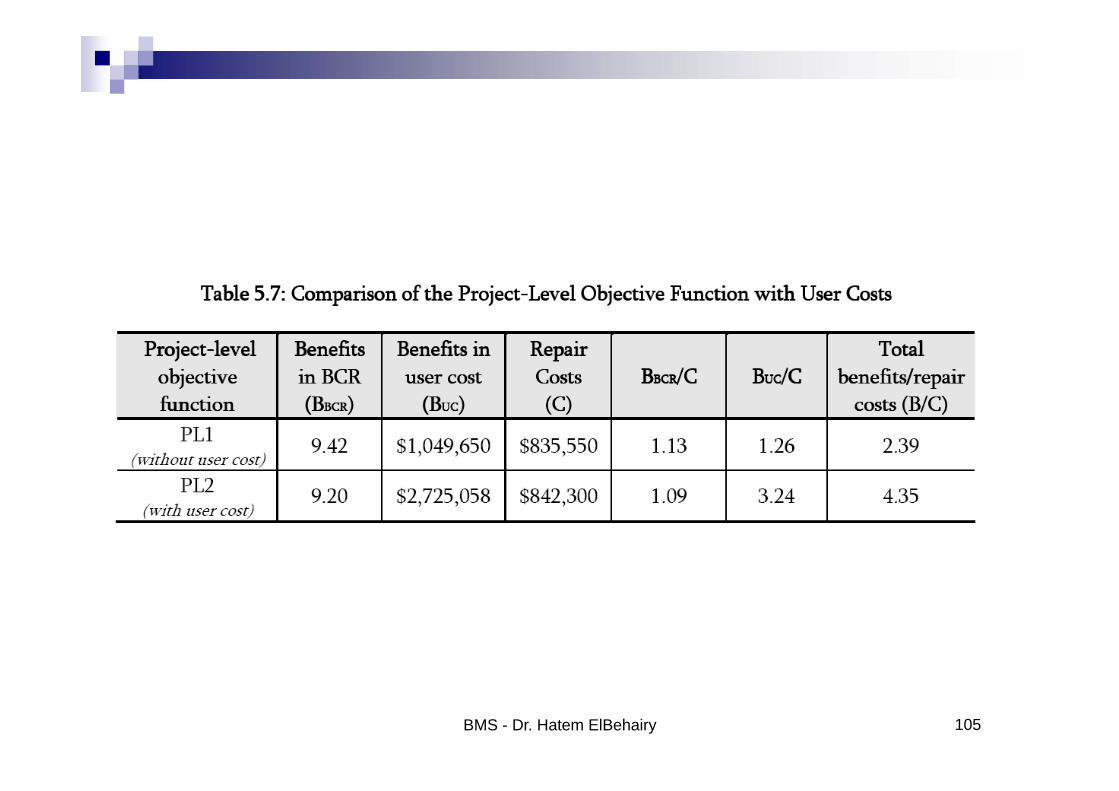
User costs are costs incurred by the public because y pof deficiencies in bridges, such as a narrow width which causes accidents, low load capacity, or low vertical clearance
some vehicles to detour thus leading to an increase in vehicle operating costs and an increase in the trip time which is translated into user delay costs
It is estimated that user costs may exceed the repair costs by a factor of 5 or more.
BMS - Dr. Hatem ElBehairy 98

User benefits of three types of functional ypimprovements as follows:
Widening the bridge approach roadway primarily g g pp y p yreduces the risk of accidents on the bridge.
Raising the height of the clearance affects the ability g g yof tall trucks to pass under the bridge. The Pontis user model predicts the savings with respect to truck detours.
Strengthening the bridge affects the ability of heavy trucks to cross the bridge. The model predicts the potential savings with respect to truck detour costs.
BMS - Dr. Hatem ElBehairy 99

BMS - Dr. Hatem ElBehairy 100

BMS - Dr. Hatem ElBehairy 101

BMS - Dr. Hatem ElBehairy 102

BMS - Dr. Hatem ElBehairy 103

BMS - Dr. Hatem ElBehairy 104
BMS - Dr. Hatem ElBehairy 105

Work ZoneWork Zone
BMS - Dr. Hatem ElBehairy 106

BMS - Dr. Hatem ElBehairy 107

BMS - Dr. Hatem ElBehairy 108

BMS - Dr. Hatem ElBehairy 109

BMS - Dr. Hatem ElBehairy 110

BMS - Dr. Hatem ElBehairy 111
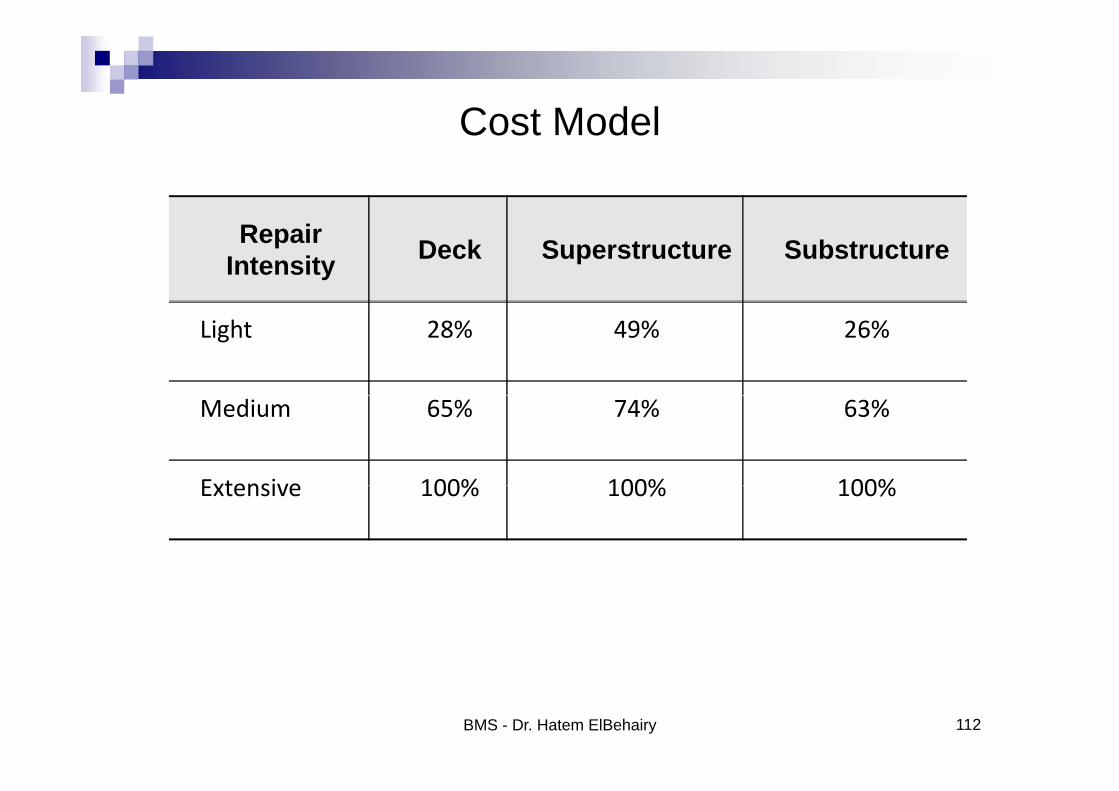
Cost ModelCost Model
Repair Intensity Deck Superstructure Substructure
Light 28% 49% 26%
Medium 65% 74% 63%
Extensive 100% 100% 100%Extensive 100% 100% 100%
BMS - Dr. Hatem ElBehairy 112

Life Cycle CostLife Cycle Cost
Sum of all recurring and one-time (non-recurring) g ( g)costs over the full life span or a specified period of a good, service, structure, or system. In includespurchase price/construction cost, installation cost, operating costs, maintenance and upgrade costs,
d i i ( id l l ) l t th dand remaining (residual or salvage) value at the endof ownership or its useful life.
BMS - Dr. Hatem ElBehairy 113

Life Cycle Cost (LCC) as “the total discounted y ( )dollar cost of owning, operating, maintaining, and disposing of a building or a building system” over a period of time. Life Cycle Cost Analysis (LCCA) is an economic evaluation technique that d t i th t t l t f i d tidetermines the total cost of owning and operating a facility over period of time.
BMS - Dr. Hatem ElBehairy 114

BMS - Dr. Hatem ElBehairy 115

Bridge Deck Management systemBridge Deck Management system
BMS - Dr. Hatem ElBehairy 116

BMS - Dr. Hatem ElBehairy 117

BMS - Dr. Hatem ElBehairy 118

BMS - Dr. Hatem ElBehairy 119

BMS - Dr. Hatem ElBehairy 120
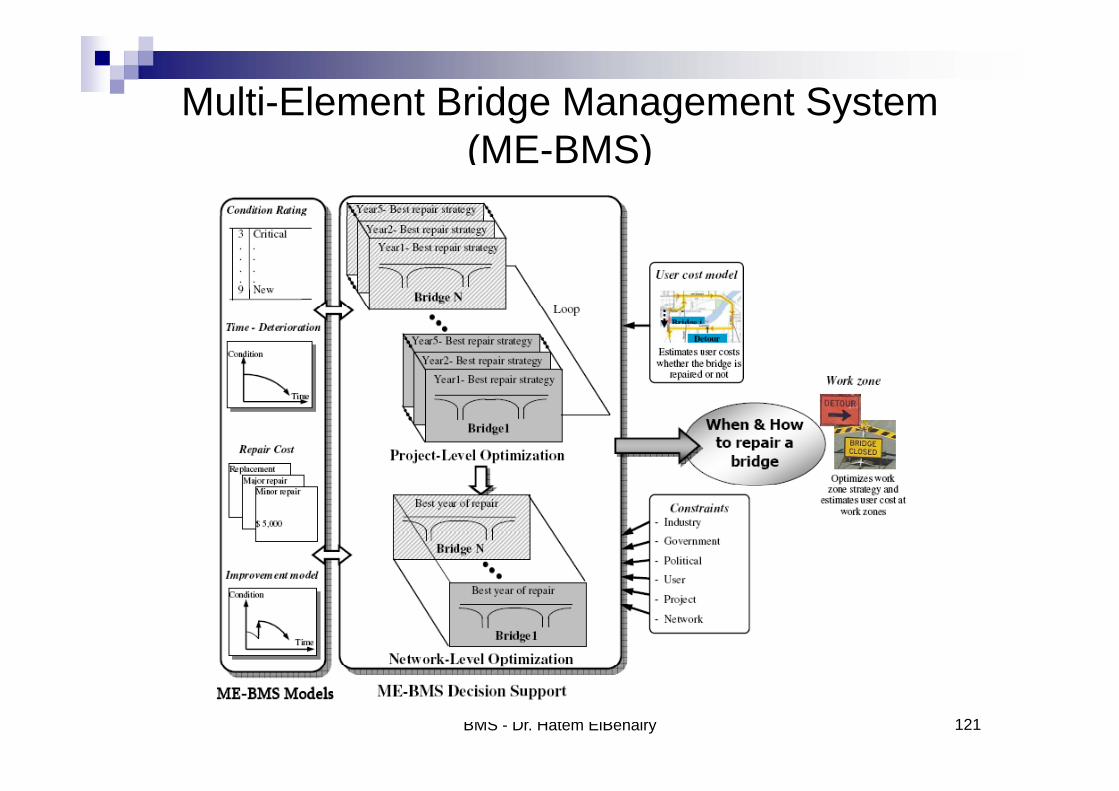
Multi-Element Bridge Management System(ME-BMS)
BMS - Dr. Hatem ElBehairy 121
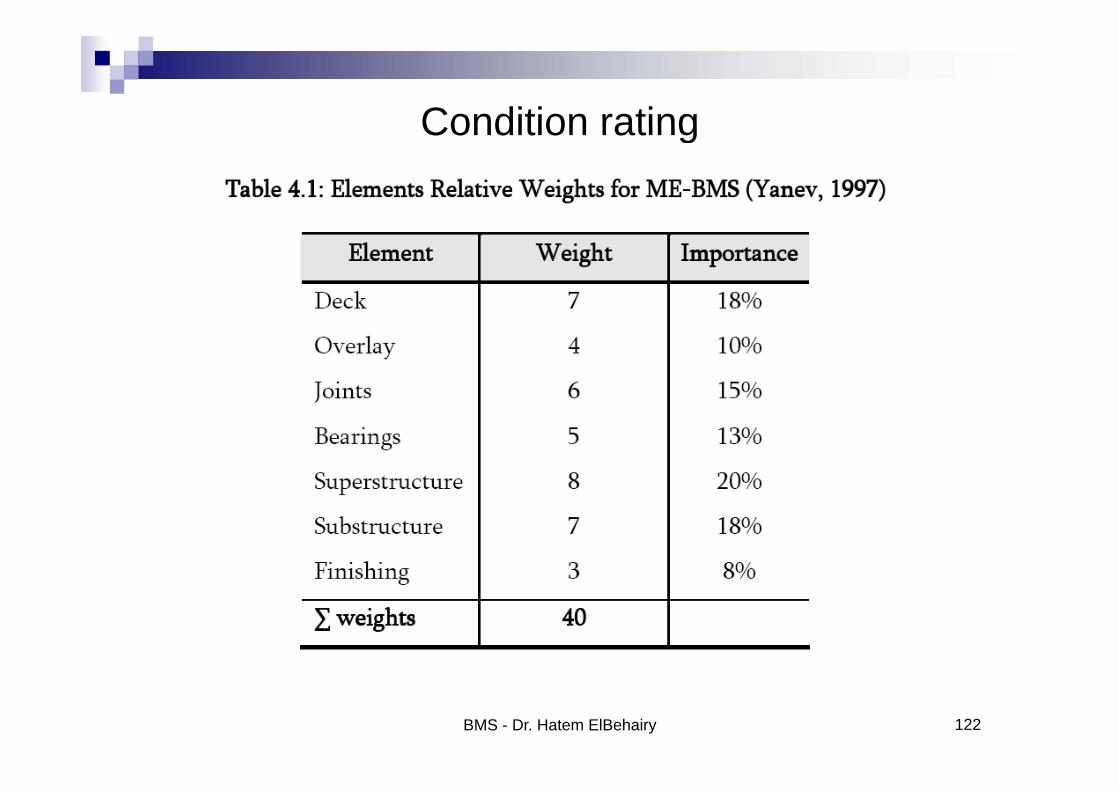
Condition ratingCondition rating
BMS - Dr. Hatem ElBehairy 122

Component Weight
1 Bearings 62 Back wall 53 Abutments 84 Wing walls 55 Piers 85 Piers 86 Primary members 107 Secondary members 58 88 Deck 89 Curb 1
10 Wearing surface 410 Wearing surface 411 Bridge seats 612 Sidewalks 213 J i t 4
BMS - Dr. Hatem ElBehairy 123
13 Joints 4

Condition ratingCondition rating
BCE = BRIDGE CONDITION RATING
BMS - Dr. Hatem ElBehairy 124

BMS - Dr. Hatem ElBehairy 125

BMS - Dr. Hatem ElBehairy 126

BMS - Dr. Hatem ElBehairy 127

BMS - Dr. Hatem ElBehairy 128

BMS - Dr. Hatem ElBehairy 129

BMS - Dr. Hatem ElBehairy 130

BMS - Dr. Hatem ElBehairy 131

BMS - Dr. Hatem ElBehairy 132

BMS - Dr. Hatem ElBehairy 133

BMS - Dr. Hatem ElBehairy 134

BMS - Dr. Hatem ElBehairy 135

Traditional Priority RankingTraditional Priority Ranking
Choosing the bridges with the worst conditiong g Projects are selected until the available fund is
exhausted Does not maximize the benefits Do not reduce life cycle cost Do not reduce life cycle cost Do not guarantee optimal selection
BMS - Dr. Hatem ElBehairy 136

Commercial BMSCommercial BMS
Pontis
BMS - Dr. Hatem ElBehairy 137

Commercial BMSCommercial BMS
BRIDGIT
BMS - Dr. Hatem ElBehairy 138

O t i B id M t S tOntario Bridge Management System
BMS - Dr. Hatem ElBehairy 139

User CostUser Cost
User costs consists to 2 components:p the first one estimates the user cost for a network of
bridges under service conditions, g , the other estimates the user costs incurred when
crossing work zones during repair activities and g g poptimizes the work zone strategies in order to minimize the user costs
BMS - Dr. Hatem ElBehairy 140

BMS - Dr. Hatem ElBehairy 141
User costs are costs incurred by the public because y pof deficiencies in bridges, such as a narrow width which causes accidents, low load capacity, or low vertical clearance
some vehicles to detour thus leading to an increase in vehicle operating costs and an increase in the trip time which is translated into user delay costs
It is estimated that user costs may exceed the repair costs by a factor of 5 or more.
BMS - Dr. Hatem ElBehairy 142

User benefits of three types of functional ypimprovements as follows:
Widening the bridge approach roadway primarily g g pp y p yreduces the risk of accidents on the bridge.
Raising the height of the clearance affects the ability g g yof tall trucks to pass under the bridge. The Pontis user model predicts the savings with respect to truck detours.
Strengthening the bridge affects the ability of heavy trucks to cross the bridge. The model predicts the potential savings with respect to truck detour costs.
BMS - Dr. Hatem ElBehairy 143

BMS - Dr. Hatem ElBehairy 144

BMS - Dr. Hatem ElBehairy 145

BMS - Dr. Hatem ElBehairy 146

BMS - Dr. Hatem ElBehairy 147

BMS - Dr. Hatem ElBehairy 148

BMS - Dr. Hatem ElBehairy 149

Work ZoneWork Zone
BMS - Dr. Hatem ElBehairy 150

BMS - Dr. Hatem ElBehairy 151

BMS - Dr. Hatem ElBehairy 152

BMS - Dr. Hatem ElBehairy 153

BMS - Dr. Hatem ElBehairy 154

BMS - Dr. Hatem ElBehairy 155