Embed Size (px)
Citation preview
EAH 422
ADVANCED WATER RESOURCES ENGINEERING
Bridge HydraulicsProf. Aminuddin Ab. Ghani
W e l e a dReferences
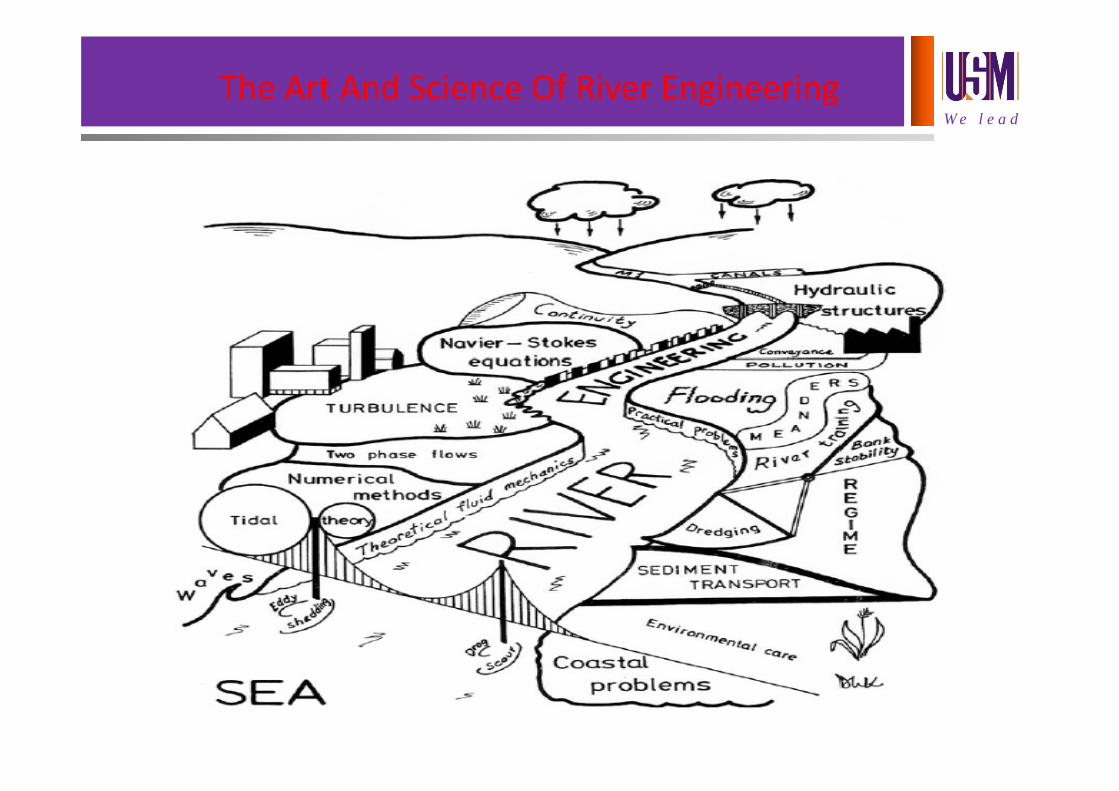
W e l e a dThe Art And Science Of River Engineering
W e l e a d
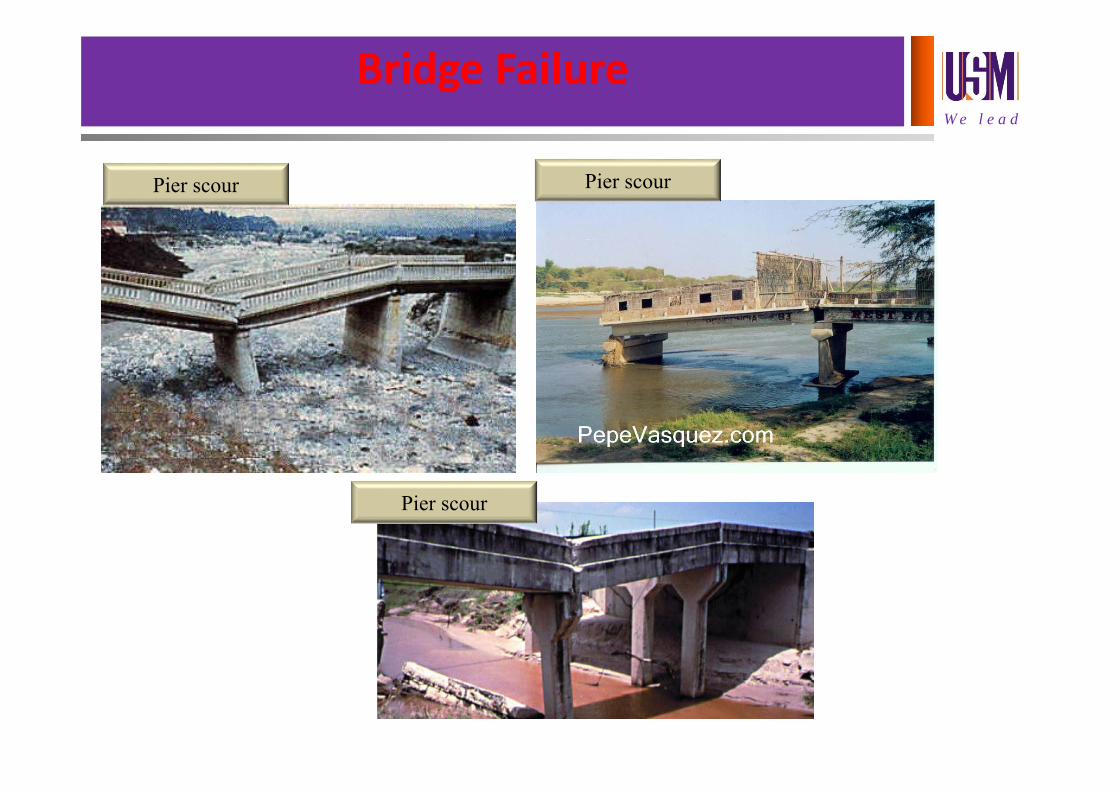
Pier scour Pier scour
Pier scour
Bridge Failure
W e l e a d
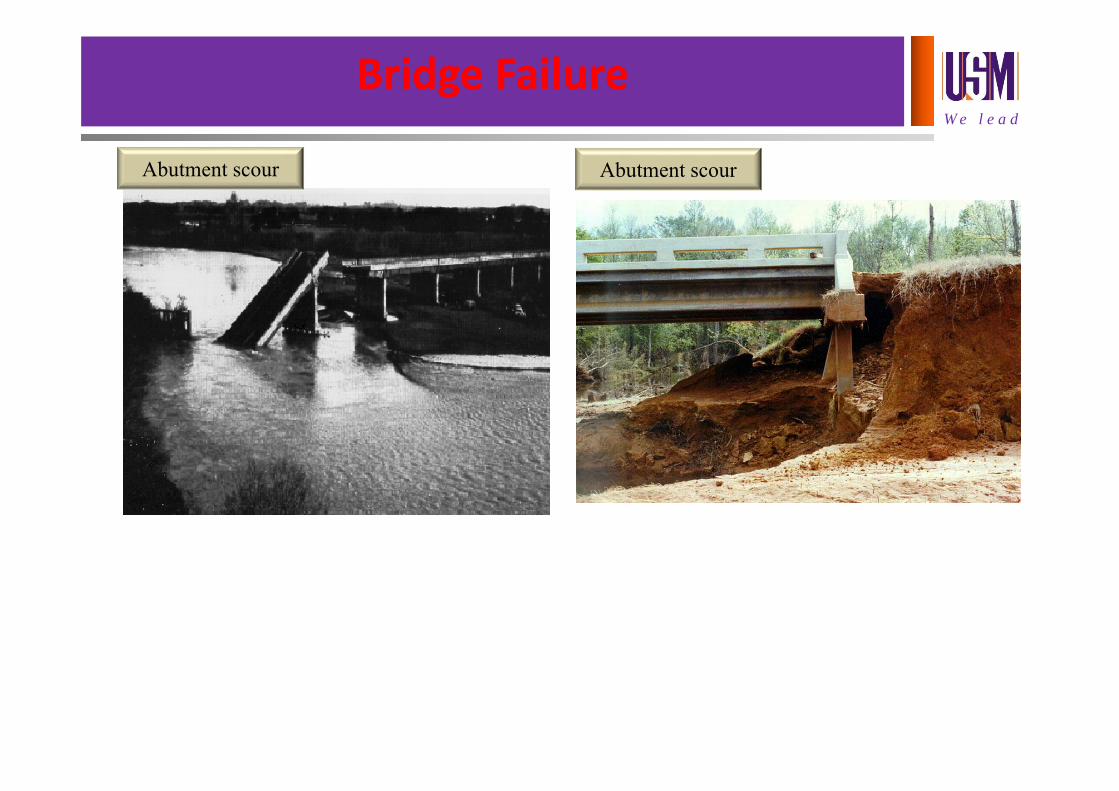
Abutment scour Abutment scour
Bridge Failure
W e l e a d
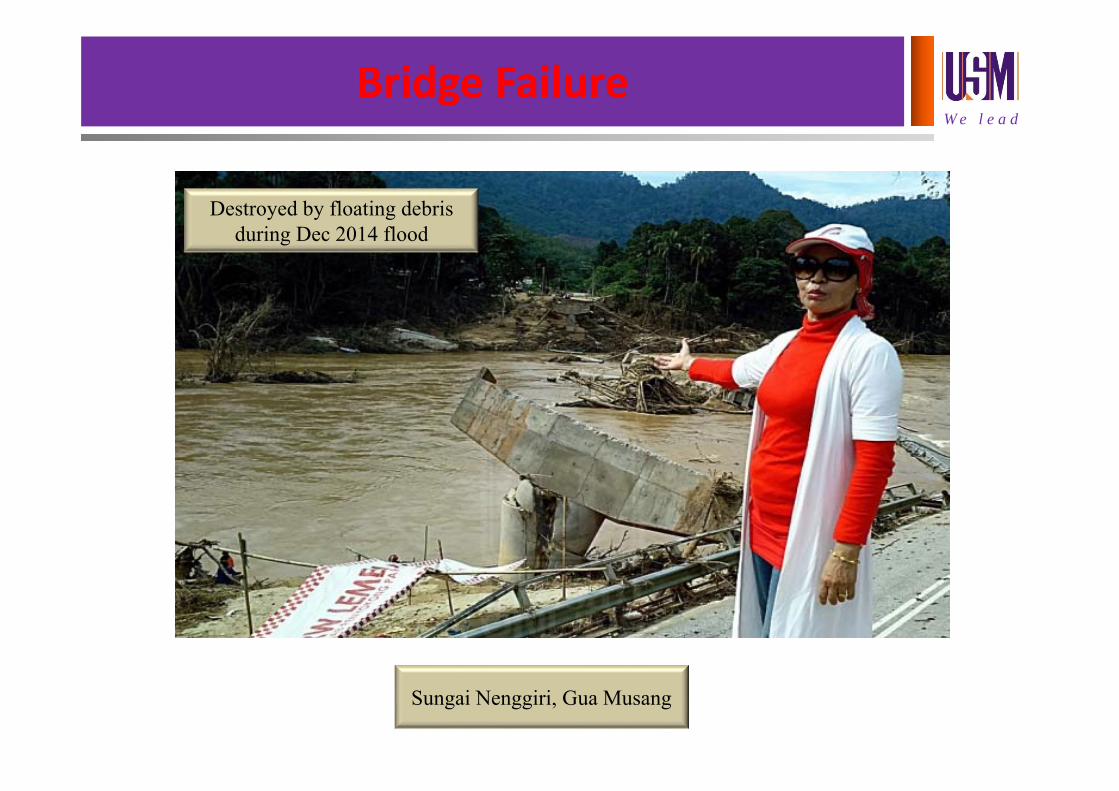
Bridge Failure
Sungai Nenggiri, Gua Musang
Destroyed by floating debris during Dec 2014 flood
W e l e a d
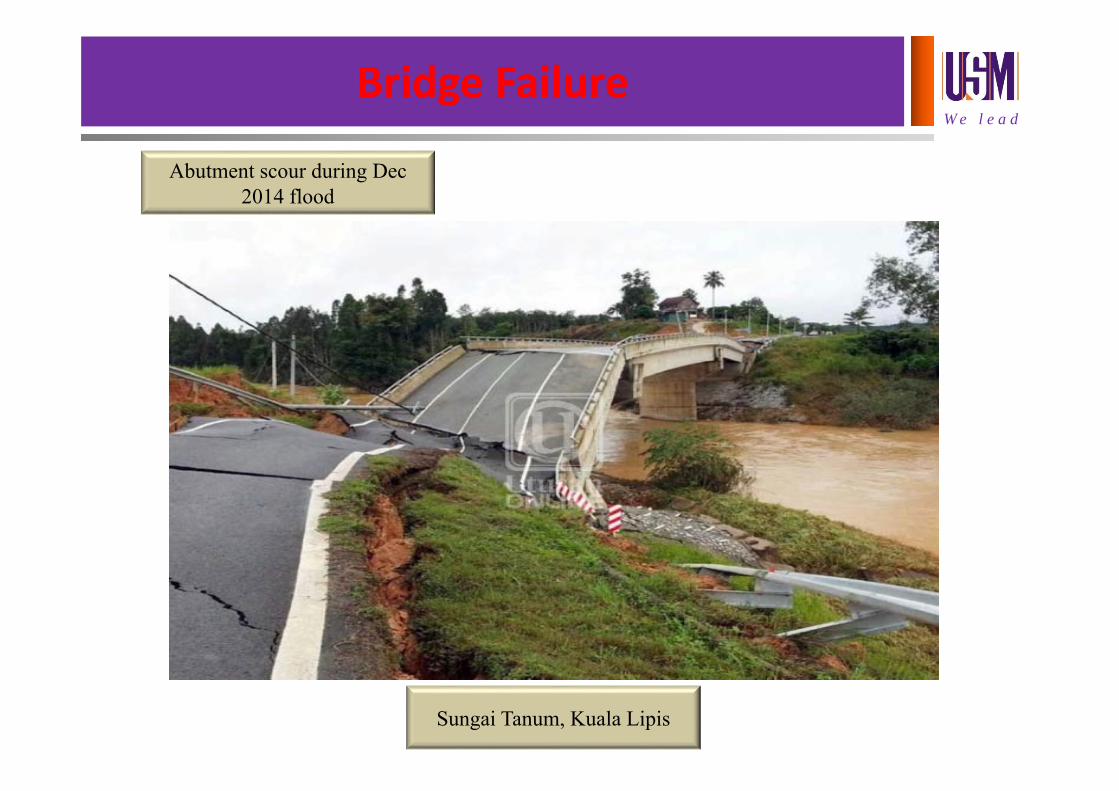
Bridge Failure
Sungai Tanum, Kuala Lipis
Abutment scour during Dec 2014 flood
W e l e a d
Cross Drainage
Structure built over the roads, railways and rivers
• Culverts ‐ shorter span < 6 m
• Bridges ‐ high‐level crossing structures which can beexpensive for large rivers. It is therefore essential to protectthem even from rare floods.
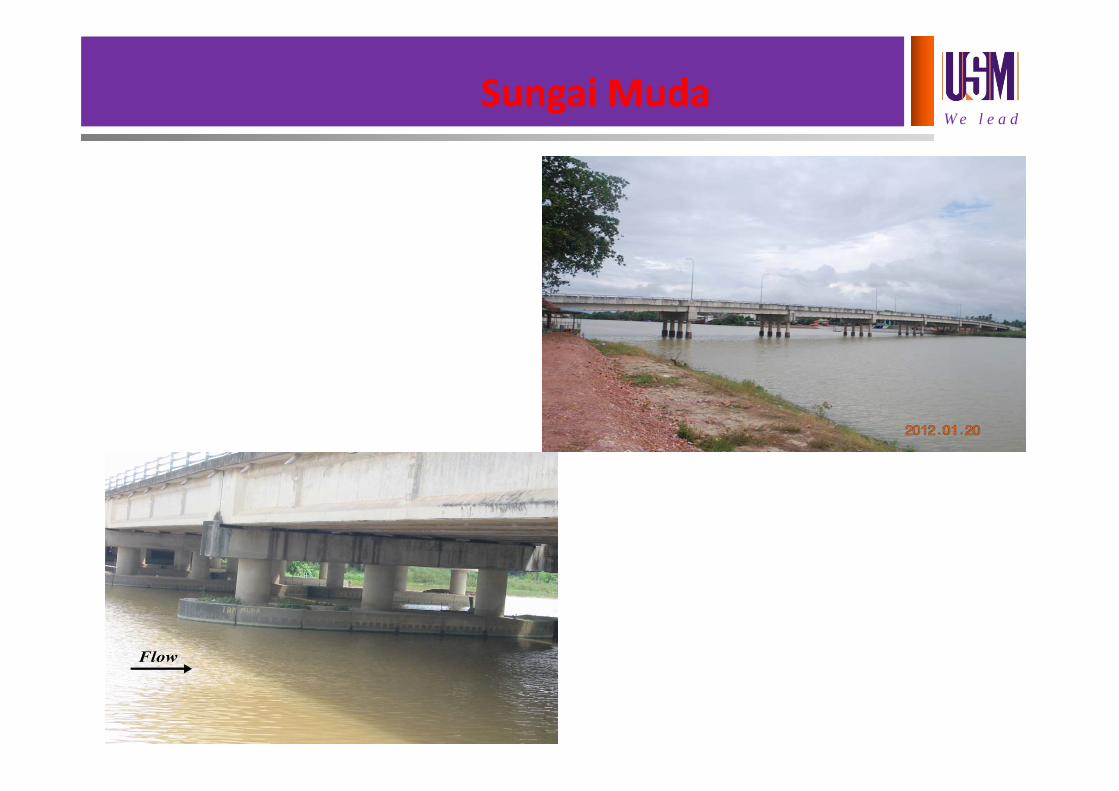
W e l e a dSungai Muda
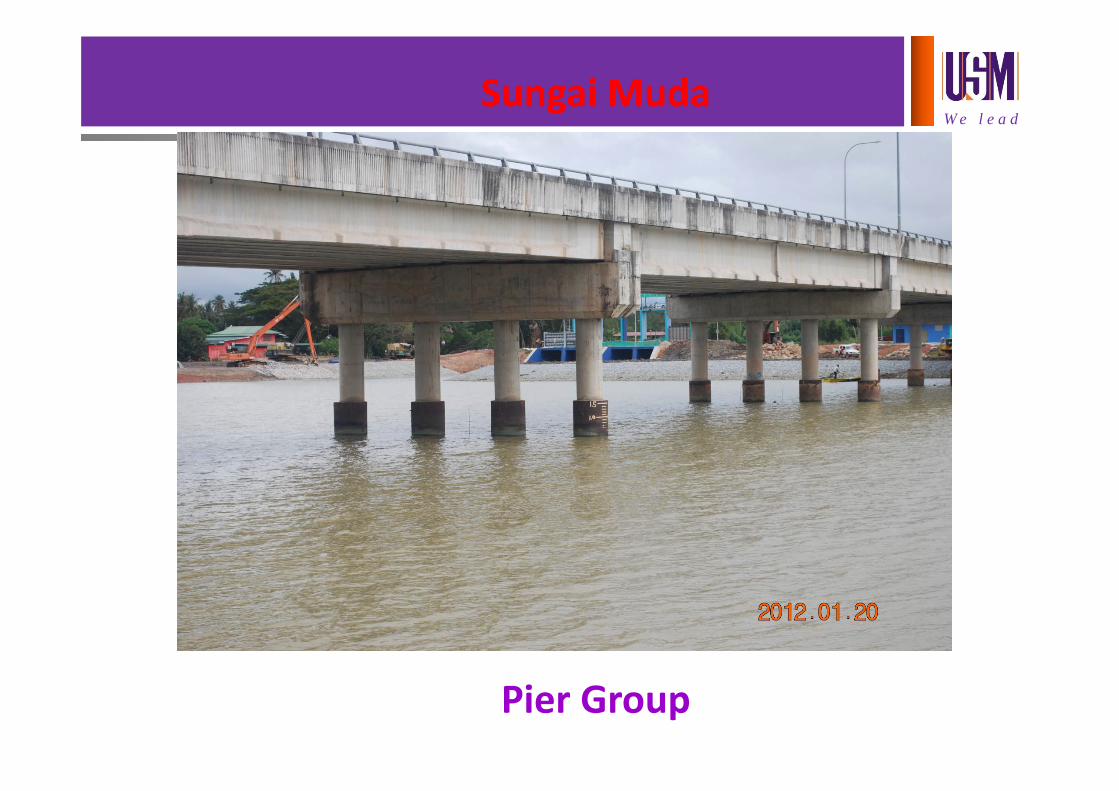
W e l e a dSungai Muda
Pier Group
W e l e a d
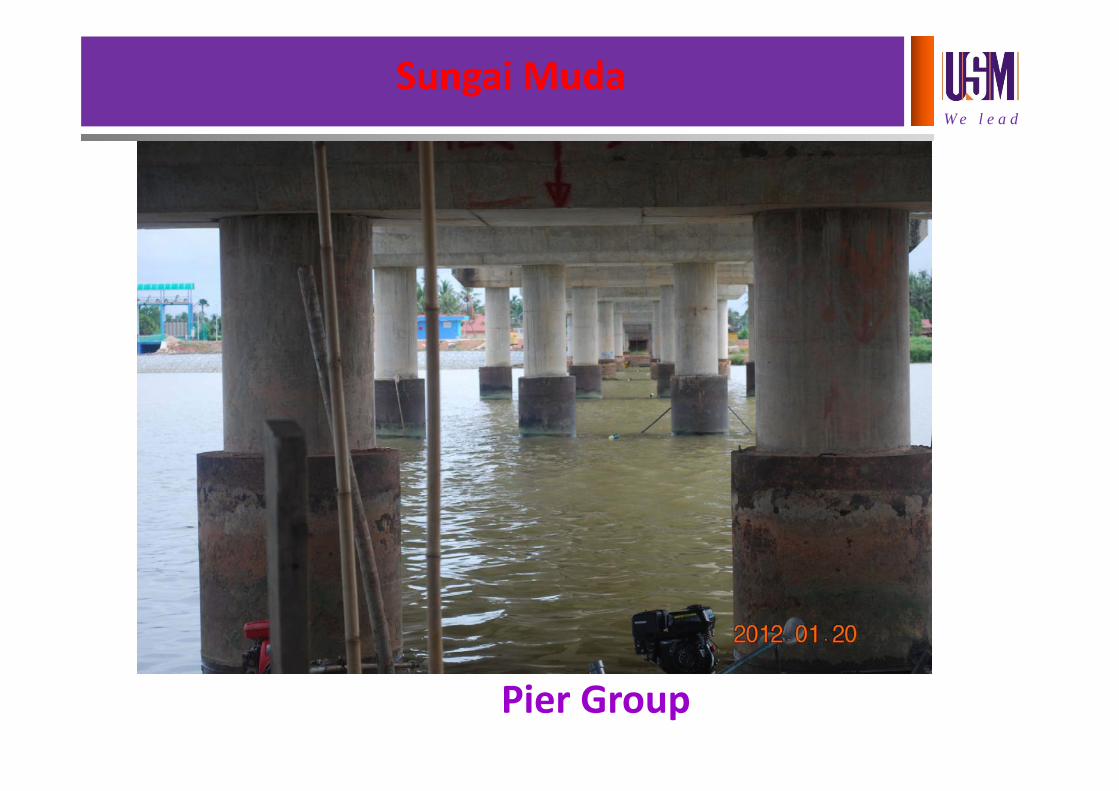
Sungai Muda
Pier Group
W e l e a d
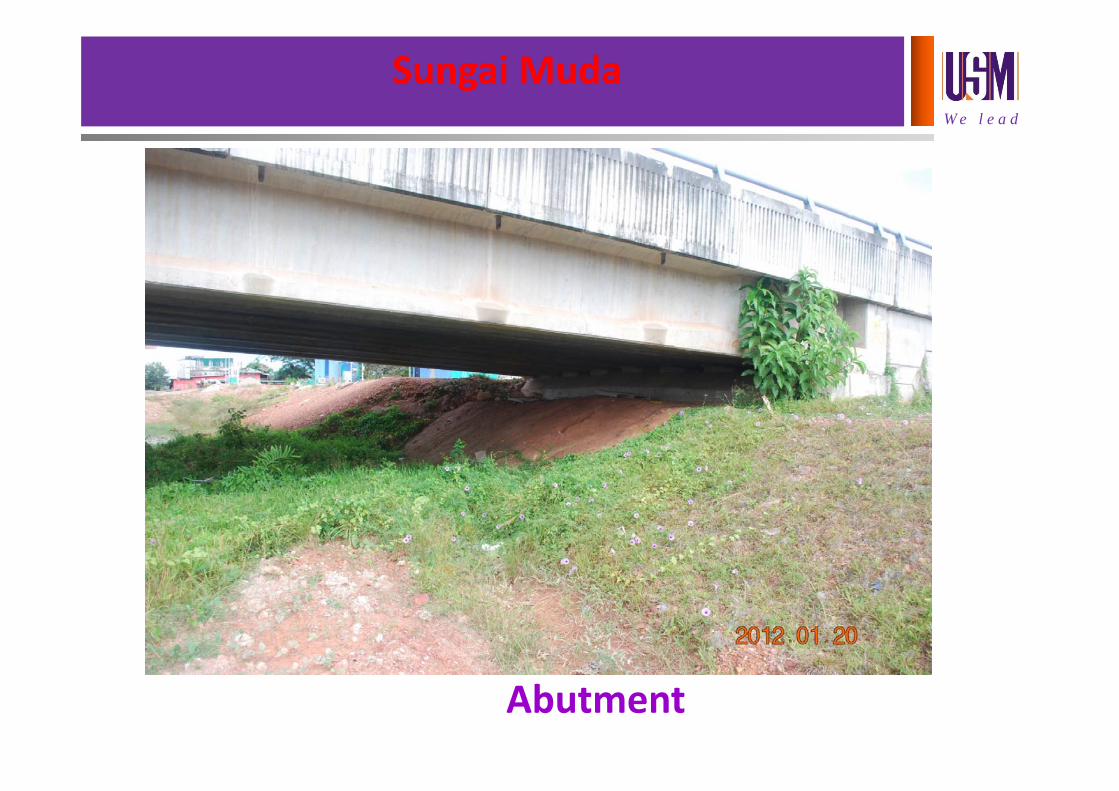
Sungai Muda
Abutment
W e l e a d
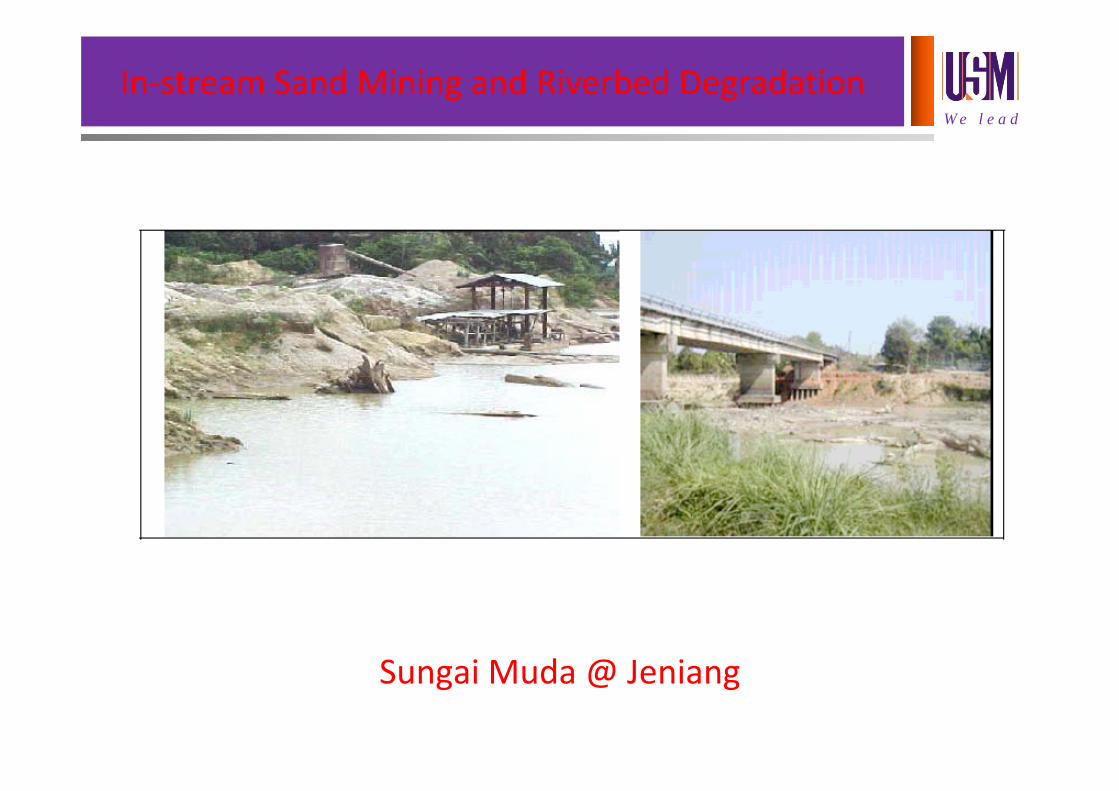
In‐stream Sand Mining and Riverbed Degradation
Sungai Muda @ Jeniang
W e l e a dHydraulic Issues in Bridge Design
The presence of a bridge across a stream createsconstricted flow through its openings because of
(a) the reduction in the width of the stream due topiers and their associated end contractions and
(b) the fluming of the stream itself (in the case ofwide streams with flood plains) to reduce the costsof the structure
W e l e a dHydraulic Issues in Bridge Design
• Local scour around the piers and bridge abutmentsand possible bed erosion
• A considerable backwater effect of the bridge. Thecorresponding afflux (rise in upstream water level)depends on the type of flow (subcritical orsupercritical).
• As most bridges are designed for subcritical flowconditions in order to minimize scour and chokingproblems, further discussions here are mainlyconfined to subcritical flow.
W e l e a dHydraulic Issues in Bridge Design
The establishment of afflux levels is extremelyimportant for the design of upstream dykes and otherprotective works and also for the location of safe bridgedeck levels (to avoid the flooding of the deck and anyconsequent structural damage).
It is equally important to determine the minimum clearlength of span (economic considerations) which willnot cause undesirable afflux levels.
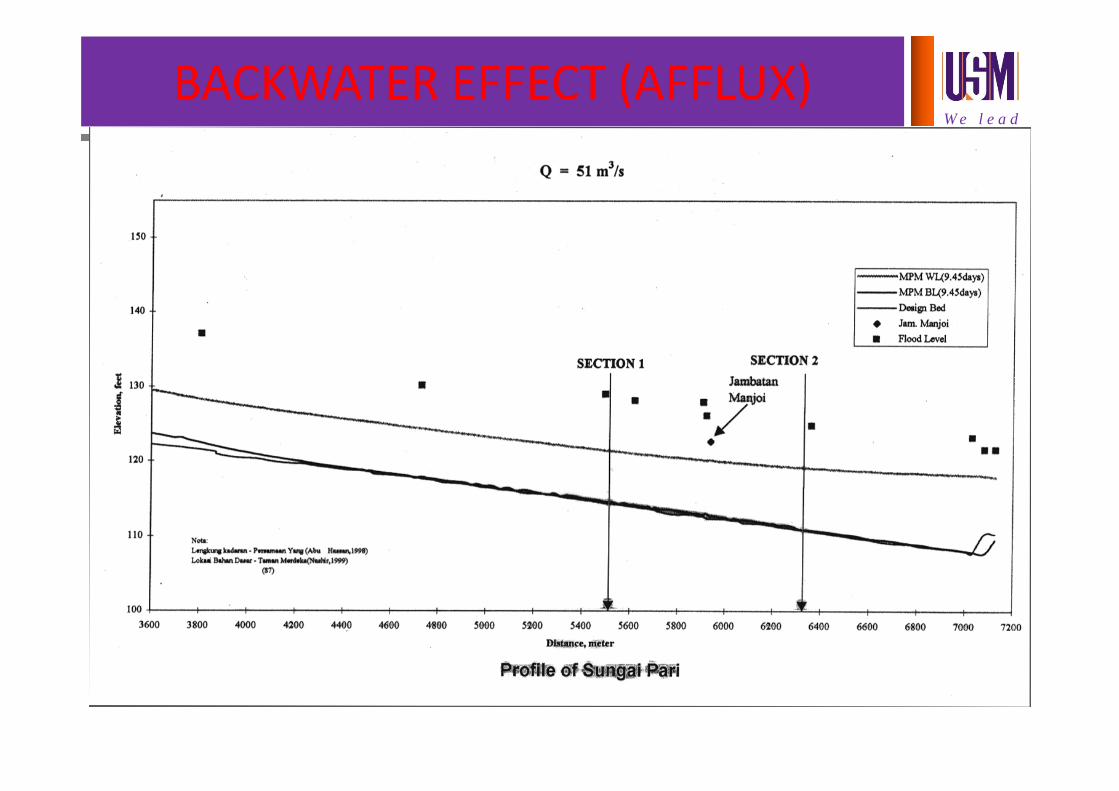
W e l e a dBACKWATER EFFECT (AFFLUX)
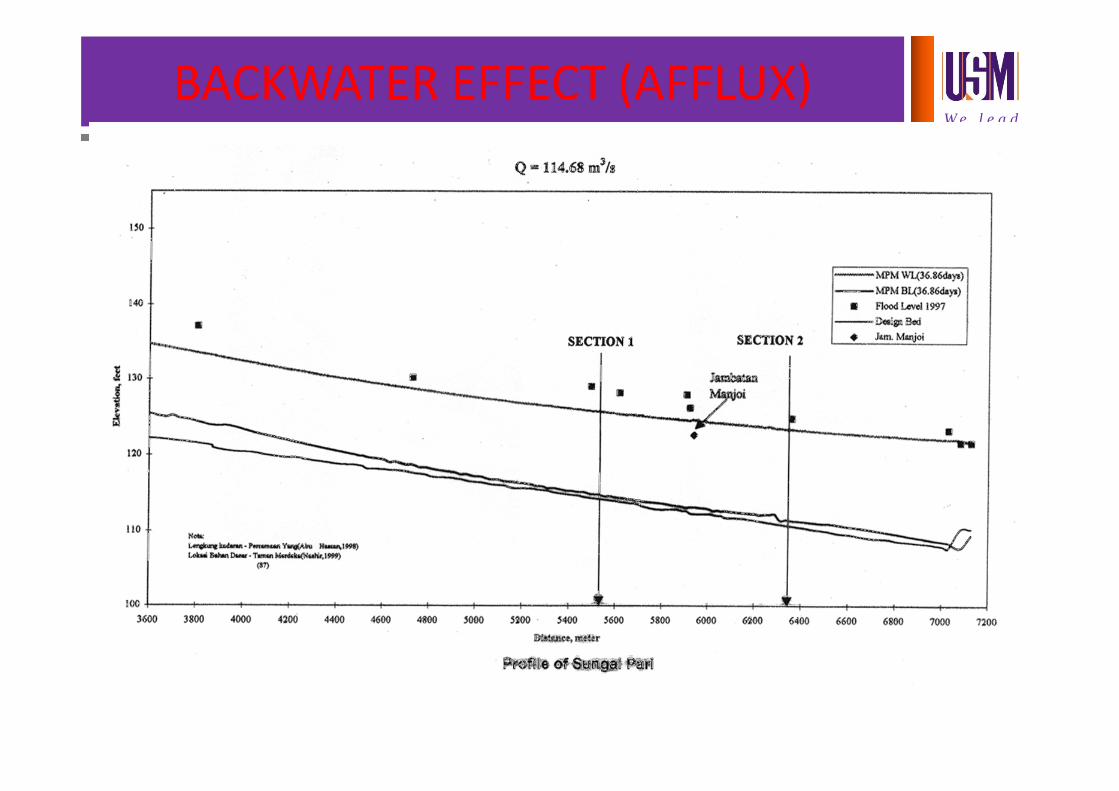
W e l e a dBACKWATER EFFECT (AFFLUX)
W e l e a d
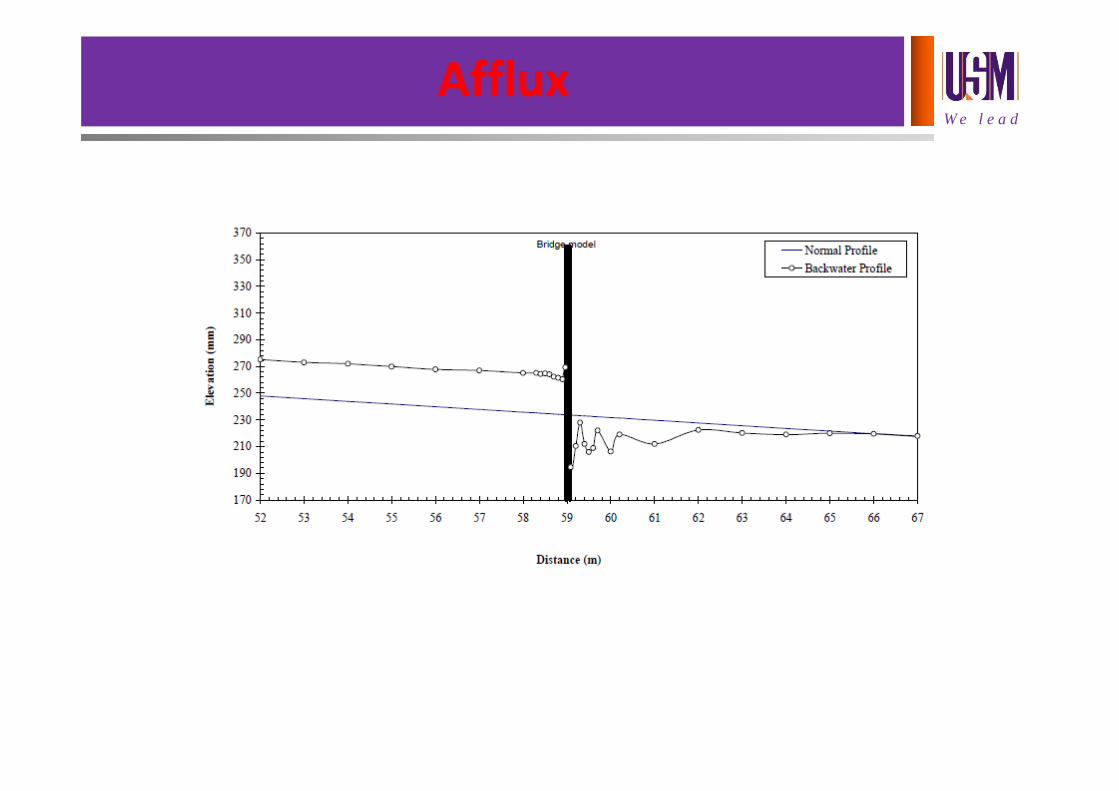
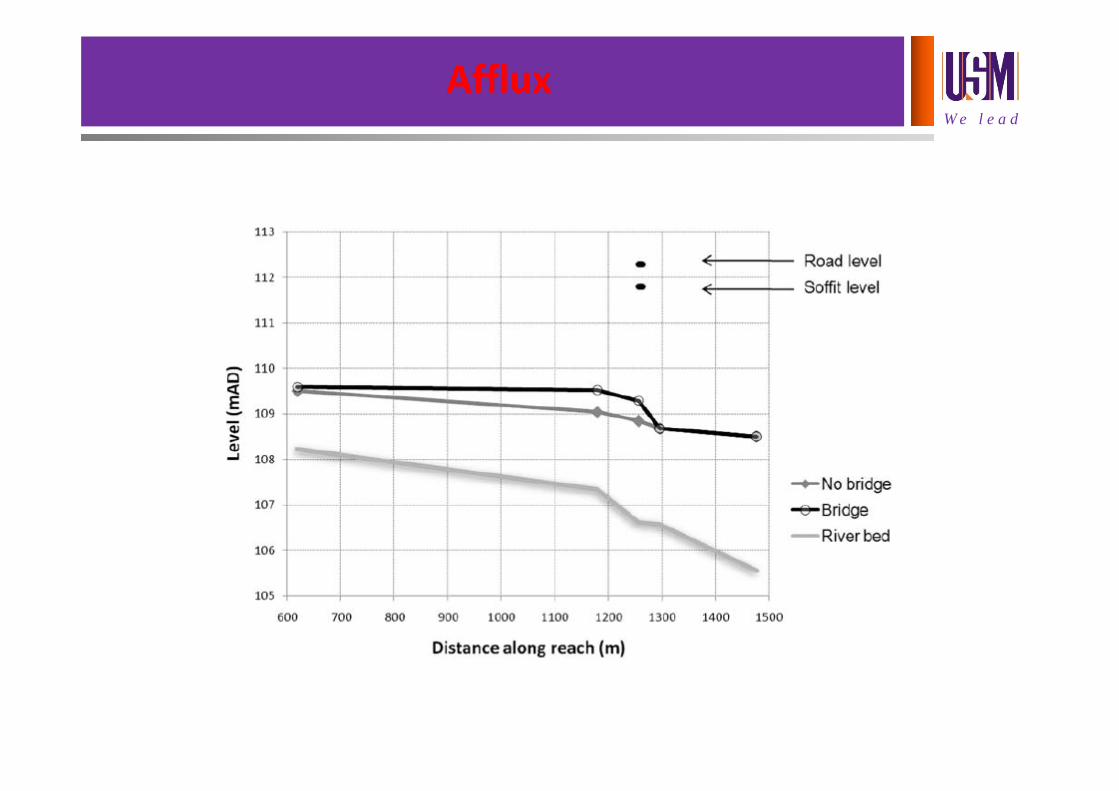
Afflux
W e l e a d
Afflux

W e l e a d
Afflux
W e l e a d
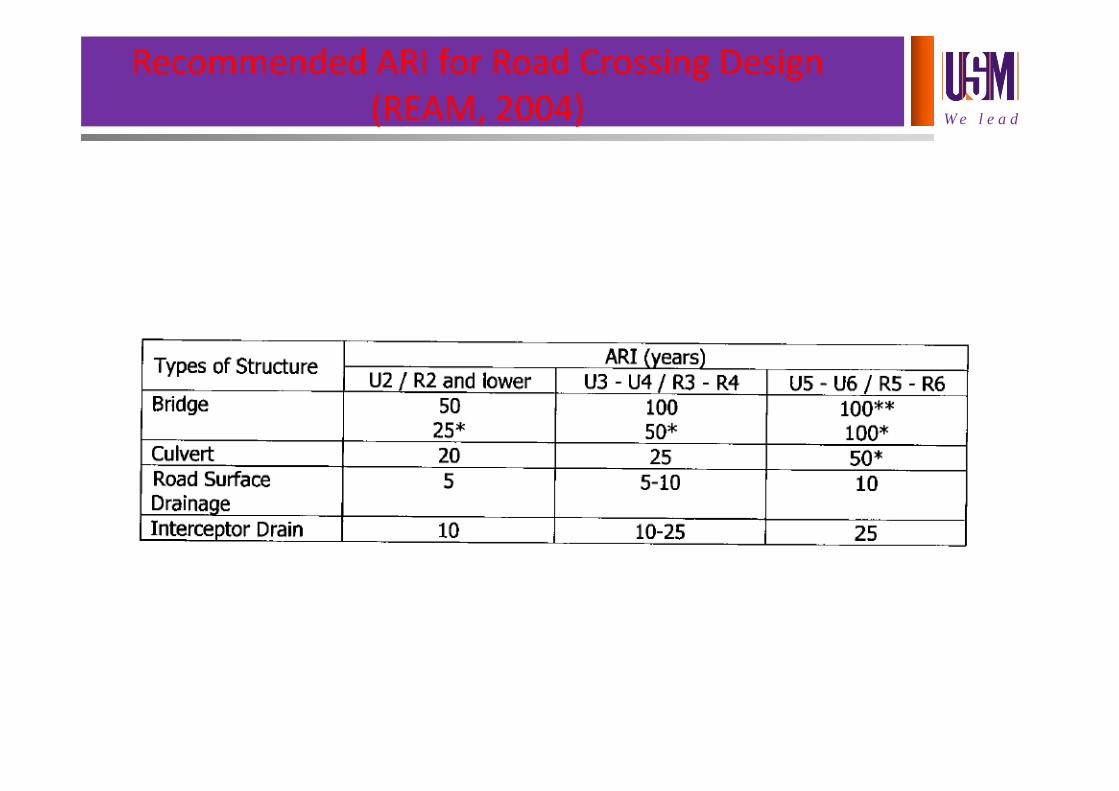
Recommended ARI for Road Crossing Design (REAM, 2004)
W e l e a d
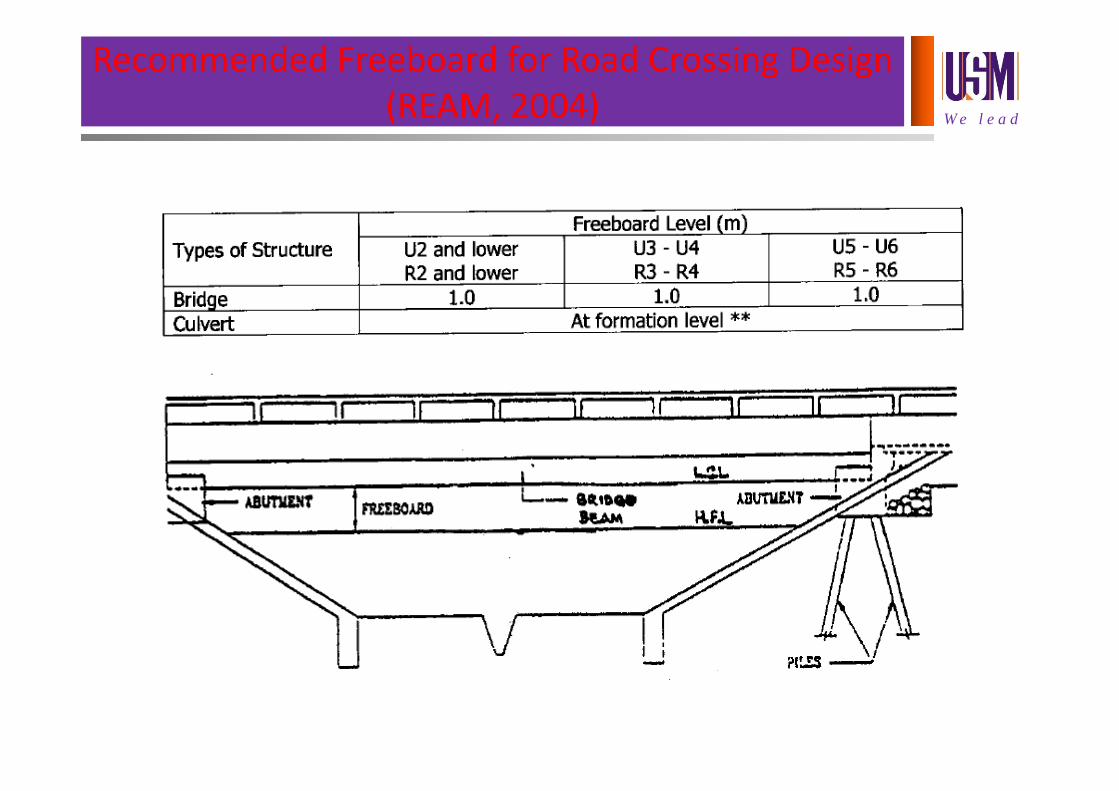
Recommended Freeboard for Road Crossing Design (REAM, 2004)
W e l e a dGuidelines
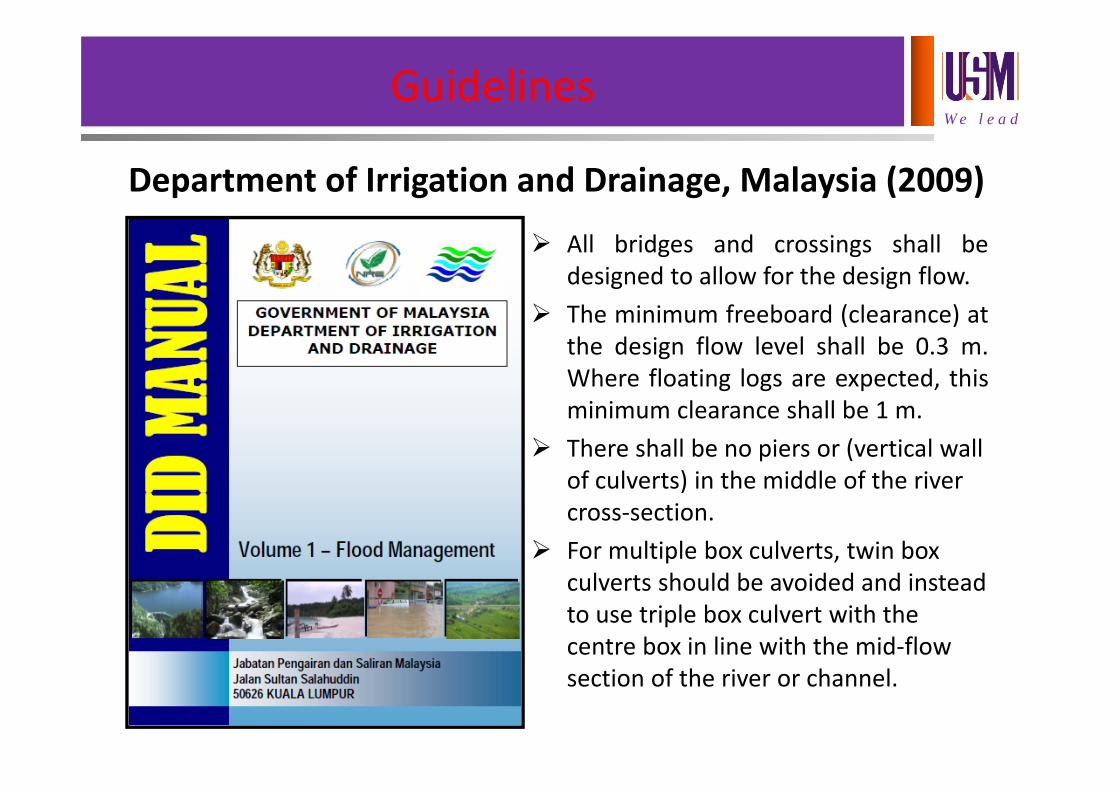
All bridges and crossings shall bedesigned to allow for the design flow.
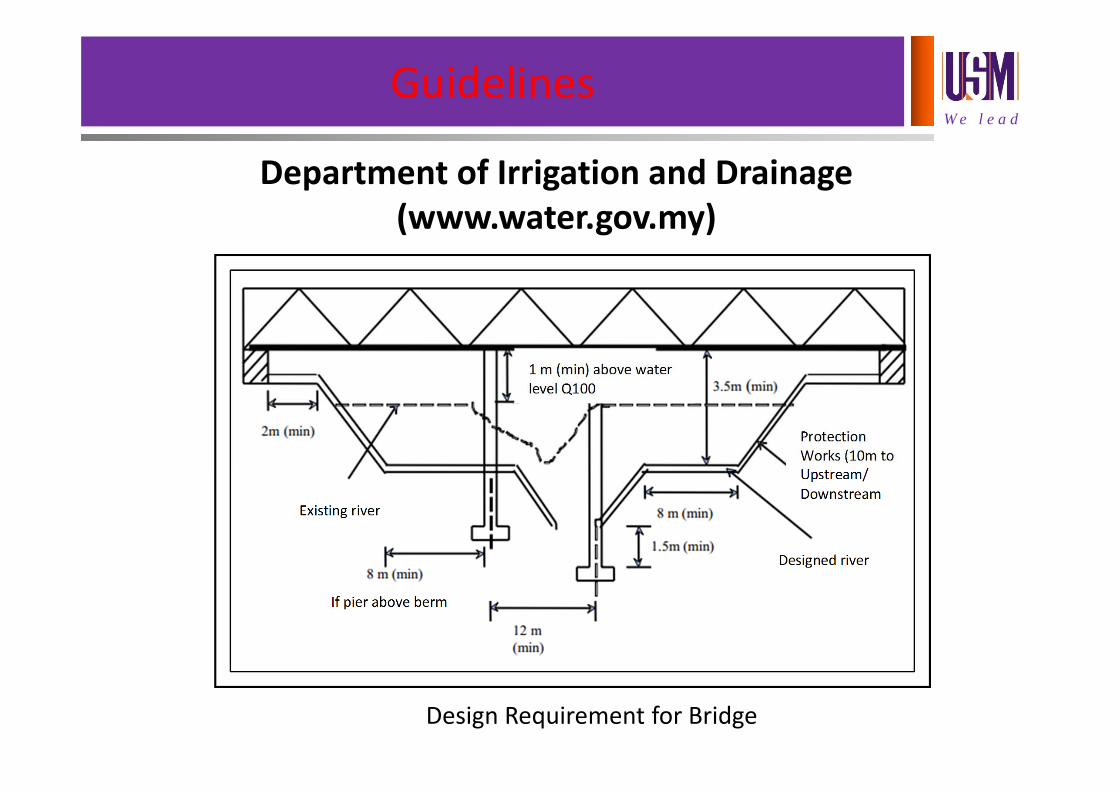
The minimum freeboard (clearance) atthe design flow level shall be 0.3 m.Where floating logs are expected, thisminimum clearance shall be 1 m.
There shall be no piers or (vertical wall of culverts) in the middle of the river cross‐section.
For multiple box culverts, twin box culverts should be avoided and instead to use triple box culvert with the centre box in line with the mid‐flow section of the river or channel.
Department of Irrigation and Drainage, Malaysia (2009)
W e l e a d
Guidelines
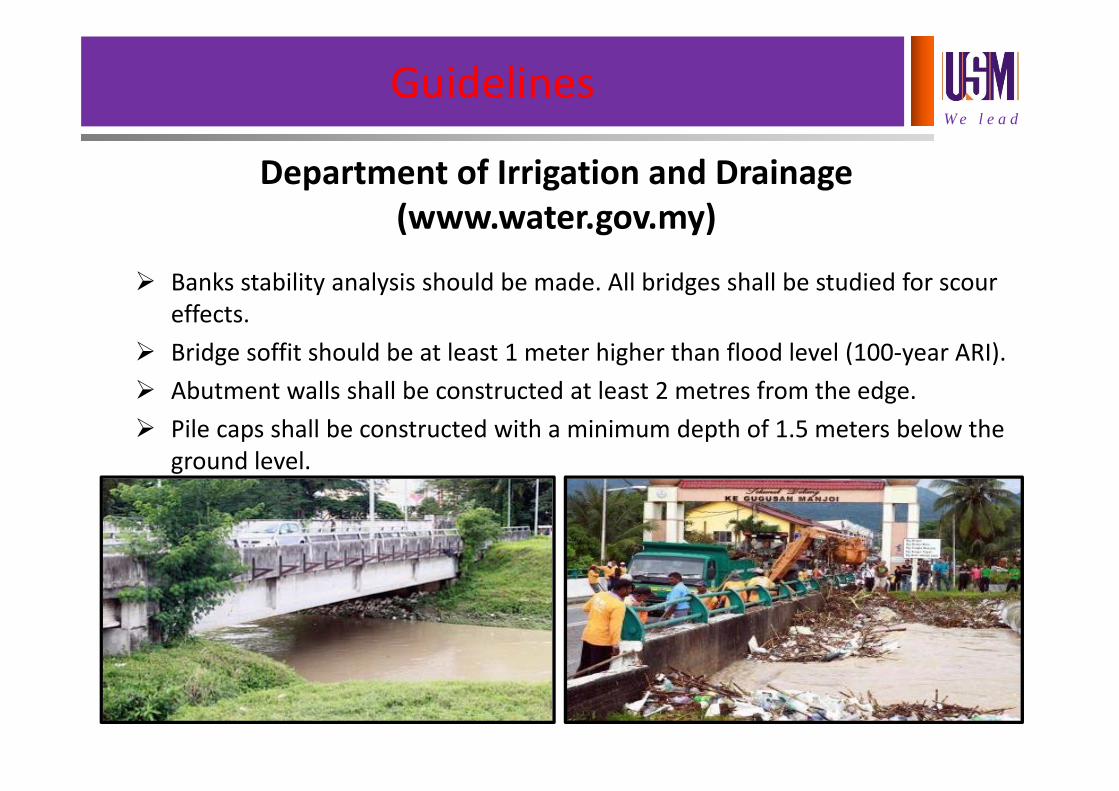
Banks stability analysis should be made. All bridges shall be studied for scour effects.
Bridge soffit should be at least 1 meter higher than flood level (100‐year ARI). Abutment walls shall be constructed at least 2 metres from the edge. Pile caps shall be constructed with a minimum depth of 1.5 meters below the
ground level.
Department of Irrigation and Drainage(www.water.gov.my)
W e l e a d
Guidelines
Design Requirement for Bridge
Department of Irrigation and Drainage(www.water.gov.my)
W e l e a d
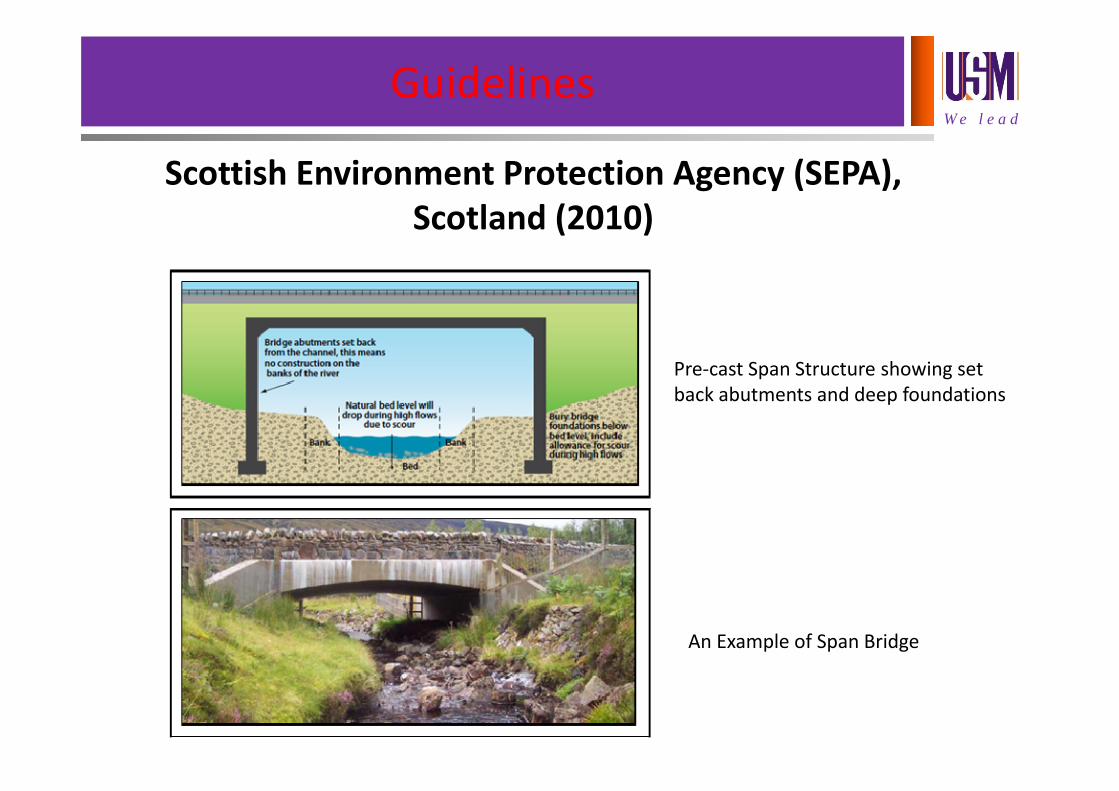
Guidelines
Pre‐cast Span Structure showing set back abutments and deep foundations
Scottish Environment Protection Agency (SEPA), Scotland (2010)
An Example of Span Bridge
W e l e a d
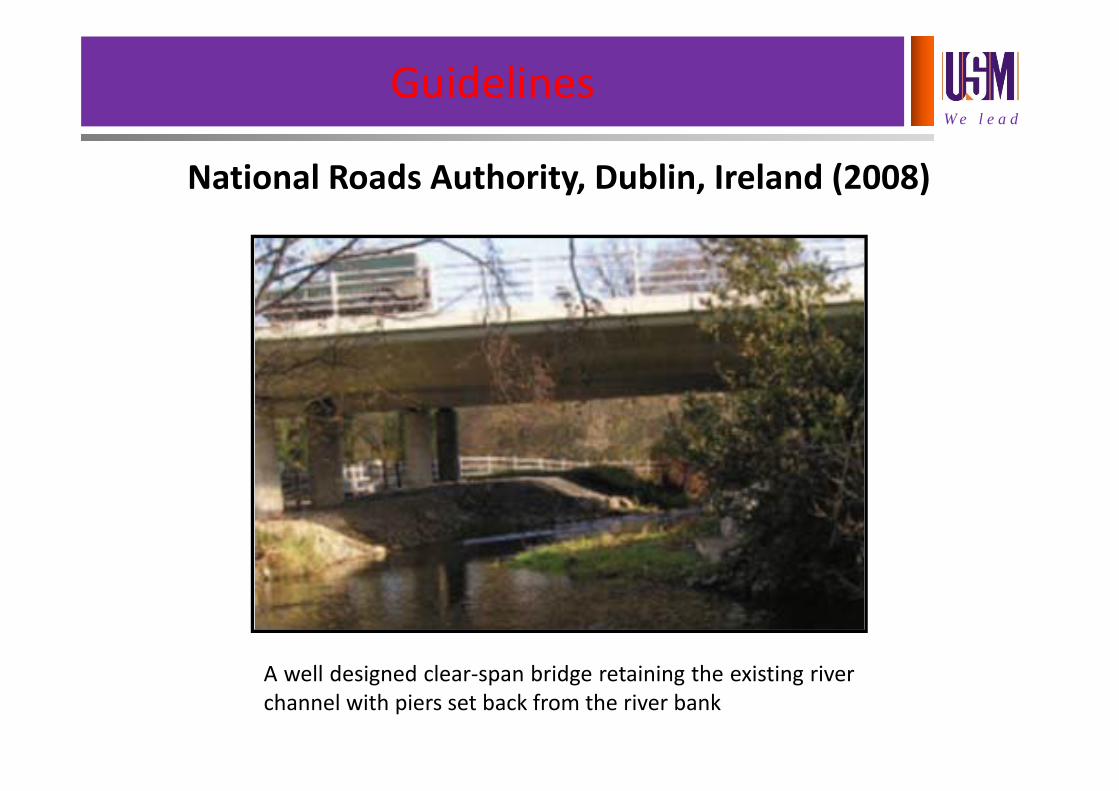
Guidelines
A well designed clear‐span bridge retaining the existing riverchannel with piers set back from the river bank
National Roads Authority, Dublin, Ireland (2008)
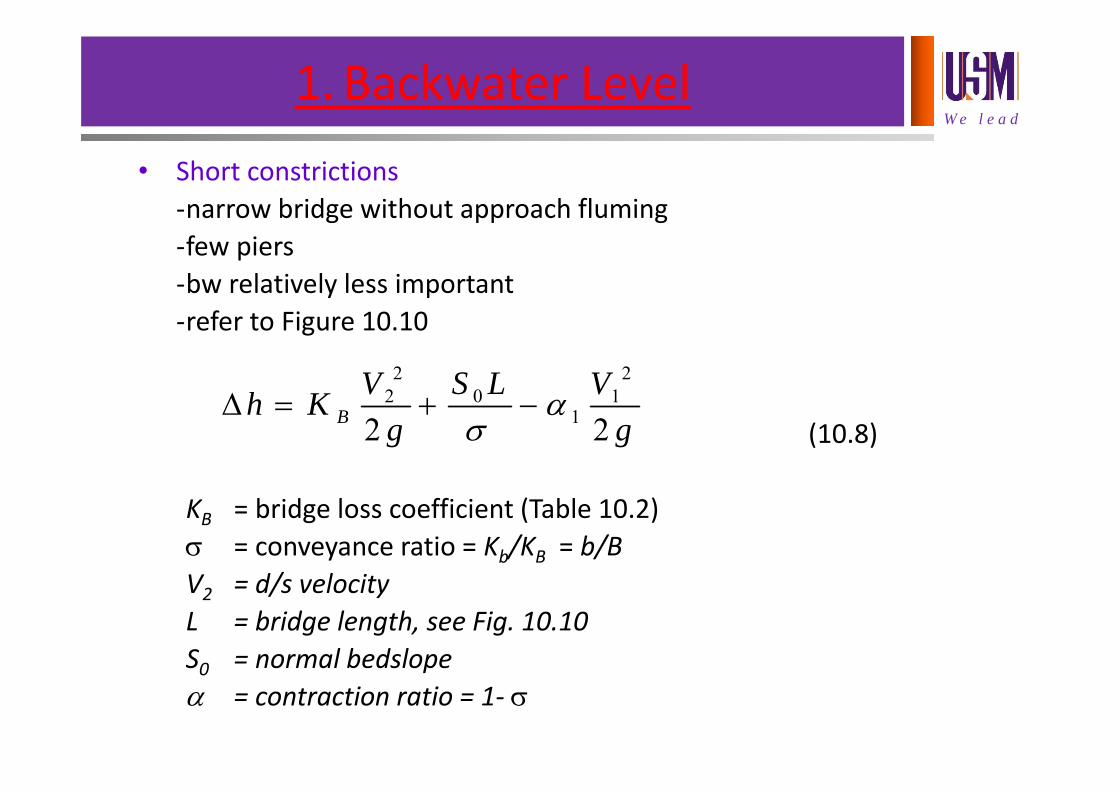
W e l e a d1. Backwater Level
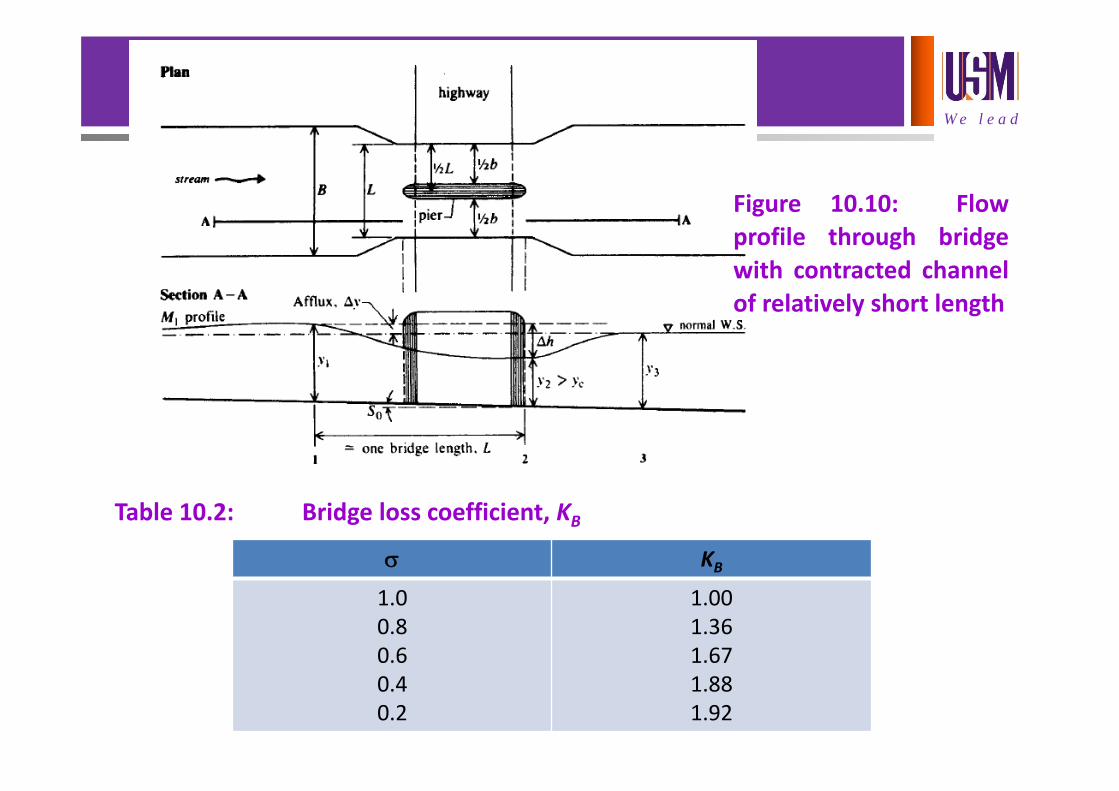
• Short constrictions ‐narrow bridge without approach fluming‐few piers‐bw relatively less important‐refer to Figure 10.10
(10.8)
KB = bridge loss coefficient (Table 10.2) = conveyance ratio = Kb/KB = b/BV2 = d/s velocityL = bridge length, see Fig. 10.10S0 = normal bedslope = contraction ratio = 1‐
gVLS
gVKh B 22
21
10
22
W e l e a d
Table 10.2: Bridge loss coefficient, KB KB1.00.80.60.40.2
1.001.361.671.881.92
Figure 10.10: Flowprofile through bridgewith contracted channelof relatively short length
W e l e a d1. BACKWATER LEVEL (bw)
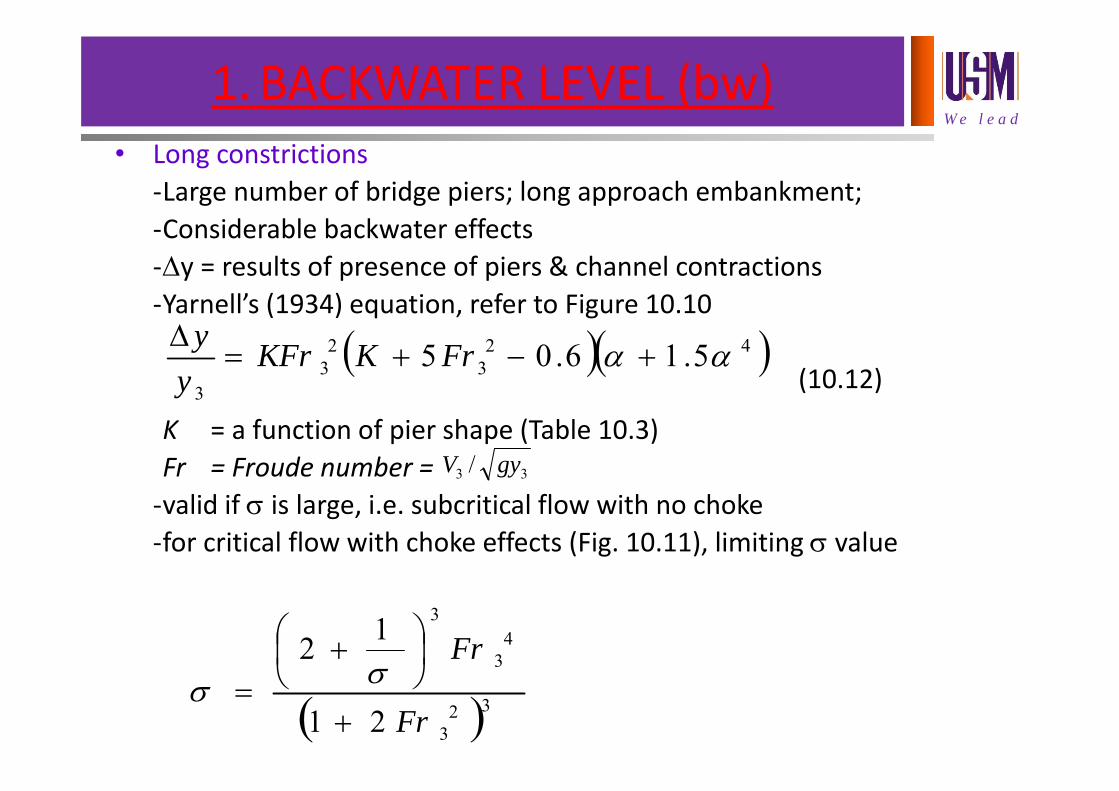
• Long constrictions ‐Large number of bridge piers; long approach embankment;‐Considerable backwater effects‐y = results of presence of piers & channel contractions‐Yarnell’s (1934) equation, refer to Figure 10.10
(10.12)
K = a function of pier shape (Table 10.3)Fr = Froude number = ‐valid if is large, i.e. subcritical flow with no choke‐for critical flow with choke effects (Fig. 10.11), limiting value
423
23
3
5.16.05 FrKKFry
y
33 / gyV
323
43
3
21
12
Fr
Fr
W e l e a d
W e l e a d
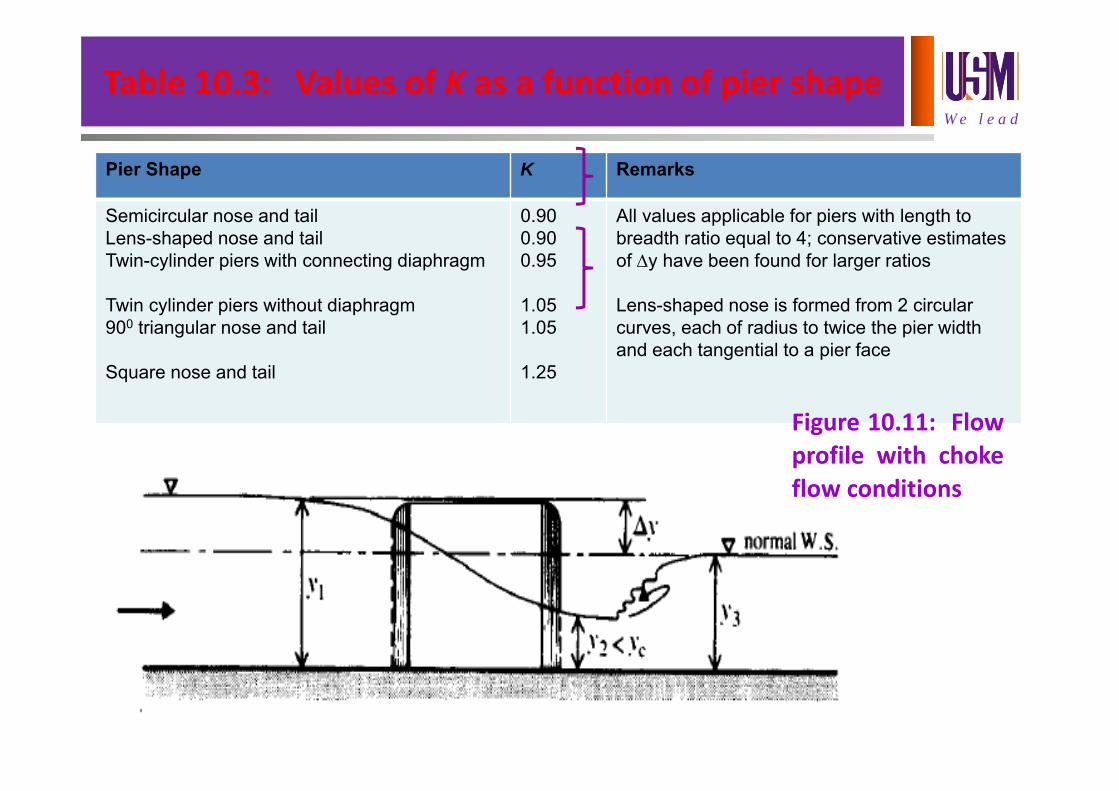
Table 10.3: Values of K as a function of pier shape
Pier Shape K Remarks
Semicircular nose and tail Lens-shaped nose and tailTwin-cylinder piers with connecting diaphragm
Twin cylinder piers without diaphragm 900 triangular nose and tail
Square nose and tail
0.900.900.95
1.051.05
1.25
All values applicable for piers with length to breadth ratio equal to 4; conservative estimates of y have been found for larger ratios
Lens-shaped nose is formed from 2 circular curves, each of radius to twice the pier width and each tangential to a pier face
Figure 10.11: Flowprofile with chokeflow conditions
W e l e a d
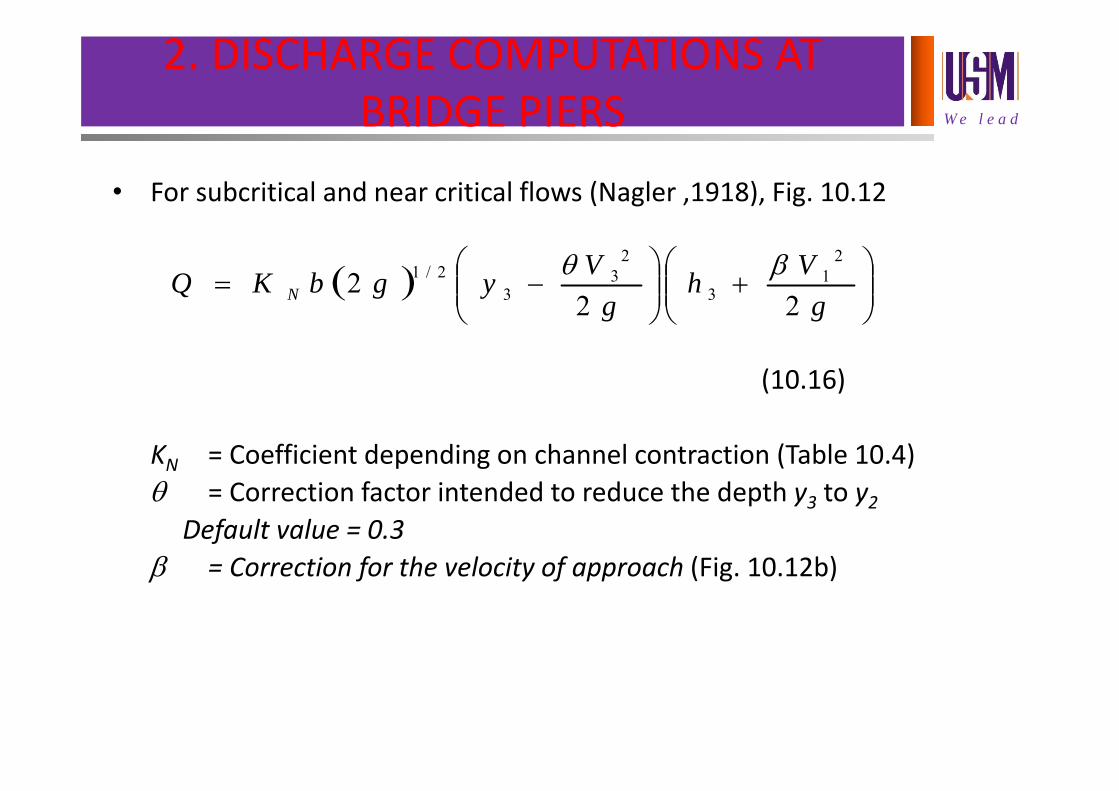
2. DISCHARGE COMPUTATIONS AT BRIDGE PIERS
• For subcritical and near critical flows (Nagler ,1918), Fig. 10.12
(10.16)
KN = Coefficient depending on channel contraction (Table 10.4) = Correction factor intended to reduce the depth y3 to y2
Default value = 0.3 = Correction for the velocity of approach (Fig. 10.12b)
gVh
gVygbKQ N 22
22
13
23
32/1
W e l e a d
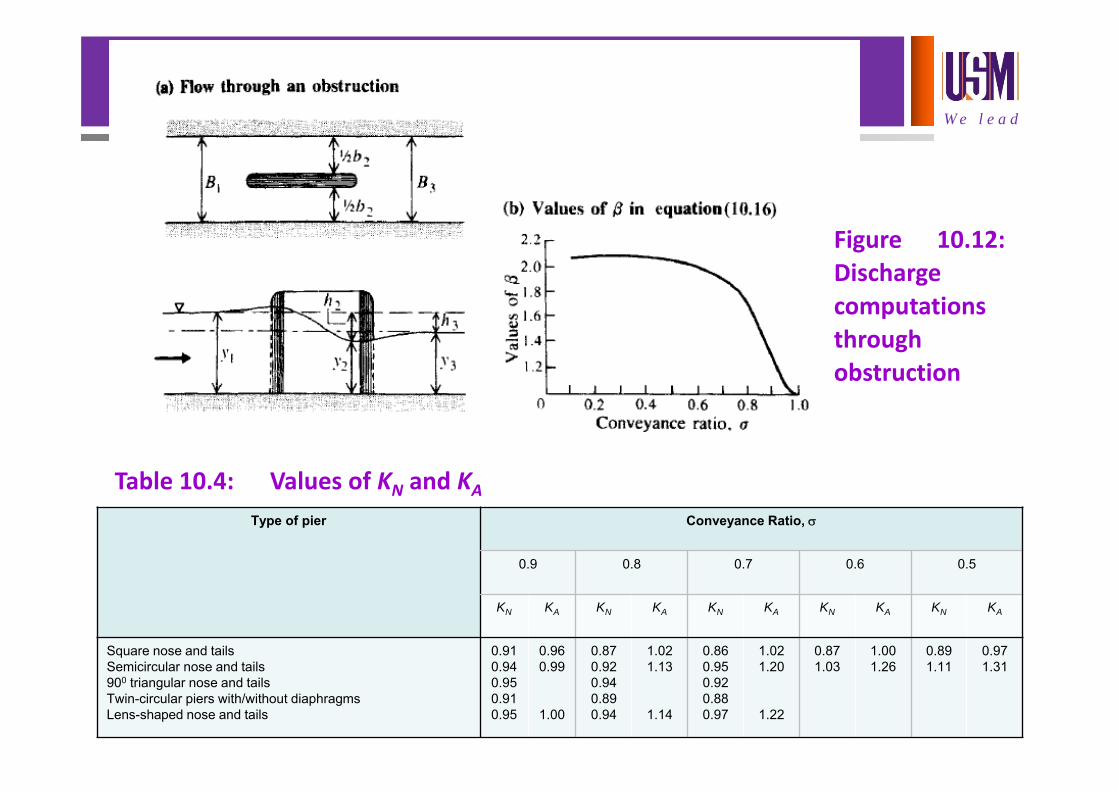
Table 10.4: Values of KN and KAType of pier Conveyance Ratio,
0.9 0.8 0.7 0.6 0.5
KN KA KN KA KN KA KN KA KN KA
Square nose and tailsSemicircular nose and tails900 triangular nose and tailsTwin-circular piers with/without diaphragmsLens-shaped nose and tails
0.910.940.950.910.95
0.960.99
1.00
0.870.920.940.890.94
1.021.13
1.14
0.860.950.920.880.97
1.021.20
1.22
0.871.03
1.001.26
0.891.11
0.971.31
Figure 10.12:Dischargecomputationsthroughobstruction
W e l e a d
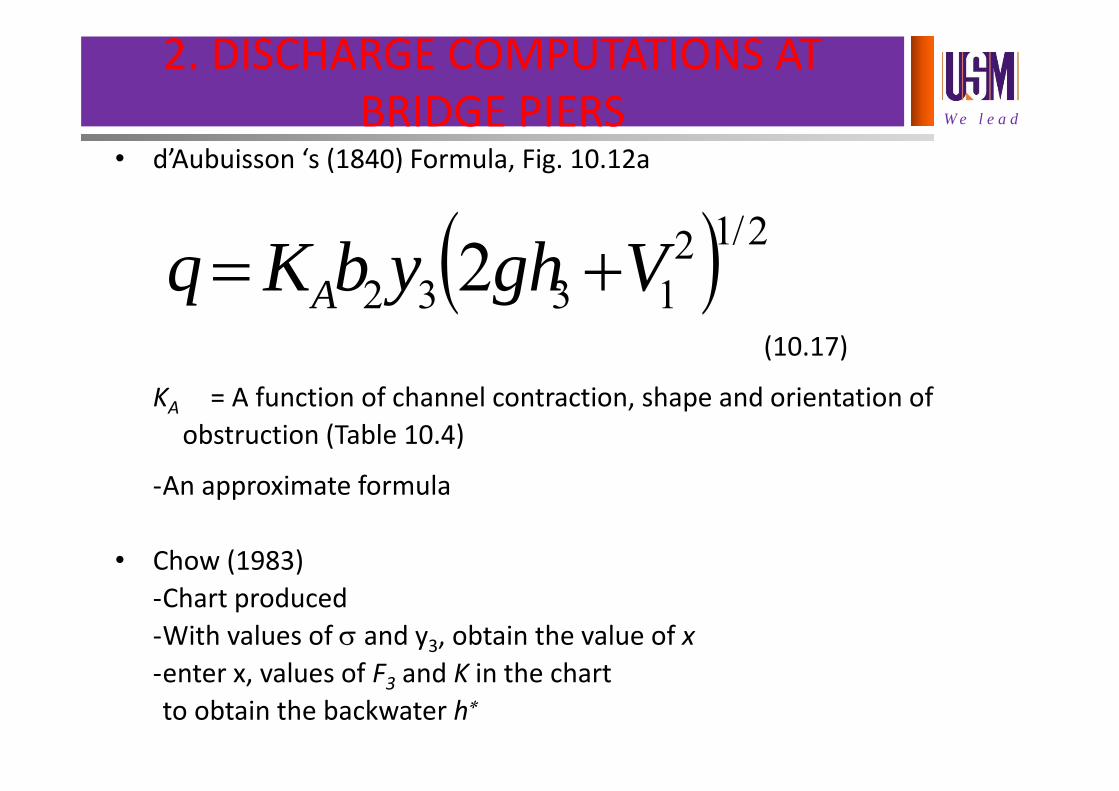
2. DISCHARGE COMPUTATIONS AT BRIDGE PIERS
• d’Aubuisson ‘s (1840) Formula, Fig. 10.12a
(10.17)
KA = A function of channel contraction, shape and orientation of obstruction (Table 10.4)
‐An approximate formula
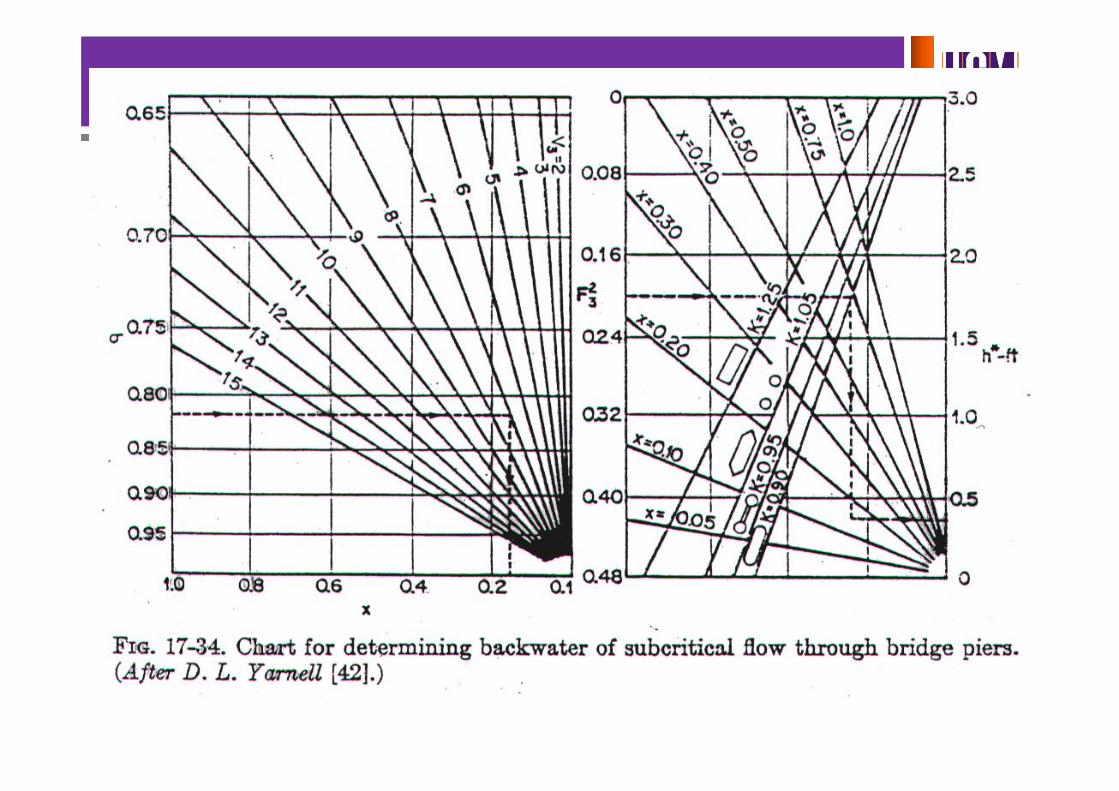
• Chow (1983)‐Chart produced‐With values of and y3, obtain the value of x‐enter x, values of F3 and K in the chartto obtain the backwater h
2/121332 2 VghybKq A
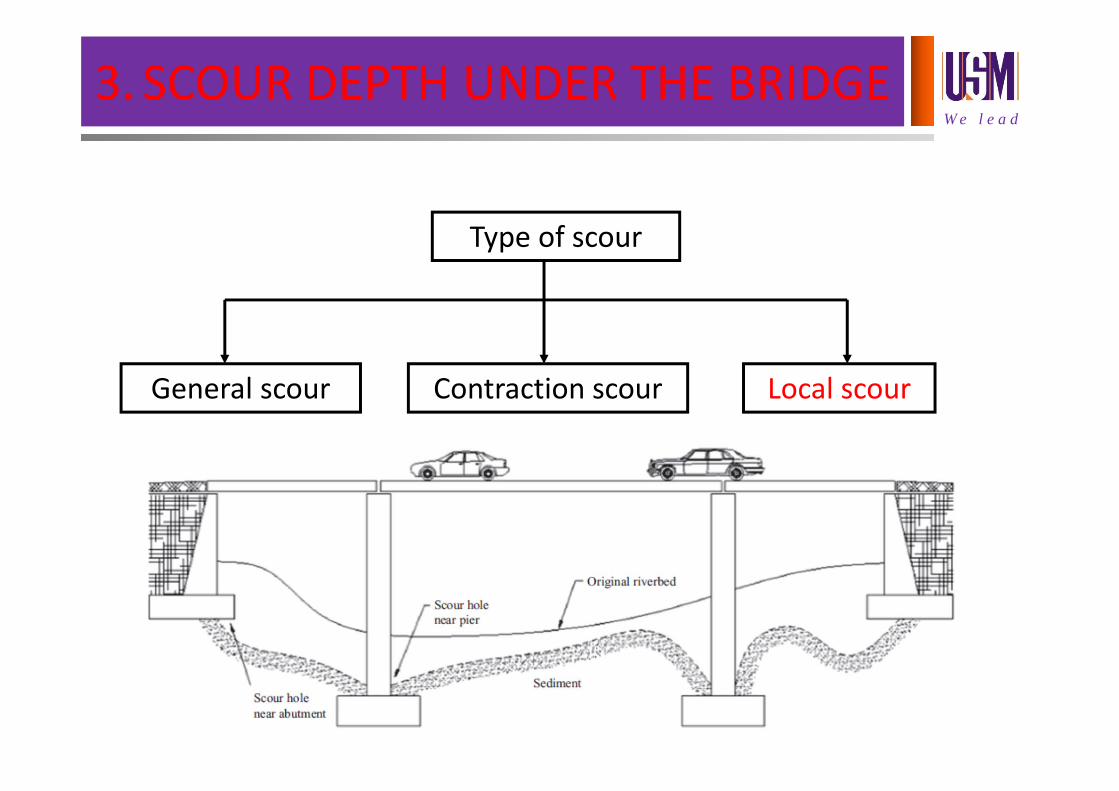
W e l e a d3. SCOUR DEPTH UNDER THE BRIDGE
Type of scour
Local scourContraction scourGeneral scour
W e l e a d
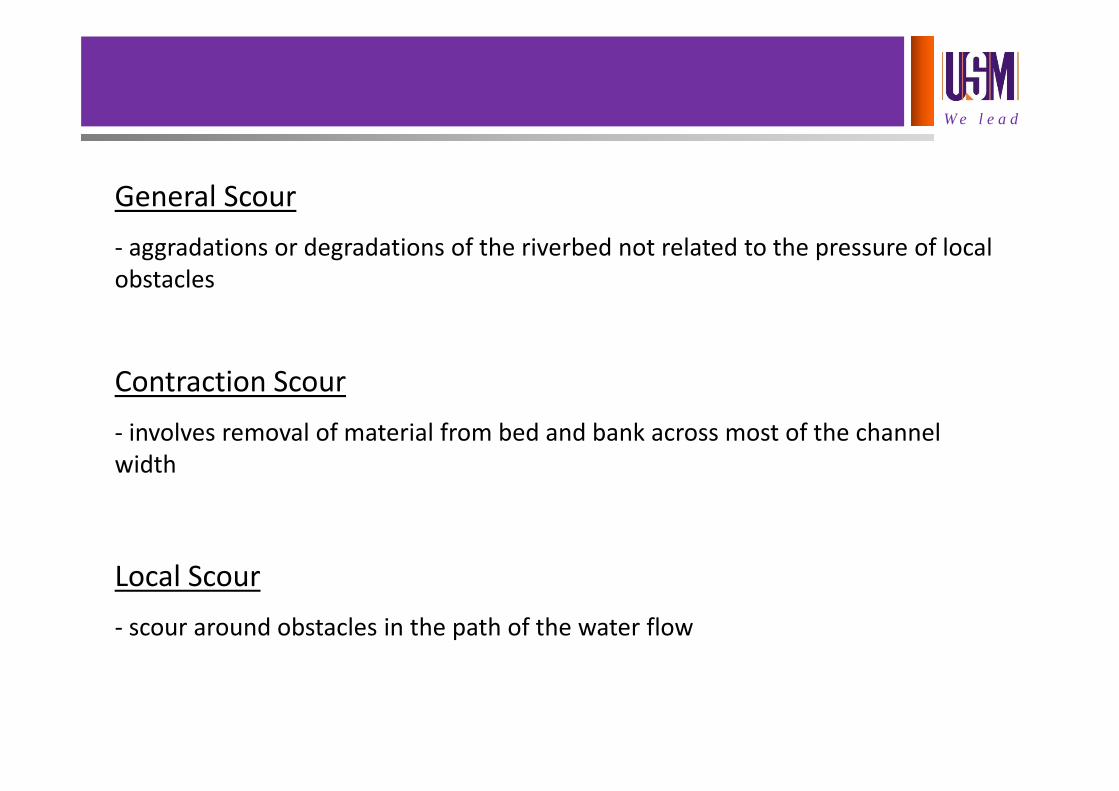
General Scour‐ aggradations or degradations of the riverbed not related to the pressure of local obstacles
Contraction Scour‐ involves removal of material from bed and bank across most of the channel width
Local Scour‐ scour around obstacles in the path of the water flow
W e l e a d
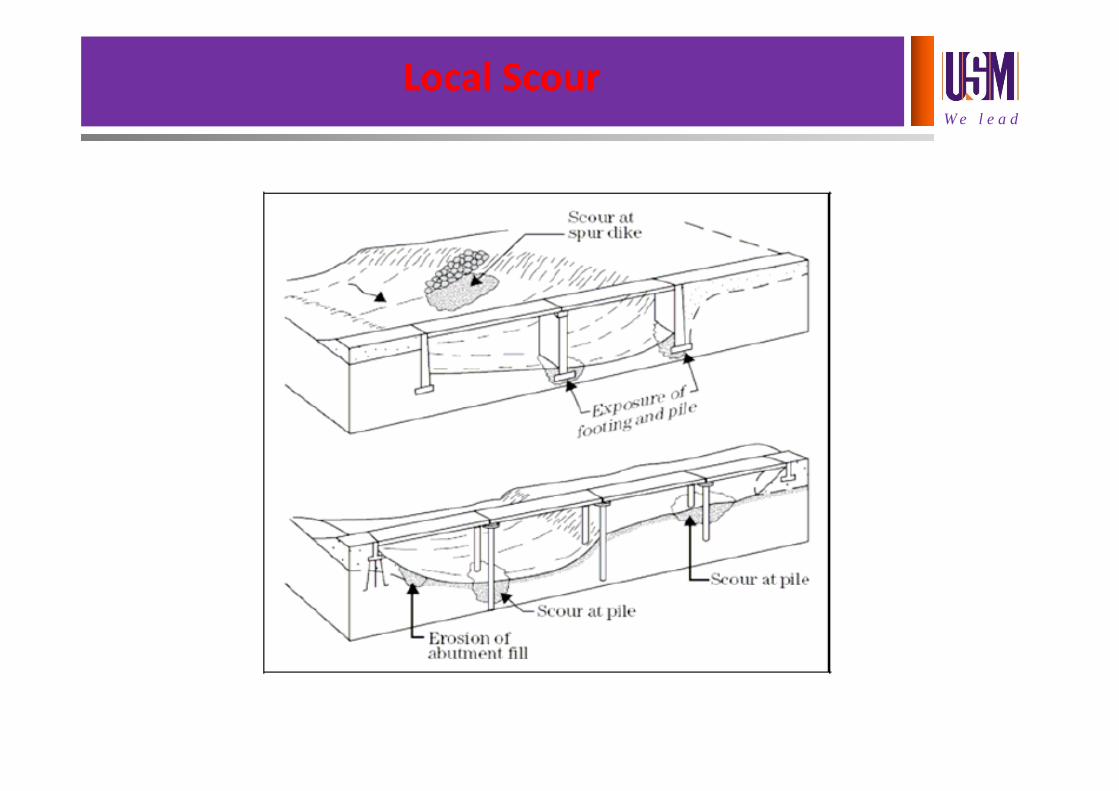
Local Scour
W e l e a d
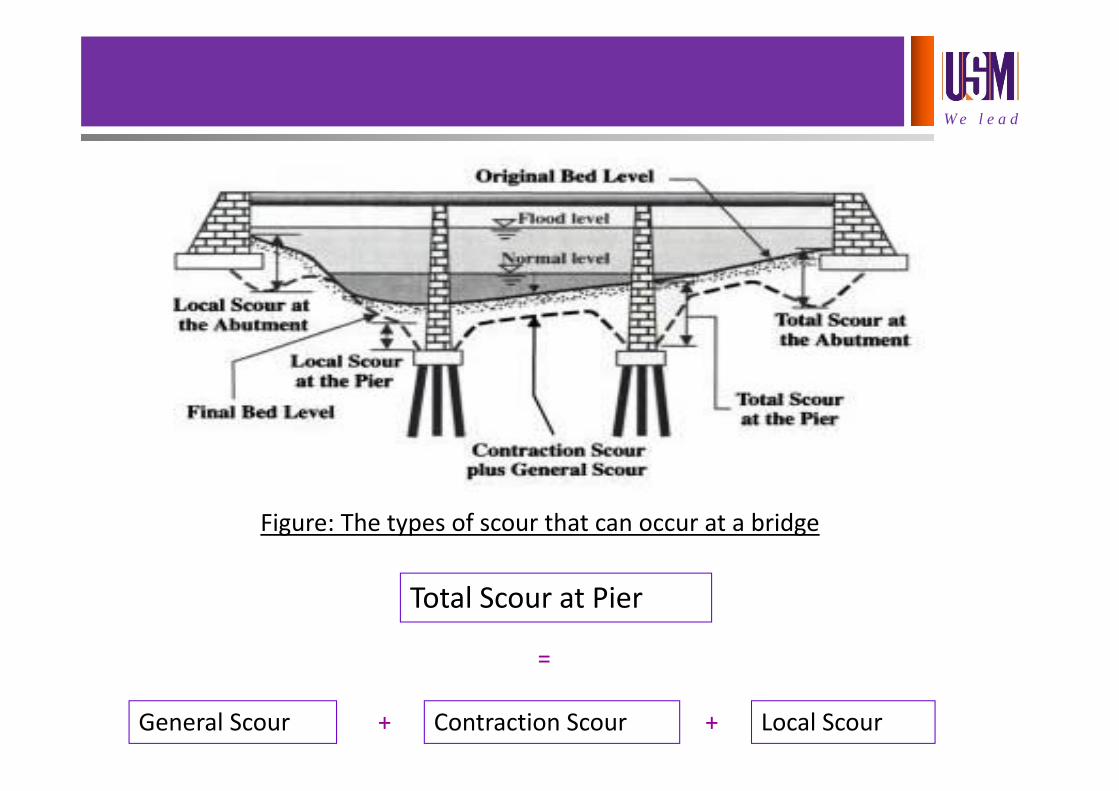
Total Scour at Pier
General Scour +
=
Contraction Scour Local Scour+
Figure: The types of scour that can occur at a bridge
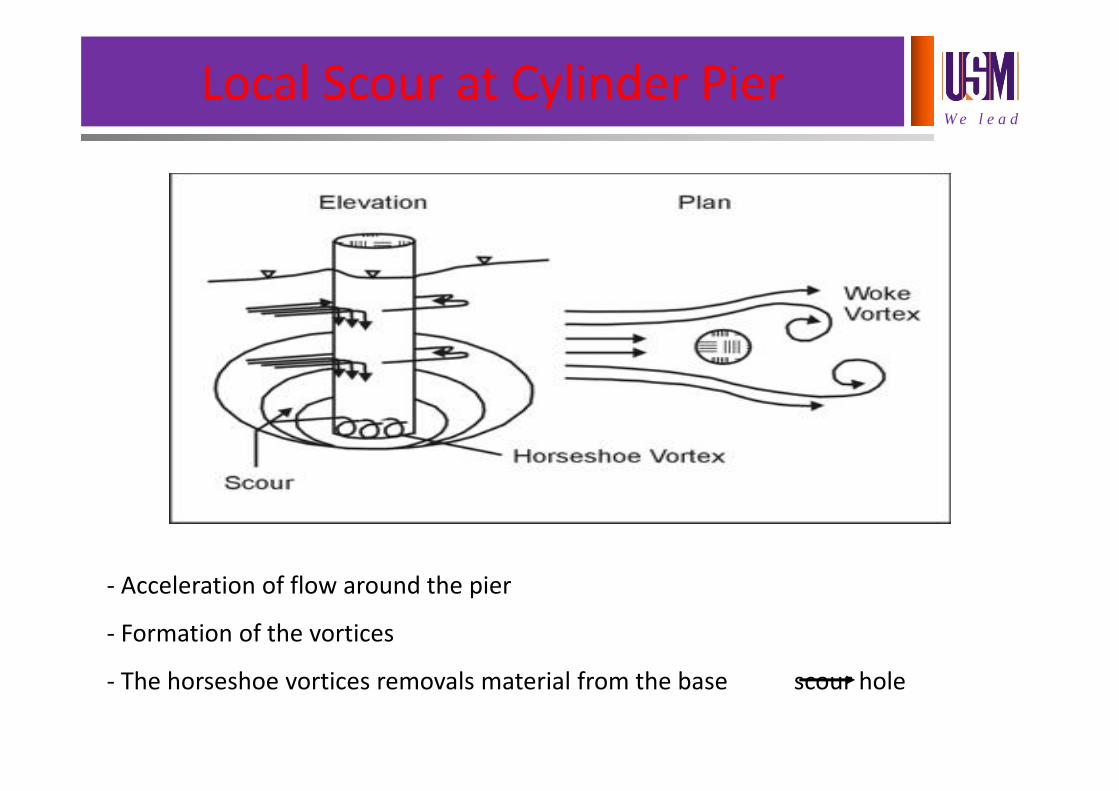
W e l e a dLocal Scour at Cylinder Pier
‐ Acceleration of flow around the pier
‐ Formation of the vortices
‐ The horseshoe vortices removals material from the base scour hole
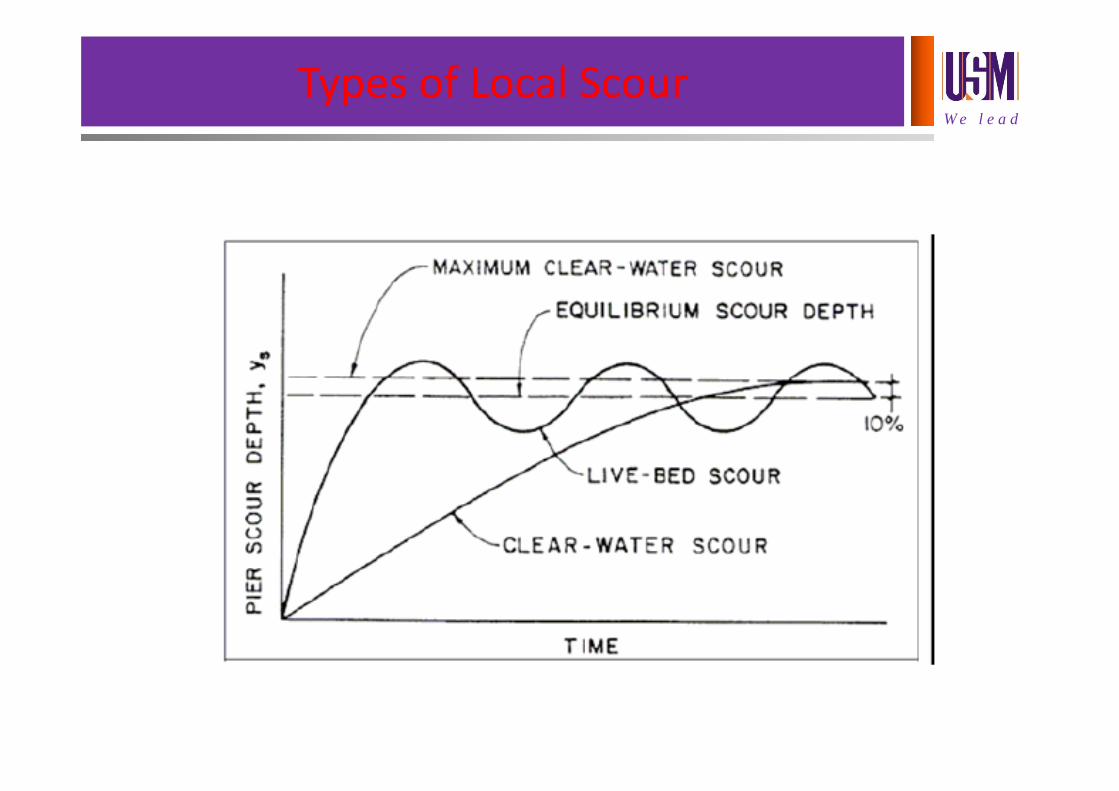
W e l e a d
Types of Local Scour
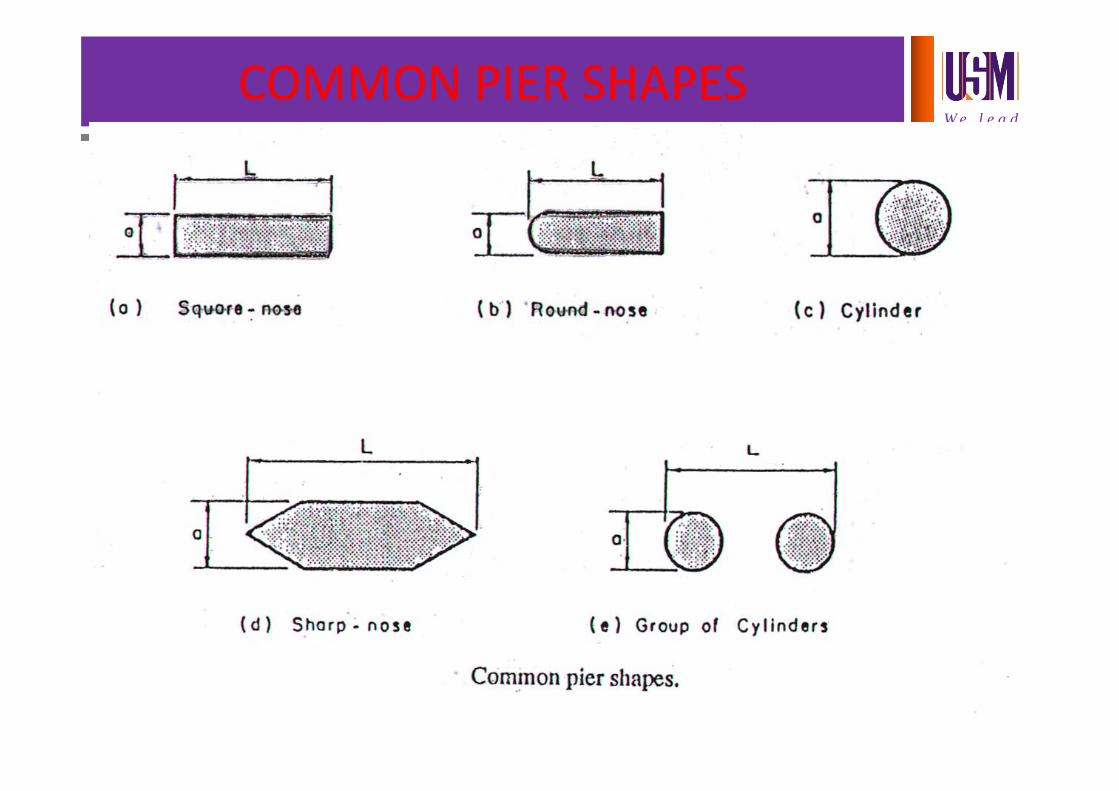
W e l e a dCOMMON PIER SHAPES
W e l e a d
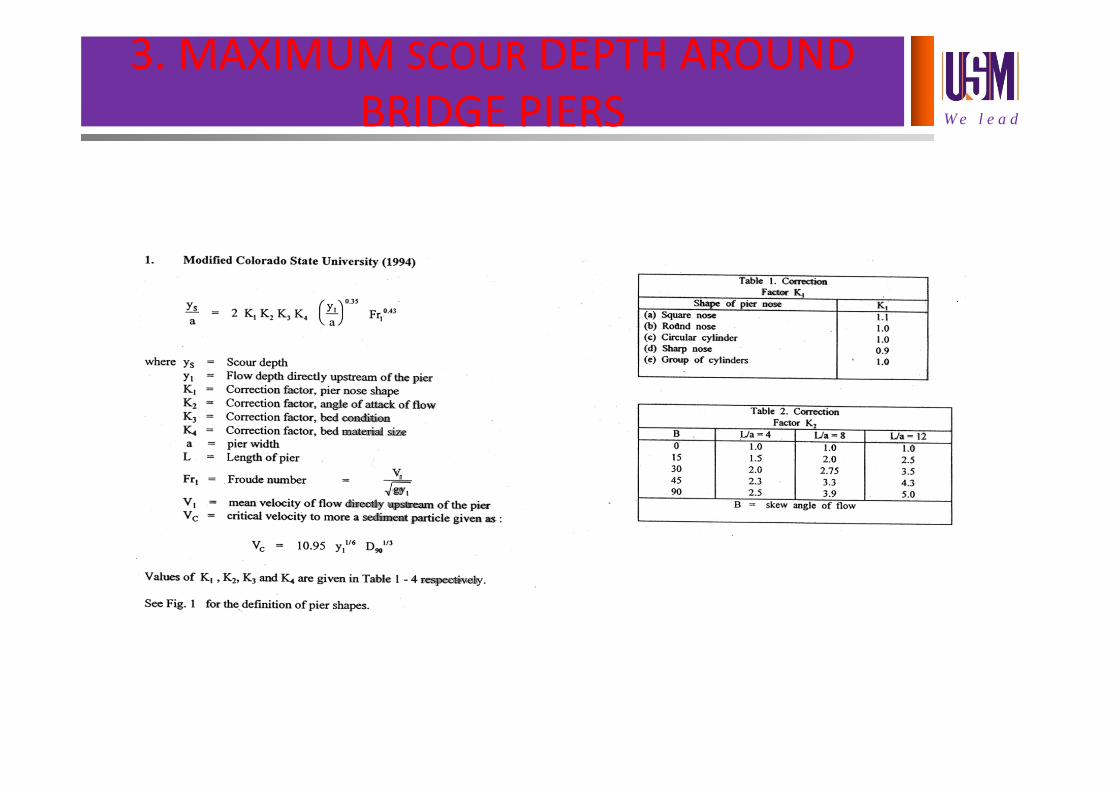
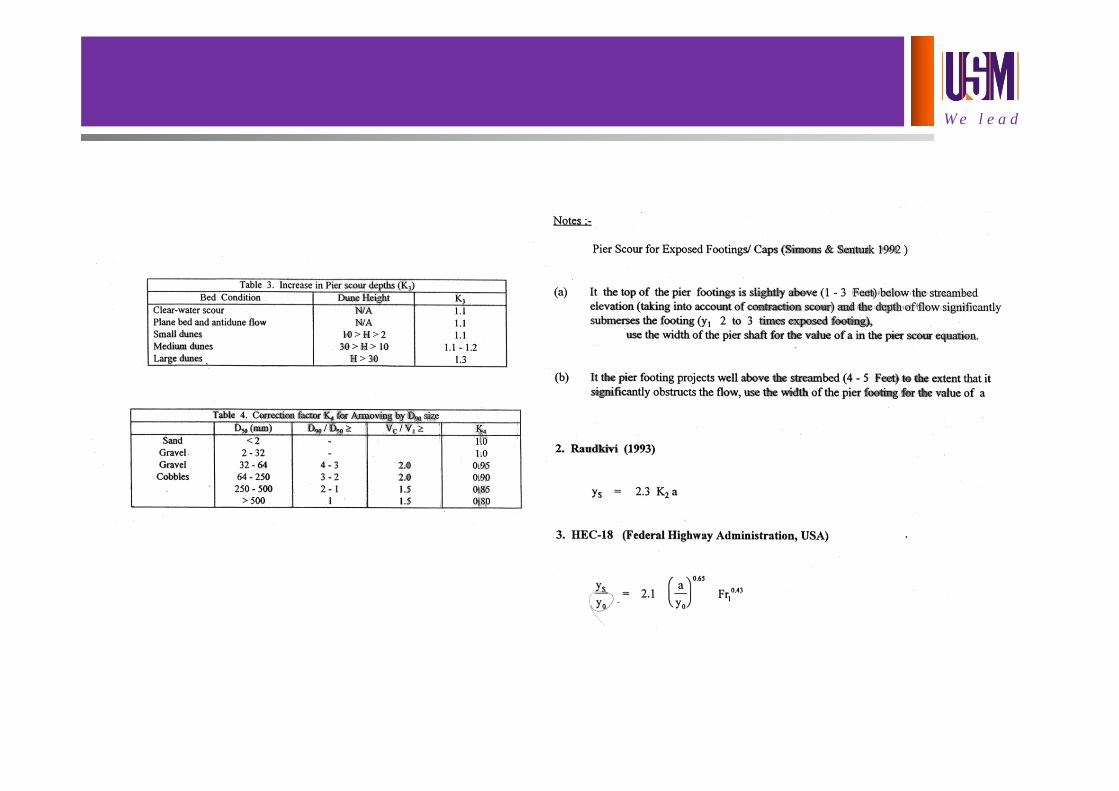
3. MAXIMUM SCOUR DEPTH AROUND BRIDGE PIERS
W e l e a d
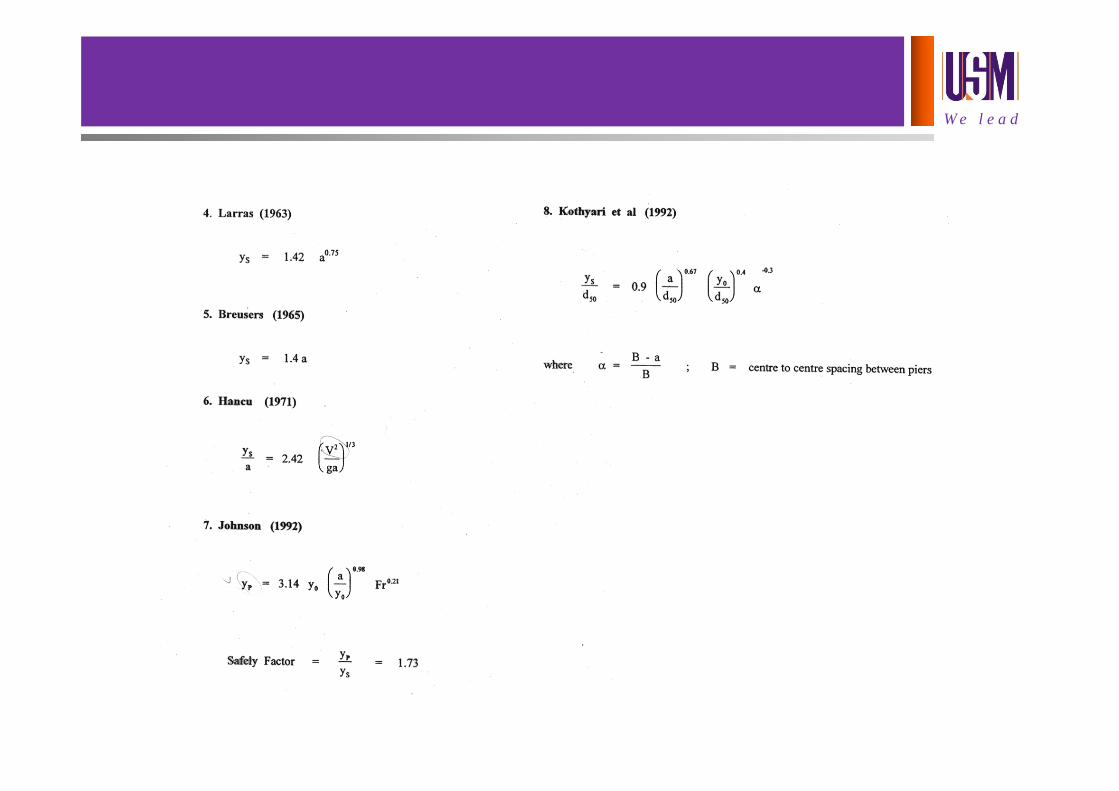
W e l e a d
W e l e a d
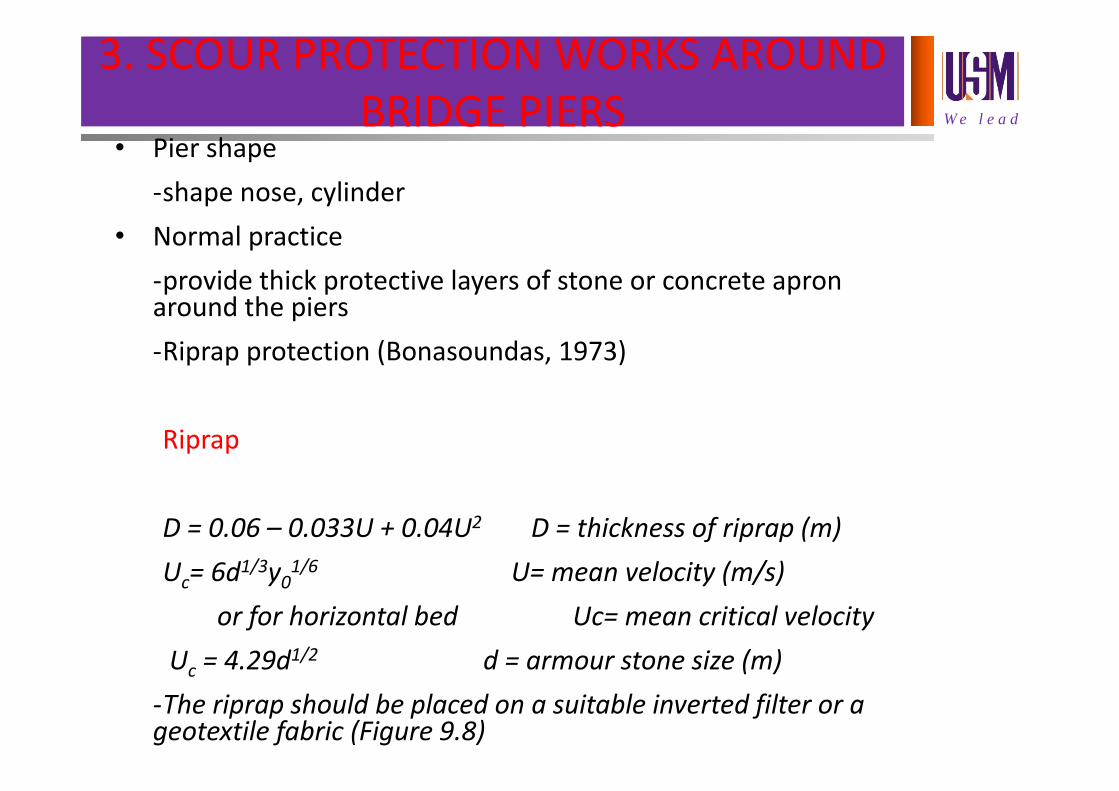
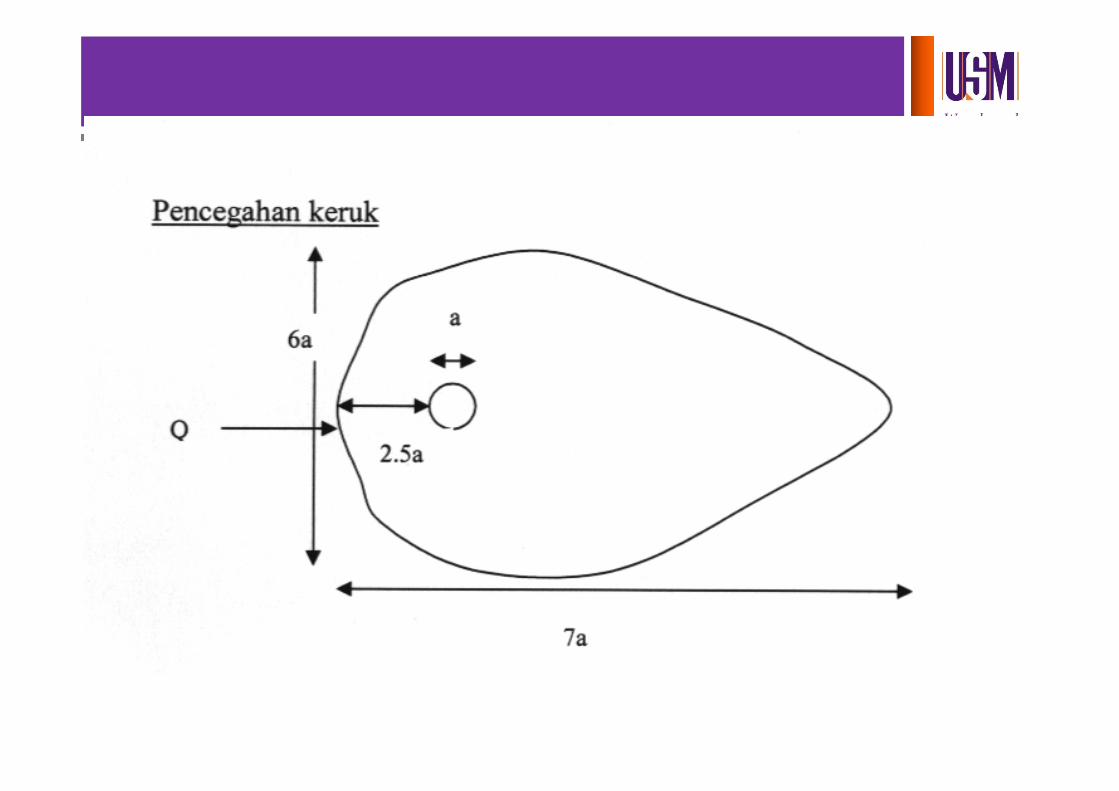
3. SCOUR PROTECTION WORKS AROUND BRIDGE PIERS
• Pier shape‐shape nose, cylinder
• Normal practice‐provide thick protective layers of stone or concrete apron around the piers‐Riprap protection (Bonasoundas, 1973)
Riprap
D = 0.06 – 0.033U + 0.04U2 D = thickness of riprap (m)Uc= 6d1/3y01/6 U= mean velocity (m/s)
or for horizontal bed Uc= mean critical velocityUc = 4.29d1/2 d = armour stone size (m)
‐The riprap should be placed on a suitable inverted filter or a geotextile fabric (Figure 9.8)
W e l e a d

Thank you
Presented byName | Centre/Schools/Units etc
![EAH 225/3 – Hydraulic [Hidraulik]eprints.usm.my/15752/1/EAH_225-3_-_HYDRAULIC_APR_09..pdf · EAH 225/3 – Hydraulic [Hidraulik] ... Gravity g 9.81 m/s2 ... Kedua-dua pembukaan](https://img.pdfslide.net/doc/110x75/5a8e7e8f7f8b9a085a8d37be/eah-2253-hydraulic-hidraulik-2253-hydraulic-hidraulik-gravity.jpg)