Embed Size (px)
Citation preview
iBridging the Gap Between Energy and Climate Policies in Brazil
WRI.ORG
BRIDGING THE GAP BETWEEN ENERGY AND CLIMATE POLICIES IN BRAZIL Policy Options to Reduce Energy-Related GHG Emissions
OSWALDO LUCON, VIVIANE ROMEIRO, TARYN FRANSEN
Design and layout by:Carni [email protected]
TABLE OF CONTENTSV Foreword
1 Executive Summary
5 Introduction
11 Background and Context12 Brazil’s Changing GHG Emissions Profile
17 Scenario Analysis
21 Policy Implications for Key Energy-Related GHG Emissions25 Transport39 Industry45 Power-Generation Sector58 Opportunities to Improve Integration Between Climate and Energy Policies in Brazil
63 Conclusions and Recommendations
66 References
76 List of Acronyms
77 Annex 1: Details From the Scenario Analysis 81 Annex 2: Carbon Budgets and Country Allocations

WRI.org iv
vBridging the Gap Between Energy and Climate Policies in Brazil
FOREWORD
Andrew SteerPresident World Resources Institute
Until recently Brazil’s greenhouse gas emissions have been dominated by deforestation and land-use change. But good progress in reducing deforesta-tion and rapid growth in energy use have shifted this balance so that emissions from land-use change and energy are roughly equal. This is leading to a greater focus on the potential role of the energy sec-tor in Brazil’s transition to a low-carbon economy.
Bridging the Gap Between Energy and Climate Policies in Brazil: Policy Options to Reduce Energy-Related GHG Emissions assesses trends in Brazil’s energy sector and presents policy options for emissions reductions, with the goal of informing the national dialog on energy and climate change. The authors assess the impacts of existing energy and climate policies, as well as opportunities for further efficiency gains and emissions reductions, particularly in the post-2020 timeframe.
Emissions from energy in Brazil have traditionally been low due to strong reliance on hydroelectricity. But recently, even while renewable-sourced energy continues to grow, fossil-based energy has been growing much faster, leading to a strong upward trend in emissions. The good news is that Brazil
can reverse this trend. With nearly half of Brazil’s energy emissions now coming from transportation, the report finds that Brazil can make significant headway by tapping its vast renewable energy potential, modernizing its vehicles, and encouraging mass electrification and hybridization of its transportation fleet. Such efforts would not only make a major contribution to Brazil’s mitigation efforts, they would also deliver health co-benefits to its citizens and increase the livability and competitiveness of its cities.
Recent research from many countries around the world has shown that a bold shift toward a low-carbon economy need not involve large incremental costs. On the contrary, done right, it can lead to accelerated technological change, more jobs, a better quality of life, and faster economic growth. Brazil can position itself as a leader in this historic transformation.
WRI.org vi
1Bridging the Gap Between Energy and Climate Policies in Brazil
EXECUTIVE SUMMARYBrazil is facing a series of important policy decisions that will
determine its energy future over the next several decades, with
important implications for the country’s economic competitiveness,
the well-being of its citizens, and the global climate. The decisions
concern the direction of approximately 0.5 trillion U.S. dollars of
anticipated investment in energy infrastructure over the next decade–
which can either lock in carbon-intensive infrastructure, or advance
Brazil’s position as a leader in the low-carbon economy.
WRI.org 2
These decisions also include the role of large-scale hydropower projects, the pace of transition to mod-ern renewables (biofuels that do not cause land-use change (LUC), biopower, wind power, solar power, and others), ambitious and widespread efficiency improvements, decentralized power generation, and its “smart” integration with the grid.
More recently, the economic crisis, a severe drought, regulatory uncertainty in the power sector, and management problems associated with the state-owned oil company have raised more concerns about investment diversion in the Brazilian energy sector. On the eve of the 21st Conference of the Parties to the United Nations Framework Convention on Climate Change (UNFCCC), global environmental concerns add another important dimension to Brazil’s national decision-making process.
Energy decisions must be made against the backdrop of several important trends intersecting energy and climate. First, global greenhouse gas (GHG) emissions are increasing at a rate that threatens imminently to exceed physical global limits. Second, even as Brazil makes strides in reducing deforestation rates, emissions from its energy sector are increasing rapidly, as the economy grows and the country relies more on fossil-fuel-fired power generation—a departure from its history of relying primarily on renewable resources. As a result, Brazil will increasingly need to grapple with the climate implications of a sector that has historically enjoyed an especially large share of low-carbon energy sources. Under the UNFCCC, it becomes imperative that Brazil’s intended nationally determined contribution (INDC) for the 2015 Paris Agreement should reflect the post-2020 reality of the country’s emissions profile by taking on an ambitious national commitment that goes beyond forests and includes transformative actions, especially in the energy sector.
Therefore, Bridging the Gap Between Energy and Climate Policies in Brazil: Policy Options to Reduce Energy-Related GHG Emissions examines Brazil’s key energy-related GHG emitting sectors through a climate lens in order to offer recommendations for a more integrated approach that can more effectively reconcile energy and climate needs.
Bridging the Gap Between Energy and Climate Policies in Brazil: Policy Options to Reduce Energy-Related GHG Emissions begins with an overview of Brazil’s past energy and GHG emissions profiles, current pledges and future trends, and a discussion of the implications for a possible allocation of the remaining global carbon budget.
Next, it reviews available scenarios for Brazil’s energy-related GHG emissions in order to identify key drivers and results and compare them to a given allocation of the global carbon budget. It then focuses on the top-emitting subsectors—transport, industry, and power generation—to identify key abatement opportunities. The report concludes with recommendations regarding a portfolio of policies and measures that could achieve both climate and energy objectives.
FindingsThe current trajectory of Brazil’s energy-related GHG emissions is not consistent with least-cost pathways to avoiding dangerous levels of climate change. Although the allocation of the remaining carbon budget by country—and what Brazil’s share should be—is fundamentally a political question, the literature describes various approaches and proposals that are under consideration as possible means to determine Brazil’s economy-wide “fair share.” These approaches include historical responsibility, ethical allocation including rights of future generations, economic capability, and least possible cost (discussed in Annex 2). Generally, they present an upper emissions limit (a carbon budget) for Brazil’s non land-use change (LUC) sectors that ranges from approximately 20 to 26 GtCO2e over the period 2010-2050. However, under current policies, Brazilian GHG emissions, especially energy-related GHG emissions, are likely to exceed that budget between 2024 and 2035.
GHG mitigation scenarios identify abatement opportunities for Brazil that are consistent with the need to limit global carbon emissions. A review of a range of modeling scenarios for Brazil’s future GHG emissions, including those produced by the International Energy Agency, McKinsey, the World Bank, and others, identifies
3Bridging the Gap Between Energy and Climate Policies in Brazil
opportunities for reductions in Brazil’s energy-related GHG emissions that are significantly greater than those identified in Brazil’s current energy plans. Many of these reductions would incur nega-tive or low economic costs, with significant benefits in the form of energy security, mobility, health, and economic competitiveness.
Key abatement opportunities in energy-related GHG emissions exist primarily in the transport, industry, and power-generation sectors. The following recommendations can help Brazil take advantage of these opportunities:
▪ Improve fuel economy and invest in shifting to low-carbon modes of trans-port. Transport is the largest contributor to energy-related GHG emissions in Brazil. Ambitious decarbonization of this sector can be achieved through the use of biofuels that do not cause negative land-use change, mass transportation, and non-motorized modes of transport. Appropriate regulatory signals and incentives can encourage the inclusion of advanced flex-fuel engine technologies, hybrids, and electrical vehicles in the energy transporta-tion mix, as well as increase synergies between transport and power-generation. Fuel-economy standards in Brazil still lag in both stringency and implementation behind several other major economies. Likewise, with the exception of certain cities, Brazil has provided limited incen-tives to date to encourage shifts toward more efficient transportation modes, including rail and bus rapid transit. A series of reforms at fed-eral, state, and local levels could help accelerate this shift.
▪ Create incentives and systems for im-proving and gauging industrial efficiency by using carbon metrics. These measures include implementing the planned Brazilian Market for Emission Reductions, developing life-cycle-assessment-based benchmarks to differentiate low-carbon from more carbon-intensive products: leveraging environmental licensing to improve efficiency; accelerating plans to switch to low-carbon fuels; and accel-erating implementation of the measurement,
reporting, and verification (MRV) system for industrial carbon emissions.
▪ Prioritize modern renewables, particularly solar and wind, while addressing the challenges concerning large hydropower projects. There are significant untapped opportunities for Brazil to foster the deployment of modern renewables and to promote their interconnection with the grid. It would be necessary to remove harmful incentives for fossil fuels, leveling the playing field so that alternative energy solutions can compete in a free market. A commitment to increase the share of solar and wind in the national energy mix to 30 percent by 2030, as part of Brazil’s intended nationally determined contribution (INDC), could be also a relevant strategy to advance the use of these clean energy sources.
▪ Reconcile climate and energy policy and planning processes in national- and international-level policies. Climate and energy policy and planning processes need to be more thoroughly integrated in Brazil. In the energy sector, this implies acknowledging the constraints imposed by the global carbon budget—as well as the sizable risk and cost of locking in carbon-intensive energy sources—in planning processes such as the National Energy Plan and the Ten-Year Energy Expansion Plan. In the context of climate policy, it includes setting ambitious and feasible GHG mitigation goals that consider the full range of cost-effective and beneficial abatement potential in the energy sector. Such goals set the pace of implementation, and address the practical challenges involved in transitioning to a sustainable low-carbon economy, including the need to grapple with intermittency challenges in modern renewables and the serious social and environmental issues concerning hydropower. Confronting the need to reconcile energy and climate priorities is the first step in mustering the political will and ingenuity necessary to overcome the barriers to the low-carbon pathway.
5Bridging the Gap Between Energy and Climate Policies in Brazil
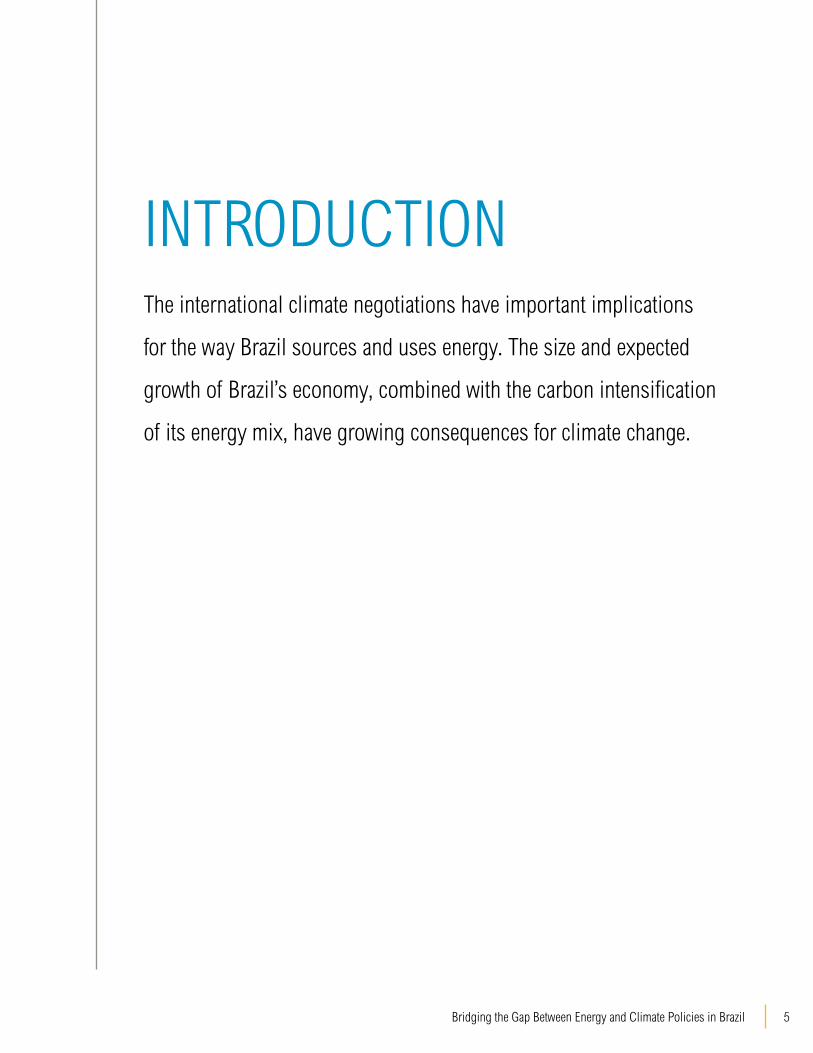
INTRODUCTIONThe international climate negotiations have important implications
for the way Brazil sources and uses energy. The size and expected
growth of Brazil’s economy, combined with the carbon intensification
of its energy mix, have growing consequences for climate change.
WRI.org 6
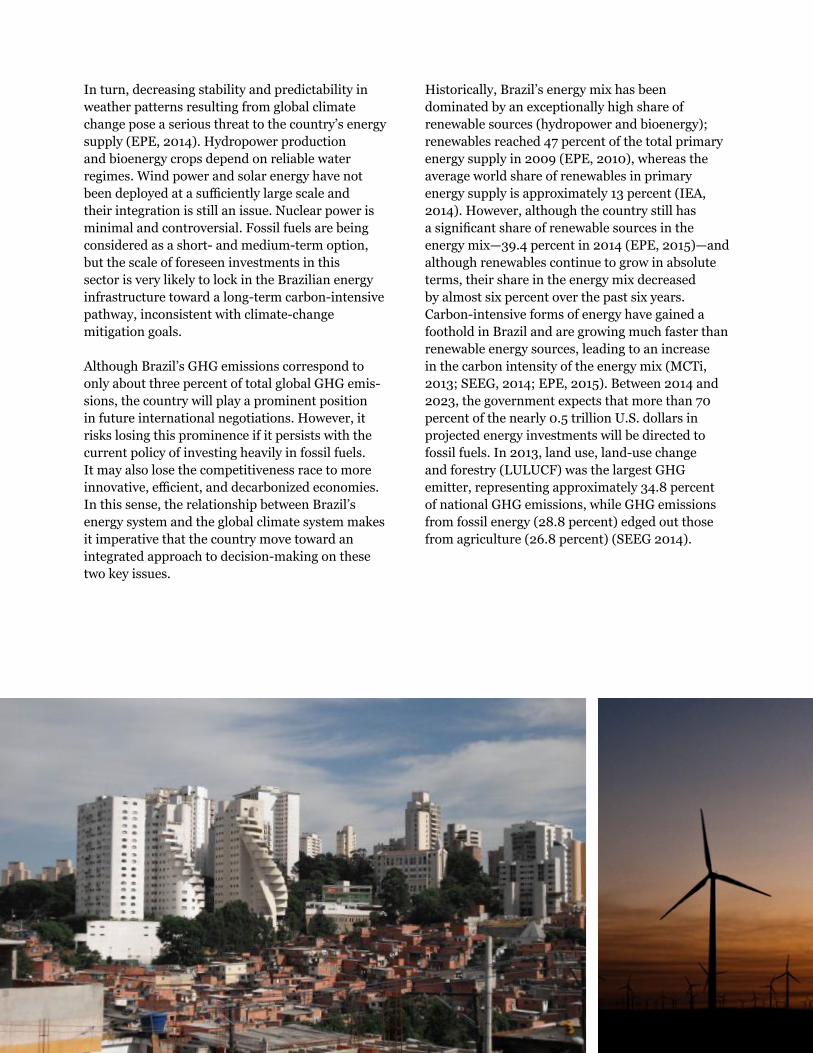
In turn, decreasing stability and predictability in weather patterns resulting from global climate change pose a serious threat to the country’s energy supply (EPE, 2014). Hydropower production and bioenergy crops depend on reliable water regimes. Wind power and solar energy have not been deployed at a sufficiently large scale and their integration is still an issue. Nuclear power is minimal and controversial. Fossil fuels are being considered as a short- and medium-term option, but the scale of foreseen investments in this sector is very likely to lock in the Brazilian energy infrastructure toward a long-term carbon-intensive pathway, inconsistent with climate-change mitigation goals.
Although Brazil’s GHG emissions correspond to only about three percent of total global GHG emis-sions, the country will play a prominent position in future international negotiations. However, it risks losing this prominence if it persists with the current policy of investing heavily in fossil fuels. It may also lose the competitiveness race to more innovative, efficient, and decarbonized economies. In this sense, the relationship between Brazil’s energy system and the global climate system makes it imperative that the country move toward an integrated approach to decision-making on these two key issues.
Historically, Brazil’s energy mix has been dominated by an exceptionally high share of renewable sources (hydropower and bioenergy); renewables reached 47 percent of the total primary energy supply in 2009 (EPE, 2010), whereas the average world share of renewables in primary energy supply is approximately 13 percent (IEA, 2014). However, although the country still has a significant share of renewable sources in the energy mix—39.4 percent in 2014 (EPE, 2015)—and although renewables continue to grow in absolute terms, their share in the energy mix decreased by almost six percent over the past six years. Carbon-intensive forms of energy have gained a foothold in Brazil and are growing much faster than renewable energy sources, leading to an increase in the carbon intensity of the energy mix (MCTi, 2013; SEEG, 2014; EPE, 2015). Between 2014 and 2023, the government expects that more than 70 percent of the nearly 0.5 trillion U.S. dollars in projected energy investments will be directed to fossil fuels. In 2013, land use, land-use change and forestry (LULUCF) was the largest GHG emitter, representing approximately 34.8 percent of national GHG emissions, while GHG emissions from fossil energy (28.8 percent) edged out those from agriculture (26.8 percent) (SEEG 2014).
7Bridging the Gap Between Energy and Climate Policies in Brazil
Under the Ministry of Energy (MME), the Energy Research Company (EPE) is the government research organization that handles long-term energy planning. EPE periodically issues the Long-term National Energy Plan (PNE), the annual National Energy Balance (BEN), and the annual Ten-Year Energy Expansion Plan (PDE), which together form the basis of Brazil’s energy policies. The most recent long-term planning document, the PNE 2030 (EPE, 2007), was published before the global financial crisis, the launch of Brazil’s national climate policy, and numerous other important developments. In a move to address the longer term, EPE is currently developing the 2050 National Energy Plan.
The 2050 PNE’s Terms of Reference (TOR), the energy-demand studies, and the economic scenar-ios for the elaboration of the 2050 National Energy Plan have been already published. They take into consideration many issues and trade-offs facing the energy sector that will have implications for the country’s strategies to reduce energy-related GHG emissions:
▪ The global financial crisis of 2008 and its continuing effects ▪ Vulnerability of the hydro system due to climate change impacts
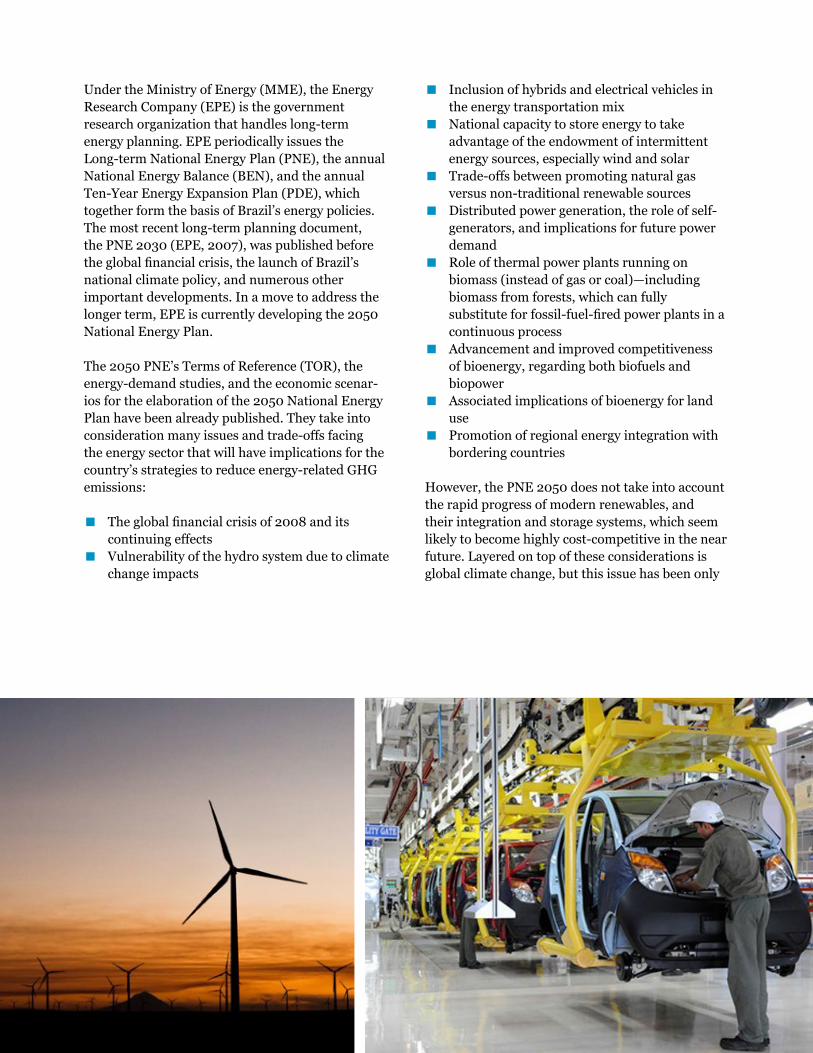
▪ Inclusion of hybrids and electrical vehicles in the energy transportation mix ▪ National capacity to store energy to take advantage of the endowment of intermittent energy sources, especially wind and solar ▪ Trade-offs between promoting natural gas versus non-traditional renewable sources ▪ Distributed power generation, the role of self-generators, and implications for future power demand ▪ Role of thermal power plants running on biomass (instead of gas or coal)—including biomass from forests, which can fully substitute for fossil-fuel-fired power plants in a continuous process ▪ Advancement and improved competitiveness of bioenergy, regarding both biofuels and biopower ▪ Associated implications of bioenergy for land use ▪ Promotion of regional energy integration with bordering countries
However, the PNE 2050 does not take into account the rapid progress of modern renewables, and their integration and storage systems, which seem likely to become highly cost-competitive in the near future. Layered on top of these considerations is global climate change, but this issue has been only
WRI.org 8
marginally discussed in the PNE 2050 preliminary documents as a driver for new technologies and necessary adaptive measures. The issue of compatibility with the global carbon budget is similarly neglected.
The threat of climate change has implications for the resilience of Brazil’s energy sector and its economy more generally; it also implies limits to the amount of net GHG emissions that can safely be allowed at the global level. The Fifth Assessment Report of the Intergovernmental Panel on Climate Change (IPCC, 2013) has made clear that current emissions trends threaten the integrity of the global climate system and that the time available for action to maintain safe levels of average global temperature rise is running out. To limit the average global temperature increase to 2°C by the end of the century, cumulative global CO2 emissions should stay within a “budget” of approximately 990 (510–1505) GtCO2 over the period 2012–2100 (RCP2.6 scenarios, according to the IPCC, 2013). Scientists estimate that, ideally, global CO2 emissions will need to reach net zero between 2050 and 2070 (UNEP, 2014) and should become negative over the remainder of the century to offset previous emissions. Global GHG emissions will need to reach net zero between 2080 and 2100 (IPCC, 2013).
If current trends continue unabated, humankind will burn through this budget within the next 30 years. How the remaining carbon budget is allocated by country—and what Brazil’s share should be—was not addressed in the IPCC AR5; it is fundamentally a political question, but there are various approaches and proposals under consideration in the literature that could be used to determine Brazil’s economy-wide “fair share.” These approaches include historical responsibil-ity, ethical allocation including rights of future generations, economic capability, and least possible cost; they are discussed further in Annex 2 of this report. Policies and economic decisions made in the interest of pursuing such goals are likely to have serious implications for the economic viability of
investments in fossil fuels vis a vis investments in a more rapid deployment of energy efficiency and renewables-related infrastructure.
Objectives and Structure of the ReportThe main objectives of this report are to:
▪ assess the key Brazilian energy-related GHG emitting sectors through a climate lens; ▪ present recommendations regarding how the Brazilian government could enhance implementation of existing energy policies; and ▪ identify potential policies that could effectively reconcile energy and climate needs in Brazil.
The report is focused on potential and realistic national policy recommendations that could assist the Brazilian government in promoting better integration of climate and energy considerations. It is based on the premise that most decarbonization and energy-efficiency efforts will occur at the necessary pace only with a strong policy signal to guide public and private investment. We have considered mostly specific sector-level approaches that the government could take to implement new policies, and to enhance effectiveness of existing policies, in order to reduce energy-related GHG emissions in Brazil.
The proposed policy recommendations address key energy-related GHG emission sectors (transport, industry, and power generation), as well as opportunities for improved integration between energy and climate policies. They are based on (i) policy literature specific to Brazil; (ii) international literature on best-practice policies in key energy sectors; (iii) analysis of existing GHG mitigation scenarios; and (iv) expert opinion elicited from energy and climate stakeholders.
This section has introduced some of the key national and global factors that are affecting the Brazilian energy sector in the context of the need to constrain GHG emissions, and has outlined the methodological approach of the report.

9Bridging the Gap Between Energy and Climate Policies in Brazil
Background and Context describes the changing profile of Brazil’s GHG emissions and discusses the implications of the global carbon budget for Brazil’s energy-related GHG emissions and the measures that might need to be taken by the government to contribute to the joint effort of limiting global tem-perature rise to 2°C.
Scenario Analysis presents available GHG mitiga-tion scenarios concerning Brazil’s energy-related GHG emissions and analyzes their main findings in order to identify some key drivers of future GHG emissions and highlight key differences between those scenarios that are compatible with the global carbon budget and those that are not. It is important to note that this report compiles several different sources of information, from different dates. For this reason, base years may vary, as do the assumptions underlying different projections.
Policy Implications examines the policy implica-tions for Brazil’s energy subsectors with the highest GHG emissions—transport, industry, and power generation—and identifies technological options and key abatement opportunities. It discusses the practicality of these opportunities by looking at existing, available technologies and/or those that have not been widely implemented but present great potential to reduce GHG emissions. The sec-tion identifies policies that would be consistent with implementing those technologies, and proposes recommendations to increase the effectiveness of existing energy policies and/or climate policies related to energy-related GHG emissions in Brazil. It also makes recommendations on the implemen-tation of new policies to spread the use of existing and potential low-carbon technologies in Brazil.
Finally, Conclusions and Recommendations presents conclusions and summarizes the main policy recommendations that concern the key energy subsector emitters. Because this report takes a qualitative approach to potential and realistic policies to be implemented or enhanced, the effects of each recommendation have not been quantified in the present analysis.
How the remaining carbon budget is
allocated by country—and what Brazil’s
share should be...is fundamentally a political
question, but there are various approaches
and proposals under consideration in the literature that could
be used to determine Brazil’s economy-wide
“fair share.”
WRI.org 10
11Bridging the Gap Between Energy and Climate Policies in Brazil
BACKGROUND AND CONTEXT Historically, the vast majority of Brazil’s GHG emissions1
have stemmed from deforestation and forest degradation. The
contribution from energy-related GHG emissions was relatively
modest, because of heavy reliance on renewable energy sources
(biofuels and hydropower). However, this scenario has changed
and energy and agriculture represent the key sectors.

WRI.org 12
Figure 1 | Annual Deforestation Rates in the Legal Amazon (1988–2014)
0
5,000
10,000
15,000
20,000
25,000
30,000
km2 /y
ear
1988 1990 1992 1994 1996 1998 2000 2002 2004 2006 2008 2010 2012 2014
Brazil’s Changing GHG Emissions ProfileSince 2005, the Brazilian government has pri-oritized command-and-control policies to reduce deforestation in the Legal Amazon (the socio-geo-graphic division in Brazil that contains nine states in the Amazon Basin), through the Action Plan for Prevention and Control of Deforestation in the Legal Amazon—PPCDAM (MMA, 2004) and in the Cerrado savannah, through the Action Plan for the Prevention and Control of Deforestation and Forest Fires in the Cerrado—PPCerrado (MMA, 2010).
In December 2009, the Brazilian Government launched the National Policy on Climate Change (PNMC) through Federal Law No. 12.187/2009. In line with its submission to the UNFCCC, the PNMC pledged Brazil to a 36.1–38.9 percent reduction in GHG emissions by 2020, relative to a trend-line scenario, and established a reduction target for deforestation rates of 80 percent in the Legal Amazon and 40 percent in the Cerrado savannah. A year later, Decree 7.390 was established to regulate the PNMC, and stated that the 2020 commitments should be achieved through sectoral mitigation and adaptation plans. The Satellite Monitoring System of the Brazilian Amazon Forest (PRODES) provides the annual deforesta-
tion rates in the Legal Amazon, and the latest data (INPE PRODES, 2014) show that deforestation rates reached their lowest level in 2012. There was a one-year increase of 28 percent in 2013 over the previous year’s rate but a return to the decreasing trend (18 percent) in 2014, as shown in Figure 1.
As Brazil’s response to deforestation becomes more effective, and as reliance on fossil fuels for energy grows, the country’s GHG emissions profile is undergoing a radical transformation.
The Ministry of Science, Technology and Innova-tion (MCTi) periodically publishes information on national GHG emissions divided into main sectors grouped according to their processes, sources, and sinks, as determined by the 2006 IPCC Guidelines for National Greenhouse Gas Inventories (IPCC, 2006): energy; industrial processes and product use (IPPU); waste; and agriculture, forestry, and other land use (AFOLU)—which includes agriculture, and land use, land-use change and forestry (LULUCF). Each sector comprises individual categories and sub-categories, and this report is focused on the energy-related GHG emissions from these sectors. The latest GHG emissions estimates for the five broad sectors (MCTi, 2013) are available up to the year 2011 (see Table 1.)
Source: INPE PRODES, 2014.
13Bridging the Gap Between Energy and Climate Policies in Brazil
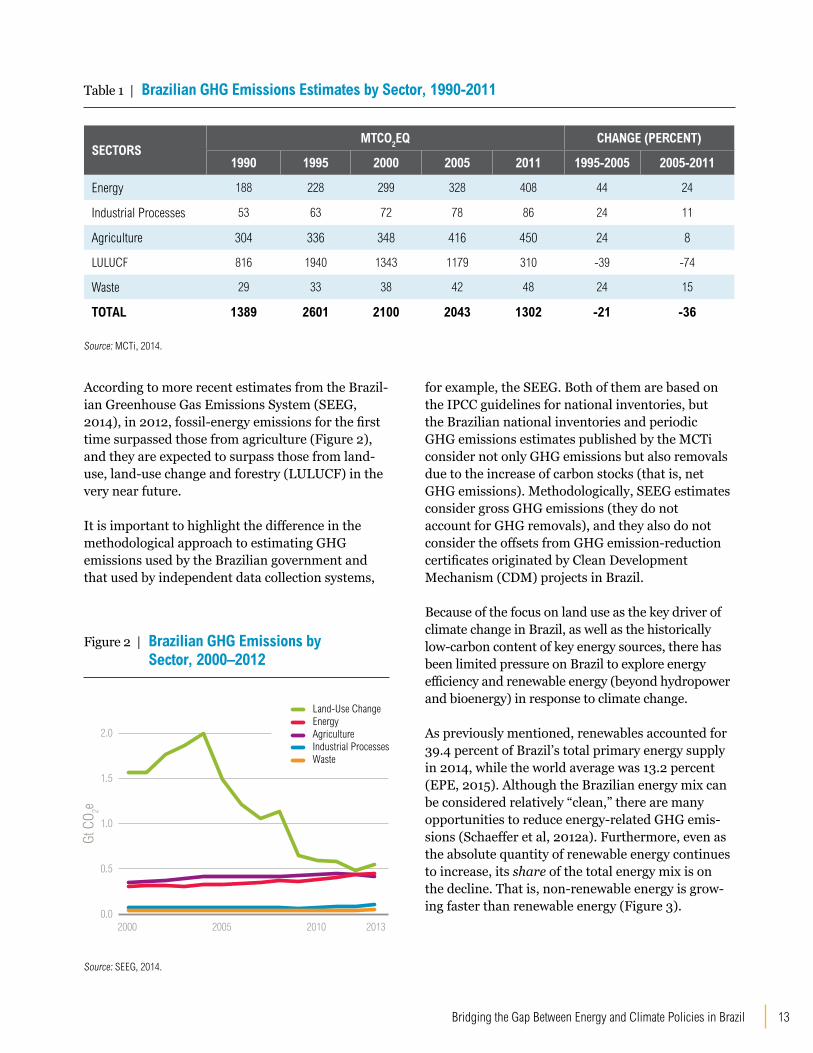
Table 1 | Brazilian GHG Emissions Estimates by Sector, 1990-2011
SECTORSMTCO2EQ CHANGE (PERCENT)
1990 1995 2000 2005 2011 1995-2005 2005-2011
Energy 188 228 299 328 408 44 24
Industrial Processes 53 63 72 78 86 24 11
Agriculture 304 336 348 416 450 24 8
LULUCF 816 1940 1343 1179 310 -39 -74
Waste 29 33 38 42 48 24 15
TOTAL 1389 2601 2100 2043 1302 -21 -36
Source: MCTi, 2014.
According to more recent estimates from the Brazil-ian Greenhouse Gas Emissions System (SEEG, 2014), in 2012, fossil-energy emissions for the first time surpassed those from agriculture (Figure 2), and they are expected to surpass those from land-use, land-use change and forestry (LULUCF) in the very near future.
It is important to highlight the difference in the methodological approach to estimating GHG emissions used by the Brazilian government and that used by independent data collection systems,
0.0
0.5
1.0
1.5
2.0
2000 2005 2010 2013
Gt C
O 2e
Agriculture Energy Land-Use Change
Industrial Processes Waste
Figure 2 | Brazilian GHG Emissions by Sector, 2000–2012
Source: SEEG, 2014.
for example, the SEEG. Both of them are based on the IPCC guidelines for national inventories, but the Brazilian national inventories and periodic GHG emissions estimates published by the MCTi consider not only GHG emissions but also removals due to the increase of carbon stocks (that is, net GHG emissions). Methodologically, SEEG estimates consider gross GHG emissions (they do not account for GHG removals), and they also do not consider the offsets from GHG emission-reduction certificates originated by Clean Development Mechanism (CDM) projects in Brazil.
Because of the focus on land use as the key driver of climate change in Brazil, as well as the historically low-carbon content of key energy sources, there has been limited pressure on Brazil to explore energy efficiency and renewable energy (beyond hydropower and bioenergy) in response to climate change.
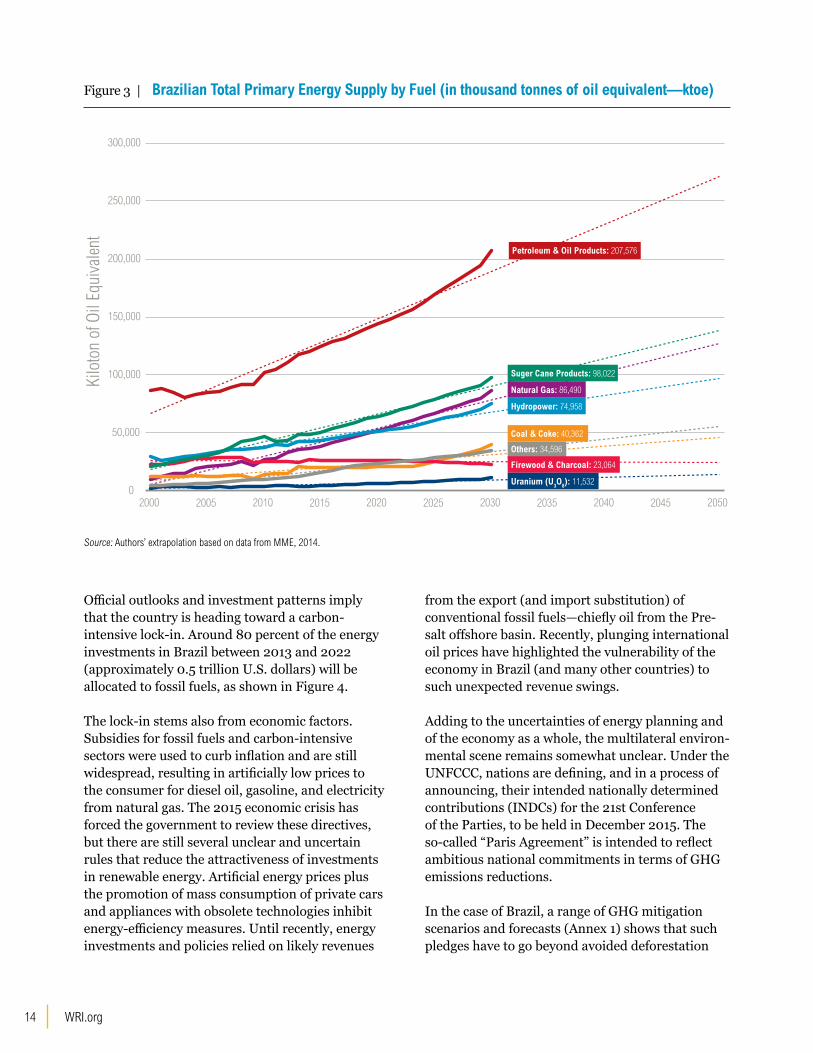
As previously mentioned, renewables accounted for 39.4 percent of Brazil’s total primary energy supply in 2014, while the world average was 13.2 percent (EPE, 2015). Although the Brazilian energy mix can be considered relatively “clean,” there are many opportunities to reduce energy-related GHG emis-sions (Schaeffer et al, 2012a). Furthermore, even as the absolute quantity of renewable energy continues to increase, its share of the total energy mix is on the decline. That is, non-renewable energy is grow-ing faster than renewable energy (Figure 3).
WRI.org 14
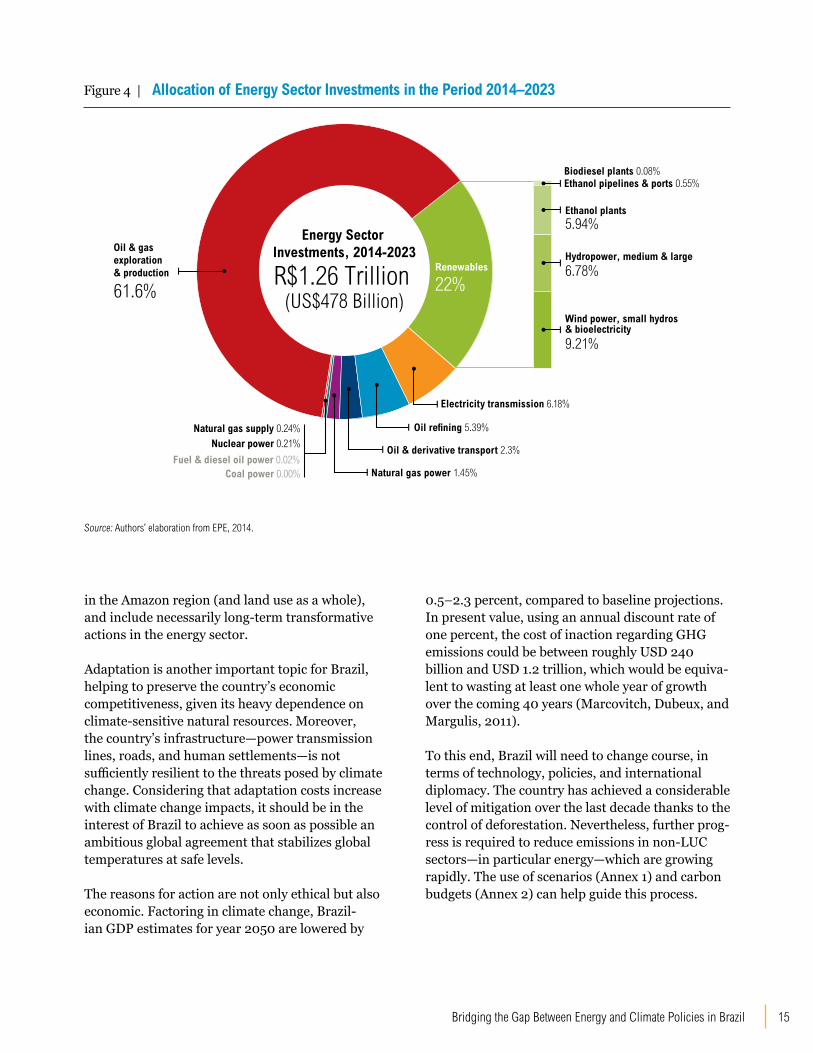
Official outlooks and investment patterns imply that the country is heading toward a carbon-intensive lock-in. Around 80 percent of the energy investments in Brazil between 2013 and 2022 (approximately 0.5 trillion U.S. dollars) will be allocated to fossil fuels, as shown in Figure 4.
The lock-in stems also from economic factors. Subsidies for fossil fuels and carbon-intensive sectors were used to curb inflation and are still widespread, resulting in artificially low prices to the consumer for diesel oil, gasoline, and electricity from natural gas. The 2015 economic crisis has forced the government to review these directives, but there are still several unclear and uncertain rules that reduce the attractiveness of investments in renewable energy. Artificial energy prices plus the promotion of mass consumption of private cars and appliances with obsolete technologies inhibit energy-efficiency measures. Until recently, energy investments and policies relied on likely revenues
Figure 3 | Brazilian Total Primary Energy Supply by Fuel (in thousand tonnes of oil equivalent—ktoe)
Source: Authors’ extrapolation based on data from MME, 2014.
0
50,000
100,000
150,000
200,000
250,000
300,000
2000 2005 2010 2015 2020 2025 2030 2035 2040 2045 2050
Brazil Total Primary Energy Supply (ktoe) historical 2000-2013 (BEN); 2014, 2018 and 2023 (PDE 2023) interpolations; linear trendlines 2000-2050
Kilo
ton
of O
il Eq
uiva
lent
Petroleum & Oil Products: 207,576
Suger Cane Products: 98,022
Coal & Coke: 40,362
Others: 34,596
Firewood & Charcoal: 23,064
Uranium (U3O8): 11,532
Natural Gas: 86,490
Hydropower: 74,958
from the export (and import substitution) of conventional fossil fuels—chiefly oil from the Pre-salt offshore basin. Recently, plunging international oil prices have highlighted the vulnerability of the economy in Brazil (and many other countries) to such unexpected revenue swings.
Adding to the uncertainties of energy planning and of the economy as a whole, the multilateral environ-mental scene remains somewhat unclear. Under the UNFCCC, nations are defining, and in a process of announcing, their intended nationally determined contributions (INDCs) for the 21st Conference of the Parties, to be held in December 2015. The so-called “Paris Agreement” is intended to reflect ambitious national commitments in terms of GHG emissions reductions.
In the case of Brazil, a range of GHG mitigation scenarios and forecasts (Annex 1) shows that such pledges have to go beyond avoided deforestation
15Bridging the Gap Between Energy and Climate Policies in Brazil
Figure 4 | Allocation of Energy Sector Investments in the Period 2014–2023
Source: Authors’ elaboration from EPE, 2014.
Renewables
22%
Electricity transmission 6.18%
Oil refining 5.39%
Oil & derivative transport 2.3%
Natural gas power 1.45%
Natural gas supply 0.24%
Nuclear power 0.21%
Wind power, small hydros & bioelectricity
9.21%
Hydropower, medium & large
6.78%
Ethanol plants 5.94%
Ethanol pipelines & ports 0.55%Biodiesel plants 0.08%
Energy Sector Investments, 2014-2023
R$1.26 Trillion (US$478 Billion)
Oil & gas exploration & production
61.6%
Fuel & diesel oil power 0.02%Coal power 0.00%
in the Amazon region (and land use as a whole), and include necessarily long-term transformative actions in the energy sector.
Adaptation is another important topic for Brazil, helping to preserve the country’s economic competitiveness, given its heavy dependence on climate-sensitive natural resources. Moreover, the country’s infrastructure—power transmission lines, roads, and human settlements—is not sufficiently resilient to the threats posed by climate change. Considering that adaptation costs increase with climate change impacts, it should be in the interest of Brazil to achieve as soon as possible an ambitious global agreement that stabilizes global temperatures at safe levels.
The reasons for action are not only ethical but also economic. Factoring in climate change, Brazil-ian GDP estimates for year 2050 are lowered by
0.5–2.3 percent, compared to baseline projections. In present value, using an annual discount rate of one percent, the cost of inaction regarding GHG emissions could be between roughly USD 240 billion and USD 1.2 trillion, which would be equiva-lent to wasting at least one whole year of growth over the coming 40 years (Marcovitch, Dubeux, and Margulis, 2011).
To this end, Brazil will need to change course, in terms of technology, policies, and international diplomacy. The country has achieved a considerable level of mitigation over the last decade thanks to the control of deforestation. Nevertheless, further prog-ress is required to reduce emissions in non-LUC sectors—in particular energy—which are growing rapidly. The use of scenarios (Annex 1) and carbon budgets (Annex 2) can help guide this process.
17Bridging the Gap Between Energy and Climate Policies in Brazil
SCENARIO ANALYSISScenario-building and analysis is an important tool in energy
planning and policymaking. The results and conclusions drawn
from scenarios depend upon the assumptions employed for
their development; the approach can thus help scientists and
policymakers to forecast the results of a hypothetical situation and
make policy choices that are more likely to deliver a specific goal.
A modeling exercise can serve as a robust guide for decision-
makers as they try to understand what would happen if the
assumptions were to become concrete (Kwon and Østergaard,
2012; Schaeffer et al., 2012b).
WRI.org 18
Integrating and analyzing climate data through the use of scenarios can lay out a range of pos-sible futures facing a country’s energy sector and demonstrate the relationships between technolo-gies, policies, energy supply/demand, and GHG emissions. When analyzed alongside a given global carbon budget, scenarios can help scientists and policymakers to understand which combinations of technology and policy choices are consistent with such a budget cap, if adopted, and which are not. In the case of Brazil, analysis of the GHG emissions contributed by each energy subsector in the latest Ten-Year Plan 2023 (approved in December 2014), for example, enables the evaluation of trends in sec-toral emissions from 2014 to 2023, and can serve as a relevant input to the formulation of mitigation policies in Brazil.
The scenarios examined were developed for various purposes, and were based on a range of methodologies and assumptions. The present study is limited to publications that meet the following criteria:
▪ Official and independent modeling of supply and demand in the energy sector in Brazil that presents outlooks for future GHG emissions. ▪ Official and independent modeling that is suf-ficiently recent (not older than five to six years and extending at least through 2020) to reflect Brazil’s latest energy-planning developments and to ensure that modeling parameters are relatively up to date. The exception was the National Energy Plan (PNE 2030) that was published in 2007, but it was included in the analysis because it is the current official plan adopted by the federal government. PNE 2030 will ultimately be replaced by PNE 2050, for which Terms of Reference and some economic premises were published in 2013 and 2014, but PNE 2050 is still under development and can-not therefore serve as the basis for this analysis.
Annex 1 of this report details GHG mitigation scenarios and pathways that have been published in recent years. It explores in detail the various projections of future energy-related GHG emissions in Brazil and compares the assumptions underly-ing each projection. Annex 1 also identifies the key factors that differentiate these scenarios in terms of their consistency, or lack of consistency, with a given carbon budget. This is explained in more detail
The National Energy Plan—PNE 2030 (2007) shows basically four scenarios, covering a broad range of possibilities. Uncertainties are high and the assumptions made in 2007 are now being revised for the 2050 outlook, still not published.
McKinsey (2009) launched a study utilizing marginal abatement cost curves (MACC) to produce low-carbon pathways for all domestic sectors in year 2030. The publication has a very low level of detail, and data are not traceable.
World Bank—De Gouvello et al. (2010) analysis is another MACC study, based on the intermediate reference scenario from Brazil’s National Energy Plan (PNE) 2030, which assumes an average economic growth rate for Brazil. Using a higher level of detail, it identifies a Low-Carbon Scenario which uses mitigation options such as hybrid cars and carbon capture and storage.
The (PNMCs) Brazil 2020 Pledge (2010) considers only implemented and adopted policies in Brazil, and adopts the annual Ten-Year Energy Plan as the sectoral plan for mitigation and adaptation in the energy sector, with projected 2020 emissions using a considerably inflated trendline as discussed in pages 60 and 61.
The IEA’s Energy Technology Perspectives—ETP (2012) defines three scenarios for the Brazilian Energy sector, consistent with the 2°C, 4°C, and 6°C pathways respectively by 2100. The study projects that even after compliance with the Brazilian Nationally Appropriated Mitigation Actions (NAMAs), proposed emission reductions would exceed even the 6°C trajectory.
La Rovere et al (2013) shows the energy sector as the major source of emissions for Brazil post-2020 and presents three projections based on existing policies, more ambitious policies, and advanced strategies.
Greenpeace (2013) presents an ambitious low-carbon highly renewable scenario, with decentralized and integrated solutions, plus phase-outs of fossil fuels and nuclear power.
The IEA’s World Energy Outlook WEO (2014) includes the Current Policies Scenario (formally enacted as of mid-2014); the New Policies (with the enactment of all improved policies under consideration by the government); and the 450 (ppm) scenario (bolder and consistent with a proposed allocation of the global carbon budget from the IPCC AR5).
BOX 1 | SCENARIO ANALYSIS: POSSIBLE FUTURES FOR BRAZIL’S CO2 EMISSIONS FROM THE ENERGY SECTOR
19Bridging the Gap Between Energy and Climate Policies in Brazil
in Annex 2. It is important to note that this report compiles several different sources of information, from different dates. For this reason, the base years and the underlying assumptions adopted in different projections will vary.
A brief summary of these scenarios is provided in Box 1.
Collectively, the scenarios paint a picture of a range of possible futures for Brazil, against which cur-rent policies and alternative approaches can be examined. The scenarios provide alternatives to a reference scenario, which assumes the maintenance of existing trends (without considering potential policy changes). This contrast between the refer-ence or “business-as-usual” scenario and the alter-native scenarios is an important tool, not only to explain the implications of the long-term strategies
Luco
n 20
14
0
200
400
600
800
1000
1200
1400
1600
1800
2000
2000 2005 2010 2015 2020 2025 2030 2035 2040
Mill
ion
Tonn
es C
O 2
Brazil CO2 emissions from the Energy Sector
Historical 2000–2013: 395
Brazil 2020 Pledge (2010): 868
La Rovere 2011 (A): 1,720
La Rovere 2011 (B): 1,210
La Rovere 2011 (C): 1,100
IEA ETP 2012 +6ºC: 810
IEA ETP 2012 +4ºC: 570
IEA ETP 2012 +2ºC: 290
Greenpeace 2013: 431
WB 2010: 815 IEA WEO 2013 CPS: 774
IEA WEO 2013 NPS: 703
IEA WEO 2013 450: 411
McKinsey 2009: 785
PDE2023 PNE2030 & Interpolations 2014-2030: 921
to be adopted, but also to evaluate the credibility of alternative scenarios (Schaeffer et al., 2012a).
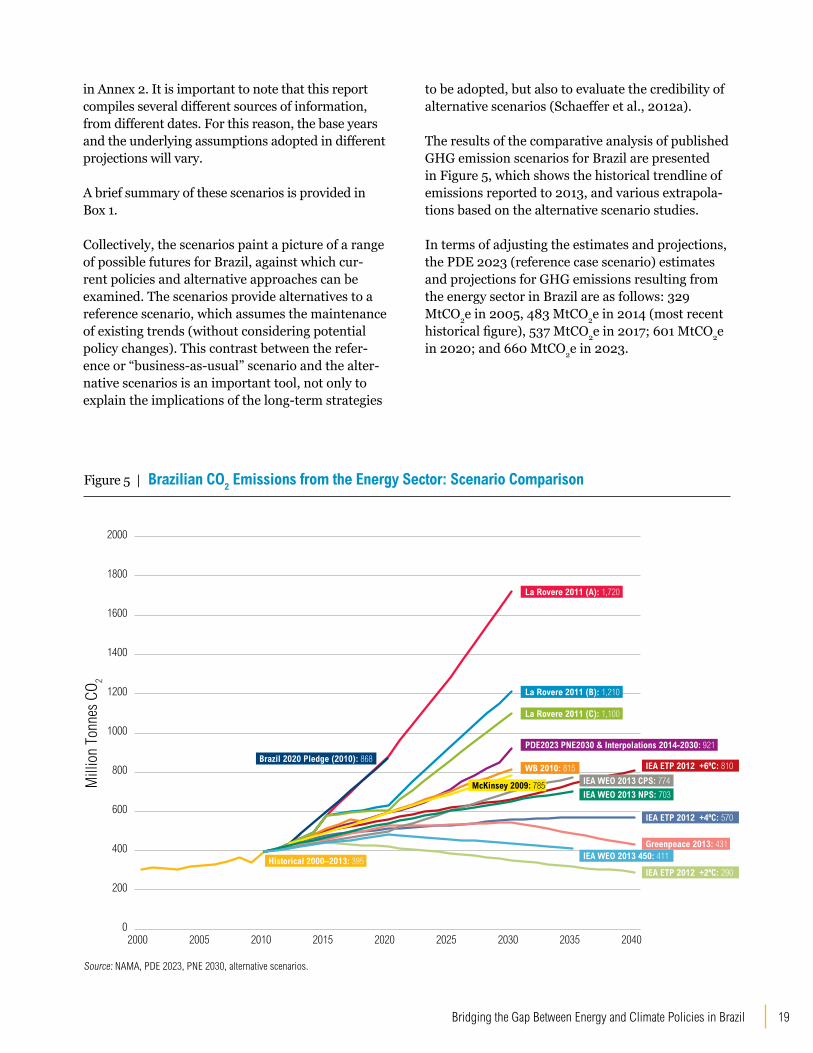
The results of the comparative analysis of published GHG emission scenarios for Brazil are presented in Figure 5, which shows the historical trendline of emissions reported to 2013, and various extrapola-tions based on the alternative scenario studies.
In terms of adjusting the estimates and projections, the PDE 2023 (reference case scenario) estimates and projections for GHG emissions resulting from the energy sector in Brazil are as follows: 329 MtCO2e in 2005, 483 MtCO2e in 2014 (most recent historical figure), 537 MtCO2e in 2017; 601 MtCO2e in 2020; and 660 MtCO2e in 2023.
Figure 5 | Brazilian CO2 Emissions from the Energy Sector: Scenario Comparison
Source: NAMA, PDE 2023, PNE 2030, alternative scenarios.
WRI.org 20

21Bridging the Gap Between Energy and Climate Policies in Brazil
POLICY IMPLICATIONS FOR KEY ENERGY-RELATED GHG EMISSIONS As already mentioned, the Brazilian national GHG emissions are
estimated by major economic sectors, each grouped according
to its processes, sources, and sinks, as determined by the 2006
IPCC Guidelines for National GHG (IPCC, 2006): energy, industrial
processes, waste, agriculture, and LULUCF. Each sector comprises
individual categories and sub-categories, and this report is focused
on the energy-related GHG emissions from these sectors.
WRI.org 22
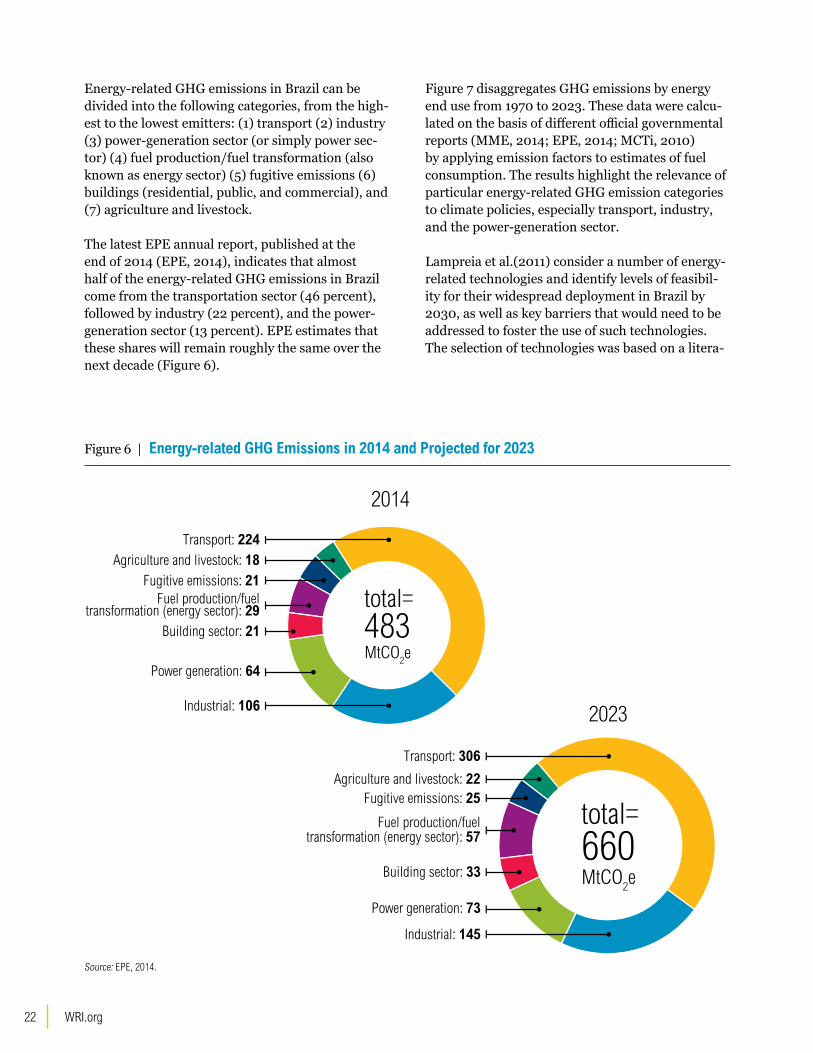
Energy-related GHG emissions in Brazil can be divided into the following categories, from the high-est to the lowest emitters: (1) transport (2) industry (3) power-generation sector (or simply power sec-tor) (4) fuel production/fuel transformation (also known as energy sector) (5) fugitive emissions (6) buildings (residential, public, and commercial), and (7) agriculture and livestock.
The latest EPE annual report, published at the end of 2014 (EPE, 2014), indicates that almost half of the energy-related GHG emissions in Brazil come from the transportation sector (46 percent), followed by industry (22 percent), and the power-generation sector (13 percent). EPE estimates that these shares will remain roughly the same over the next decade (Figure 6).
2014
2023
Fuel production/fueltransformation (energy sector): 29
Transport: 224
Industrial: 106
Power generation: 64
Building sector: 21
Fugitive emissions: 21Agriculture and livestock: 18
total=483MtCO
2e
total=660MtCO
2e
Fuel production/fueltransformation (energy sector): 57
Transport: 306
Industrial: 145
Power generation: 73
Building sector: 33
Fugitive emissions: 25Agriculture and livestock: 22
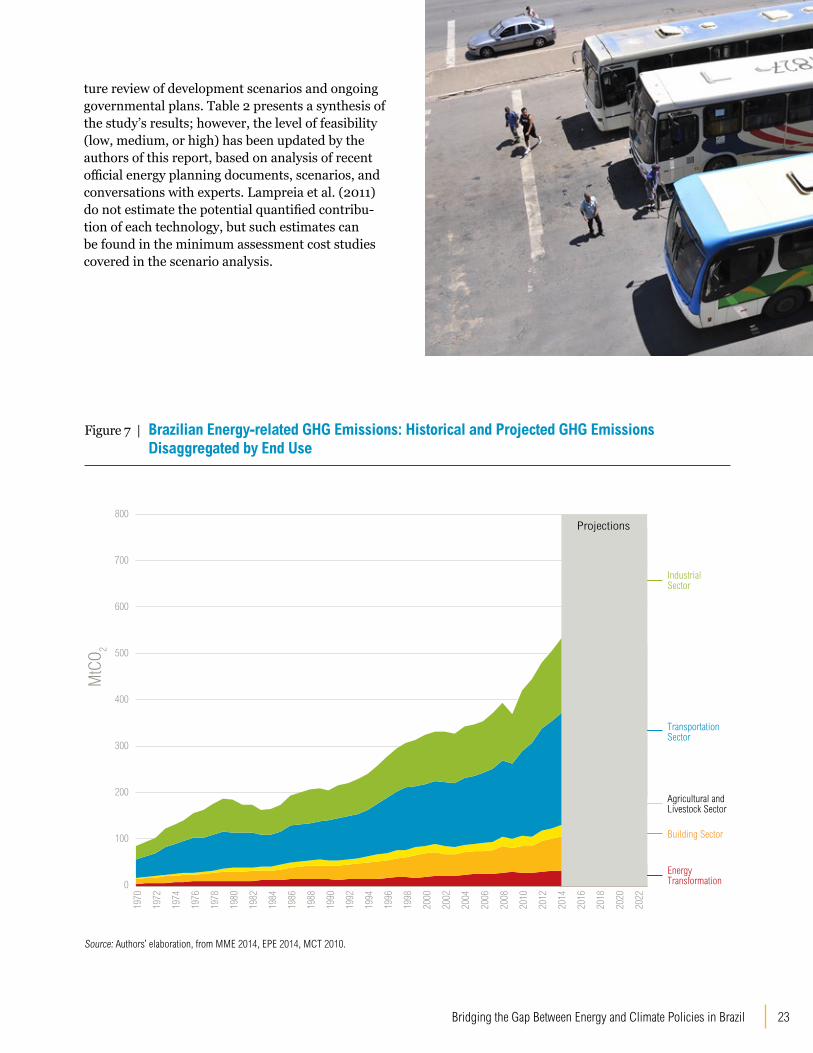
Figure 7 disaggregates GHG emissions by energy end use from 1970 to 2023. These data were calcu-lated on the basis of different official governmental reports (MME, 2014; EPE, 2014; MCTi, 2010) by applying emission factors to estimates of fuel consumption. The results highlight the relevance of particular energy-related GHG emission categories to climate policies, especially transport, industry, and the power-generation sector.
Lampreia et al.(2011) consider a number of energy-related technologies and identify levels of feasibil-ity for their widespread deployment in Brazil by 2030, as well as key barriers that would need to be addressed to foster the use of such technologies. The selection of technologies was based on a litera-
Figure 6 | Energy-related GHG Emissions in 2014 and Projected for 2023
Source: EPE, 2014.
23Bridging the Gap Between Energy and Climate Policies in Brazil
0
100
200
300
400
500
600
700
800
1970
1972
1974
1976
1978
1980
1982
1984
1986
1988
1990
1992
1994
1996
1998
2000
2002
2004
2006
2008
2010
2012
2014
2016
2018
2020
2022
MtC
O 2
Sectoral Emissions End-Uses
Industrial Sector
Transportation Sector
Agricultural and Livestock Sector
Building Sector
Energy Transformation
Projections
Figure 7 | Brazilian Energy-related GHG Emissions: Historical and Projected GHG Emissions Disaggregated by End Use
Source: Authors’ elaboration, from MME 2014, EPE 2014, MCT 2010.
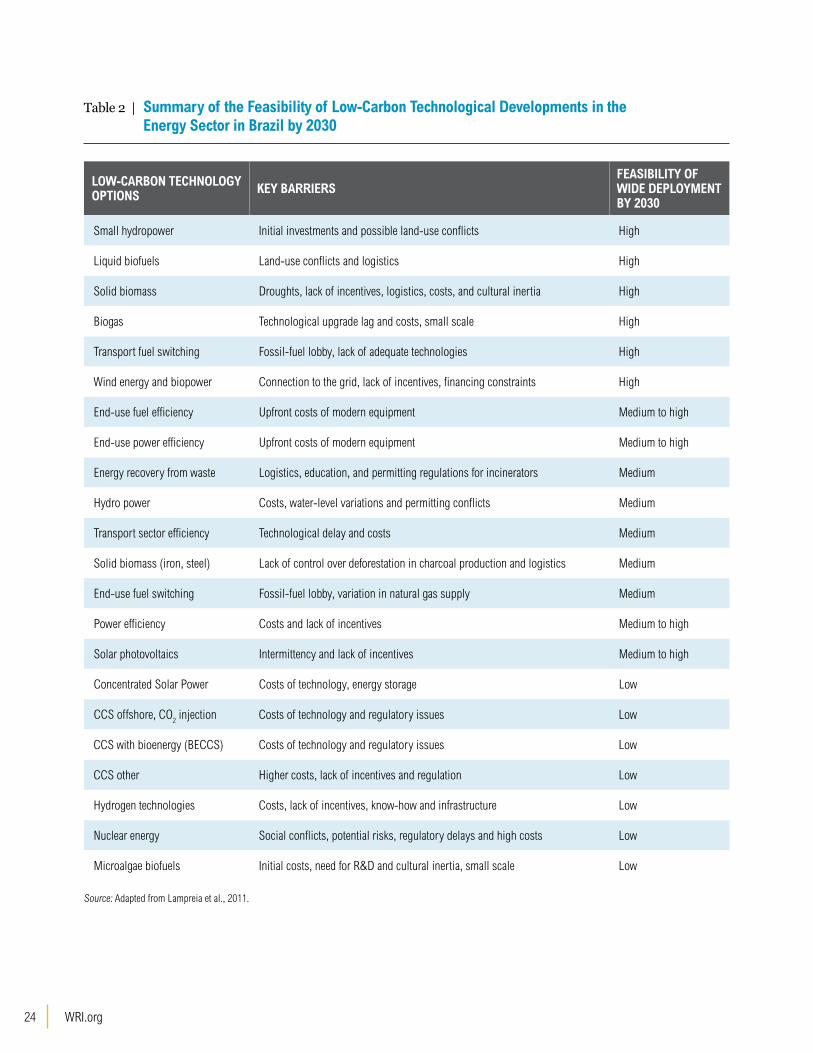
ture review of development scenarios and ongoing governmental plans. Table 2 presents a synthesis of the study’s results; however, the level of feasibility (low, medium, or high) has been updated by the authors of this report, based on analysis of recent official energy planning documents, scenarios, and conversations with experts. Lampreia et al. (2011) do not estimate the potential quantified contribu-tion of each technology, but such estimates can be found in the minimum assessment cost studies covered in the scenario analysis.
WRI.org 24
Table 2 | Summary of the Feasibility of Low-Carbon Technological Developments in the Energy Sector in Brazil by 2030
LOW-CARBON TECHNOLOGY OPTIONS KEY BARRIERS
FEASIBILITY OF WIDE DEPLOYMENT BY 2030
Small hydropower Initial investments and possible land-use conflicts High
Liquid biofuels Land-use conflicts and logistics High
Solid biomass Droughts, lack of incentives, logistics, costs, and cultural inertia High
Biogas Technological upgrade lag and costs, small scale High
Transport fuel switching Fossil-fuel lobby, lack of adequate technologies High
Wind energy and biopower Connection to the grid, lack of incentives, financing constraints High
End-use fuel efficiency Upfront costs of modern equipment Medium to high
End-use power efficiency Upfront costs of modern equipment Medium to high
Energy recovery from waste Logistics, education, and permitting regulations for incinerators Medium
Hydro power Costs, water-level variations and permitting conflicts Medium
Transport sector efficiency Technological delay and costs Medium
Solid biomass (iron, steel) Lack of control over deforestation in charcoal production and logistics Medium
End-use fuel switching Fossil-fuel lobby, variation in natural gas supply Medium
Power efficiency Costs and lack of incentives Medium to high
Solar photovoltaics Intermittency and lack of incentives Medium to high
Concentrated Solar Power Costs of technology, energy storage Low
CCS offshore, CO2 injection Costs of technology and regulatory issues Low
CCS with bioenergy (BECCS) Costs of technology and regulatory issues Low
CCS other Higher costs, lack of incentives and regulation Low
Hydrogen technologies Costs, lack of incentives, know-how and infrastructure Low
Nuclear energy Social conflicts, potential risks, regulatory delays and high costs Low
Microalgae biofuels Initial costs, need for R&D and cultural inertia, small scale Low
Source: Adapted from Lampreia et al., 2011.
25Bridging the Gap Between Energy and Climate Policies in Brazil
The following chapter provides a deeper focus on the major GHG-emitting energy subsectors in Brazil—transport, industry, and power genera-tion—examines the main trends, and recommends policies to meet energy needs in ways that are consistent with global climate goals. These recom-mendations are based largely on (i) policy litera-ture specific to Brazil; (ii) international literature on best-practice policies in key energy sectors; (iii) analysis of existing GHG scenarios; and (iv) expert opinion elicited from energy and climate stakeholders.
Transport Context and trends
From the GHG-emissions standpoint, transporta-tion is one of the most urgent Brazilian energy subsectors to address, and the various scenarios discussed above identified it as the key energy subsector to be decarbonized. As already men-tioned, in 2013, transportation was responsible for nearly half of Brazil’s energy emissions (46 percent or 224 MtCO2e) (EPE, 2014), and in EPE’s outlook this share is projected to be maintained over the next decade. By 2023, overall energy emissions are expected to increase from 483 MtCO2e to 660 MtCO2e, of which transportation will account for 306 MtCO2e (EPE 2014).
Initiatives to reduce GHG emissions from the Bra-zilian transportation sector have taken a variety of approaches. Under the Sectoral Plan for Transport and Urban Mobility for the Mitigation of Climate Change (PSTM), a proposal to develop energy-efficiency standards for the light- and heavy-duty vehicle fleets was developed in 2012 (MMA, 2012). The so-called Inovar-Auto program was established to support technology development, innovation, safety, environmental protection, energy efficiency, and the quality of vehicles. This program, however, lacks ambition to bring Brazilian vehicle standards into line with international best practices. More-over, future steps for this initiative are not clearly defined as of July 2015, which creates uncertainty for investors and undoubtedly delays manufac-turers’ investment plans concerning advanced technologies. Another challenge is how to induce car-makers to develop the flex-fuel technology necessary to incorporate ethanol fuel efficiently in new hybrid electric vehicles. Heavy-duty diesel-fueled engines are also not prepared to run on high blends of bio-diesel covered by the manufacturers’ guarantees.
Contrary to any reasonable climate and energy efficiency policy, the government decided, in 2012, to discontinue the Tax on Industrialized Goods
WRI.org 26
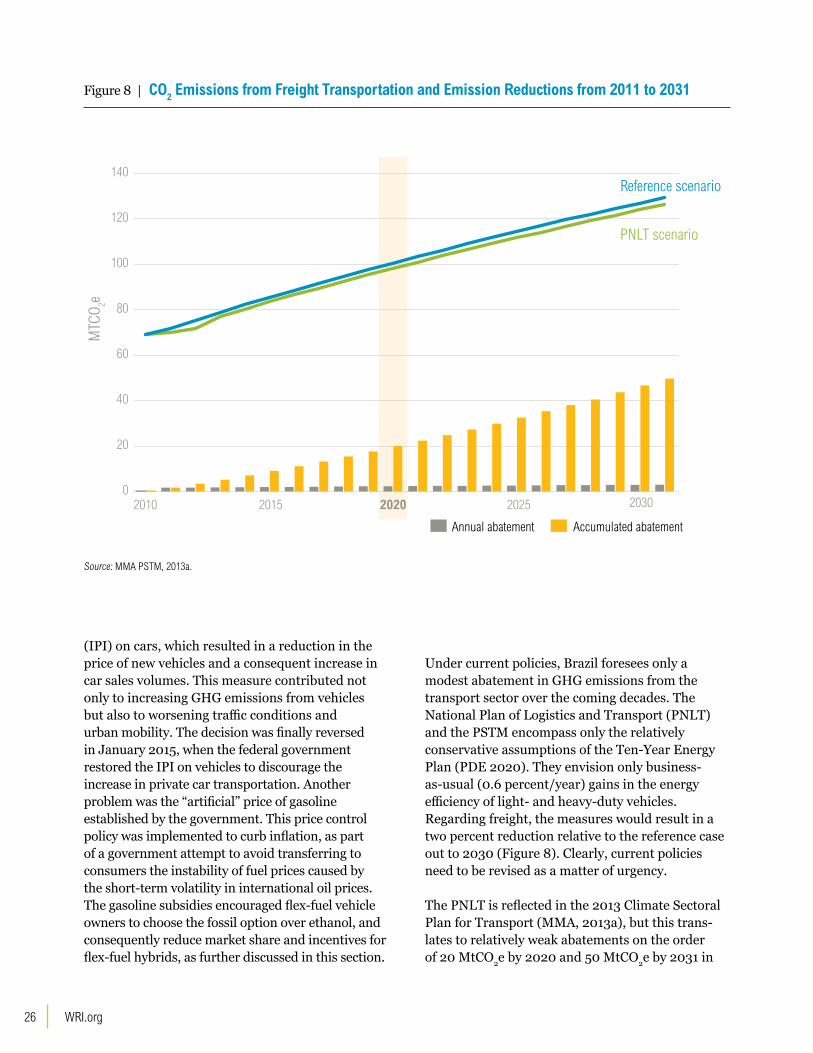
Figure 8 | CO2 Emissions from Freight Transportation and Emission Reductions from 2011 to 2031
Source: MMA PSTM, 2013a.
0
20
40
60
80
100
120
140Reference scenario
PNLT scenario
Annual abatement
2010
MTC
O 2e
2030202520202015
Accumulated abatement
(IPI) on cars, which resulted in a reduction in the price of new vehicles and a consequent increase in car sales volumes. This measure contributed not only to increasing GHG emissions from vehicles but also to worsening traffic conditions and urban mobility. The decision was finally reversed in January 2015, when the federal government restored the IPI on vehicles to discourage the increase in private car transportation. Another problem was the “artificial” price of gasoline established by the government. This price control policy was implemented to curb inflation, as part of a government attempt to avoid transferring to consumers the instability of fuel prices caused by the short-term volatility in international oil prices. The gasoline subsidies encouraged flex-fuel vehicle owners to choose the fossil option over ethanol, and consequently reduce market share and incentives for flex-fuel hybrids, as further discussed in this section.
Under current policies, Brazil foresees only a modest abatement in GHG emissions from the transport sector over the coming decades. The National Plan of Logistics and Transport (PNLT) and the PSTM encompass only the relatively conservative assumptions of the Ten-Year Energy Plan (PDE 2020). They envision only business-as-usual (0.6 percent/year) gains in the energy efficiency of light- and heavy-duty vehicles. Regarding freight, the measures would result in a two percent reduction relative to the reference case out to 2030 (Figure 8). Clearly, current policies need to be revised as a matter of urgency. The PNLT is reflected in the 2013 Climate Sectoral Plan for Transport (MMA, 2013a), but this trans-lates to relatively weak abatements on the order of 20 MtCO2e by 2020 and 50 MtCO2e by 2031 in
27Bridging the Gap Between Energy and Climate Policies in Brazil
freight transport, and 19.5–20 MtCO2e by 2020 for all modes of passenger transport. (By contrast, 1,255 MtCO2e of abatement is foreseen for 2020 in the Decree 7.390/2010 described previously.)
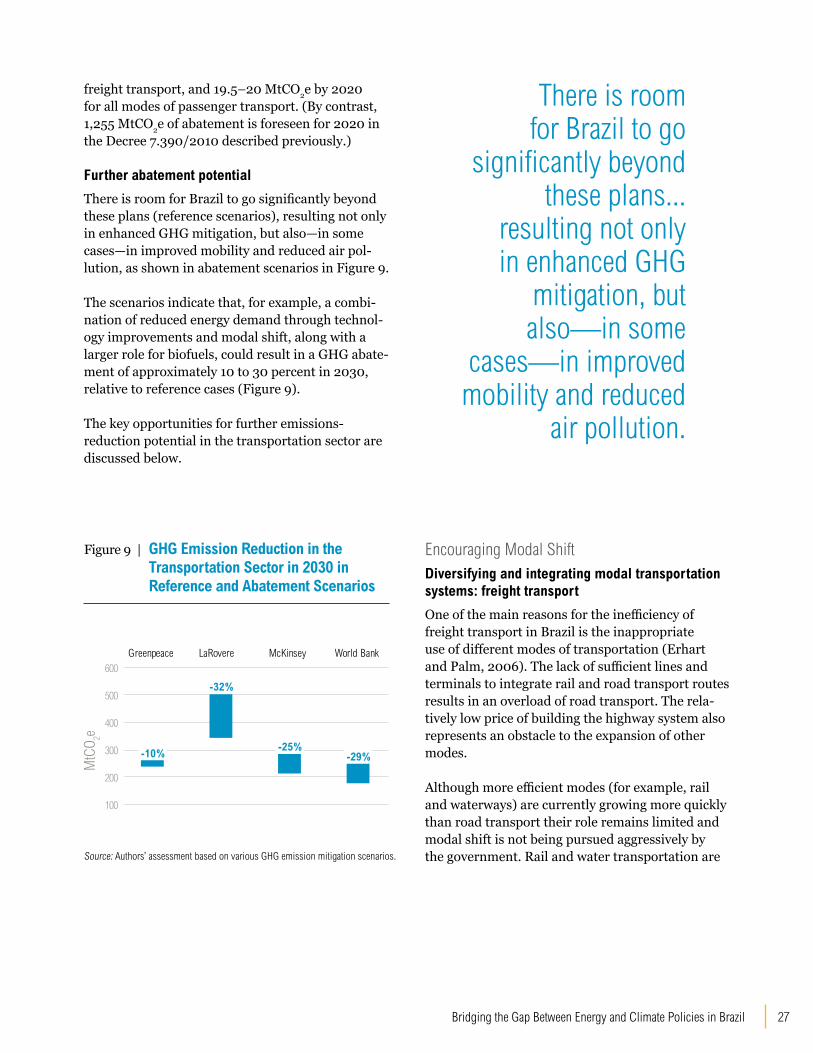
Further abatement potential
There is room for Brazil to go significantly beyond these plans (reference scenarios), resulting not only in enhanced GHG mitigation, but also—in some cases—in improved mobility and reduced air pol-lution, as shown in abatement scenarios in Figure 9. The scenarios indicate that, for example, a combi-nation of reduced energy demand through technol-ogy improvements and modal shift, along with a larger role for biofuels, could result in a GHG abate-ment of approximately 10 to 30 percent in 2030, relative to reference cases (Figure 9). The key opportunities for further emissions-reduction potential in the transportation sector are discussed below.
Greenpeace LaRovere McKinsey World Bank
0
100
200
300
400
500
600
AbatementReference
MtC
O 2e
-10%
-32%
-25%-29%
Greenpeace LaRovere McKinsey World Bank
0
100
200
300
400
500
600
AbatementReference
MtC
O 2e
-10%
-32%
-25%-29%
Greenpeace LaRovere McKinsey World Bank
0
100
200
300
400
500
600
AbatementReference
MtC
O 2e
-10%
-32%
-25%-29%
Figure 9 | GHG Emission Reduction in the Transportation Sector in 2030 in Reference and Abatement Scenarios
Source: Authors’ assessment based on various GHG emission mitigation scenarios.
There is room for Brazil to go
significantly beyond these plans...
resulting not only in enhanced GHG
mitigation, but also—in some
cases—in improved mobility and reduced
air pollution.
Encouraging Modal ShiftDiversifying and integrating modal transportation systems: freight transport
One of the main reasons for the inefficiency of freight transport in Brazil is the inappropriate use of different modes of transportation (Erhart and Palm, 2006). The lack of sufficient lines and terminals to integrate rail and road transport routes results in an overload of road transport. The rela-tively low price of building the highway system also represents an obstacle to the expansion of other modes.
Although more efficient modes (for example, rail and waterways) are currently growing more quickly than road transport their role remains limited and modal shift is not being pursued aggressively by the government. Rail and water transportation are
WRI.org 28
impeded by the complicated bureaucratic proce-dures involved in obtaining environmental licens-ing, high costs of constructing infrastructure, and lack of governmental attention (MMA, 2013b).
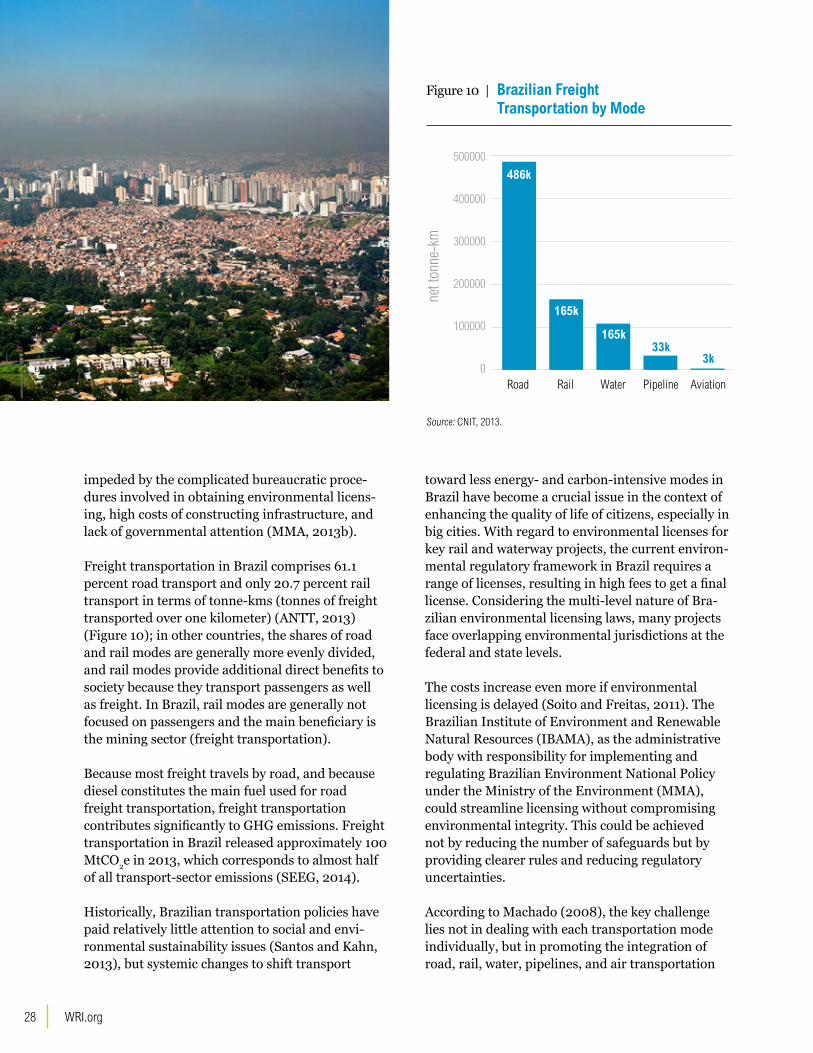
Freight transportation in Brazil comprises 61.1 percent road transport and only 20.7 percent rail transport in terms of tonne-kms (tonnes of freight transported over one kilometer) (ANTT, 2013) (Figure 10); in other countries, the shares of road and rail modes are generally more evenly divided, and rail modes provide additional direct benefits to society because they transport passengers as well as freight. In Brazil, rail modes are generally not focused on passengers and the main beneficiary is the mining sector (freight transportation).
Because most freight travels by road, and because diesel constitutes the main fuel used for road freight transportation, freight transportation contributes significantly to GHG emissions. Freight transportation in Brazil released approximately 100 MtCO2e in 2013, which corresponds to almost half of all transport-sector emissions (SEEG, 2014).
Historically, Brazilian transportation policies have paid relatively little attention to social and envi-ronmental sustainability issues (Santos and Kahn, 2013), but systemic changes to shift transport
0
100000
200000
300000
400000
500000
net t
onne
-km
-
-
-
-
-
-
Road
486k
165k
165k33k
3k
Rail Water Pipeline Aviation
toward less energy- and carbon-intensive modes in Brazil have become a crucial issue in the context of enhancing the quality of life of citizens, especially in big cities. With regard to environmental licenses for key rail and waterway projects, the current environ-mental regulatory framework in Brazil requires a range of licenses, resulting in high fees to get a final license. Considering the multi-level nature of Bra-zilian environmental licensing laws, many projects face overlapping environmental jurisdictions at the federal and state levels.
The costs increase even more if environmental licensing is delayed (Soito and Freitas, 2011). The Brazilian Institute of Environment and Renewable Natural Resources (IBAMA), as the administrative body with responsibility for implementing and regulating Brazilian Environment National Policy under the Ministry of the Environment (MMA), could streamline licensing without compromising environmental integrity. This could be achieved not by reducing the number of safeguards but by providing clearer rules and reducing regulatory uncertainties.
According to Machado (2008), the key challenge lies not in dealing with each transportation mode individually, but in promoting the integration of road, rail, water, pipelines, and air transportation
Figure 10 | Brazilian Freight Transportation by Mode
Source: CNIT, 2013.
29Bridging the Gap Between Energy and Climate Policies in Brazil
modes, and creating storage spaces for freight. It would be important for the federal government to invest in more actions to maximize the use of the available capacity of transportation modes, and in more efficient modes (ANTT, 2014).
Encouraging modal shift and promoting multi-modal transportation systems in Brazil would reduce the high reliance on road transport and lead to better integrated planning, especially in terms of land use in urban centers. In pursuit of these goals, freight transport vehicles need to be larger, carry a bigger load, and operate more quickly. Ports must be prepared for such demands via land and water, and this requires significant government effort.
As for the high costs of infrastructure, financial resources have not been sufficient to plan and implement a national system of integrated surface transport. Governments have been struggling to balance investments in transportation with other pressing needs (eliminating poverty, improving health conditions, and combating hunger, among others). However, it is possible to achieve substan-tial improvements in all modes and in their integra-tion, even with existing resources. Federal plans, especially the National Mobility Plan (Plan-Mob) do not currently provide strong support for shifting transportation modes (for example, road to rail), and a greater integration between transport regula-tory agencies could help with establishing measures to integrate modal transportation systems.
Diversifying and integrating modal transportation systems: passenger transport
Integrating and optimizing existing routes and transport modes for public transport of passengers could not only reduce GHG emissions, but also increase local quality of life by reducing road traffic from individual transportation modes. The benefits of investing in mass-passenger transport within major urban centers include reduced air pollution and improved traffic flow, as well as improved management and operation of transportation to optimize routes.
The Ministry of Transport could prioritize public transportation through exploring high-speed rail to displace the use of individual modes of transportation for long distances, and also by developing high-capacity bus and rail transport systems in high-demand areas, as suggested by Machado (2008). The Ministry of Cities, under the National Secretary of Transport and Urban Mobility (SeMob), could offer municipalities incentives to create local mass-transport plans under the National Mobility Plan (Plan-Mob). As measures to discourage individual transportation, local governments could create and/or improve strategies that limit the use of private cars, such as restrictive parking policies in downtown areas or license-plate-rationing schemes, similar to those used in São Paulo, Quito, and Los Angeles, among other cities. Municipalities could also create and/or
WRI.org 30
improve strategies that reduce the emissions impact of private vehicles, such as compulsory inspections and maintenance programs for heavy vehicles that could be linked to annual licensing, and voluntary inspection and maintenance programs for light vehicles.
Municipal governments of major cities could also invest in solutions to manage traffic flow and reduce congestion delays, focusing their policies on mass
passenger transportation systems. Increasing the frequency and punctuality of public transportation (especially local buses), and increasing the number of bus corridors, for example, could save travel time, reduce operational costs, improve urban mobility, and decrease traffic congestion, all while reducing GHG emissions from the transportation sector. The most common options in major urban centers are Bus Rapid Transit (BRT) systems and metro lines. Because BRT systems are less costly and can be implemented more quickly (Conselho de Arquitetura e Urbanismo, 2015), local governments could prioritize the use of BRTs by introducing bus-only lanes to improve the speed and comfort of travel and reduce traffic congestion. Those cities that already have metro and rail systems (such as São Paulo and Rio de Janeiro) could improve the quality of rail and subway services and expand the existing lines.
A survey recently conducted among residents of São Paulo City, for example, identified that the level of satisfaction with local transportation has increased over the past year. One of the reasons is the increasing number of bicycle lanes (Embarq Brasil, 2015). However, while this is an important achievement, the overall shift is still very modest and could receive much more attention and investment from local governors. Local governments could create and expand bike lanes, especially in major cities; create more bicycle parking facilities; enhance the quality, attractiveness, and safety of sidewalks; and incorporate bicycle path networks into public-transport policies and systems. Such measures could lead to additional national benefits, such as reduced energy costs, fewer road accidents, less traffic, better mobility, and less pollution.
Promoting Vehicle EfficiencyThe predominance of road transport is likely to persist but the introduction of new vehicle tech-nologies, particularly those that increase the energy efficiency of heavy vehicles, can play an important role in mitigating GHG emissions. In fact, there is already competition among manufacturers to offer more fuel-efficient trucks for freight transporta-tion because fuel expenses represent a high por-tion of freight operating costs. Major investments in infrastructure to increase storage capacity at dispatching and receiving locations and better
Integrating and optimizing existing routes and transport modes for public transport of passengers could not only reduce GHG emissions, but also increase local quality of life by reducing road traffic from individual transportation modes. The benefits of investing in mass-passenger transport within major urban centers include reduced air pollution and improved traffic flow, as well as improved management and operation of transportation to optimize routes.
31Bridging the Gap Between Energy and Climate Policies in Brazil
logistics planning—at both the supply chain level and on road and rail networks to avoid the need for long distance transport—could reduce unnecessary tonne-kms and result in efficiency gains of more than 75 percent in tons CO2 per kilometer (CEFIC, 2012; EPE, 2011; SP, 2010; Filho, 2010).
According to the New European Driving Cycle (NEDC) test cycle (adapted from ICCT 2012), improved efficiency standards could result in a 30–50 percent increase in efficiency for a new fleet of light-duty vehicles.
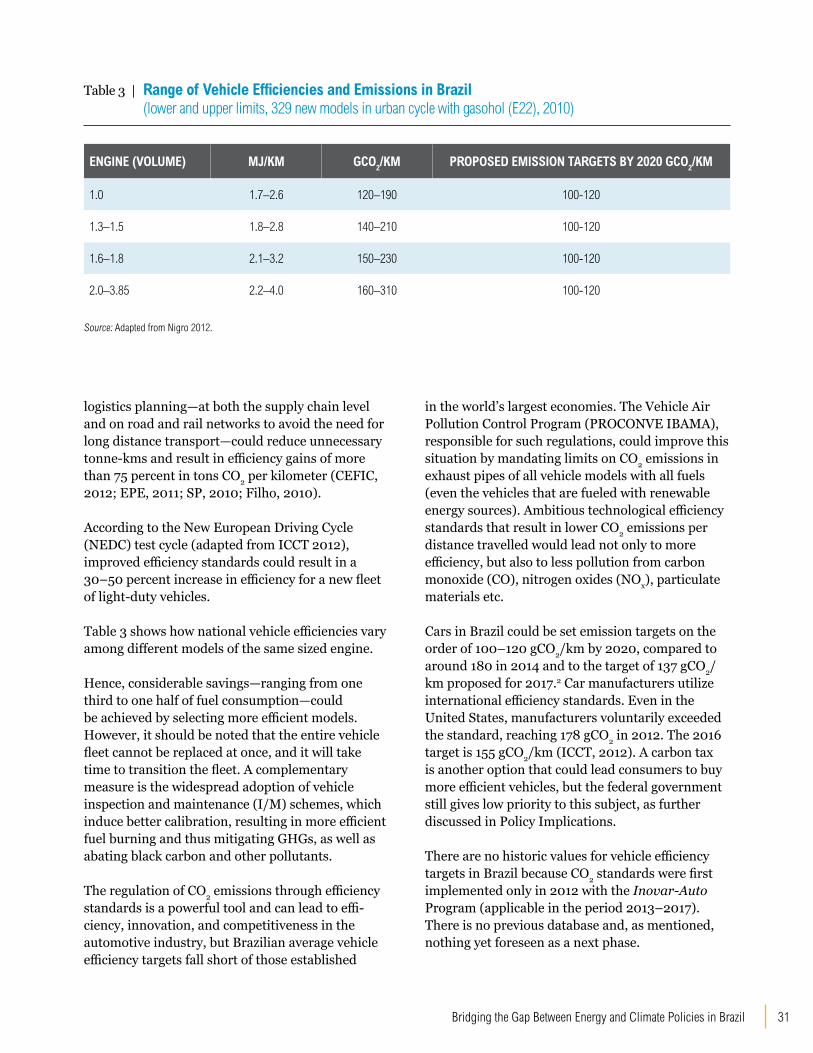
Table 3 shows how national vehicle efficiencies vary among different models of the same sized engine.
Hence, considerable savings—ranging from one third to one half of fuel consumption—could be achieved by selecting more efficient models. However, it should be noted that the entire vehicle fleet cannot be replaced at once, and it will take time to transition the fleet. A complementary measure is the widespread adoption of vehicle inspection and maintenance (I/M) schemes, which induce better calibration, resulting in more efficient fuel burning and thus mitigating GHGs, as well as abating black carbon and other pollutants.
The regulation of CO2 emissions through efficiency standards is a powerful tool and can lead to effi-ciency, innovation, and competitiveness in the automotive industry, but Brazilian average vehicle efficiency targets fall short of those established
in the world’s largest economies. The Vehicle Air Pollution Control Program (PROCONVE IBAMA), responsible for such regulations, could improve this situation by mandating limits on CO2 emissions in exhaust pipes of all vehicle models with all fuels (even the vehicles that are fueled with renewable energy sources). Ambitious technological efficiency standards that result in lower CO2 emissions per distance travelled would lead not only to more efficiency, but also to less pollution from carbon monoxide (CO), nitrogen oxides (NOx), particulate materials etc.
Cars in Brazil could be set emission targets on the order of 100–120 gCO2/km by 2020, compared to around 180 in 2014 and to the target of 137 gCO2/km proposed for 2017.2 Car manufacturers utilize international efficiency standards. Even in the United States, manufacturers voluntarily exceeded the standard, reaching 178 gCO2 in 2012. The 2016 target is 155 gCO2/km (ICCT, 2012). A carbon tax is another option that could lead consumers to buy more efficient vehicles, but the federal government still gives low priority to this subject, as further discussed in Policy Implications.
There are no historic values for vehicle efficiency targets in Brazil because CO2 standards were first implemented only in 2012 with the Inovar-Auto Program (applicable in the period 2013–2017). There is no previous database and, as mentioned, nothing yet foreseen as a next phase.
Table 3 | Range of Vehicle Efficiencies and Emissions in Brazil (lower and upper limits, 329 new models in urban cycle with gasohol (E22), 2010)
ENGINE (VOLUME) MJ/KM GCO2/KM PROPOSED EMISSION TARGETS BY 2020 GCO2/KM
1.0 1.7–2.6 120–190 100-120
1.3–1.5 1.8–2.8 140–210 100-120
1.6–1.8 2.1–3.2 150–230 100-120
2.0–3.85 2.2–4.0 160–310 100-120
Source: Adapted from Nigro 2012.
WRI.org 32
Investing in Electrical and Hybrid Vehicles and Increasing Synergies between Transport and the Power SectorFostering the development of new end-use technologies such as electric vehicles and hybrid vehicles (electricity and ethanol, for example), as well as the production of more efficient vehicles that demand less fuel and consequently reduce GHG emissions, represents one of the key strategies to decarbonize the transportation sector in Brazil (Greenpeace, 2013). The diffusion of hybrid and electric vehicles provides practical energy efficiency over time, and the notion of a hybrid system becomes even more tangible in Brazil because consumers are already used to a flex-fuel system, and it might facilitate an eventual transition to electric light vehicles and even to hybrid-drive buses (Johnson and Semida, 2014). In the case of public transportation, Almeida, Kahn and Cristiane (2013) state that the use of hybrid-drive buses is a promising option, and that state governments should consider the use of hybrid vehicles (diesel-electric or ethanol-electric) and fuel-cell electric vehicles (hydrogen-powered).
However, the penetration of hybrid and electric vehicles in the national market in Brazil is still slow, as stated in the terms of reference of the 2050 PNE (EPE, 2013). Questions of technical and economic feasibility, and the lack of governmental
incentives, have limited their growth to less than 600 units, and it is estimated that by 2023 they will represent only 4.2 percent of new licensed vehicles (EPE, 2013). In spite of the various challenges and the relatively low support from the government, a few initiatives exist to foster their dissemination. In 2012, for example, the local government from Curitiba established the “Hibribus,” an electric-biodiesel-fueled public bus that operates with two motors (in parallel or independently), leading to a reduction in GHG emissions of 35 percent (URBS, 2012). The electric motor is also used as a power generator during braking. Each time the brakes are applied, the energy of deceleration is used to charge the batteries. In 2013, Renault and Itaipu Binational signed an agreement (EPE, 2013) to jointly invest in research and development of electric vehicles. The agreement includes studies to analyze the feasibility of producing some key components nationally (instead of importing them). An example of such a component is batteries, which can account for approximately 50 percent of the total costs to produce hybrid vehicles (Sector Value, 2013).
Brazil could become a prime candidate for mass electrification of part of its transport fleet, if the country’s vast untapped renewable energy potential is explored. However, it is important to recall that electricity is increasingly being generated by fossil fuels. If this trend continues, it is possible
33Bridging the Gap Between Energy and Climate Policies in Brazil
that incentives to encourage the growth of electric vehicles could actually stimulate the demand for fossil fuels in power generation. Any decision to promote electric vehicles should emphasize co-benefits, such as lowered local air pollution. It is also important to consider the increasing role that biofuels can play in the transport sector, ultimately leading to lower carbon emissions than under an “electrified” scenario.
By increasing the share of renewable energy in the electricity mix, a major shift toward electricity consumption in the transport sector in Brazil could be very important to help the load curve (which is the variation in energy demand from a specific source at a specific time). The big payoff will result from shifting to renewable electricity, rather than gasoline and ethanol, to power transport fleets, and such a shift could also reduce the pressure on distillation capacity for liquid fuels and on land use for ethanol production.
Nevertheless, disseminating the technologies and realizing the cost savings from increasing the use of hybrid and electric light and heavy vehicles will be achieved only in the long term, according to projec-tions. The same is true for deploying the necessary infrastructure that will allow these vehicles to be competitive in the market (EPE, 2013). It is esti-mated that the fleet of regular buses, especially urban buses, will migrate to hybrid or electric
fleets only by 2050, but these estimates are based on current (low) incentives to spread the use of such technology. If better incentives are provided, this migration could occur by 2030. Considering that development of the power infrastructure for transport and all the distributed energy options can bring additional benefits, especially for the domes-tic industrial capacity of the country, the federal government could provide incentives to encourage the inclusion of hybrids and electrical vehicles in the energy transportation mix in the next 15 years. Such incentive should also cover electric motor-cycles, scooters, and even bicycles, which are in the end dematerialized vehicles (vehicles whose construction requires less material and energy than regular vehicles).
Because current Brazilian law offers few opportunities to introduce these kinds of incentive, the federal government could provide tax relief (reductions in IPI, PIS, and COFINS) to increase production of hybrid and electric vehicles, while local governments could provide tax relief (IPVA exemption) to increase the sales of such vehicles. In some states, for example, Maranhão, Pernambuco, Ceará, Rio Grande do Norte, Rio Grande do Sul, and Sergipe, there is already a tax exemption (IPVA) for hybrid vehicles. In São Paulo, the license-plate-rationing scheme does not apply to electric vehicles (Stocco, 2013).
WRI.org 34
Another option could be that federal and local authorities prioritize, at least in the short and medium term, the development and operation of hybrid public buses (ethanol-electric, biodiesel-electric, or diesel-electric) in place of hybrid light vehicles. Because this technology is considered more appropriate to congested, large traffic urban zones, it would be easier to create fixed infrastruc-ture to recharge such vehicles (Almeida, Kahn, and Cristiane, 2013). If the government establishes a sectoral ethanol fund, as further discussed below, part of the resources could be focused on research and development to foster the deployment of hybrid vehicles that are capable of making efficient use of biofuels—a genuine Brazilian technology.
However, while these alternative options to replace fossil fuels in public transportation are relevant in terms of GHG emissions, it is important to consider the negative effects in terms of the higher infrastructural costs of the system; increased fees and fares would make public transportation less accessible to the population. Because public transport in Brazil is currently priced with a tariff, it is recommended that the relevant authorities subsidize such measures to avoid increasing the cost of tariffs because of the burden it places on citizens. It is also recommended that subsidies to diesel are ended,3 to level the playing field with biofuels.
Promoting the Use of Biofuels in the Transportation Sector
The production of sugarcane ethanol in Brazil is considered highly efficient in capturing and converting solar energy relative to other types of ethanol. The net energy balance (the output ratio of energy contained in a certain volume of the fuel divided by the input ratio of energy required for its production) of sugarcane first-generation ethanol is high (8 to 10), while the net energy balance in the production of maize ethanol in the United States, for example, is about 1.3 to 1.6 (Shapouri, 2002; Macedo, 2004; Goldemberg, 2008). The efficiency of sugarcane ethanol can be even higher with recent developments on cellulosic ethanol (second generation made by grasses, wood etc.) that might improve the output/input ratio yields.
The energy balance associated with sugarcane ethanol results in considerably reduced GHG emissions: while maize ethanol reduces GHG emissions by only 18 percent relative to gasoline, sugarcane ethanol in Brazil reduces GHG emissions by 91 percent when it replaces gasoline (Macedo, 2008; Goldemberg, 2008). The World Bank estimates that the use of ethanol rather than fossil fuels in Brazil results in avoided emissions of approximately 50MtCO2e per year (World Bank, 2010).
Despite these mitigation benefits, there is an important debate concerning the land-use change (LUC) associated with the production of biofuels, and the relationships between food, energy, and environmental sustainability (Souza et al., 2015). There is considerable controversy surrounding the amount of land-use change globally that can be linked to the production of biofuel (Tyner and Taheripour, 2013; Searchinger and Heimlich, 2015). In the case of Brazil, robust literature reviews show that the expansion of sugarcane in recent years has occurred mostly at the expense of extensive pasturelands and other temporary crops, without leading to perceivable indirect land-use change related to deforestation (Walter et al. 2011; Souza et al, 2015). There is virtually no sugarcane in the Amazon; sugarcane expansion occurred outside the Amazonian forest because of the practical difficulties of growing sugarcane crops in hot and humid areas. The expansion in the Cerrado has occurred mainly on pastures,
35Bridging the Gap Between Energy and Climate Policies in Brazil
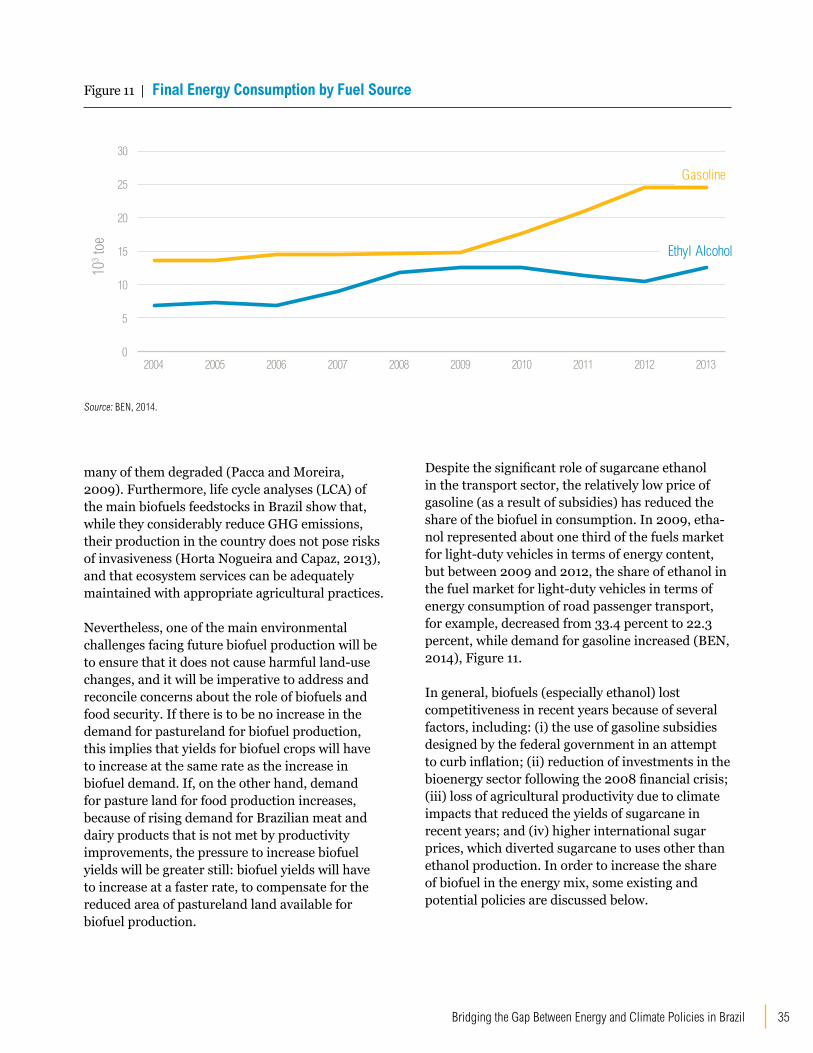
many of them degraded (Pacca and Moreira, 2009). Furthermore, life cycle analyses (LCA) of the main biofuels feedstocks in Brazil show that, while they considerably reduce GHG emissions, their production in the country does not pose risks of invasiveness (Horta Nogueira and Capaz, 2013), and that ecosystem services can be adequately maintained with appropriate agricultural practices.
Nevertheless, one of the main environmental challenges facing future biofuel production will be to ensure that it does not cause harmful land-use changes, and it will be imperative to address and reconcile concerns about the role of biofuels and food security. If there is to be no increase in the demand for pastureland for biofuel production, this implies that yields for biofuel crops will have to increase at the same rate as the increase in biofuel demand. If, on the other hand, demand for pasture land for food production increases, because of rising demand for Brazilian meat and dairy products that is not met by productivity improvements, the pressure to increase biofuel yields will be greater still: biofuel yields will have to increase at a faster rate, to compensate for the reduced area of pastureland land available for biofuel production.
0
5
10
15
20
25
30
2004 2005 2006 2007 2008 2009 2010 2011 2012 2013
Gasoline
Ethyl Alcohol
103 to
eFigure 11 | Final Energy Consumption by Fuel Source
Source: BEN, 2014.
Despite the significant role of sugarcane ethanol in the transport sector, the relatively low price of gasoline (as a result of subsidies) has reduced the share of the biofuel in consumption. In 2009, etha-nol represented about one third of the fuels market for light-duty vehicles in terms of energy content, but between 2009 and 2012, the share of ethanol in the fuel market for light-duty vehicles in terms of energy consumption of road passenger transport, for example, decreased from 33.4 percent to 22.3 percent, while demand for gasoline increased (BEN, 2014), Figure 11.
In general, biofuels (especially ethanol) lost competitiveness in recent years because of several factors, including: (i) the use of gasoline subsidies designed by the federal government in an attempt to curb inflation; (ii) reduction of investments in the bioenergy sector following the 2008 financial crisis; (iii) loss of agricultural productivity due to climate impacts that reduced the yields of sugarcane in recent years; and (iv) higher international sugar prices, which diverted sugarcane to uses other than ethanol production. In order to increase the share of biofuel in the energy mix, some existing and potential policies are discussed below.
WRI.org 36
Phasing out fossil-fuel subsidies
Price controls on fossil fuels subsidize their con-sumption and affect the competitiveness of renew-able energy. In Brazil, this is a case of gasoline against ethanol (and, to a lesser extent, of diesel against biodiesel). Investments prioritizing oil (and gas) infrastructure are other forms of “hidden” subsidies. Price-control policy is part of the govern-ment’s efforts to curb inflation, an attempt to avoid transferring to consumers the short-term volatility in international oil prices (Aidar and Serigati, 2015; Fattouh et al., 2015). This leads to relatively lower gasoline prices, compared to the “rule of thumb” break-even price. It is known from consumer behavior studies that ethanol is only preferable if the cost per liter is 70 percent of the cost of gasoline at the pump, or lower. As a result, flex-fuel vehicle owners choose the fossil option over ethanol, and consequently reduce market share and incentives for flex-fuel hybrids.
The federal government finally adjusted and raised the price of gasoline in 2013; the increase had originally been planned for 2007. The government also announced an increase in the mandated level
of ethanol (anhydrous alcohol mixture) from 20 percent to 25 percent, and unveiled a set of tax cuts for the ethanol industry.
Instead of providing fossil-fuel subsidies, it would be more useful to increase the subsidies to renewable-energy sources (Goldemberg, 2012). In this spirit, when the government recently fully reestablished the CIDE for gasoline, it created incentives to enhance the production of biodiesel, by reducing some federal taxes on the production of renewable fuel. They include the CIDE tax, the Industrialized Products Tax (IPI), the Contribution to the Social Integration Program and Civil Service Asset Formation Program (PIS/Pasep), and the Contribution to Social Security Financing (COFINS). The government also offered low-cost credit to biofuel producers, as well as some subsidies that cover the higher cost of biofuels relative to diesel. In November 2014, the federal government established the Normative Instruction no 1.514, suspending the levy of PIS/Pasep and COFINS on the acquisition of raw materials that are used for biodiesel production, which translates to a tax reduction of 0.825 percent and 3.8 percent respectively.
37Bridging the Gap Between Energy and Climate Policies in Brazil
Investing in more R&D and creating a sectoral biofuel fund
Additional measures are necessary to induce continued long-term technological progress on biofuels. It is important to coordinate financing lines and programs in science, technology, and innovation (ST&I) and continuous research and development (R&D) to keep the national market abreast of new trends in the energy sector. Second-generation ethanol production, for example, allows the use of new biomass, including forest and agricultural residues (sugarcane bagasse), and is an innovation in the sector that could help Brazil maintain its place at the forefront of biofuel production (Nova Cana, 2013). The federal, state, and local governments could create more financial incentives to stimulate the production of new domestic technologies on biofuels that could increase the number of patents in Brazil and decrease production costs. The government could establish a sectoral biofuel fund to invest in R&D in specific programs to increase efficiency in motors fueled by ethanol (first and second generation) and biodiesel, and in programs to foster the deployment of hybrid vehicles, as discussed further below.
Increasing the mandatory blend of biofuel and encouraging 100-percent-biofueled public buses
While taking care that future biofuel production does not cause negative land-use changes, the Ministry of Transport (MT) could increase the level of the mandatory blend of biodiesel to diesel for heavy vehicles and the mandatory blend of anhydrous ethanol to gasoline for light vehicles. Local governments could also encourage urban bus operators to use more biofuel blends. Some cities in Brazil, for example, are already starting to operate with low-carbon-emission public buses. In 2012, Rio de Janeiro City launched the “Sugarcane Diesel Project” to test the addition of 30 percent sugarcane in the blend of diesel (AFCP, 2012). São Paulo City has also invested in a pilot project called “Ecofrota,” to test “B20” public buses (buses fueled by a 20 percent biofuel mix) (AFCP, 2012; SPtrans, 2012).
Besides requesting higher levels of ethanol and biodiesel in the fuel market in Brazil, local gov-ernments could incentivize 100-percent-biofuel (ethanol or biodiesel) public buses. In 2007, São
Paulo City began testing public buses powered by 100-percent ethanol, as part of an international initiative of the Bio Ethanol for Sustainable Trans-port (BEST) project, led by the Brazilian National Reference Center of Biomass (CENBIO) (São Paulo, 2007). In 2009, the local government from Curitiba established, through a private-public partnership (PPP), the “B100 Biodiesel Project” to test public buses operated with “B-100” fuel (100-percent-soy biodiesel), which can lead to 30 percent reductions in GHG emissions. This kind of bus involves higher costs (an increase of 20 to 30 percent) compared to regular fossil-fueled buses, and has been subsidized by the local government, but the environmental benefits include not only GHG emission reduc-tions, but also improved air quality in terms of lower emissions of particulates and sulfur (URBS, 2009; BiodieselBr, 2010). Soybean production is more extensive than sugarcane in terms of land and requires adequate management and prioritization in the uses of biodiesel—the case of urban buses, which have lower fleets (relative to trucks) and run in populated areas. However, the number of such buses in operation is still very modest (SPtrans, 2012), and the need for more incentives is crucial.
Establishing sustainable public procurement that prioritizes biofuels
Public procurement accounts for a large share of a national economy (estimates range between eight percent and 25 percent of GDP) (IPEA, 2010).
Instead of providing fossil-fuel subsidies, it
would be more useful to increase the subsidies to
renewable-energy sources (Goldemberg, 2012).
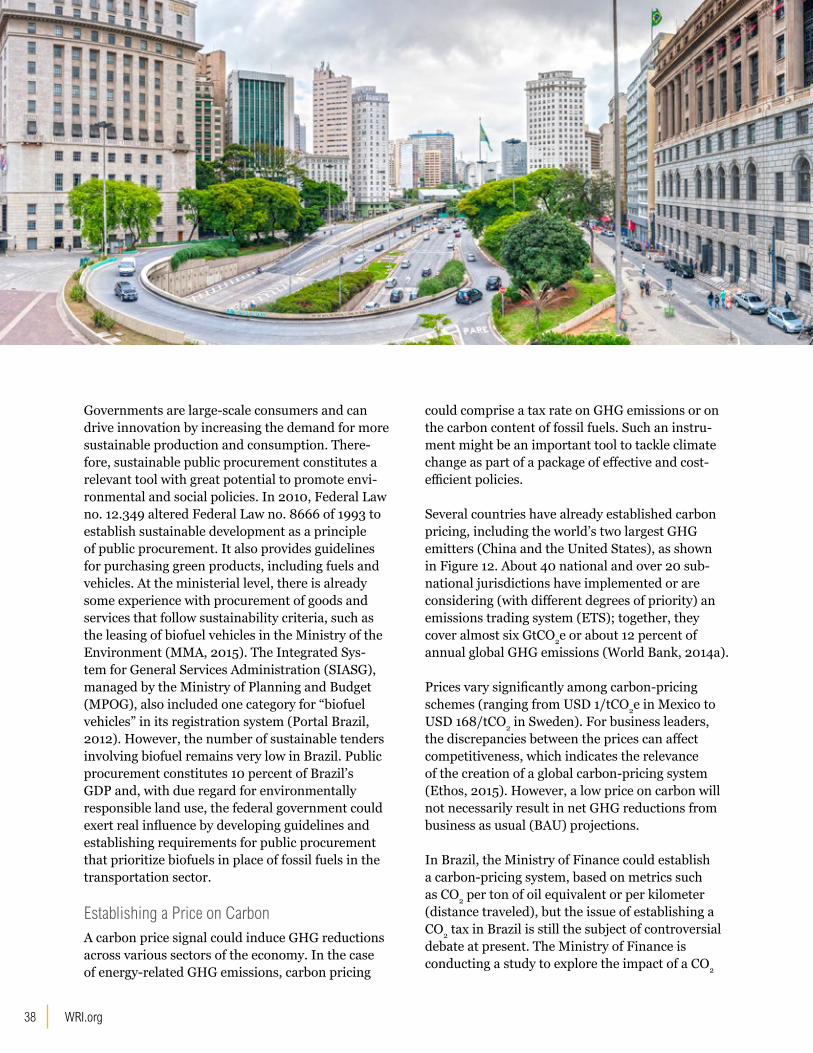
WRI.org 38
Governments are large-scale consumers and can drive innovation by increasing the demand for more sustainable production and consumption. There-fore, sustainable public procurement constitutes a relevant tool with great potential to promote envi-ronmental and social policies. In 2010, Federal Law no. 12.349 altered Federal Law no. 8666 of 1993 to establish sustainable development as a principle of public procurement. It also provides guidelines for purchasing green products, including fuels and vehicles. At the ministerial level, there is already some experience with procurement of goods and services that follow sustainability criteria, such as the leasing of biofuel vehicles in the Ministry of the Environment (MMA, 2015). The Integrated Sys-tem for General Services Administration (SIASG), managed by the Ministry of Planning and Budget (MPOG), also included one category for “biofuel vehicles” in its registration system (Portal Brazil, 2012). However, the number of sustainable tenders involving biofuel remains very low in Brazil. Public procurement constitutes 10 percent of Brazil’s GDP and, with due regard for environmentally responsible land use, the federal government could exert real influence by developing guidelines and establishing requirements for public procurement that prioritize biofuels in place of fossil fuels in the transportation sector.
Establishing a Price on CarbonA carbon price signal could induce GHG reductions across various sectors of the economy. In the case of energy-related GHG emissions, carbon pricing
could comprise a tax rate on GHG emissions or on the carbon content of fossil fuels. Such an instru-ment might be an important tool to tackle climate change as part of a package of effective and cost-efficient policies.
Several countries have already established carbon pricing, including the world’s two largest GHG emitters (China and the United States), as shown in Figure 12. About 40 national and over 20 sub-national jurisdictions have implemented or are considering (with different degrees of priority) an emissions trading system (ETS); together, they cover almost six GtCO2e or about 12 percent of annual global GHG emissions (World Bank, 2014a).
Prices vary significantly among carbon-pricing schemes (ranging from USD 1/tCO2e in Mexico to USD 168/tCO2 in Sweden). For business leaders, the discrepancies between the prices can affect competitiveness, which indicates the relevance of the creation of a global carbon-pricing system (Ethos, 2015). However, a low price on carbon will not necessarily result in net GHG reductions from business as usual (BAU) projections.
In Brazil, the Ministry of Finance could establish a carbon-pricing system, based on metrics such as CO2 per ton of oil equivalent or per kilometer (distance traveled), but the issue of establishing a CO2 tax in Brazil is still the subject of controversial debate at present. The Ministry of Finance is conducting a study to explore the impact of a CO2
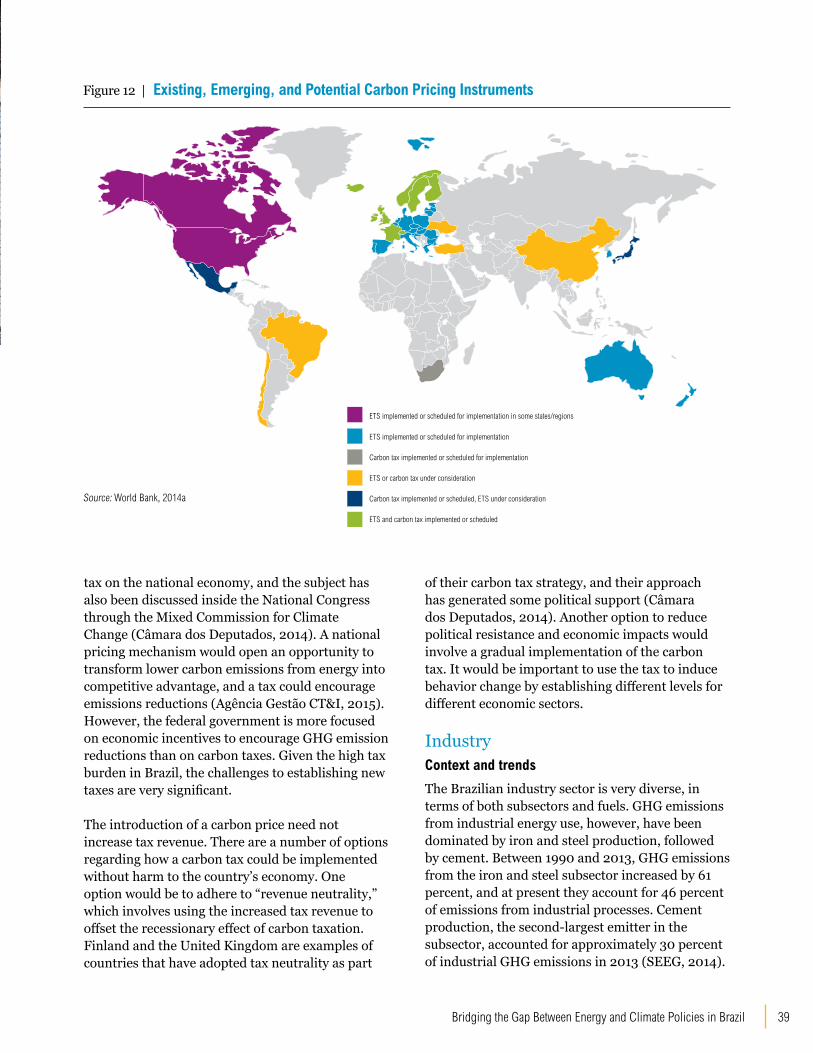
39Bridging the Gap Between Energy and Climate Policies in Brazil
ETS implemented or scheduled for implementation
ETS implemented or scheduled for implementation in some states/regions
Carbon tax implemented or scheduled for implementation
ETS or carbon tax under consideration
Carbon tax implemented or scheduled, ETS under consideration
ETS and carbon tax implemented or scheduled
tax on the national economy, and the subject has also been discussed inside the National Congress through the Mixed Commission for Climate Change (Câmara dos Deputados, 2014). A national pricing mechanism would open an opportunity to transform lower carbon emissions from energy into competitive advantage, and a tax could encourage emissions reductions (Agência Gestão CT&I, 2015). However, the federal government is more focused on economic incentives to encourage GHG emission reductions than on carbon taxes. Given the high tax burden in Brazil, the challenges to establishing new taxes are very significant.
The introduction of a carbon price need not increase tax revenue. There are a number of options regarding how a carbon tax could be implemented without harm to the country’s economy. One option would be to adhere to “revenue neutrality,” which involves using the increased tax revenue to offset the recessionary effect of carbon taxation. Finland and the United Kingdom are examples of countries that have adopted tax neutrality as part
Figure 12 | Existing, Emerging, and Potential Carbon Pricing Instruments
Source: World Bank, 2014a
of their carbon tax strategy, and their approach has generated some political support (Câmara dos Deputados, 2014). Another option to reduce political resistance and economic impacts would involve a gradual implementation of the carbon tax. It would be important to use the tax to induce behavior change by establishing different levels for different economic sectors.
Industry Context and trends
The Brazilian industry sector is very diverse, in terms of both subsectors and fuels. GHG emissions from industrial energy use, however, have been dominated by iron and steel production, followed by cement. Between 1990 and 2013, GHG emissions from the iron and steel subsector increased by 61 percent, and at present they account for 46 percent of emissions from industrial processes. Cement production, the second-largest emitter in the subsector, accounted for approximately 30 percent of industrial GHG emissions in 2013 (SEEG, 2014).
WRI.org 40
Although Brazil’s iron and steel industry is already very efficient, the subsector is expected to be responsible for the greatest share of GHG emis-sions in the industry sector until 2022, and growth in this subsector is expected to lead to considerable increases in the consumption of coal, coal coke, and coke oven gas, with implications for future emis-sions. The majority of Brazilian iron and steel (76 percent in 2012) is produced in blast furnaces/basic oxygen furnaces (IAB, 2013; CNI, 2012). National average energy intensities in 2007-2011 ranged between 20.1 and 20.8 GJ/t steel, while actual best technologies reached 14.8 GJ/t steel, with further potential energy savings of 4.7 GJ/t steel (WSA, 2012; IAB, 2013; Henriques Jr, 2010; Worrel et al., 2008; IEA, 2010).
Cement: Brazilian cement production relies on the relatively efficient dry processing approach. Average energy intensity of production in 2007 was 3.7 GJ/t clinker, which was slightly better than the global average (4.1 GJ/t clinker), but worse than the best available technology (2.85 GJ/t clinker) (Henriques Jr. 2010; IEA 2007). The profile of fuel consump-tion in the cement industry has changed dramati-cally from fuel oil to coal and petroleum coke, which has led to more efficiency in the industry.
Non-ferrous metals: Non-ferrous metals (ferroalloys) include aluminum, zinc, copper, and other metals. This subsector draws primarily on charcoal, firewood, and electricity to meet its growing energy needs. Aluminum is the most electricity-intensive output from this subsector; its electricity intensity can be reduced by up to 95 percent through waste-heat recycling in Brazil (OECO, 2013).
Chemicals: The chemical industry involves a vast array of products and manufacturing processes, from the production of simple substances to the complex petrochemical and fine chemical indus-tries. Its energy mix is also diverse and changing. The most energy-intensive products are ethylene (or ethene), ammonia, methanol, chlorine, sodium hydroxide (or caustic soda), and sulfuric acid. Energy-intensive subsectors are petrochemical,
fertilizer, and chlorine-alkali production, which together are responsible for 70 percent of total energy consumption in the chemicals industry. Some groups (elastomers, resins, plastics, and fine chemicals) make specific products involving higher energy intensity, but these are less relevant given their small share of total energy consumption.
The various scenarios for the Brazilian energy sector presented in Scenario Analysis show that industry is the second largest emitter in the energy sector and therefore must be the second top prior-ity in terms of reducing GHG emissions. One of the main proposals of the McKinsey (2009) scenario for decarbonizing the energy sector in Brazil is to improve industrial efficiency. The reference sce-nario (PNE, 2030) emphasizes the need to phase out the use of fossil fuels in industry by 2030. La Rovere et al. (2013) show that more efficient and cleaner technologies will result in lower emissions from industrial processes. A reduction in SF6 emis-sions and cooling gases as a result of mitigation actions in industrial processes was also assumed as a consequence of redesigned equipment and more advanced techniques in gas collection during maintenance activities.
GHG emissions from industrial
energy use...have been dominated by iron and steel
production, followed by cement.

41Bridging the Gap Between Energy and Climate Policies in Brazil
Greenpeace (2013) states that final industrial energy consumption can be reduced by 22 percent, through the use of solar, biomass, biogas, and bioelectricity, contributing to an overall reduction in final energy demand,4 achieved by more rational use in the buildings, industry, and transport sectors. While the Ten-Year Energy Plan does not break down future projected energy use by subsector, it is possible to estimate this information based on certain subsectoral characteristics (like dedicated use of certain fuels) and a few simplified assumptions (like constant shares of each subsector over time).5 Industry in Brazil encompasses a wide variety of subsectors fueled by diverse energy sources, as shown in Figure 13. Together, they contribute approximately one quarter of Brazil’s Gross Domestic Product (World Bank, 2014b).
1970
1972
1974
1976
1978
1980
1982
1984
1986
1988
1990
1992
1994
1996
1998
2000
2002
2004
2006
2008
2010
2012
2014
2016
2018
2020
2022
0
20000
40000
60000
80000
100000
120000
140000
ktoe
Other Petroleum Secondaries
Charcoal
Electricity
Coal Coke
Fuel OilOther Primary Sources
Sugar Cane Bagasse
Firewood
Steam Coal
Natural Gas
Projections
Figure 13 | Evolution of the Brazilian Industry Sector: Subsectors by Fuel Source (process emissions not included)
Source: Authors’ elaboration, from MME 2013, EPE 2014, MCT 2010.
GHG emissions from industry, however, as already mentioned, are concentrated in the iron and steel, cement, and chemicals subsectors (Figure 14). Current policies
In 2013, the Ministry of Development, Industry, and Foreign Commerce (MDIC) published a Sectoral Plan on Climate Change Mitigation and Adaptation for the Consolidation of a Low-Carbon Economy in the Manufacturing Industry-Industry Plan, (MDIC, 2013) as mandated under Decree 7.390 (Brazil, 2010), regulating the Climate Law. The plan covers aluminum, cement, pulp and paper, and chemicals during its first phase, after which iron and steel, lime, and glass are expected to be considered (a separate plan for the steel sector is under development).
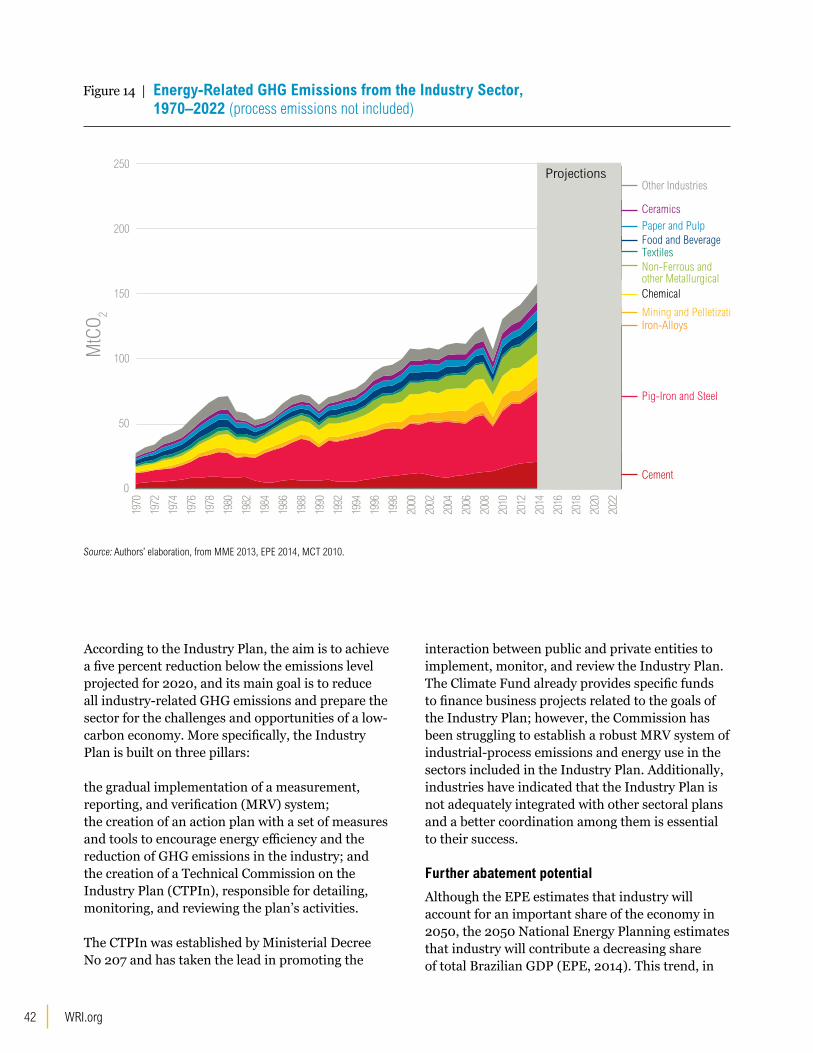
WRI.org 42
Figure 14 | Energy-Related GHG Emissions from the Industry Sector, 1970–2022 (process emissions not included)
Source: Authors’ elaboration, from MME 2013, EPE 2014, MCT 2010.
According to the Industry Plan, the aim is to achieve a five percent reduction below the emissions level projected for 2020, and its main goal is to reduce all industry-related GHG emissions and prepare the sector for the challenges and opportunities of a low-carbon economy. More specifically, the Industry Plan is built on three pillars:
the gradual implementation of a measurement, reporting, and verification (MRV) system;the creation of an action plan with a set of measures and tools to encourage energy efficiency and the reduction of GHG emissions in the industry; andthe creation of a Technical Commission on the Industry Plan (CTPIn), responsible for detailing, monitoring, and reviewing the plan’s activities.
The CTPIn was established by Ministerial Decree No 207 and has taken the lead in promoting the
interaction between public and private entities to implement, monitor, and review the Industry Plan. The Climate Fund already provides specific funds to finance business projects related to the goals of the Industry Plan; however, the Commission has been struggling to establish a robust MRV system of industrial-process emissions and energy use in the sectors included in the Industry Plan. Additionally, industries have indicated that the Industry Plan is not adequately integrated with other sectoral plans and a better coordination among them is essential to their success.
Further abatement potential
Although the EPE estimates that industry will account for an important share of the economy in 2050, the 2050 National Energy Planning estimates that industry will contribute a decreasing share of total Brazilian GDP (EPE, 2014). This trend, in
0
50
100
150
200
250
1970
1972
1974
1976
1978
1980
1982
1984
1986
1988
1990
1992
1994
1996
1998
2000
2002
2004
2006
2008
2010
2012
2014
2016
2018
2020
2022
Emissions from Industries
Other Industries
CeramicsPaper and PulpFood and BeverageTextilesNon-Ferrous and other Metallurgical Chemical
Mining and PelletizationIron-Alloys
Pig-Iron and Steel
Cement
MtC
O 2
Projections
43Bridging the Gap Between Energy and Climate Policies in Brazil
turn, might reduce the relative share of industry’s energy consumption over the long term, and consequently its relative contribution to total GHG emissions.
The scenarios analyzed in Annex 1 suggest that a gradual increase in the energy efficiency of materi-als used in infrastructure, especially in the con-struction of industrial facilities, is a key opportunity for further emissions reduction. The expansion of more efficient power plants and the decommis-sioning of inefficient plants could also reduce the projected acceleration of energy demand out to 2050. The PNE 2050 estimates that overall energy efficiency across all industry sectors can contribute to reducing energy consumption by approximately 20 percent by 2050 (EPE, 2014). The various scenarios analyzed in Annex 1 also indicate that a combination of energy efficiency and the use of low-carbon technologies (such as solar, wind, carbon capture and storage etc.) can result in GHG abate-ment of approximately 20–43 percent in 2030, relative to reference cases.
Increasing incentives for low-carbon fuels, which effectively can cause a drop in GHG emissions, is one option but these fuels often require adequate technologies, supply logistics, and dependability. The policies listed below could advance abatement in the industry sector.
Establishing a Mandatory and Bottom-Up MRV System in BrazilThe Technical Commission on the Industry Plan (CTPIn) has established a Working Group on Inventories (WG inventories) to set parameters for reporting GHG emissions from industrial sectors. The Ministry of the Environment, under the Federal Joint Center for the Climate, also created, in 2013, a Working Group on GHG Registry (Registry WG) that aims to propose recommendations for an MRV System and a mandatory bottom-up GHG Registry. The Registry WG convenes stakeholders from the various levels of government, academia, and civil society, and intends to assist Brazilian states and the federal government to create and/or harmonize GHG Registries and to set them on an implementa-tion path based on robust and effective interna-tional best practices. However, the Inter-Ministerial Commission on Climate Change (CIM) has not yet analyzed the recommendations provided, in 2013,
by the Working Group on GHG Registry for the creation of a MRV System in Brazil; it could there-fore review and approve the document as a first step toward establishing such a system in Brazil.
Implementing the Brazilian Market for Emissions Reduction (MBRE)One of the aims of the 2009 National Policy on Climate Change (PNMC) is to encourage the development of the Brazilian Market for Emissions Reduction (MBRE). According to the PNMC, the MBRE will be operationalized in stock exchanges authorized by the Brazilian Securities and Exchange Commission (CVM) to trade GHG emission-reduction certificates. This market could serve as an important tool to reduce GHG emissions in Brazil. In 2011, the Working Group on Carbon Markets, coordinated by the Ministry of Finance (MF) and comprising representatives from various min-istries, was established by the Inter-Ministerial Commission on Climate Change (CIM). Its goal was to analyze the feasibility and requirements for the implementation of the MBRE and support
Increasing incentives for low-carbon fuels, which effectively can cause a drop in GHG
emissions, is one option but these fuels
often require adequate technologies, supply
logistics, and dependability.
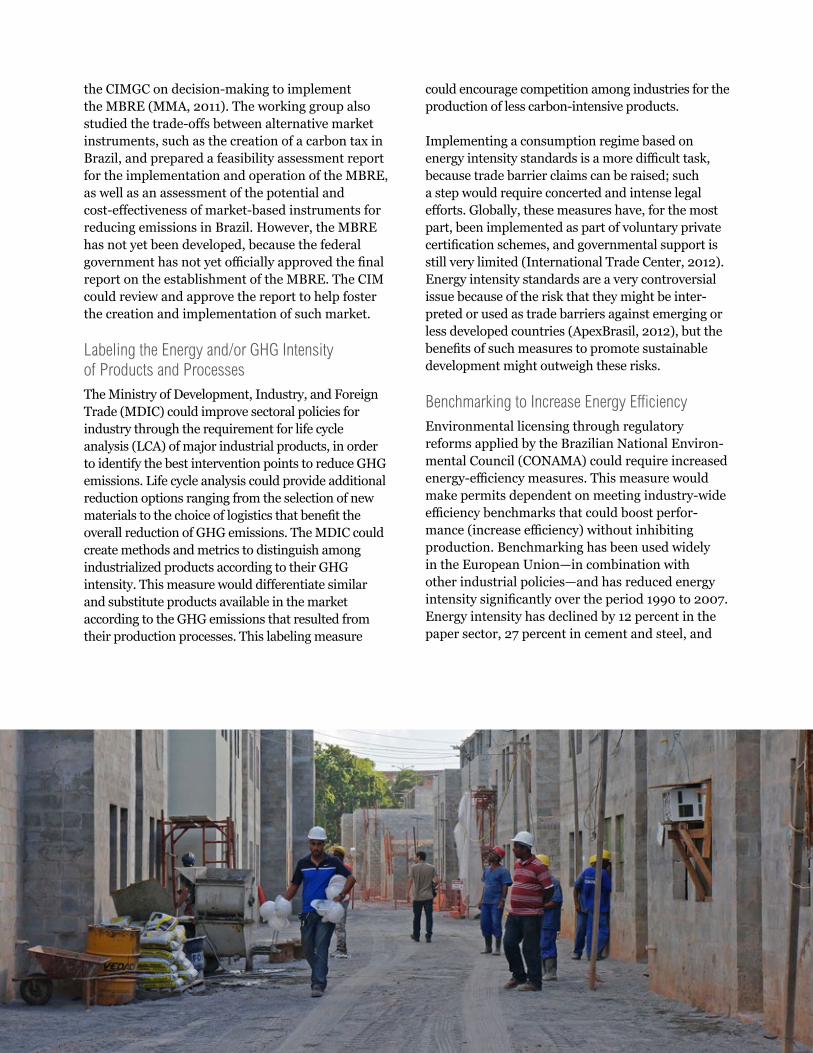
WRI.org 44
the CIMGC on decision-making to implement the MBRE (MMA, 2011). The working group also studied the trade-offs between alternative market instruments, such as the creation of a carbon tax in Brazil, and prepared a feasibility assessment report for the implementation and operation of the MBRE, as well as an assessment of the potential and cost-effectiveness of market-based instruments for reducing emissions in Brazil. However, the MBRE has not yet been developed, because the federal government has not yet officially approved the final report on the establishment of the MBRE. The CIM could review and approve the report to help foster the creation and implementation of such market.
Labeling the Energy and/or GHG Intensity of Products and Processes The Ministry of Development, Industry, and Foreign Trade (MDIC) could improve sectoral policies for industry through the requirement for life cycle analysis (LCA) of major industrial products, in order to identify the best intervention points to reduce GHG emissions. Life cycle analysis could provide additional reduction options ranging from the selection of new materials to the choice of logistics that benefit the overall reduction of GHG emissions. The MDIC could create methods and metrics to distinguish among industrialized products according to their GHG intensity. This measure would differentiate similar and substitute products available in the market according to the GHG emissions that resulted from their production processes. This labeling measure
could encourage competition among industries for the production of less carbon-intensive products.
Implementing a consumption regime based on energy intensity standards is a more difficult task, because trade barrier claims can be raised; such a step would require concerted and intense legal efforts. Globally, these measures have, for the most part, been implemented as part of voluntary private certification schemes, and governmental support is still very limited (International Trade Center, 2012). Energy intensity standards are a very controversial issue because of the risk that they might be inter-preted or used as trade barriers against emerging or less developed countries (ApexBrasil, 2012), but the benefits of such measures to promote sustainable development might outweigh these risks.
Benchmarking to Increase Energy Efficiency Environmental licensing through regulatory reforms applied by the Brazilian National Environ-mental Council (CONAMA) could require increased energy-efficiency measures. This measure would make permits dependent on meeting industry-wide efficiency benchmarks that could boost perfor-mance (increase efficiency) without inhibiting production. Benchmarking has been used widely in the European Union—in combination with other industrial policies—and has reduced energy intensity significantly over the period 1990 to 2007. Energy intensity has declined by 12 percent in the paper sector, 27 percent in cement and steel, and
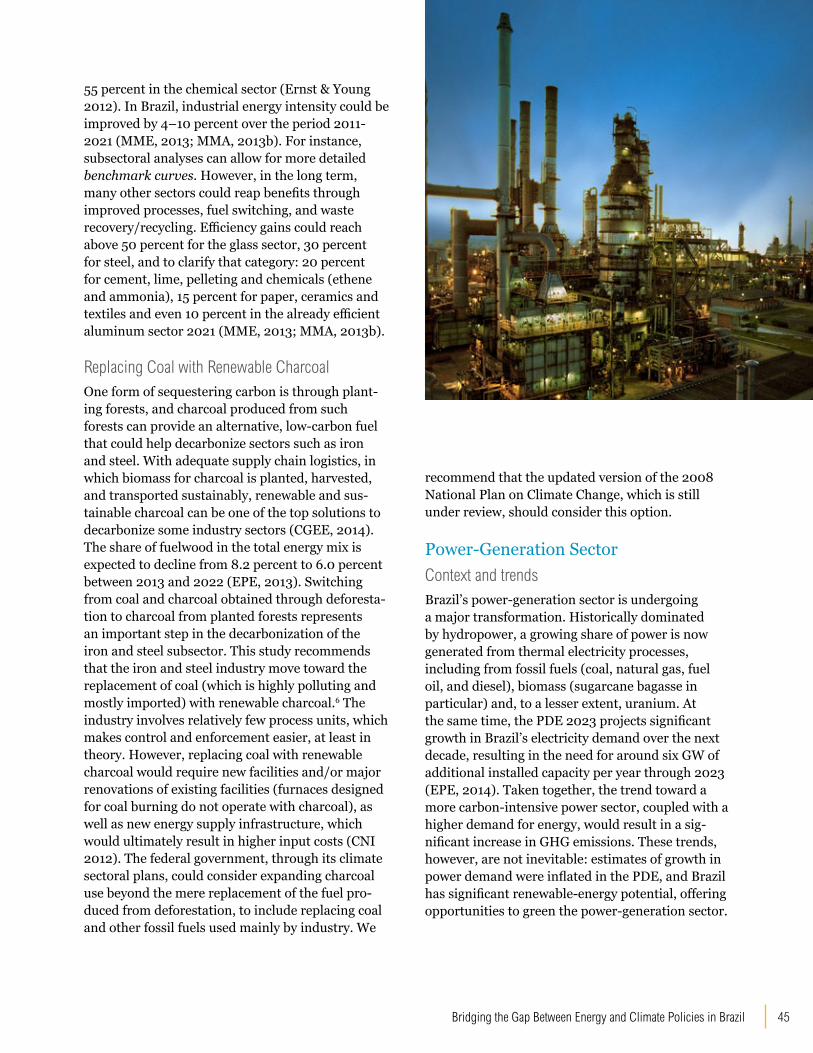
45Bridging the Gap Between Energy and Climate Policies in Brazil
55 percent in the chemical sector (Ernst & Young 2012). In Brazil, industrial energy intensity could be improved by 4–10 percent over the period 2011-2021 (MME, 2013; MMA, 2013b). For instance, subsectoral analyses can allow for more detailed benchmark curves. However, in the long term, many other sectors could reap benefits through improved processes, fuel switching, and waste recovery/recycling. Efficiency gains could reach above 50 percent for the glass sector, 30 percent for steel, and to clarify that category: 20 percent for cement, lime, pelleting and chemicals (ethene and ammonia), 15 percent for paper, ceramics and textiles and even 10 percent in the already efficient aluminum sector 2021 (MME, 2013; MMA, 2013b).
Replacing Coal with Renewable Charcoal One form of sequestering carbon is through plant-ing forests, and charcoal produced from such forests can provide an alternative, low-carbon fuel that could help decarbonize sectors such as iron and steel. With adequate supply chain logistics, in which biomass for charcoal is planted, harvested, and transported sustainably, renewable and sus-tainable charcoal can be one of the top solutions to decarbonize some industry sectors (CGEE, 2014). The share of fuelwood in the total energy mix is expected to decline from 8.2 percent to 6.0 percent between 2013 and 2022 (EPE, 2013). Switching from coal and charcoal obtained through deforesta-tion to charcoal from planted forests represents an important step in the decarbonization of the iron and steel subsector. This study recommends that the iron and steel industry move toward the replacement of coal (which is highly polluting and mostly imported) with renewable charcoal.6 The industry involves relatively few process units, which makes control and enforcement easier, at least in theory. However, replacing coal with renewable charcoal would require new facilities and/or major renovations of existing facilities (furnaces designed for coal burning do not operate with charcoal), as well as new energy supply infrastructure, which would ultimately result in higher input costs (CNI 2012). The federal government, through its climate sectoral plans, could consider expanding charcoal use beyond the mere replacement of the fuel pro-duced from deforestation, to include replacing coal and other fossil fuels used mainly by industry. We
recommend that the updated version of the 2008 National Plan on Climate Change, which is still under review, should consider this option.
Power-Generation Sector Context and trendsBrazil’s power-generation sector is undergoing a major transformation. Historically dominated by hydropower, a growing share of power is now generated from thermal electricity processes, including from fossil fuels (coal, natural gas, fuel oil, and diesel), biomass (sugarcane bagasse in particular) and, to a lesser extent, uranium. At the same time, the PDE 2023 projects significant growth in Brazil’s electricity demand over the next decade, resulting in the need for around six GW of additional installed capacity per year through 2023 (EPE, 2014). Taken together, the trend toward a more carbon-intensive power sector, coupled with a higher demand for energy, would result in a sig-nificant increase in GHG emissions. These trends, however, are not inevitable: estimates of growth in power demand were inflated in the PDE, and Brazil has significant renewable-energy potential, offering opportunities to green the power-generation sector.
WRI.org 46
The scenarios reviewed above identify opportunities for both supply- and demand-side GHG reductions in the power sector. McKinsey (2009) considers the power sector only peripherally, but nonetheless identifies opportunities for 11 percent (190 MtCO2) potential emissions reductions in the power sector relative to official plans for 2030 (PNE2030). De Gouvello et al. (2011) examine supply-side mitiga-tion options (wind and biomass cogeneration, fuel replacement by biomass/ethanol, and oil refining and gas-to-liquids), as well as demand-side options (such as energy efficiency in electricity consumption and reductions from industrial use of fossil fuels).7 The abatement potential for the power sector is estimated at 11.7 Gt CO2e (between 2010 and 2030) or an average of 560 MtCO2e annually. Greenpeace (2013) indicates that the necessary GHG emis-sion reductions will be possible if thermal-power plants running on fossil fuels are replaced by non-fossil-fuel powered plants as the energy supply is expanded. IEA’s Energy Technology Perspectives (ETP) suggest that, to achieve the 2°C pathway, key mitigation strategies in the power sector include decarbonization through investments in low-carbon technologies such as wind and solar, energy effi-ciency, and carbon capture and storage (CCS).
Policy options and implications for the technologies discussed in these various scenarios—including hydropower and interconnected renewables (for example, wind complementing hydropower)—are discussed below.
Increasing the Share of Wind and Solar in the Electricity Mix Investing in modern renewable energy sources (especially wind and solar) can enhance energy security, reduce GHG emissions, and create more jobs in Brazil (Pao and Fu, 2013). However, despite signals in the latest auctions that wind can compete with fossil sources and win (Fidelis da Silva et al., 2012), these energy sources have received limited support in Brazil. Although the Terms of Refer-ence for the upcoming National Energy Plan (PNE 2050), elaborated by the Governmental Energy Research Company (EPE), indicate the relevance of investing in modern renewable energies such as wind and solar, the plan contrarily estimates a rela-tive increase in energy supply from thermal power plants fueled by natural gas and coal.
With regard to solar energy, as of 2015, photo-voltaic solar energy contributes only 15 MW of installed capacity in Brazil (ANEEL, 2015). The high cost of solar energy per MWh is one of the greatest obstacles to the widespread use of solar PV in Brazil. The cost of solar PV energy was estimated at R$ 280.00 to R$ 300.00/MWh in 2013 (Scalambrini, 2013). Other key challenges are related to the intermittency of renewable energy sources in Brazil (EPE, 2012; OESP, 2013; Oak and Sauer, 2012), and the lack of adequate incentives in Brazilian energy policy to disseminate the use of solar power. The Ten Year Energy Plan 2013–2022, for example, forecasts the generation of only 1,400 MW of distributed generation via solar PV by 2022 (PDE, 2014). However, the opportunity to invest in photovoltaic solar energy in Brazil is significant, not only because of the high incidence of solar radia-tion, but also because of the increasing efficiency
Investing in modern renewable energy sources
(especially wind and solar) can enhance energy
security, reduce GHG emissions, and create
more jobs in Brazil (Pao and Fu, 2013). However,
despite signals in the latest auctions that wind can
compete with fossil sources and win (Fidelis da Silva
et al., 2012), these energy sources have received
limited support in Brazil.
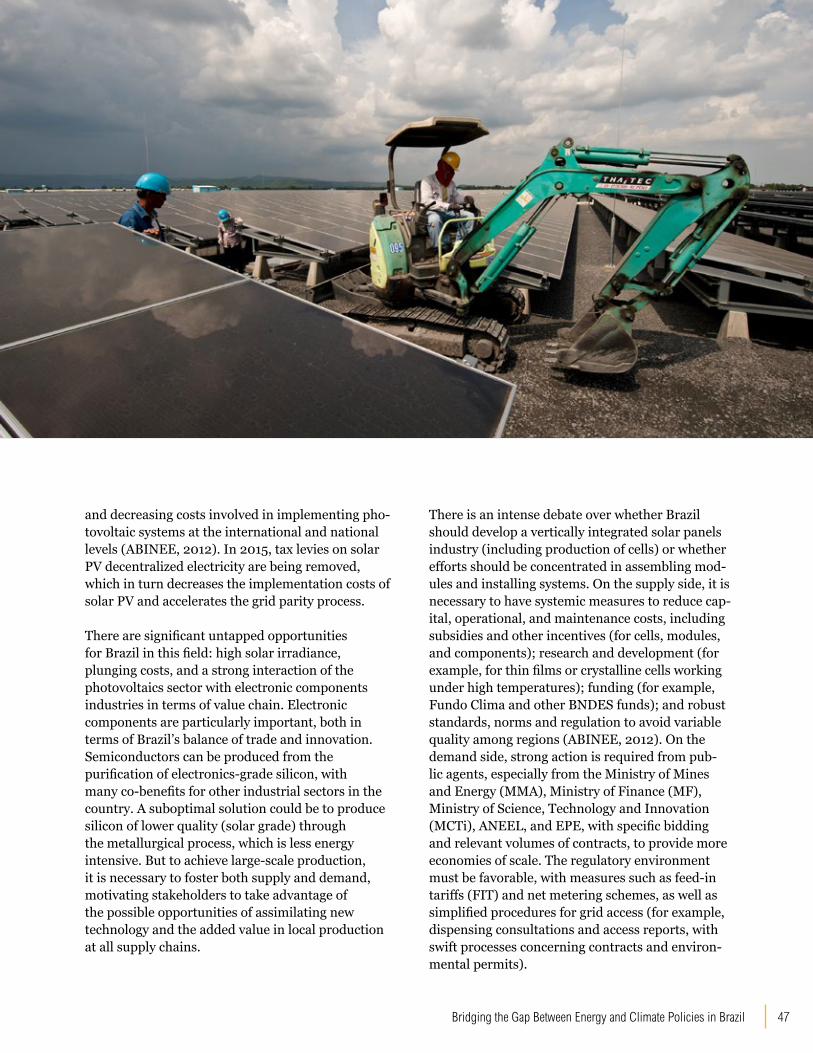
47Bridging the Gap Between Energy and Climate Policies in Brazil
and decreasing costs involved in implementing pho-tovoltaic systems at the international and national levels (ABINEE, 2012). In 2015, tax levies on solar PV decentralized electricity are being removed, which in turn decreases the implementation costs of solar PV and accelerates the grid parity process.
There are significant untapped opportunities for Brazil in this field: high solar irradiance, plunging costs, and a strong interaction of the photovoltaics sector with electronic components industries in terms of value chain. Electronic components are particularly important, both in terms of Brazil’s balance of trade and innovation. Semiconductors can be produced from the purification of electronics-grade silicon, with many co-benefits for other industrial sectors in the country. A suboptimal solution could be to produce silicon of lower quality (solar grade) through the metallurgical process, which is less energy intensive. But to achieve large-scale production, it is necessary to foster both supply and demand, motivating stakeholders to take advantage of the possible opportunities of assimilating new technology and the added value in local production at all supply chains.
There is an intense debate over whether Brazil should develop a vertically integrated solar panels industry (including production of cells) or whether efforts should be concentrated in assembling mod-ules and installing systems. On the supply side, it is necessary to have systemic measures to reduce cap-ital, operational, and maintenance costs, including subsidies and other incentives (for cells, modules, and components); research and development (for example, for thin films or crystalline cells working under high temperatures); funding (for example, Fundo Clima and other BNDES funds); and robust standards, norms and regulation to avoid variable quality among regions (ABINEE, 2012). On the demand side, strong action is required from pub-lic agents, especially from the Ministry of Mines and Energy (MMA), Ministry of Finance (MF), Ministry of Science, Technology and Innovation (MCTi), ANEEL, and EPE, with specific bidding and relevant volumes of contracts, to provide more economies of scale. The regulatory environment must be favorable, with measures such as feed-in tariffs (FIT) and net metering schemes, as well as simplified procedures for grid access (for example, dispensing consultations and access reports, with swift processes concerning contracts and environ-mental permits).
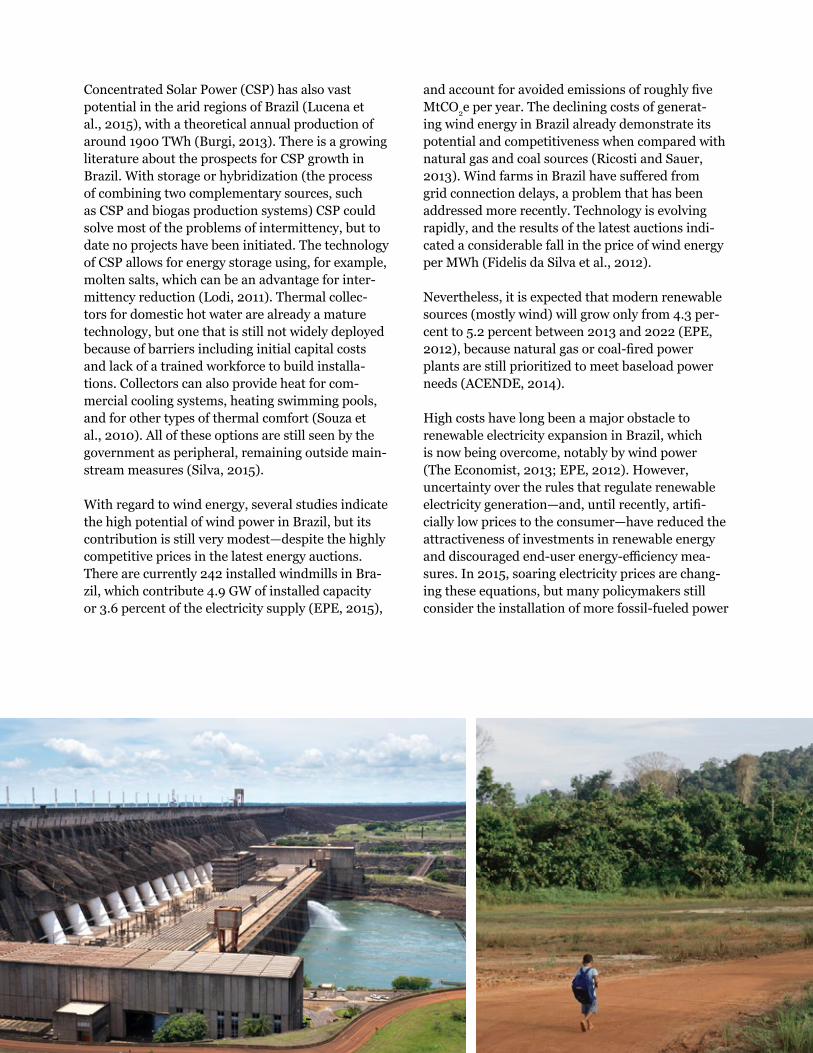
WRI.org 48
Concentrated Solar Power (CSP) has also vast potential in the arid regions of Brazil (Lucena et al., 2015), with a theoretical annual production of around 1900 TWh (Burgi, 2013). There is a growing literature about the prospects for CSP growth in Brazil. With storage or hybridization (the process of combining two complementary sources, such as CSP and biogas production systems) CSP could solve most of the problems of intermittency, but to date no projects have been initiated. The technology of CSP allows for energy storage using, for example, molten salts, which can be an advantage for inter-mittency reduction (Lodi, 2011). Thermal collec-tors for domestic hot water are already a mature technology, but one that is still not widely deployed because of barriers including initial capital costs and lack of a trained workforce to build installa-tions. Collectors can also provide heat for com-mercial cooling systems, heating swimming pools, and for other types of thermal comfort (Souza et al., 2010). All of these options are still seen by the government as peripheral, remaining outside main-stream measures (Silva, 2015).
With regard to wind energy, several studies indicate the high potential of wind power in Brazil, but its contribution is still very modest—despite the highly competitive prices in the latest energy auctions. There are currently 242 installed windmills in Bra-zil, which contribute 4.9 GW of installed capacity or 3.6 percent of the electricity supply (EPE, 2015),
and account for avoided emissions of roughly five MtCO2e per year. The declining costs of generat-ing wind energy in Brazil already demonstrate its potential and competitiveness when compared with natural gas and coal sources (Ricosti and Sauer, 2013). Wind farms in Brazil have suffered from grid connection delays, a problem that has been addressed more recently. Technology is evolving rapidly, and the results of the latest auctions indi-cated a considerable fall in the price of wind energy per MWh (Fidelis da Silva et al., 2012).
Nevertheless, it is expected that modern renewable sources (mostly wind) will grow only from 4.3 per-cent to 5.2 percent between 2013 and 2022 (EPE, 2012), because natural gas or coal-fired power plants are still prioritized to meet baseload power needs (ACENDE, 2014).
High costs have long been a major obstacle to renewable electricity expansion in Brazil, which is now being overcome, notably by wind power (The Economist, 2013; EPE, 2012). However, uncertainty over the rules that regulate renewable electricity generation—and, until recently, artifi-cially low prices to the consumer—have reduced the attractiveness of investments in renewable energy and discouraged end-user energy-efficiency mea-sures. In 2015, soaring electricity prices are chang-ing these equations, but many policymakers still consider the installation of more fossil-fueled power
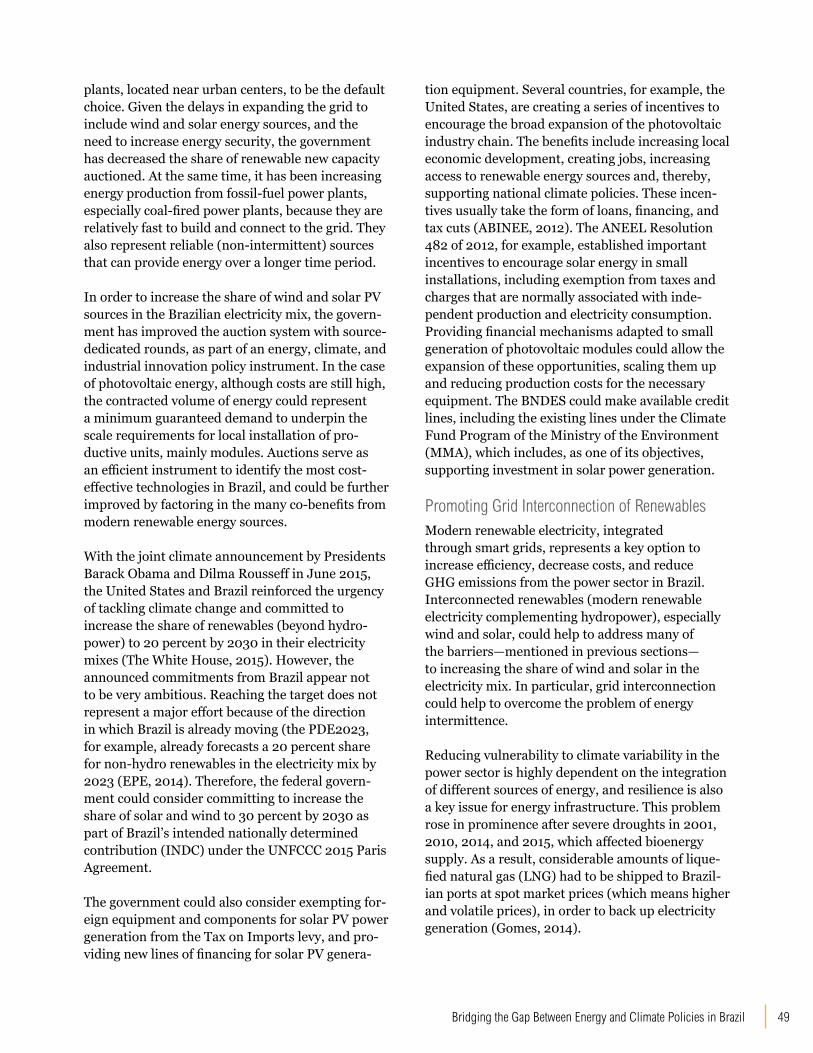
49Bridging the Gap Between Energy and Climate Policies in Brazil
plants, located near urban centers, to be the default choice. Given the delays in expanding the grid to include wind and solar energy sources, and the need to increase energy security, the government has decreased the share of renewable new capacity auctioned. At the same time, it has been increasing energy production from fossil-fuel power plants, especially coal-fired power plants, because they are relatively fast to build and connect to the grid. They also represent reliable (non-intermittent) sources that can provide energy over a longer time period.
In order to increase the share of wind and solar PV sources in the Brazilian electricity mix, the govern-ment has improved the auction system with source-dedicated rounds, as part of an energy, climate, and industrial innovation policy instrument. In the case of photovoltaic energy, although costs are still high, the contracted volume of energy could represent a minimum guaranteed demand to underpin the scale requirements for local installation of pro-ductive units, mainly modules. Auctions serve as an efficient instrument to identify the most cost-effective technologies in Brazil, and could be further improved by factoring in the many co-benefits from modern renewable energy sources.
With the joint climate announcement by Presidents Barack Obama and Dilma Rousseff in June 2015, the United States and Brazil reinforced the urgency of tackling climate change and committed to increase the share of renewables (beyond hydro-power) to 20 percent by 2030 in their electricity mixes (The White House, 2015). However, the announced commitments from Brazil appear not to be very ambitious. Reaching the target does not represent a major effort because of the direction in which Brazil is already moving (the PDE2023, for example, already forecasts a 20 percent share for non-hydro renewables in the electricity mix by 2023 (EPE, 2014). Therefore, the federal govern-ment could consider committing to increase the share of solar and wind to 30 percent by 2030 as part of Brazil’s intended nationally determined contribution (INDC) under the UNFCCC 2015 Paris Agreement.
The government could also consider exempting for-eign equipment and components for solar PV power generation from the Tax on Imports levy, and pro-viding new lines of financing for solar PV genera-
tion equipment. Several countries, for example, the United States, are creating a series of incentives to encourage the broad expansion of the photovoltaic industry chain. The benefits include increasing local economic development, creating jobs, increasing access to renewable energy sources and, thereby, supporting national climate policies. These incen-tives usually take the form of loans, financing, and tax cuts (ABINEE, 2012). The ANEEL Resolution 482 of 2012, for example, established important incentives to encourage solar energy in small installations, including exemption from taxes and charges that are normally associated with inde-pendent production and electricity consumption. Providing financial mechanisms adapted to small generation of photovoltaic modules could allow the expansion of these opportunities, scaling them up and reducing production costs for the necessary equipment. The BNDES could make available credit lines, including the existing lines under the Climate Fund Program of the Ministry of the Environment (MMA), which includes, as one of its objectives, supporting investment in solar power generation.
Promoting Grid Interconnection of RenewablesModern renewable electricity, integrated through smart grids, represents a key option to increase efficiency, decrease costs, and reduce GHG emissions from the power sector in Brazil. Interconnected renewables (modern renewable electricity complementing hydropower), especially wind and solar, could help to address many of the barriers—mentioned in previous sections— to increasing the share of wind and solar in the electricity mix. In particular, grid interconnection could help to overcome the problem of energy intermittence.
Reducing vulnerability to climate variability in the power sector is highly dependent on the integration of different sources of energy, and resilience is also a key issue for energy infrastructure. This problem rose in prominence after severe droughts in 2001, 2010, 2014, and 2015, which affected bioenergy supply. As a result, considerable amounts of lique-fied natural gas (LNG) had to be shipped to Brazil-ian ports at spot market prices (which means higher and volatile prices), in order to back up electricity generation (Gomes, 2014).
WRI.org 50
New opportunities have been created with smaller and integrated power plant stations systems, such as plants based on small streams and small waterfalls, the reuse of biomass residues, and offshore wind farms (Soito and Freitas, 2011). While relying only on intermittent renewable energy sources, such as wind and solar, might not guarantee energy supply over the year, they could be used as a complementary power source or backup system. A wind-hydro hybrid scheme, for example, is a reasonable option that could be further explored in Brazil, because wind power potential in Brazil is comparable in scale to hydropower, and because Brazil has strong winds throughout the year, in contrast to the seasonal nature of water flow (Pau and Fu, 2013; Pimenta and Assireu, 2015). Wind power in the Northeast coast, for example, could complement hydropower supply during the dry season in that region (Alvim et al., 2005; Riscosti and Sauer, 2013).
As integration among sources is improved, hydropower dispatch can be shifted from baseload to peak shaving, and intermittent sources become more stable as contributions to the grid from different regions smooth out variabilities. Smart grids and net metering8 can take this situation to another level, where data systems can also forecast variabilities more efficiently and in a more resilient way. A first measure to achieve this is to break out from the conventional generation-transmission-distribution schemes by means of regulations that reduce bureaucracy and administrative barriers to decentralized electricity generation.
A key policy recommendation to increase the share of wind and solar in the electricity mix and to promote grid interconnection of renewables is that the federal government should remove harmful incentives for fossil fuels, leveling the playing field so that alternative energy solutions can compete in a free market. The federal government could also encourage more investments in infrastructure for energy distribution and technological development aimed at local competitiveness, by creating more incentives to reduce production costs, and promoting deployment of manufacturing equipment in Brazil. These actions could increase the installed capacity of such sources and reduce production costs. Through better regulation and fair pricing (following the principle of the affordability tariff as defined by ANEEL, where even low-income consumers have the ability to access electricity and pay for it), wind and solar energy sources could be boosted to levels consistent with long-term low-carbon pathways. Such policy options could offer important prospects for better energy integration and use of smart grids, with several co-benefits like job creation and improved environmental health. It would be important to provide more long-term loans for investments in wind and solar, and improve infrastructure to expand the grid with wind farms, as well as prioritize clean energy sources in energy auctions held by the Brazilian Chamber of Electric Energy Commercialization.
Promoting Grid Integration with Neighboring CountriesEnergy integration is emerging as a highly relevant strategy to improve energy security in neighboring countries, mostly because of the benefits related
A key policy recommendation to increase the share of wind and solar in the electricity mix and to promote grid interconnection of renewables is that the federal government should remove harmful incentives for fossil fuels, leveling the playing field so that alternative energy solutions can compete in a free market.
51Bridging the Gap Between Energy and Climate Policies in Brazil
to economic complementarity among different countries. Grid integration also has the potential to reduce energy costs and diversify the energy mix (Carta Capital, 2015). Countries with a high exportable surplus of energy resources (such as Venezuela, Bolivia, Paraguay, and Peru) share borders with others that need to import energy to meet domestic demand (such as Argentina, Brazil, Chile, and Uruguay).
Cross-border integration of the energy generation system can reduce the risk of failing to meet energy demands in a specific country, and a regional power grid offers the possibility of improved management of seasonality, intermittency, and complementarity of different renewable power sources, thus expanding their potential. In the case of Brazil, energy integration between the country and bordering countries is an option that can provide many joint benefits, in particular, increased reliability and security of supply of complementary national hydropower systems (EPE, 2014).
Brazil’s larger borders with neighboring countries include: Argentina 1,263 km, Bolivia 3,403 km, Colombia 1,790 km, Guyana 1,308 km, Paraguay 1,371 km, Peru 2,659 km, Uruguay 1,050 km, and Venezuela 2,137 km. In addition to the Binational Itaipu Hydropower that encompasses Brazil and Paraguay, there are currently interconnections between Brazil and Argentina, Uruguay, and Ven-ezuela (EPE, 2014). There are also some planning studies for the expansion of such joint investments, following the example of projects with Peru, Bolivia, and Guyana. These joint projects have been estab-lished predominantly to generate renewable and low-cost energy, for example, through construction of hydroelectric dams.
However, as of 2014, only 25 percent of the potential joint hydropower between Brazil and neighboring countries had been explored (EPE, 2014). The construction of hydropower plants in trans-boundary areas, such as the hydropower plant in the Madeira River, is very challenging and requires monitoring stations and mechanisms for sharing hydrological data (Soito and Freitas, 2011).
Building national hydropower plants is complicated enough and, while reaching an agreement between two countries might be even more challenging,
it could still be a reasonable way to increase the sustainable use of cross-border natural resources (IPS, 2012). Because the national grid is highly dependent on short- and medium-term water availability to generate energy, the need to guarantee that energy supply will meet demand is a critical issue, and it becomes imperative to take advantage of opportunities for regional integration (Soito and Freitas, 2011).
Besides hydropower plants, Brazil and Uruguay launched, in February 2015, a wind farm in Uruguay with generation capacity of 61.5 MW (the Artillero’s Park). Development of the wind project was originated in the “Agreement for Evaluation and Joint Development of wind farms for Power Generation Installed in the Eastern Republic of Uruguay,” signed in 2012 by Brazil and Uruguay. The project is part of a cooperation agreement between the Brazilian and Uruguayan Electric Utility Companies (Eletrobras and UTE) for the construction of up to 300 MW of wind power in Uruguayan territory (Brazil, 2015a). This is the first commercial investment by Eletrobras outside Brazil, and it constitutes part of the recognition that energy integration is needed to ensure a South American grid with better quality and cheaper electricity (Brazil, 2015b). Additionally, the power grid of Brazil could benefit, and be of benefit, in a regional approach that seeks to lower the combined carbon footprint of power generation. The movement toward integration of regional economies, while usually argued in plain financial terms, could also result in substantial carbon benefits.
The federal government could recognize the rel-evance of regional energy integration, and the possibility of expanding such interconnections, or establishing new interconnection grids, could be the subject of new international agreements between the Brazilian government and other relevant countries.
The government could also incentivize energy integration with neighboring countries through bilateral treaties focused on the shared use of water resources, for example, where the energy generated would be divided equally among the corresponding countries. As a preliminary step, it could be relevant to create more incentives for the elaboration of joint

WRI.org 52
hydropower project inventories and assessments of trans-boundary areas, as well as to enhance understanding of the hydro potential in neighboring countries, and identify joint opportunities for the implementations of new hydropower plants.
To reproduce bilateral agreements like the Binational Itaipu with Paraguay, a supranational legal regime is required. A supranational legal framework—such as the one provided in the European Energy Charter on energy efficiency and related environmental aspects (EUR-LEX, 1997) that has been decisive for energy integration in Europe—would provide assurance to binational and multinational initiatives, as well as to institutional investors engaging in long-term return endeavors in South America.
Increasing Energy Efficiency Requirements for Electrification and BuildingsIn view of the current national energy landscape, increasing energy efficiency requirements for elec-trification is an evident need (Pereira, Lambert, and Ghisi, 2013). Increasing energy efficiency could save consumers money, reduce the likelihood of future energy shortages, and reduce energy consumption and GHG emissions.
Energy efficiency actions can be turned into kilowatt hours saved on the energy bill and hence into bottom-line savings, but this cannot be realized without good measurement.
While mandatory efficiency standards have a role to play on the supply side, on the demand side, mechanisms such as rebates and feebates could create powerful incentives to drive the selection of more efficient equipment, including replacement of electric showers by solar systems. There are several opportunities for more vigorous action on energy efficiency on the demand side, including stronger product standards, and improved access to efficient equipment through financial and tax-favorable mechanisms.
Improved equipment could be introduced through the creation of electronic equipment with energy self-service capacity: this service could be achieved through the use of small-scale solar energy powering low-potential equipment and perhaps charging small batteries in communication devices, among other things. The PNE 2050 includes this alternative and estimates a consumption reduction of approximately 24 TWh compared to the reference scenario, which represents seven percent of total electricity consumption (EPE, 2015). However, this projection was done only for the Brazilian residential sector, but it could also be applied to the commercial sector.

53Bridging the Gap Between Energy and Climate Policies in Brazil
Globally, in the not-too-distant future, renewable and decentralized systems attached directly to buildings will provide electricity to smart grids, bringing reductions in electricity consumption of 10 percent or more, as well as better stability of supply (fewer disruptions), and reduced baseload power generation from polluting sources (Lang and Mutschler, 2012).
Additionally, it would be important to increase the share of solar hot-water heating and decrease that of electric and natural-gas systems. The deployment of solar water heaters is already part of the current housing policy of the Federal Government; solar heating systems (SAS) must be included in the federal housing assistance program “Minha Casa, Minha Vida,” established by the state-owned Brazilian bank “Caixa Economica Federal” and implemented by the Ministry of Cities (MC). The replacement of old and inefficient equipment that consumes a lot of energy is an important government policy. However, this type of initiative could be expanded to include more households. This energy-efficiency program presents some contradictions. For example, the program implies that the families that consume less energy receive more resources, but low-income families already consume much less energy than wealthier households. Additionally, in terms of reducing energy consumption, it would be important to broaden this kind of tax-relief program to focus additionally on large factories and the replacement of old and inefficient machines that consume far more energy than low-income households.
Governmental procurement is a powerful tool to influence markets. In the case of popular housing, the “Minha Casa, Minha Vida” (and other state or city programs) should pay close attention to the building standards for thermal and lighting com-fort. The building envelope should utilize low-trans-mittance materials, frames should provide natural ventilation and illumination, avoiding the use of air conditioners and artificial lighting as far as possible. Government buildings could be labeled under the Procel-Edifica Scheme. Recent developments by the Federal Government are intensifying these mea-sures, and their importance should be highlighted in national energy and climate policies.
Commercial and public buildings offer significant possibilities for decentralized energy—both thermal and electric. Hybrid systems and cogeneration improve efficiency and resilience against power outages. Solar thermal heating reduces energy bills for heating water and, with improved technologies, even for cooling. Nevertheless, there are several misconceptions within the civil construction sector concerning these options, mostly because of the high initial capital costs and disregard for the life cycle cost of energy.
It is important to highlight the social disparities and regional heterogeneities in Brazil. Different climatic zones, urbanization patterns, and income levels require different perspectives for energy genera-tion, consumption, efficiency, and GHG emission profiles. Improving socioeconomic indicators entails reducing inequalities, providing widespread and sufficient energy services, and ensuring envi-ronmental quality. Among existing frameworks, one that could be adopted is the Sustainable Development Goals (SDGs) indicators that measure citizens’ access to affordable, reliable, sustainable, and modern energy (UNSDSN, 2015). Sustainable Development Goal 7 refers to energy and includes, among other indicators, access to modern cooking solutions and to reliable electricity generated by sustainable sources. It also includes incentives for low-carbon energy in the electricity sector and the rate of improvement in primary energy intensity.
Reconciling the Role of Hydropower with Concern for Sustainability and ResilienceLarge-scale deployment of hydropower has con-tributed to Brazil’s position as a world leader in low-carbon energy development, and has generated important economic benefits, including limiting the country’s reliance on imported fossil fuels, enabling the expansion of access to modern energy services, and serving as a low-cost domestic energy source. Hydropower reservoirs have both positive and negative socioeconomic impacts: while they provide energy storage, flood control, multiple water uses throughout the year, and tourism development, among other goods, they cause damage including biodiversity loss, submersion of sensitive sites, and local population displacement. Trade-offs are extremely context-specific (Goldemberg and Lucon, 2008; Sathaye et al, 2011).
WRI.org 54
Brazil still has 100GW in hydroelectric poten-tial—and, in theory, such potential would easily be enough to meet the projected demand of six GW of additional installed capacity per year until 2023 (EPE, 2023), while offering stability and low emissions (except for methane in certain instances). Despite this potential, forecasts indicate a gradual reduction in the relative share of hydropower in Brazil’s electricity-generation mix (EPE, 2014). The country has vast hydro resources still untapped: Of the 100GW in hydroelectric potential, 69.2 GW have been inventoried and only 16.7 GW of poten-tial projects have had feasibility studies completed (Eletrobras, 2013). However, hydropower expan-sion is facing significant barriers. These include: (i) lack of adequate public engagement at all stages of developing new projects; (ii) increasing public protest driven by social and environmental con-cerns; (iii) lack of strong coordination between federal- and state-level governments; (iv) long and complicated licensing procedures; and (v) increas-ing unreliability of hydropower because of climate
change impacts. As a result of these factors, accord-ing to the 2014 Brazilian National Energy Balance (BEN) the estimated available hydro potential declined from 50.5 GW in 2005 to 26.5 GW in 2013 (BEN, 2014). Therefore, if hydropower is to play the increased role in the power sector that the govern-ment plans for it, the aforementioned challenges will need to be proactively addressed. Potential solutions are both technological and governance-focused, as discussed below.
Streamline environmental license processes
The current environmental regulatory framework in Brazil requires a range of licenses for hydropower, resulting in high fees for the use, consumption, and discharge of water. Considering the multi-level nature of Brazilian environmental licensing laws, many projects face overlapping environmental jurisdictions at the federal and state levels. The costs increase even more if environmental licensing is delayed, which in turn leads to higher costs for licensed plants as they seek to meet energy demand (Soito and Freitas, 2011). New hydropower projects have been affected by difficulties in obtaining environmental licenses (especially for larger projects), which often leads to a reduction in the size of planned reservoirs for storage capacity. Consequently, the costs increase, as the share of supply sources changes because of the reduction in the planned reservoirs, which may lead to higher energy prices. It will be important to reduce the uncertainties regarding the environmental licensing process in plants that appear likely to impact protected areas, and IBAMA could streamline its environmental license process and promote better coordination with state agencies and other federal environmental agencies. Providing more regular revisions to update and contextualize environmental licensing rules could reduce such conflicts and political disputes without compromising the integrity of environmental protection.
Increase reliability and resilience of hydropower
Global warming is likely to change the hydrological cycle, impacting the availability of water in Brazil’s drainage reservoirs (Soito and Freitas, 2011). Severe droughts have reduced hydropower generation in recent years (2001, 2010, 2014,
Overall, the reliance on baseload hydropower generation in Brazil is diminishing. If the government intends to maintain the major role of hydropower in the electricity mix, it will be important to promote grid interconnection with non-hydro modern renewables.
55Bridging the Gap Between Energy and Climate Policies in Brazil
2015). Hydropower—and especially run-of-the-river hydropower projects with no reservoirs—is at risk from drought-induced reductions in water levels. The extent to which hydropower can be expanded will depend significantly on the ability to store water in reservoirs, because such power plants will then be somewhat independent of the rainfall regime (ONS, 2013b). Hydropower in the flat Amazon region is not able easily to include energy storage, because reservoirs have deep environmental and social implications, leading to the option of run-of-the-river projects with lower capacity factors.
Overall, the reliance on baseload hydropower gen-eration in Brazil is diminishing. If the government intends to maintain the major role of hydropower in the electricity mix, it will be important to pro-mote grid interconnection with non-hydro modern renewables. Another option would be to increase national energy storage capacity in such a way that the additional generation possible during the wet season can be used during the dry season. Also, the Energy Research Company (EPE), the Electricity Regulatory Agency (ANEEL), and the major Elec-tricity Utility Company (Eletrobras) could consider measures and policies to encourage investments in energy complementarity and storage capacity in regions other than the Amazon. Such measures could increase resilience during the dry seasons. There are also some other techniques that could support increased storage capacity in Brazilian watersheds (Hunt, Freitas, and Pereira Jr., 2014), such as enhanced-pumped-storage, pumped-stor-age in cascade, additional storage reservoir dams, or retrofit of run-of-the-river dams into storage reservoir dams. Such systems result in less water loss through evaporation and have high storage efficiency (roughly 90 percent). However, although they could be a reasonable option to store energy from hydropower—because such systems require a substantially smaller flooded area to store water than traditional hydropower plants—it is important to highlight that over-reliance on pumped storage might undercut the benefits, because more energy is used pumping the water uphill than is gained when it is released. Finally, it is important to highlight the importance of increasing energy efficiency for elec-trification to help decarbonize the energy-related GHG emissions sectors, and of deploying at large
scale demand-side management (DSM) measures, in response to climate change. These measures could save consumers money, reduce the prob-ability of future energy shortages, and, ultimately, reduce energy consumption and GHG emissions.
Enhance public engagement at all stages of new projects
As of December 2014, there were 48 hydropower feasibility studies with installed capacity above 100 megawatts registered at the National Electricity Regulatory Agency (ANEEL). Of these 48 studies, 30 are located in tropical forests, with implied risks of delays or non-viability caused by lack of public acceptance. One major project represents 19 percent of the total 31.6 GW; the top three projects cover 48 percent and the top seven cover more than 73 percent, which means that if just one or two of these projects do not go through then much less of this potential will be delivered (ANEEL, 2014).
The fact that the remaining hydroelectric potential is located predominantly in the Amazon region, which also encompasses most of Brazil’s protected areas and indigenous communities, has several consequences for the development planning of power plants. Located in the Amazon Region, Belo Monte is the largest infrastructure work in progress in Brazil, and because of socio-environmental con-
WRI.org 56
cerns and lack of public acceptance, it is expected to take more than three decades to move from its initial announcement to operations. The originally planned size of the reservoir was reduced by 58 per-cent and the current installed capacity is approxi-mately 11 GW (ANEEL, 2015), and the plant’s estimated costs doubled. Even so, opponents of the project believe that the case of Belo Monte will set a precedent for other large projects in the Amazon region that could be detrimental going forward (EPE, 2011; ANEEL, nd; ISA, nd; Pereira 2013).
Policy recommendations to overcome lack of public acceptance of new projects include that the federal government could encourage higher public engagement in all stages of such projects, and developers could create permanent and more effective channels of communication with local people who will be affected over the whole cycle of the project. Although the need to manage the process better to gain public acceptance is relevant, it is important to highlight that addressing the real socio-environmental concerns as part of the project is the key issue to gain public acceptance, because public rejection is often motivated by genuine concerns and real issues with hydropower projects. Therefore, dealing with this issue does not imply only overcoming public resistance but also making
decisions that incorporate the negative externalities based on understanding the specific local context and trade-offs.
Reconsidering an Emission Performance Standard (EPS) for Fossil-Fuel Power PlantsIn order to reduce GHG emissions from fossil-fuel power plants and encourage the growth of modern renewables in the electricity mix, the federal gov-ernment could also reconsider establishing an emis-sion performance standard (CO2 EPS) for fossil-fuel power plants that was adopted in 2009 but subse-quently revoked (discussed further below). An EPS could play a key role in the development and imple-mentation of climate policies in different countries, and it could accelerate the process of generating energy efficiently, while enabling the development and dissemination of advanced technologies to reduce GHG emissions (Romeiro, 2014). A CO2 EPS could also be relevant to foster the deployment of certain clean technologies that otherwise are unlikely to be viable at the commercial scale, such as carbon capture and storage.
Over the past few years, many countries and states have attempted to create EPS for fossil-fired power plants (Table 4).
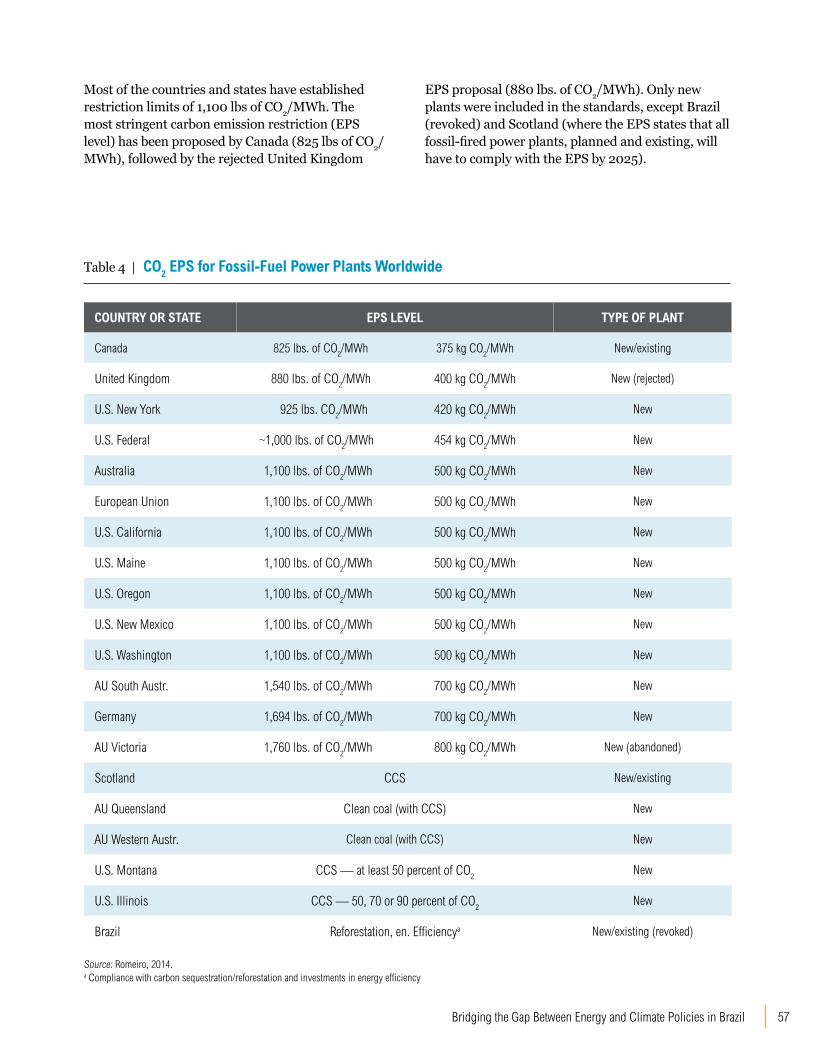
57Bridging the Gap Between Energy and Climate Policies in Brazil
Most of the countries and states have established restriction limits of 1,100 lbs of CO2/MWh. The most stringent carbon emission restriction (EPS level) has been proposed by Canada (825 lbs of CO2/MWh), followed by the rejected United Kingdom
EPS proposal (880 lbs. of CO2/MWh). Only new plants were included in the standards, except Brazil (revoked) and Scotland (where the EPS states that all fossil-fired power plants, planned and existing, will have to comply with the EPS by 2025).
Table 4 | CO2 EPS for Fossil-Fuel Power Plants Worldwide
COUNTRY OR STATE EPS LEVEL TYPE OF PLANT
Canada 825 lbs. of CO2/MWh 375 kg CO
2/MWh New/existing
United Kingdom 880 lbs. of CO2/MWh 400 kg CO
2/MWh New (rejected)
U.S. New York 925 lbs. CO2/MWh 420 kg CO
2/MWh New
U.S. Federal ~1,000 lbs. of CO2/MWh 454 kg CO
2/MWh New
Australia 1,100 lbs. of CO2/MWh 500 kg CO
2/MWh New
European Union 1,100 lbs. of CO2/MWh 500 kg CO
2/MWh New
U.S. California 1,100 lbs. of CO2/MWh 500 kg CO
2/MWh New
U.S. Maine 1,100 lbs. of CO2/MWh 500 kg CO
2/MWh New
U.S. Oregon 1,100 lbs. of CO2/MWh 500 kg CO
2/MWh New
U.S. New Mexico 1,100 lbs. of CO2/MWh 500 kg CO
2/MWh New
U.S. Washington 1,100 lbs. of CO2/MWh 500 kg CO
2/MWh New
AU South Austr. 1,540 lbs. of CO2/MWh 700 kg CO
2/MWh New
Germany 1,694 lbs. of CO2/MWh 700 kg CO
2/MWh New
AU Victoria 1,760 lbs. of CO2/MWh 800 kg CO
2/MWh New (abandoned)
Scotland CCS New/existing
AU Queensland Clean coal (with CCS) New
AU Western Austr. Clean coal (with CCS) New
U.S. Montana CCS — at least 50 percent of CO2
New
U.S. Illinois CCS — 50, 70 or 90 percent of CO2
New
Brazil Reforestation, en. Efficiencya New/existing (revoked)
Source: Romeiro, 2014.a Compliance with carbon sequestration/reforestation and investments in energy efficiency
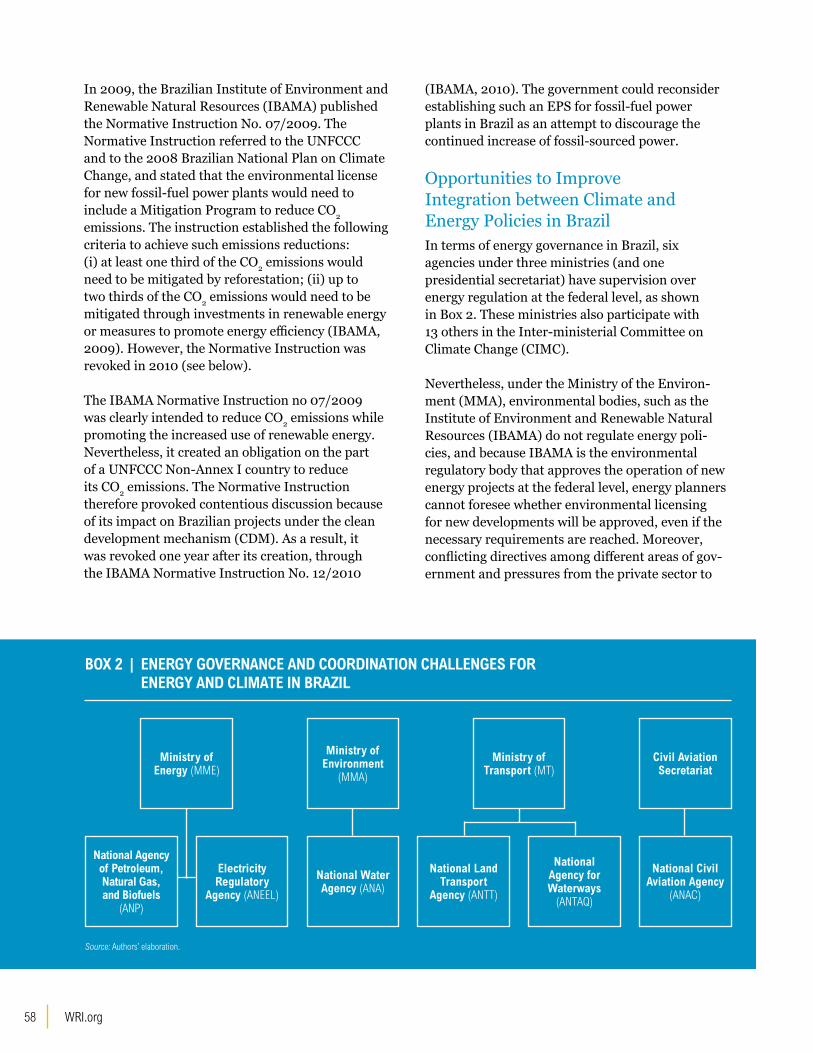
WRI.org 58
BOX 2 | ENERGY GOVERNANCE AND COORDINATION CHALLENGES FOR ENERGY AND CLIMATE IN BRAZIL
Ministry of Energy (MME)
Ministry of Transport (MT)
Ministry of Environment
(MMA)
Civil Aviation Secretariat
National Agency of Petroleum, Natural Gas, and Biofuels
(ANP)
National Land Transport
Agency (ANTT)
Electricity Regulatory
Agency (ANEEL)
National Agency for Waterways
(ANTAQ)
National Water Agency (ANA)
National Civil Aviation Agency
(ANAC)
Source: Authors’ elaboration.
In 2009, the Brazilian Institute of Environment and Renewable Natural Resources (IBAMA) published the Normative Instruction No. 07/2009. The Normative Instruction referred to the UNFCCC and to the 2008 Brazilian National Plan on Climate Change, and stated that the environmental license for new fossil-fuel power plants would need to include a Mitigation Program to reduce CO2 emissions. The instruction established the following criteria to achieve such emissions reductions: (i) at least one third of the CO2 emissions would need to be mitigated by reforestation; (ii) up to two thirds of the CO2 emissions would need to be mitigated through investments in renewable energy or measures to promote energy efficiency (IBAMA, 2009). However, the Normative Instruction was revoked in 2010 (see below).
The IBAMA Normative Instruction no 07/2009 was clearly intended to reduce CO2 emissions while promoting the increased use of renewable energy. Nevertheless, it created an obligation on the part of a UNFCCC Non-Annex I country to reduce its CO2 emissions. The Normative Instruction therefore provoked contentious discussion because of its impact on Brazilian projects under the clean development mechanism (CDM). As a result, it was revoked one year after its creation, through the IBAMA Normative Instruction No. 12/2010
(IBAMA, 2010). The government could reconsider establishing such an EPS for fossil-fuel power plants in Brazil as an attempt to discourage the continued increase of fossil-sourced power.
Opportunities to Improve Integration between Climate and Energy Policies in BrazilIn terms of energy governance in Brazil, six agencies under three ministries (and one presidential secretariat) have supervision over energy regulation at the federal level, as shown in Box 2. These ministries also participate with 13 others in the Inter-ministerial Committee on Climate Change (CIMC).
Nevertheless, under the Ministry of the Environ-ment (MMA), environmental bodies, such as the Institute of Environment and Renewable Natural Resources (IBAMA) do not regulate energy poli-cies, and because IBAMA is the environmental regulatory body that approves the operation of new energy projects at the federal level, energy planners cannot foresee whether environmental licensing for new developments will be approved, even if the necessary requirements are reached. Moreover, conflicting directives among different areas of gov-ernment and pressures from the private sector to

59Bridging the Gap Between Energy and Climate Policies in Brazil
speed development in the energy sector frequently result in environmental authorities being accused of delaying Brazil's economic development with complex licensing procedures and rules.
In December 2009, the Brazilian Government launched the National Policy on Climate Change (PNMC) through Federal Law No. 12.187/2009. In line with its submission to the UNFCCC, the PNMC pledged Brazil to a 36.1–38.9 percent reduction in GHG emissions by 2020, relative to a trend line scenario. A year later, Decree 7.390 was established to regulate the PNMC, and stated that the 2020 commitments should be achieved through mitigation and adaptation sectoral plans. It has also decreed that the Ten-Year Energy Expansion Plan (PDE), revised and updated on an annual basis, should constitute the Energy Sectoral Plan for mitigation and adaptation to climate change, which means that energy-related climate policies in Brazil are defined by the Ministry of Mines and Energy.
The Ten-Year Energy Plan is supposed to represent Brazil’s official sectoral plan to address climate change. However, because it prioritizes economic development over climate-change concerns, the scientific recommendations to deeply reduce GHG emissions are not fully heeded and the necessary
shifts in priorities to efficiently tackle climate change in Brazil are not sufficiently considered.
Changes in the business-as-usual (BAU) GHG emission projections between the 2009 Brazilian commitments under the Copenhagen Accord and the 2010 Decree of the National Policy on Climate Change: implications for energy-related GHG emissions
The first problem is the unexplained revision (increase) of projected GHG emissions under the Brazilian business-as-usual (BAU) scenario. The original BAU projection for 2020, announced in November 2009 as part of the Copenhagen Accord, was 2.7 GtCO2e. However, the National Decree 7.390 of 2010, which regulates the PNMC, revised and increased the BAU GHG emissions for 2020 to 3.2 GtCO2e—which represents an increase of more than 18 percent, as shown in Table 5.
In addition, because Brazil’s pledge is framed as a percentage reduction relative to the baseline level, the total 2020 emissions associated with achieving the pledge depend entirely on the definition of the baseline. The higher the BAU, the lower will be Brazil’s ambition, because the country will be able to meet its pledge with a smaller reduction in emissions.
Table 5 | Brazilian Nationally Appropriate Mitigation Actions (NAMAs): Changes in the Business-as-Usual GHG Emission Projections for 2020
SECTOR
2020 BASELINE EMISSIONS (MT CO2E)
PERCENT CHANGEGHG EMISSIONS PROJECTED
BY 2020 UNDER THE COPENHAGEN ACCORD
GHG EMISSIONS PROJECTED BY 2020 UNDER THE DECREE OF THE NATIONAL
POLICY ON CLIMATE CHANGE
Agriculture 627 730 + 16.4
Industry and Waste 92 234 + 254.3
Energy 901 868 - 3.6
Land-Use Change 1.084 1.404 + 29.5
Total 2.703 3.236 + 19.71
Source: Brazil, 2009 and Brazil, 2010.
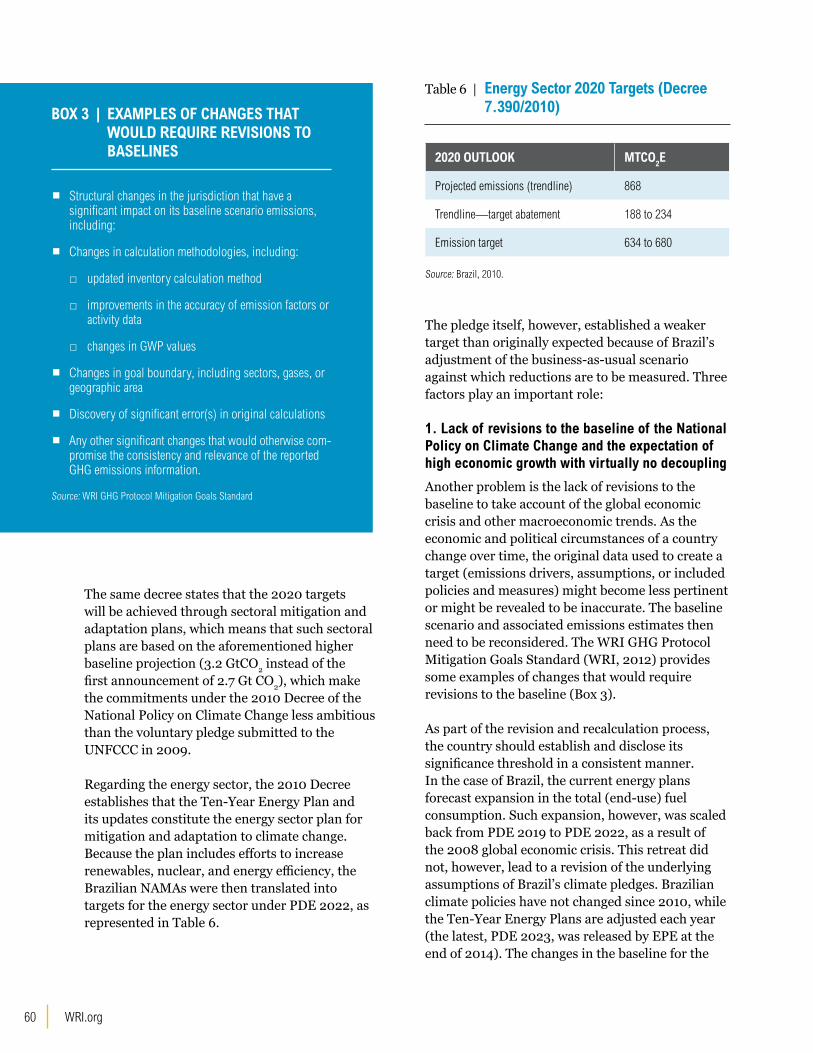
WRI.org 60
The same decree states that the 2020 targets will be achieved through sectoral mitigation and adaptation plans, which means that such sectoral plans are based on the aforementioned higher baseline projection (3.2 GtCO2 instead of the first announcement of 2.7 Gt CO2), which make the commitments under the 2010 Decree of the National Policy on Climate Change less ambitious than the voluntary pledge submitted to the UNFCCC in 2009.
Regarding the energy sector, the 2010 Decree establishes that the Ten-Year Energy Plan and its updates constitute the energy sector plan for mitigation and adaptation to climate change. Because the plan includes efforts to increase renewables, nuclear, and energy efficiency, the Brazilian NAMAs were then translated into targets for the energy sector under PDE 2022, as represented in Table 6.
Table 6 | Energy Sector 2020 Targets (Decree 7.390/2010)
2020 OUTLOOK MTCO2E
Projected emissions (trendline) 868
Trendline—target abatement 188 to 234
Emission target 634 to 680
Source: Brazil, 2010.
The pledge itself, however, established a weaker target than originally expected because of Brazil’s adjustment of the business-as-usual scenario against which reductions are to be measured. Three factors play an important role:
1. Lack of revisions to the baseline of the National Policy on Climate Change and the expectation of high economic growth with virtually no decoupling
Another problem is the lack of revisions to the baseline to take account of the global economic crisis and other macroeconomic trends. As the economic and political circumstances of a country change over time, the original data used to create a target (emissions drivers, assumptions, or included policies and measures) might become less pertinent or might be revealed to be inaccurate. The baseline scenario and associated emissions estimates then need to be reconsidered. The WRI GHG Protocol Mitigation Goals Standard (WRI, 2012) provides some examples of changes that would require revisions to the baseline (Box 3).
As part of the revision and recalculation process, the country should establish and disclose its significance threshold in a consistent manner. In the case of Brazil, the current energy plans forecast expansion in the total (end-use) fuel consumption. Such expansion, however, was scaled back from PDE 2019 to PDE 2022, as a result of the 2008 global economic crisis. This retreat did not, however, lead to a revision of the underlying assumptions of Brazil’s climate pledges. Brazilian climate policies have not changed since 2010, while the Ten-Year Energy Plans are adjusted each year (the latest, PDE 2023, was released by EPE at the end of 2014). The changes in the baseline for the
▪ Structural changes in the jurisdiction that have a significant impact on its baseline scenario emissions, including:
▪ Changes in calculation methodologies, including:
□ updated inventory calculation method
□ improvements in the accuracy of emission factors or activity data
□ changes in GWP values
▪ Changes in goal boundary, including sectors, gases, or geographic area
▪ Discovery of significant error(s) in original calculations
▪ Any other significant changes that would otherwise com-promise the consistency and relevance of the reported GHG emissions information.
Source: WRI GHG Protocol Mitigation Goals Standard
BOX 3 | EXAMPLES OF CHANGES THAT WOULD REQUIRE REVISIONS TO BASELINES

61Bridging the Gap Between Energy and Climate Policies in Brazil
energy sector, allied with the lack of ambition of the PDEs to reduce GHG emissions, cast doubt on whether these plans can be considered as medium- to long-term instruments of climate policy in Brazil, as determined by Decree 7.390/2010.
2. The EPE forecast for growth in the energy sector is based on two non-practical assumptions:
The first is that average GDP growth assumed in the Ten-Year Energy Plan is five percent per year, while, in practice, GDP growth has averaged approximately 3.4 percent per year since 2010, fall-ing to 0.4 percent in 2014.
3. Non-LUC sectors had their BAU trend lines based on expectations of a high GDP growth rate.
For industry, waste, and agriculture it was esti-mated to be five percent per year over the period 2006 to 2020—a total increase of 97 percent. The energy sector was expected to grow at 4.8 percent per year (EPE, 2013). From 2006 to 2012, Brazil-ian GDP grew 4.2 percent per year. According to the IMF (2015) growth was 2.7 percent in 2013, 0.1 percent in 2014 and forecasts indicate growths of negative 1.5 percent in 2015 and positive 0.7 per-cent in 2016. The official estimate of GDP growth for the present year, as of June 2015, is -1.3 percent (Central Bank of Brazil, 2015).
The EPE forecast for growth in the energy sec-tor is much higher than the reality, and GDP and energy demand is not decoupled, which means that the efficiency of the economy is assumed not to improve. EPE’s outlooks of six GW of additional installed capacity per year may be an overestimate, based on GDP assumptions alone. The second assumption is that GDP and energy demand will not be decoupled—in other words, the efficiency of the economy will not improve. It is important to decouple expectations of growth in energy demand from expectations of economic growth (Lucon, Romeiro, and Pacca, 2013).
In light of these issues, there is ample opportunity to strengthen energy and climate policies in Brazil. The first necessary action is to acknowledge the considerable lock-in risks posed by current energy and climate policies. Despite remarkable improve-ments in deforestation control, changing patterns of emissions pose considerable threats for Brazil
after 2020, and the present narrative of mitiga-tion strategies undertaken by the government may not endure for long. More specifically, the federal government should update the baseline announced by the Decree 7.390 of 2010, because the inflated baselines represent steep increases in emissions that are not consistent with historical trends and forecasts.
Another necessary action is to consider revisions to the baseline based on the global economic crisis/other macroeconomic trends, for example, under the provisions established by the WRI GHG Protocol Mitigation Goals Standard (mentioned above). It will be important to decouple the emis-sions reduction pledges from the expectations on economic growth, given that current trends present relatively small improvements in efficiency and decarbonization. The 36.1 percent–38.9 percent reduction pledges under the National Policy on Climate Change (Brazil, 2009) actually translate to a reduction of only 15–18 percent when 2005 is the baseline year, and the contribution from the energy sector is even lower.
It would be important to create comprehensive metrics to decouple expectations of growth in energy demand from expectations of economic growth (Lucon, Romeiro, and Pacca, 2013). Some indicators to be monitored at the national and subnational levels could be considered, such as efficiency improvements in final energy use, reduc-tion in energy consumption, and mitigation of GHG emissions. A monitoring process, accessible to the public at large and based on quantifiable dimensions, would be relevant to move from public policy rhetoric to results-driven climate and energy policies. Metrics regarding generation, consump-tion, efficiency, and GHG emissions could help civil society to follow up on sound policy implementa-tion and bring about meaningful results.
Given that the Ten-Year Energy Expansion Plan (PDE) constitutes the energy sector’s climate plan, climate change concerns are subordinate to economic growth in Brazil. On the eve of the Paris Climate Change Conference, the federal government could consider effectively integrating climate policies more fully into the sectoral energy plan.
WRI.org 62
63Bridging the Gap Between Energy and Climate Policies in Brazil
CONCLUSIONS AND RECOMMENDATIONSUntil the early years of the 21st century, climate change
mitigation in Brazil was almost exclusively, and rightly,
associated with forests and land-use change. The absolute
volume of GHG emissions produced by unsustainable
deforestation and agricultural practices was overwhelming,
while the carbon intensity of Brazil’s energy mix was
relatively low. That is changing.
WRI.org 64
While Brazil’s energy sector is relatively efficient, with moderately low carbon intensity (because of the significant use of biofuels for transport, the relative efficiency of iron and steel produc-tion, and the major role of hydropower), current policy approaches leave a lot of opportunities “on the table.” A combination of efforts to increase efficiency and the share of all forms of renewable energy in the national energy mix could reinforce Brazil’s position as a low-carbon economy—which is currently in jeopardy—and deliver many other benefits to its citizens, including better air qual-ity, enhanced and cleaner mobility, and overall improvements in quality of life. Reflecting these opportunities in its approach to international climate policy, likewise, would reinforce Brazil’s position as a leader in the international community and enhance pressure on other major economies to implement international best practices. This, in turn, would create a further competitive advan-tage for Brazilian industry, which is already more efficient than the global average.
Due in part to the lack of historical association between the energy sector and climate-change mitigation in Brazil, climate change has not been considered thoroughly in national energy policy. The existing annual Ten-Year Energy Plan, with its conservative assumptions and modest efficiency improvements, was simply adopted as the mitiga-tion and adaptation sectoral plan for the energy sector to represent climate policy. Sectoral climate plans that have an impact on the energy sector, like-wise, do little to enhance ambition relative to the annual Ten-Year Energy Plan. They have been slow to be developed and implemented, lack specificity and priority, and ignore significant, cost-effective potential abatement options.
In contrast to many other major emerging economies, Brazil’s energy mix is becoming more carbon intensive, not less, because of increased reliance on fossil fuels, heavy investments in the Pre-Salt oil fields, subsidies to keep gasoline prices artificially low, and tax subsidies that encourage the purchase of new cars, among other reasons.
A variety of scenarios have identified key technolo-gies and cost-effective abatement opportunities that offer emissions reductions of approximately 40
percent relative to the baseline. (Some very recent studies are in the process of publication, or were published too late for inclusion in this report, and have not been included in this analysis.) Public policy recommendations evaluated in this report indicate that a different future is possible for GHG emissions from Brazil’s energy sector if significant efforts are made to overcome existing barriers. It is important to highlight that this report did not attempt to discuss other key related questions such as equity, fairness, and financing, despite their significance in international climate negotiations. Although these issues will play an important role both domestically and internationally, the aim of this report was to focus on national circumstances and initiatives that could improve the integration between existing climate and energy policies in Brazil.
Keeping in mind that Brazil has many disparities and regional differences, we propose a comprehensive set of public policy priorities, stemming from the recognition that high-carbon lock-in is a risk, both to Brazil’s economy and to the global climate. It is very unlikely that decarbonization and energy efficiency improvements will proceed at the necessary pace without a strong policy signal to guide public and private investment. The policy priorities proposed below address the key energy subsector emitters (transport, industry, and power generation), as well as opportunities for more integration between the energy sector and climate policies:
Transport
▪ Accelerate the implementation of fuel-economy standards and bring them into line with best international practice ▪ Diversify and integrate modal transportation systems for freight and public transport by conducting scoping studies on rail for freight transportation and high-speed rail for public transport; developing high-capacity bus and rail systems in high-demand areas; and increasing investment in low-emission transportation modes ▪ Offer municipalities incentives to create local mass-transport plans ▪ Streamline licensing for key rail and waterway projects ▪ Establish carbon pricing for transport

65Bridging the Gap Between Energy and Climate Policies in Brazil
▪ Promote the use of biofuels while ensuring that they do not cause negative land-use changes ▪ Provide incentives to encourage the inclusion of hybrids and electrical vehicles in the energy transportation mix over the next 20 years ▪ Establish public procurement of cleaner fuel and vehicles as a strategy to promote a more sustainable transport system
Industry
▪ Accelerate implementation of an MRV system as a basis for creation of a carbon market ▪ Implement Brazilian Market for Emission Reductions ▪ Develop LCA-based benchmarks and labels to differentiate products ▪ Leverage environmental licensing to improve efficiency ▪ Accelerate plans to replace coal with renewable biomass
Power generation
▪ Invest in the development of wind and solar technologies aimed at competitiveness ▪ Hold dedicated auctions for modern renewables, incorporating fair pricing practices ▪ Provide more long-term loans for grid infrastructure ▪ Incentivize energy integration through bilateral treaties focused on the shared use of water resources ▪ Increase the share of wind and solar PV sources in the electricity mix ▪ Consider a commitment to increase the share of solar and wind in the energy mix to 30 percent by 2030 as part of Brazil’s intended nationally determined contribution (INDC) ▪ Explore the options for new storage technologies to reduce the social and environmental impacts of large hydropower projects, while increasing their resilience to climate change ▪ Reconsider establishing an EPS for fossil-fuel power plants ▪ Develop a regulatory framework for carbon capture and storage
Integration between climate and energy policies in Brazil
▪ Adopt rigorous metrics, at national and subnational level, to track the decoupling of economic growth from natural resource use. Possible indicators include: (a) efficiency improvements in final energy use, (b) reduction in energy consumption, and (c) mitigation of GHG emissions ▪ Revise the baseline of the National Policy on Climate Change and its decree, based on inter-national standards and best practices ▪ Establish a monitoring process, accessible to the public at large and based on quantifiable dimensions. This would help with moving from public policy rhetoric to results-driven climate and energy policies, and address barriers ▪ Review the sectoral plans regularly (every other year) with a view to enhancing ambition over time, as implementation improves and technology and financing options advance ▪ Establish a robust, periodic review process for national climate policies and plans that is transparent about assumptions and that is participatory, with an ample public comment period and a mandate to respond to public comments ▪ Consider the implications of integrating global carbon budget constraints into Brazil’s climate plan for the energy sector, with due regard for equity, fairness, technology support, finance, and other issues of particular concern to non-Annex I Parties ▪ Integrate ambitious energy targets into Brazil’s INDC—first in Paris, and then with a view to ratcheting up targets every five years, or some other time frame that is determined to be appropriate
This ambitious agenda will require political leadership at the highest levels, strong coordination across line ministries and up and down jurisdictional levels, as well as participation of the private sector and civil society. The rewards, however, are significant—cost savings, health benefits, enhanced competitiveness, and an improved quality of life for the citizens of Brazil—and enhanced Brazilian leadership in climate policy at the global level.
WRI.org 66
REFERENCES ABEEOLICA – Brazilian Wind Energy Association. 2015. “Data on the wind power sector.” Available at: http://www.portalabeeolica.org.br/
ABINEE. 2012. “Propostas para Inserção da Energia Solar Fotovoltaica na Matriz Elétrica Brasileira.” Associação Brasileira da Indústria Elétrica e Eletrônica.
ACENDE Brazil. 2014. “Analyzes of auctions.” Available at: http://www.acendebrasil.com.br/br/analises
AFCP. Associação dos fornecedores de cana de Pernambuco. “Cidades brasileiras testam biocombustível nas frotas de ônibus.” Available at: http://www.afcp.com.br/?p=3413. Last accessed in May, 2015.
Agência Gestão CT&I. 2015. “Brasil quer precificar carbono para aumentar competitividade.” Available at: http://www.agenciacti.com.br/index.php?option=com_content&view=article&id=7493:brasil-quer-precificar-carbono-para-aumentar-competitividade&catid=3:newsflash Last accessed in June, 2015.
Aidar, A.C.K., F. Serigati. 2014. “The Influence of Gasoline Price Controls on Ethanol Prices.” Fundação Getúlio Vargas. Available at: http://fgvprojetos.fgv.br/en/noticias/influence-gasoline-price-controls-ethanol-prices#sthash.35TBdwOH.dpuf
Almeida, D’A., S. Kahn, and C. Souza. 2013. “Opportunity to reduce greenhouse gas by the use of alternative fuels and technologies in urban public transport in Brazil.” Current Opinion in Environmental Sustainability 2013. 5: 177–183
Alvim, C.F., O.C. Ferreira, F. Eidelman, J. Goldemberg., 2000. “Energia Final e Equivalente - Procedimento Simplificado de Conversão.” Economia & Energia 18. Available at: http://ecen.com/eee18/enerequi.htm
Alvim, C.F., J. Vargas, O. Silva, O. Ferreira, F. Eidelman. 2005. “Um Porto de destino para o sistema elétrico Brasileiro.” Econ Energ 2005. 9: 49.
ANAC - Agência Nacional de Aviação Civil. 2014. “Inventário nacional de emissões atmosféricas da aviação civil. Superintendência de Relações Internacionais.” Gerência Técnica de Análise Ambiental.
Andi. 2011. “Hot air.” Available at: http://www.mudancasclimaticas.andi.org.br/content/hot-air-ar-quente.
ANEEL. 2013a. “Leilão de Energia A-5.” Available at: http://www.aneel.gov.br/aplicacoes/noticias/Output_Noticias.cfm?Identidade=7575&id_area=90
ANEEL. 2013b. “Banco de Informações de Geração.” Agência Nacional de Energia Elétrica. Available at:, http://www.aneel.gov.br/aplicacoes/capacidadebrasil. Last accessed on: June, 2011.
ANEEL. 2014. “Relatório de Acompanhamento de Estudos e Projetos.” Versão 17/04/2014. Available at http://www.aneel.gov.br/visualizar_arquivo.cfm?idarq=13177
ANEEL. “Resolution n0 393 of 1998.” Available at: http://www.aneel.gov.br/cedoc/bres1998393.pdf.
ANEEL. “Wind Energy Source in Brazil.” 2015. Available at: http://www.aneel.gov.br/aplicacoes/atlas/pdf/06-energia_eolica(3).pdf.
ANP – Agência Nacional do Petróleo, gás natural e biocombustíveis. “Resolução ANP nº 63 de 2014.”
ANP. 2013. “Anuário Estatístico Brasileiro do Petróleo, Gás Natural e Biocombustíveis 2012.” Agência Nacional do Petróleo e Biocombustíveis (ANP). Available at: http://www.anp.gov.br/?pg=64555&m=&t1=&t2=&t3=&t4=&ar=&ps=&cachebust=1363976230591.
ANTT. 2014. “Operações de transporte multimodal: desafios e perspectivas.” André Gulce Maia, 2014.
Arioli, M. 2013. “The challenges of ethanol in Brazil.” The City Fix. Available at: http://thecityfix.com/blog/ethanol-brazil-sugar-cane-industry-biofuels-magdala-arioli/.
Assunção, J., C. Gandour, R. Rocha, 2012. “Deforestation Slowdown in the Legal Amazon: Prices or Policies?” CPI Working Paper Climate Policy Initiative and PUC-Rio. Available at: http://climatepolicyinitiative.org/wp-content/uploads/2012/03/Deforestation-Prices-or-Policies-Working-Paper.pdf.
Bastos, F.C. and R. Schaeffer. 2011. “Análise da política de banimento de lâmpadas incandescentes do mercado brasileiro.” Rio de Janeiro: UFRJ/COPPE.
BBC Brasil. 2013. “Quatro fatores para entender a crise do etanol.” 5 de maio, Available at: http://www.bbc.co.uk/portuguese/noticias/2013/05/130424_etanol_mdb.shtml.
Beck, B. et al. 2011. “The Current Status of CCS development in Brazil.” Energy Proceedings 4: 6148–6151.
BEN - Brazilian National Energy Balance. 2014. “Annual report.” Available at: https://ben.epe.gov.br/downloads/Relatorio_Final_BEN_2014.pdf.
Bertelli, L.G. 2013. “Indústria sucroalcooleira.” DCI, October 17, Available at: http://unica.com.br/convidados/40728229920330851297/industria-sucroalcooleira/.
BiodieselBR. “Ônibus da Linha Verde em Curitiba aumentam quilometragem com biodiesel.” Available at: http://www.biodieselbr.com/noticias/em-foco/onibus-linha-verde-curitiba-aumentam-quilometragem-biodiesel-260710.htm. Last accessed in May, 2015.
Bourne Jr, J.K. and R. Clark. 2007. “Biofuels compared.” National Geographic Magazine. October.
Brandt, N. 2012. “Green Growth in Economic Surveys.” Paris, France: OECD. Available at: http://www.oecd.org/greengrowth/Green%20Growth%20in%20economic%20surveys.pdf.
Brazil, Government of. 2007. “Proposed Elements of a Protocol to the United Nations Framework Convention on Climate Change,” Presented by Brazil in Response to the Berlin Mandate (submission dated May 1997). FCCC/AGBM/1997/MISC.1/Add.3.
67Bridging the Gap Between Energy and Climate Policies in Brazil
Brazil. “Projeto de Lei 5109 de 2013.” Altera o Código Brasileiro de Aeronáutica, com o objetivo de estimular a utilização de biocombustíveis e reduzir os custos da aviação brasileira. Available at: http://www.camara.gov.br/proposicoesWeb/fichadetramitacao?idProposicao=566771
Burgi, A., 2013. “Avaliação do Potencial Técnico de Geração Elétrica Termossolar no Brasil a partir de Modelagem em SIG e Simulação de Plantas Virtuais.” (Master Thesis). COPPE/UFRJ, Planejamento Energético, Rio de Janeiro, Brazil.
Câmara, G. et al. 2011. “Regulatory framework for geological storage of CO
2 in Brazil: Analyses and proposal.” International
Journal of Greenhouse Gas Control 5: 966–974.
Câmara dos Deputados. 2014. “Especialistas defendem imposto sobre carbono com neutralidade fiscal.” Available at: http://www2.camara.leg.br/camaranoticias/noticias/MEIO-AMBIENTE/469114-ESPECIALISTAS-DEFENDEM-IMPOSTO-SOBRE-CARBONO-COM-NEUTRALIDADE-FISCAL.html. Last accessed in June, 2015.
Carvalho, J.F.C. and I.L. Sauer. 2012. “Um sistema interligado hidroeólico para o Brasil.” Valor Econômico, 1º de novembro
Castro, P., L. Hörnlein, and K. Michaelowa. 2014. “Constructed peer groups and path dependence in international organizations: The case of the international climate change negotiations.” Global Environmental Change. 5: 109–120.
Causo, A.F.T. 2013. “Mecanismos políticos para promoção da eficiência energética e geração renovável em edificações: um estudo de caso da Alemanha e aplicações para o Brasil.” MSc Thesis, Universidade Estadual de Campinas. Available at: https://app.box.com/s/ai15ewtlbai2bkrq4sfn.
CDIAC. 2013. “Carbon dioxide emissions from fossil fuels and manufacture of cement.” Oak Ridge, TN, U.S.A. Carbon Dioxide Information Analysis Center, Environmental Sciences Division, Oak Ridge National Laboratory.
CEFIC. 2012. “Guidelines for Measuring and Managing CO2
Emission from Freight Transport Operations.” Available at: http://www.cefic.org/Documents/IndustrySupport/Transport-and-Logistics/Best%20Practice%20Guidelines%20-%20General%20Guidelines/Cefic-ECTA%20Guidelines%20for%20measuring%20and%20managing%20CO2%20emissions%20from%20transport%20operations%20Final%2030.03.2011.pdf.
Central Bank of Brazil. 2015. “Focus: Market report.” Available at: http://www.bcb.gov.br/?FOCUSRELMERC.
CETESB. 2013a. “Relatório da Qualidade do Ar 2012.” Companhia Ambiental do Estado de São Paulo, Available at: http://www.cetesb.sp.gov.br/ar/qualidade-do-ar/31-publicacoes-e-relatorios.
CETESB. 2013b. “Padrões de Qualidade do Ar.” Companhia Ambiental do Estado de São Paulo. Available at: http://www.cetesb.sp.gov.br/ar/Informa??es-B?sicas/22-Padr?es-e-?ndices.
CGEE. 2014. “Levantamento dos níveis de produção de aço e ferro-gusa, cenário em 2020 -- Ênfase: Usos da energia gerada na combustão dos gases da carbonização.” Technical Note. Subsídios 2014 ao Plano Siderurgia do MDIC: Modernização da Produção do Carvão Vegetal. Contrato Administrativo CGEE/MDIC 49/2013.
Brasília: Centro de Gestão e Estudos Estratégicos. Available at: http://www.cgee.org.br/eventos/arquivos/CarvaoVegetal-CGEE_NT-Producao_de_aco_e_gusa2.pdf.
Climate Observatory. 2013. “Greenhouse Gas emissions estimate system in Brazil.”
CNI. 2009. “Eficiência Energética na Indústria: O Que foi feito no Brasil, Oportunidades de Redução de Custos e Experiência Internacional.” Confederação Nacional da Indústria.
CNI. 2011. “A indústria do Aço no Brasil.” Instituto Aço Brasil e Confederação Nacional da Indústria. Available at: http://www.acobrasil.org.br/site/portugues/sustentabilidade/downloads/livro_cni.pdf
Conselho de Arquitetura e Urbanismo. “Especialistas e governo discutem Plano de Mobilidade da Grande Florianópolis.” Available at: http://www.caubr.gov.br/?p=39074. Last accessed in June, 2015
CORINAIR. 2006. “Emission Inventory Guidebook.” B111(S1)-1. Available at: http://www.eea.europa.eu/publications/EMEPCORINAIR5/page010.html
Cursino, A., M. Fagá. 2011. “Eficiência Energética e a contribuição dos gases combustíveis: análise de caso das políticas públicas de avaliação das edificações.” Programa de Pós Graduação em Energia. São Paulo: Universidade de São Paulo.
da Costa, L. and I. Vaz. 2014. “Regulatory framework proposal for carbon capture and geologic storage in Brazil and a case study for Rio de Janeiro State.” Ph.D. dissertation. Energy Planning - UFRJ/ COPPE.
da Silva, F. et al. 2012. “The renewable energy market in Brazil: Current status and potential.” Renewable and Sustainable Energy Reviews 16: 3786–3802.
De Gouvello, C., R. Schaeffer, A. Szklo, R. De Gouvello. 2010. “Energy: low carbon emissions scenario in Brazil - synthesis report.” World Bank Working Paper Report no.: 59358. Available at: http://www.esmap.org/sites/esmap.org/files/Energy_English_final_09-12.pdf.
Diário de Pernambuco. “Sistema de partilha de carro elétrico é lançado no Recife.” Available at: http://www.diariodepernambuco.com.br/app/46,2/2014/12/15/interna_tecnologia,549150/sistema-de-partilha-de-carro-eletrico-e-lancado-no-recife.shtml. Last accessed in June, 2015
EC. 2010. “Overview of energy efficiency measures of European Industry.” IP/A/ITRE/NT/2010-08. Available at: http://www.lbst.de/ressources/docs2010/EP-05_Energy-Efficiency-Industry_DEC2010_PE-451-483.pdf.
EcoEquity and the Stockholm Environment Institute. “The Climate Equity Reference Calculator.” Available at: http://gdrights.org/calculator-about/.
Eletrobrás. 2013. “Potencial Hidrelétrico Brasileiro por Bacia Hidrográfica.”Available at: http://www.eletrobras.com/elb/data/Pages/LUMIS21D128D3PTBRIE.htm.
WRI.org 68
Embarq Brasil. 2015. “São Paulo: pesquisa aponta aumento da satisfação com o transporte na cidade.” Available at: http://embarqbrasil.org/noticia/s%C3%A3o-paulo-pesquisa-aponta-aumento-da-satisfa%C3%A7%C3%A3o-com-o-transporte-na-cidade#sthash.xLQvKpyL.dpuf.
EMBRAER - Empresa Brasileira de Aeronáutica S.A. 2012. “Gases de efeito estufa.” Relatório anual 2012. Available at: http://www.relatoweb.com.br/embraer/12/pt-br/construimos-um-futuro-sustentavel/responsabilidade-ambiental/gases-de-efeito-estufa#.VIw4yyvF_AY
EPE. 2008. “Considerações sobre repotenciação e modernização de usinas hidrelétricas.” Série Recursos Energéticos. Nota Técnica DEN 03/08. Ministério de Minas e Energia e Empresa de Pesquisa Energética. Available at: http://www.epe.gov.br/mercado/Documents/S%C3%A9rie%20Estudos%20de%20Energia/20081201_1.pdf.
EPE. 2008. “Plano Nacional de Energia 2030.” Available at: http://www.epe.gov.br/PNE/Forms/Empreendimento.aspx.
EPE. 2010. “Plano Decenal de Expansão de Energia.” 2019. Available at: http://www.epe.gov.br/PDEE/20101129_1.pdf.
EPE. 2011a. “Plano Decenal de Energia, PDEE 2021.” Empresa de Pesquisa Energética/ Ministério de Energia e Minas, Brasília. Available at: http://www.epe.gov.br/PDEE/20130326_1.pdf.
EPE. 2011b. “Plano Decenal de Expansão de Energia 2020.” Available at: http://www.epe.gov.br/PDEE/20120302_1.pdf.
EPE. 2011c. “Projeto da usina hidrelétrica de Belo Monte: fatos e dados.” Empresa de Pesquisa Energética. Available at: http://www.epe.gov.br/leiloes/Documents/Leil%C3%A3o%20Belo%20Monte/Belo%20Monte%20-%20Fatos%20e%20Dados%20-%20POR.pdf.
EPE. 2012a. “Balanço Energético Nacional 2012 – Ano base 2011: Resultados Preliminares.” Available at: https://ben.epe.gov.br/downloads/Resultados_Pre_BEN_2012.pdf.
EPE. 2012b. “Avaliação da eficiência energética para os próximos 10 anos (2012-2021).” Nota Técnica DEA 16/12. Available at: http://www.epe.gov.br/mercado/Documents/S%C3%A9rie%20Estudos%20de%20Energia/20121221_1.pdf.
EPE. 2013a. “O Leilão de Energia A-3.” Available at: http://www.epe.gov.br/imprensa/PressReleases/20131118_1.pdf.
EPE. 2013b. “Plano Decenal de Expansão de Energia 2022 – Consolidação dos resultados.” Plano Decenal de Expansão de Energia 2022. Ministério de Minas e Energia, Empresa de Pesquisa Energética.
EPE. 2013c. “Termo de Referência (TDR) para elaboração do PNE 2050.” Nota Técnica DEA05/13. In Portuguese. Available at: http://www.epe.gov.br/Estudos/Paginas/Plano%20Nacional%20de%20Energia%20%E2%80%93%20PNE/EPEdisponibilizaoTermodeRefer%C3%AAnciadoPlanoNacionaldeEnergia%E2%80%93PNE2050.aspx.
Ernst & Young. 2012. “Renewable energy country attractiveness indices.” November 2012. Issue 35. Available at: http://www.ey.com/Publication/vwLUAssets/CAI_issue-35_Nov-2012/$FILE/CAI_issue-35_Nov-2012_DE0372.pdf.
EUR-LEX. Council and Commission Decision 98/181/EC, ECSC, Euratom of 23 September 1997 on the conclusion, by the European Communities, of the Energy Charter Treaty and the Energy Charter Protocol on energy efficiency and related environmental aspects.
Fattouh, B., C.S. Oliveira, A. Sen. 2015. “Gasoline and Diesel Pricing Reforms in the BRIC Countries: A Comparison of Policy and Outcomes.” Oxford Institute for Energy Studies. Available at: http://www.oxfordenergy.org/wpcms/wp-content/uploads/2015/01/WPM-57.pdf.
Fialho, F. 2010. “O Transporte Hidroviário como Solução Logística e Ambiental. XVIII Encontro sobre o Corredor Centro Norte e a Hidrovia do Parnaíba.” Available at: http://www.antaq.gov.br/portal/pdf/palestras/ANTAQ2010Mar11DGFialhoXVIIIEncontrosobreoCorredorCentro NorteHidroviaParnaiba.pdf.
Goldemberg, J. 2012. “Brasil deve cortar subsídio à gasolina.” Globo G1. Available at: http://g1.globo.com/natureza/noticia/2012/01/brasil-deve-cortar-subsidio-da-gasolina-diz-pesquisador-da-usp.html Last accessed in June, 2015.
Goldemberg, J. and S.T. Coelho. 2004. “Renewable energy: traditional biomass versus modern biomass.” Energy Policy 32: 711–714.
Goldemberg, J. and O. Lucon. 2008. “Energia, Meio Ambiente & Desenvolvimento.” Editora da Universidade de São Paulo. 3rd. São Paulo.
Goldemberg, J. 2008. “The Brazilian biofuels industry.” Biotechnology for Biofuels 1 (6): 4096.
Goldemberg, J., P.M. Guardabassi. 2012. “Climate change and ‘historical responsibilities.’” Ambiente & Sociedade XV (1).
Gomes, I. 2014. “Brazil: Country of the future or has its time come for natural gas?” Oxford, U.K.: Oxford Institute for Energy Studies. Available at: http://www.oxfordenergy.org/wpcms/wp-content/uploads/2014/07/NG-88.pdf.
Greenpeace. 2013. “[R]Evolução Energética.” Cenário Brasileiro. Available at: http://www.greenpeace.org/brasil/Global/brasil/image/2013/Agosto/Revolucao_Energetica.pdf.
Henriques, Jr., M.F. 2010. “Potencial de redução de emissão de gases de efeito estufa pelo uso de energia no setor industrial brasileiro.” PhD Thesis. COPPE-UFRJ, Rio de Janeiro. Available at: http://www.ppe.ufrj.br/ppe/production/tesis/mauricio_junior.pdf.
Hino, T. and A. Lejeune. 2012. “Pumped Storage Hydropower Developments.” Reference Module in Earth Systems and Environmental Sciences Comprehensive Renewable Energy: 405–434.
Höhne, N. and J. Harnisch. 2002. “Evaluating indicators for the relative responsibility for climate change: alternatives to the Brazilian proposal and global warming potentials.” Third International Symposium on Non-CO
2 Greenhouse Gases (NCGG-
3). Maastricht, The Netherlands, 21-23 January. Available at: http://unfccc.int/resource/brazil/results/ecofys/hoheif_24Jan.pdf.
69Bridging the Gap Between Energy and Climate Policies in Brazil
Höhne, N. and S. Moltmann. 2009. “Sharing the effort under a global carbon budget.” Cologne: Ecofys and WWF International. Available at: http://www.ecofys.com/en/publication/sharing-the-effort-under-a-global-carbon-budget/.
Höhne, N., J. Penner, M. Prather, J. Fuglestvedt, J. Lowe, and G. Hu. 2007. “Summary report of the ad-hoc group for the modelling and assessment of contributions to climate change (MATCH).” Ecofys. Available at: http://www.match-info.net/data/MATCH%20summary%20report.pdf.
Horta Nogueira, L.A. and J.C. Costa. 2012. “Opções tecnológicas em energia: uma visão brasileira.” Fundação Brasileira para o Desenvolvimento Sustentável – FBDS, Rio de Janeiro. www.fbds.org.br.
Horta Nogueira, L.A. and R.S. Capaz. 2013. “Biofuels in Brazil: evolution, achievements and perspectives on food security.” Global Food Security 2 (2): 117-125.
Hunt, D., M. Freitas, and A. Pereira Jr. 2014. “Enhanced-Pumped-Storage: Combining pumped-storage in a yearly storage cycle with dams in cascade in Brazil.” Energy 78: 513–523.
IAB. 2013. “Estatísticas.” Instituto Aço Brasil. Available at: http://www.acobrasil.org.br/site/portugues/numeros/estatisticas.asp?par=201212.
IAEA. 2005. “Energy indicators for sustainable development : guidelines and methodologies.” Vienna: International Atomic Energy Agency: ISBN 92–0–116204–9.
IAEA. 2006. “Brazil: A Country Profile on Sustainable Energy Development.” Vienna: International Atomic Energy Agency.
IBAMA. 2011. “Monitoramento dos Sistemas Brasileiros – Cerrado.” Available at: http://siscom.ibama.gov.br/monitorabiomas/cerrado/APRESENTACAO_cerrado_2010.pdf.
ICCT. 2012. “Global Transportation Energy and Climate Roadmap.” International Council on Clean Transportation. Available at: http://www.theicct.org/sites/default/files/publications/ICCT%20Roadmap%20Energy%20Report.pdf
IDDRI. Brazil: 2012. “Curbing forests emissions and anticipating energy issues.” Emilio La Rovere (CentroClima/COPPE/UFRJ), Marcelo Poppe (CGEE) n°07/12 April 2012.
IEA. 2007. “Tracking Industrial Energy Efficiency and CO2
Emissions.” Paris, France: International Energy Agency.
IEA. 2010b. “The transition to modern energy services.” World Energy Outlook 2010. Paris, France: International Energy Agency. www.worldenergyoutlook.org/energy_services.asp.
IEA. 2012a. “Energy Balances of Non-OECD Countries.” Paris, France: International Energy Agency. Available at: http://www.iea.org/W/bookshop/add.aspx?id=612.
IEA. 2012a. “Key World Energy Statistics.” Paris, France: International Energy Agency.
IEA. 2012b. “Energy Technology Perspectives.” Paris, France: International Energy Agency. www.iea.org/etp.
IEA. 2012b. “World Energy Outlook.” Paris, France: International Energy Agency.
IEA. 2013. “Energy Technology Perspectives 2012.” Paris, France: International Energy Agency. www.iea.org/etp.
IEA. 2013. “Energy Statistics for Balances.” Paris, France: International Energy Agency. Available at: http://www.iea.org/stats/prodresult.asp?PRODUCT=Balances.
IEA. 2013b. “World Energy Outlook 2013 Edition.” Paris, France: International Energy Agency.
IEA. 2013c. “World Energy Outlook Special Report 2013: Redrawing the Energy Climate Map.” Paris, France: International Energy Agency. Available at: http://www.iea.org/publications/freepublications/publication/WEO_Special_Report_2013_Redrawing_the_Energy_Climate_Map.pdf.
IEA. 2014. “Tracking clean energy progress.” 5th Clean Energy Ministerial. Korea, 2014 OECD/IEA.
IIASA. 2012. “Global Energy Assessment: Toward a Sustainable Future.” International Institute for Applied Systems Analysis. Cambridge, U.K.: Cambridge University Press.
IISD. 2012. “Summary of the Doha Climate Change Conference: 26 Nov–8 Dec.” Earth Negotiations Bulletin 12 (567). Winnipeg, Canada: International Institute for Sustainable Development. Available at: http://www.iisd.ca/download/pdf/enb12567e.pdf.
IISD. 2013. “Summary of the Bonn Climate Change Conference: 29 April–3 May 2013.” Earth Negotiations Bulletin. 12 (568). International Institute for Sustainable Development. http://www.iisd.ca/download/pdf/enb12568e.pdf.
IMF. 2015. “World Economic Outlook.” Available at: http://www.imf.org/external/pubs/ft/weo/2015/update/02/pdf/0715.pdf.
INPE/PRODES. 2014. “Satellite monitoring of the Amazon Forest.” Available at: http://www.obt.inpe.br/prodes/index.php.
Instituto Ethos. “Precificação do carbono: futurologia ou realidade?” Observatório de Políticas Públicas de Mudanças Climáticas do Fórum Clima, 2015.
IPCC. 1990. “Climate Change: The IPCC Scientific Assessment.” Report prepared for the Intergovernmental Panel on Climate Change by Working Group I. Cambridge, U.K., New York, NY, U.S.A. and Melbourne, Australia: Cambridge University Press. Available at: http://www.ipcc.ch/publications_and_data/publications_ipcc_first_assessment_1990_wg1.shtml#.UaNWMcpz7Us.
IPCC. 2006. “Guidelines for National Greenhouse Gas Inventories.” International Panel on Climate Change. [(Eds.: Eggleston, H.S., L. Buendia, K. Miwa, T. Ngara, K. Tanabe.] Prepared by the National Greenhouse Gas Inventories Programme, Tokyo.
IPCC. 2011. “Special Report on Renewable Energy Sources and Climate Change Mitigation.” International Panel on Climate Change, [Eds.: Edenhofer, O., R. Pichs-Madruga, Y. Sokona, K. Seyboth, P. Matschoss, S. Kadner, T. Zwickel, P. Eickemeier, G. Hansen, S. Schlömer, C. von Stechow].
WRI.org 70
IPCC. 2013. “Climate Change 2013: The Physical Science Basis. Summary for Policymakers.” Working Group I Contribution to the IPCC Fifth Assessment Report.
IPEA. 2012.) “Biodiesel no Brasil: desafios das políticas públicas para a dinamização da produção.” Instituto de Pesquisa Econômica Aplicada. Comunicado 137.
IPEA. 2012. “O papel das compras públicas sustentáveis na economia verde.” Available at: http://www.ipea.gov.br/desafios/index.php?option=com_content&id=2746:catid=28&Itemid=23. Last accessed in June, 2015.
ISA sd. Belo Monte. Instituto Socioambiental. http://www.socioambiental.org/esp/bm/hist.asp
Jannuzzi, G.M., A. Romeiro, C. Melo, F. Piacente, G. Esteves, H. Xavier Jr, R. Gomes. 2007. “Agenda Elétrica Sustentável 2020: Estudo de cenários para um setor elétrico brasileiro eficiente, seguro e competitivo.” Brasilia, Brazil: WWF-Brasil. Série Técnica.
Johnson, F. and S. Silveira. 2014. “Pioneer countries in the transition to alternative transport fuels: Comparison of ethanol programmes and policies in Brazil, Malawi and Sweden.” Environmental Innovation and Societal Transitions 11: 1–24.
Jornal Economia. “Air conditioning is the new enemy of energy distributors.” Available at http://economia.ig.com.br/empresas/2014-01-21/ar-condicionado-e-o-novo-vilao-das-distribuidoras-de-energia.html. Last accessed in January, 2015.
Kanitkar, T., T. Jayaraman, M. D’Souza, P. Purkayastha. 2013. “Carbon budgets for climate change mitigation: a GAMS-based emissions model.” Current Science 104, (9).
Kanitkar, T., T. Jayaraman, M. D’Souza, M. Sanwal, P. Purkayastha, R. Talwar, D. Raghunandan. 2010. “Global Carbon Budgets and Burden Sharing in Mitigation Actions.” Conference on Global Carbon Budgets and Equity in Climate Change 28-29 June. Mumbai, India: Tata Institute of Social Sciences. Available at: http://www.moef.nic.in/sites/default/files/tiss-conference-cc-2010.pdf.
Kaya, Y. and K. Yoboroki. 1993. “Environment, Energy, and Economy: strategies for sustainability.” Conference on Global Environment, Energy, and Economic Development, Tokyo.
Ketzer, J.M., J.A. Villwock, G. Caporale, L.H. Rocha, G. Rockett, H. Braum, L. Giraffa. 2007. “Opportunities for CO
2 Capture and
Geological Storage in Brazil: The CARBMAP Project.” Carbon Capture & Sequestration. Sixth Annual Conference on CCS outside the U.S. Pittsburgh. http://www.netl.doe.gov/publications/proceedings/07/carbon-seq/data/papers/wed_025.pdf
Ketzer, J. and M. Medina. “Sequestro de carbono-empenhado no futuro.” Revista Brasileira Bioenergia. ISSN 1677-3926. CENBIO/IEE/USP. Ano 5. No 10, 2011.
Kwon and Østergaard. 2012. “Comparison of future energy scenarios for Denmark.” IDA 2050. CEESA (Coherent Energy and Environmental System Analysis), and Climate Commission 2050. ISSN 0360-5442
La Rovere, et al. 2013. “Brazil beyond 2020: from deforestation to the energy challenge.” Climate Policy 13 Supp.1: 70–86.
La Rovere, E. and M. Poppe. 2012. “Brazil: Curbing forests emissions and anticipating energy issues.” IDDRI Working Paper 07 (12). Institut du développement durable et des relations internationals. Available at: http://www.iddri.org/Publications/Collections/Idees-pour-le-debat/WP0712_LP_BRAZIL.pdf.
Lampreia et al. 2011. 2011. “Analyses and perspectives for Brazilian low carbon technological development in the energy sector.” Renewable and Sustainable Energy Reviews 15: 3432–3444.
Lang, M. and L. Mutschler. 2012. “Smart Grid Pilot Projects in Germany – First Project Completed.” German Energy Blog. Available at: http://www.germanenergyblog.de/?p=11635.
Letschert, V., L.B. Desroches, J. Ke, and M. McNeil. 2012. “Estimate of Technical Potential for Minimum Efficiency Performance Standards in 13 Major World Economies.” LBNL-5724E. Ernest Orlando Lawrence Berkeley National Laboratory. Available at: http://ies.lbl.gov/node/476.
Levin, K. and J. Finnegan. 2011. “Assessing Non-Annex I Pledges: Building a Case for Clarification.” WRI Working Paper. Washington, D.C.: World Resources Institute: 8. Available at: http://www.wri.org/sites/default/files/assessing_non_annex_I_pledges.pdf.
Lodi, C. 2011. “Perspectivas para a Geração de Energia Elétrica no Brasil Utilizando a Tecnologia Solar Térmica Concentrada.” Rio de Janeiro, Brazil: UFRJ/COPPE. Available at: http://www.ppe.ufrj.br/ppe/production/tesis/cristiane_lodi.pdf.
Lucena, A.F.P., A. Szklo, R. De Gouvello, R.R. Souza, B.S.M.C. Borba, I.V.L. Costa, A. Pereira Jr and S.H.F. Cunha. 2009. “The vulnerability of renewable energy to climate change in Brazil.” Energy Policy 37: 879–889.
Lucena, A.F.P. et al. 2015. “Climate policy scenarios in Brazil: A multi-model comparison for energy.” Energy Economics.
Lucon, O. and S. Coelho. 2002. “Depois da Rio +10: as lições aprendidas em Johannesburgo.” Revista do Departamento de Geografia 15: 11–18. Available at: http://www.geografia.fflch.usp.br/publicacoes/RDG/RDG_15/11-18.pdf.
Lucon, O., V. Romeiro, and S. Pacca 2013. “Reflections on the international climate change negotiations: a synthesis of a working group on carbon emission policy and regulation in Brazil.” Energy Policy 59: 938–941.
Macedo, I.C., M.R.L.V. Leal, and J.E.A.R da Silva. 2004. “Assessment of greenhouse gas emissions in the production and use of fuel ethanol in Brazil.” Government of the State of São Paulo.
Macedo, I., J.E.A. Seabra, and J.E.A.R. da Silva. 2008. “Greenhouse gases emissions in the production and use of ethanol from sugarcane in Brazil: The 2005/2006 averages and a prediction for 2020.” Biomass and Bioenergy. doi:10.1016/j.biombioe.2007.12.006
Machado Filho, H. 2008. “Options for International Support for Low-Carbon Transportation Policies in Brazil.” International support for domestic climate policies. Climate Strategies.
MAPS. 2011. “Country Study for Brazil.” Rovere E.L.L. CentroClima/PPE/COPPE/UFRJ.
71Bridging the Gap Between Energy and Climate Policies in Brazil
Marcovitch, J., C.B.S. Dubeux, and S. Margulis. 2011. “The economics of climate change in Brazil: costs and opportunities.” [Technical coordinators: Margulis. S. and C.B.S. Dubeux; general coordinator: Jacques Marcovitch.] ISBN 978-85-61522-03-2 - São Paulo: FEA/USP. 84 pp.
MATCH. 2007. Ad hoc group for the modeling and assessment of contributions of climate change. http://www.match-info.net/.
Matos, M.I. and J. Goldemberg. 2012. “O código de obras como instrumento regulatório de eficiência energética em edificações residenciais: proposições para o município de São Paulo.” Programa de Pós Graduação em Energia. São Paulo, Brasil: Universidade de São Paulo.
McKinsey. 2009. “Pathways to a low-carbon economy in Brazil.”
MCT. 2009. “Inventário Brasileiro das Emissões de Gases de Efeito Estufa – valores preliminares.” Ministério de Ciência e Tecnologia. Available at: http://www.mct.gov.br/upd_blob/0207/207624.pdf.
MCTi. 2013. “Annual Greenhouse Gas emissions estimates 2013.” Available at: http://www.mct.gov.br/upd_blob/0226/226591.pdf.
MCTi. 2010. “Segundo inventário brasileiro de emissões antrópicas de gases de efeito estufa. Relatórios de referência. Emissões de dióxido de carbono por queima de combustíveis: abordagem top-down.” Economia e Energia – OSCIP. Ministério da Ciência e Tecnologia. Available at: http://www.mct.gov.br/upd_blob/0219/219523.pdf
MCTi. 2013. “Fatores Médios Anuais (em tCO2/MWh) da eletricidade produzida dentro do Sistema Interligado Nacional (SIN).” Ministério de Ciência e Tecnologia. Available at: http://www.mct.gov.br/index.php/content/view/321144.html#ancora.
Melo, C.L. et al. 2011. “The challenges on the CCGS monitoring in the development of Santos Basin Pre-salt Cluster.” Energy Proceedings 4: 3394–3398.
MMA. “Plano de Prevenção e Controle do Desmatamento na Amazônia Legal (PPCDAM).” Available at: http://www.mma.gov.br/florestas/controle-e-preven%C3%A7%C3%A3o-do-desmatamento/plano-de-a%C3%A7%C3%A3o-para-amaz%C3%B4nia-ppcdam Last accessed in July, 2015.
MMA. 2009. “Cenários para Oferta Brasileira de Mitigação de Emissões.” São Paulo, 13 de Novembro 2009. MMA MAPA MME MF MDIC MCT MRE Casa Civil. Available at: http://www.mma.gov.br/estruturas/182/_arquivos/cenarioemissoes_182.pdf e http://www.forumclima.pr.gov.br/arquivos/File/CenariosparaOfertaBrasileiradeMitiga.pdf
MMA. 2011. Grupo de Trabalho Interministerial sobre Mercado de Carbono. Available at: http://www.mma.gov.br/component/k2/item/8414-grupo-de-trabalho-interministerial-sobre-mercado-de-carbono.
MMA. 2010. “Prevenção e Controle do Desmatamento e das Queimadas no Cerrado (PPCerrado).” Available at: http://www.mma.gov.br/florestas/controle-e-preven%C3%A7%C3%A3o-do-desmatamento/plano-de-a%C3%A7%C3%A3o-para-cerrado-%E2%80%93-ppcerrado. Last accessed in July, 2015.
MMA. 2010. “Plano de Ação para Prevenção e Controle do Desmatamento e das Queimadas no Cerrado.” Available at: http://www.mma.gov.br/estruturas/201/_arquivos/ppcerrado_201.pdf.
MMA. 2011. “Plano setorial de redução de emissões da siderurgia.” Available at: http://www.mma.gov.br/estruturas/smcq_climaticas/_arquivos/plano_setorial_siderurgia___sumrio_executivo_04_11_10_141.pdf.
MMA. 2013a. “Plano Setorial de Transporte e de Mobilidade Urbana para Mitigação e Adaptação à Mudança do Clima (PSTM).” Ministério dos Transportes e Ministério das Cidades. Disponibilizado pelo Ministério de Meio Ambiente. Available at: http://www.mma.gov.br/images/arquivo/80076/Transporte.pdf.
MMA. 2013b. “Plano Setorial de Mitigação e Adaptação à Mudança do Clima para a Consolidação de uma Economia de Baixa Emissão de Carbono na Indústria de Transformação.” Available at: http://www.mma.gov.br/images/arquivo/80076/Industria.pdf.
MMA. 2014. “Governo investe pesado buscando reduzir emissões das siderúrgicas.” Available at: http://www.mma.gov.br/informma/item/9924-governo-investe-pesado-buscando-reduzir-emiss%C3%B5es-das-sider%C3%BArgicas.
MMA. 2015. “Compras sustentáveis na prática.” Available at: http://www.mma.gov.br/responsabilidade-socioambiental/a3p/eixos-tematicos/licitação-sustentável/item/9031. Last accessed in June, 2015.
MME. 2013. “National Energy Balance.” Brazilian Ministry of Mines and Energy. Available at: https://ben.epe.gov.br/downloads/S%C3%ADntese%20do%20Relat%C3%B3rio%20Final_2013_Web.pdf.
MobFloripa. 2014. “Integração entre o sistema de carro compartilhado e políticas públicas de planejamento urbano.” Available at: http://www.mobfloripa.com.br/novidades_det.php?codigo=3126. Last accessed in June, 2015.
Moöllersten, K., Y. Jinyue, and J.R. Moreira. 2003. “Potential Market Niches for Biomass Energy with CO2
Capture and storage: Opportunities for Energy Supply with Negative CO
2 Emissions.”
Biomass and Bioenergy 25 (3): 273–85. doi:10.1016/S0961-9534(03)00013-8.
Moreira, J.R. 2011. “Projeto governamental pretende fazer CCS andar no Brasil.” Revista Brasileira Bioenergia. 5 (10).
MT. 2007. “National Logistics and Transportation Plan.” Brazilian Ministry of Transport. Available at: http://www2.transportes.gov.br/bit/01-inicial/pnlt.html.
NASA. 2013. “NASA scientists react to 400 ppm carbon milestone.” National Air and Space Administration. Available at: http://climate.nasa.gov/400ppmquotes/.
Nigro, F. 2012. “Políticas e Incentivos para Redução de Consumo em Automóveis.” 2º Workshop de Tecnologia e Eficiência Energética. Poli-USP.
Nova Cana. “Desafios para o etanol brasileiro.” Available at: http://www.novacana.com/estudos/desafios-para-etanol-brasileiro-120913/. Last accessed in May, 2015.
WRI.org 72
Observatório do Clima. 2015. “Proposta do Observatório do Clima para a INDC do Brasil.” Available at: http://observatoriodoclima.eco.br/wp-content/uploads/2015/06/proposta-indc-oc.pdf.
OECD. 2011. “A Caminho do Crescimento Verde: Um Sumário para os Decisores Políticos.” Available at: http://www.oecd.org/greengrowth/48536946.pdf.
OECD. 2012. “Green growth and sustainable development.” Paris, France: Organisation for Economic Co-operation and Development. Available at: http://www.oecd.org/greengrowth/greengrowthindicators.htm. Last accessed on 13 March, 2013.
OECD. 2012. “Economic Outlook.” Available at: http://www.oecd.org/eco/outlook/economicoutlookannextables.htm.
OECD Factbook 2013. “Economic, Environmental and Social Statistics.” Available at: http://www.oecd-ilibrary.org/docserver/download/3012021ec042.pdf?expires=1363209063&id=id&accname=guest&checksum=36F79773AEF11560A0B515280640B4A6.
OECD Stat. 2013. “Green Growth Indicators: Brazil. OECD Statistics Database. Available at: http://stats.oecd.org/Index.aspx?DataSetCode=GREEN_GROWTH. Last accessed on 13 March, 2013.
OECO. 2013. “Reciclar pode ser a saída para fabricantes de alumínio.” Fabíola Ortiz. Available at: http://www.oeco.org.br/noticias/27149-reciclar-pode-ser-a-saida-para-fabricantes-de-aluminio
OESP. 2013. “Governo troca usinas eólicas por termoelétricas a carvão.” O Estado de São Paulo, 29 de abril.
ONS. 2013. Indicadores de desempenho do SIN.” Operador Nacional de Sistemas. Available at: http://www.ons.org.br/indicadores_desempenho/qualidade_operacao.aspx.
ONS. 2013b. “Volume útil dos principais reservatórios.” Available at: http://www.ons.org.br/historico/percentual_volume_util.aspx.
Pacca, S. and J.R. Moreira. 2009. “Historical carbon budget of the Brazilian ethanol program.” Energy Policy. 37 (1).
Pao, Hsiao-Tien; Fu Hsin-Chia. 2013. “Renewable energy, non-renewable energy and economic growth in Brazil.” Renewable and Sustainable Energy Reviews 25: 381–392.
Pereira, R. 2013. “Orçado em R$ 16 bilhões, custo da Usina de Belo Monte já supera os R$ 30 bilhões.” O Estado de S. Paulo, 11 May. http://economia.estadao.com.br/noticias/economia-geral,orcado-em-r-16-bilhoes-custo-da-usina-de-belo-monte-ja-supera-os-r-30-bilhoes,153398,0.htm.
Pereira, C., R. Lambert, and E. Ghisi. 2013. “Technical note on the minimum requirements for energy efficiency of air conditioning equipment in Brazil.” UFSC CB3E.
Petrobras. 2012. Environmental Impact Assessment and Environmental Impact Report (EIA-EIR - Phase I). “Integrated Projects for Oil and Gas in the Pre-Salt Fields, Santos Basin.” Brazilian National Oil and Gas Company. Available at: http://licenciamento.ibama.gov.br/Petroleo/Atividade%20de%20Produ%C3%A7%C3%A3o%20e%20Escoamento%20de%20Petr%C3%B3leo%20e%20G%C3%A1s%20Natural%20do%20
Polo%20Pr%C3%A9-Sal%20da%20Bacia%20de%20Santos%20-%20Etapa%201/028125-EIA-CP-0001-02.pdf.
Pimenta, F. and A. Assireu. 2015.“Simulating reservoir storage for a wind-hydro hydrid system.” Renewable Energy 76: 757–767.
Portal Brasil. 2009. “Agências Reguladoras.” Available at: http://www.brasil.gov.br/governo/2009/11/agencias-reguladoras.
Portal Brasil. 2012. “Compra de produtos sustentáveis.” Available at: http://www.brasil.gov.br/governo/2012/05/compra-de-produtos-sustentaveis-ate-marco-ja-superam-em-83-o-ano-de-2011. Last accessed in June, 2015.
Ribas, R.P. 2013. “CO2 emissions from the energy sector in the
context of the National Policy on Climate Change.” Rio de Janeiro: Ph.D. Dissertation-UFRJ/COPPE.
Ricosti, J. and I. Sauer. 2013. “An assessment of wind power prospects in the Brazilian hydrothermal system.” Renewable and Sustainable Energy Review 3 (19): 742–753.
Rockström, J. et al. 2009. “A safe operating space for humanity.” Nature 461: 472–475.
Romeiro, V. 2014. “Carbon capture and storage legal and regulatory framework in developing countries: Proposals for Brazil.” USP, IEE São Paulo. 192 f.: il.; 30 cm.
Ryan, M.G., M.E. Harmon, R.A. Birdsey, C.P. Giardina, L.S. Heath, R.A. Houghton, R.B. Jackson, D.C. McKinley, J.F. Morrison, B.C. Murray, D.E. Pataki, and K.E. Skog. 2010. “A Synthesis of the Science on Forests and Carbon for U.S. Forests.” Issues in Ecology 13. Ecological Society of America. http://www.extension.org/mediawiki/files/3/3b/Ryan_et_al_2010.pdf.
SAE. 2013. “IPEA revela que 3,5 milhões saíram da pobreza em 2012.” Portal Brasil, em 01.10.2013. Secretaria de Estudos Estratégicos, http://www.sae.gov.br/site/?p=18326.
Santos, A. and S. Kahn. 2013. “The use of sustainability indicators in urban passenger transport during the decision-making process: the case of Rio de Janeiro, Brazil.”
São Paulo. “Começa a circular em São Paulo ônibus movido a etanol.” Available at: http://www.saopaulo.sp.gov.br/spnoticias/lenoticia.php?id=90442. Last accessed in May, 2015.
Scalambrini Costa, H. 2013. “Energia solar: sem incentivo não há esperança.” Ecoagencia. Available at: http://www.ecoagencia.com.br/inc_imprimir_artigo.php?id===AUUJlcV5mTHNlRaNVTWJVU.
Schaeffer, R. et al. 2012a. “Energy-related climate change mitigation in Brazil: Potential, abatement costs and associated policies.” Energy Policy 49: 430–441.
Schaeffer, R. et al. 2012b. “Energia e Economia Verde: Cenários Futuros e Políticas Públicas.” Fundação Brasileira para o Desenvolvimento Sustentável (FBDS). Rio de Janeiro. www.fbds.org.br.
Searchinger, T. and R. Heimlich. 2015. “Avoiding Bioenergy Competition for Food Crops and Land: Creating a Sustainable Food Future.” Working Paper, Installment Nine. Washington, D.C.: World Resources Institute.
73Bridging the Gap Between Energy and Climate Policies in Brazil
SEEG. 2014. “Sistema de Estimativa de Emissões de Gases de Efeito Estufa.” Available at: http://seeg.observatoriodoclima.eco.br/index.php/emissions/index/sector/.
Seroa da Motta, R.S. 2012. “Economia verde para o desenvolvimento sustentável. Fundamentos econômicos da sustentabilidade e políticas de transição rumo à economia verde.” Centro de Gestão e Estudos Estratégicos. http://www.cgee.org.br/publicacoes/economia_verde.php.
Shaheen et al. 2015. “Carsharing and CO2.” Berkeley, CA, U.S.A.
University of California, Berkeley. Available at: http://tsrc.berkeley.edu/CarsharingandCO2.
Shapouri, H., J.A. Duffield, and M. Wang. “The Energy Balance of Corn Ethanol: An Update.” Agricultural Economic Report 813. U.S. Department of Agriculture, Office of the Chief Economist, Office of Energy Policy and New Uses.
Silva, C.F.A., O.C. Ferreira, O.Y.M. Guidicini, F. Eidelman, R.L. Macedo, and L. Deppe. 2010. “Segundo inventário brasileiro de emissões antrópicas de gases de efeito estufa. Relatórios de referência: Emissões de dióxido de carbono por queima de combustíveis: abordagem bottom-up.” Ministério de Ciência e Tecnologia. http://www.mct.gov.br/upd_blob/0219/219295.pdf.
Silva, R.M. 2015. “Energia Solar no Brasil: dos incentivos aos desafios.” Brasília: Núcleo de Estudos e Pesquisas/CONLEG/Senado. Fevereiro. Available at: http://www12.senado.gov.br/publicacoes/estudos-legislativos/tipos-de-estudos/textos-para-discussao/td166.
Soito, J.L.d.S. and M.A.V. Freitas. 2011. “Amazon and the expansion of hydropower in Brazil: vulnerability, impacts and possibilities for adaptation to global climate change.” Renewable and Sustainable Energy Reviews 15: 3165–3177.
Sousa, E.L., E. Farina, and L. Rodrigues. 2013. “A política de petróleo e a indústria de etanol no Brasil.” Interesse Nacional 6 (22): 64–75. Available at: http://interessenacional.uol.com.br/index.php/edicoes-revista/a-politica-de-petroleo-e-a-industria-de-etanol-no-brasil/.
Souto, P. 2012. “A assimetria das obrigações entre os entes da Federação.” Liberdade e Cidadania IV (16) abril/junho. http://www.flc.org.br/revista/materias_view6219.html?id={37F99355-369B-4905-AD12-CD77D5BD3086}.
Souza, K.T., L.S. Miranda, and M.A. Silva. 2010. “Aquecimento de água através do uso de coletores planos.” Revista de divulgação do Projeto Universidade Petrobras e IF Fluminense 1: 51-57. Available at: http://www.essentiaeditora.iff.edu.br/index.php/BolsistaDeValor/article/viewFile/1792/970
Souza, G.M., R. Victoria, C. Joly, and L. Verdade. (Eds.). 2015. “Bioenergy & Sustainability: Bridging the gaps.” Vol. 72: 779. Paris: SCOPE. ISBN 978-2-9545557-0-6.
Stocco, L.Z. 2013. “Soluções sustentáveis para o transporte público no Brasil.” 2013. Ambiente legal. Available at: http://www.ambientelegal.com.br/solucoes-sustentaveis-para-o-transporte-publico-no-brasil/#sthash.hFAvqoHB.dpuf. Last accessed in June, 2015
Strack, D. and A.F.Z. Azevedo. 2012. “A doença holandesa no brasil: sintomas e efeitos.” Revista Economia e Desenvolvimento. 24 (2): 68. http://cascavel.ufsm.br/revistas/ojs-2.2.2/index.php/eed/article/view/6432/pdf.
The City Fix Brazil. “Cidade brasileira cria vaga exclusiva para car-share.” Available at: http://thecityfixbrasil.com/2015/06/04/cidade-brasileira-cria-vaga-exclusiva-para-car-share/#sthash.C7uSYW7E.dpuf. Last accessed in June, 2015.
The Economist. “Dams in the Amazon: The rights and wrongs of Belo Monte.” 4 May, 2013.
Tyner, W.E.; and F. Taheripour. 2013. “Land-Use Changes and CO2
Emissions Due to U.S. Corn Ethanol Production.” Encyclopedia of Biodiversity (Second Edition): 539–554.
UBRABIO. 2014. União Brasileira de Biodiesel e Bioquerosene. Representantes do setor de biocombustíveis promovem parceria com o Governo Federal. Available at: http://www.ubrabio.com.br/1891/noticias/representantesdosetordebiocombustiveispromov emparceria_232587/.
UN (United Nations). 1987. “Our Common Future.” Report of the World Commission on Environment and Development: Available at: http://www.un-documents.net/wced-ocf.htm.
UN. 2011. “A United Nations System-wide Perspective.” New York, NY, U.S.A.: United Nations. Available at: http://www.fao.org/fileadmin/user_upload/suistainability/pdf/GreenEconomy-Full.pdf.
UN. 2012. “The future we want.” Resolution adopted by the General Assembly 66/288. http://daccess-dds-ny.un.org/doc/UNDOC/GEN/N11/476/10/PDF/N1147610.pdf?OpenElement.
UNCED. 1997. “United Nations Conference on Environment and Development.” http://www.un.org/geninfo/bp/enviro.html.
UNDESA. 2001. “Indicators of Sustainable Development: Guidelines and Methodologies.” 2nd edition. New York, NY, U.S.A.: United Nations Department of Economic and Social Affairs.
UNDESA. 2013. :Sustainable Development Goals.” United Nations Department of Economic and Social Affairs. http://sustainabledevelopment.un.org/index.php?menu=1300.
UNDESA. 2013a. “MDG Gap Task Force.” United Nations Department of Economic and Social Affairs. http://www.un.org/en/development/desa/policy/mdg_gap/index.shtml.
UNDESA. 2013b. “Sustainable Development Knowledge Platform.” http://sustainabledevelopment.un.org/.
UNDP. 2011. “Green Economy Report.” New York, NY. U.S.A.: United Nations Development Programme.
UNDP. 2012. “Desenvolvimento Humano e IDH.” Programa das Nações Unidas para o Desenvolvimento. http://www.pnud.org.br/IDH/DH.aspx.
UNDP. 2013. “Human Development Index tables.” Available at: http://hdr.undp.org.
WRI.org 74
UNEP. “The green steel revolution: replacing fossil fuels in steel production.” New York, NY, U.S.A.: United Nations Environment Programme. http://www.unep.org/forests/Portals/142/docs/our_vision/Green_Steel.pdf.
UNFCCC. 2009. “Copenhagen Accord.” (Decision-/CP.15). Available at: http://unfccc.int/files/meetings/cop_15/application/pdf/cop15_cph_auv.pdf.
UNFCCC. 2011a. “Durban Platform for Enhanced Action.” Available at: https://unfccc.int/files/meetings/durban_nov_2011/decisions/application/pdf/cop17_durbanplatform.pdf.
UNFCCC. 2010. Decision /CMP.6 “Carbon dioxide capture and storage in geological formations as clean development mechanism project activities.” Available at: http://unfccc.int/files/meetings/cop_16/application/pdf/cop16_cmp_ccs.pdf.
UNFCCC. 2013. “Milestones on the road to 2012: The Cancun Agreements.” http://unfccc.int/key_steps/cancun_agreements/items/6132.php.
UNFCCC. 2008. “Report of the Subsidiary Body for Scientific and Technological Advice on its twenty-eighth session.” Held in Bonn from 4 to 13 June 2008. FCCC/SBSTA/2008/6 paras. 109-113.
UNIDO. 2010. “Global Industrial Energy Efficiency Benchmarking.” An Energy Policy Tool Working Paper.” http://www.unido.org/fileadmin/user_media/Services/Energy_and_Climate_Change/Energy_Efficiency/Benchmarking_Energy_Policy_Tool.pdf
UNIDO. 2011. “International Resource Panel - Decoupling natural resources use and environmental impacts from economic growth.” http://www.oecd.org/greengrowth/Latin%20America%20and%20the%20Caribbean%20Programme_UNIDO.pdf
UNSD. 2013. “System of Environmental-Economic Accounting for Energy (SEEA-Energy).” United Nations Statistics Division. https://unstats.un.org/unsd/envaccounting/seeae/.
UNSDSN. 2015. “Indicators and a Monitoring Framework for the Sustainable Development Goals Launching a data revolution for the SDGs.” A report to the Secretary-General of the United Nations by the Leadership Council of the Sustainable Development Solutions Network.
URBS. “Projeto Biodiesel B100.” Available at: http://www.urbs.curitiba.pr.gov.br/transporte/sustentabilidade. Last accessed in May, 2015.
U.S. EPA. 2013. “Air Emissions.” United States Environmental Protection Agency. http://www.epa.gov/cleanenergy/energy-and-you/affect/air-emissions.html
U.S. Government. 2015. “U.S.-Brazil Joint Statement On Climate Change.” Washington, D.C.: The White House, Office of the Press Secretary. Available at https://www.whitehouse.gov/the-press-office/2015/06/30/us-brazil-joint-statement-climate-change
Walter, A. et al. 2011. “Sustainability assessment of bio-ethanol production in Brazil considering land use change, GHG emissions and socio-economic aspects.” Energy Policy. Volume 39, Issue 10: 5703–5716.
WEC. 2013. “World Energy Trilemma: 2013 Energy Sustainability Index.” World Energy Council. http://www.worldenergy.org/wp-content/uploads/2013/09/2013-Energy-Sustainability-Index-VOL-2.pdf.
World Bank. 2014a. “States and trends of carbon pricing.” Washington, D.C.: World Bank Group - Climate Change.
World Bank. 2014b. "World Development Indicators." Washington, D.C.: World Bank Group. Available at: http://data.worldbank.org/data-catalog/world-development-indicators.
World Energy Council. 2013. “World Energy Perspective: Cost of Energy Technologies.” Available at: worldenergy.org/wp-content/uploads/2013/09/WEC_J1143_CostofTECHNOLOGIES_021013_WEB_Final.pdf Last accessed in June, 2015.
Worrel, E., L. Price, M. Neelis, C. Galitsky, Z. Nan. 2008. “World Best Practice Energy Intensity Values for Selected Industrial Sectors.” REV. 2. Ernest Orlando Lawrence Berkeley National Laboratory, Environmental Energy Technologies Division, Report LBNL-62806. Available at: http://ies.lbl.gov/drupal.files/ies.lbl.gov.sandbox/62806.pdf.
WRI (World Resources Institute). 2012. “Greenhouse Gas Protocol Mitigation Goal Standard.” Washington, D.C.: WRI.
WSA. 2012. “Sustainable Steel: Policy and indicators.” World Steel Association. http://www.worldsteel.org/dms/internetDocumentList/press-release-downloads/2012/Sustainable-Steel-2012/document/Sustainable%20Steel%202012.pdf.
75Bridging the Gap Between Energy and Climate Policies in Brazil
ENDNOTES1. CO
2, CH
4, N
2O, HFCs, PFCs, and SF
6.
2. Such values are applicable for the “GHG worst case scenario,” that is, when the flex vehicle is running on Brazilian gasohol (a test-driving gasoline blended with 22 percent of anhydrous ethanol, also called E22).
3. It is estimated that the subsidy policies practiced by the gov-ernment led to a tax waiver of approximately USD 350 million per month in 2013. The value corresponds to the exemption of the Intervention Contribution in the Economic Domain (CIDE) on gasoline and diesel, according to calculations of the Brazilian Infrastructure Centre (Brasil Econômico, 2013). As of 2015, ending all subsidies for gasoline and diesel could imply savings of approximately USD 4.5 billion per year, and these savings could be used to support the broad dissemination of modern renewable energy-based systems (EBC, 2015).
4. From 8,173 PJ (peta-joules) in 2010 to a reference 17,040 PJ in 2050 or alternative 12,600 PJ in this same year.
5. These assumptions are subject to uncertainties related to future economic development in the country, which are not captured by this analysis or, to any great extent, by the official plans.
6. This is only applicable to basic oxygen furnaces.
7. The potential for increasing nuclear and hydropower was not considered, because of the need for long-term planning for nuclear plants and challenges related to environmental licenses and climate impacts on the water regimes underpinning hydropower.
8. Building-integrated photovoltaics (BIPV), though still a novelty in Brazil, gained more momentum after the recent changes in regulations for net metering (ANEEL Resolution 482 of 2012, National Council of Fiscal Policy (CONFAZ) decision to exempt electricity bidirectional flows from taxes as a way to ease the connection of small power generation plants to the grid by using renewable sources). This resolution proposed the establishment of an energy compensation system to enable the additional electricity generated in a small power plant to be released into the grid. The regulation also established that the remaining credits of electricity at the close of a contract between consumers and distributors may not be subject to any form of compensation to the consumers.
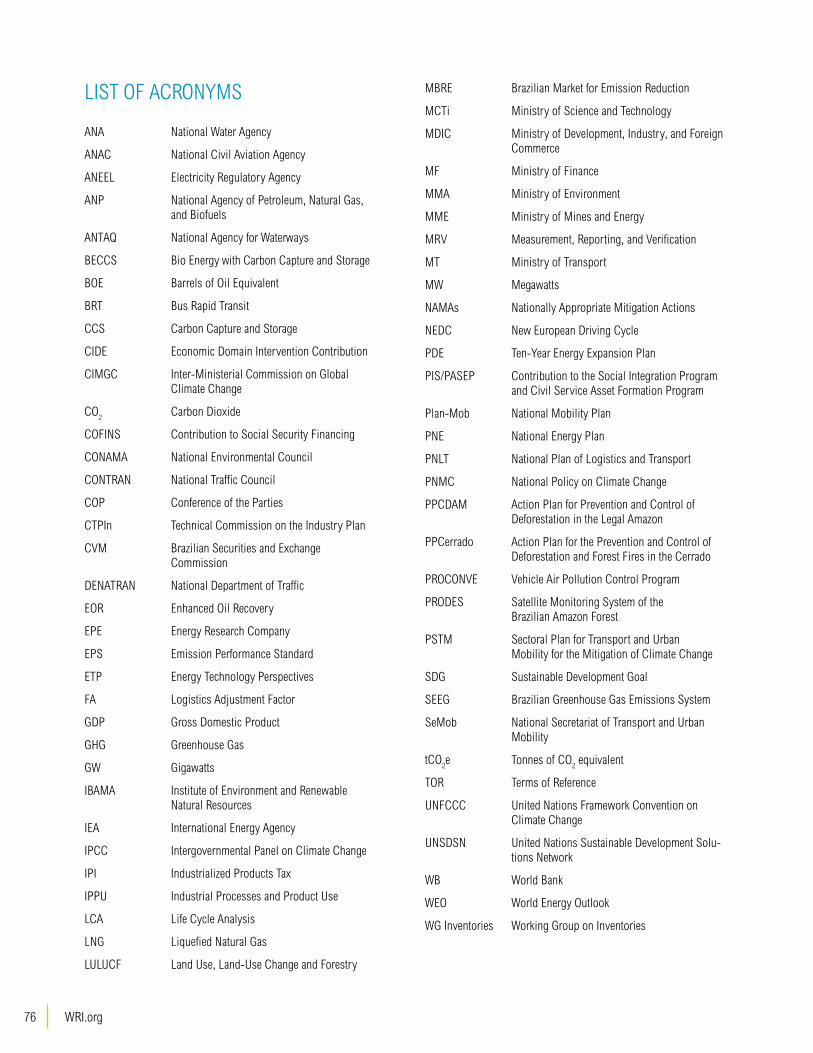
WRI.org 76
LIST OF ACRONYMS
ANA National Water Agency
ANAC National Civil Aviation Agency
ANEEL Electricity Regulatory Agency
ANP National Agency of Petroleum, Natural Gas, and Biofuels
ANTAQ National Agency for Waterways
BECCS Bio Energy with Carbon Capture and Storage
BOE Barrels of Oil Equivalent
BRT Bus Rapid Transit
CCS Carbon Capture and Storage
CIDE Economic Domain Intervention Contribution
CIMGC Inter-Ministerial Commission on Global Climate Change
CO2 Carbon Dioxide
COFINS Contribution to Social Security Financing
CONAMA National Environmental Council
CONTRAN National Traffic Council
COP Conference of the Parties
CTPIn Technical Commission on the Industry Plan
CVM Brazilian Securities and Exchange Commission
DENATRAN National Department of Traffic
EOR Enhanced Oil Recovery
EPE Energy Research Company
EPS Emission Performance Standard
ETP Energy Technology Perspectives
FA Logistics Adjustment Factor
GDP Gross Domestic Product
GHG Greenhouse Gas
GW Gigawatts
IBAMA Institute of Environment and Renewable Natural Resources
IEA International Energy Agency
IPCC Intergovernmental Panel on Climate Change
IPI Industrialized Products Tax
IPPU Industrial Processes and Product Use
LCA Life Cycle Analysis
LNG Liquefied Natural Gas
LULUCF Land Use, Land-Use Change and Forestry
MBRE Brazilian Market for Emission Reduction
MCTi Ministry of Science and Technology
MDIC Ministry of Development, Industry, and Foreign Commerce
MF Ministry of Finance
MMA Ministry of Environment
MME Ministry of Mines and Energy
MRV Measurement, Reporting, and Verification
MT Ministry of Transport
MW Megawatts
NAMAs Nationally Appropriate Mitigation Actions
NEDC New European Driving Cycle
PDE Ten-Year Energy Expansion Plan
PIS/PASEP Contribution to the Social Integration Program and Civil Service Asset Formation Program
Plan-Mob National Mobility Plan
PNE National Energy Plan
PNLT National Plan of Logistics and Transport
PNMC National Policy on Climate Change
PPCDAM Action Plan for Prevention and Control of Deforestation in the Legal Amazon
PPCerrado Action Plan for the Prevention and Control of Deforestation and Forest Fires in the Cerrado
PROCONVE Vehicle Air Pollution Control Program
PRODES Satellite Monitoring System of the Brazilian Amazon Forest
PSTM Sectoral Plan for Transport and Urban Mobility for the Mitigation of Climate Change
SDG Sustainable Development Goal
SEEG Brazilian Greenhouse Gas Emissions System
SeMob National Secretariat of Transport and Urban Mobility
tCO2e Tonnes of CO
2 equivalent
TOR Terms of Reference
UNFCCC United Nations Framework Convention on Climate Change
UNSDSN United Nations Sustainable Development Solu-tions Network
WB World Bank
WEO World Energy Outlook
WG Inventories Working Group on Inventories
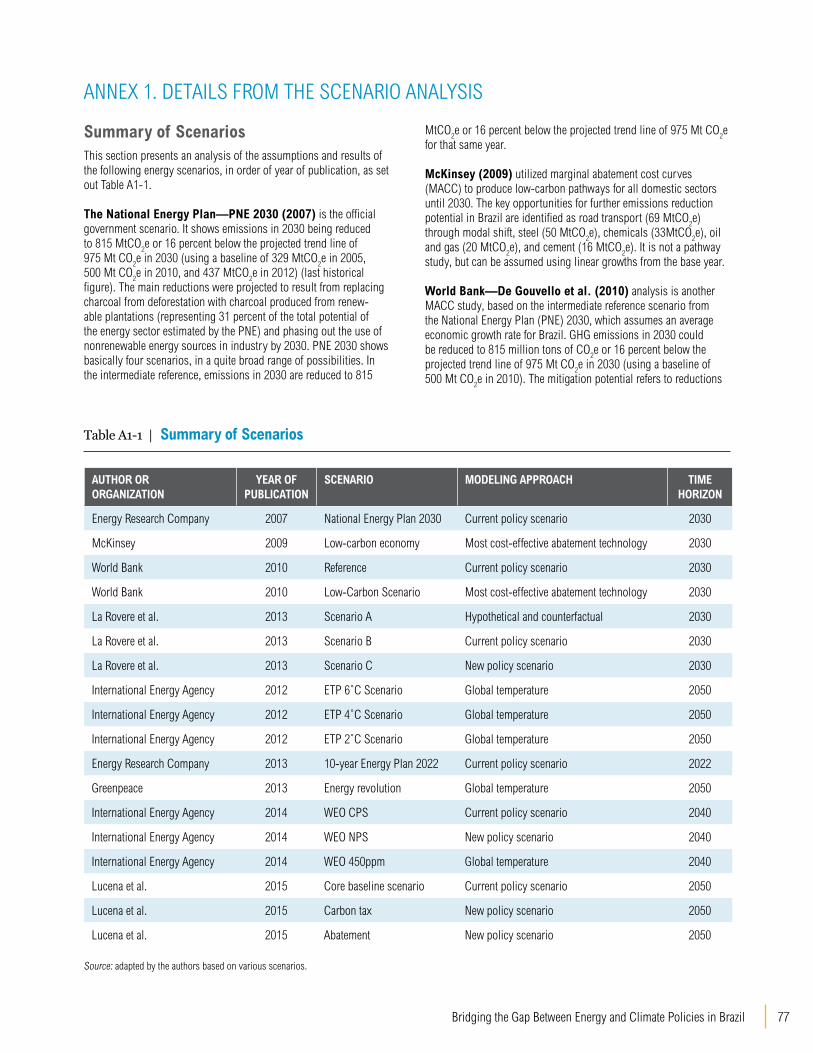
77Bridging the Gap Between Energy and Climate Policies in Brazil
Summary of Scenarios This section presents an analysis of the assumptions and results of the following energy scenarios, in order of year of publication, as set out Table A1-1.
The National Energy Plan—PNE 2030 (2007) is the official government scenario. It shows emissions in 2030 being reduced to 815 MtCO
2e or 16 percent below the projected trend line of
975 Mt CO2e in 2030 (using a baseline of 329 MtCO
2e in 2005,
500 Mt CO2e in 2010, and 437 MtCO
2e in 2012) (last historical
figure). The main reductions were projected to result from replacing charcoal from deforestation with charcoal produced from renew-able plantations (representing 31 percent of the total potential of the energy sector estimated by the PNE) and phasing out the use of nonrenewable energy sources in industry by 2030. PNE 2030 shows basically four scenarios, in a quite broad range of possibilities. In the intermediate reference, emissions in 2030 are reduced to 815
ANNEX 1. DETAILS FROM THE SCENARIO ANALYSIS
Table A1-1 | Summary of Scenarios
AUTHOR OR ORGANIZATION
YEAR OF PUBLICATION
SCENARIO MODELING APPROACH TIME HORIZON
Energy Research Company 2007 National Energy Plan 2030 Current policy scenario 2030
McKinsey 2009 Low-carbon economy Most cost-effective abatement technology 2030
World Bank 2010 Reference Current policy scenario 2030
World Bank 2010 Low-Carbon Scenario Most cost-effective abatement technology 2030
La Rovere et al. 2013 Scenario A Hypothetical and counterfactual 2030
La Rovere et al. 2013 Scenario B Current policy scenario 2030
La Rovere et al. 2013 Scenario C New policy scenario 2030
International Energy Agency 2012 ETP 6˚C Scenario Global temperature 2050
International Energy Agency 2012 ETP 4˚C Scenario Global temperature 2050
International Energy Agency 2012 ETP 2˚C Scenario Global temperature 2050
Energy Research Company 2013 10-year Energy Plan 2022 Current policy scenario 2022
Greenpeace 2013 Energy revolution Global temperature 2050
International Energy Agency 2014 WEO CPS Current policy scenario 2040
International Energy Agency 2014 WEO NPS New policy scenario 2040
International Energy Agency 2014 WEO 450ppm Global temperature 2040
Lucena et al. 2015 Core baseline scenario Current policy scenario 2050
Lucena et al. 2015 Carbon tax New policy scenario 2050
Lucena et al. 2015 Abatement New policy scenario 2050
Source: adapted by the authors based on various scenarios.
MtCO2e or 16 percent below the projected trend line of 975 Mt CO
2e
for that same year.
McKinsey (2009) utilized marginal abatement cost curves (MACC) to produce low-carbon pathways for all domestic sectors until 2030. The key opportunities for further emissions reduction potential in Brazil are identified as road transport (69 MtCO
2e)
through modal shift, steel (50 MtCO2e), chemicals (33MtCO
2e), oil
and gas (20 MtCO2e), and cement (16 MtCO
2e). It is not a pathway
study, but can be assumed using linear growths from the base year.
World Bank—De Gouvello et al. (2010) analysis is another MACC study, based on the intermediate reference scenario from the National Energy Plan (PNE) 2030, which assumes an average economic growth rate for Brazil. GHG emissions in 2030 could be reduced to 815 million tons of CO
2e or 16 percent below the
projected trend line of 975 Mt CO2e in 2030 (using a baseline of
500 Mt CO2e in 2010). The mitigation potential refers to reductions
WRI.org 78
of carbon emissions arising from the change from the Reference Scenario to a Low-Carbon Scenario (by analyzing the mitigation options not deeply considered in the PNE 2030, such as hybrid cars, carbon capture and storage, among others).
The Brazil BAU (2010) considers only implemented and adopted policies in Brazil, and adopts the annual Ten-Year Energy Plan as the sectoral plan for mitigation and adaptation in the energy sector. Pro-jected 2020 emissions (643 MtCO
2e) fall within the range pledged
by the NAMA (634–680 MtCO2e); however, projected GHG intensity
per unit GDP and per unit of energy consumed both slightly exceed 2005 levels. (Brazil’s climate policy dictates that these figures should not exceed 2005 levels.)
The Energy Technology Perspectives – ETP (2012) taskforce from the International Energy Agency (IEA) defined three scenarios for the Brazilian Energy sector, consistent with pathways leading to increased average temperatures of 2°C, 4°C, and 6°C respectively by 2100. The business-as-usual representative pathway leads to an increase in global average temperature of +6°C, while the 2°C scenario presents an emissions trajectory consistent with the IEA WEO 450 scenario, and details the new developments in energy technology necessary to achieve the objectives of limiting the global temperature rise to 2°C and enhancing energy security. The study projects that, even after compliance with the Brazilian Nationally Ap-propriated Mitigation Actions (NAMAs)—the voluntary pledges that Brazil announced in 2009 during COP15—the proposed emissions reductions would not be enough to keep within the 2°C trajectory, and would even stay above the 6°C trajectory (Figure 1).
La Rovere et al. (2013) show the energy sector as the biggest growing source of emissions for Brazil post-2020 and present projections based on existing policies and more ambitious policies. Scenario A is counterfactual and based on no further renewable energy growth, that is, it excluded any expansion of generation capacities based on renewable sources (including large hydropower plants) as of 2010. For Scenario B, the energy sources mix was taken from the 2019 Ten-Year Energy Plan (PDE 2019). The energy mix for the period 2020–2030 was determined through the evolution outlined in PNE 2030. Scenario C was constructed by including additional mitigation options not included in Scenario B, such as hybrid cars, and carbon capture and storage, among others. Advanced strategies are similar to those from the World Bank’s study.
Greenpeace (2013) considers that GHG emissions from the energy sector are 358 MtCO2
e in 2010, reach 512 MtCO2e in 2020,
then reduce to 312 mtCO2e by 2050. The scenario is based on five
premises: decentralized and integrated renewable solutions; respect for environmental impacts when building new projects; gradual phase-out of fossil fuels and nuclear power; better distribution of the use of energy and natural resources; and decoupling economic growth from consumption of fossil fuels. Such goals require many policy changes, including (i) elimination of all subsidies to fossil fuels and nuclear; (ii) internalizing socio-environmental impact costs by means of carbon taxes or social indicators; (iii) rigorous efficiency standards for appliances, vehicles, and buildings, plus
labeling schemes and awareness-raising campaigns; (iv) regulatory frameworks for new renewable-energy sources, including access to the grid; (v) feed-in tariffs and fair minimum energy-auction prices for renewables; (vi) financing R&D for renewables and efficiency.
The IEA’s World Energy Outlook WEO (2014) includes the Current Policies Scenario (CPS), which takes into account only policies and measures affecting energy markets that were formally enacted as of mid-2014. It both illustrates the consequences of inaction and makes it possible to evaluate the potential effectiveness of recent developments in energy and climate policy (IEA, 2014).
Lucena et al. (2015) is a more recent reference. Without showing pathways, it models the effects of market-based mechanisms and carbon-emission restrictions on the energy sector and compares six models under different scenarios for carbon taxes and abatement targets up to 2050. The results show an increase in GHG emissions in the baseline scenarios because of the increasing penetration of coal and natural gas. Nevertheless, climate policy scenarios indicate that high carbon taxes (roughly 50 USD/tCO
2e in 2020 rising to
162 USD/tCO2e in 2050) can lead to GHG emissions reductions of
around 60 percent. In a 2050 horizon, core baselines range from 0.9 to 1.6 Gt CO
2e. Most of the emissions after mitigation efforts
range around 0.8 Gt CO2e (Low C price); and 0.3-0.4 GtCO
2e (20%
and 50% fossil fuel abatement scenarios). Despite the many models and pathways displayed, a 40-year span cumulative emissions can be easily estimated: 14 to 24 GtCO
2e (from the 0.4 GtCO
2e in 2010
to the final values ranging 0.3-0.8 Gt CO2e in 2050). These results
corroborate the recommendations made hereafter.
According to the baseline scenarios, emissions intensities (that is, emissions per unit of GDP and per unit of energy consumed) are projected to be higher at the end of the time horizon, because of increased energy consumption as a result of population growth and increased affluence, relatively lower penetration of renewables in the energy mix (low decarbonization), and no projected increase in energy efficiency. The non-reference scenarios assume more conser-vative population and GDP growth rates than those assumed in the PNE 2030, as do the scenarios of the IEA WEO 2014 (CPS, NPS, and 450ppm), Greenpeace (2013), and IEA ETP (2°C, 4°C, and 6°C).
According to Greenpeace (2013), projections of energy demand are normally subject to three main factors: population growth, which determines the number of consumers; economic growth, for which the Gross Domestic Product (GDP) is the most common indicator; and the amount of energy required to produce one unit of GDP (measured by energy intensity indicators and price elasticity of electricity demand (Greenpeace, 2013).
Greenpeace does not support low-carbon technologies such as carbon capture and storage (CCS), and indicates that the neces-sary GHG emissions reductions will be made possible by replacing thermal-power plants with non-fossil-fuel power plants to expand energy supply. It also assumes the widespread use of biofuels and electricity for light vehicles, the reduction of fossil sources in in-dustry, strong measures on energy efficiency in all sectors, and the diffusion of technologies to store energy (Greenpeace, 2013).
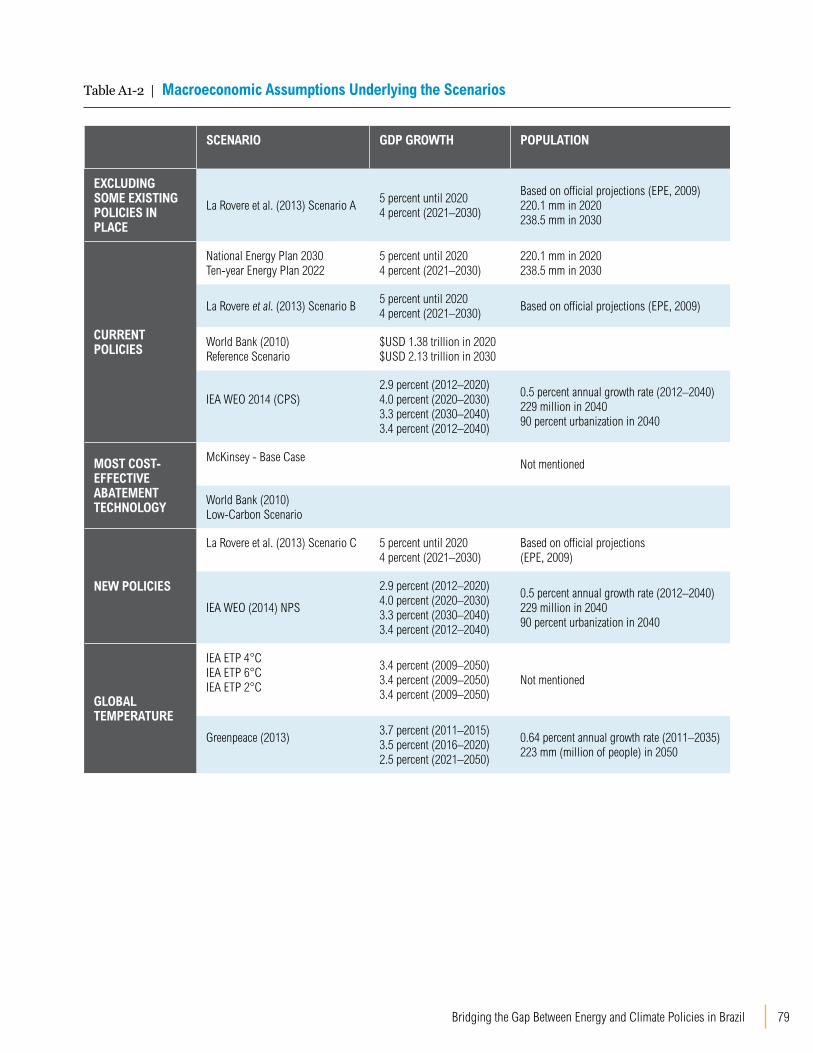
79Bridging the Gap Between Energy and Climate Policies in Brazil
Table A1-2 | Macroeconomic Assumptions Underlying the Scenarios
SCENARIO
GDP GROWTH POPULATION
EXCLUDING SOME EXISTING POLICIES IN PLACE
La Rovere et al. (2013) Scenario A5 percent until 20204 percent (2021–2030)
Based on official projections (EPE, 2009)220.1 mm in 2020238.5 mm in 2030
CURRENT POLICIES
National Energy Plan 2030Ten-year Energy Plan 2022
5 percent until 20204 percent (2021–2030)
220.1 mm in 2020238.5 mm in 2030
La Rovere et al. (2013) Scenario B5 percent until 20204 percent (2021–2030)
Based on official projections (EPE, 2009)
World Bank (2010)Reference Scenario
$USD 1.38 trillion in 2020$USD 2.13 trillion in 2030
IEA WEO 2014 (CPS)
2.9 percent (2012–2020)4.0 percent (2020–2030)3.3 percent (2030–2040)3.4 percent (2012–2040)
0.5 percent annual growth rate (2012–2040)229 million in 204090 percent urbanization in 2040
MOST COST-EFFECTIVE ABATEMENT TECHNOLOGY
McKinsey - Base Case
Not mentioned
World Bank (2010)Low-Carbon Scenario
NEW POLICIES
La Rovere et al. (2013) Scenario C
5 percent until 20204 percent (2021–2030)
Based on official projections (EPE, 2009)
IEA WEO (2014) NPS
2.9 percent (2012–2020)4.0 percent (2020–2030)3.3 percent (2030–2040)3.4 percent (2012–2040)
0.5 percent annual growth rate (2012–2040)229 million in 204090 percent urbanization in 2040
GLOBAL TEMPERATURE
IEA ETP 4°CIEA ETP 6°CIEA ETP 2°C
3.4 percent (2009–2050)3.4 percent (2009–2050)3.4 percent (2009–2050)
Not mentioned
Greenpeace (2013)
3.7 percent (2011–2015)3.5 percent (2016–2020)2.5 percent (2021–2050)
0.64 percent annual growth rate (2011–2035)223 mm (million of people) in 2050
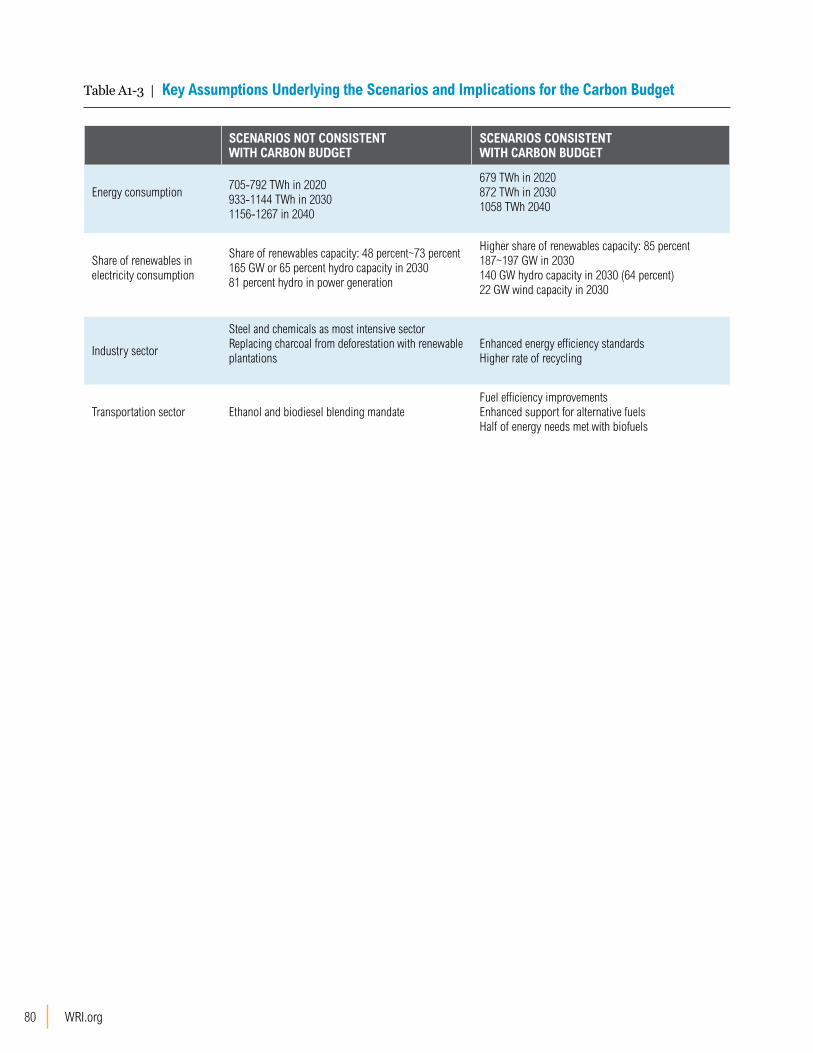
WRI.org 80
Table A1-3 | Key Assumptions Underlying the Scenarios and Implications for the Carbon Budget
SCENARIOS NOT CONSISTENT WITH CARBON BUDGET
SCENARIOS CONSISTENT WITH CARBON BUDGET
Energy consumption705-792 TWh in 2020933-1144 TWh in 20301156-1267 in 2040
679 TWh in 2020872 TWh in 20301058 TWh 2040
Share of renewables in electricity consumption
Share of renewables capacity: 48 percent~73 percent165 GW or 65 percent hydro capacity in 203081 percent hydro in power generation
Higher share of renewables capacity: 85 percent187~197 GW in 2030140 GW hydro capacity in 2030 (64 percent)22 GW wind capacity in 2030
Industry sector
Steel and chemicals as most intensive sector Replacing charcoal from deforestation with renewable plantations
Enhanced energy efficiency standardsHigher rate of recycling
Transportation sector Ethanol and biodiesel blending mandateFuel efficiency improvements Enhanced support for alternative fuels Half of energy needs met with biofuels
81Bridging the Gap Between Energy and Climate Policies in Brazil
To limit the average global temperature increase to 2°C by the end of the century, cumulative global CO
2 emissions should stay within
a “budget” of approximately 990 (510–1505) GtCO2 over the period
2012–2100 (IPCC, 2013). Scientists estimate that, ideally, global CO
2 emissions will need to reach net zero between 2050 and 2070
(UNEP, 2014) and should become negative over the remainder of the century to offset previous emissions and ongoing emissions from non-CO
2 gases. Global GHG emissions will need to reach net zero
between 2080 and 2100 (IPCC, 2013).
Under current trends, this budget will be exhausted within the next 30 years, so immediate reductions in global emissions are neces-sary. The question of how much Brazil should contribute to the necessary global reduction was not addressed by the IPCC, and is fundamentally a political question. This Annex presents some of the literature that could be used to determine Brazil’s economy-wide “fair share.” The literature covers approaches including historical responsibility, ethical allocation including rights of future genera-tions, economic capability, and least possible cost.
Kanitkar et al. (2010) and Höhne and Moltmann (2009) present a range of possible allocations of the carbon budget per country, in-cluding: (i) a budget for the 2010–2050 period with allocation based on the entitlements; (ii) a budget for the 2010-2050 period based on per capita allocation by 2000 population (known as the “German Budget Proposal”), and (iii) a gap (overdrawn entitlements*) defining financial and technology transfers.
In particularly, Höhne and Moltmann (2009) present allocations based on the following approaches:
▪ Greenhouse Development Rights (GDRs): All countries reduce emissions below their business-as-usual path based on their responsibility (cumulative emissions) and capacity (GDP); only emissions and GDP of the population above a development threshold counts toward responsibility and capability.
▪ Contraction and Convergence (C&C): Targets for individual countries are set in such a way that per capita emission allow-ances converge from the countries’ current levels to a level equal for all countries within a given period, from the present until 2050.
▪ Common but Differentiated Convergence (CDC): Targets are set so per capita emissions for all countries converge to an equal level over the period 2010 to 2050. For developed (Kyoto Proto-col Annex I) countries’ per capita emission allowances conver-gence starts immediately. For individual non-Annex I countries’ per capita emissions convergence starts from the date when their per capita emissions reach a certain percentage threshold of the (gradually declining) global average.
ANNEX 2. CARBON BUDGETS AND COUNTRY ALLOCATIONS
Table A2-1 presents possible budgets for Brazil, based on a review of existing studies covering all countries. From these cases, the most generous budget for Brazil would be 41.4 Gt CO
2e and the
most stringent, 19.8 Gt CO2e. Most of the prognostics range be-
tween 20 and 30 Gt CO2e, meaning that average emissions per year
would be between 0.5 and 0.75 Gt CO2e.
The International Energy Agency‘s World Energy Outlook 2013 (IEA, 2014) identifies an upper limit for Brazil’s energy-related GHG emissions of approximately 23 GtCO
2e over a 40-year period from
2010 to 2050.
The Climate Equity Reference Calculator and the Climate Equity Pledge Scorecard are equity reference tools to elucidate national responsibility and capacity for climate action, and to determine each country’s fair share of the global climate effort, on both the mitigation and adaptation sides. The tools have been developed by EcoEquity and the Stockholm Environment Institute, and serve as an equity reference framework to enable analysis of a broader range of possible conceptions of responsibility, capacity, and fair shares. According to the tool, under a strong two degrees scenario (2DS), and considering historical emissions to 1850, Brazil´s target for annual emissions in 2030 should be below 1 GtCO
2e (EcoEquity and the Stockholm Environment Institute, 2015).
Based on different analysis of equity allocation for mitigation efforts, the Brazilian Climate Observatory (OC) also "indicated" what Brazil’s target should be from a top-down perspective consistent with two degrees and fair share, and proposed a target below 1 GtCO
2e total
emissions for Brazil in 2030 (Observatorio do Clima, 2015).
Figure A2-1 translates the pathways presented in Figure 5 into cumulative emissions and compares them to the 2010 to 2050 carbon budget here discussed. This comparison suggests that, while there is significant scope for abatement based on current, cost-effective technologies, only the most aggressive scenarios, which envision new, cutting-edge CO
2 removal technologies, are
compatible with a budget that would limit the global temperature increase to 2°C by the end of the century. Illustrative extrapolations show how few scenarios fall within a theoretical budget (for energy only) of 25 gigatonnes of CO
2 until 2050.
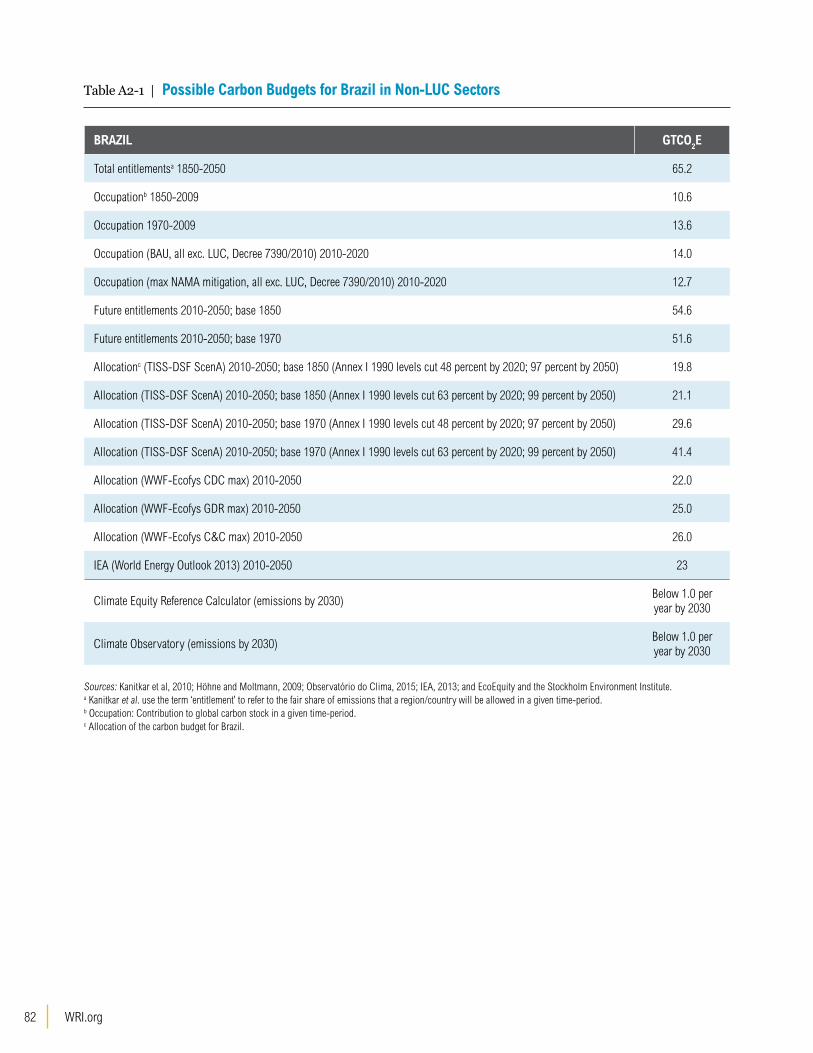
WRI.org 82
Table A2-1 | Possible Carbon Budgets for Brazil in Non-LUC Sectors
BRAZIL GTCO2E
Total entitlementsa 1850-2050 65.2
Occupationb 1850-2009 10.6
Occupation 1970-2009 13.6
Occupation (BAU, all exc. LUC, Decree 7390/2010) 2010-2020 14.0
Occupation (max NAMA mitigation, all exc. LUC, Decree 7390/2010) 2010-2020 12.7
Future entitlements 2010-2050; base 1850 54.6
Future entitlements 2010-2050; base 1970 51.6
Allocationc (TISS-DSF ScenA) 2010-2050; base 1850 (Annex I 1990 levels cut 48 percent by 2020; 97 percent by 2050) 19.8
Allocation (TISS-DSF ScenA) 2010-2050; base 1850 (Annex I 1990 levels cut 63 percent by 2020; 99 percent by 2050) 21.1
Allocation (TISS-DSF ScenA) 2010-2050; base 1970 (Annex I 1990 levels cut 48 percent by 2020; 97 percent by 2050) 29.6
Allocation (TISS-DSF ScenA) 2010-2050; base 1970 (Annex I 1990 levels cut 63 percent by 2020; 99 percent by 2050) 41.4
Allocation (WWF-Ecofys CDC max) 2010-2050 22.0
Allocation (WWF-Ecofys GDR max) 2010-2050 25.0
Allocation (WWF-Ecofys C&C max) 2010-2050 26.0
IEA (World Energy Outlook 2013) 2010-2050 23
Climate Equity Reference Calculator (emissions by 2030)Below 1.0 per year by 2030
Climate Observatory (emissions by 2030)Below 1.0 per year by 2030
Sources: Kanitkar et al, 2010; Höhne and Moltmann, 2009; Observatório do Clima, 2015; IEA, 2013; and EcoEquity and the Stockholm Environment Institute.a Kanitkar et al. use the term ‘entitlement’ to refer to the fair share of emissions that a region/country will be allowed in a given time-period. b Occupation: Contribution to global carbon stock in a given time-period.c Allocation of the carbon budget for Brazil.

83Bridging the Gap Between Energy and Climate Policies in Brazil
0
5,000
10,000
15,000
20,000
25,000
2040
MtC
O 2
2000 2005 2010 2015 2020 2025 2030 2035
Within 25Gt budget
IEA WEO 2013 NPS
IEA ETP 2012 +4°C
IEA ETP 2012 +2°C
Greenpeace 2013
IEA WEO 2013 450
Brazil BAU 2010
La Rovere 2011 (A)
La Rovere 2011 (B)
La Rovere 2011 (C)
WB 2010
McKinsey 2009
EPE PDE2023 PNE2030
IEA ETP 2012 +6°C
IEA WEO 2013 CPS
Over 25Gt budget
* Budget range for all sectors: 19.8-41.4 GtCO2e in 40 years (models TISS-DSF, WWF-Ecofys, and GAMS). Energy budget 25 GtCO
2e based on 60 GtCO
2e (future
entitlements) minus non-energy GHGs (~0.85 GtCO2e in 2010 multiplied by 40 years).
Figure A2-1 | Screening of CO2 Emission Outlooks Considering a 25 Billion Tonnes of CO2 40-year Carbon Budget for Brazil
WRI.org 84
ABOUT WRIWorld Resources Institute is a global research organization that turns big ideas into action at the nexus of environment, economic opportunity and human well-being.
Our ChallengeNatural resources are at the foundation of economic opportunity and human well-being. But today, we are depleting Earth’s resources at rates that are not sustainable, endangering economies and people’s lives. People depend on clean water, fertile land, healthy forests, and a stable climate. Livable cities and clean energy are essential for a sustainable planet. We must address these urgent, global challenges this decade.
Our VisionWe envision an equitable and prosperous planet driven by the wise management of natural resources. We aspire to create a world where the actions of government, business, and communities combine to eliminate poverty and sustain the natural environment for all people.
Our Approach
COUNT ITWe start with data. We conduct independent research and draw on the latest technology to develop new insights and recommendations. Our rigorous analysis identifies risks, unveils opportunities, and informs smart strategies. We focus our efforts on influential and emerging economies where the future of sustainability will be determined.
CHANGE ITWe use our research to influence government policies, business strategies, and civil society action. We test projects with communities, companies, and government agencies to build a strong evidence base. Then, we work with partners to deliver change on the ground that alleviates poverty and strengthens society. We hold ourselves accountable to ensure our outcomes will be bold and enduring.
SCALE ITWe don’t think small. Once tested, we work with partners to adopt and expand our efforts regionally and globally. We engage with decision-makers to carry out our ideas and elevate our impact. We measure success through government and business actions that improve people’s lives and sustain a healthy environment.
ACKNOWLEDGMENTSThe authors are grateful for the contributions of many individuals who helped shape this report, especially Dr. José Goldemberg, from the University of São Paulo, who provided invaluable insights and technical contributions from inception to publication. The report was also significantly informed by the views of experts from a range of sectors and institutions who participated in several events we con-vened to discuss our research. These experts include Sérgio Pacca, University of São Paulo; Karen Coppe, Ministry of the Environment; André Ferretti, Fundação Boticário; Carlos Rittl, Observatório do Clima; Gabriela Couto, independent consultant; Juliana Simões, Instituto Ethos; Marcelo Poppe, Center for Strategic Studies and Management in Science, Technology and Innovation (CGEE); and Emílio La Rovere, Federal University of Rio de Janeiro and MAPS/IES Brasil.
The report was further strengthened by detailed peer review by Jacques Marcovitch, University of São Paulo; Laura Valente, inde-pendent consultant; Roberto Schaeffer, Federal University of Rio de Janeiro; Tasso Azevedo, independent consultant; Virgínia Parente, University of São Paulo; Craig Hanson, WRI; Davida Wood, WRI; Jennifer Morgan, WRI; Laura Malaguzzi, WRI; Pankaj Bhatia, WRI; Priya Barua, WRI; Rachel Biderman, WRI; and Walter Vergara, WRI.
Additionally, the following individuals capably supported the editing and publication process: Emily Matthews, Hyacinth Billings, Courtney Durham, Carni Klirs, Julie Moretti, Allison Meyer, Rhys Gerholdt, and Elyse Myrans.
Finally, funding from the International Policies and Politics Initiative (IPPI) made this analysis possible.
ABOUT THE AUTHORSOswaldo Lucon is a climate change adviser to the São Paulo State Government, an invited lecturer at the Institute of Energy and Environment, University of São Paulo (IEE/USP) and member of the Research Center on Carbon Emission Policy and Regulation (NUP-PREC/IEE/USP).
Contact: [email protected]
Viviane Romeiro is a Policy Associate with the Climate Program at WRI Brazil and member of the Research Center on Carbon Emis-sion Policy and Regulation (NUPPREC/IEE/USP).
Contact: [email protected]
Taryn Fransen is a Senior Associate with the Climate Program at WRI, and the Director of the Open Climate Network.
Contact: [email protected]
ABOUT OCNThe Open Climate Network (OCN) brings together independent research institutes and stakeholder groups to monitor countries’ progress on climate change. We seek to accelerate the transition to a low-emission, climate-resilient future by providing consistent, cred-ible information that enhances accountability both among and within countries. www.openclimatenetwork.org

85Bridging the Gap Between Energy and Climate Policies in Brazil
Copyright 2015 World Resources Institute. This work is licensed under the Creative Commons Attribution 4.0 International License. To view a copy of the license, visit http://creativecommons.org/licenses/by/4.0/
Each World Resources Institute report represents a timely, scholarly treatment of a subject of public concern. WRI takes responsibility for choosing the study topics and guaranteeing its authors and researchers freedom of inquiry. It also solicits and responds to the guidance of advisory panels and expert reviewers. Unless otherwise stated, however, all the interpretation and findings set forth in WRI publications are those of the authors.
PHOTO CREDITS Cover photo National Renewable Energy Lab; table of contents, pg. 62 The Danish Wind Industry Association; pg. iv, 36 Lance Cheung; pg. vi, 44, 48 (right) World Bank Photo Collection; pg. 4, 29, 33 (right) WRI Brasil Cidades Sustentáveis; pg. 6 (left) Milton Jung, pg. 7 (center) Will De Freitas, pg. 7 (right) Disclosure; pg. 10 CIFOR; pg. 16 connectionconsulting; pg. 20 . Shell; pg. 25 Sarah Murray; pg. 28 (left) Fernando Stankuns; pg. 32 (left), 33 (center) Sweeter Alternative; pg. 38 Wilfredo Rodríguez; pg. 45 (right) Programa de Aceleração do Crescimento; pg. 47 Asian Development Bank; pg. 48 (left) Deni Williams, pg. 52 OneEighteen; pg. 55 Fernando Pangaré; pg. 56 Boneysp.

WRI.org 86
10 G STREET NE SUITE 800WASHINGTON, DC 20002, USA+1 (202) 729-7600WWW.WRI.ORG ISBN 978-1-56973-871-9